CDC PUBLIC HEALTH GRAND ROUNDS Staying … · 19/01/2016 · Improve preparedness Inform...
63
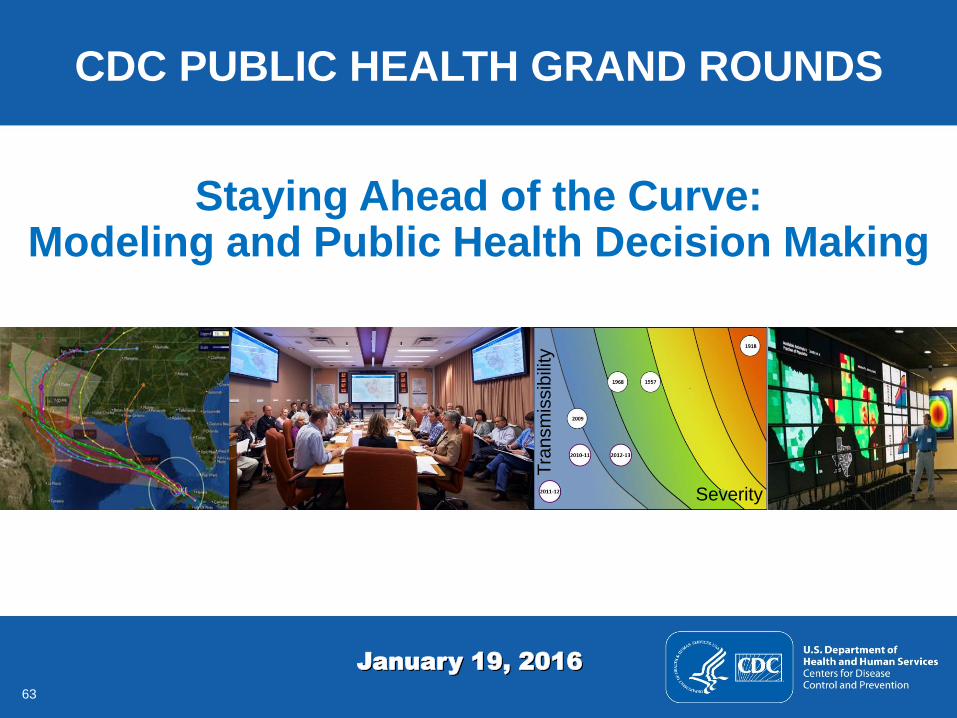
1 1 CDC PUBLIC HEALTH GRAND ROUNDS Staying Ahead of the Curve: Modeling and Public Health Decision Making January 19, 2016 Transmissibility Severity Accessible version: https://youtu.be/WPfehEIPdWQ
Transcript of CDC PUBLIC HEALTH GRAND ROUNDS Staying … · 19/01/2016 · Improve preparedness Inform...
11
CDC PUBLIC HEALTH GRAND ROUNDS
Staying Ahead of the Curve: Modeling and Public Health Decision Making
January 19, 2016
Tra
nsm
issib
ility
Severity
Accessible version: https://youtu.be/WPfehEIPdWQ
22
Modeling to Support Outbreak Preparedness, Surveillance and Response
Lauren Ancel Meyers, PhDProfessor, The University of Texas at Austin
Department of Integrative Biology
Department of Statistics and Data Sciences
External Faculty, Santa Fe InstituteT
ran
sm
issib
ility
Severity
33
What Are Models?
Mathematical models use equations to represent disease
transmission in the real world and can provide insights into
outbreak emergence, spread and control
Using advanced methods for data analysis, optimization, and high
performance computing, models can translate the basic science
of infectious diseases into practical public health guidance
Models can predict where and when events will occur, allowing
better outbreak preparedness and response

44
The Questions
Where are infectious diseases spreading today?
Where will they be spreading tomorrow?
How can we use limited resources to minimize death
and illness during outbreaks?
5
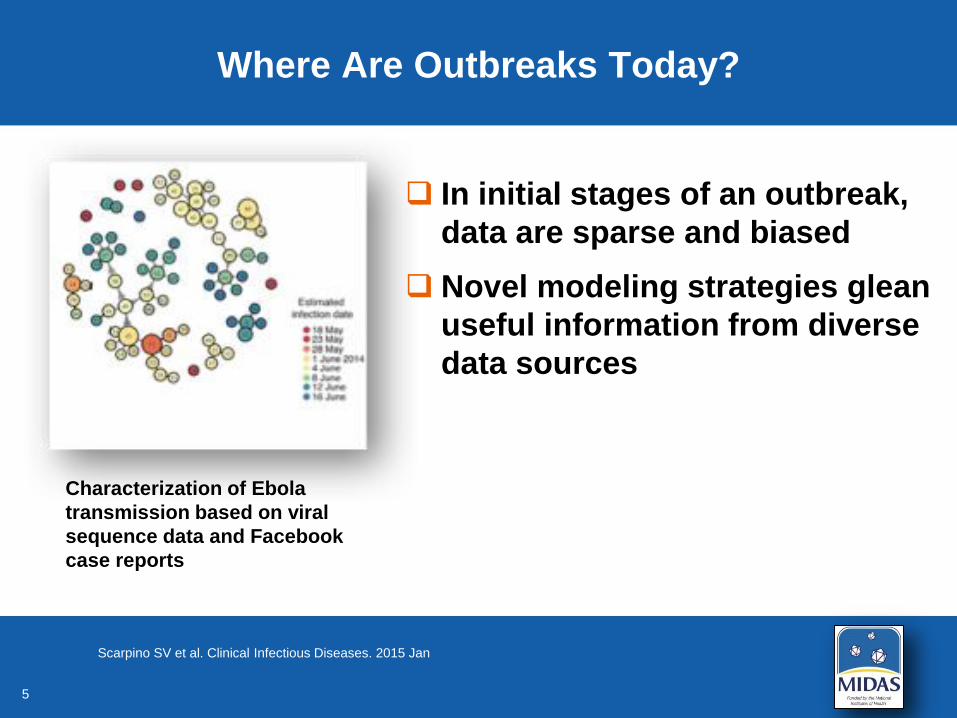
Where Are Outbreaks Today?
In initial stages of an outbreak,
data are sparse and biased
Novel modeling strategies glean
useful information from diverse
data sources
Scarpino SV et al. Clinical Infectious Diseases. 2015 Jan
Characterization of Ebola
transmission based on viral
sequence data and Facebook
case reports
6
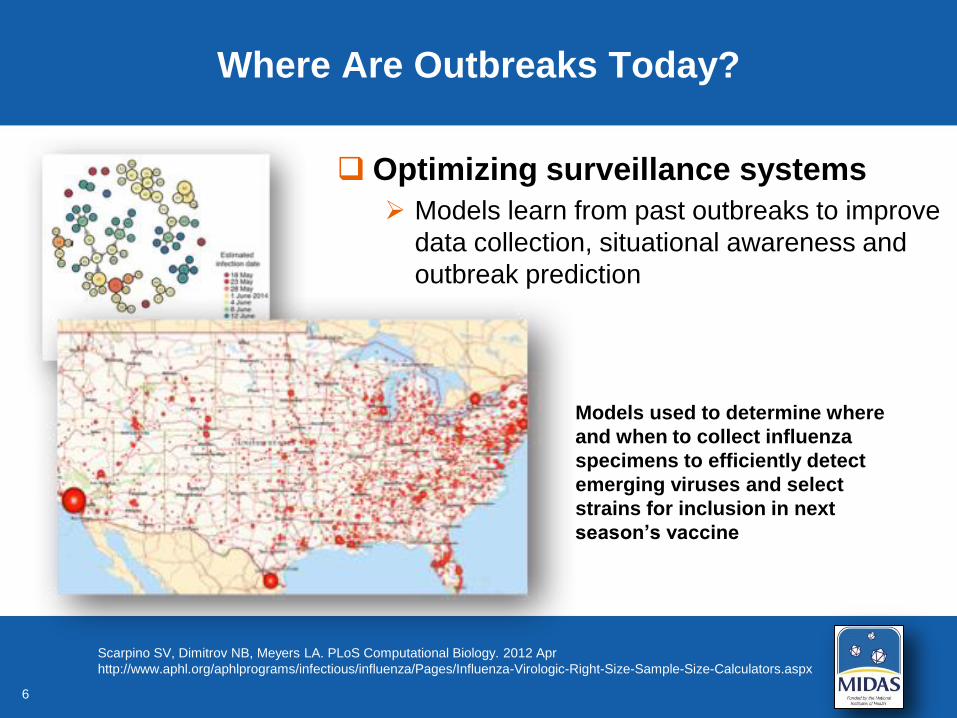
Where Are Outbreaks Today?
Optimizing surveillance systems
Models learn from past outbreaks to improve
data collection, situational awareness and
outbreak prediction
Scarpino SV, Dimitrov NB, Meyers LA. PLoS Computational Biology. 2012 Apr
http://www.aphl.org/aphlprograms/infectious/influenza/Pages/Influenza-Virologic-Right-Size-Sample-Size-Calculators.aspx
Models used to determine where
and when to collect influenza
specimens to efficiently detect
emerging viruses and select
strains for inclusion in next
season’s vaccine

7
Where Are Outbreaks Today?
DTRA: Defense Threat Reduction Agency
BSVE: Biosurveillance Ecosystem
Biosurveillance Ecosystem Surveillance App

8
Where Will They Be Tomorrow?
CDC’s Predict the Influenza Season Contest
Early Season Flu Forecasted
Actual Flu Trajectory

9
Forecast to Support Decision Making
Early Season Flu Forecasted
Actual Flu Trajectory
CDC’s Predict the Influenza Season Contest
Onset
Peak
End
10
Focus Models on Key Quantities
Early Season Flu Forecasted
Actual Flu Trajectory
Forecasted Point
Actual Data
CDC’s Predict the Influenza Season Contest
Onset
Peak
End

11
How Can We Use Models to
Optimally Mitigate Outbreaks?
Clearly articulate goals
Deepen intuition
Transmission dynamics
Impacts of interventions
Biases of surveillance data
Improve preparedness
Inform “quantitative” decisions
Optimize stockpiling and
allocation of medical
countermeasures
http://flu.tacc.utexas.edu
Singh B, Huang HC, Morton D, et al. Emerging Infectious Diseases. 2015 Feb

12
How Can We Optimally Mitigate Outbreaks?
Bellan SE, Pulliam JR, Dushoff J, Meyers LA. Lancet. 2014 Oct
Gutfraind A, Meyers LA. J Infect Dis. 2015 Apr

1313
Opportunities
Transformative moment for modeling
Upsurge in government appreciation and investment
Widening collaborations between decision-makers and modelers
Increase in model-driven policies for outbreak prevention
and control

1414
Challenges
New opportunities bring “new” (and old) challenges
Access to reliable historical data and real-time data
Model outputs only as good as their inputs
Legitimate concerns about privacy and safety
Urgent need for best practices and shared resources
Sustainability of modeling tools
Rapidly changing technological infrastructure and data resources
User training and support

1515
Martin I. Meltzer, PhDLead, Health Economics and Modeling Unit
Division of Preparedness and Emerging Infections
National Center for Emerging and Zoonotic Infectious Diseases
What Do Policy Makers Expect from Modelers
during a Response?
Tra
nsm
issib
ility
Severity
1616
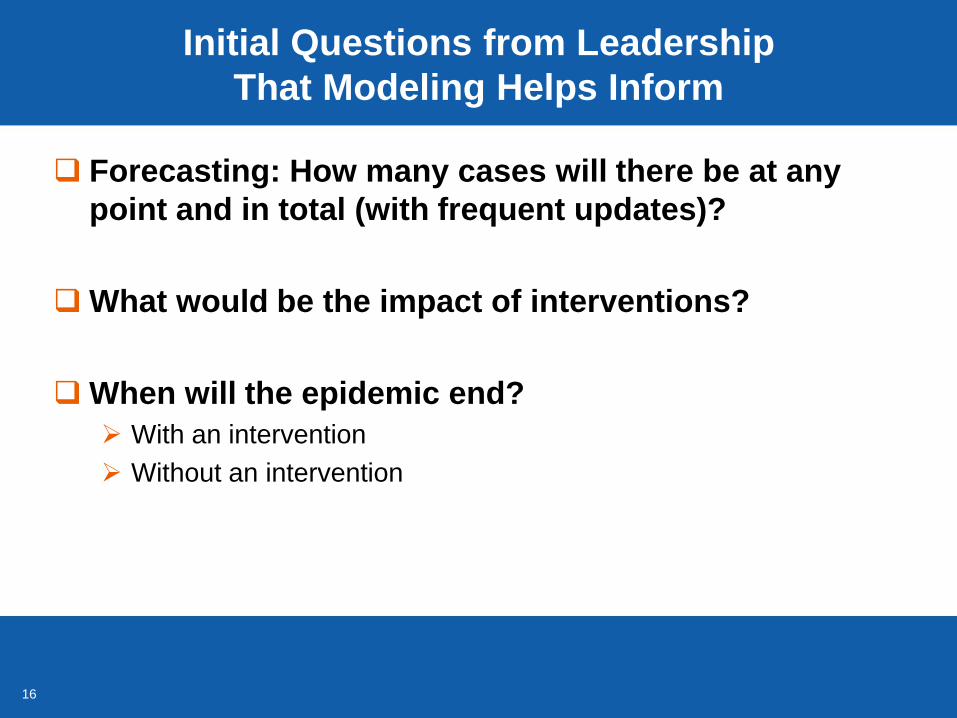
Initial Questions from Leadership
That Modeling Helps Inform
Forecasting: How many cases will there be at any
point and in total (with frequent updates)?
What would be the impact of interventions?
When will the epidemic end?
With an intervention
Without an intervention
1717
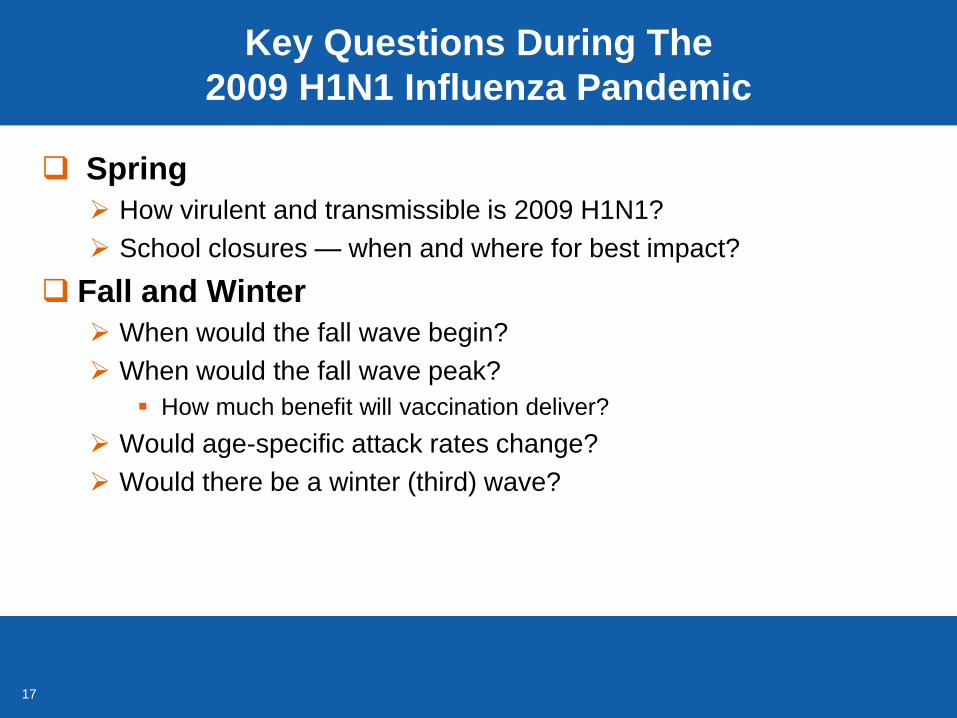
Key Questions During The
2009 H1N1 Influenza Pandemic
Spring
How virulent and transmissible is 2009 H1N1?
School closures — when and where for best impact?
Fall and Winter
When would the fall wave begin?
When would the fall wave peak?
How much benefit will vaccination deliver?
Would age-specific attack rates change?
Would there be a winter (third) wave?

1818
Archive: Updates of CDC estimates at: http://www.cdc.gov/h1n1flu/estimates_2009_h1n1.htm
Shrestha SS, Swerdlow DL, Borse RH, et al. Clin Infect Dis. 2011 Jan
2009 H1N1 Influenza Burden:
Near Real-time Estimates
61 million cases (range: 43 million to 89 million)
• 274,000 hospitalizations(range: 195,000 to 403,000)
• 12,470 deaths(range: 8,870 to 18,300)
19
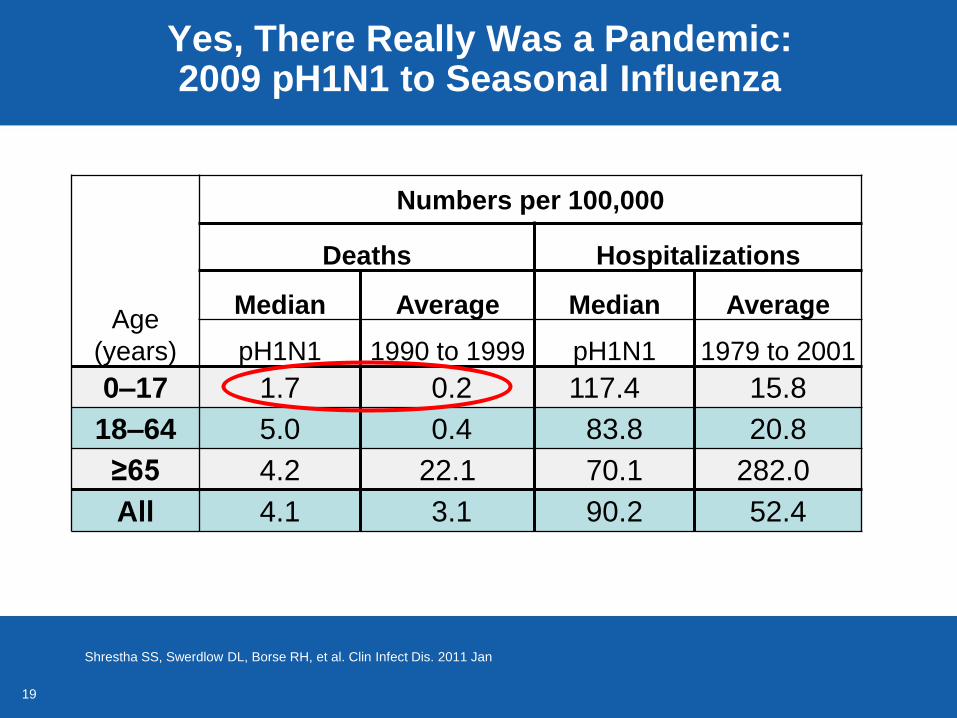
Yes, There Really Was a Pandemic:2009 pH1N1 to Seasonal Influenza
Shrestha SS, Swerdlow DL, Borse RH, et al. Clin Infect Dis. 2011 Jan
Age
(years)
Numbers per 100,000
Deaths Hospitalizations
Median Average Median Average
pH1N1 1990 to 1999 pH1N1 1979 to 2001
0–17 1.7 0.2 117.4 15.8
18–64 5.0 0.4 83.8 20.8
≥65 4.2 22.1 70.1 282.0
All 4.1 3.1 90.2 52.4
20
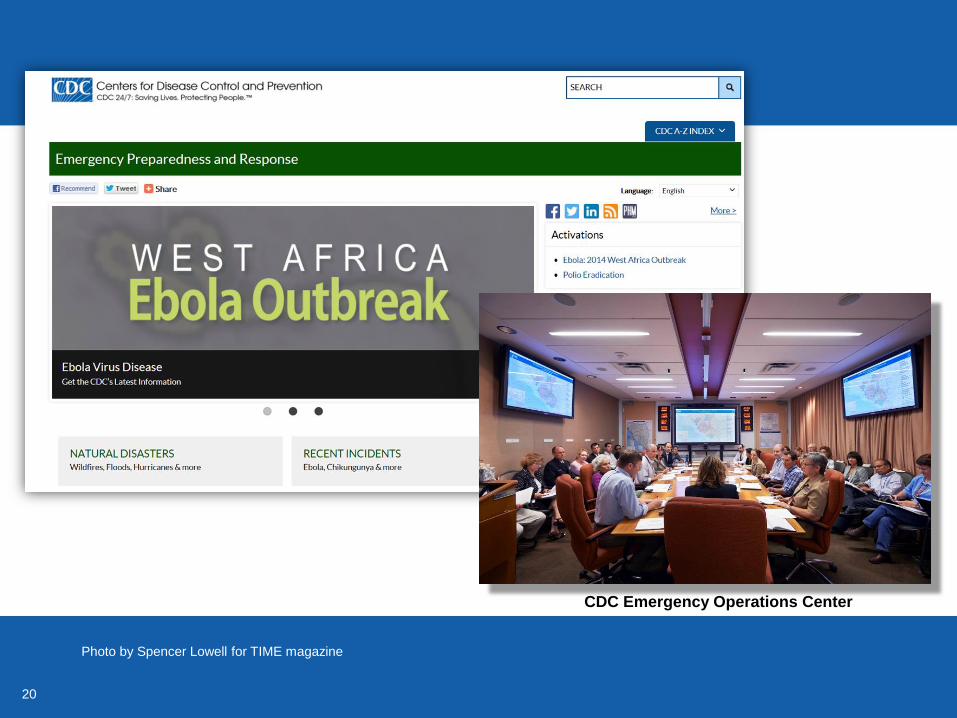
CDC Emergency Operations Center
Photo by Spencer Lowell for TIME magazine
21
0
200
400
600
800
1,000
1,200
1,400
3/26 4/25 5/25 6/24 7/24 8/23 9/22 10/22 11/21 12/21 1/20
Cu
mu
lati
ve c
ases (
Th
ou
san
ds)
Date
No intervention
Intervention
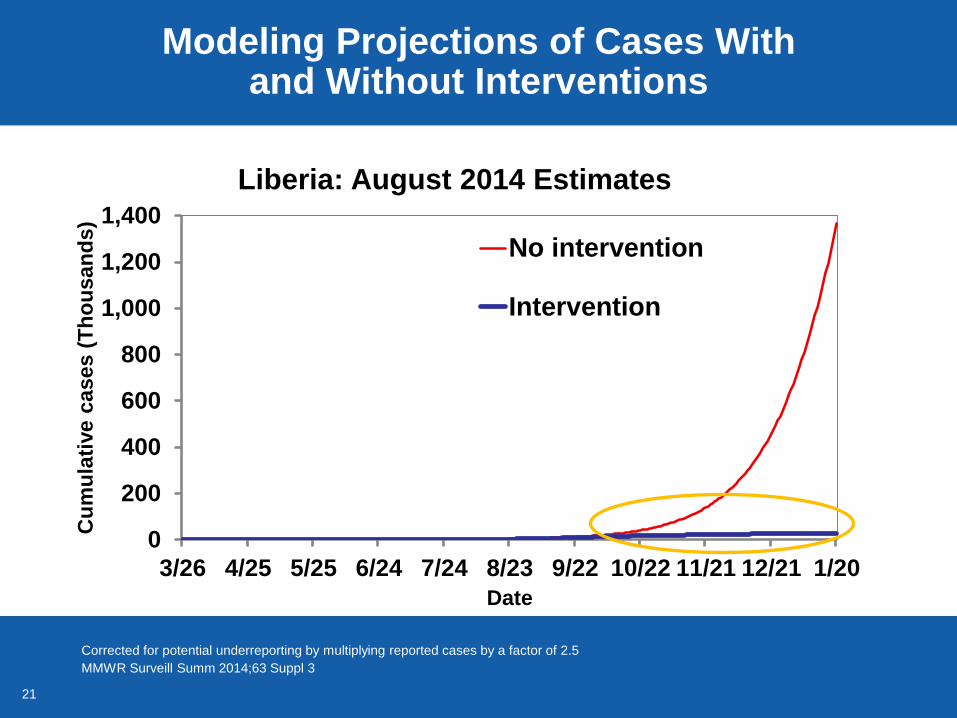
Modeling Projections of Cases With and Without Interventions
Corrected for potential underreporting by multiplying reported cases by a factor of 2.5
MMWR Surveill Summ 2014;63 Suppl 3
Liberia: August 2014 Estimates

22
Response Time Matters –Cases Could Triple For Every Month of Inaction
Data are not corrected for potential underreportingMMWR Surveill Summ 2014;63 Suppl 3
Liberia Case Estimates, Based on August 2014 Data
2014 2015
23
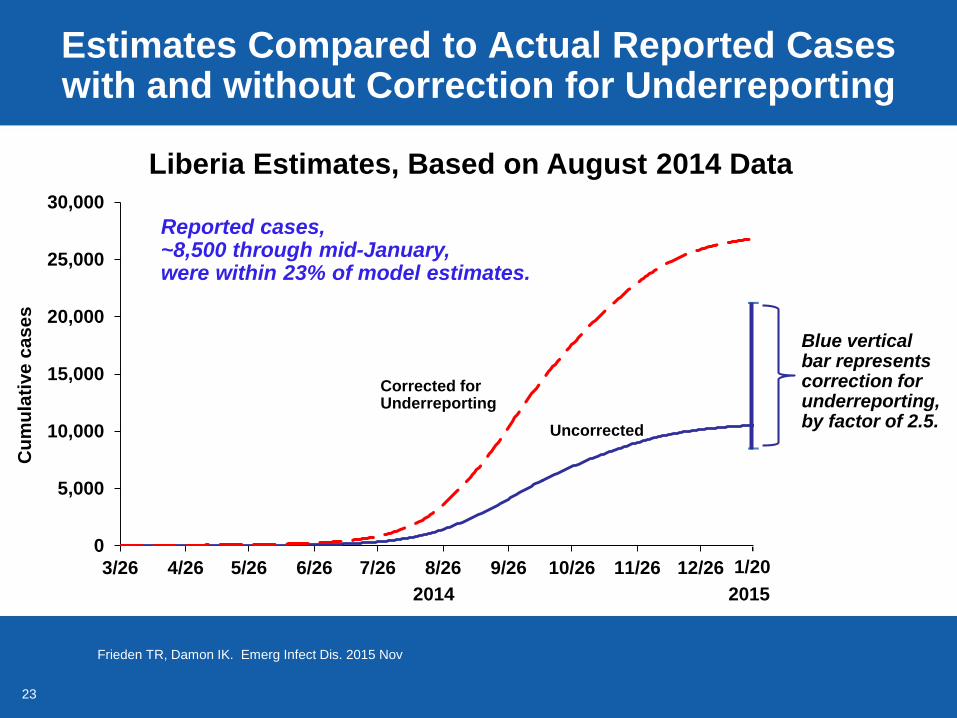
Estimates Compared to Actual Reported Caseswith and without Correction for Underreporting
0
5,000
10,000
15,000
20,000
25,000
30,000
3/26 4/26 5/26 6/26 7/26 8/26 9/26 10/26 11/26 12/26
Cu
mu
lati
ve
ca
se
s
2014 2015
Frieden TR, Damon IK. Emerg Infect Dis. 2015 Nov
Liberia Estimates, Based on August 2014 Data
Blue vertical bar represents correction for underreporting, by factor of 2.5.
Corrected for Underreporting
Uncorrected
Reported cases, ~8,500 through mid-January, were within 23% of model estimates.
1/20
-

24
Rainisch G, Shankar M, Wellman M, et al. Emerg Infect Dis. 2015 Mar

2525
Modeling’s Major Contributions During
Emergency Response
Estimation of possible size of outbreak before large
amounts of data are available
Assessment of impact of interventions
Identification of key data needs
Value of what is known
Value of what is not known
Prioritize data collection efforts
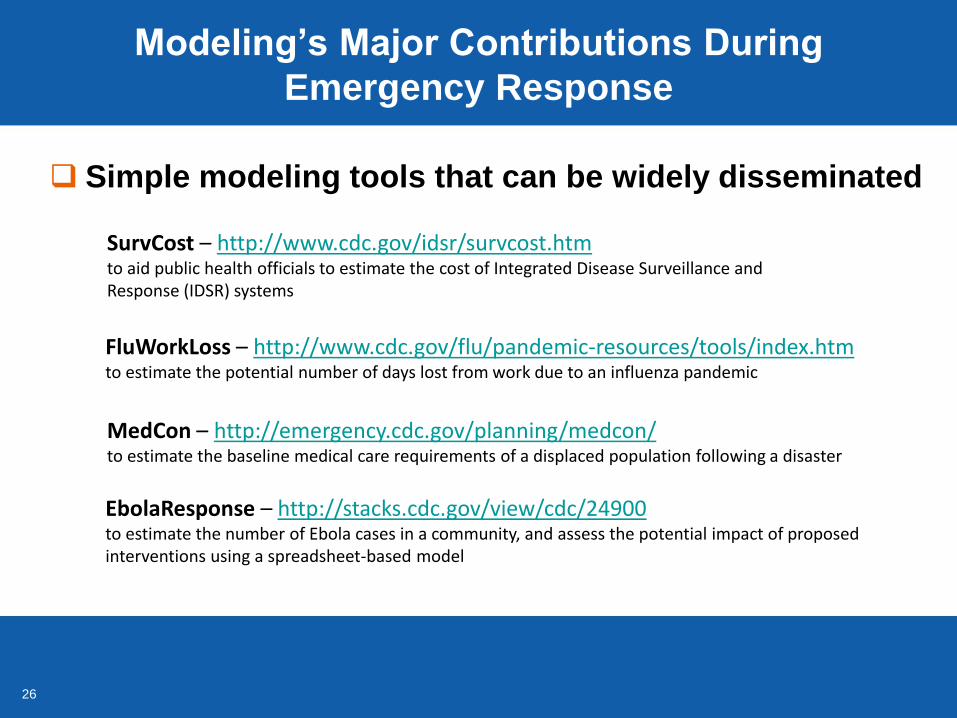
2626
Modeling’s Major Contributions During
Emergency Response
Simple modeling tools that can be widely disseminated
SurvCost – http://www.cdc.gov/idsr/survcost.htmto aid public health officials to estimate the cost of Integrated Disease Surveillance and Response (IDSR) systems
FluWorkLoss – http://www.cdc.gov/flu/pandemic-resources/tools/index.htmto estimate the potential number of days lost from work due to an influenza pandemic
MedCon – http://emergency.cdc.gov/planning/medcon/to estimate the baseline medical care requirements of a displaced population following a disaster
EbolaResponse – http://stacks.cdc.gov/view/cdc/24900to estimate the number of Ebola cases in a community, and assess the potential impact of proposed interventions using a spreadsheet-based model
27
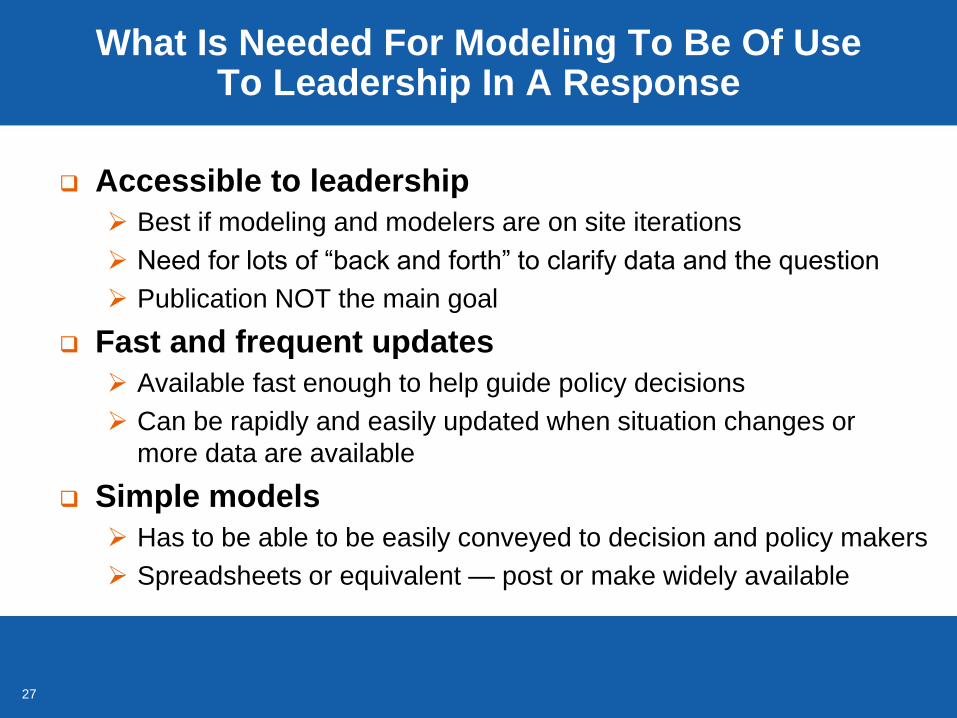
What Is Needed For Modeling To Be Of Use To Leadership In A Response
Accessible to leadership
Best if modeling and modelers are on site iterations
Need for lots of “back and forth” to clarify data and the question
Publication NOT the main goal
Fast and frequent updates
Available fast enough to help guide policy decisions
Can be rapidly and easily updated when situation changes or
more data are available
Simple models
Has to be able to be easily conveyed to decision and policy makers
Spreadsheets or equivalent — post or make widely available

2828
Application of Modeling and
Forecasting for Preventing Influenza
Daniel B. Jernigan, MD, MPH
Director, Influenza Division
National Center for Immunization and Respiratory DiseasesT
ran
sm
issib
ility
Severity

29
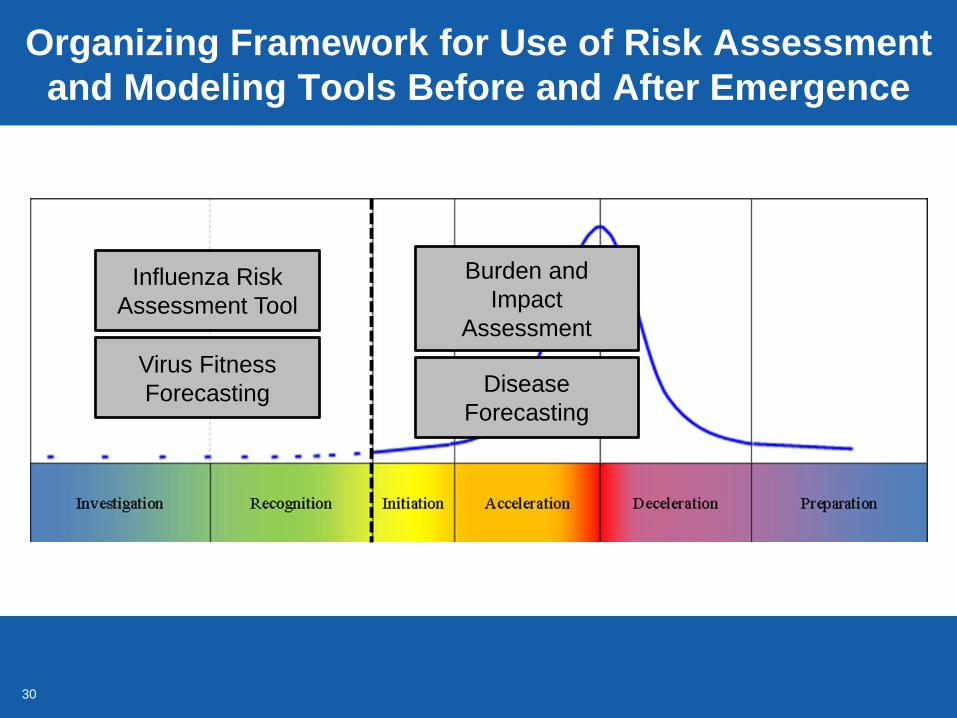
Organizing Framework for Use of Risk Assessment
and Modeling Tools Before and After Emergence
Holloway R, Rasmussen S, Zaza S, et al. MMWR Recomm Rep. 2014 Sep
30
Organizing Framework for Use of Risk Assessment
and Modeling Tools Before and After Emergence
Virus Fitness
Forecasting
Influenza Risk
Assessment Tool
Disease
Forecasting
Burden and
Impact
Assessment

31
Organizing Framework for Use of Risk Assessment
and Modeling Tools Before and After Emergence
Virus Fitness
Forecasting
Influenza Risk
Assessment Tool
Disease
Forecasting
Burden and
Impact
Assessment
32
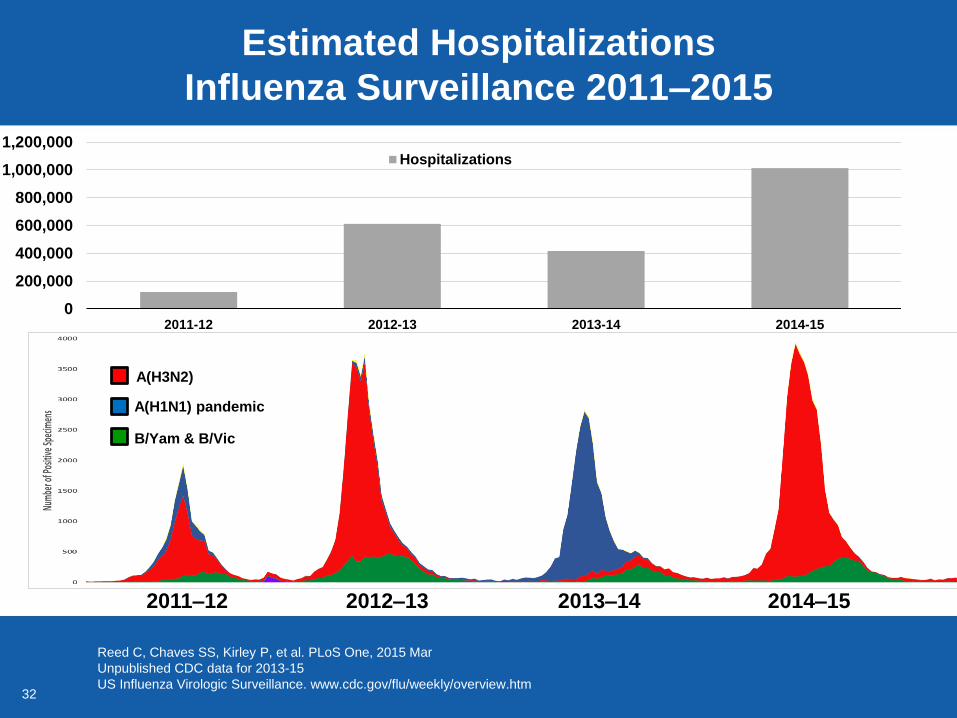
2014–152013–142012–132011–12
Estimated Hospitalizations
Influenza Surveillance 2011–2015
Reed C, Chaves SS, Kirley P, et al. PLoS One, 2015 Mar
Unpublished CDC data for 2013-15
US Influenza Virologic Surveillance. www.cdc.gov/flu/weekly/overview.htm
A(H3N2)
A(H1N1) pandemic
B/Yam & B/Vic
0
200,000
400,000
600,000
800,000
1,000,000
1,200,000
2011-12 2012-13 2013-14 2014-15
Hospitalizations
3333
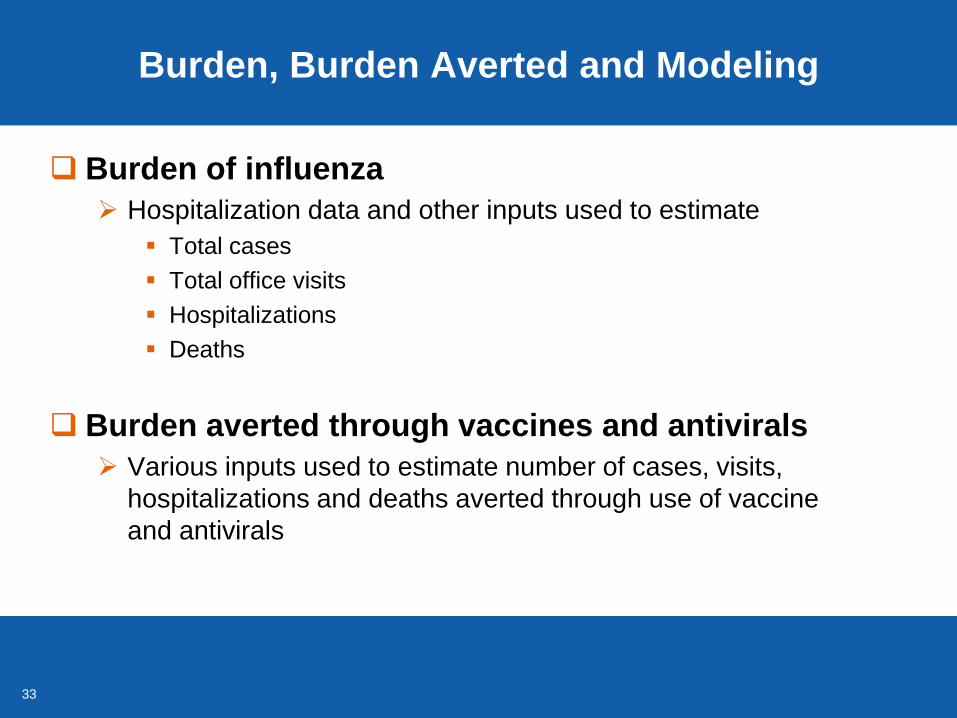
Burden, Burden Averted and Modeling
Burden of influenza
Hospitalization data and other inputs used to estimate
Total cases
Total office visits
Hospitalizations
Deaths
Burden averted through vaccines and antivirals
Various inputs used to estimate number of cases, visits,
hospitalizations and deaths averted through use of vaccine
and antivirals
3434
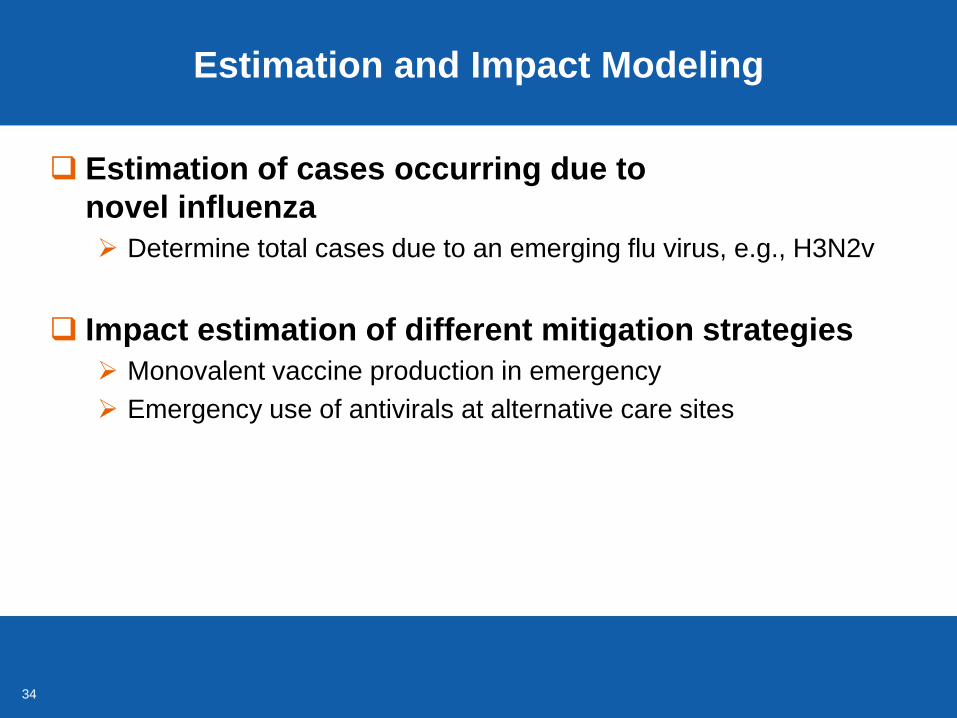
Estimation and Impact Modeling
Estimation of cases occurring due to
novel influenza
Determine total cases due to an emerging flu virus, e.g., H3N2v
Impact estimation of different mitigation strategies
Monovalent vaccine production in emergency
Emergency use of antivirals at alternative care sites
35
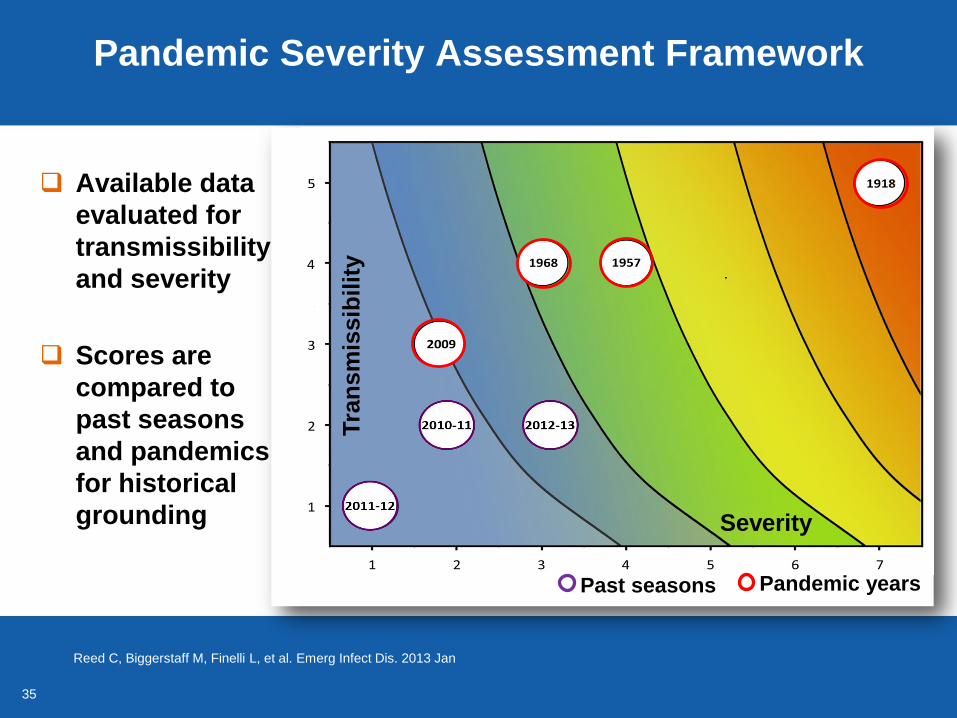
Pandemic Severity Assessment Framework
Available data
evaluated for
transmissibility
and severity
Scores are
compared to
past seasons
and pandemics
for historical
grounding
Reed C, Biggerstaff M, Finelli L, et al. Emerg Infect Dis. 2013 Jan
Tra
ns
mis
sib
ilit
y
Severity
Pandemic yearsPast seasons

36
Influenza Risk Assessment Tool
Virus Fitness
Forecasting
Influenza Risk
Assessment Tool
Disease
Forecasting
Burden and
Impact
Assessment

37
1. Genomic variation
2. Receptor binding
3. Transmission in laboratory animals
4. Antivirals and treatment options
5. Existing population immunity
6. Disease severity and pathogenesis
7. Antigenic relationship to vaccine candidates
8. Global geographic distribution
9. Infection in animals, human risk of infection
10. Human infections and transmission
Ten Elements Evaluated in Influenza Risk Assessment Tool (IRAT)
Virus
Population
Ecology
IRAT: Influenza Risk Assessment Tool. http://www.cdc.gov/flu/pandemic-resources/tools/risk-assessment.htm
Trock SC, Burke SA, Cox NJ. Avian Dis. 2012 Dec

3838
CDC Influenza Risk Assessment of
Emerging Novel Influenza Viruses
IRAT: Influenza Risk Assessment Tool. http://www.cdc.gov/flu/pandemic-resources/tools/risk-assessment.htm
Trock S, Burke S. CDC Unpublished Data for H5NX Assessment
Trock S, Burke S, Cox N. Avian Dis. 2012 Dec
0
1
2
3
4
5
6
7
8
9
10
0 1 2 3 4 5 6 7 8 9 10
H7N9
H3N2v
H5N1Clade 1
H1N1A/duck/New York/96
H5NXNorth America
Emergence Risk
Impact
Ris
k
CDC routinely
conducts risk
assessments on
emerging novel
influenza viruses
Assess risk
of emergence
Assess impact,
if emerges

3939
CDC Influenza Risk Assessment Tool (IRAT)
IRAT: Influenza Risk Assessment Tool. http://www.cdc.gov/flu/pandemic-resources/tools/risk-assessment.htm
IRAT informs leadership regarding
Readiness toolkit development (e.g., lab reagents)
Vaccine and antiviral development, trials, and stockpiles
Changes to diagnostics
Changes to response posture
Medical countermeasures, deployment
40
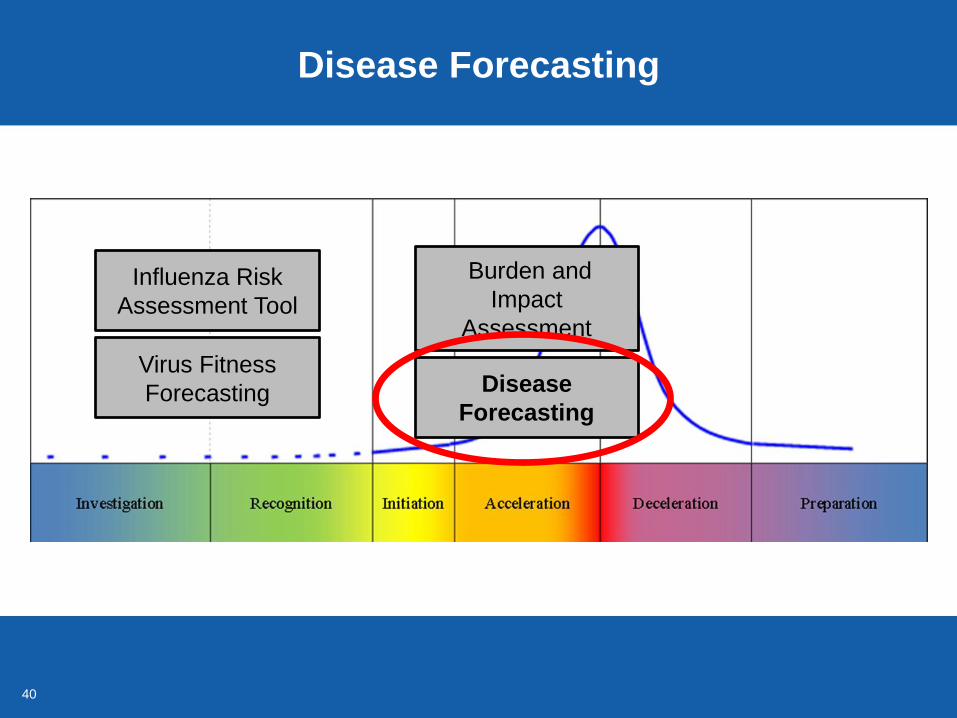
Disease Forecasting
Virus Fitness
Forecasting
Influenza Risk
Assessment Tool
Disease
Forecasting
Burden and
Impact
Assessment

4141
Forecasts for the Onset and Peak of the
2015–2016 Influenza Season
Ten academic partners receive standard weekly CDC data inputs and
provide their best predictions for onset, peak, and other key estimates
CDC serves as model broker to assure Accurate and available data via web portal for participants
Collaboration and comparison of outputs
Ensemble models may provide best estimates
Biggerstaff, Reed, and Influenza Division Applied Research and Modeling Team
4242
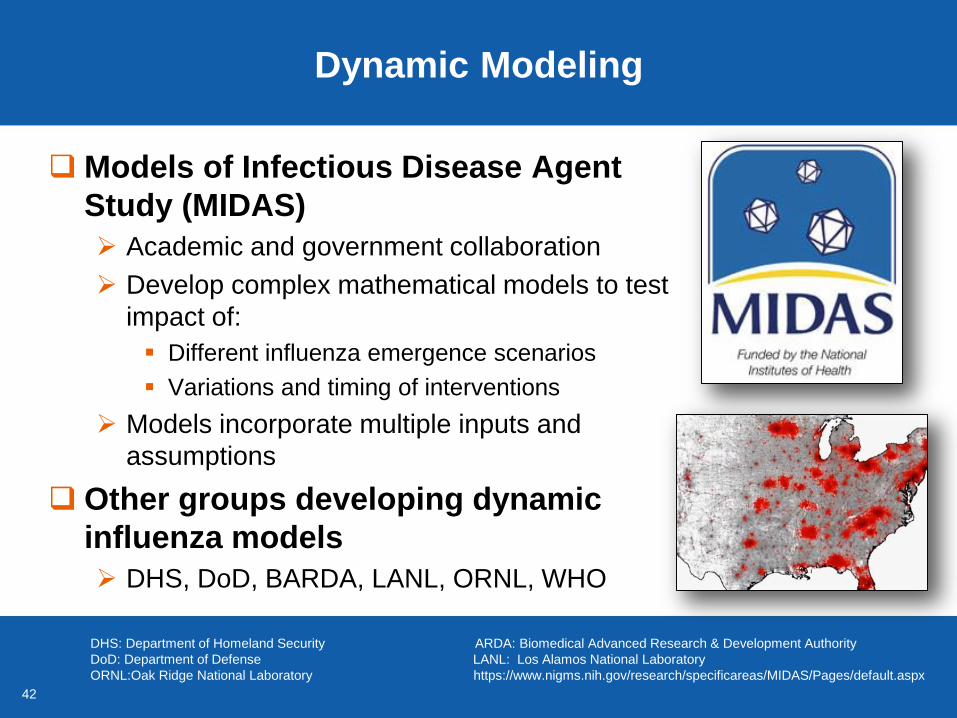
Dynamic Modeling
Models of Infectious Disease Agent
Study (MIDAS)
Academic and government collaboration
Develop complex mathematical models to test
impact of:
Different influenza emergence scenarios
Variations and timing of interventions
Models incorporate multiple inputs and
assumptions
Other groups developing dynamic
influenza models
DHS, DoD, BARDA, LANL, ORNL, WHO
DHS: Department of Homeland Security ARDA: Biomedical Advanced Research & Development Authority
DoD: Department of Defense LANL: Los Alamos National Laboratory
ORNL:Oak Ridge National Laboratory https://www.nigms.nih.gov/research/specificareas/MIDAS/Pages/default.aspx

43
Virus Fitness Forecasting
Virus Fitness
Forecasting
Influenza Risk
Assessment Tool
Disease
Forecasting
Burden and
Impact
Assessment

44
Possibilities for Real-Time Genomic
and Antigenic Virus Fitness Forecasting?
http://www.nextflu.org/H3N2/1y/
CDC, WHO, and collaborators
work to develop models
to combine:
Whole genome, next-generation,
sequencing data
Antigenic data describing host
responses to flu virus proteins
Geotemporal and epidemiologic data
from surveillance
Goal is to identify most likely
viruses to predominate and
improve selection of candidate
vaccine viruses

4545
Conclusions
Practical use of historic and historical data can help
estimate impact of emerging influenza severity
Modeling of epidemiologic and laboratory findings can
be used to estimate likelihood of novel, animal-origin
influenza emergence and severity
Influenza disease forecasting through ensemble
modeling efforts may help disease control efforts
Use of epidemiologic, genomic, and antigenic modeling
forecasts may help select best vaccine virus candidates
4646
Models as Decision Support Tools:Explanation, Foresight, Prediction
Richard J. Hatchett, MDChief Medical Officer and Deputy Director
Biomedical Advanced Research and Development Authority
Office of the Assistant Secretary for Preparedness and ResponseT
ran
sm
issib
ility
Severity

4747
Models as Tools for Decision Making
“Prediction implies an ability to
discern a particular turn of events.
Foresight identifies variables and
a range of alternatives that might
better prepare for the future.”
– Richard Danzig
Models provide an input to
decision making by Explaining phenomena
Providing foresight
Making predictions
Richard Danzig, Driving in the Dark: Ten Propositions about Prediction and National Security Center for a New American Security, 2011
4848
Decision Makers Need to Recognize
Limitations of Models
Models are a tool to help frame decisions
Models are highly stylized representations of the
world and are typically fit to specific purpose
Whatever purpose decision makers defined
Decision makers must be careful not to misuse them
Limit conclusions to domains that the model was designed
to address
Models should not be used in isolation

49
NPIs: Nonpharmaceutical interventions
Halloran ME, Ferguson NM, Eubank S, et al. Proc Natl Acad Sci U S A. 2008 Mar
Explanatory Models
Percent infected before measures started
Models can provide a means for
understanding observed outcomes
Modelers looked at the impact of
the timing and use of NPIs
(e.g., social distancing measures,
including closing schools and
banning large gatherings) on
overall attack rates
Efficacy of such measures was
substantially enhanced if
they were introduced early in
an epidemic

50
Importance of Timing and Nonpharmaceutical
Interventions (NPIs) in 1918 Epidemic
0
2000
4000
6000
8000
10000
12000
14000
St Louis
Philadelphia
Timing of NPIs was
the critical determinant
of their efficacy
Early implementation
reduced epidemic
peak intensity
Relaxation of NPIs
may explain the
multiple waves
in St. Louis
Ex
ce
ss
We
ek
ly D
ea
ths
Ra
tes
pe
r 1
00
,00
0
1918 Death Rates: Philadelphia vs St Louis
Date
Hatchett RJ, Mecher CE, Lipsitch M. Proc Natl Acad Sci U S A. 2007 May
Bootsma MC, Ferguson NM. Proc Natl Acad Sci U S A. 2007 May
Markel H, Lipman HB, Navarro JA, et al. JAMA 2007 Nov

51
Importance of Timing and Nonpharmaceutical
Interventions (NPIs) in 1918 Epidemic
0
2000
4000
6000
8000
10000
12000
14000
Chart Title
St Louis
Philadelphia
Timing of NPIs was
the critical determinant
of their efficacy
Early implementation
reduced epidemic
peak intensity
Relaxation of NPIs
may explain the
multiple waves
in St. Louis
Ex
ce
ss
We
ek
ly D
ea
ths
Ra
tes
pe
r 1
00
,00
0
Day 16 – Philadelphia starts NPIs
Day 2 – St. Louis starts NPIs
1918 Death Rates: Philadelphia vs St Louis
Date
Hatchett RJ, Mecher CE, Lipsitch M. Proc Natl Acad Sci U S A. 2007 May
Bootsma MC, Ferguson NM. Proc Natl Acad Sci U S A. 2007 May
Markel H, Lipman HB, Navarro JA, et al. JAMA 2007 Nov
5252
Examples of Ways In Which
Models Provide Foresight
Facilitate analysis and understanding of
sparse datasets Early readouts during 2009 H1N1 response
Enhance intuition by allowing exploration of
what-ifs Efficacy of isolation and quarantine in SARS, smallpox,
and influenza
Establish risk boundaries Risk of sexual transmission of Ebola

53
Risk of Sexual Transmission of Ebola
Eggo RM, Watson CH, Camacho A, et al. Euro Surveill. 2015 Dec
Ebola virus can persist in
semen for months, producing a
sustained risk of transmission
Eggo, et al., combined recent
data on viral RNA persistence
with weekly disease incidence
to estimate the current number
of semen-positive men in
affected West African countries
The risk of sexual transmission
has declined significantly but
will persist into 2016

54
Risk of Sexual Transmission of Ebola
Ebola virus can persist in
semen for months, producing a
sustained risk of transmission
Eggo, et al., combined recent
data on viral RNA persistence
with weekly disease incidence
to estimate the current number
of semen-positive men in
affected West African countries
The risk of sexual transmission
has declined significantly but
will persist into 2016
Eggo RM, Watson CH, Camacho A, et al. Euro Surveill. 2015 Dec

55
Repeated Comparison of Predict vs. Actual
Outcomes Has Improved Accuracy of Models
Pre
dic
tive
Ac
cu
rac
y (
%)
National Centers for Environmental Prediction at NOAA
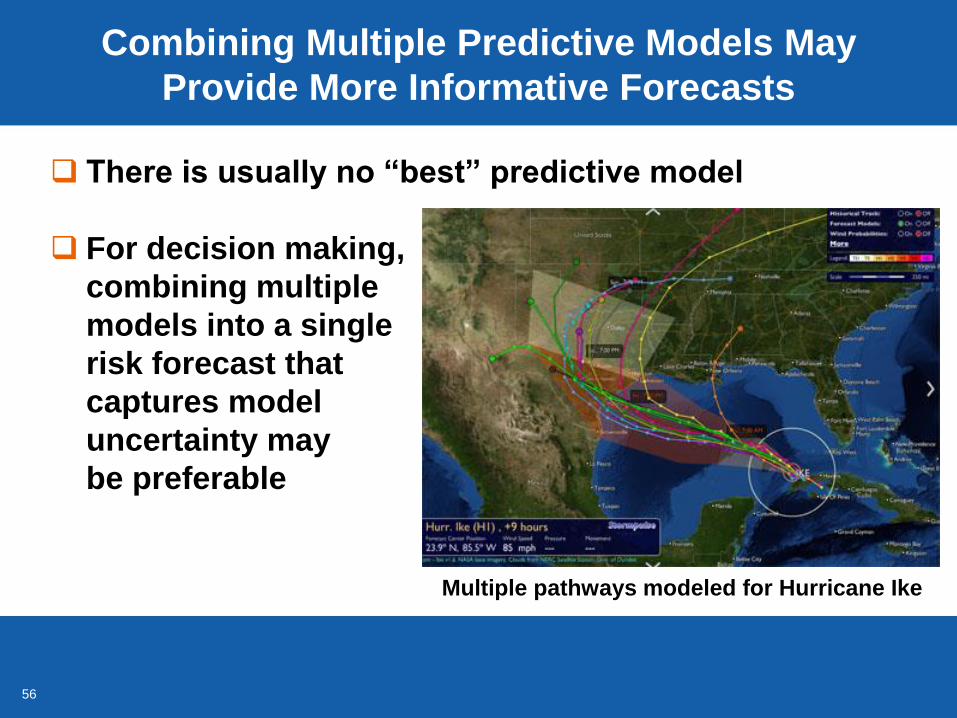
56
Combining Multiple Predictive Models May
Provide More Informative Forecasts
There is usually no “best” predictive model
For decision making,
combining multiple
models into a single
risk forecast that
captures model
uncertainty may
be preferable
Multiple pathways modeled for Hurricane Ike

57
Combining Multiple Predictive Models
Shrinks Cone of Error
As modeling techniques improve, the cone of
error for aggregate
models shrinks
As the time horizon
is extended, the cone
of error widens and
uncertainty increases

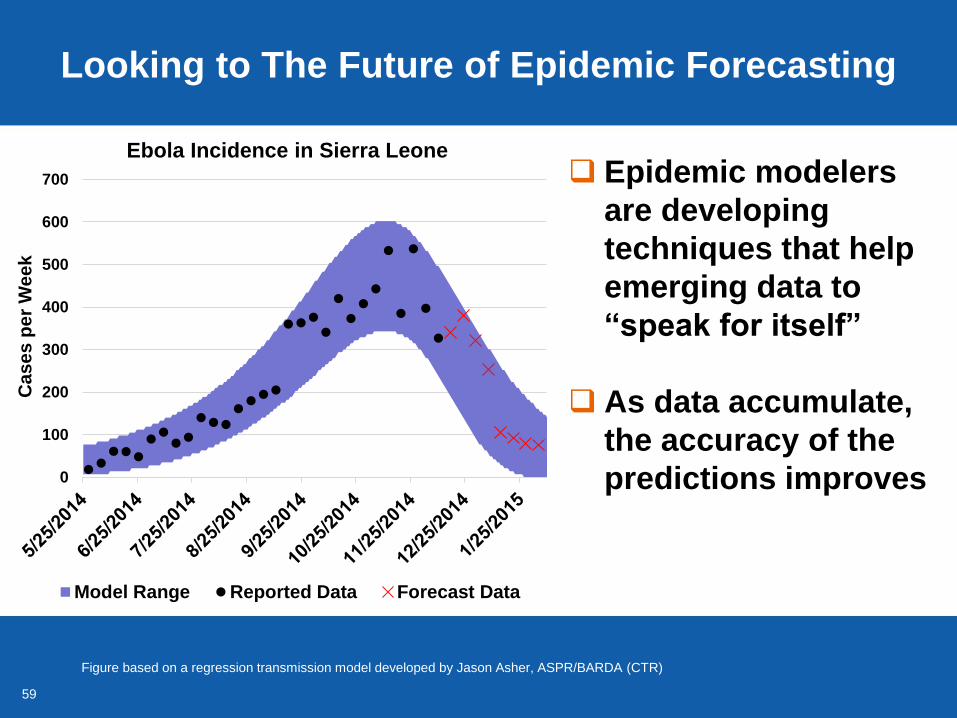
5858
0
100
200
300
400
500
600
700
Ca
se
s p
er
We
ek
Ebola Incidence in Sierra Leone
Model Range Reported Data Forecast Data
Looking to The Future of Epidemic Forecasting
Figure based on a regression transmission model developed by Jason Asher, ASPR/BARDA (CTR)
Epidemic modelers
are developing
techniques that help
emerging data to
“speak for itself”
As data accumulate,
the accuracy of the
predictions improves
5959
0
100
200
300
400
500
600
700
Ca
se
s p
er
We
ek
Ebola Incidence in Sierra Leone
Model Range Reported Data Forecast Data
Looking to The Future of Epidemic Forecasting
Figure based on a regression transmission model developed by Jason Asher, ASPR/BARDA (CTR)
Epidemic modelers
are developing
techniques that help
emerging data to
“speak for itself”
As data accumulate,
the accuracy of the
predictions improves

6060
0
100
200
300
400
500
600
700
Ca
se
s p
er
We
ek
Ebola Incidence in Sierra Leone
Model Range Reported Data Forecast Data
Looking to The Future of Epidemic Forecasting
Figure based on a regression transmission model developed by Jason Asher, ASPR/BARDA (CTR)
Epidemic modelers
are developing
techniques that help
emerging data to
“speak for itself”
As data accumulate,
the accuracy of the
predictions improves

6161
0
100
200
300
400
500
600
700
Ca
se
s p
er
We
ek
Ebola Incidence in Sierra Leone
Model Range Reported Data Forecast Data
Looking to The Future of Epidemic Forecasting
Figure based on a regression transmission model developed by Jason Asher, ASPR/BARDA (CTR)
Epidemic modelers
are developing
techniques that help
emerging data to
“speak for itself”
As data accumulate,
the accuracy of the
predictions improves

6262
The Prosocial Function Of Modeling:
Conduit for Communication
With thanks to Steve Bankes
6363
CDC PUBLIC HEALTH GRAND ROUNDS
Staying Ahead of the Curve: Modeling and Public Health Decision Making
January 19, 2016
Tra
nsm
issib
ility
Severity