CD O June 30, 2008 Actuarial Valuation - Blog of San Diego€¦ · -(j-'EIRON June 30, 2008...
19
-(j-'EIRON June 30, 2008 Actuarial Valuation CD O O O O Presentation to the San Diego City Council lED ! I February 23, 2009
Transcript of CD O June 30, 2008 Actuarial Valuation - Blog of San Diego€¦ · -(j-'EIRON June 30, 2008...
-(j-'EIRON
June 30, 2008 Actuarial Valuation
CD O O O O
Presentation to the San Diego City Council
lED !
I
February 23, 2009
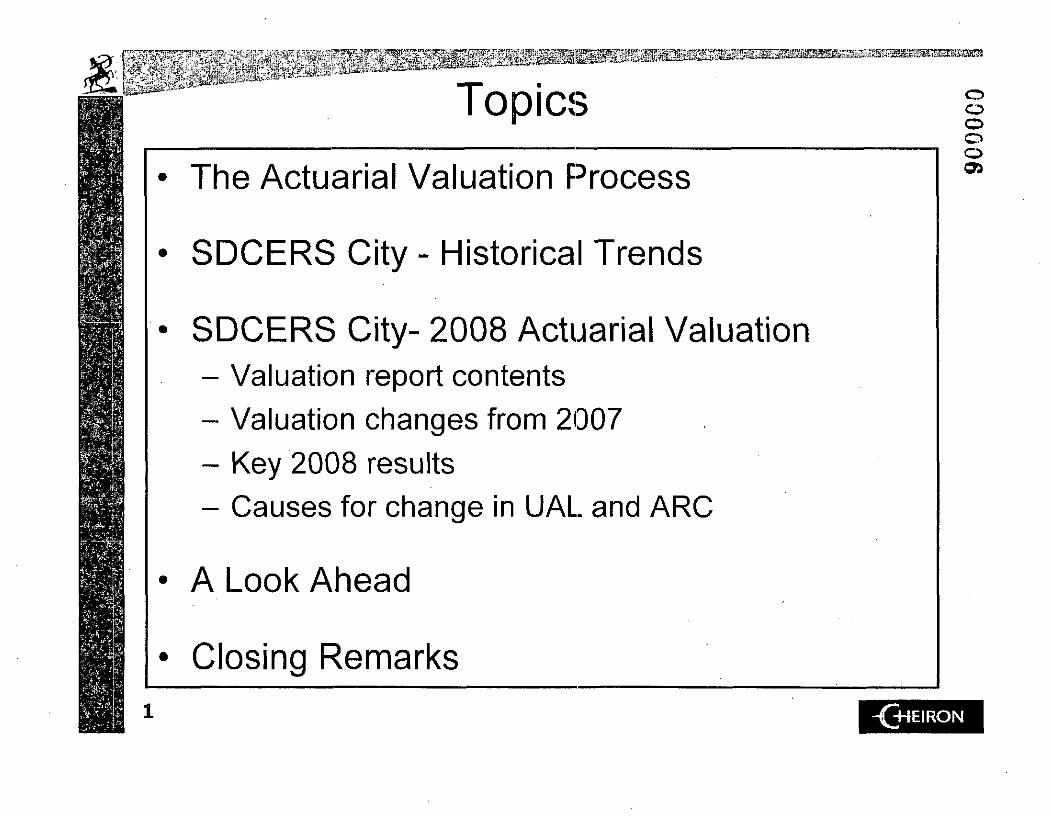
Topics
The Actuarial Valuation F^ocess
SDCERS City - Historical Trends
SDCERS City- 2008 Actuarial Valuation
- Valuation report contents - Valuation changes from 2007 - Key 2008 results - Causes for change in UAL and ARC
A Look Ahead
Closing Remarks
o o o o o OS
1 -(iHEIRON
iS2iSli^Silili^^ i Eassasas^EuCTs
*-.">;)
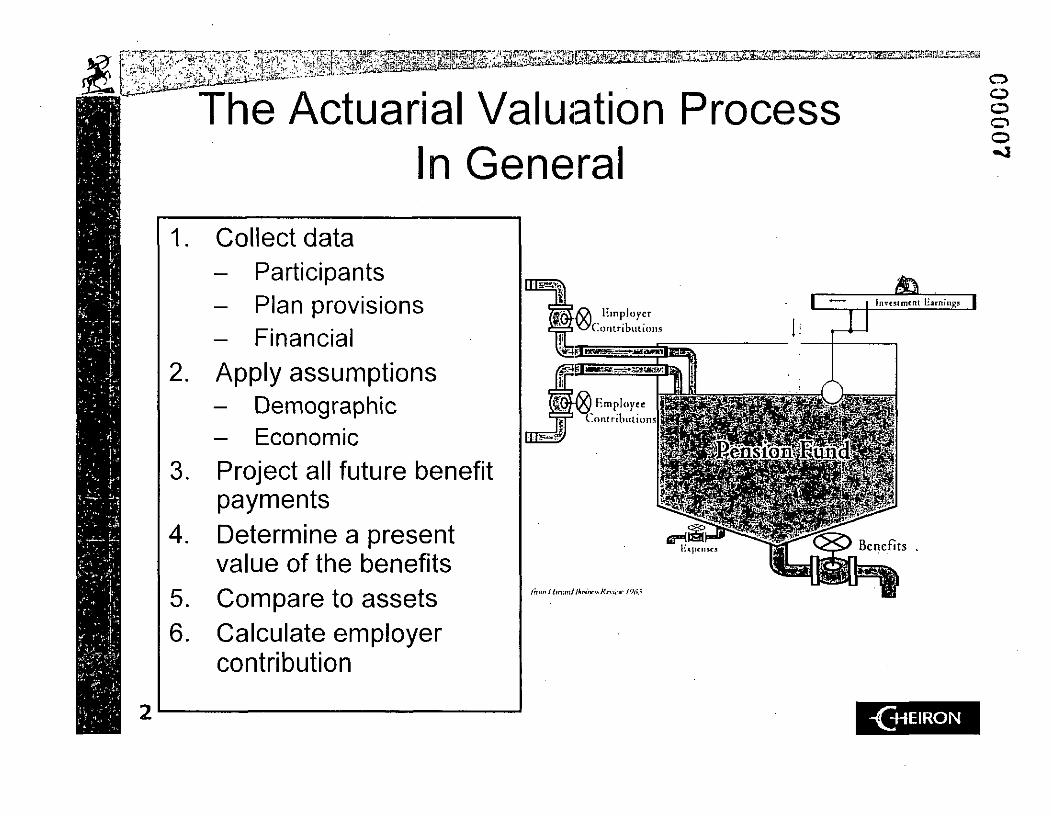
The Actuarial Valuation Process In General
5 6
O o o o o ^ 3
Collect data - Participants - Plan provisions - Financial Apply assumptions - Demographic - Economic Project all future benefit payments Determine a present value of the benefits Compare to assets Calculate employer contribution
an Hinploycr
3 ^-'C.oiiiribulions c == /S&ftmi*rmt.~~*s)tveaiiir:
§ ^ ) Employee
- - Contributions
fra=3y
lm<n/bnMi/lkNnr.i.Kn :.•..• / 'M!
h i pen sc.i
-(HHEIRON
^^^^SSS^ZUmZI^!SS^S!SSSS^^SSff3C=^
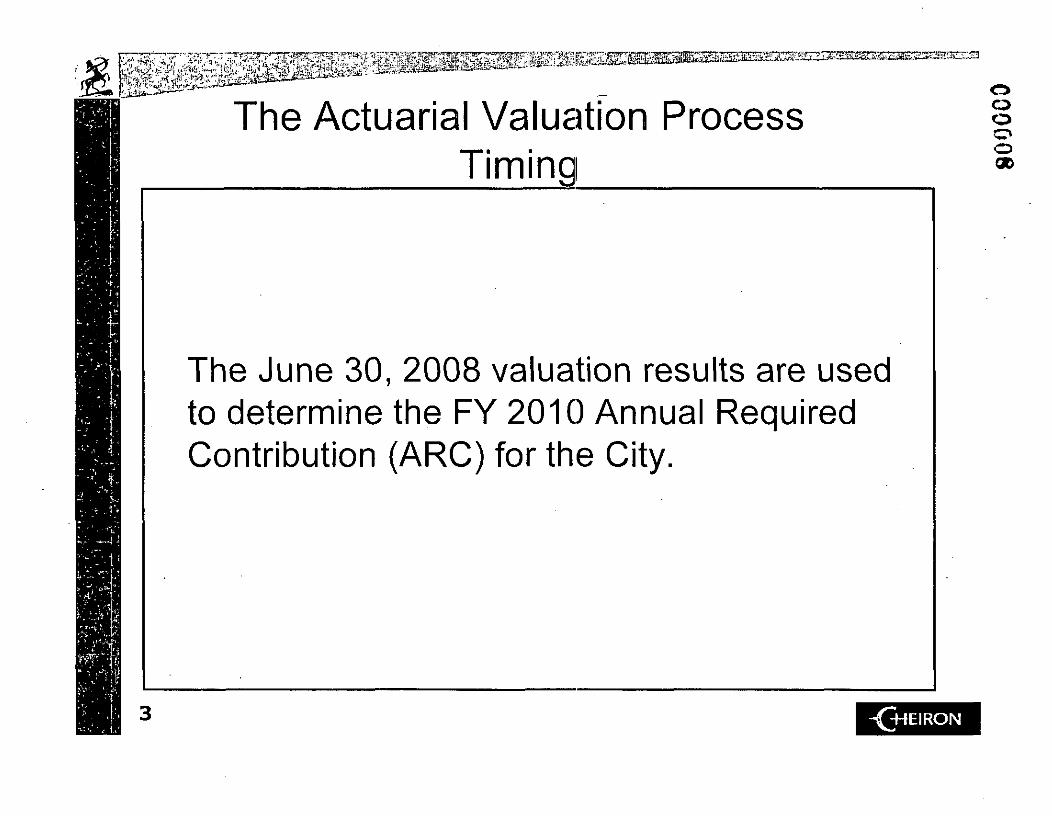
The Actuarial Valuation Process Tim mq
o o o o
The June 30, 2008 valuation results are used to determine the FY 2010 Annual Required Contribution (ARC) for the City.
- ( + I E I R O N
' 3 ^ • ; ; • * " ! • ' • • - • { , ' • " . - - • . v
• • " : ' . - ~ v s . •-•• " • • ; • ' - '• " ' • • •
;asffij&i^j3E?sCT
CD O o o o CO
Historical Trends
4 -(H-JEIRON
mMB0mEz%&mstti
} & $ • & a * ^ ^
, " " • • • / - ^
I*i * l'
> , • • , ' > '
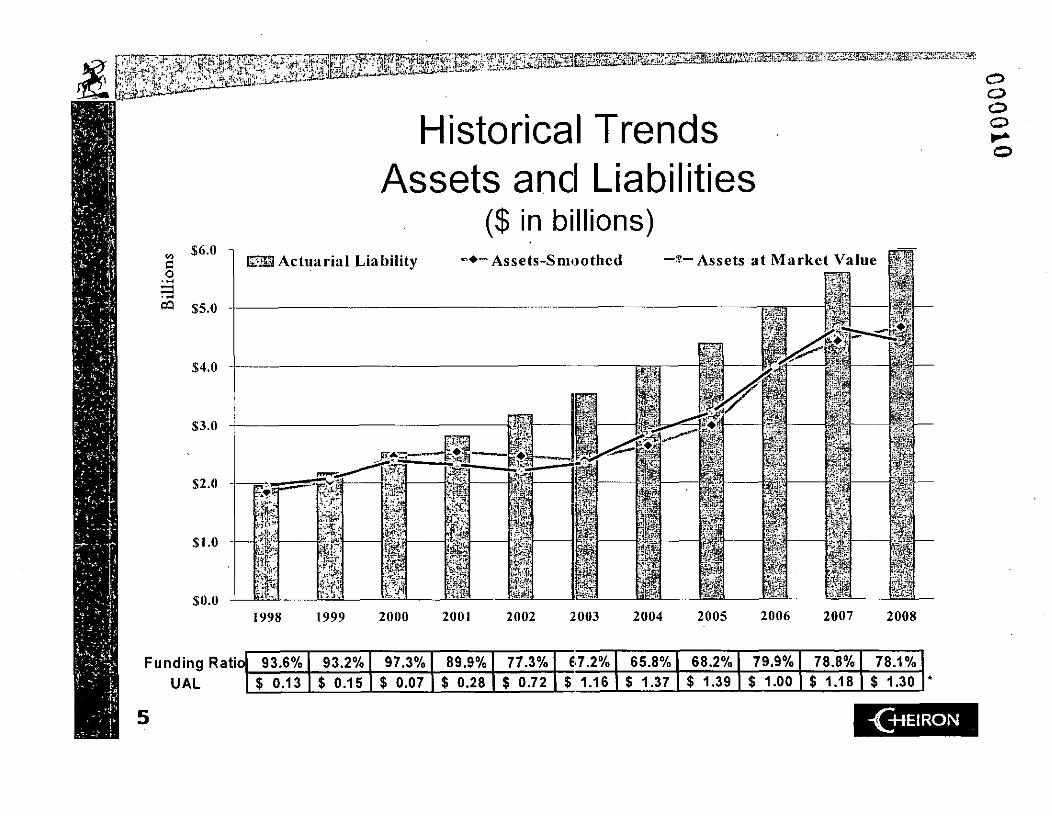
Historical Trends Assets and Liabilities
($ in billions) $6.0 -i
o • » j
^ $5.0
$4.0
$3.0
$2.0
$1.0
$0.0
O o o o
i998 1999 2000 2001 2002 2003 2004 2005 2006 2007 2008
Funding Ratio UAL
93.6% $ 0.13
93.2% $ 0.15
97.3% $ 0.07
89.9% $ 0.28
77.3% $ 0.72
67.2% $ 1.16
65.8% $ 1.37
68.2% $ 1.39
79.9% $ 1.00
78.8% $ 1.18
78.1% $ 1.30
-£HEIRON
! S ? | | p ^ ^ E5Z^2H^S!E^^S^rIX^ar2!? ,!
' .£Wij5£i^i•«• i• J"- , : ' •
o
a.
e o
c o
U
35%
30%
25%
^ 20%
2 15% 3
10%
5%
0%
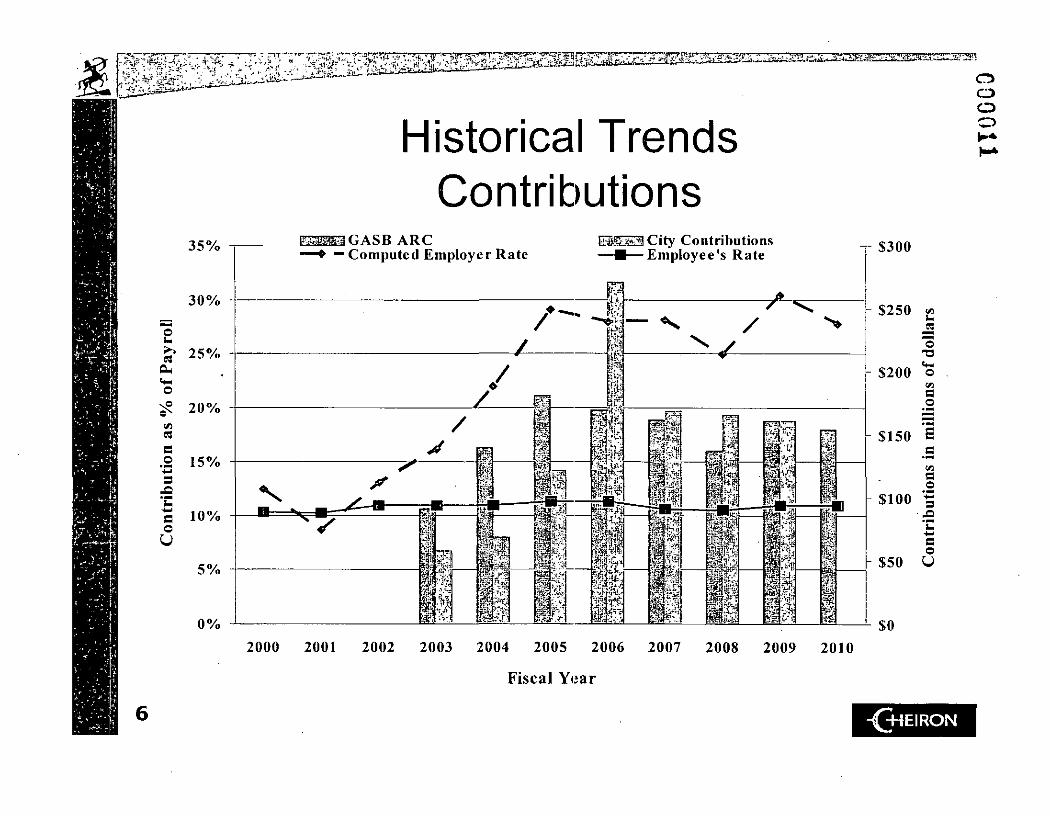
Historical Trends Contributions
ESUEaGASB ARC — • — Computed Employer Rate
USSOiSi City Contributions —•—Employee's Rate -T $300
2000 2001 2002 2003 2004 2005 2006 2007 2008 2009 2010
Fiscal Year
$250
$200
$150
$100
$50
( A
08
O •u t * -
o w a o
^ i ^
t=
c •^ (A
a o 3
- £ i k.
• w
a o U
$0
en o o
-(+*EIRON
. 3 •&*
c © •
$400
S $300
($400)
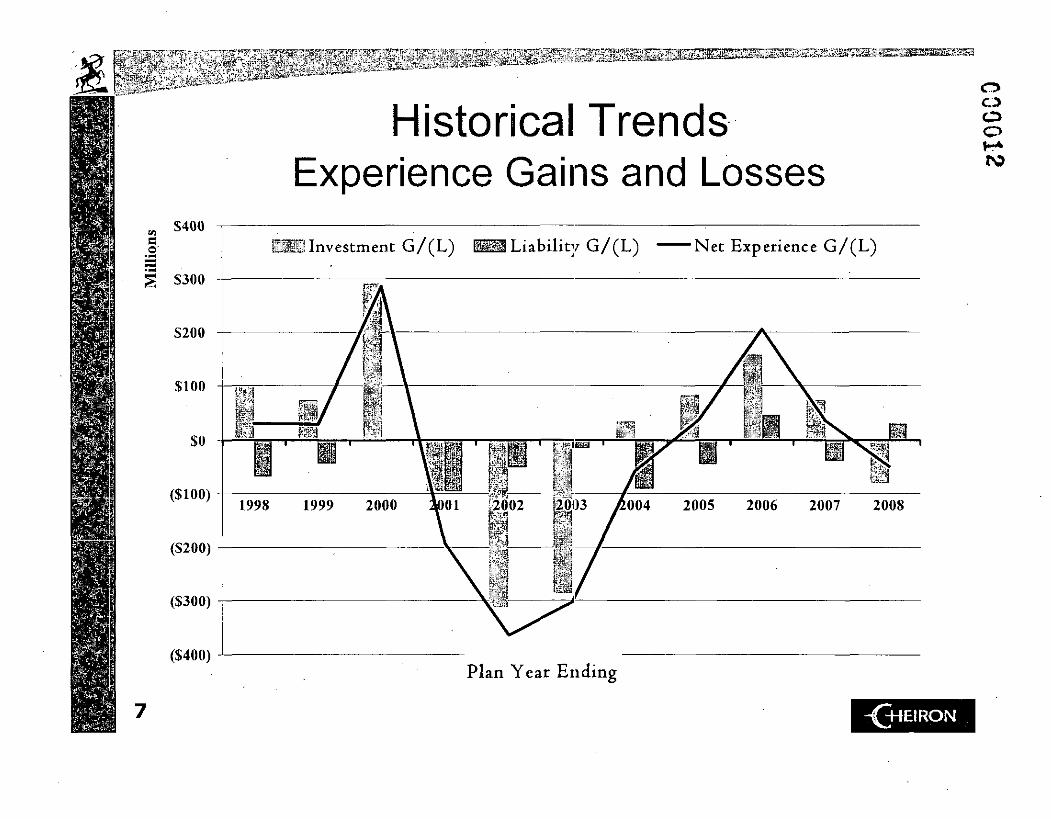
Historical Trends Experience Gains and Losses
S I ! Investment G/(L) H B Liability G/(L) Net Experience G/(L)
Plan Year Ending
O O
ro
-(j-IEIRON
gBSPmsaas sgar l^SSiiO^l^SSS^^ssa^ss^aaat^K^'sssEasfflospsssEs
r i f t i i . M
33 0 CD o o
DCERS'City 2008 Actuarial Valuation
8 -£H E I R O N
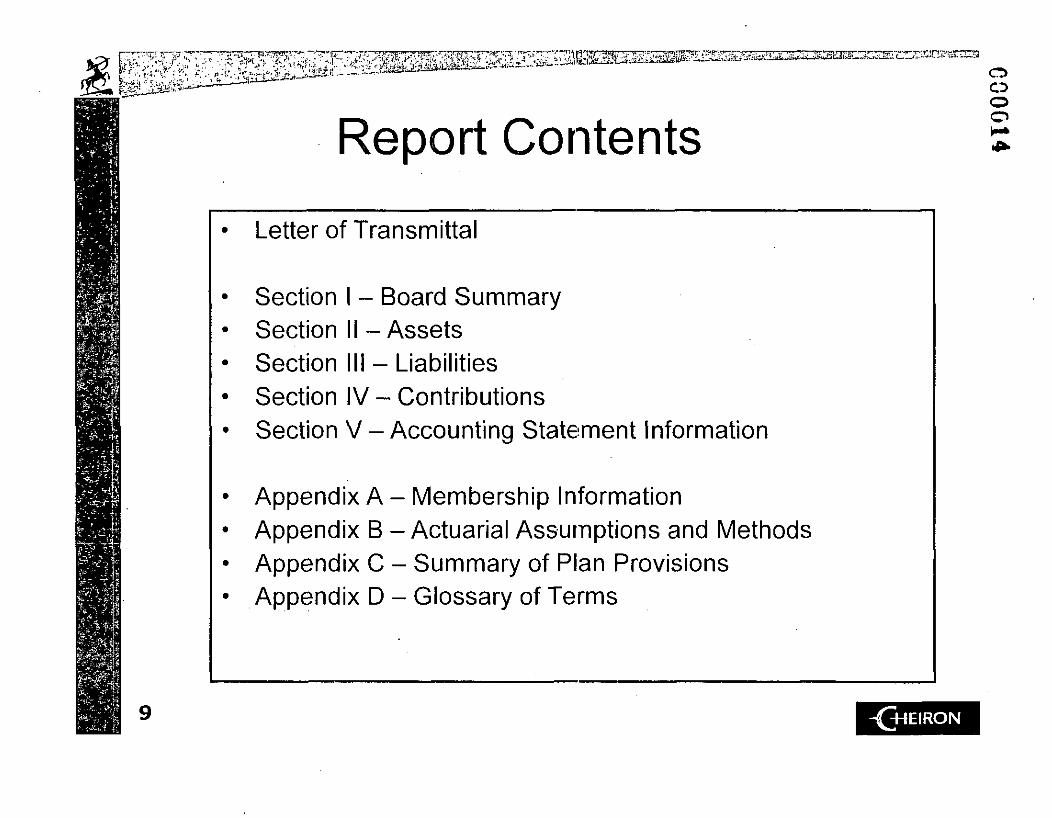
Report Contents
Letter of Transmittal
Section I - Board Summary Section II -Assets Section III - Liabilities Section IV-Contributions Section V-Accounting Statement Information
Appendix A Appendix B Appendix C Appendix D
Membership Information Actuarial Assumptions and Methods Summary of Plan Provisions Glossary of Terms
o CD o o
-(+IEIRON
a k
A<JUS* ^ ^ • ^ ^ m m M m M m ^ ^ B ^ ^ ^ -^-^•^s^^^^^in^iz^^x S T j ^ l n r i t l *
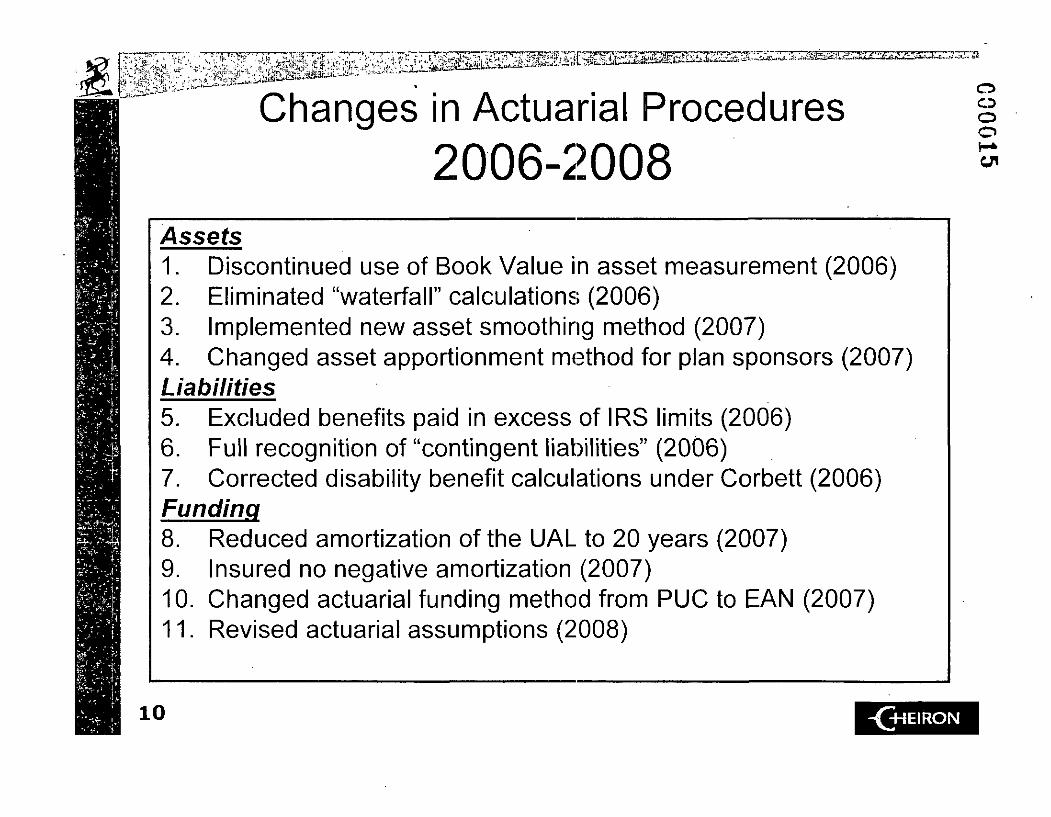
Changes in Actuarial Procedures 2006-2008
C5 CD o o
4ssefs 1. Discontinued use of Book Value in asset measurement (2006) 2. Eliminated "waterfall" calculations (2006) 3. Implemented new asset smoothing method (2007) 4. Changed asset apportionment method for plan sponsors (2007) Liabilities 5. Excluded benefits paid in excess of IRS limits (2006) 6. Full recognition of "contingent liabilities" (2006) 7. Corrected disability benefit calculations under Corbett (2006) Funding 8. Reduced amortization of the UAL to 20 years (2007) 9. Insured no negative amortization (2007) 10. Changed actuarial funding method from PUC to EAN (2007) 11. Revised actuarial assumptions (2008)
10 -(34EIRON
1)
11
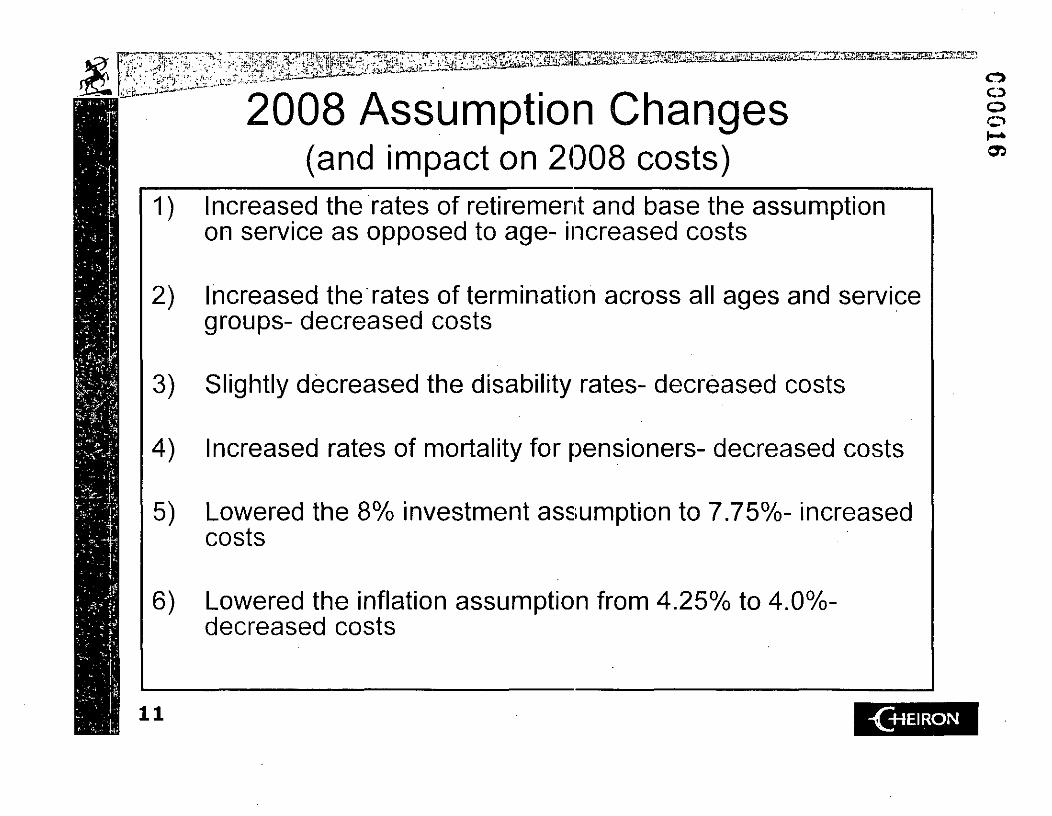
2008 Assumption Changes (and impact on 2008 costs)
lEKSBESSEBSSSCKB
ncreased the rates of retirement and base the assumption on service as opposed to age- increased costs
2) Increased the rates of termination across all ages and service groups- decreased costs
3) Slightly decreased the disability rates- decreased costs
4) Increased rates of mortality for pensioners- decreased costs
5) Lowered the 8% investment assumption to 7.75%- increased costs
6) Lowered the inflation assumption from 4.25% to 4.0%-decreased costs
-(+1EIRON
O CO o
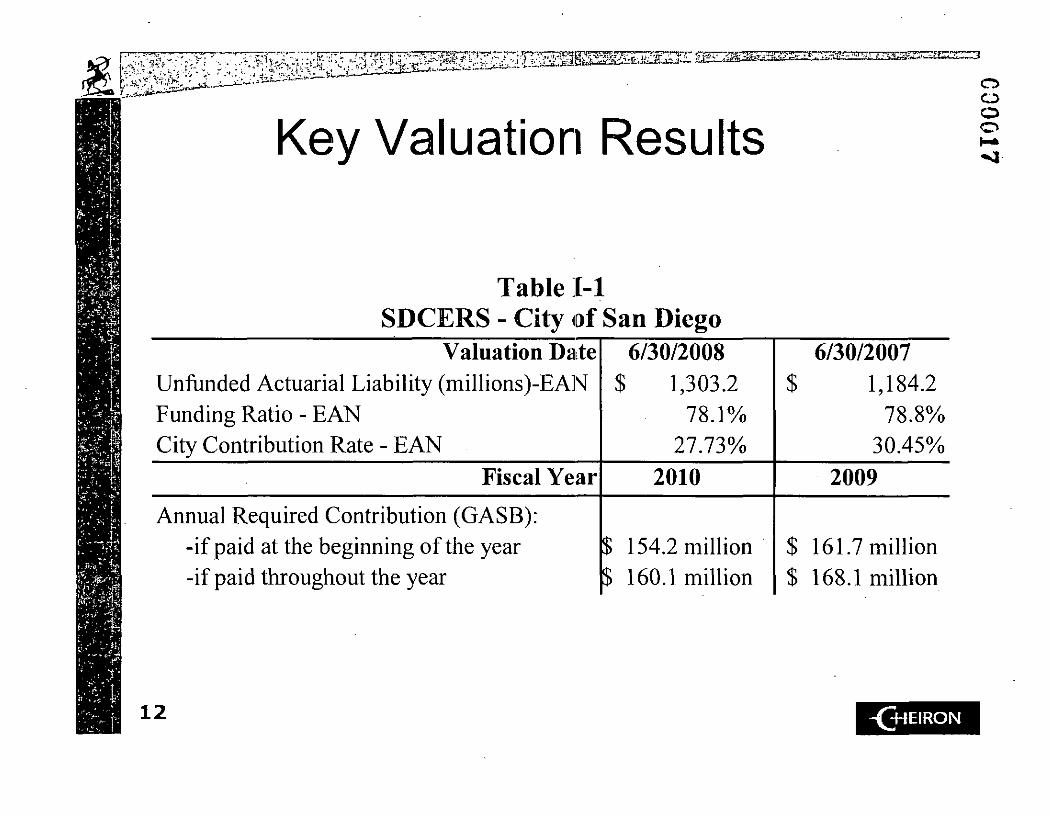
Key Valuation Results o CJ) o o
Table 1-1 SDCERS - City of San Diego
Valuation Date Unfunded Actuarial Liability (millions)-EA]V Funding Ratio - EAN City Contribution Rate - EAN
6/30/2008 $ 1,303.2
78.1% 27.73%
6/30/2007 $ 1,184.2
78.8% 30.45%
Fiscal Year 2010 2009
Annual Required Contribution (GASB): -if paid at the beginning of the year -if paid throughout the year
$ 154.2 million $ 160.1 million
$ 161.7 million $ 168.1 million
12 -(+IEIRON
••1. ; ' - - ' v i - . ' , ' ' - ; ' T
; i t • ' | • • ' • ^ J i - " ' - - • ' " • ,
i r T ^ J T ^ ^ t ; a * • . r . . . . . _" ^ , ;»s.t-»
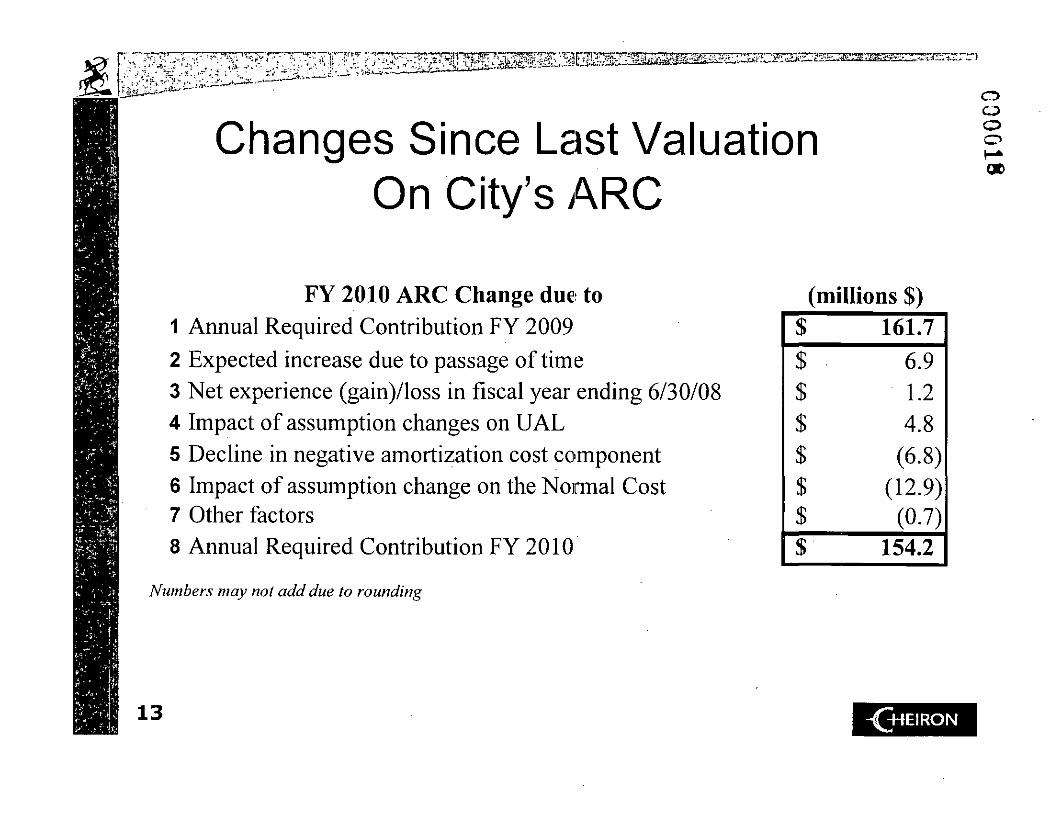
Changes Since Last Valuation On City's ARC
s^£rzs33s*;
O CO
o o at
FY 2010 ARC Change due to 1 Annual Required Contribution FY 2009
2 Expected increase due to passage of time 3 Net experience (gain)/loss in fiscal year ending 6/30/08 4 Impact of assumption changes on UAL 5 Decline in negative amortization cost component 6 Impact of assumption change on the Normal Cost 7 Other factors 8 Annual Required Contribution FY 2010
Numbers may not add due to rounding
(millions $)
$
$
$
$
$
$
161.7 6.9 1.2 4.8
(6.8) (12.9)
(0.7)
154.2
13 -(j-IEIRON
f f I P g l i l g ^ ^ S l i S S i i S K ^ ^ ^ ^ ^ SiKoSZSH'O^
^ ' **-
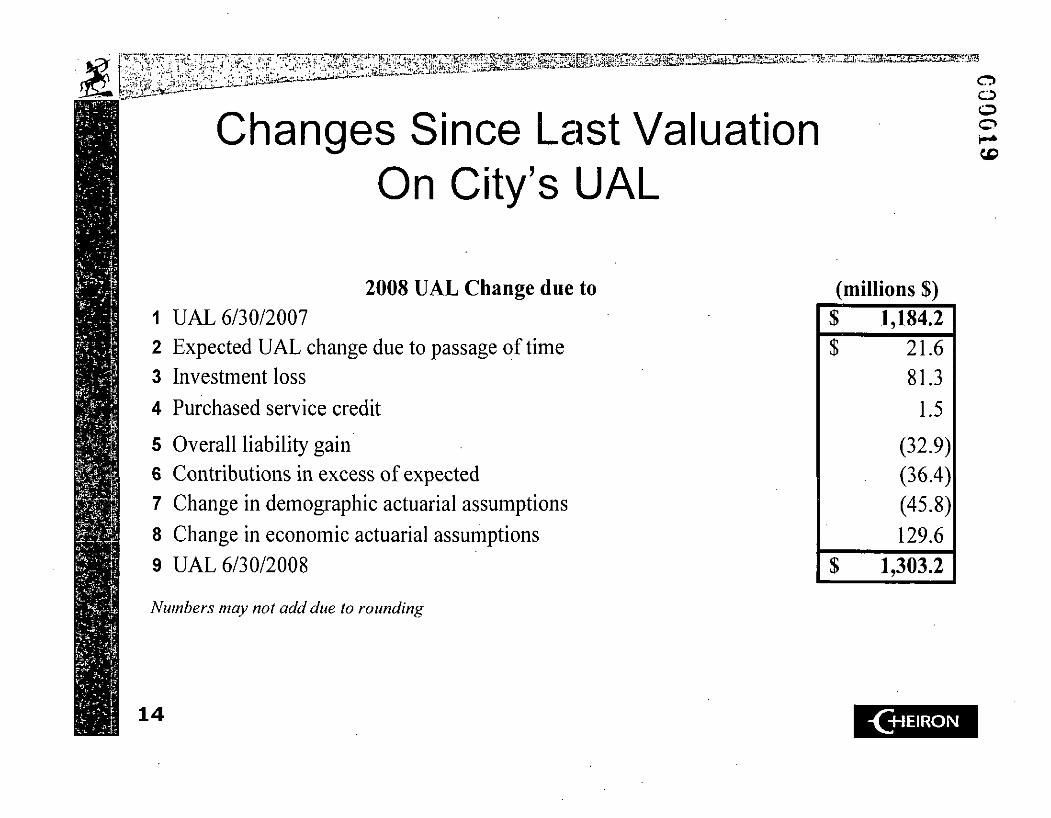
Changes Since Last Valuation On City's UAL
O CO o o
2008 UAL Change due to 1 UAL 6/30/2007 2 Expected UAL change due to passage of time 3 Investment loss
4 Purchased service credit
5 Overall liability gain 6 Contributions in excess of expected 7 Change in demographic actuarial assumptions 8 Change in economic actuarial assumptions 9 UAL 6/30/2008
Numbers may not add due to rounding
(millions $)
1,184.2 21.6 81.3
1.5
(32.9) (36.4) (45.8) 129.6
1,303.2
14 -(jHEIRON

O o o o
A Look Forward
I
15 -(+IEIRON
S^I^1!^^^^^*^^^
^•••x.-
SDCERS Pro ections <+lEIRON y
F Y 7 • ARC (hi)! UAH fbl m^n^iinrra
S 161.7
$ 186.5
$ 2 1 8 . 2
$ 228.6
$ 260.7
$ 271.9
S 283.3 S 295.2
$ 307.4
S 317.7
•$ 319.6
S 323.6
BASEUNE
HISTORICAL
Asset smoo tfaiii
Min AVA/MVA
M M AVA/MVA
25% 80%
120%
L . S I 6 ^
-$121 -•
V $ 6 >
^78.1% 78;3%.4J9.2%%80.6% * 82.5%; "8416% % 86.9% >• 89:6%^ 92.6% 95.8% 99 .1%' 99.5% 99:8% f '%
SZD Actuarial Liability "'""Actuarial Value of Assets Market Value of Assets
40% -
3 5 % = , - • " > " » - • '
30%:-
• Employer Contr ibut ion Rate
' 2 0 % -•» *
f^4J
l3%C-29.8%k
i ru i .30.7%$ JlB.25yR31::53S j i i la%|p^7.% H
-29:8%1
16 -( j4EIRON
o o o
Hni25^!2SS^«2I,'^^-")
£ v ^ ^ i t o . « -
17
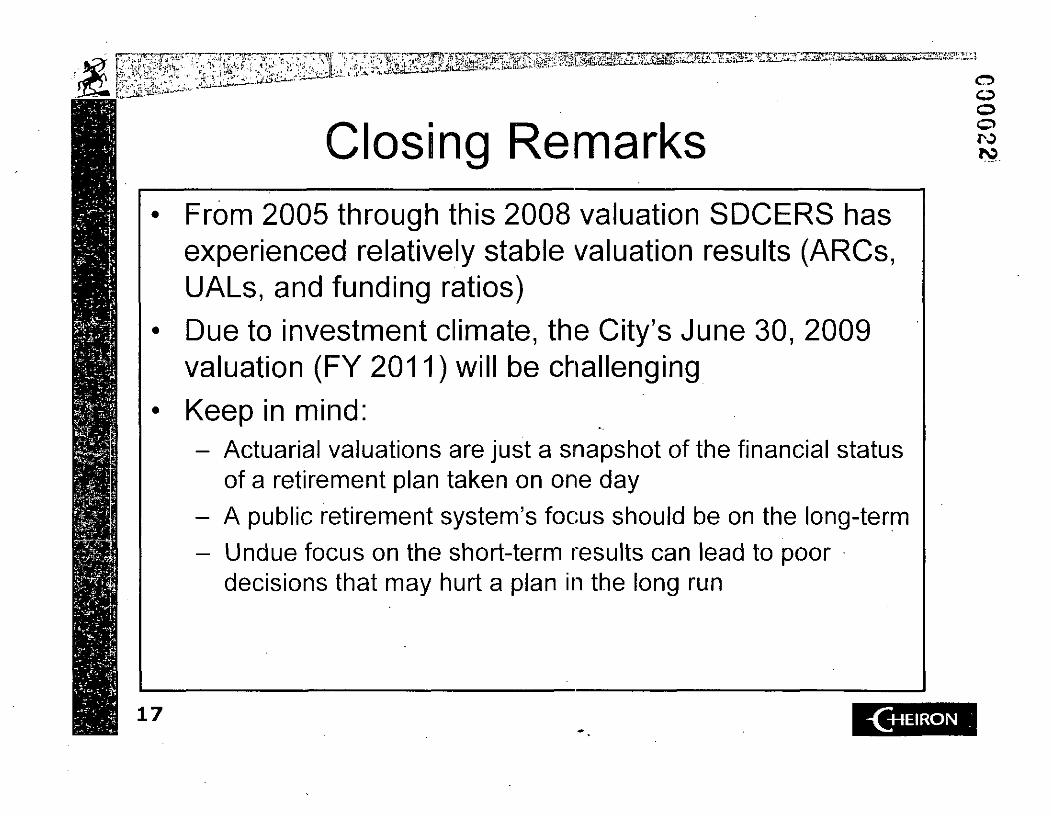
Closina Remarks From 2005 through this 2008 valuation SDCERS has experienced relatively stable valuation results (ARCs, UALs, and funding ratios)
Due to investment climate, the City's June 30, 2009 valuation (FY 2011) will be challenging
Keep in mind: - Actuarial valuations are just a snapshot of the financial status
of a retirement plan taken on one day - A public retirement system's focus should be on the long-term - Undue focus on the short-term results can lead to poor
decisions that may hurt a plan in the long run
o o o o
-(+IEIRON
h ' J 4
r , '-T^-ry^T^r'jjTj^ * J 3.1 „iai_jJtS^— •"- • j :
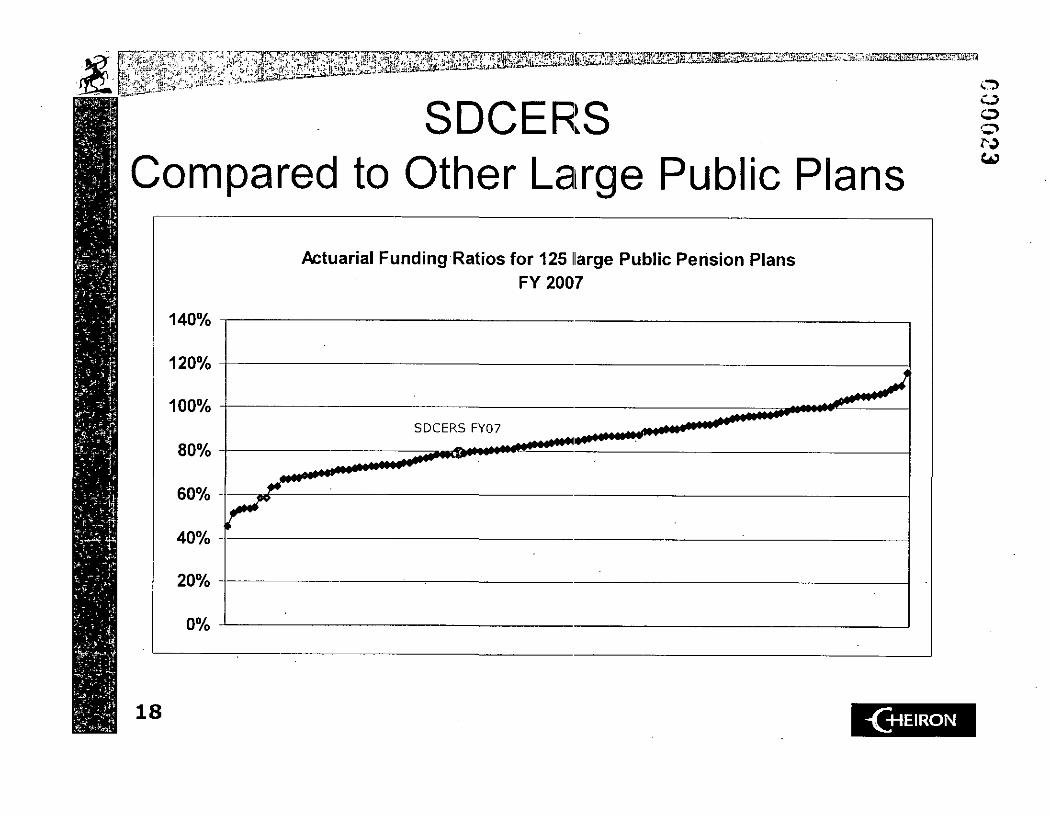
SDCERS Compared to Other Large Public Plans
O o
> • - . ' * • -
140%
120%
Actuarial Funding Ratios for 125 llarge Public Pension Plans FY 2007
18 -(H4EIRON