CCT Investor presentation (US) investor meetings) Sep 2011...The CCT UiUnits are not obligations of,...
74
CapitaCommercial Trust Presentation for Investor Meetings in the United States 6 – 9 September 2011
Transcript of CCT Investor presentation (US) investor meetings) Sep 2011...The CCT UiUnits are not obligations of,...

CapitaCommercial Trust pPresentation for Investor Meetings in the United States
6 – 9 September 2011

Important Notice
This presentation shall be read in conjunction with CCT’s Second Quarter 2011 UnauditedFinancial Statement Announcement.
The past performance of CCT is not indicative of the future performance of CCT. Similarly, the past performanceof CapitaCommercial Trust Management Limited, the manager of CCT is not indicative of the future performanceof the Manager.
Th l f i i CCT (CCT U i ) d h i d i d f h f ll ll i Th CCT U iThe value of units in CCT (CCT Units) and the income derived from them may fall as well as rise. The CCT Unitsare not obligations of, deposits in, or guaranteed by, the CCT Manager. An investment in the CCT Units issubject to investment risks, including the possible loss of the principal amount invested. Investors have no rightto request that the CCT Manager redeem or purchase their CCT Units while the CCT Units are listed. It isintended that holders of the CCT Units may only deal in their CCT Units through trading on Singapore Exchangeintended that holders of the CCT Units may only deal in their CCT Units through trading on Singapore ExchangeSecurities Trading Limited (SGX-ST). Listing of the CCT Units on the SGX-ST does not guarantee a liquidmarket for the CCT Units.
This presentation may contain forward-looking statements that involve assumptions, risks and uncertainties.This presentation may contain forward looking statements that involve assumptions, risks and uncertainties.Actual future performance, outcomes and results may differ materially from those expressed in forward-lookingstatements as a result of a number of risks, uncertainties and assumptions. Representative examples of thesefactors include (without limitation) general industry and economic conditions, interest rate trends, cost of capitaland capital availability, competition from other developments or companies, shifts in expected levels ofoccupancy rate, property rental income, charge out collections, changes in operating expenses (includingemployee wages, benefits and training costs), governmental and public policy changes and the continuedavailability of financing in the amounts and the terms necessary to support future business.
Y ti d t t l d li th f d l ki t t t hi h b d th
CapitaCommercial Trust Presentation *July 2011*
You are cautioned not to place undue reliance on these forward-looking statements, which are based on thecurrent view of the CCT Manager on future events.
2
Contents
1. Highlights 4Slide No.
2. Financial Results 73. Market Street Car Park Joint Venture 204. Asset Enhancement Update 365 Stable Portfolio 405. Stable Portfolio 406. Market Outlook 497. Summary 528. Raffles City 1H 2011 Information 549. Supplementary Information 64
CapitaCommercial Trust Presentation *July 2011*3

1 Highlights1. Highlights
CapitaCommercial Trust Presentation *July 2011*4

Highlights
• Signed JV agreement with CapitaLand and MEA to redevelop Market Street Car Park into Grade A office tower
• Successfully refinanced S$578.4 million (CCT’s 60% interest in Raffles City Singapore) at lower interest rates
ll h d f t it d twell ahead of maturity date
5 CapitaCommercial Trust Presentation *July 2011*

Healthy portfolio performance
• Portfolio committed occupancy rate at 97.7% as at 30 June 2011(1)as at 30 June 2011( )
• Signed new office and retail leases and renewals of aro nd 264 600 sq are feet from Jan ar J ne 2011around 264,600 square feet from January – June 2011– For 2Q 2011, tenants include:
• Saudi Petroleum Ltd (Singapore Branch) (Energy)Saudi Petroleum, Ltd (Singapore Branch) (Energy)• Shearman & Sterling LLP (Legal)• Shinhan Bank, Singapore Branch (Financial Services)
– Key sectors of these new leases and renewals: Legal Services and Energy
Note:
6
(1) Computation excludes Market Street Car Park.
CapitaCommercial Trust Presentation *July 2011*
2 Financial Results2. Financial Results
CapitaCommercial Trust Presentation *July 2011*7

Achieved S$106.5 million in distributable income and DPU of 3 77 cents for 1H 2011income and DPU of 3.77 cents for 1H 2011
1H 2011 1H 2010 VarianceS$ million %
Due to reduction in rental income following divestments of two non-Grade A properties and negative rent reversions, mitigated by higher income contribution from other CCT
Due to reduction in rental income following divestments of two non-Grade A properties and negative rent reversions, mitigated by higher income contribution from other CCT
139.8
182.0
Net Property Income
202.0
151.8 (7.9)
(9.9)Gross Revenue
Mitigated by lower property operating Mitigated by lower property operating
income contribution from other CCT propertiesincome contribution from other CCT properties
1
106.5Distributable Income 110.0 (3.2)expensesexpenses
Mitigated by lower interest expenses resulting from debt reductions using Mitigated by lower interest expenses resulting from debt reductions using
3.77¢1Distribution Per Unit 3.90¢ (3.3) divestment proceedsdivestment proceeds
Note:1. DPU for 1H 2011 was computed on the basis that none of the Convertible Bonds is converted into Units.
Accordingly, the actual quantum of DPU may differ if any of the Convertible Bonds is converted into Units
CapitaCommercial Trust Presentation *July 2011*8

1H 2011 gross revenue decline mainly due to negative rent reversions
6.0%
negative rent reversions
Higher contribution from Gross Revenue
60,491 64,415
60 000
70,000Lower yield
6.0%S$'000 Negative rent
reversions and lower occupancy
ghotel and retail offset
negative rent reversions from office
43,928
40 000
50,000
60,000
1.9%-1.0%
-28.2% protection required
31,987 29,641
32,580 31,536 29,350 30,000
40,000
3.2% 0.6%20 4% Divested-5 2%
Lower occupancy
1 3%
Higher occupancy
4,703 4,985 5,243 5,640 2,704
8,348 4,366 4,854 6,004 5,276 5,349
2,669
10,000
20,00020.4% 5.2% -1.3%
, - -0
Capital Tower
Six Battery Road
One George Street
60% Interest in
RCS
HSBC Building
Wilkie Edge
Bugis Village
Golden Shoe Car
Park
Market Street Car
Park
Starhub Centre
Robinson Point
CapitaCommercial Trust Presentation *July 2011*
1H 2010 1H 2011
9

Lower operating expenses in 1H 2011 mitigated net property income decline
8.2%S$'000
net property income decline
Mainly due t hi h
Lower revenue but mitigated
Net Property Income
43,683
47,281
40,000
50,000
-26.4%
to higher revenue
by lower property tax and other operating expenses
33,016
24 295
30,000
40,000
6.2% 0.1% Lower revenue but mitigated by
decline in
Mainly due to higher
revenue but offset by higher
22,827 24,539 24,219 24,295 24,552
20,000
9.4%23.2%3.5% Divested-0.7%2 7%
decline in operating
costs
operating costs
4,658 3,255 3,984 4,236
2,064
6,172 3,373
4,822 4,009 4,360 4,207 2,008
10,000
-2.7%
- -0
Capital Tower
Six Battery Road
One George Street
60% Interest in
RCS
HSBC Building
Wilkie Edge
Bugis Village
Golden Shoe Car
Park
Market Street Car
Park
Starhub Centre
Robinson Point
1H 2010 1H 2011
CapitaCommercial Trust Presentation *July 2011*10

Total Assets at S$6.2 BillionAdj. NAV improved to S$1.52 due to revaluation gain
30 Jun 11 S$'000
31 Dec 10S$'000
Adj. NAV improved to S$1.52 due to revaluation gain
Non-current assets 1 5,710,799 5,554,383Current assets 2 479,981 641,784Total assets 6,190,780 6,196,167Total assets 6,190,780 6,196,167Current liabilities 3 655,740 986,290Non-current liabilities 4 1,126,020 936,136N t t 4 409 020 4 273 741Net assets 4,409,020 4,273,741Unitholders' funds 4,409,020 4,273,741NAV Per Unit $1.56 $1.51Adjusted NAV Per Unit 5 $1.52 $1.47
Notes: Comparing Jun 11 against Dec 10(1) Non-current assets increased by 3% primarily due to higher valuation of the investment properties on a portfolio basis(1) Non-current assets increased by 3% primarily due to higher valuation of the investment properties on a portfolio basis(2) Current assets decreased primarily due to drop in cash balance utilized to repay MTN due in Jan 2011 and redemption
of convertible bonds(3) Current liabilities dropped due to reclassification of borrowings of RCS Trust and convertible bonds due 2013 from
current liabilities to non-current liabilities.(4) Non-current liabilities increased due to reclassification of borrowings from RCS Trust and convertible bonds due 2013
CapitaCommercial Trust Presentation *July 2011*11
( ) gfrom current liabilities and convetrible bonds
(5) Assuming the distribution income has been paid to the unitholders

Valuation as at 30 June 2011 increased 2.8%
As at 31 Dec 10 $
As at 30 Jun 11 S$'
Variance %
As at 30 Jun 11S$'m S$'m % 30 Jun 11
S$ psfCapital Tower 1,113.5 1,175.0 5.5 1,586Six Battery Road 1 115 0 1 150 0 3 1 2 320Six Battery Road 1,115.0 1,150.0 3.1 2,320HSBC Building 345.8 370.5 7.1 1,848Bugis Village 62.4 60.6 (2.9) 495G ld Sh C P k 109 1 110 0 0 8 NMGolden Shoe Car Park 109.1 110.0 0.8 NMOne George Street 914.3 922.6 0.9 2,059Wilkie Edge 150.9 151.1 0.1 1,011
Subtotal 3,811.0 3,939.8 3.4 Raffles City 60% 1,615.8 1,640.4 1.5 NM
Portfolio 5,426.8 5,580.2 2.8
Note: Excludes Market Street Car Park which has been reclassified as Investment Property under Construction
CapitaCommercial Trust Presentation *July 2011*12

CCT’s June 2011 valuation showed slight cap rate compression for some propertiesrate compression for some properties
Cap rates Dec 2008 Dec 2009 Dec 2010 Jun 2011pGrade A
offices and HSBC
4.5% 4.25% Six Battery Road, HSBC Building:
4%
4%
BuildingCapital Tower, One George
StreetStreet 4.15%
Wilkie Edge 4.75% 4.5% 4.4% 4.25%Raffles City Singapore
Office: 4.5%Retail: 5.5%
Hotels &
Office: 4.5%Retail: 5.6%
Hotels &
Office - 4.5%Retail - 5.5%
Hotels &
Office – 4.5%Retail – 5.5%
Hotels & Convention
Centre: 5.75%Convention
Centre: 5.85%Convention
Centre - 5.75% Convention
Centre – 5.75%
CapitaCommercial Trust Presentation *July 2011*13

RCS Trust’s new debt package (100% interest)
1. 1.7 times subscription for issue of US$645 million 5-year secured floating rate notes – Proceeds from issue swapped into S$800 million and fixed at
attractive 3 09% per annum ( ff ti 13 S t 2011)attractive 3.09% per annum (effective 13 Sept 2011)
2. S$200 million 5-year secured term loan facility granted by DBS HSBC and Standard Charteredgranted by DBS, HSBC and Standard Chartered Bank at 3.025% per annum (effective 13 Sept 2011)
– Drawdown of S$164 millionDrawdown of S$164 million
3. S$300 million 5-year revolving credit facility in place
CapitaCommercial Trust Presentation *July 2011*14

Refinanced RCS’ borrowings well ahead of maturity date and at lower interest ratematurity date and at lower interest rate
S$866m CMBS
(@4.18%)
S$98m secured revolving
credit facility
Aggregate S$964m
Previous RCS borrowings
S$800m secured
notes(@3 09%)
S$164m term loan
facility(@3 025%)
AggregateS$964m
New RCS borrowings (@3.09%) (@3.025%)g
CCT (60%)S$578.4m
CapitaCommercial Trust Presentation *July 2011*15

Completed refinancing of all 2011 debt- diverse sources of fundingdiverse sources of funding
Debt maturity profile as at 30 June 2011
$98
Average term of debt maturity extended -from 1 3 years in 1Q 2011 to 2 9 years in
$570m (34%)
$480m(29%)
$98m (6%)
from 1.3 years in 1Q 2011 to 2.9 years in 2Q 2011
$50m
$225m(14%)
(29%)(3%)
Completedrefinancing of RCS debt
$174m (10%)
$70m (4%)
2011 2012 2013 2014 2015 20162011 2012 2013 2014 2015 2016
Secured term loan due Mar Convertible bonds with YTM of 3.95% due May 3.5% fixed rate MTN due Jun 3.64% fixed rate MTN due FebC tibl b d t 2 7% d A RCS fi d t 3 09% d t d J
CapitaCommercial Trust Presentation *July 2011*16
Convertible bonds at 2.7% due Apr RCS fixed rate 3.09% secured notes due JunRCS secured term loan at 3.025% due Jun

2Q 2011’s financial indicators – improved capital structure and healthy cashflowsst uctu e a d ea t y cas o s
2Q 2011 1Q 2011 Remarks
Total Gross Debt (S$'m) 1,666.7 1,673.4 Improved
G i R ti 26 9% 27 8%Improved
Gearing Ratio 26.9% 27.8% (due to higher assets value and lower borrowings)
Net Debt/EBITDA 5.3 times 5.3 times Stable
Unencumbered Assets as % of Total Assets 54.5% 54.6% Stable
A T tAverage Term to Maturity 2.9 years 1.3 years Improved
(due to refinancing of RCS Trust)
Average Cost of Debt 3.6% 3.6% StableAverage Cost of Debt 3.6% 3.6% Stable
Interest Coverage 4.1 times 4.1 times Stable
17 CapitaCommercial Trust Presentation *July 2011*

Further enhanced financial flexibility
• Total number of unsecured assets : 7 out of 9
• Value of unsecured assets : S$2.8 billion (50.0% of totalValue of unsecured assets : S$2.8 billion (50.0% of total value of investment properties)
• S$1.9 billion untapped balance from S$2.0 billion $ pp $multicurrency medium term note programme
Golden Shoe Car ParkWilkie Edge
Six Battery Road
One George Street
HSBC Building
CapitaCommercial Trust Presentation *July 2011*18
Market Street Car ParkBugis Village

Fixed/Floating Interest Rate ProfileLow exposure to interest rate riskLow exposure to interest rate risk
12%
Borrowings on Floating Rate
88%
Borrowings on Fixed Rate
CapitaCommercial Trust Presentation *July 2011*19

3 Market Street Car Park Joint Venture3. Market Street Car Park Joint Venture
CapitaCommercial Trust Presentation *July 2011*20

Well-connected island site in Raffles Place and near Marina Bay financial areanear Marina Bay financial area
Attractiveness of Attractiveness of
HSBC Bldg
Six Battery Rd
One George St
Market Street site
• In the heart of Singapore’s
Market Street site
• In the heart of Singapore’sRaffles Place
Bldg In the heart of Singapore s Central Business District, and close to Marina Bay
In the heart of Singapore s Central Business District, and close to Marina BayGolden Shoe
Car Park
• Excellent connectivity to public transportation network and amenities
• Excellent connectivity to public transportation network and amenities
New Market Street tower
• Island site with high visibility • Island site with high visibility
Marina Bay
21

Obtained outline planning permission from URA for redevelopment in Jan 2008
• Subject to conditions:
URA for redevelopment in Jan 2008
• Subject to conditions:1. Proposed Commercial use at gross plot ratio
12.6+ (equivalent to 14.49), subject to approval to12.6 (equivalent to 14.49), subject to approval to rezone the site from Transport to Commercial use; and
2. Site to be developed for office use only with activity generating uses on the first storey
22

Enhancement in Land Use
• Lifting of land use restriction from “Transport g pFacilities” to “Commercial Use”
• Subject to:Subject to:1. Differential premium payment by the lessee (the
joint venture) of 100% of enhancement in landjoint venture) of 100% of enhancement in land value (assessed by Chief Valuer in a spot valuation))
2. No extension of existing land lease (62 years)
23

In line with CCT’s portfolio reconstitution strategy to generate higher value for Truststrategy to generate higher value for Trust
Flexibility and speed to i h i i
Redevelop Market
Redeploy
seize growth opportunities Street Car Park into Grade A office tower
Acquire good quality asset
Redeploy capital
Funding flexibility
Organic growth
Enhance / refurbish asset
Unlock value at optimal stage of life cycle
Value creation
Robinson Point
Starhub Centre
Six Battery Road
Raffles City Singapore
24

Rationale for the redevelopment
1. Converting to office maximises use of the prime site
2. Increase foothold in Raffles Place area
3. Financial considerations
4. No Grade A office buildings in CBD completing in 2014
5 Office demand expected to increase on the back of5. Office demand expected to increase on the back of economic growth
6 Positive trends in office rents6. Positive trends in office rents
25

Redevelop into a Grade A office tower to maximise land use for the sitemaximise land use for the site
Mr. Toyo Ito, internationally-acclaimed architect and winner of
Designacclaimed architect and winner of
multiple awards, including the Royal Gold Medal by RIBA (Royal
Institute of British Architects)
Tenure 99 years from 1 April 1974
Estimated GFA 887,000 sq ft (including bonus GFA)
Estimated NLA 720,000 sq ft
Typical floor plate 20,000 – 25,000 sq ftyp p , , q
Max. height control 245 m (same as new office buildings at Marina Bay)
No. of storeys About 40
Target completion Before end-2014Artist’s impression only. Actual design may change without notification.
26

Joint venture partner neededas total project cost exceeds 10% of CCT total assets
According to the Property Fund Guidelines issued by the Monetary A h i f Si
as total project cost exceeds 10% of CCT total assets
Authority of Singapore,
“The total contract value of property development activities undertaken and investments in uncompleted propertyundertaken and investments in uncompleted property developments should not exceed 10% of the property fund’s deposited property [total asset size].”p p p y [ ]
Estimated total project development cost
CCT’s total asset size as at 31 Mar 2011
10% of CCT’s total assetsdevelopment cost total assets
S$1.4 billion S$6.0 billion S$601 million
27

Collaboration with strong partners allows leverage of expertise and strengthsleverage of expertise and strengths
CapitaLand (CL)CapitaLand (CL) Mitsubishi Estate Asia Mitsubishi Estate Asia CapitaCommercialCapitaCommercialp ( )
• One of Asia’s largest real t t i
p ( )
• One of Asia’s largest real t t i
(MEA)
• Strategic partner of CLP d i t
(MEA)
• Strategic partner of CLP d i t
pTrust (CCT)
• Driver of redevelopment j t
pTrust (CCT)
• Driver of redevelopment j testate companies
• Strong track record in real estate development and services including design
estate companies• Strong track record in real estate development and services including design
• Proven record in property development, architecture research and design
• Subsidiary of Mitsubishi
• Proven record in property development, architecture research and design
• Subsidiary of Mitsubishi
project• Premier office landlord with consistently above market occupancy
project• Premier office landlord with consistently above market occupancyse ces c ud g des g
& development, project management, marketing & leasing and property
t
se ces c ud g des g& development, project management, marketing & leasing and property
t
Subs d a y o tsub sEstate Co., Ltd., a leading international property company; substantial
i l tf li i
Subs d a y o tsub sEstate Co., Ltd., a leading international property company; substantial
i l tf li i
a et occupa cy• Extensive REIT management expertise
• Proven track record in t d it l
a et occupa cy• Extensive REIT management expertise
• Proven track record in t d it lmanagement
• Strong balance sheet• Sponsor of CCT (owns 31.9%)
management• Strong balance sheet• Sponsor of CCT (owns 31.9%)
commercial portfolio in Japan, including over 30 buildings (net area of 17 million sq ft) in Tokyo’s
commercial portfolio in Japan, including over 30 buildings (net area of 17 million sq ft) in Tokyo’s
asset and capital management
• Owner of over 3 million sq ft of commercial space in
asset and capital management
• Owner of over 3 million sq ft of commercial space in )) q ) y
Marunouchi area.q ) y
Marunouchi area.p
Singapore’s Central Areap
Singapore’s Central Area
28

Joint venture structure
CLCL50%50%CLCL50%50%
MEAMEA10%10%MEAMEA10%10%
CCTCCT40%40%CCTCCT40%40%
Property Management
CapitaLand Commercial
MSO MSO TrustTrust
The Property Manager
The Property Manager
Management Services
as Trustee & Manager
The Trustee-Manager
(CCT Manager
The Trustee-Manager
(CCT ManagerTrustTrustPreserves Preserves
tax privileges tax privileges Project
Management
(CCT Manager and CapitaLand
Commercial)
(CCT Manager and CapitaLand
Commercial)
for CCTfor CCTThe Project Manager
The Project Manager
gServices Management
committee to manage day-to-day matters of
MSO Trust
MSCPMSCP 100%
MSO Trust
29

Role of Management Committee
• 5 members: 3 nominated by CCL and 2 nominated by CCT Trustee
• Acts on behalf of MSO Trustee-Manager to manage g gdaily operation matters of MSO Trust
• Performs all of MSO Trustee-Manager’s obligationsg g
30
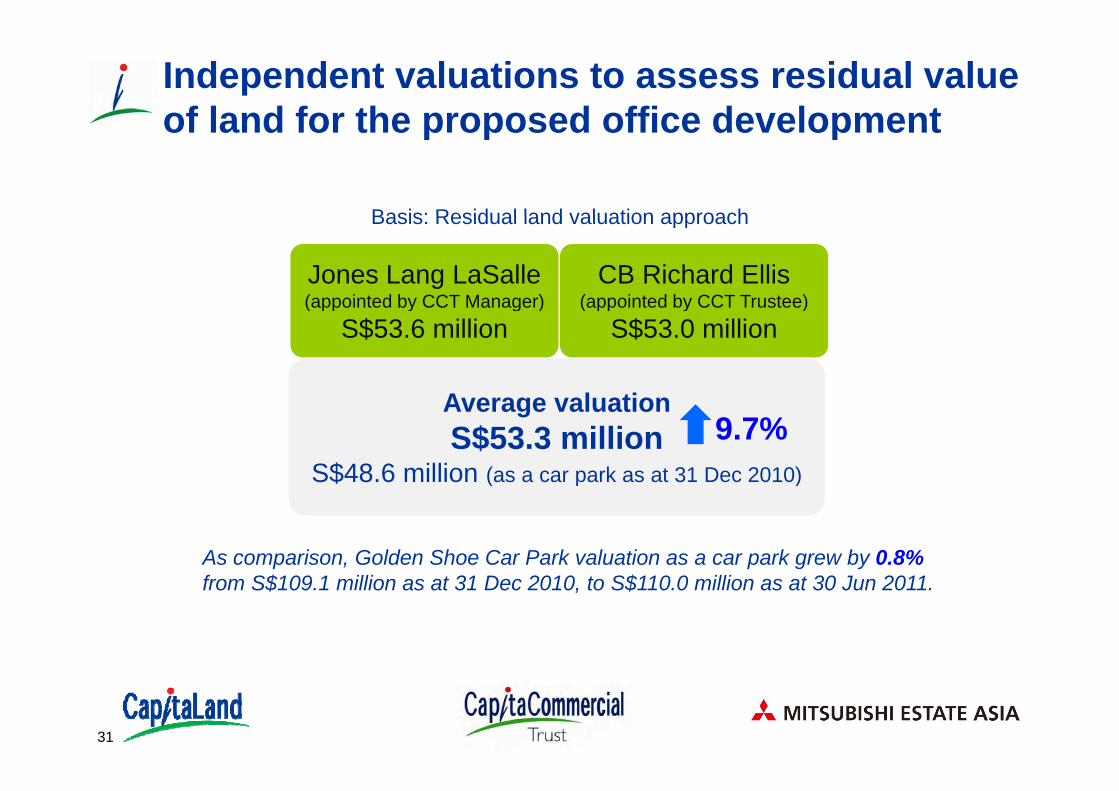
Independent valuations to assess residual value of land for the proposed office developmentof land for the proposed office development
Basis: Residual land valuation approachBasis: Residual land valuation approach
Jones Lang LaSalle(appointed by CCT Manager)
CB Richard Ellis(appointed by CCT Trustee)(appointed by CCT Manager)
S$53.6 million(appointed by CCT Trustee)
S$53.0 million
A l tiAverage valuation S$53.3 million
S$48.6 million (as a car park as at 31 Dec 2010)
9.7%( p )
As comparison, Golden Shoe Car Park valuation as a car park grew by 0.8%f S$109 1 illi 31 D 2010 S$110 0 illi 30 J 2011from S$109.1 million as at 31 Dec 2010, to S$110.0 million as at 30 Jun 2011.
31

Sale to MSO Trust at S$56m with call option to buy completed asset within 3 years after TOPbuy completed asset within 3 years after TOP
C ll ti3Sale price of S$56 illi *
1 Call option (CCT’s right
to buy) at market
3
MSO Trust
million* market valuation** after TOP
22 TOP in 2014*15.2% above Dec 2010 valuation as a car park
** Price must give at least a compounded return of 6 3% percompounded return of 6.3% per annum (CapitaLand’s estimated cost of capital) to the sellers before the call option can be exercised.
32

JV pays for 100% enhancement in land value which makes up bulk of land-related costsp
9%Others (costs borne by CCT and recoverable from MSO Trust, tenant compensation, marketing, financing and contingency)
S$122m
39%Construction &
S$122m
Differential premium
Professional fees S$550m
Total project p
and other land related costsS$672m
p jcost
S$1.4b
Valuation
48%Premium S$2.7m
Total land costS$728m
Valuation as car parkS$48.6m
4%
Valuation with
redevelopment S$53.3m
33

Funding
MSO TrustMSO TrustS$1.4 billionS$1.4 billion
Expected loan to value: Expected loan to value: 40% to 60%40% to 60%
CCT CCT 40%40%CCT CCT 40%40% MEA 10%MEA 10%MEA 10%MEA 10%CL CL 50%50%CL CL 50%50%Equity: Equity:
S$224m to S$340mS$224m to S$340mEquity: Equity:
S$224m to S$340mS$224m to S$340mEquity: Equity:
S$56m to S$85mS$56m to S$85mEquity: Equity:
S$56m to S$85mS$56m to S$85mEquity: Equity:
S$280m to S$425m S$280m to S$425m Equity: Equity:
S$280m to S$425m S$280m to S$425m
34

Project milestones
Jan 2008Outline planning permission given to enhance land use
2nd half 2014Complete redevelopment
Decommissioning given to enhance land use
From Jul 2011
Jan 2009Aborted plan during Global Financial Crisis
and demolition
14 Jul 2011
From Jul 2011Commence
redevelopment
30 Jun 2011Closure of car park
Announced joint ventureAssistance given to tenants and season car parkers
19 Apr 2011Announced redevelopment
31 Jan 2011
Outstanding issues- No. of car park lots provision- Link to MRT station
Confirmed obtaining of provisional permission for
redevelopment
35

4 Asset Enhancement Update4. Asset Enhancement Update
CapitaCommercial Trust Presentation *July 2011*36

Six Battery Road: Strong pre-commitment for upgraded space available in 2011upgraded space available in 2011
Upgraded space targeted Pre-commitment for
upgraded space in 2011gfor handover in 2011 upgraded space in 2011
Q2 2011 93,700 sq ft 74,400 sq ft 79%Q1 2011 76 100 sq ft 48 800 sq ft 64%Q1 2011 76,100 sq ft 48,800 sq ft 64%
37 CapitaCommercial Trust Presentation *July 2011*

Completed works in 2Q 2011Refreshed Washrooms feature:
i li htienergy-saving lightings water-efficient water fittings green-label toilet door laminates quality finishes
before after
Revitalized Main Lift Lobby:
stylish interior design unique architectural lighting design premium floor finishes premium floor finishes designer walls feature mirror finish with specially designed back-lit motifs
before after
38 CapitaCommercial Trust Presentation *July 2011*

First chiller replacementThe challenging task of chiller replacement was successfully carried
out in a carefully planned and coordinated overnight operation
before after
39 CapitaCommercial Trust Presentation *July 2011*

5 Stable Portfolio5. Stable Portfolio
CapitaCommercial Trust Presentation *July 2011*40

CCT’s Grade A offices and portfolio near 100% occupancy
CCT Committed Occupancy Level Industry Statistics Occupancy Level
Grade A Office 2Q2011 97.2% 1Q2011 98.1% 2Q2011 94.0% 1Q2011 95.2%
CCT's Committed Occupancy Since Inception
Office
Portfolio 2Q2011 97.7% 1Q2011 98.2% 2Q2011 94.6% 1Q2011 94.4%
99.1% 99.6% 99.6% 99.3%97.7%
100%
CCT s Committed Occupancy Since Inception
95.2% 96.2%94.8%
89 7%
92.7%91.2%90%
84.0%
87.2%
89.7%
87.9% 87.90%87.5%
80%2Q 3Q 4Q 1Q 2Q 3Q 4Q 1Q 2Q 3Q 4Q 1Q 2Q 3Q 4Q 1Q 2Q 3Q 4Q 1Q 2Q 3Q 4Q 1Q 2Q 3Q 4Q 1Q 2Q
2004 2005 2006 2007 2008 2009 2010 2011
CCT URA
41 CapitaCommercial Trust Presentation *July 2011*

Top ten blue-chip tenants(1) contribute about 44% of monthly gross rental income
Weighted Average Lease Term to Expiry (by floor area) for Top 10 Tenants as at 30 Jun 2011 = 4.7 years
14.0%14.0%
5.0%4.6%
4.2%3.7%
3.0% 2.7% 2.5% 2.3% 2.1%
RC Hotels (Pte) Ltd
Government of Singapore Investment
JPMorgan Chase Bank,
N.A.
Standard Chartered Bank
Nomura Singapore
Limited
The Hongkong and Shanghai
Banking
BHP Billiton Marketing Asia
Pte Ltd
Lloyd's of London (Asia)
Pte Ltd
Robinson & Company
(Singapore)
Cisco Systems (USA) Pte. Ltd.
(2)
Notes:(1) Based on gross rental income for Jun 2011 (excluding retail turnover rent).
Corporation Private Limited
gCorporation
Limited
( g p )Private Limited
42
(2) BHP Billiton Marketing Asia Pte Ltd lease expired on 30 Jun 2011. The space has been committed to JPMorgan Chase Bank, N.A. and Mizuho Corporate Bank, Ltd.
CapitaCommercial Trust Presentation *July 2011*

Well spread portfolio lease expiry profile
Lease expiry profile as a percentage of monthly gross
20.9%
Lease expiry profile as a percentage of monthly gross rental income(1) for June 2011
12.6%
18.9%20.9%
12 1%
7.5%
7.8%5.9%
8.8%
5.6%
10.5%12.1%
0.9% 0.6%
2011 2012 2013 2014 2015 and beyond
3.4%
Office Retail Hotels and Convention Centre
Note:(1) Excludes turnover rent
Committed
43
( )
CapitaCommercial Trust Presentation *July 2011*

Balance between extending office lease expiries and opportunity to capture market recoverypp y p y
Office lease expiry profile as a percentage of monthly office gross rental income for Jun 2011
28 0%30.8%
18.6%
28.0%
17.8%
11.0%
11.5%
Office Committed
2011 2012 2013 2014 2015 & Beyond
Average office portfolio rent as at 30 Jun 2011 is $7.84 psf
44 CapitaCommercial Trust Presentation *July 2011*

Undertaken measures to partially mitigate risk
2011
2Q 2011 Industry Statistics (1) –Grade A Office Average Market Rent: S$10.60 psfPrime Office Average Market Rent: S$ 8.80 psf
$15.43 $16
$2060%2011
Average rent of remaining leases expiring is $13.91 psf (2)
$
$13.06 $12
40%
5 5% 5 1%
Yield protection in place
$4
$820%
Assetenhancement
works
Completed5.5% 5.1% Completed
$00%Capital Tower Six Battery Road One George Street Raffles City Tower(3)
Monthly gross rental income for leases expiring at respective properties X 100%Monthly gross rental income for office portfolio
Ave Monthly Gross Rental Rate for Expiring Leases (S$ psf/month)
Notes:(1) Source: CBRE (as at 2Q 2011)(2) 3 Grade A buildings and Raffles City Tower only
45
(2) 3 Grade A buildings and Raffles City Tower only(3) Has embedded yield protection of 4.25% p.a., based on purchase consideration of S$1.165 billion until 10 July 2013 from CapitaLand. This eliminates
downside rental risk for One George Street during the yield protection period, but allows CCT to benefit from any upside in rental reversion..
CapitaCommercial Trust Presentation *July 2011*

Positioning leasing strategy to benefit from office market recovery upon lease expiriesy p p
20132012
$12
$16
$20
40%
60%2013
Average rent of remaining leases expiring is $7.91 psf
$12 00 $12
$16
$20
40%
60%2012
Average rent of remaining leases expiring is $9.88 psf (1) (1)
12.7%7.3%
$7.70 $8.53 $7.87 $8.56
$4
$8
$12
20%
4 6% 6 0% 4 9%
$12.00 $11.06 $11.84
$7.28
$4
$8
$12
20%
2.9% 2.3%$00%
Capital Tower Six Battery Road
One George Street
Raffles City Tower
1.6%4.6% 6.0% 4.9%
$00%Capital Tower Six Battery
RoadOne George
StreetRaffles City
Tower(2) (2)
Monthly gross rental income for leases expiring at respective properties X 100%Monthly gross rental income for office portfolio
Ave Monthly Gross Rental Rate for Expiring Leases (S$ psf/month)
Notes:(1) 3 Grade A buildings and Raffles City Tower only(2) Has embedded yield protection of 4.25% p.a., based on purchase consideration of S$1.165 billion until 10 July 2013 from CapitaLand. This eliminates
downside rental risk for One George Street during the yield protection period but allows CCT to benefit from any upside in rental reversion
Monthly gross rental income for office portfolio
46
downside rental risk for One George Street during the yield protection period, but allows CCT to benefit from any upside in rental reversion.
CapitaCommercial Trust Presentation *July 2011*

Awards and recognition that demonstrate our commitment to environmental sustainabilitycommitment to environmental sustainability
One George Street attained Green Mark Goldplus award by the Building and
Construction Authority
Raffles City Singapore achieved Green Mark Gold award by the
Building and Construction Authority
47 CapitaCommercial Trust Presentation *July 2011*

Enhancing relationships: Delighting tenants via Ice Cream Day
6 Market Outlook6. Market Outlook
CapitaCommercial Trust Presentation *July 2011*49

3 mil sq ft supply from 2H 2011 to 2012 about 60% pre-leasedNo new office supply in 2014 except for Market Street
Avg annual supply = 2.4 mil sq ft
pp y p
Singapore Private Office Space (Central Area) – Demand & Supply
3.23
4
g pp y qAvg annual demand during prev growth phase (’93-97) = 2.1 mil sq ft
Post-Asian financial crisis, SARs & GFC -weak demand & undersupply
Remaking of Singapore as a global city
1.61.3
0.8 0.7 0.50.8 0.91
2
2
-1
0
Avg annual supply =1.8 mil sq ftAvg annual demand = 1.6 mil sq ft Supply Forecast
-2
1993
1994
1995
1996
1997
1998
1999
2000
2001
2002
2003
2004
2005
2006
2007
2008
2009
2010
1H 1
1
2H11
F
2012
F
2013
F
2014
F
2015
F
> 20
16F
Supply Demand Forecast Supply Committed Spacepp y p
Notes: (1) Central Area comprises ‘The Downtown Core’, ‘Orchard’ and ‘Rest of Central Area’(2) Supply is calculated as net change of stock over the quarter and may include office stock removed from market due to conversions or demolitions(3) Minimum office requirement for Marina South project is 2.2 mil sq. ft with estimated TOP in 2016
CapitaCommercial Trust Presentation *July 2011*
Source: Consensus Compiled from CBRE , Morgan Stanley (May 2011), JP Morgan (Jun 2011), OCBC (Jun 2011)(4) Ophir-Rochor Site with minimum office requirement of 690,000 sq.ft. has not been included as project details have not yet been released.
50

Lack of new office supply in 2014 expected to spur rental growthspur rental growth
Peak LowestGrade A 3Q08: S$18 80 3Q03: S$4 48
S$18.80New peaks
Grade A 3Q08: S$18.80 3Q03: S$4.48
Prime 3Q08: S$16.10 1Q04: S$4.00S$16.10
S$10 60S$10.60
S$8.00
S$4.48S$8.80
S$7.50
S$6.70
Higher troughs
S$4.00Global
financial crisisPost-SARs , Dot.com crash
S$6.70
*No historical data for Grade A rents prior to 2002. Source of rental data: CB Richard Ellis (Pte) Ltd (figures as at end of each quarter)
51 CapitaCommercial Trust Presentation *July 2011*

7 Summary7. Summary
CapitaCommercial Trust Presentation *July 2011*52
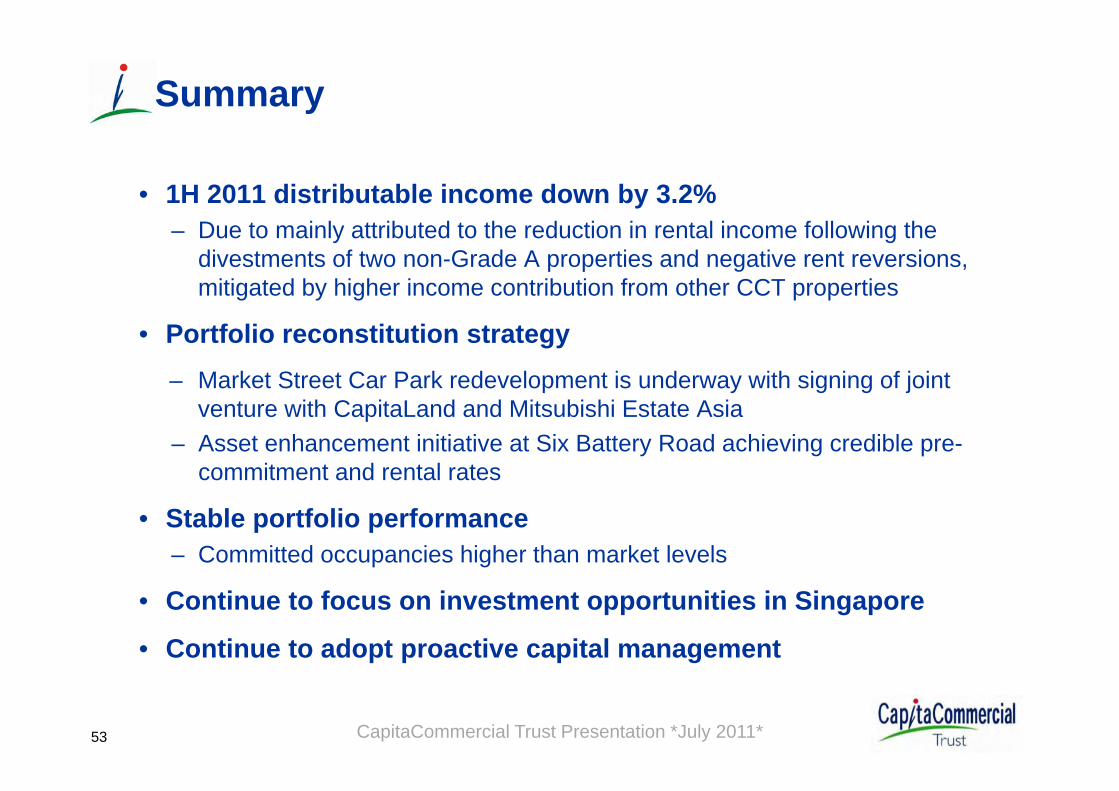
Summary
• 1H 2011 distributable income down by 3.2%– Due to mainly attributed to the reduction in rental income following the
divestments of two non-Grade A properties and negative rent reversions, mitigated by higher income contribution from other CCT properties
• Portfolio reconstitution strategy– Market Street Car Park redevelopment is underway with signing of joint
venture with CapitaLand and Mitsubishi Estate Asia– Asset enhancement initiative at Six Battery Road achieving credible pre-
commitment and rental rates
• Stable portfolio performance– Committed occupancies higher than market levels
• Continue to focus on investment opportunities in Singapore
• Continue to adopt proactive capital management
CapitaCommercial Trust Presentation *July 2011*53

8 Raffles City 1H 2011 Information8. Raffles City 1H 2011 Information
CapitaCommercial Trust Presentation *July 2011*54

Performance of RCS Trust – 1H 2011
CCT's 60% Interest RCS Trust 100%
1H 11 S$'000
1H 10 S$'000 S$'000 Variance
%1H 11 S$'000
Gross Revenue 64,415 60,491 3,924 6.5 107,359
- Office 10,520 11,713 (1,193)(1) (10.2) 17,534( , )- Retail 27,897 24,755 3,142 12.7 46,495
- Hotel 23,872 21,812 2,060 9.4 39,787
- Others 2,126 2,211 (85)(2) (3.8) 3,543
Net Property Income 47,281 43,683 3,598 8.2 78,802(1) The decline in office revenue was due to lower renewed or signed rents as compared to expiring rents(2) The decline in other revenue was due to lower tenants’ recovery in 1H 2011
Raffles City Singapore Presentation *October 2010*55 Raffles City Singapore Presentation *July 2011*
( ) y

RCS Trust – Financial Ratios
As at 30 June
2011
2Q 2011
Net Debt / Total Assets 34.3%
2Q 2011
Net Operating Profit / Secured Notes Debt
Service3.5 x
Service
Net Operating Profit / Total Debt Service 3.4 x
Raffles City Singapore Presentation *October 2010*56 Raffles City Singapore Presentation *July 2011*

Raffles City Singapore – SummaryKey Details (As at 30 June 2011)Gross Floor Area 320,490 sq m (or 3,449,727 sq ft)
Net Lettable AreaOffice: 35,333 sq m (or 380,320 sq ft)Retail: 39 094 sq m (or 420 810 sq ft)Net Lettable Area Retail: 39,094 sq m (or 420,810 sq ft)Total : 74,427 sq m (or 801,130 sq ft)
Number of Tenants
Office: 53Retail: 218Hotels & Convention Centre: 1Hotels & Convention Centre: 1Total: 272
Number of Hotel Rooms 2,030
Carpark Lots 1,043
Title Leasehold tenure of 99 years expiring 15 July 2078
Valuation (as at 30 June 2011) S$2,734.0 million by CB Richard Ellis (Pte) Ltd and Jones Lang LaSalle Hotels(1)
Office: 97 7%Committed Occupancy
Office: 97.7%Retail: 100.0%Total: 98.9%
A dGreen Mark (Gold) Award 2010 by Building and Construction Authority
Awards National Safety & Security Award 2010 - Marina SSWG (Safety & Security Watch Group) by Singapore Police Force- Individual Category
(1) CB Richard Ellis (Pte) Ltd was engaged to conduct the valuation of the retail and office components and Jones Lang LaSalle Hotels was engaged to conduct the valuation of the hotel component
Raffles City Singapore Presentation *October 2010*57
was engaged to conduct the valuation of the hotel component
Raffles City Singapore Presentation *July 2011*

Lease Expiry Profile – Raffles City Tower (Office)(Office)
Leases up for Renewal as a % of Gross Rental Income as at 30 June 2011
50.1%
23.6%
Completed
14.0% 12.3%
2011 2012 2013 2014 2015 & Beyond
Weighted Average Expiry by Gross Rental Income 2.02 Years
Raffles City Singapore Presentation *October 2010*58 Raffles City Singapore Presentation *July 2011*

Lease Expiry Profile – Raffles City Shopping CentreCentre
Leases up for Renewal as a % of Gross Rental Income as at 30 June 2011
44.5%
22.3%29.3%
3.9%0.0%
2011 2012 2013 2014 2015 and beyond
Weighted Average Expiry by Gross Rental Income 2.03 Years
Raffles City Singapore Presentation *October 2010*59 Raffles City Singapore Presentation *July 2011*

Top 10 Tenants(1) – Raffles City Tower (Office)
Tenant % of Gross Rental Income
Economic Development Board 27.1%Accenture Pte Ltd 12.3%Philip Securities Pte Ltd 11.4%Total Trading Asia Pte. Ltd. 3.3%AAPC Hotels Management Pte. Ltd. 3.2%R ffl I t ti l Li it d 3 2%Raffles International Limited 3.2%Delegation of the European Union to Singapore 2.7%Petrol-Diamond Singapore (Pte) Ltd 2.4%N d A t M t A i Pt Ltd 2 3%Noonday Asset Management Asia Pte. Ltd. 2.3%OSIsoft Asia Pte Ltd 2.3%Top 10 Tenants 70.2%Other Tenants 29 8%
(1) Based on committed gross rental income as at 30 June 2011
Other Tenants 29.8%TOTAL 100.0%
Raffles City Singapore Presentation *October 2010*60 Raffles City Singapore Presentation *July 2011*

Top 10 Tenants(1) – Raffles City Shopping CentreCentre
Tenant % of Gross Rental Income
Robinson & Co (Singapore) Pte Ltd 13 7%Robinson & Co (Singapore) Pte Ltd 13.7%
Wing Tai Clothing Pte Ltd 4.1%
TES 07 Pte Ltd 3.3%
Jay Gee Enterprises Pte Ltd 3.1%
Cold Storage Singapore (1983) Pte Ltd 2.6%
Esprit Retail Pte Ltd 2.4%
Food Junction Management Pte Ltd 2.4%
Cortina Watch Pte Ltd 2.1%
DBS Bank Ltd. 1.8%
Hinckley Singapore Trading Pte. Ltd. 1.7%
Top 10 Tenants 37.2%Other Tenants 62 8%Other Tenants 62.8%
TOTAL 100.0%
(1) Based on committed gross rental income as at 30 June 2011
Raffles City Singapore Presentation *October 2010*61 Raffles City Singapore Presentation *July 2011*

Trade Mix – Raffles City Tower (Office)Tenant Business Sector Analysis by Gross Rental Income as at 30 June 2011
Real Estate & Services 0 7%
Energy, Business C &
Others, 5.4%
Real Estate & Property Services,
3.4%
Services, 0.7%
Consultancy, IT & Telecommunications,
34.8%
Banking, Insurance & Financial Services,
25 1%25.1%
Government & Government Linked
Office, 30.6%
Raffles City Singapore Presentation *October 2010*62 Raffles City Singapore Presentation *July 2011*

Trade Mix – Raffles City Shopping Centre
Supermarket, 2.4%Others, 3.0%
(1)
Tenant Business Sector Analysis by Gross Rental Income as at 30 June 2011
Food & Beverage, 28.7%Beauty & Health Related, 7 8%
Sundry & Services, 4.5%
Gifts & Souvenirs, 2.1%
Jewellery/Watches/Pen, 5 2%
7.8%
5.2%
Fashion, 23.9%Shoes & Bags, 9.1%
Department Store, 13.3%
(1) Oth i l d B k & St ti El t i l & El t i H & F i hi A t G ll M i & Vid
Raffles City Singapore Presentation *October 2010*63
(1) Others include Books & Stationery, Electrical & Electronics, Houseware & Furnishings, Art Gallery, Music & Video, Toys & Hobbies and Information Technology
Raffles City Singapore Presentation *July 2011*

Supplementary SlidesSupplementary Slides
CapitaCommercial Trust Presentation *July 2011*64

Singapore’s First Listed Commercial REIT
Listing May 2004 on Singapore Exchange Securities Trading Limited
Portfolio Nine quality commercial assets in the Central Area of SingaporePortfolio - Singapore
Nine quality commercial assets in the Central Area of Singapore
Three Grade A offices and one prime office, three mixed-use properties, and two multi-storey car parks in CBD
Total Net Lettable Area
Total number of Tenants
About 3 million sq ft
More than 400 (office and retail)
Investments 30% stake in Quill Capita Trust who owns ten commercial properties in Kuala Lumpur, Cyberjaya and Penang
7.4% stake in Malaysia Commercial Development Fund Pte. Ltd.- Malaysia
(less than 5% of total assets) y p(less than 5% of total assets)
Total assets S$6.2 billion (US$5.1 billion)(as at 30 June 2011)
Market cap S$3.3billion (US$2.7 billion)Based on CCT’s closing price of S$1.17 on 29 August 2011 and total units on issue 2,829,871,567
CapitaCommercial Trust Presentation *July 2011*65

Gross rental income(1) predominantly contributed by Grade A officescontributed by Grade A offices
CCT’s income contribution by sector for 1H 2011CCT s income contribution by sector for 1H 2011
Office, 65%
Hotels & Convention Centre, 15%
Retail, 20%
66
Note:(1) Excludes retail turnover rent
CapitaCommercial Trust Presentation *July 2011*

Portfolio diversification with focus on quality (1)
More than 80% of Net Property Income from Grade A offices and Raffles City(2)
Raffles City (60%),
Bugis Village, 3%
Golden Shoe Car Park, 3%
Wilkie Edge, 3% Market Street Car Park, 1%
Raffles City (60%), 34%HSBC Building,
3%
Capital Tower, 17%
Six Battery
Notes:
Six Battery Road, 18%One George
Street, 18%
67
(1) For the period from 1 Jan 2011 to 30 Jun 2011(2) Represents CCT’s interest of 60% in Raffles City
CapitaCommercial Trust Presentation *July 2011*

Diverse tenant mix in CCT’s portfolio(1)
Car Park, 3%
Real Estate & Property Services, 2% Department Store, 2% Education, 1%
Banking, Insurance & Financial Services, 34%
Legal, 4%
Retail Services, 3%
Food & Beverage 7%
Others, 6%(2)
Fashion, 7%
Food & Beverage, 7%
Energy, Business Consultancy, IT &
Telecommunications, 11%
Government & Government Linked
Off %
Notes:(1) Based on portfolio gross rental income for Jun 2011 including car park income from Golden Shoe Car Park and Market Street Car Park
Hospitality, 13%11%Office, 7%
68
(1) Based on portfolio gross rental income for Jun 2011 including car park income from Golden Shoe Car Park and Market Street Car Park(2) Consists of other minor retail and office trades.
CapitaCommercial Trust Presentation *July 2011*
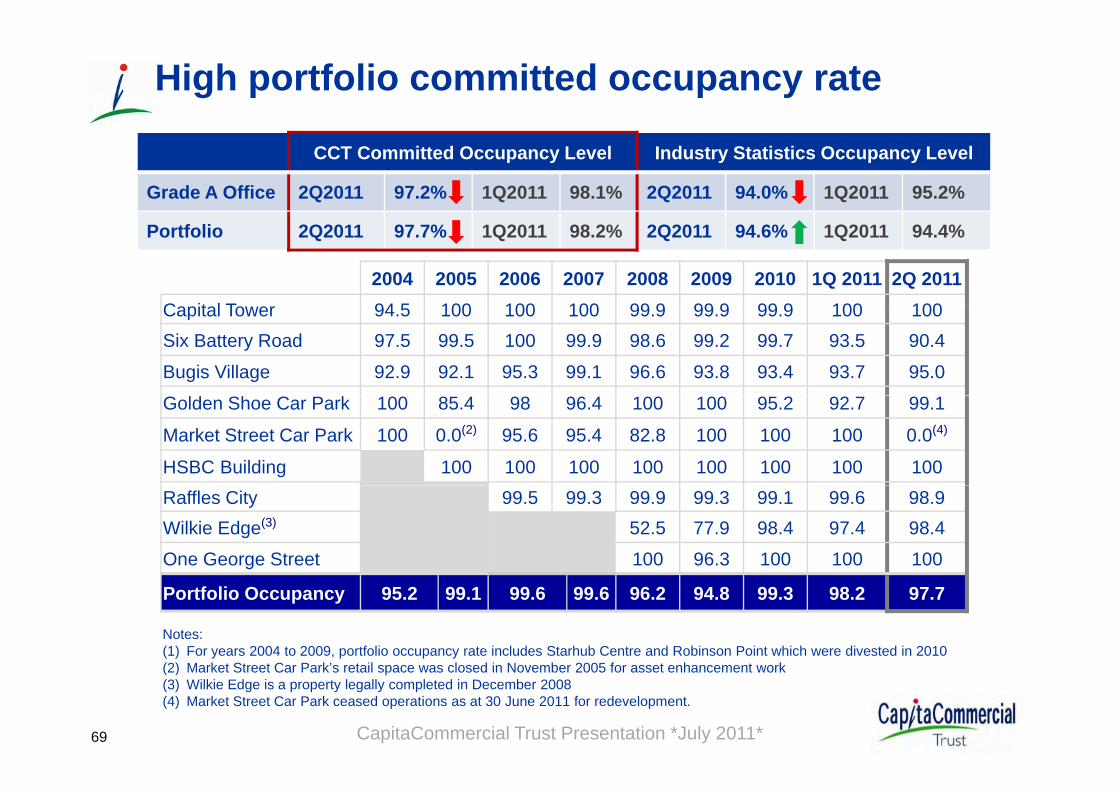
High portfolio committed occupancy rate
CCT Committed Occupancy Level Industry Statistics Occupancy Level
Grade A Office 2Q2011 97.2% 1Q2011 98.1% 2Q2011 94.0% 1Q2011 95.2%
2004 2005 2006 2007 2008 2009 2010 1Q 2011 2Q 2011C it l T 94 5 100 100 100 99 9 99 9 99 9 100 100
Portfolio 2Q2011 97.7% 1Q2011 98.2% 2Q2011 94.6% 1Q2011 94.4%
Capital Tower 94.5 100 100 100 99.9 99.9 99.9 100 100Six Battery Road 97.5 99.5 100 99.9 98.6 99.2 99.7 93.5 90.4
Bugis Village 92.9 92.1 95.3 99.1 96.6 93.8 93.4 93.7 95.0
Golden Shoe Car Park 100 85.4 98 96.4 100 100 95.2 92.7 99.1
Market Street Car Park 100 0.0(2) 95.6 95.4 82.8 100 100 100 0.0(4)
HSBC Building 100 100 100 100 100 100 100 100Raffles City 99.5 99.3 99.9 99.3 99.1 99.6 98.9Wilkie Edge(3) 52.5 77.9 98.4 97.4 98.4
One George Street 100 96.3 100 100 100
Notes: (1) For years 2004 to 2009, portfolio occupancy rate includes Starhub Centre and Robinson Point which were divested in 2010(2) M k t St t C P k’ t il l d i N b 2005 f t h t k
Portfolio Occupancy 95.2 99.1 99.6 99.6 96.2 94.8 99.3 98.2 97.7
CapitaCommercial Trust Presentation *July 2011*69
(2) Market Street Car Park’s retail space was closed in November 2005 for asset enhancement work(3) Wilkie Edge is a property legally completed in December 2008(4) Market Street Car Park ceased operations as at 30 June 2011 for redevelopment.

Property details (1)
Capital Tower Six Battery Road One George Street Raffles City
Address 168 Robinson Rd 6 Battery Rd 1 George Street 250/252 North Bridge Rd; 2 St f d Rd 80 B B h RdAddress 168 Robinson Rd 6 Battery Rd 1 George Street Stamford Rd; 80 Bras Basah Rd
NLA (sqm) 68,836 46,339 41,620 74,376(Office: 35,334, Retail: 39,042)
Leasehold expiring 31-Dec-2094 19-Apr-2825 21-Jan-2102 15-Jul-2078
Committed occupancy 100% 90.4% 100% 98.9%
Valuation (30 Jun 2011) $1,175.0m $1,150.0m $922.6m $2,734.0m (100%)
$1,640.4m (60%)
Car park lots 415 190 175 1,043
CapitaCommercial Trust Presentation *July 2011*70

Property details (2)
HSBC Building Wilkie Edge Bugis Village (1) Golden Shoe
Car ParkMarket Street
Car Park
Address 21 CollyerQuay 8 Wilkie Road
62 to 67 Queen St, 151 to 166 Rochor
Rd, 229 to 253 (odd nos only) Victoria St
50 Market Street 146 Market Street
NLA (sqm) 18,624 13,576 11,375 4,117 2,360
Leasehold expiring 18-Dec-2849 20-Feb-2105 30-Mar-2088 31-Jan-2081 31-Mar-2073
Committed occupancy 100% 98.4% 95.0% 99.1% 0%(2)
Valuation (30 Jun 2011) $370.5m $151.1m $60.6m $110.0m $53.3m(3)( )
Car park lots NA 215 NA 1,053 704
Note:(1) The leasehold title and the valuation take into account the right of the President of the Republic of Singapore, as lessor under the State Lease, to
terminate the State Lease on 1 April 2019 upon payment of S$6 610 208 53 plus accrued interest
CapitaCommercial Trust Presentation *July 2011*71
terminate the State Lease on 1 April 2019 upon payment of S$6,610,208.53 plus accrued interest.(2) Market Street Car Park officially ceased operations on 30 June 2011 for the redevelopment project. (3) Average valuation of the property with the redevelopment potential less the differential premium to be paid for the change
of land use.

Known Future Office Supply in Central Area (2011-2016)(1 of 2)( )
Exp. DOC
Proposed Office Projects Micromarket NFA (sf) Pre-commitmentas at 2Q11
3Q11 Asia Square Tower 1 (Marina View Tower 1 (only L6 –L43 Office)
Marina Bay 1,260,000 62%
4Q11 1 Raffles Place (Tower 2) Raffles Place 350,000 9%
Subtotal (2011): 1,610,000 50%
2012 Marina Bay Financial Centre (MBFC – Phase 2) Marina Bay 1,300,000 66%
S bt t l (2012) 1 300 000 66%Subtotal (2012): 1,300,000 66%
2013 Asia Square Tower 2 Marina Bay 782,000 N.A.
Subtotal (2013): 782,000 N.A.( ) ,
2014 Market Street Carpark (redevelopment) Raffles Place 720,000 N.A.
Subtotal (2014): 720,000 N.A.
Note: Ophir-Rochor Site with minimum office requirement of 690,000 sq.ft. has not been included as project details have not yet been released.
Source: Consensus Compiled from CBRE , Morgan Stanley (May 2011), JP Morgan (Jun 2011), OCBC (Jun 2011)
72 CapitaCommercial Trust Presentation *July 2011*

Known Future Office Supply in Central Area (2011-2016)(2 of 2)( )
Exp. Proposed Office Projects Micromarket NFA (sf)DOC
2015 South Beach Project Beach Rd/City Hall 506,000
Subtotal (2015): 506,000( ) ,
2016 Peck Seah / Choon Guan Street Tanjong Pagar 1,000,000
2016 Marina South Site (min office requirement) Marina Bay 2,202,000
Subtotal (2016): 3,202,000
TOTAL FORECAST SUPPLY (2011 – 2013) 8,100,000
Note: Ophir-Rochor Site with minimum office requirement of 690,000 sq.ft. has not been included as project details have not yet been released.Source: Consensus Compiled from CBRE , Morgan Stanley (May 2011), JP Morgan (Jun 2011), OCBC (Jun 2011)
73 CapitaCommercial Trust Presentation *July 2011*

C it C i l T t M t Li it dCapitaCommercial Trust Management Limited39 Robinson Road
#18-01 Robinson PointSingapore 068911Singapore 068911Tel: (65) 6536 1188 Fax: (65) 6533 6133
http://www cct com sghttp://www.cct.com.sg
For enquiries, please contact: Ms Ho Mei PengMs Ho Mei Peng
Head, Investor Relations & CommunicationsDirect: (65) 6826 5586
Email: [email protected]
CapitaCommercial Trust Presentation *July 2011*74
a o e pe g@cap ta a d co