CCSP- 1 /VA
55
CRUISE REPORT NO. 8 2 of PE/VA.6/T-1 to 4 17 October 1983 BASELINE STUDIES OF PORT VILA AND ERAKOR LAGOONS, VANUATU Cruise VA-83-1 7 July to 3 August 1983 by Ralf Carter Prepared for: COMMITTEE FOR CO-ORDINATION OF JOINT PROSPECTING FOR MINERAL RESOURCES IN SOUTH PACIFIC OFFSHORE AREAS (CCOP/SOPAC) WORK PROGRAMME CCSP- 1 /VA.6 As a joint contribution by: 1) South Pacific Regional Environmental Programme (SPREP), South Pacific Commission; 2) UNDP Project RAS/81/102 Investigation of Mineral Potential of the South Pacific.
Transcript of CCSP- 1 /VA

CRUISE REPORT NO. 82
of PE/VA.6/T-1 to 4
17 October 1983
BASELINE STUDIES OF PORT VILA AND ERAKOR LAGOONS,
VANUATU
Cruise VA-83-1
7 July to 3 August 1983
by
Ralf Carter
Prepared for:
COMMITTEE FOR CO-ORDINATION OF
JOINT PROSPECTING FOR MINERAL
RESOURCES IN SOUTH PACIFIC OFFSHORE
AREAS (CCOP/SOPAC) WORK PROGRAMME
CCSP- 1 /VA.6
As a joint contribution by:
1) South Pacific Regional
Environmental Programme
(SPREP), South Pacific Commission;
2) UNDP Project RAS/81/102
Investigation of Mineral Potential
of the South Pacific.

FOREWORD
This report is the first for a continuing series of studies that are being undertaken
jointly by the South Pacific Regional Environment Programme (SPREP) and the Committee
for Coordination of Joint Prospecting for Mineral Resources in South Pacific Offshore Areas
(CCOP/SOPAC).
In nearshore areas where coordinated effort will conserve resources and improve study
efficiency, joint investigations are being conducted. The environmental elements are a part
of the SPREP's Regional Environmental Programme and the baseline engineering elements
are part of the CCOP/SOPAC Programme. The studies are funded by the member country,
SPREP, and CCOP/SOPAC. As evidenced by the following report the integrated effort con-
tributes breadth to the data base.
BASELINE STUDIES OF PORT VILA AND ERAKOR
LAGOONS, VANUATU
7 July to 3 August 1983
Cruise VA-83-1
CRUISE REPORT NO. 82
of PE/VA.6/T-1 to 4.
INTRODUCTION AND BACKGROUND
This cruise was undertaken as a part of the CCOP/SOPAC Work Programme CCSP/
VA.6 (Baseline Studies of Inshore Areas in Vanuatu for Coastal Development Programmes)
in cooperation with the South Pacific Regional Environmental Programme (SPREP) and their
environmental studies of Port Vila area and the assessment of effects of a proposed bridge
from the mainland to Efila Island.
Vanuatu, formerly the New Hebrides, is an archipelago of about 70 islands. The total 2 land area is reported to be 11,880km of which 75 percent comprises the four main islands
of Espiritu Santo, Malekula, Pentecost and Efate. Port Vila, 17' 45'S, 168' 19'E is the admini-
strative capital with a permanent population estimated at 14230 in 1983 and is situated on
Efate. The total population according to the January 1979 census is 112,596. The rate of
growth is 3.2 percent per year.
The islands have a tropical climate with a warm humid period from November to April
and a cooler drier period under the influence of SE trade winds between May and October.
The average maximum and minimum temperatures are 29.2'C and 22.5'C in summer, and
26.6'C and 20'C in winter with extremes of 12.6'C and 33.3'C.
The thirty year mean annual rainfall at Port Vila was 2366mm, with a maximum in
March (381mm) and a minimum in October (94mm), and the rainfall is generally in excess
of the evaporation.
The industry, mainly canning and copra oil production, is found in Vila and Santo.
Agricultural livestock, copra, fisheries, and tourism remain the largest sector of the economy.
Copra is the main export, tourism is second in revenue, and fishing is third.
Tourism started when the two larger hotels opened around 1972. Tourism grew from
10,672 in 1972 t o 30,454 in 1979 and is predicted t o increase to 48,000 by 1985. It grew
by 20 percent annually during both 1981 and 1982. Saturation of 100,000 per year is pre-
dicted by 2005. The average stay is 9.2 days, and an additional 40,000 cruise ship passen-
gers come each year.
......./2

2
A forty unit hotel was begun in mid-1983 and five additional tourist facilities are planned.
They will accommodate some 1,500 tourists daily, or more than double the present capacity
of the two major hotels.
Port Vila has a safe water supply; however, sanitary wastes are disposed of in septic
tanks with sub-surface effluents. Some overloading difficulty is evident and many septic
tanks require regular pumping.
There is little legislation at present on the regulation of effluent and designation of
beneficial uses or water quality standards for the marine receiving waters.
The need for baseline marine data from the rapidly developing Vila Harbour and Erakor
Lagoon areas is now recognized by the Vanuatu Government. Little basin information is at
present available on these bodies of water.
SURVEY OBJECTIVES
The present survey was conducted to develop baseline data of Vila Harbour, Erakor
Lagoon and Talimoru Passage. Priority was given to those parameters that would aid in future
coastal management relevant to proposed developments in the Port Vila area where tourist
and industrial developments are in progress or are being proposed at present. Special atten-
tion was given t o the construction of a bridge across Talimoru Passage to Efila Islands.
Specific objectives included current studies, physical, chemical and biological charac-
teristics, residence periods, fresh water discharges, and other hydrodynamic and bathymetric
characteristics of the receiving waters.
PERSONNEL PARTICIPATING
Ralf Carter, Marine Scientist, from the UNDP staff in Fiji participated in the survey.
He had the support and assistance from the Ministry of Lands and Natural Resources. The
following staff from the Department of Geology, Mines and Rural Water Supply in the above
Ministry aided in the study:
Mr A Macfarlane, Director and Designated national member
Mr R J Marks, Applied Geologist
Mr R Pregear, Engineer
....../3
3
Mr W Harrison, Senior Geological Assistant
Mr A Tari, Geological Assistant
Mr J Balango, Geological Assistant
Mr D Sogari, Geological Technician
Mr C Edgell, Technical Assistant
Mr K Kiri, Technical Assistant
Others aiding in the study included Mr Luke Beandi and John Mahlon, crew of the
LOEPI from the Marine Department. Numerous individuals were contacted for information
and discussion during the study. They included:
Hon. Seltry Regenvano, Minister of Lands and Natural Resources
Mr. Martin Tamata, Secretary, Ministry of Lands and Natural Resources
Mr A J Lee, Principal Engineer, Public Works
Mr M Quaile, Principal Architect, Public Works
Mr A Garae, Deputy Director, National Planning and Statistics Office
Mr B Bell, Senior Planning Officer, National Planning and Statistics Office
Mr W Purser, Director of Tourism
Mr M Kalotiti, Health Inspector, Vila
Mr P Emery, Meteorologist
Mr C J O'Brien, Managing Director, Clarriers General Repairs Limited
Ms M Smith, Diver, Nautilus Dive Shop
Mr K Katerekia, Resident, Efila Island
Mr R Prown, Operator Hospital Treatment Plant
Mr B Schuler, Owner, resort on Emten lagoon
EQUIPMENT, FACILITIES, AND METHODS
One control station and seven monitoring stations were located at Vila Harbour, and
one control station and ten monitoring stations were located for Erakor Lagoon as indicated
in Figure 1. Several sub-stations were used to utilize existing structures for special needs.
Where adequate depth was available, three depths of water were sampled: top, mid-depth,
and bottom.
The water currents, speed, direction and depth were measured using a NBA current
meter. The meter contained a conductivity sensor. Temperature, BOD, DO and Phosphate
were determined from a grab sample. A standard 300ml BOD bottle was employed for DO
and BOD. The dissolved oxygen was titrated using the standard modified Azide-Winkler
......../4
4
method. The ascorbid acid method was employed for reactive phosphates. Transparency
was determined using a 23cm secchi disk. A 12cm diam. opening, 80 micron mesh Wisconsin
style plankton net was employed in vertical haul to sample plankton, and an eight 25mm
by 75mm glass microscope slide periphyton sampler was used to measure the five day growth
of Periphyton in the water (23 percent were lost during the growth period).
The currents in and out of the lagoons was measured. The maximum current at the
center surface in the channel was assumed to be two times section average, and the cross
section area of the channels were measured using a fathometer. The currents at Vila Harbour
entrance were measured using the NBA current meter at these depths and a 4 meter long,
25mm diameter spar that was weighted to float vertical with 3.7 meters draft. The spar's
course over a 6 to 16 minute drift period was recorded for each observation period. The
spar can measure the weak surface current while the current meter could not.
The volume of water contained in the lagoons and in the harbour were estimated from
a series of fathometer transits across the lagoons and along their major axes. No previous
bathymetric data for Erakor lagoon could be located. An analysis of the tide measurements
recorded during the study period was made in order to relate the local or Ordnance Datum
to the Chart Datum. The volume of the lagoons was estimated for mean low lower water,
MLLW, level and a formula was derived for the lagoon volume for any water level. The amount
of fresh water tributary to the lagoon was estimated from the difference between the ebb
and flood tide volumes.
The following equipment was provided by CCOP/SOPAC.
Current Meter (NBA, DNC-3)
Hand winch
Water sampler
Secchi disk
Plankton net
Periphyton growth units
Portable laboratory
Sextant
Sample containers, BOD bottles
Temperature and Conductivity meter
Fathometer (Raytheon D-719)
......./5
5
Compass
Tools, spare parts, and miscellaneous items.
The facilities and equipment supplied by the Vanuatu Government include the following:
A laboratory area, with oven and analytical balance
Equipment storage facilities
Land transportation
20ft. flat bottom boat and meter for lagoon survey
The 33ft., 15.27 ton "LOPEVI" and crew for harbour survey
Extra line and anchors for anchoring with 50 meter depth
Skiff and motor and rubber inflatable
Miscellaneous items, batteries, lines, spar, tide gauge etc.
Wind and tide records for Port Vila area
Various maps, charts and aerial photos
Population and water use data.
RESULTS
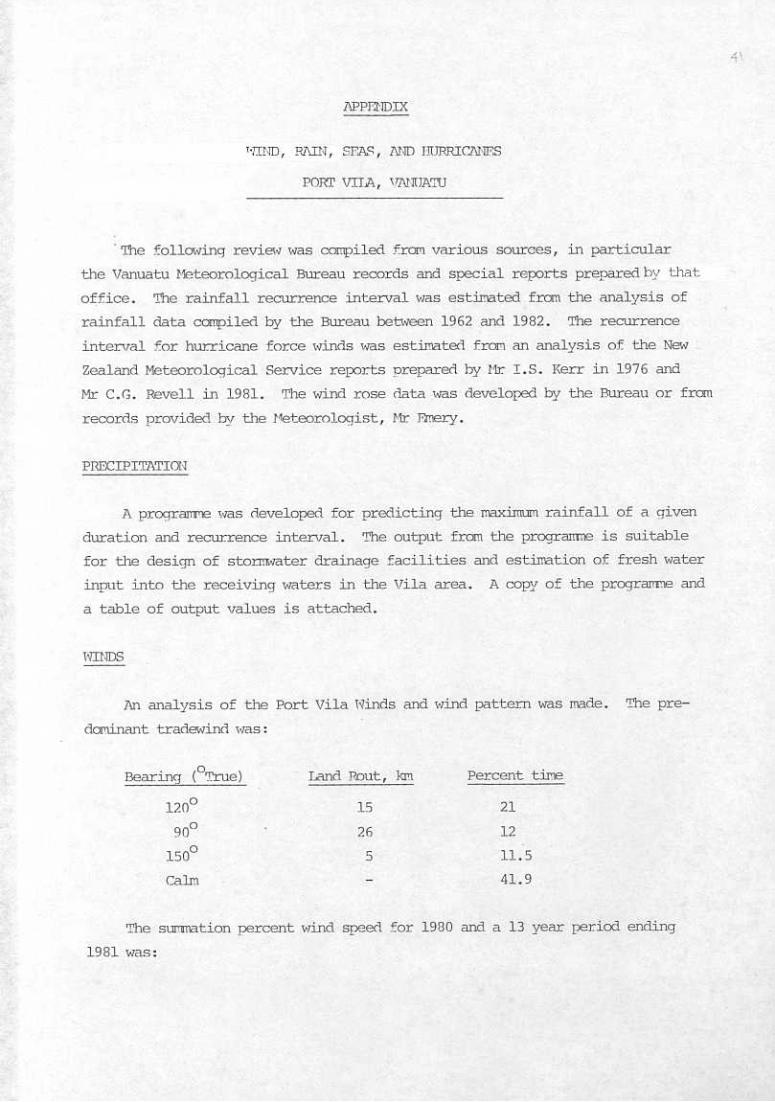
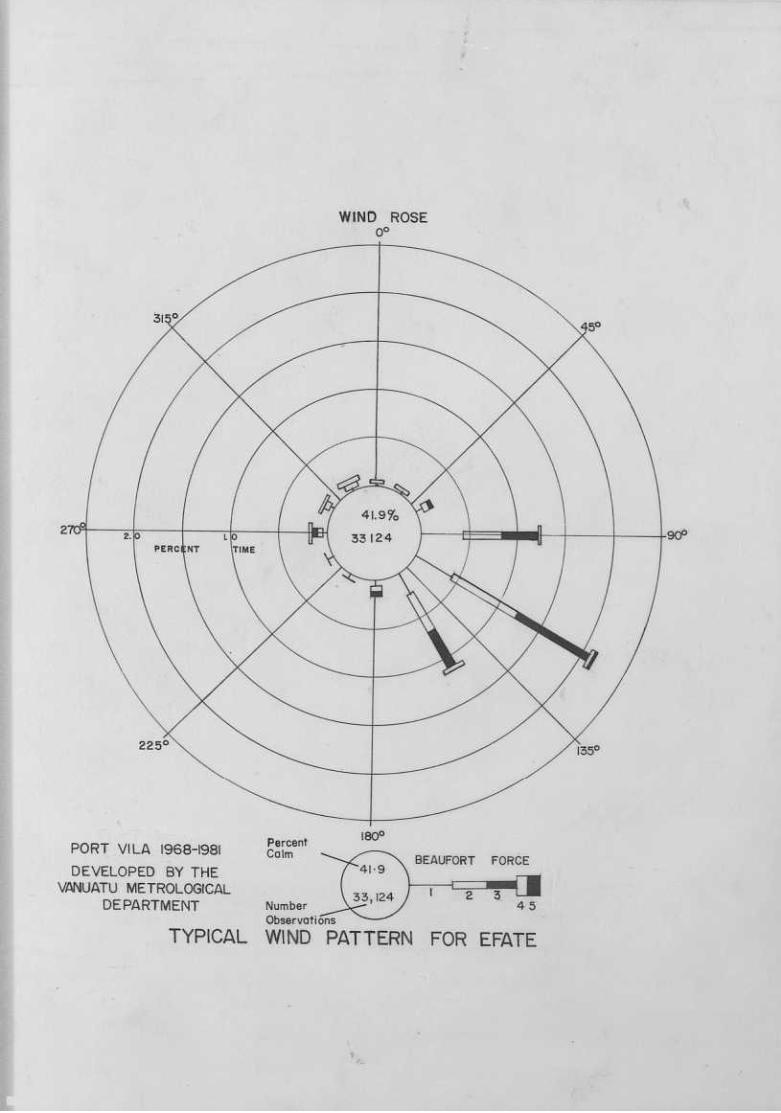
An analysis of the wind, storm, wave and rainfall characteristics for the Vila area were
made prior to the site study. The detailed finding of those analyses is attached as Appendix 1
of this report. As will be shown, the prevailing wind is critical to the water quality of Vila
Harbour and the wind has significant impact upon both of the lagoons. The results of the
site study are presented below.
Vila Harbour
The general characteristics of Vila Harbour are given in Table 1. The Harbour has
four distinct areas (see Figure 1): 1) the north reef of approximately 84 hectares; 2) Vila Bay
with 190 hectares; 3) Paray Bay of 68 hectares; and 4) Pontoon Bay with 143 hectares,
giving a total area estimated to be 485 hectares at Chart Datum. The tributary watershed
has 685 hectares, and there are no significant fresh water streams. Shallow to moderate
depth reefs isolate each of the three deep bays in the central and south end of the harbour.
Hence, circulation within the harbour is restricted to the upper strata and surface waters.
The harbour entrance to Mele Bay and the open ocean is also restricted by a 25 meter depth
reef. The depth of water inside the entrance is 48 metres. Paray Bay has a maximum depth
of 42 meters, and Pontoon Bay has a maximum depth of 51 meters. The reef separating
them is 1.5 meters deep. The bathymetric characteristics of the harbour is given in Figure
......./6

6
2.. The tidal prism amounts to approximately 5 percent of the total volume of the harbour,
and the time required to reduce the residual water to one percent was estimated t o be 69
days. The tide levels given to chart datum are:
MHHW 1.2M
MLHW 1.1M
MHLW 0.5M
MLLW 0.2M
The calculated relationship between the various datum employed at Vila were:
Ordnance Datum + .674M = Chart Datum
Ordnance Datum + 2.268M = Gauge Datum
Chart Datum + 1.594M = Gauge Datum
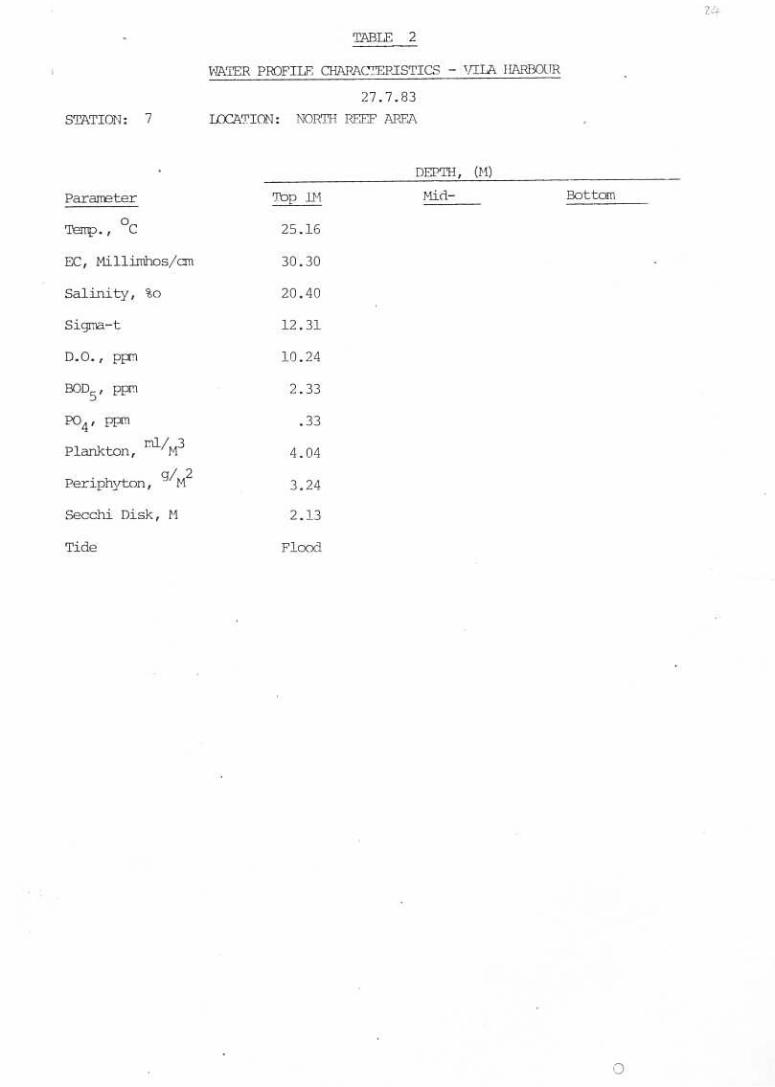
The characteristics of the water within the Harbour are given in Table 2 and those
of Mele Bay where the control station is located are given in Table 3. The surface water
averaged 25.03'C, 36.55%Salinity, and 24.53 sigma-t. The salinity and sigma-t of the reef
area was 20.40%. and 12.31 respectively. The reef area values were not averaged in the
harbour values. The values in Mele Bay were 25.36'C, 36.92%, and 24.69. The bottom
water averages in the harbour were 24.56'C, 36.81% and 25.00 respectively.
The mid-day dissolved oxygen concentration in the surface water varied from 100
percent saturation in the south to 141 percent saturation in the north of the harbour. The
surface water biochemical oxygen demand was minimum .29ppm at the entrance, increased
to .34ppm in the south, .57ppm on the east, and increased further t o 2.33ppm in the north.
The dissolved oxygen decreased in the bottom water to about 84 percent saturation, and
the BOD increased to 0.5ppm.
Phosphate values ranged from .25ppm to .45ppm. The control station had .15ppm. 3 3 The net plankton increased from .47ml/M at the harbour entrance to 2.1ml/M at the south-
3 . east end, and was a maximum of 4.04ml/M in the reef area at the northeast end. The trans-
parency of the water was inversely related to the plankton concentration and varied from
22.25M in the control area, to 11.28M at the harbour entrance, 6.17M at the southeast end,
and was a minimum of 2.13M at the northeast end.
Table 4 gives additional physical characteristics of the water column that were obser-
ved during the current studies for both ebb and flood tide conditions.
Tables 5, 6 and 7 give the ocean current observation made in Vila Harbour. The surface
currents were measured at the harbour entrance using both a weighted spar and the current
......../7

7
meter. Both values are given in Table 5. The net ebb current measured by the spar was
2.3 times greater than that measured using the current meter. Currents between 166' and
345' were identified as ebb, and currents between 345' and 166' (mag) were identified as
flood. However, flood occurred only below 10 meters depth during the flood stage of the
tide. The current meter would indicate short periods of flood current at different depths;
however, as shown by the spar movement these were due to harbour surge and resulted
in no net current transport. Currents averaged .005M/S to .056M/S; the faster currents were
at the surface.
Table 6 gives the current near the seawall on the east side of the harbour. The ebb
currents tended to be stronger than those during the flood period. The wind, although only
3 to 4 knots, was in the ebb direction. A half hour harbour surge was present during the
period of observation.
Table 7 shows the currents at the east end of Talimoru Passage where the proposed
causeway/bridge is to be located. Currents were weak throughout this study period. The
strongest currents .08M/S occurred near the end of flood and .15M/S just following high
slack water when water could pass over the outer reef. There was no wind during these
two strong current periods. The duration of these currents were quite short.
Erakor Lagoons
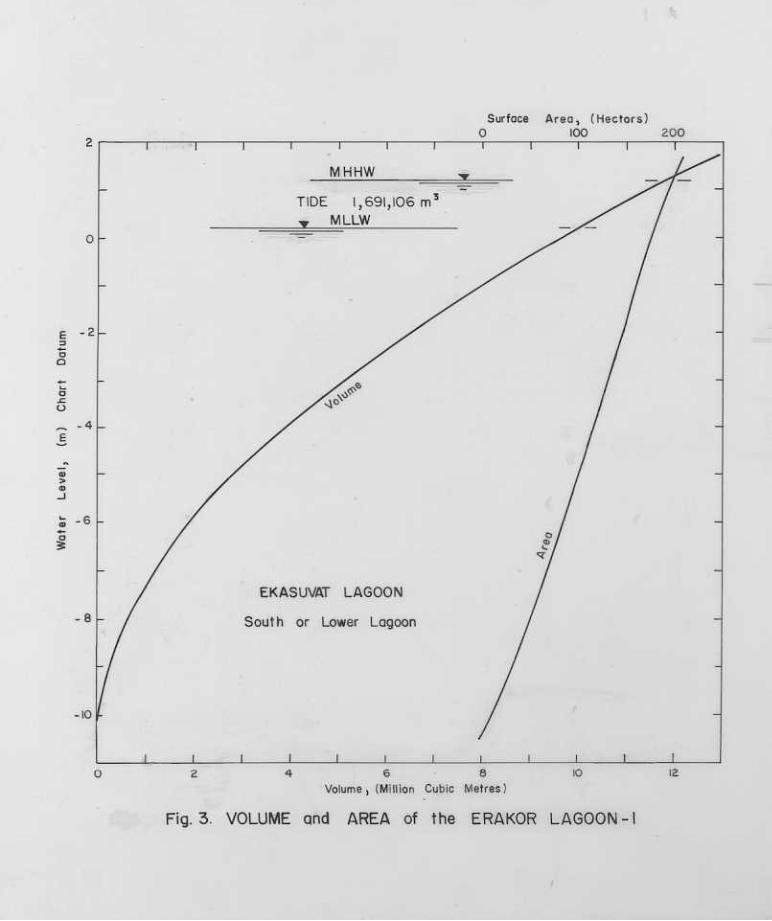
The general characteristics of Erakor Lagoon are given in Table 8 and shown in Figure 1.
There are two lagoons, Ekasuvat, a 178 hectare, 10.7M deep lagoon that has an entrance to
the ocean at the southern end, and a second outlet that leads to Emten Lagoon, a 219 hec-
tare, 6.4M deep lagoon. There are no significant fresh water rivers tributary to the lagoons
and the watersheds to each are rather small, 327.5 hectares and 1,542.5 hectares respec-
tively. The lagoons' surface area and bathymetric characteristics are shown in Figures 3
and 4. The tidal prisms average 2.15 x 10 M and .31 x 10 M for the lower and upper
lagoons respectively. The ebb volumes are approximately 10 t o 15 percent greater than
the flood volumes. The hydraulic residerice periods appear t o be 19 days for the lower lagoon,
and 91 days for the upper lagoon.
6 3 6 3
The characteristics of the water columns in Erakor Lagoon are given in Table 9. The
surface water in Ekasuvat lagoon averaged 26.22'C, 35.21% salinity, and sigma-t was 23.13.
The bottom water averaged 25.22'C, 36.09%, and 24.14. The water in Emten lagoon aver-
aged 24.61'C, 32.87%, and 21.86 sigma-t at the surface, and 24.40'C, 33.96%, and 22.76
sigma-t at the bottom.
......../8
8
The dissolved oxygen concentration in the surface water varied from 107 to 111 per-
cent saturation in the lower lagoon and the bottom water varied from 81 to 83 percent satu-
ration. The dissolved oxygen concentration of the surface water in the upper lagoon varied
from 92 to 103 percent saturation, and the bottom water contained 12.6 to 95 percent satu-
ration. The bio-chemical oxygen demand averaged 0.68ppm in the surface water in Ekasuvat
lagoon. It had a low value of 0.34ppm near the ocean entrance and increased to 1.2ppm
at the north end. The bottom water in Emten lagoon contained .32ppm BOD near its entrance
and 9.25ppm near the deeper central area of the lagoon. Surface water BOD was measured
in the lower lagoon as this water would be of greater significance to local inhabitants, while
in the more shallow upper lagoon, the lower depth water would act as a nutrient trap and
be a potential odour problem; hence, bottom water was tested. Available resources limited
the total number of tests possible during the study period. The surface water in Ekasuvat
lagoon contained 0.30 + .05ppm PO , and the deeper water contained .45 - .07ppm PO.
The surface water of Emten lagoon averaged .26 +_ .08ppm PO concentration, and the
mid and bottom water averaged .28 +_ .02ppm PO
was found at the mid-depth near the center of the lagoon.
+ 4
The maximum concentration .31ppm 4
Tables 10 and 11 give the physical observations made during the current studies con-
ducted in the lagoon entrance channels. The ebb water temperature, salinity and density
for Ekasuvat lagoon was 25.08 +_ .37', 35.00 3.33%, and 24.09 - .63 sigma-t, and
the flood water TSD was 25.27 - .14' 36.15 - .70%, and 24.14 - .55 sigma-t. The
flood water TSD was 25.80 +_ .54', 34.26 +_ 3.29%, and 23.40 - .66 sigma-t.
+ +
+ + + +
Tables 12 and 13 give the current observations made in the channel entrances to
the lagoons. The maximum ebb and flood currents to Ekasuvat were .67M/S and 1.02M/S.
The average values were .37M/S and .56M/S respectively. The direction of the ebb cycle
changes with the tide range. The maximum ebb and flood currents to Emten lagoon were
.82M/S and .14M/S and the average was .51M/S and .09M/S. During neap tide the ebb
tide may occupy almost the entire tide cycle, and during spring tide the flood cycle is increased
in duration. During the study period the following tide corrections on the predicted tide at
Vila harbour applied to various locations in Erakor Lagoon:

9
TIME HEIGHT
_c_
CYCLE LW
+.24M Spring Tide
+ .04M Neap Tide
-.06M Spring Tide
HW LW
+1hr 27M +.05M
+44M +1hr 42M -.17M
+1M +1hr 32M -.27M -14M -
+13M +1hr 52M +.13M
+19M +2hr 27M -.18M
LOCATION
Erakor Landing -7M
HW
Inside Ekasuvat
Neap Tide 0 -
+.36M Spring Tide
+.35M Spring Tide
+.79M Spring Tide
Spring Tide
North Ekasuvat
South Bridge
Above Bridge +17M +4hr 27M -.33M
Central Emtem +2hr 18M +4hr 7M -.47M -
During the study period, 12.7.83 at the entrance to Ekasuvat lagoon, the flood tide lasted three and three-quarter hours in a 13.5hr cycle, and on 14.7.83 at the entrance to
Emten lagoon the flood lasted four hours of a 13.5 hour cycle. During a neap study period
3.9.83 the water level in Ekasuvat lagoon remained higher than the water level outside the
entrance t o the lagoon throughout the flood and ebb tide cycle. The difference in water
height between that in Ekasuvat Lagoon and that just outside Ekasuvat Lagoon at Erakor
Landing was 0.24 +_ .03M through the ebb and flood tide cycle.
DISCUSSION
The following discussion is based upon the findings of this study, and a 1980 SPC
water quality survey conducted by Tini Lam Yuen. In general there are no disagreements
between the findings of these two studies; however, a change in the dissolved oxygen con-
centration at depth in Emten lagoon could indicate a trend. The difference in the salinity
of the lagoon waters indicate a range of values probably exist that depend upon the amount
of recent rainfall, wind conditions, and the spring and neap tidal cycle.
Present Status of Vila Harbour
The present water quality of Vila Harbour is reduced relative to that of Mele Bay.
The transparency decreases from 22.25M in Mele Bay to 11.28 in Vila Bay, 9.14M in Pontoon
Bay, 8.53M at the seawall, and 6.17M in Paray Bay. The transparency falls further in the
......../10
10
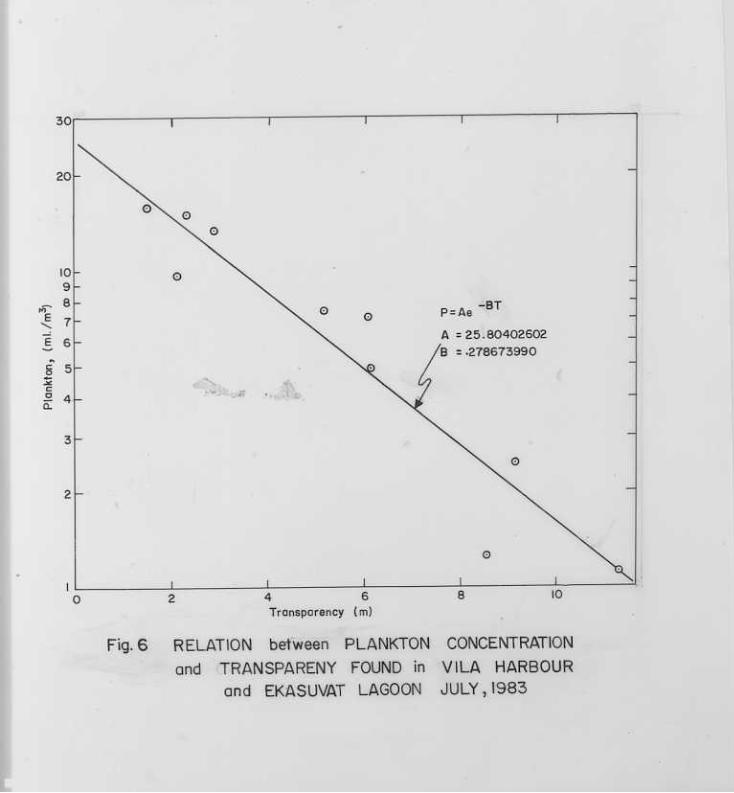
North reef area to 2.13M. As indicated in Figure 5 there is a good correlation between the
transparency of the harbour water and its productivity (growth of periphyton). The location
of the areas of lower transparency indicate the sources of nutrients in Vila Harbour. There
are no surface streams to introduce silt and other inorganic suspended solids, the shoreline
is quite abrupt and predominantly limestone or coral that contributes little turbidity; hence
plankton is the dominant suspended solids in the water. Figure 6 shows the relationship be-
tween plankton concentration and transparency for the conditions that were found in Vila
Harbour in July 1983.
At present some 7750 population are tributory to the harbour area. As the projected
growth rate is 3.2 percent per year, this population will increase to 9070 in five years, and
become 10,620 in 10 years, indicating a 37 percent increase in nutrient input t o the harbour
in 10 years. Assuming a linear relationship between nutrients and plankton concentration,
one may expect the transparency of the harbour to be reduced from an average value of
9M to 4.5M, or by one-half in 10 years. This value does not include tourist contributions;
hence the transparency may be reduced 50 percent in much less than than 10 years.
The harbour, due to the several deep basins having relatively shallow sills, will act
as settling basins and it will accumulate nutrients. If the bottom water becomes anaerobic
the nutrients will recycle and compound the water quality problem. It may require several
years to cause the anaerobic condition; however once it does occur then several years will
be required to correct it.
The temperature, salinity and density profiles of the waters in Vila Harbour indicate
that a one meter or so layer of low density surface water at times covers a portion of the
harbour surface. The low salinity water is quite evident near station 2, at the harbour
entrance, and in the north reef area. This condition results from ground water seepage into
the harbour.
A second abrupt change in the water density was found between 17 and 20 metres
depth. Due to the shallow sills, water found at a depth greater than 25m would be expected
to have a longer residence period than that of the water found above that depth. Some reduc-
tion in the dissolved oxygen concentration at the deeper depths in both Pontoon and Paray
Bays were assumed to be evidence for a reduction in the hydraulic exchange rate in those
basins.
......../11

11
The prevailing winds result in a discharge of surface water from the harbour. The
discharge can persist during the flood tide. It can be shown that the difference in surface
water density between that in Mele Bay and Vila Harbour will produce a current of approxi-
mately .08M/S. A southeast wind of 5 knots can result in a .06M/S surface current in the
same area. These currents will add and result in a .14M/S current. Noting that as the sub-
surface current is approximately .07M/S in the opposite direction, the net surface current
would be expected to be on the order of .07M/S. The average current measured with the
spare was .06M/S during the ebb tide, and .05M/S during the flood tide. In both instances
the direction of water flow was out of the harbour on the surface. The wind was 5 to 7 knots
southeast during the flood tide, and less than 4 knots during the ebb tide. An observation
on the surface wind drift, .13M/S in Pontoon Bay indicated 3.2 percent wind speed set 70'
to left of wind with a 1500M fetch and 8 knot wind. The above observations indicate that
the wind stress and density gradient were significant in producing the surface outflow at the
harbour entrance during the study period. As shown in Appendix 1, the predominate trade
wind direction is from the southeast and it is less than force 7.5 for 77 percent of the time.
It appears that the wind is a significant factor in causing replacement of the surface harbour
water with subsurface Mele Bay water. It also appears that the seepage of fresh water into
the north reef area may be equally significant in producing a density gradient current that
adds to the southeast wind shift.
An analysis of the current data and harbour volumes show the following water balance
during the study period:
Tide Volume (M)
Total Ebb flow 7,7 19,436
Total flood plus storage 7,371,096
Difference 348,340
Net flood flow* 4,881,367
Tidal Prism* 4,881,552
Difference 185
Fresh Water** 5,000
* Net flood calculated from current speed x area, tidal prism calculated from change
in tide level x harbour area.
Fresh water estimated from salinity change x surface Volume fraction. **
......./12

12
The large difference between the total ebb and total flood tides contains the seepage
water; however, i t is based upon several assumed values and should not be taken as all see- page water. The water supplied to the Vila Harbour watershed is reported to be 2,856M
per day, of which 50 percent may appear in the seepage water. This volume of water would
not be Significant except for its nutrients. The 5,000M per tide cycle may be over conserva-
tive, as it may be greater than this amount. If we assume 30 percent of the rainfall that falls
3
in the watershed reappears as seepage, it would amount to approximately 4,000M per tidal
cycle; hence, the seepage water would be on the order of 5,500M 3 per tidal cycle.
During flood tide sub-surface sea water from Mele Bay enters Vila Harbour. It passes
through Vila Bay into Pontoon Bay. Some surface water moves from Vila Bay into Paray
Bay. During ebb tide surface water discharges from both Pontoon Bay and Paray Bay through
Vila Bay along with the less saline water from the north reef area. Mid-depth water also
discharges from Vila Bay into Mele Bay. An occasional mass of mid-depth or deeper water
was observed passing over the sill at station 3 from Paray Bay into Vila Bay during the ebb
tide. The above exchanges are to some extent wind dependent. A strong harbour surge,
resonance also contributes to the mixing of the water layers. It appears that there was a
counter-clockwise circulation about Iririki Island during the period of observation. This condi-
tion would suggest that any waste water discharge from Iririki Island would remain in the har-
bour area for a significant period of time.
The salinity of the surface water increases from Pontoon Bay to Paray Bay and it
reaches a maximum near station 3 between Paray Bay and Vila Bay. Evaporation may be
the cause for this salinity increase. Apparently most of the fresh water seeps into the harbour
in the north reef area. The density and salinity of the sub-surface and bottom harbour water
is similar to that found at the central station in Mele Bay.
In daylight hours the percent supersaturation of dissolved oxygen increases in areas
where the BOD and plankton concentrations increase. This relationship is to be expected
in Vila Harbour as much or most of the BOD is due to the plankton, and the phytoplankton
release oxygen during the daylight hours. At night this excess oxygen would be depleted
in proportion to the plankton population. The high plankton concentration in the north reef
area produced a 141 percent saturation DO concentration. This area can be expected to
have an odour problem at night following calm, cloudy days. The problem In this area will
Increase with additional population growth and associated increase of septic tank seepage.
The seepage should cause a serious pollution problem in less than ten years.
......../13
13
Present Status of Erakor Lagoons
The water quality of both Ekasuvat and Emten Lagoons have deteriorated. There are
areas in Ekasuvat where the existing water quality should be improved in order to continue
the present level of water contact sports. There are three areas where pollution problems
can be expected. One is in the vicinity of the Le Lagon Hotel from Erakor Island to inside
of Ekasuvat Lagoon, where septic tank seepage is resulting in excess periphyton growth
and odour problems exist at present. A second area is in the Intercontinental Hotel-Hospital
Treatment Plant area where water circulation is reduced due to the small island and cove
and the treated hospital waste is discharged. Some lechate from the hotel and local septic
tanks can also be expected. The third area is in the confined dredged area at the north end
of the lagoon. Ground water seepage sampled at low tide was approximately 50 percent
fresh. A significant amount of seepage was observed in the general area. This area will
accumulate nutrients due to the general geometry of the development.
The hospital treated waste water was estimated to contribute 6.6kg of PO daily to
the lagoon. This amounts to about one percent of the total PO in the surface water in the
lagoon. The deeper water in Ekasuvat Lagoon is accumulating PO The surface water
in Emten Lagoon appears to be in equilibrium with the surface water in Ekasuvat Lagoon.
The sub-surface water in Emten is also accumulating PO. The amount of phosphorus is
adequate to support a significant plankton population and it appears to have accumulated
to approximately three times the concentration found in Mele Bay. Water sampled near Erakor
Island at the end of flood tide contained 0.23ppm PO. This water would contain some lagoon
water from the previous ebb tide; however, there does appear to be other sources.
4'
During the survey the total freshwater discharge from Erakor Lagoon appeared to 3 be on the order of 100,000M /tide with 60 percent coming from Emten Lagoon. The domestic
water supplied to the Erakor watershed is approximately 660M per day. Assuming 50 percent
appears in septic tank seepage or 330M per day would leach into the lagoons. This amount
is not significant, except for nutrients that it contributes.
3
3
The transparency of the water and the plankton concentration indicate a high nutrient
level in the lagoon water. When the transparency is reduced to less than one meter depth
due to plankton then serious odour problems can be expected. However there does not
appear to be a significant change in transparency between the 1980 and 1983 surveys in
either of the lagoons to match what appears to be a trend in the dissolved oxygen concentra-
tion.
......./14

14
The daytime average surface dissolved oxygen concentration in Ekasuvat Lagoon
showed an increase of 6 percent over that reported in 1980. The bottom water showed a
7 percent decrease in the three years. These two changes show a consistent trend of increased
plankton activity in the lagoons. The average surface dissolved oxygen concentration in
Emten Lagoon was 6.99ppm and the average bottom concentration was 5.01ppm in 1980.
In 1983 these values were 6.63ppm and 4.55ppm respectively. The reduction in bottom dis-
solved oxygen concentration was 9 percent. In the critical central area the reduction was
80 percent. The surface water Biochemical Oxygen Demand, BOD does not appear to have
changed during the past three years. Again, in the critical central area of Emten Lagoon,
it appears that a change has occurred in the deeper water. Organic matter has now begun
to accumulate at a rate faster than it will settle to the bottom, and a higher, 9.25ppm BOD
concentration now exists in that area. The top of the bottom sediments were anaeorobic
and high in sulfides. It would appear that Emten Lagoon could have a serious odour problem
in less than 5 years,
Impact of Efila Bridge
Current studies conducted at the east entrance to Talimoru Passage and observations
made in the passage, show that there is no significant exchange of Mele Bay water with
Pontoon Bay except at high tide where waves break on the west reef, or during strong east
winds. Due to the general shape of Pontoon Bay, floatables could collect along its western
side if the Talimoru Passage were closed. A low level roadway or "ford" could be used to
connect Efila Island with the mainland so traffic could pass during low tide. Such a structure
would not significantly affect the transport of floatables or the flow of water through the
passage, and it would provide the island with some degree of privacy. Other structures such
as a bridge could be used; however, they would likely cost more and result in less privacy
on the island.
Emten Channel
At present the tidal prism in Emten Lagoon is limited to 0.18M, due t o the hydraulic
restriction at the causeway/bridge between Ekasuvat and Emten Lagoons. During an ebb
tide the hydraulic head loss at the bridge can be 0.5M. Due to the entrance loss and elevation,
the culverts contribute only about four percent to the hydraulic flow at the bridge. A flow
of 17.4M /S istypical. The flow from the lower lagoon to the ocean amounts to 124M /S
during maximum current, or almost 7 times that of the upper lagoon. The area of the upper
lagoon is 23 percent larger than that of the lower lagoon so it could have a larger net tidal
prism than the lower lagoon with open access to the ocean.
3 3
......./15

15
3 At present, a flow of 17.4M /S passes through the 800m long channel above the
bridge, with a head loss of about .064M. If the bridge head loss were halved then the flow
would increase to about 38M /S, and i f it was eliminated the flow would be approximately 3
53M /S. The phase shift between the tidal flows for each lagoon would also be altered.
At present, due to phase shift and the input of fresh water, it appears possible for the lower
lagoon to ebb during the entire tidal cycle. The lower lagoon can discharge simultaneously
to both the ocean and the upper lagoon for the same reason. These effects tend to increase
the hydraulic resident period of both lagoons. It appears essential to increase the hydraulic
flow to the upper lagoon i f the water quality of that lagoon is to be maintained or improved.
It may be necessary to not only reduce the hydraulic head loss at the bridge, but also improve
the hydraulic characteristics of the channel leading to the upper lagoon.
Ekasuvat Channel
3
The Ekasuvat Lagoon is connected t o the ocean by a 140M wide, 3600M long, 2.8M 2 2 2 deep channel. It has a section area of 195M at low tide, 341M at high tide, and 305
at maximum ebb current. The hydraulic radius was estimated to be 5.4, and the discharge
was 156M /S during maximum current when the hydraulic head loss was .28M. Mannings
"n" was estimated to be .028. From a similar evaluation of the channel to Emten Lagoon,
the "n" value was estimated at 0.035. Apparently the additional mangroves and coral heads
in the upper channel offer greater hydraulic resistance than the lower channel. It is of interest
to note that the salinity and sigma-t value of the surface water decrease in value in the lower
channel near slack water on both ebb and flood tide; the change in turbulence is apparently
the cause.
Water Quality Control
3
Legal and technical machinery necessary for co-ordinating development, pollution
control, receiving capacity, and water resource requirement in Vanuatu is now needed. This
is evident as at present new hotel facilities are being constructed close to an existing hotel
that shares the same limited receiving waters for waste disposal. In a short period of time,
both facilities will suffer from reduced water quality of their recreational water resource.
Correction of such problems is generally at greater expense than prevention. The occurrence
of the above problem will become more frequent with development in the Vila area; hence,
the urgency for appropriate water quality control at this time.
......../16
16
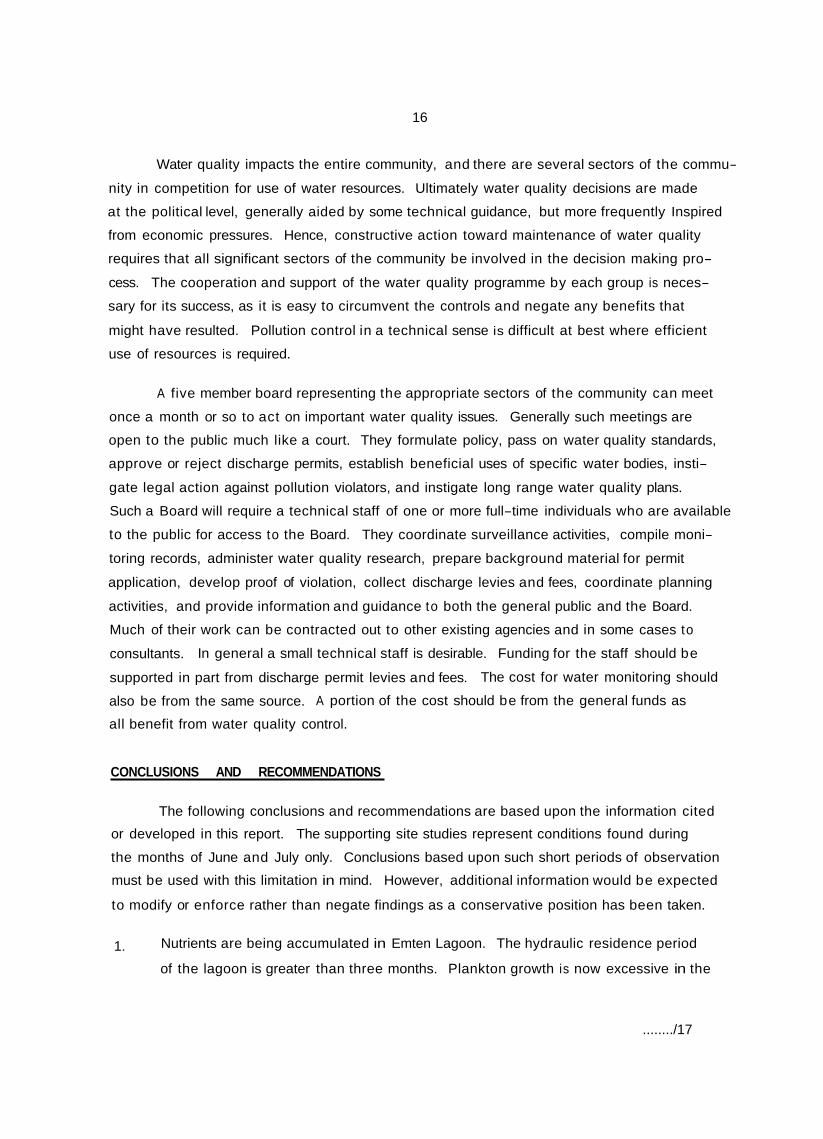
Water quality impacts the entire community, and there are several sectors of the commu-
nity in competition for use of water resources. Ultimately water quality decisions are made
at the political level, generally aided by some technical guidance, but more frequently Inspired
from economic pressures. Hence, constructive action toward maintenance of water quality
requires that all significant sectors of the community be involved in the decision making pro-
cess. The cooperation and support of the water quality programme by each group is neces-
sary for its success, as it is easy to circumvent the controls and negate any benefits that
might have resulted. Pollution control in a technical sense is difficult at best where efficient
use of resources is required.
A five member board representing the appropriate sectors of the community can meet
once a month or so to act on important water quality issues. Generally such meetings are
open to the public much like a court. They formulate policy, pass on water quality standards,
approve or reject discharge permits, establish beneficial uses of specific water bodies, insti-
gate legal action against pollution violators, and instigate long range water quality plans.
Such a Board will require a technical staff of one or more full-time individuals who are available
to the public for access to the Board. They coordinate surveillance activities, compile moni-
toring records, administer water quality research, prepare background material for permit
application, develop proof of violation, collect discharge levies and fees, coordinate planning
activities, and provide information and guidance to both the general public and the Board.
Much of their work can be contracted out to other existing agencies and in some cases to
consultants. In general a small technical staff is desirable. Funding for the staff should be
supported in part from discharge permit levies and fees. The cost for water monitoring should
also be from the same source. A portion of the cost should be from the general funds as
all benefit from water quality control.
CONCLUSIONS AND RECOMMENDATIONS
The following conclusions and recommendations are based upon the information cited
or developed in this report. The supporting site studies represent conditions found during
the months of June and July only. Conclusions based upon such short periods of observation
must be used with this limitation in mind. However, additional information would be expected
to modify or enforce rather than negate findings as a conservative position has been taken.
1. Nutrients are being accumulated in Emten Lagoon. The hydraulic residence period
of the lagoon is greater than three months. Plankton growth is now excessive in the
......../17

17
lagoon. Significant pollution problems, fish kills and odour, can be expected to occur
within a few years if action is not taken. No further development should occur in
the watershed until corrective action is taken.
The causeway to the bridge across the entrance t o Emten Lagoon is a serious restric-
tion upon the normal hydraulic exchange between the two lagoons. The 18 concrete
culverts provide little relief for the problem. An adequate channel is required.
The hospital effluent is a source of nutrients to Ekasuvat Lagoon. The treatment re-
duces the BOD in the effluent but it does not remove the nutrients significantly.
It is recommended that the hospital be connected to a sewer system that transports
the waste water away from the lagoon. An alternative would be tertiary treatment
stage be added to the present treatment facility.
The proposed bridge to Efila island should pose no serious impact upon the water quality
of Vila Harbour. Such a bridge would Impact Efila island by providing public access
t o the island. It is proposed that a "ford", low level roadway, be considered instead
of a bridge. It could be designed for traffic at low tide only. Such a structure would
permit floatables to pass seaward through the channel during high tide, a necessary
action due to the direction of the prevailing winds. Such a roadway would also provide
a greater privacy to the local inhabitants on the island, and its construction cost would
be minimal.
The development and growth at Vila has reached a critical planning stage. It is neces-
sary at this time t o decide whether to install a sewer system, or to continue develop-
ment using septic tanks as the major sewage disposal method. If the latter is the case,
then the future development must be distributed over a larger area. If sewers are
to be installed, the development should be concentrated along specific routes.
It is now necessary to do the preliminary engineering if a sewer system is to be used.
Any further growth in the Vila area will impact the receiving water significantly. At
present the turbidity due to plankton in the water at the north end of the harbour
is 10 times that found in Mele Bay, and six times that in the central part of the harbour.
The Biological Oxygen Demand (BOD) and productivity of the water in the north end
of the harbour is about 10 times that of the incoming Mele Bay water. Odour problems
can be expected to occur at night in that area.
2.
3.
4.
5.
6.
7.
......../18

18
8. The Port Vila area now requires an adequate water quality programme i f the present rate of development is to continue, and serious pollution of the nearshore marine waters
is to be averted.
It is recommended that the Government of Vanuatu now consider some of the basic steps necessary t o implement such a programme which would include:
a.
9.
The selection of an existing agency or the creation of a new agency with the
legal means to regulate activities that impact upon the quality of the receiving
waters in the coastal areas;
One of the first activities of the agency should be to define the beneficial uses
of the receiving waters within specific areas. Such action would form a basis
for setting receiving water standards, monitoring and reporting requirements,
and enforcement needs to protect the beneficial uses;
It is recommended that the agency be directed b y and be under the control
of a "Water Resources Control Board" (WRCB), consisting of at least five mem-
bers. The members should represent the technical, public, industrial, resource,
and political sectors of the region served ;
A permit system should be adopted in order to finance a portion of the cost
for water quality control, and serve as an instrument of control. All dischargers
should be required to secure a discharge permit prior to any development.
An annual charge should be collected for administration of the programme,
monitoring, reporting, enforcement and improvement of the programme;
The permit should specify certain restrictions upon what cannot be discharged,
toxic materials etc. However, the permit should indicate that it is the responsi-
bility of the discharger to maintain the water quality of the receiving waters
at or above the specified standard, and that he can be forced t o stop his dis-
charge, be fined for damages, and have to pay for clean up if his activity pol-
lutes the receiving waters.
b.
c.
d.
e.
10. As an ocean outfall may be required for any future sewer system serving Port Vila,
it is recommended that potential outfall sites in Mele Bay be evaluated. Little is now
known regarding the currents and water density profiles in Mele Bay. As this type
of information will be important with respect to outfall site selection, they should be
investigated before other parameters are evaluated.
......../19
19
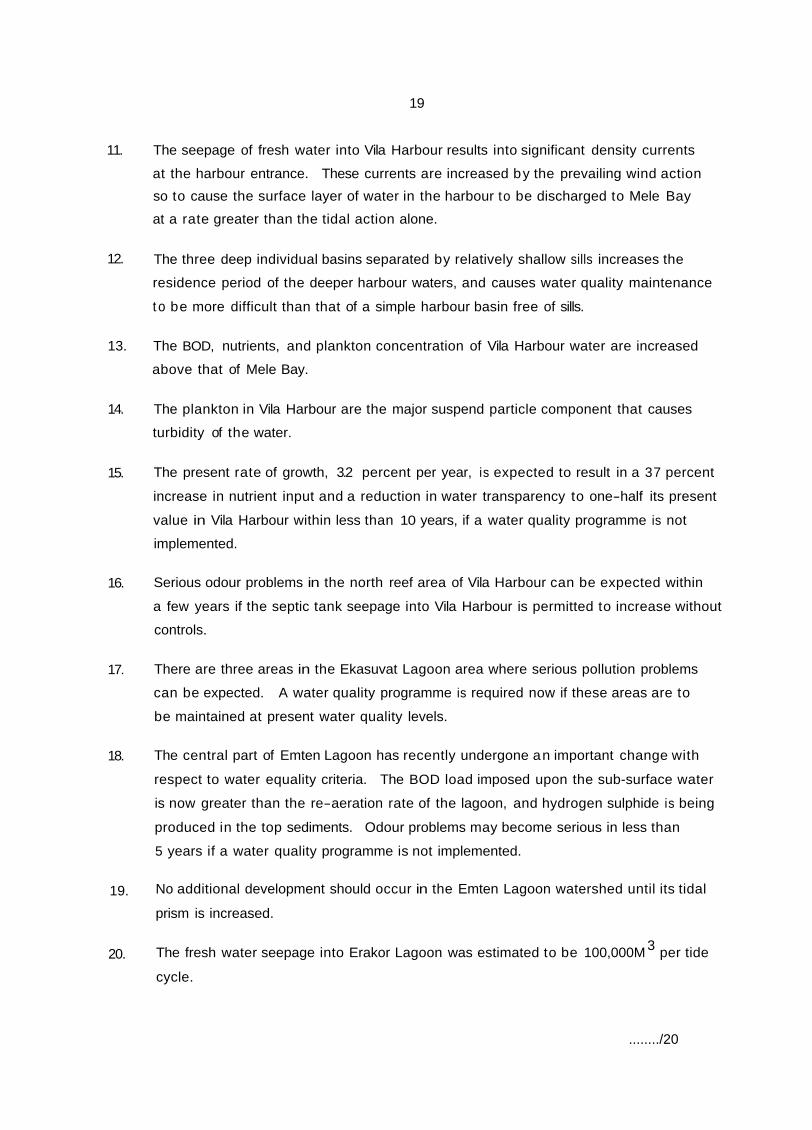
11. The seepage of fresh water into Vila Harbour results into significant density currents
at the harbour entrance. These currents are increased by the prevailing wind action
so to cause the surface layer of water in the harbour to be discharged to Mele Bay
at a rate greater than the tidal action alone.
The three deep individual basins separated by relatively shallow sills increases the
residence period of the deeper harbour waters, and causes water quality maintenance
t o be more difficult than that of a simple harbour basin free of sills.
The BOD, nutrients, and plankton concentration of Vila Harbour water are increased
above that of Mele Bay.
The plankton in Vila Harbour are the major suspend particle component that causes
turbidity of the water.
The present rate of growth, 3.2 percent per year, is expected to result in a 37 percent
increase in nutrient input and a reduction in water transparency to one-half its present
value in Vila Harbour within less than 10 years, if a water quality programme is not
implemented.
Serious odour problems in the north reef area of Vila Harbour can be expected within
a few years if the septic tank seepage into Vila Harbour is permitted to increase without
controls.
There are three areas in the Ekasuvat Lagoon area where serious pollution problems
can be expected. A water quality programme is required now if these areas are to
be maintained at present water quality levels.
The central part of Emten Lagoon has recently undergone an important change with
respect to water equality criteria. The BOD load imposed upon the sub-surface water
is now greater than the re-aeration rate of the lagoon, and hydrogen sulphide is being
produced in the top sediments. Odour problems may become serious in less than
5 years if a water quality programme is not implemented.
No additional development should occur in the Emten Lagoon watershed until its tidal
prism is increased.
The fresh water seepage into Erakor Lagoon was estimated to be 100,000M per tide
cycle.
12.
13.
14.
15.
16.
17.
18.
19.
3 20.
......../20
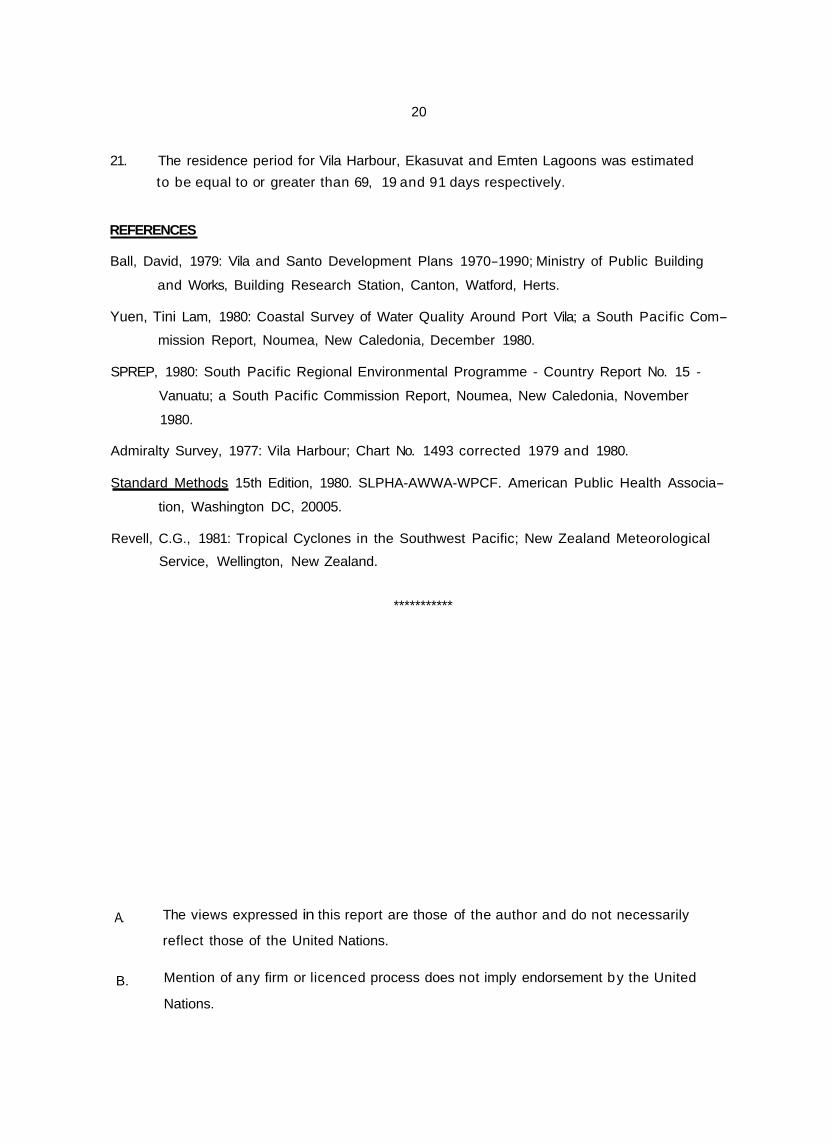
20
21. The residence period for Vila Harbour, Ekasuvat and Emten Lagoons was estimated to be equal to or greater than 69, 19 and 91 days respectively.
REFERENCES
Ball, David, 1979: Vila and Santo Development Plans 1970-1990; Ministry of Public Building
and Works, Building Research Station, Canton, Watford, Herts.
Yuen, Tini Lam, 1980: Coastal Survey of Water Quality Around Port Vila; a South Pacific Com-
mission Report, Noumea, New Caledonia, December 1980.
SPREP, 1980: South Pacific Regional Environmental Programme - Country Report No. 15 -
Vanuatu; a South Pacific Commission Report, Noumea, New Caledonia, November
1980.
Admiralty Survey, 1977: Vila Harbour; Chart No. 1493 corrected 1979 and 1980.
Standard Methods 15th Edition, 1980. SLPHA-AWWA-WPCF. American Public Health Associa-
tion, Washington DC, 20005.
Revell, C.G., 1981: Tropical Cyclones in the Southwest Pacific; New Zealand Meteorological
Service, Wellington, New Zealand.
***********
A. The views expressed in this report are those of the author and do not necessarily
reflect those of the United Nations.
Mention of any firm or licenced process does not imply endorsement by the United
Nations.
B.