CCoolllliieerr CCoouunnttyy WWaatteerrsshheedd MMooddeell ...
89
Prepared by C C o o l l l l i i e e r r C C o o u u n n t t y y W W a a t t e e r r s s h h e e d d M M o o d d e e l l U U p p d d a a t t e e a a n n d d P P l l a a n n D D e e v v e e l l o o p p m m e e n n t t V V o o l l u u m m e e 1 1 E E x x e e c c u u t t i i v v e e S S u u m m m m a a r r y y A A s s s s e e s s s s m m e e n n t t o o f f E E x x i i s s t t i i n n g g C C o o n n d d i i t t i i o o n n s s a a n n d d P P e e r r f f o o r r m m a a n n c c e e M M e e a a s s u u r r e e s s August 2011
Transcript of CCoolllliieerr CCoouunnttyy WWaatteerrsshheedd MMooddeell ...

Prepared by May 2011
CCoolllliieerr CCoouunnttyy WWaatteerrsshheedd MMooddeell UUppddaattee
aanndd PPllaann DDeevveellooppmmeenntt
VVoolluummee 11
EExxeeccuuttiivvee SSuummmmaarryy
AAsssseessssmmeenntt ooff EExxiissttiinngg CCoonnddiittiioonnss
aanndd PPeerrffoorrmmaannccee MMeeaassuurreess
AAuugguusstt 22001111

Collier County Watershed
Management Plan
Collier County, Florida

Document No. 110082
Job No. 100013237
DRAFT 2 COLLIER COUNTY WATERSHED
MANAGEMENT PLAN COLLIER COUNTY, FLORIDA
VOLUME 1: EXECUTIVE SUMMARY, SUMMARY ASSESSMENT OF EXISTING CONDITIONS, AND DEVELOPMENT OF PERFORMANCE MEASURES
Prepared for:
Collier County 3301 East Tamiami Trail Naples, Florida 34112
Prepared by:
Atkins 4030 Boy Scout Boulevard
Suite 700 Tampa, Florida 33607
August 2011

V O L 1 COLLIER COUNTY WATERSHED
PAGE ii MANAGEMENT PLAN – DRAFT
Contents of Volume 1
Page
List of Figures ............................................................................................................................................... iii
List of Tables ................................................................................................................................................. v
Acronyms and Abbreviations ....................................................................................................................... iii
Executive Summary .................................................................................................................................. ES-1
INTRODUCTION ............................................................................................................................................. 1
WATERSHED MANAGEMENT PLAN DIRECTIVE .............................................................................................. 2
WATERSHED MANAGEMENT PLAN DEVELOPMENT ...................................................................................... 3
WATERSHED MANAGEMENT PLAN DOCUMENT ORGANIZATION ............................................................... 3
SUMMARY ASSESSMENT OF EXISTING CONDITIONS – WATERSHED ............................................................. 5
1.1: SURFACE WATER QUANTITY ..................................................................................................................... 5
1.2: IN-STREAM SURFACE WATER QUALITY .................................................................................................... 9
1.3: SURFACE WATER POLLUTANT LOADING ............................................................................................... 12
1.4: HYDROGEOLOGY ..................................................................................................................................... 13
1.5: GROUNDWATER QUANTITY ................................................................................................................... 14
1.6: GROUNDWATER QUALITY AND GROUNDWATER POLLUTANT LOADS ............................................... 25
1.7: NATURAL SYSTEMS: REFERENCE PERIOD COMPARISON ...................................................................... 29
1.8: NATURAL SYSTEMS: FUNCTIONAL ASSESSMENT .................................................................................. 31
SUMMARY ASSESSMENT OF EXISTING CONDITIONS – ESTUARIES .............................................................. 35
1.9: VOLUME AND TIMING OF FRESHWATER INFLOWS .............................................................................. 35
1.10: QUALITY OF FRESHWATER INFLOWS ................................................................................................... 38
1.11: QUALITY OF RECEIVING WATERS ......................................................................................................... 40
1.12: COASTAL HABITATS ............................................................................................................................... 43
SUMMARY DEVELOPMENT OF PERFORMANCE MEASURES ........................................................................ 46
2.1: NATURAL SYSTEMS .................................................................................................................................. 47
2.2: FRESHWATER DISCHARGE TO ESTUARIES.............................................................................................. 49
2.3: SURFACE WATER POLLUTANT LOADS .................................................................................................... 51
2.4: AQUIFER RECHARGE/YIELD ..................................................................................................................... 55
LITERATURE CITED ....................................................................................................................................... 58

Contents
V O L 1 COLLIER COUNTY WATERSHED
PAGE iii MANAGEMENT PLAN – DRAFT
Figures
Page
ES-1 Collier County Watersheds and Estuaries ........................................................................................ES-2
ES-2 Surface Water Budget .......................................................................................................................ES-3
ES-3 Water Table Aquifer Average Annual Groundwater Fluctuation....................................................ES-5
ES-4 Water Table Aquifer (Prolonged Dry Season) Drawdown with 10 percent Increase in Withdrawals .......................................................................................................................................ES-5
ES-5 Hydrology assessment (pre-development vs. existing conditions) .................................................ES-6
ES-6 Wet season fresh water surplus/deficit (inches) in Collier County estuaries .................................ES-6
ES-7 Dry season fresh water surplus/deficit (inches) in Collier County estuaries ..................................ES-7
ES-8 Wiggins Pass Habitat ..........................................................................................................................ES-9
ES-9 Naples Bay Habitat .............................................................................................................................ES-9
ES-10 Rookery Bay Habitat ....................................................................................................................... ES-10
ES-11 Ten Thousand Islands Mangrove ................................................................................................... ES-10
ES-12 Mapped scores for the water table aquifer .................................................................................. ES-11
1-1 Collier County Watersheds and Estuaries ............................................................................................. 2
1-2 Surface Water Flow Schematic .............................................................................................................. 5
1-3 Average Water Year (2003–2007) Water Budget ................................................................................. 6
1-4 Average Water Year Budget – Cocohatchee-Corkscrew Watershed ................................................... 7
1-5 Average Water Year Budget – Golden Gate-Naples Bay Watershed .................................................. 7
1-6 Average Annual Water Budget – Rookery Bay Watershed .................................................................. 7
1-7 Average Water Year Budget – Faka Union, Okaloacoochee/SR 29, and Fakahatchee Watersheds ............................................................................................................................................. 8
1-8 Relationship of Base flow and (Head – Stage) Elevation Difference .................................................... 8
1-9 WBIDs Impaired for Dissolved Oxygen .................................................................................................. 9
1-10 Collier County Nutrient Impairment .................................................................................................... 10
1-11 Conceptual Groundwater Budget ........................................................................................................ 14
1-12 Well Head Protection Zones and Public Supply Wells ........................................................................ 15
1-13 Urban Water Supply Distribution ......................................................................................................... 15
1-14 Agricultural and Golf Course Irrigated Areas ....................................................................................... 15
1-15 Water Table Aquifer Average Annual Groundwater Head Elevation ................................................ 19
1-16 Water Table Aquifer Average Annual Groundwater Fluctuation....................................................... 19
1-17 Lower Tamiami Aquifer Average Annual Groundwater Head Elevation ........................................... 19
1-18 Lower Tamiami Aquifer Average Annual Groundwater Fluctuation ................................................. 19
1-19 Sandstone Aquifer Average Annual Groundwater Head Elevation ................................................... 20
1-20 Sandstone Aquifer Average Annual Groundwater Fluctuation.......................................................... 20
1-21 Mid-Hawthorn Aquifer Average Annual Groundwater Head Elevation ............................................ 20
1-22 Mid-Hawthorn Aquifer Average Annual Groundwater Fluctuation .................................................. 20
1-23 Water Table Aquifer Average Annual Groundwater Head Elevation Difference (ECM-NSM) ...................................................................................................................................................... 21

Contents
Figures, cont’d.
Page
V O L 1 COLLIER COUNTY WATERSHED
P A G E iv MANAGEMENT PLAN – DRAFT
1-24 Lower Tamiami Aquifer Average Annual Groundwater Head Elevation Difference (ECM-NSM) ...................................................................................................................................................... 21
1-25 Sandstone Aquifer Average Annual Groundwater Head Elevation Difference (ECM-NSM) ............ 22
1-26 Water Table Aquifer Average Increase in Drawdown with 10% Increase in Groundwater Withdrawal ............................................................................................................................................ 22
1-27 Lower Tamiami Aquifer Average Increase in Drawdown with 10% Increase in Groundwater Withdrawal .................................................................................................................... 23
1-28 Sandstone Aquifer Average Increase in Drawdown with 10% Increase in Groundwater Withdrawal ............................................................................................................................................ 23
1-29 Mid Hawthorn Aquifer Average Increase in Drawdown with 10% Increase in Groundwater Withdrawal .................................................................................................................... 23
1-30 Water Table Aquifer Average Driest Dry Season Increase in Drawdown with 10% Increase in Groundwater Withdrawal ................................................................................................................ 23
1-31 Lower Tamiami Aquifer Average Increase in Drawdown with 10% Increase in Groundwater Withdrawal .................................................................................................................... 24
1-32 Sandstone Aquifer Average Increase in Drawdown with 10% Increase in Groundwater Withdrawal ............................................................................................................................................ 24
1-33 Mid Hawthorn Aquifer Average Increase in Drawdown with 10% Increase in Groundwater Withdrawal .................................................................................................................... 24
1-34 Dissolved Oxygen Concentration Interpolation .................................................................................. 25
1-35 Total Nitrogen Concentration Interpolation ....................................................................................... 26
1-36 Total Phosphorus Concentration Interpolation .................................................................................. 27
1-37 Model-Wide Overview, Land Use and Land Cover Changes from Pre-Development to 2007 ....................................................................................................................................................... 30
1-38 Vegetation, Functional Assessment ..................................................................................................... 32
1-39 Combined Hydrology Score, Functional Assessment ......................................................................... 33
1-40 Landscape Suitability Index (LSI) .......................................................................................................... 33
1-41 Resource Protective Lands that are not currently protected ............................................................. 34
1-42 Flow and Salinity Monitoring Stations in Collier County ..................................................................... 36
1-43 Wet season runoff (inches) in Collier County estuaries ...................................................................... 36
1-44 Dry season runoff (inches) in Collier County estuaries ....................................................................... 36
1-45 Collier County Estuaries and Major Features ...................................................................................... 40
1-46 Wiggins Pass Habitat ............................................................................................................................. 43
1-47 Naples Bay Habitat ................................................................................................................................ 44
1-48 Rookery Bay Habitat ............................................................................................................................. 44
1-49 Ten Thousand Islands Mangrove ......................................................................................................... 44
2-1 Total Nitrogen Pollutant Load Scores .................................................................................................. 52
2-2 Total Suspended Solids Pollutant Load Scores .................................................................................... 52
2-3 Total Phosphorus Pollutant Load Scores ............................................................................................. 52
2-4 BOD-5 Pollutant Load Scores ............................................................................................................... 53

Contents
Figures, cont’d.
Page
V O L 1 COLLIER COUNTY WATERSHED
P A G E v MANAGEMENT PLAN – DRAFT
2-5 Copper (Cu) Pollutant Load Scores ...................................................................................................... 53
2-6 Lead (Pb) Pollutant Load Scores ........................................................................................................... 53
2-7 Zinc (Zn) Pollutant Load Scores ............................................................................................................ 53
2-8 Conceptual Aquifer with Performance Score = 4.5 ............................................................................. 56
2-9 Surficial Aquifer Average Dry Season Performance Score .................................................................. 57
2-10 Lower Tamiami Aquifer Average Dry Season Performance Score ..................................................... 57
2-11 Sandstone Aquifer Average Dry Season Performance Score ............................................................. 57

Contents
V O L 1 COLLIER COUNTY WATERSHED
PAGE vi MANAGEMENT PLAN – DRAFT
Tables
ES-1 Average Functional Values for Non-Urban Lands, by Watershed ...................................................ES-8
ES-2 Discharge to Estuary Performance Scores ........................................................................................ES-8
ES-3 Nutrient Pollution Load Performance Scores ................................................................................ ES-11
ES-4 Aquifer Conditions Performance Scores ........................................................................................ ES-12
ES-5 Normalized Performance Scores and B/C Ratios for the Four Performance Criteria ................. ES-13
ES-6 Cumulative Benefit (Performance Scores) and Cost of Project .................................................... ES-14
ES-7 Recommended Non-Structural Initiatives ..................................................................................... ES-14
1-1 Predicted Surface Water Pollutant Loads ............................................................................................ 12
1-2 Annual Water Year and Seasonal Budgets .......................................................................................... 17
1-3 Predicted Groundwater Pollutant Loads ............................................................................................. 26
1-4 Average Functional Values of Non-Urban Lands, by Watershed ....................................................... 32
2-1 Average Resource Protection Scores of Non-Urban Lands, by Watershed ....................................... 48
2-2 Discharge to Estuary Performance Scores ........................................................................................... 50
2-3 Pollutant Load Scores and Ratios ......................................................................................................... 51
2-4 Pollutant Load Performance Measures, by WBID and Watershed .................................................... 54
2-5 Performance Scores for each Aquifer by WBID .................................................................................. 56

V O L 1 COLLIER COUNTY WATERSHED
PAGE vii MANAGEMENT PLAN – DRAFT
Acronyms and Abbreviations
ACSC Area of Critical State Concern
ACSC-ST Area of Critical State Concern – Special Treatment
BCB Big Cypress Basin
BCC Board of County Commissioners
BCE Black, Crow, and Eidsness
BCNP Big Cypress National Preserve
BMAP Basin Management Action Plan
BMP Best Management Practices
BOD-5 5-Day Biochemical Oxygen Demand
CC Cocohatchee-Corkscrew Watershed
CCME Conservation Coastal Management Element
CCPC Collier County Planning Commission
CCWMP Collier County Watershed Management Plan
CDU Community Development Unit
CERP Comprehensive Everglades Restoration Plan
cfs Cubic feet per second
CN Curve Number
Cu Copper
DCIA Directly Connected Impervious Area
DEM Digital Elevation Model
DO Dissolved Oxygen
EAC Environmental Advisory Council
ECM Existing Conditions Model
EDDMapS Early Detection and Distribution Mapping System
EMC Event Mean Concentration
ENP Everglades National Park
EPA Environmental Protection Agency
ERD Environmental Research and Design
ERP Environmental Resource Permit
ERU Equivalent Residential Unit
ET Evapotranspiration
F.A.C. Florida Administrative Code
FAS Floridan Aquifer System
FCM Future Conditions Model
FDEP Florida Department of Environmental Protection
Acronyms and Abbreviations
V O L 1 COLLIER COUNTY WATERSHED
P A G E viii MANAGEMENT PLAN – DRAFT
FDoH Florida Department of Health
Fe Iron
FLInv Florida Invasive Plants Geodatabase
FLUCCS Florida Land Use, Land Cover Classification System
FLUE Future Land Use Element
FLUM Future Land Use Map
FNAI Florida Natural Areas Inventory
FPLOS Flood Protection Level of Service
FRESP Florida Ranchlands Environmental Services Project
FUFHOK Faka Union, Fakahatchee, and Okaloacoochee-SR29 Watersheds
FWRI Fish and Wildlife Research Institute
GGAMP Golden Gate Area Master Plan
GGNB Golden Gate-Naples Bay Watershed
GIS Geographic Information Systems
GMP Growth Management Plan
H&H Hydraulic and Hydrologic
HOA Homeowners Association
IAS Intermediate Aquifer System
IWR Impaired Waters Rule
JEI Janicki Environmental Inc.
LASIP Lely Area Stormwater Improvement Plan
LDC Land Development Code
LID Low Impact Development
LSI Landscape Suitability Index
MAL Minimum Aquifer Level
mg/l milligrams/liter
MPN Most Probable Number
MSL Mean Sea Level
MSTU Municipal Services Taxing Unit
NAVD North American Vertical Datum
NEXRAD High Resolution Radar
NGGE Northern Golden Gates Estates
NGGEFRA North Golden Gate Estates Flowway Restoration Area
NGGEFRP North Golden Gate Estates Flowway Restoration Program
NGVD National Geodetic Vertical Datum
NOx Nitrate + Nitrite
NSG Natural Systems Group

Acronyms and Abbreviations
V O L 1 COLLIER COUNTY WATERSHED
P A G E ix MANAGEMENT PLAN – DRAFT
NSM Natural Systems Model
OFW Outstanding Florida Water
OL Overland
Pb Lead
PBS&J Post Buckley Schuh and Jernigan
PCU Platinum Cobalt Units
PDVM Pre-Development Vegetation Map
PIR Project Implementation Report
PSRP Picayune Strand Restoration Project
PUD Planned Unit Development
RB Rookery Bay Watershed
RFMU Rural Fringe Mixed Use
RIDS Regional Irrigation Distribution System
RLSA Rural Lands Stewardship Area
ROMA Regional Offsite Mitigation Area
RSF Residential Single Family
RWCA Recyclable Water Containment Areas
SAS Surficial Aquifer System
SCS Soil Conservation Service
SFWMD South Florida Water Management District
SGGE Southern Golden Gate Estates
SOW Scope of Work
S.R. State Road
ST Special Treatment
SWFFS Southwest Florida Feasibility Study
SWIM Surface Water Improvement and Management
SZ Saturated Zone
TDR Transfer of Development Rights
TMDL Total Maximum Daily Load
TN Total Nitrogen
TKN Total Kjeldahl Nitrogen
TM Technical Memorandum
TP Total Phosphorus
TSS Total Suspended Solids
TTI Ten Thousand Islands
ug/l micrograms/liter
UMAM Uniform Mitigation Assessment Method

Acronyms and Abbreviations
V O L 1 COLLIER COUNTY WATERSHED
P A G E x MANAGEMENT PLAN – DRAFT
URF Urban Residential Fringe
USACE United States Army Corps of Engineers
USDA United States Department of Agriculture
USGS United States Geologic Survey
UZ Unsaturated Zone
WBID Water body Identification Number
WMD Water Management District
WMPs Watershed Management Plans
Zn Zinc
V O L 1 COLLIER COUNTY WATERSHED
PAGE ES-1 MANAGEMENT PLAN – DRAFT
Executive Summary
The Collier County Watershed Management Plan
(CCWMP) has been developed using an integrated
water resources approach to balance water needs
of both the human and natural system
environments in the County’s watersheds and
estuaries. One of the key features of this approach
is that it takes advantage of opportunities for
restoring the natural ability of the landscape to
benefit the human environment and protect the
water quality, water quantity, and natural systems
in the County.
Directive
The CCWMP was prepared to address protection of
the County's estuarine and wetland systems,
consistent with Florida Statute (Subsection
163.3177(5)(d)). Applicable Elements of the Collier
County's Growth Management Plan (GMP)
addressed by the CCWMP include Conservation
and Coastal Management and Drainage. The
development of WMPs is specifically called out
under Goal 2 of the Conservation and Coastal
Management Element, Protection of Surface and
Estuarine Water Resources. In addition, goals of
the CCWMP are to help meet levels of service for
flood protection, as well as sustainability of future
water supplies for the citizens of Collier County.
Background and Purpose
Under pre-development conditions, surface waters
flowed through wetlands in Collier County and into
the receiving estuaries Rookery Bay, Ten Thousand
Island, Naples Bay and Wiggins Pass estuaries.
Originally most of the land drained towards Ten
Thousand Island and Rookery Bay. However,
intense development that has occurred in Collier
County over the past 70 years, including the
extensive canal construction that began in south
Florida in the 1940s, has substantially changed the
drainage patterns. For example, the Golden Gate
Canal network that was constructed in the 1960s
more than doubled the size of the Naples Bay
watershed and reduced by that same amount the
drainage area to Rookery Bay.
Growth in Collier County has continued in recent
years. According to the 2010 Census data,
population increased by about 27 percent between
2000 and 2009. As development continues, the
risk of impacting the natural system will increase.
In addition, external factors such as sea level rise
will result in further environmental pressures.
Drainage canals and urbanization have altered
regional surface and groundwater flow patterns,
lowered groundwater levels, increased freshwater
discharges to estuaries, and drained wetlands.
Associated urbanization and coastal development
displaced native habitats, increased surface water
discharges, reduced aquifer recharge, and
increased pollutant loads to estuaries. As a result,
what was historically a regional watershed has
become multiple, artificially created watersheds.
Therefore, restoring regional function via a County-
wide watershed management approach is critical
to restoring historical functions that allow the
County to manage the resources for both human
and natural environmental needs.
Development of the CCWMP started with an
evaluation of the current conditions in the study
area in terms of surface and groundwater quantity
and quality, as well as the natural system. These
conditions were then compared to pre-
development by way of performance measures.
The performance measures were also used to later
evaluate proposed recommendations for
management actions that will improve the volume
and timing of flows to the estuaries, reduce
pollutant loads, increase groundwater recharge,
and restore natural systems, to the extent possible,
in the County. Recommendations were developed
to:
Restore historical water quantity and
estuarine discharges
Improve water quality within the watersheds
and estuaries
Address flood control and water supply issues
Executive Summary
V O L 1 COLLIER COUNTY WATERSHED
PAGE ES-2 MANAGEMENT PLAN – DRAFT
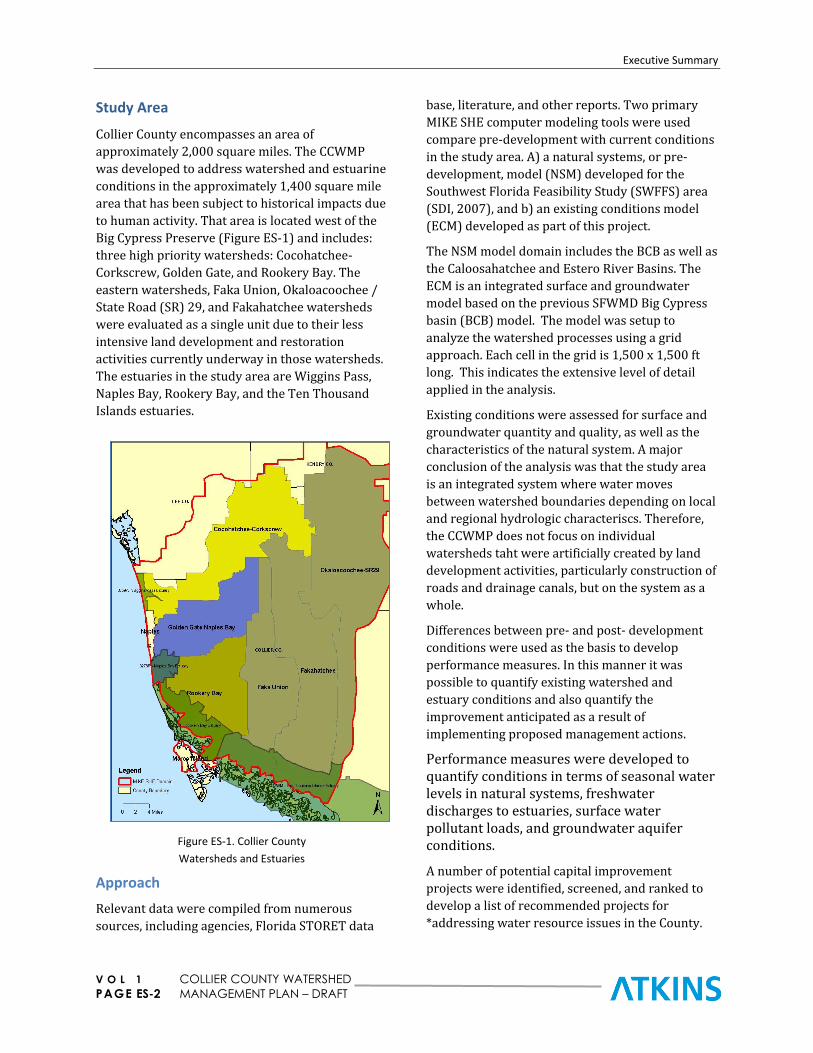
Study Area
Collier County encompasses an area of
approximately 2,000 square miles. The CCWMP
was developed to address watershed and estuarine
conditions in the approximately 1,400 square mile
area that has been subject to historical impacts due
to human activity. That area is located west of the
Big Cypress Preserve (Figure ES-1) and includes:
three high priority watersheds: Cocohatchee-
Corkscrew, Golden Gate, and Rookery Bay. The
eastern watersheds, Faka Union, Okaloacoochee /
State Road (SR) 29, and Fakahatchee watersheds
were evaluated as a single unit due to their less
intensive land development and restoration
activities currently underway in those watersheds.
The estuaries in the study area are Wiggins Pass,
Naples Bay, Rookery Bay, and the Ten Thousand
Islands estuaries.
Figure ES-1. Collier County
Watersheds and Estuaries
Approach
Relevant data were compiled from numerous
sources, including agencies, Florida STORET data
base, literature, and other reports. Two primary
MIKE SHE computer modeling tools were used
compare pre-development with current conditions
in the study area. A) a natural systems, or pre-
development, model (NSM) developed for the
Southwest Florida Feasibility Study (SWFFS) area
(SDI, 2007), and b) an existing conditions model
(ECM) developed as part of this project.
The NSM model domain includes the BCB as well as
the Caloosahatchee and Estero River Basins. The
ECM is an integrated surface and groundwater
model based on the previous SFWMD Big Cypress
basin (BCB) model. The model was setup to
analyze the watershed processes using a grid
approach. Each cell in the grid is 1,500 x 1,500 ft
long. This indicates the extensive level of detail
applied in the analysis.
Existing conditions were assessed for surface and
groundwater quantity and quality, as well as the
characteristics of the natural system. A major
conclusion of the analysis was that the study area
is an integrated system where water moves
between watershed boundaries depending on local
and regional hydrologic characteriscs. Therefore,
the CCWMP does not focus on individual
watersheds taht were artificially created by land
development activities, particularly construction of
roads and drainage canals, but on the system as a
whole.
Differences between pre- and post- development
conditions were used as the basis to develop
performance measures. In this manner it was
possible to quantify existing watershed and
estuary conditions and also quantify the
improvement anticipated as a result of
implementing proposed management actions.
Performance measures were developed to quantify conditions in terms of seasonal water levels in natural systems, freshwater discharges to estuaries, surface water pollutant loads, and groundwater aquifer conditions.
A number of potential capital improvement
projects were identified, screened, and ranked to
develop a list of recommended projects for
*addressing water resource issues in the County.
Executive Summary
V O L 1 COLLIER COUNTY WATERSHED
PAGE ES-3 MANAGEMENT PLAN – DRAFT
Rankings are based on the anticipated
improvements in the system due to proposed
projects. A benefit/cost analysis was also
completed, for which benefit=improvement and
cost=construction cost. Priority project are
recommended and described for each watershed.
A major finding of the analysis was that the
proposed structural projects will provide
improvements from existing conditions, but will
not be enough to reach restoration goals. They
must be complemented by non-structural/ policy
actions. A total of thirteen non-structural initiatives
are recommended for implementation. They are
primarily incentive-based and cost neutral. They
range from suggested changes to the land
development code to establishment of a
watershed-specific mitigation bank. These actions
are summarized later in this document and
described in detail as part of the WMP
recommendations.
Element 1: Existing Conditions –
Watersheds
The canals have increased the freshwater
discharges to the Naples Bay estuary by as much as
10 times compared with pre-development
conditions and altered the timing and volume of
flows to the other estuaries. Development and
altered surface water flows have led to a dramatic
decline in natural wetland systems in the County,
including nearly 70 percent of the wetlands in the
Golden Gate – Naples Bay watershed.
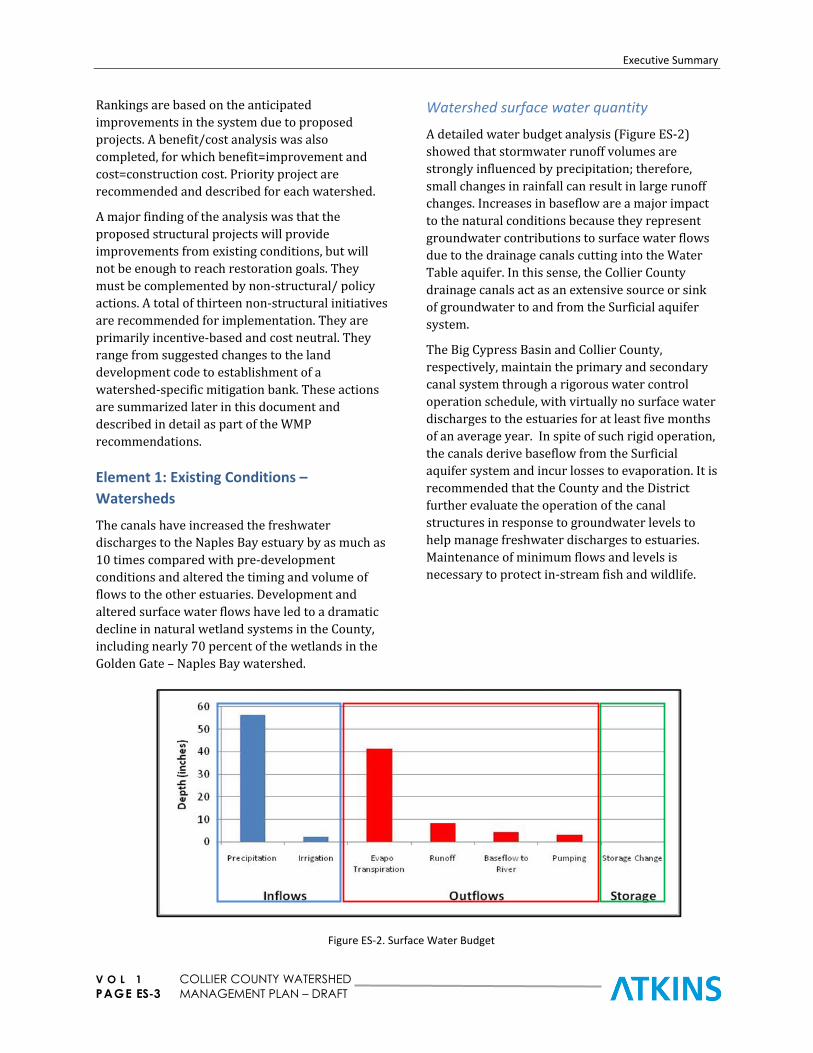
Watershed surface water quantity
A detailed water budget analysis (Figure ES-2)
showed that stormwater runoff volumes are
strongly influenced by precipitation; therefore,
small changes in rainfall can result in large runoff
changes. Increases in baseflow are a major impact
to the natural conditions because they represent
groundwater contributions to surface water flows
due to the drainage canals cutting into the Water
Table aquifer. In this sense, the Collier County
drainage canals act as an extensive source or sink
of groundwater to and from the Surficial aquifer
system.
The Big Cypress Basin and Collier County,
respectively, maintain the primary and secondary
canal system through a rigorous water control
operation schedule, with virtually no surface water
discharges to the estuaries for at least five months
of an average year. In spite of such rigid operation,
the canals derive baseflow from the Surficial
aquifer system and incur losses to evaporation. It is
recommended that the County and the District
further evaluate the operation of the canal
structures in response to groundwater levels to
help manage freshwater discharges to estuaries.
Maintenance of minimum flows and levels is
necessary to protect in-stream fish and wildlife.
Figure ES-2. Surface Water Budget
Executive Summary
V O L 1 COLLIER COUNTY WATERSHED
PAGE ES-4 MANAGEMENT PLAN – DRAFT
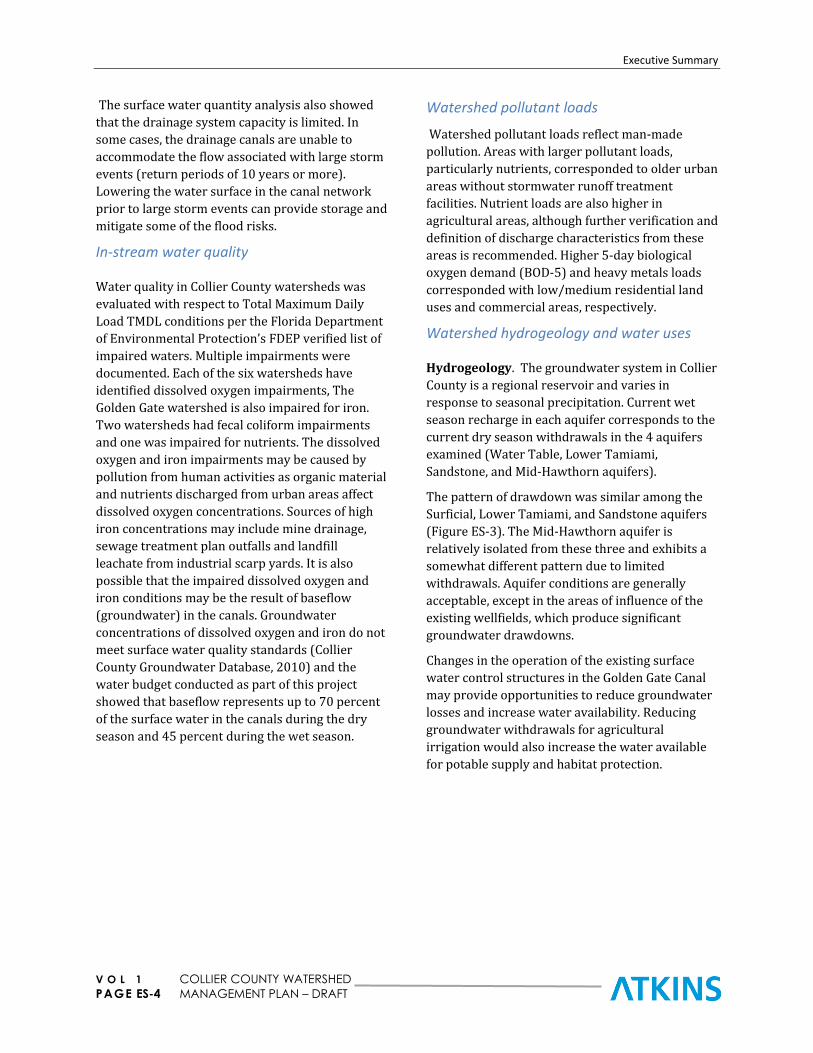
The surface water quantity analysis also showed
that the drainage system capacity is limited. In
some cases, the drainage canals are unable to
accommodate the flow associated with large storm
events (return periods of 10 years or more).
Lowering the water surface in the canal network
prior to large storm events can provide storage and
mitigate some of the flood risks.
In-stream water quality
Water quality in Collier County watersheds was
evaluated with respect to Total Maximum Daily
Load TMDL conditions per the Florida Department
of Environmental Protection’s FDEP verified list of
impaired waters. Multiple impairments were
documented. Each of the six watersheds have
identified dissolved oxygen impairments, The
Golden Gate watershed is also impaired for iron.
Two watersheds had fecal coliform impairments
and one was impaired for nutrients. The dissolved
oxygen and iron impairments may be caused by
pollution from human activities as organic material
and nutrients discharged from urban areas affect
dissolved oxygen concentrations. Sources of high
iron concentrations may include mine drainage,
sewage treatment plan outfalls and landfill
leachate from industrial scarp yards. It is also
possible that the impaired dissolved oxygen and
iron conditions may be the result of baseflow
(groundwater) in the canals. Groundwater
concentrations of dissolved oxygen and iron do not
meet surface water quality standards (Collier
County Groundwater Database, 2010) and the
water budget conducted as part of this project
showed that baseflow represents up to 70 percent
of the surface water in the canals during the dry
season and 45 percent during the wet season.
Watershed pollutant loads
Watershed pollutant loads reflect man-made
pollution. Areas with larger pollutant loads,
particularly nutrients, corresponded to older urban
areas without stormwater runoff treatment
facilities. Nutrient loads are also higher in
agricultural areas, although further verification and
definition of discharge characteristics from these
areas is recommended. Higher 5-day biological
oxygen demand (BOD-5) and heavy metals loads
corresponded with low/medium residential land
uses and commercial areas, respectively.
Watershed hydrogeology and water uses
Hydrogeology. The groundwater system in Collier
County is a regional reservoir and varies in
response to seasonal precipitation. Current wet
season recharge in each aquifer corresponds to the
current dry season withdrawals in the 4 aquifers
examined (Water Table, Lower Tamiami,
Sandstone, and Mid-Hawthorn aquifers).
The pattern of drawdown was similar among the
Surficial, Lower Tamiami, and Sandstone aquifers
(Figure ES-3). The Mid-Hawthorn aquifer is
relatively isolated from these three and exhibits a
somewhat different pattern due to limited
withdrawals. Aquifer conditions are generally
acceptable, except in the areas of influence of the
existing wellfields, which produce significant
groundwater drawdowns.
Changes in the operation of the existing surface
water control structures in the Golden Gate Canal
may provide opportunities to reduce groundwater
losses and increase water availability. Reducing
groundwater withdrawals for agricultural
irrigation would also increase the water available
for potable supply and habitat protection.
Executive Summary
V O L 1 COLLIER COUNTY WATERSHED
PAGE ES-5 MANAGEMENT PLAN – DRAFT
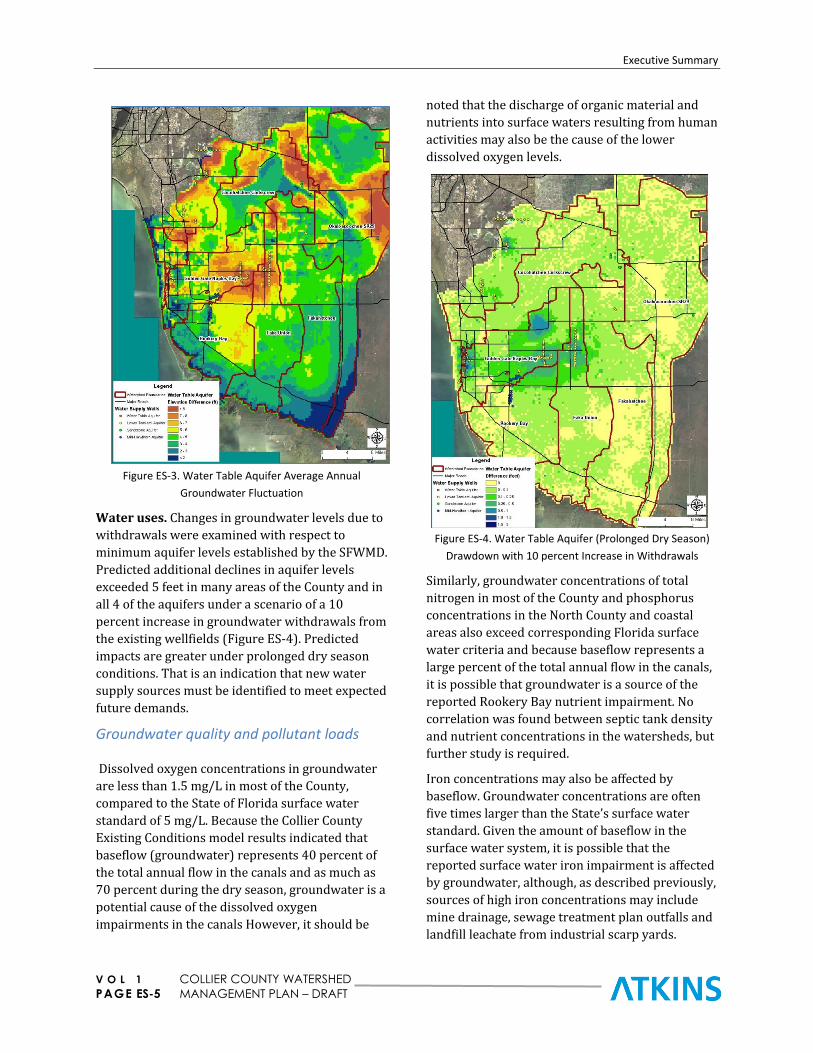
Figure ES-3. Water Table Aquifer Average Annual
Groundwater Fluctuation
Water uses. Changes in groundwater levels due to
withdrawals were examined with respect to
minimum aquifer levels established by the SFWMD.
Predicted additional declines in aquifer levels
exceeded 5 feet in many areas of the County and in
all 4 of the aquifers under a scenario of a 10
percent increase in groundwater withdrawals from
the existing wellfields (Figure ES-4). Predicted
impacts are greater under prolonged dry season
conditions. That is an indication that new water
supply sources must be identified to meet expected
future demands.
Groundwater quality and pollutant loads
Dissolved oxygen concentrations in groundwater
are less than 1.5 mg/L in most of the County,
compared to the State of Florida surface water
standard of 5 mg/L. Because the Collier County
Existing Conditions model results indicated that
baseflow (groundwater) represents 40 percent of
the total annual flow in the canals and as much as
70 percent during the dry season, groundwater is a
potential cause of the dissolved oxygen
impairments in the canals However, it should be
noted that the discharge of organic material and
nutrients into surface waters resulting from human
activities may also be the cause of the lower
dissolved oxygen levels.
Figure ES-4. Water Table Aquifer (Prolonged Dry Season)
Drawdown with 10 percent Increase in Withdrawals
Similarly, groundwater concentrations of total
nitrogen in most of the County and phosphorus
concentrations in the North County and coastal
areas also exceed corresponding Florida surface
water criteria and because baseflow represents a
large percent of the total annual flow in the canals,
it is possible that groundwater is a source of the
reported Rookery Bay nutrient impairment. No
correlation was found between septic tank density
and nutrient concentrations in the watersheds, but
further study is required.
Iron concentrations may also be affected by
baseflow. Groundwater concentrations are often
five times larger than the State’s surface water
standard. Given the amount of baseflow in the
surface water system, it is possible that the
reported surface water iron impairment is affected
by groundwater, although, as described previously,
sources of high iron concentrations may include
mine drainage, sewage treatment plan outfalls and
landfill leachate from industrial scarp yards.

Executive Summary
V O L 1 COLLIER COUNTY WATERSHED
PAGE ES-6 MANAGEMENT PLAN – DRAFT
High copper concentrations in surface waters, on
the other hand, are likely the result of human
activities. No groundwater impacts were identified.
Natural systems
A landscape-level functional assessment method
(modified from Florida’s Unified Mitigation
Assessment Method) was used to assess, and
assign value to, existing natural systems conditions
in the watersheds in Collier County. Measures used
in the assessment included landscape suitability
index (LSI), vegetation, and hydrology. Figure ES-5
shows the results of the hydrology assessment. In
general, the combined Faka Union, Okaloacoochee/
SR29, and Fakahatchee watersheds exhibited the
highest functional values (the least change from
pre-development) when compared with the other
watersheds. Measured functional values were
lower in the Rookery Bay and Cocohatchee-
Corkscrew watersheds, and least in the Golden
Gate-Naples watershed. These scores were also
used as performance measures for evaluating
potential improvement projects.
The functional assessment analysis also provided a
means of identifying resource protective lands that
are not currently included in the County’s or the
SFWMD’s preserved lands and supportive
agricultural lands programs. Those resource
protective lands were identified via consideration
of LSI and vegetation scores.
Element 2, Existing Conditions –
Estuaries
Volume and timing of freshwater flows
Figures ES-6 and ES-7 (red bars) show the fresh
water surplus /deficit entering the estuaries during
the wet and dry seasons compared to the natural
system based on ECM and NSM comparisons.
Excess wet season runoff under existing conditions
(ECM), compared with pre-development (NSM)
conditions is the primary issue in the Wiggins Pass,
Naples Bay, and Ten Thousand Islands estuaries.
For the Rookery Bay Estuary, the primary issue
appears to be the timing of flow to the estuary and
is due to fresh water surplus during the wet season
and deficit during the dry season. The ECM and
NSM comparisons were further verified by
developing a model based on measured salinity at
the estuaries. Salinity model results (green bars)
are consistent with differences measured by
comparing pre- and post- development conditions.
Figure ES-5. Hydrology Assessment
(pre-development vs. existing conditions)
Figure ES-6. Wet season fresh water surplus/deficit (inches)
in Collier County estuaries

Executive Summary
V O L 1 COLLIER COUNTY WATERSHED
PAGE ES-7 MANAGEMENT PLAN – DRAFT
Figure ES-7. Dry season fresh water surplus/deficit (inches)
in Collier County estuaries
Water quality of fresh water discharges
Collier County estuaries are typically impaired
(with respect to state water quality criteria) for
dissolved oxygen and fecal coliform bacteria.
Rookery Bay is also impaired for nutrients. The
causes of the impairments are not yet clearly
defined and require further analyses. It could be
attributed to nutrient discharges due to human
activity, groundwater influence, or impacts of
discharges from wetland systems. However, it is
noted that concentrations of dissolved oxygen and
fecal coliform bacteria in the discharges to the
estuaries do not meet water quality criteria.
Therefore, it can be concluded that watershed
conditions are likely impacting the receiving
estuaries.
Other parameters of impairment concern are iron
and copper. The water budget analysis conducted
based on the results of the existing conditions
computer model developed for this project
indicated that up to 70 percent of the average dry
season surface water flow in the canals is baseflow.
Therefore, iron concentrations appear to be
affected by the groundwater discharges to the
canal network, although other sources are possible.
High copper concentrations may be the result of
impacts of human activities such as the use of
copper sulfate as an algaecide to prevent algae
growth in ponds or leaching from boardwalks and
pilings that are constructed from pressure-treated
lumber.
Quality of receiving waters
Water quality impairments identified as part of the
FDEP TMDL program were confirmed with a single
exception: the Rookery Bay impairment for
chlorophyll-a were not confirmed and should be
addressed through further analyses to determine
the actual cause of the impairment.
The Wiggins Bay, Naples Bay, and Rookery Bay
estuaries were found to be impaired for dissolved
oxygen and fecal coliform. Wiggins Bay was also
found to be impaired for iron, and Naples Bay was
found to be impaired for iron and copper. The Ten
Thousand Islands estuary is not listed as, and was
not found to be, impaired for any water quality
parameter. Collier County should consider working
with the Florida Department of Environmental
Protection (FDEP) to determine the sources for the
identified impairments in Wiggins, Naples, and
Rookery Bay estuaries.
Coastal habitats
The reduction in areal extents of oyster bars,
seagrass beds, mangrove forests and salt marshes
in the estuaries is attributable to direct physical
loss associated with coastal development and the
associated changes in the hydrologic pattern of
fresh water discharges. Habitat loss in Wiggins
Pass and Naples Bay estuaries (Figures ES-8 and
ES-9) is substantially greater when compared with
the Ten Thousand Islands and Rookery Bay
estuaries (Figures ES-10 and ES-11), due to greater
urbanization in Wiggins Pass and Naples Bay
estuaries. In the Wiggins Pass estuary, the
combined acreage of salt marsh and mangroves has
declined by 29 percent over pre-development
conditions. Acres of salt marsh and mangrove have
declined by approximately 76 percent in Naples
Bay. In contrast, the less-impacted estuaries of
Rookery Bay and the Ten Thousand Islands have
experienced salt marsh and mangrove declines of
12 and 5 percent, respectively.
Element 3, Performance Measures
Performance measures were developed as a
baseline against which to measure the
improvement due to implementation of proposed
improvement projects. Performance measures

Executive Summary
V O L 1 COLLIER COUNTY WATERSHED
PAGE ES-8 MANAGEMENT PLAN – DRAFT
considered the natural system functional
assessment results, freshwater discharges to
estuaries, surface water pollutant loads, and
aquifer conditions. Functional assessment values
included vegetation, hydrology, and LSI. Water
quality was not explicitly considered as a
performance measure because it is a consequence
of pollutant loading. Conditions were scored on a
scale from 0 to 10, where ten represents the pre-
development condition. Details of the methodology
applied for establishing the Performance Measures
are provided in Volume 4 of this report.
The expected benefits of proposed projects
considered the increase in the performance
measure score compared to existing conditions.
More detailed descriptions of the evaluation of
recommended projects are provided later in this
Section.
Natural System Functional Assessment.
Functional assessment scores, or performance
measures, are presented in Table ES-1. Higher
scores indicate greater similarity to pre-
development conditions. Average scores are lower
in the Golden Gate-Naples Bay watershed due to
extensive canals systems and development and
indicate that hydrologic restoration may provide
the greatest opportunity for measurable
improvement in functional value in Collier County.
Hydrologic restoration is defined as the attempt to
replicate pre-development conditions.
Table ES-1. Average Functional Values (Performance Scores) for Non-Urban Lands, by Watershed
Watershed
Non-Urban Area
(acres) Vegetation
Score Hydrology
Score LSI
Score
Cocohatchee-Corkscrew
111,250 7 7 8
Golden Gate-Naples
36,630 5 6 6
Rookery Bay 83,100 8 6 9
Faka Union/ Okaloacoochee SR 29/ Fakahatchee
431,410 9 6 9
Freshwater discharges to estuaries
Performance measures (scores) are based on
comparisons of timing and volume of discharges to
estuaries for modeled pre- (NSM) and post- (ECM)
development conditions. Average monthly
discharge volumes from the NSM and ECM models
were used to define the baseline distribution and
total volume of flow from each watershed. Average
annual and seasonal scores for existing conditions
are shown in Table ES-2.
Table ES-2. Discharge to Estuary Performance Scores
Watershed Annual Score
Dry Season Score
Wet Season Score
Golden Gate-Naples Bay
1.6 1.9 1.0
Cocohatchee-Corkscrew
5.4 6.9 2.5
Rookery Bay 4.3 3.1 6.8
Faka Union, Okaloacoochee / SR 29, and Fakahatchee
5.6 7.4 2.0

V O L 1 COLLIER COUNTY WATERSHED
PAGE ES-9 MANAGEMENT PLAN – DRAFT
Figure ES-8. Wiggins Pass Habitat
Figure ES-9. Naples Bay Habitat

Executive Summary
V O L 1 COLLIER COUNTY WATERSHED
PAGE ES-10 MANAGEMENT PLAN – DRAFT
Figure ES-10. Rookery Bay Habitat
Figure ES-11. Ten Thousand Islands Mangrove
V O L 1 COLLIER COUNTY WATERSHED
PAGE ES-11 MANAGEMENT PLAN – DRAFT
Higher scores indicate greater similarity to pre-
development conditions. The Golden Gate –
Naples Bay watershed has the lowest annual score
of 1.6; this is due to the year round flow surplus
into Naples Bay. The scores for the Rookery Bay
indicate dry season freshwater deficits, likely due
to the reduced watershed caused by construction
of the Golden Gate Canal. During the wet season
the problem is a freshwater surplus likely due to
stormwater runoff from the Lely area and from
the agricultural lands in the southeastern
watershed.
Scores for the Cocohatchee-Corkscrew, and eastern watersheds suggest that the operational controls used to manage dry season flows are reasonably effective at reducing baseflow and therefore provide some control over potential impacts. This contributes to the higher scores during the dry season. Low wet season scores in all watersheds point to the effect of development on the natural drainage system.
Surface water pollutant loads
Pollutant load performance measures (scores) for
watersheds were based on data for each
individual cell in the ECM grid. The loads were
then aggregated by FDEP water body
identification numbers (WBIDs) and for each
watershed. Scores (Table ES-3) were calculated as
a function of pollutant loads relative to the land
use and the extent of runoff treatment existing
with each cell. Natural areas received a score of
10, whereas areas of high pollution potential
received scores lower than 3. Current scores
indicate that the WBIDs of most concern in terms
of nutrient loads are in the Cocohatchee –
Corkscrew and the Golden Gate – Naples Bay
watersheds, particularly the coastal segment of
Naples Bay and the Gordon River Extension. The
Golden Gate – Naples Bay watershed received the
lowest average pollutant loading scores for total
suspended solids, biochemical oxygen demand
and heavy metals because of the presence of areas
of urban development with no treatment. The
Lake Trafford WBID includes only the lake itself
and received a score of zero for nutrient loads
(area of extremely high load) due to the high
measured concentrations of nitrogen and
phosphorus. The scores do not reflect conditions
after the recent large-scale restoration projects.
Table ES-3. Nutrient Pollution Load Performance Scores
Watershed Total
Nitrogen Total
Phosphorus
Golden Gate-Naples Bay 1.0 3.0
Cocohatchee-Corkscrew 6.0 9.0
Rookery Bay 8.0 7.0
Faka Union, Okaloacoochee / SR 29, and Fakahatchee
5.0 4.0
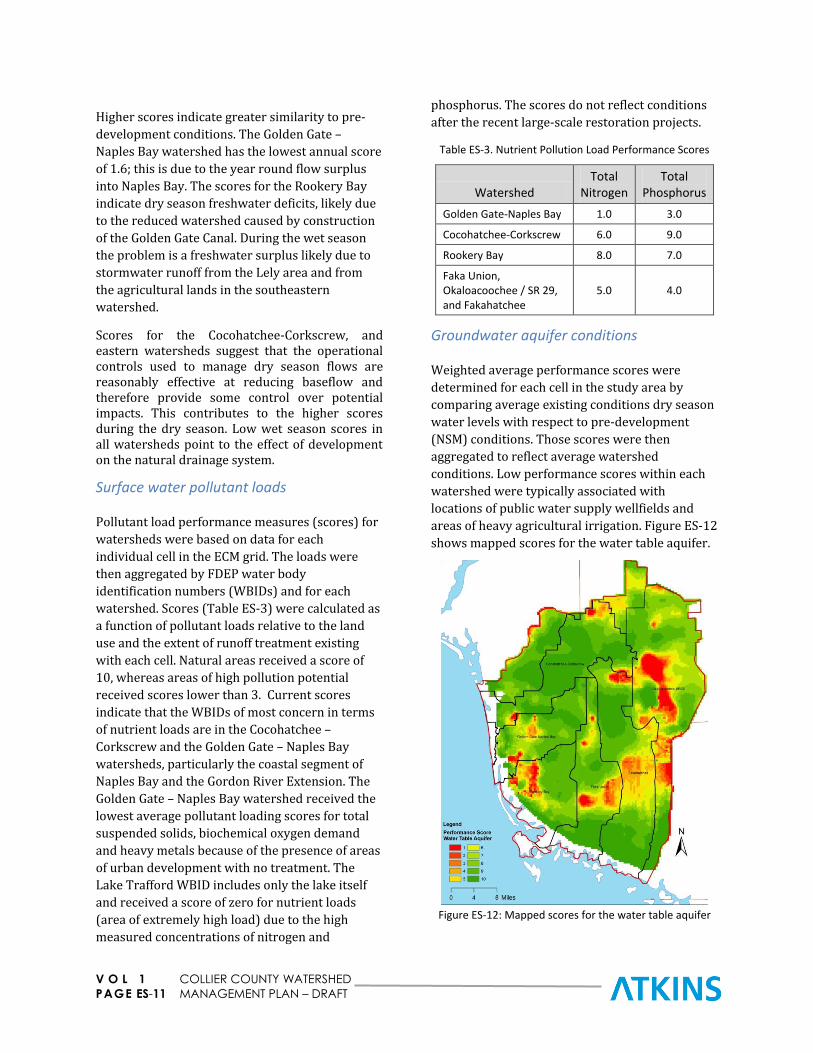
Groundwater aquifer conditions
Weighted average performance scores were
determined for each cell in the study area by
comparing average existing conditions dry season
water levels with respect to pre-development
(NSM) conditions. Those scores were then
aggregated to reflect average watershed
conditions. Low performance scores within each
watershed were typically associated with
locations of public water supply wellfields and
areas of heavy agricultural irrigation. Figure ES-12
shows mapped scores for the water table aquifer.
Figure ES-12: Mapped scores for the water table aquifer
Executive Summary
V O L 1 COLLIER COUNTY WATERSHED
PAGE ES-12 MANAGEMENT PLAN – DRAFT
High scores (10) indicate relatively a small change
in dry season aquifer level condition when
compared with the NSM. Low scores (1) indicate
areas where aquifer levels are lower relative to
historic conditions because of the presence of
facilities that help meet agricultural and potable
water supply needs. Areas that score poorly
correspond generally to the locations of the public
water supply wellfields.
Table ES-4 shows average scores by watershed.
Those average scores do not adequately represent
problem areas at specific locations within each
watershed.
Table ES-4. Aquifer Conditions Performance Scores
Watershed Water Table
Lower Tamiami Sandstone
Golden Gate-Naples Bay
9.4 9.5 9.6
Cocohatchee-Corkscrew
8.9 9.3 9.8
Rookery Bay 8.7 9.3 9.9
Faka Union, Okaloacoochee / SR 29, and Fakahatchee
8.2 8.5 9.3
Element 4, Analysis of Alternatives and
Recommendations
Structural and non-structural projects were
identified as potential solutions to existing and
anticipated water resource and natural systems
issues in Collier County based on analyses
completed as part of this study, as well as
previously completed studies.
Recommended Structural Improvements
The methodology to identify structural
recommendations included: a) an initial
identification of potential projects from the review
of previous studies including the Southwest
Florida Feasibility Study (SWFFS), or projects
identified as part of this study, b) a preliminary
screening of those projects based on permitting
and constructability issues, c) a more detailed
evaluation of the projects that passed the initial
screening based on a further assessment of
potential benefits, and d) final selection of
recommended projects.
A total of 105 projects were initially identified and
were subject to initial permitting and
constructability screening. A total of 27 were
selected for the more detailed evaluation that
included environmental benefits and preliminary
implementation costs. This final evaluation
reduced the number of feasible projects to 18. Of
those 18 projects, 10 were found feasible for
implementation through capital improvements by
the County or other agencies such as SFWMD. The
other eight (8) projects are located on private
property within Stewardship Sending Areas or
Flowway Stewardship Areas in the Fakahatchee
and Okaloacoochee- SR29 watersheds and should
be implemented through existing incentive
programs.
The 10 recommended capital projects were
evaluated against the four performance criteria
(seasonal water levels for natural systems,
freshwater discharges to estuaries, surface water
pollutant loads, and groundwater aquifer
conditions). Project benefits were measured by
the “lift,” or the improvement in performance
criteria anticipated as a result of the proposed
project. Weighting factors were integrated into the
calculation process to address both individual
watershed characteristics (e.g. watershed size)
and the relative importance of the watershed
issues (e.g. extent of development). The
performance “lifts” were then normalized to a 0 to
10 scale and summed for each of the criteria to
represent the expected project benefit.
The evaluation process also allowed for the
calculation of a benefit/cost (B/C) ratio associated
with each project by dividing the benefit score by
the estimated project construction cost. The B/C
ratio was used to prioritize project
implementation. Table ES-5 shows normalized
project benefit scores for each performance
criteria, estimated project construction costs, and
B/C ratios.
The final 10 projects, in order of B/C ratio, range
in cost from $96,000 to approximately $7 million

Executive Summary
V O L 1 COLLIER COUNTY WATERSHED
PAGE ES-13 MANAGEMENT PLAN – DRAFT
(Table ES-6). Priority projects, in order of
preferred implementation, are briefly outlined
below.
1. Northern Golden Gate Estates Flow-way
Restoration. The project ranks second in B/C,
but first in benefits. It has the most lift
anticipated for each of the 4 performance
criteria, but only minimal lift for the discharge
to estuary criteria.
2. North Belle Meade Spreader Swale project
provides lift with respect to each of the 4
performance criteria. The primary benefit is
lift in discharge to estuary in the Golden Gate
and Rookery Bay watersheds, based on an
anticipated 10 percent reduction in flows to
Naples Bay and increased flows to Rookery
Bay. Moderate lift is expected for the other 3
performance measures.
3. The Henderson Creek Diversion project is
considered the third most important project
to implement. It ranks fourth in the B/C ratio
and, similar to the North Belle Meade project,
it provides lift to estuary discharge for the
Golden Gate and Rookery Bay watersheds. It
does not provide lift to the 3 other
performance criteria.
4. The Corkscrew Regional Ecosystem
Watershed Restoration has the greatest B/C
ratio among the 10 projects. However, the
anticipated improvement in wetland
hydrology is local and does not address some
of the more important issues facing the
county. Consequently, the project was
assigned a lower priority for implementation
despite the higher B/C ratio.
Table ES-5. Normalized Performance Scores and B/C Ratios for the Four Performance Criteria
Project Name
Discharge to
Estuary Water Quality
Wetland Hydrology/
Habitat Ground-
water Total Score
Estimated Cost
($ millions)
Benefit-to-Cost Ratio
Corkscrew Regional Ecosystem Watershed
0.00 0.00 2.01 0.00 2.01 0.10 20.95
North Golden Gate Estates Flowway Restoration
0.05 10.00 10.00 10.00 30.09 2.37 12.71
North Belle Meade Spreader Swale
8.60 2.58 2.70 2.76 25.24 7.03 3.59
Henderson Creek Diversion 10.00 0.00 0.00 0.00 20.00 5.71 3.50
South I-75 Canal Spreader Swale
0.13 1.04 7.81 1.38 10.49 3.13 3.35
Wolfe Road Wetland Treatment System
0.00 0.11 0.00 3.34 3.45 1.42 2.44
Upper Golden Gate Estates Canal Weir Construction
0.00 0.00 0.00 0.67 0.67 0.55 1.21
Orange Tree Canal Control Structure Installation
0.00 0.00 0.00 0.67 0.67 0.55 1.21
Henderson Creek Off-Line Storage Reservoir
1.06 0.14 0.00 0.07 2.33 2.93 0.79
US HWY 41 Stormwater Treatment Area
0.00 0.03 0.12 0.00 0.15 0.54 0.28

Executive Summary
V O L 1 COLLIER COUNTY WATERSHED
PAGE ES-14 MANAGEMENT PLAN – DRAFT
Table ES-6. Cumulative Benefit (Performance Scores) and Cost of Project
Recommended non-structural (policy)
initiatives
An important finding of the existing conditions
analysis was that the recommended structural
watershed projects will provide only partial
restoration of the currently affected environment.
Fourteen non-structural initiatives or Best
Management Practices (BMPs) are recommended
to complement the structural improvements. The
non-structural initiatives focus on preserving and
protecting natural features of the landscape and
attempt to manage stormwater at its source. The
purpose was to formulate recommendations that
allow for the implementation of an
environmentally sustainable management
program that includes modifications to the
applicable regulatory framework such that they
can be used to guide land development into the
future. The recommended initiatives are listed in
Table ES-7 and briefly described below.
Low Impact Development Program (LID). This
initiative encompasses implementation of an LID
program that would apply to all new development
in Collier. LID aims at reducing pollutant loads
using micro-controls that either reduce the
volume of runoff or treat the runoff at the source
(i.e. pervious pavement, rain gardens, or created
wetlands). It is proposed that, in addition to the
current State and local permitting requirements,
new development include LID techniques to
remove the nutrient load associated with 50
percent of the basic ERP State requirement. It
should be noted that the local requirements is the
same as the current SFWMD requirement for
impaired water bodies.
Table ES-7. Recommended Non-Structural Initiatives
Low Impact Development (LID) Program
Stormwater Retrofit Program
Fee-Based Stormwater Utility Incentive Program
Allowable Maximum Site Discharges
Stormwater Runoff Volume Control
Verification of No Floodplain Impact
Flood Protection Levels of Service Criteria
Golden Gate Estates Transfer of Development Rights Program
Golden Gate Estates Watershed Mitigation Program
Modified Operations of Water Control Structures
Expanded Water Quality Monitoring Program
Additional Watershed Protection Programs
Stormwater Facilities Maintenance and Certification Program
Establish a Fertilizer Ordinance
The implementation of the proposed LID program
is expected to be cost neutral for the development
community. However, to promote program
implementation, various incentives are proposed
Dis
char
ge t
o E
stu
ary
Wat
er Q
ual
ity
Hyd
rolo
gy
Gro
un
dw
ater
Dis
char
ge t
o E
stu
ary
Wat
er Q
ual
ity
Hyd
rolo
gy
Gro
un
dw
ater
Dis
char
ge t
o E
stu
ary
Wat
er Q
ual
ity
Hyd
rolo
gy
Gro
un
dw
ater
Corkscrew Regional Ecosystem Watershed 0.000 0.000 0.031 0.000 $0.096
North Golden Gate Estates Flowway Restoration Project 0.010 0.682 0.118 0.002 $2.464
North Belle Meade Spreader Swale(1) 0.900 0.682 0.118 0.002 1.250 0.435 0.036 0.200 $9.490
South I-75 Canal Spreader Swale 1.289 0.523 0.088 0.250 $12.621
Henderson Creek Diversion (1) 1.345 0.682 0.118 0.002 2.124 $18.329
Wolfe Road Wetland Treatment System 1.345 0.690 0.118 0.007 $19.745
Henderson Creek Off-Line Storage Reservior 2.282 0.547 0.088 0.255 $22.674
Upper Golden Gate Estates Canal Weir Constuction 1.345 0.690 0.118 0.008 $23.226
Orange Tree Canal Control Structure Installation 1.345 0.690 0.118 0.009 $23.778
US HWY 41 Stormwater Treatment Area 2.282 0.553 0.089 0.255 $24.322
Total Benefit or Cost 0.000 0.000 0.031 0.000 1.345 0.690 0.118 0.009 2.282 0.553 0.089 0.255 $24.322
Rookery Bay
Project NameCumulative Cost
(Millions of
Dollars)
Cumulative Lift Cumulative Lift Cumulative Lift
Cocohatchee-Corkscrew Golden Gate - Naples Bay
Executive Summary
V O L 1 COLLIER COUNTY WATERSHED
PAGE ES-15 MANAGEMENT PLAN – DRAFT
through changes in the Land Development Code
(LDC).
Stormwater Retrofit Program. Protection of the
existing natural system will require establishment
of a retrofit program for existing developments.
The proposed initiative will focus on: a) retrofit of
public facilities, including parking lots in public
buildings such as the Government Center and
public schools, b) installation of local treatment
facilities in areas that lack runoff treatment and
where land acquisition makes traditional
approaches cost prohibited, and c) retrofit private
facilities by working with Municipal Services
Taxing Units (MSTUs). It is recommended that the
County establishes a program dedicated to
funding of stormwater retrofits. The program
would be funded using current stormwater utility
revenues and complemented by funds from
available state and federal grants. The projects to
be funded would be selected from a prioritized list
to be developed by County staff.
Fee-Based Stormwater Utility Incentive
Program. The existing stormwater utility funds
the stormwater program based on ad-valorem
property tax revenues. It is recommended that the
financing of the utility be changed to a fee-based
system that in turn is based on the volume of
runoff discharged from each property. All
properties within the County would be assessed.
However, the estimates of runoff discharges
would concentrate on large parcels that could
substantially benefit from a reduced fee. The goal
would be to maintain the same County revenue,
but using a different fee structure. The advantage
of the proposed fee structure is that it can be used
to provide incentives for both more
environmentally-friendly new development
design and retrofit of private property. An
economic feasibility study must be conducted to
establish a cost neutral fee schedule. To minimize
any initial economic impact on existing properties
that discharge large amounts of stormwater
runoff, a credit system that incentivizes
retrofitting should be considered.
Allowable Maximum Site Discharges. Specific
maximum allowable discharges have been
established in the GMP for five of the identified 28
stormwater basins in the County. The rest are
subject to a default value of 0.15 cfs/acre.
Computer model results indicated that many of
the drainage canal segments lack the conveyance
capacity to accommodate large storm events. To
reduce the risk of flooding, basin-specific
maximum discharges less than the default value
are recommended for 14 additional basins. The
recommended maximum allowable discharges by
basin are listed in Table 3-3 in the WMP Volume 3
report. The proposed maximum discharges should
apply to new development as part of the
development permit. This initiative is simply a re-
visiting of current requirements using the
available computer modeling tools.
Stormwater Runoff Volume Control. Changes in
discharge timing due to new development may
impact flood elevations downstream for large
storm events. In addition to the established
maximum allowable discharges, it is
recommended that the land development
regulations be updated to require post-
development volume mitigation not to exceed pre-
development conditions for the 25-year/24-hour
design storm event conditions. Analyses
conducted as part of the watershed management
plan development process have shown that this
recommendation would have basically no impact
on new development because the limiting
condition in terms of required site storage
capacity is the allowable maximum discharge
limit. The volume control requirement will be a
double check on potential impacts in the areas
downstream from a proposed development.

Executive Summary
V O L 1 COLLIER COUNTY WATERSHED
PAGE ES-16 MANAGEMENT PLAN – DRAFT
Verification of No Floodplain Impact. It is
critical that future development discharges do not
impact the extent of the FEMA regulatory
floodplain at any point along the canal network. It
is recommended that the County implement the
requirement that impacts resulting from large
development permits (e.g. 160 acres or larger) be
verified by using one of the currently available
regional computer models, such as the Tomasello
model developed by the County for floodplain
management purposes, or a version of the MIKE-
SHE model developed using a smaller grid size, i.e.
500 ft. Application of this initiative will require
changes to LDC Section 3.07.02 referencing
affected properties
Flood Protection Levels of Service (FPLOS)
Criteria. The existing FPLOS criteria are based on
the results of a single design storm event (return
period = 25-years and duration = 72-hours) and
do not allow county staff to prioritize drainage
improvement projects based on the type of road. It
is recommended that new criteria be establish
that consider both the type of road and the return
period of the storm. Some flooding would be
acceptable on minor roads during large events as
long as health and safety are not compromised.
Evacuation Routes would have the highest priority
and no flooding would be acceptable even for the
100-year return period event.
Golden Gate Estates Transfer of Development
Rights (TDR) Program It is recommended that
the County evaluates the feasibility of establishing
a TDR program in the North Golden Gate Estates
Flowway Restoration Area (NGGEFRA) located
between the Faka Union and Golden Gate Canals.
The program would be designed to provide
sufficient market attraction to not only accomplish
resource protection goals, but also to provide
enhanced incentives to promote development of
the Rural Villages in all or some of the established
Rural Fringe Mixed Use (RFMU) Receiving lands.
The TDR program would provide for the voluntary
severing of residential development rights from
the identified Sending lands and allow the transfer
of such rights to targeted Receiving lands, which
may be those currently identified in the existing
RFMU program. It is recommended that programs
be implemented to encourage aggregation of
smaller parcels into a larger development tract.
An oversight committee should be established to
develop the specifics of the program. The purpose
of the oversight committee will be to define the
relationship between the various County
programs and to ensure that the proposed TDR
program in the NGGE complements and enhances
the existing programs. The oversight committee
may elect to modify those existing programs to
address known deficiencies.
Golden Gate Estates Watershed Mitigation
Program. Regulations allow wetland impacts to
be mitigated either on-site, at a permitted
mitigation bank or at an authorized “regional
offsite mitigation area” (ROMA). There is no
ROMA within the Golden Gate – Naples Bay
watershed. However, ROMAs do exist within the
Cocohatchee – Corkscrew, Rookery Bay, and
Okaloacoochee – SR29 watersheds. It is
recommended that the County develop a
mitigation area within the Golden Gate – Naples
Bay and Faka Union watersheds to offset wetland
losses within the watershed. The lands required
for the establishment of the mitigation bank
would be located within the area considered for
the Golden Gate Estates TDR program to provide
another mechanism to finance the proposed North
Golden Gate Estates Flowway Restoration Plan.
Improved Operations of Water Control
Structures. The Big Cypress Basin and Collier
County respectively maintain the primary and
secondary canal system through a rigorous water
control operation schedule that limits the amount
of baseflow entering the canals. In spite of such
rigid operation, the canals will continue to derive
baseflow from the surficial aquifers and incur
losses to evaporation.
Results of the existing conditions model (ECM)
developed as part of this study indicate that
baseflow (groundwater) discharges entering the
drainage canal system contribute approximately
40 percent of the annual flow from the Golden
Gate Main Canal to Naples Bay. During the dry
season, as much as 70 percent of the discharge to
the estuary is predicted to come from
groundwater. It is recommended that Collier
County and the South Florida Water Management

Executive Summary
V O L 1 COLLIER COUNTY WATERSHED
PAGE ES-17 MANAGEMENT PLAN – DRAFT
District (SFWMD) work together to fully evaluate
opportunities to improve structure operations
within the physical limitations of the existing
structures to maintain the water surface in the
canals at an elevation that more closely matches
the water table elevation such that baseflow is
reduced.
Water Quality Monitoring Program. Multiple
agencies collect water quality data from surface
water and groundwater sampling locations. The
various agencies should coordinate their activities
so that the collected data are consistent for all
stations and can be applied for multiple purposes.
It would be beneficial if one agency were
responsible for collecting all data and sharing the
analytical results with the other agencies.
Implementation of a one-time wet weather
sampling program is also recommended to better
define pollutant loading contributions from
specific land uses, particularly agriculture.
Additional Watershed Protection Programs.
Several watershed protection programs are
recommended for implementation in various
areas identified as being valuable for resource
protection: a) land acquisition along the State
Road 29 corridor from I-75 to US 41, b) expansion
of the incentive-based Recyclable Water
Containment Area Programs by partnering with
the SFWMD to include agricultural lands in the
Rookery Bay watershed and those areas in Lee
and Hendry counties that flow into Collier County
watersheds, c) evaluation of the rural fringe
neutral lands programs to reclassify some areas as
Rural Fringe Sending Lands based on the
vegetative communities and preservation
standards required for Red Cockaded Woodpecker
protection, d) coordination with property owners
to ensure that resource protective lands within
the Rural Lands Stewardship Area (RLSA) are
added to the existing Stewardship Sending, or
Flowway Stewardship Areas.
Stormwater Facilities Maintenance and
Certification Program. Proper operation of
existing stormwater system, including the runoff
treatment facilities, is critical to safeguard water
quality. It is recommended that a certification
program be implemented to make sure that the
stormwater facilities continue to operate as
originally permitted. The objective is to be able to
implement remedial actions before water quality
in the receiving water bodies is impacted.
Conclusions
Canal construction and urban development in
Collier County have altered what were historically
regional surface and groundwater patterns,
resulting in multiple, artificially created
watersheds that have reduced water quality,
altered freshwater flows to estuaries, reduced
groundwater recharge, and altered natural
ecosystems.
The CCWMP provides an analysis of existing
conditions in the County with respect to changes
from pre-development conditions and provides
County-wide recommendations to:
Restore historical water quantity and
estuarine discharges
Improve water quality within the watersheds
and estuaries
Address flood control and water supply issues
Simulation results of the existing conditions model
(ECM) developed as part of this management plan
and the SWFFS natural systems model (NSM)
were used to evaluate historical changes and
develop performance measures that were, in turn,
used to quantify relative benefits anticipated from
implementing proposed structural projects.
Several structural projects are recommended for
implementation. Projects were ranked based on
various criteria, including a detailed cost versus
benefit analysis. The top four structural projects
recommended, in order of preferred
implementation are:
Northern Golden Gate Estates Flow-way
Restoration
North Belle Meade Spreader Swale
Henderson Creek Diversion
Corkscrew Regional Ecosystem Watershed
Restoration
Thirteen nonstructural policy initiatives that will
provide long term, sustainable ecosystem benefits
Executive Summary
V O L 1 COLLIER COUNTY WATERSHED
PAGE ES-18 MANAGEMENT PLAN – DRAFT
are also recommended for implementation. These
non-structural measures promote an integrated
approach to managing water resources in Collier
County and include programs such as low impact
development (LID), transferrable development
rights, better management and/or improvements
of existing control structures, and water quality
monitoring. The implementation of these
initiatives will require significant input from
stakeholders, including the land development
community, environmental groups, and the
general public.

V O L 1 COLLIER COUNTY WATERSHED
P A G E 1 MANAGEMENT PLAN – DRAFT
INTRODUCTION
The Collier County Watershed Management Plan
(CCWMP) has been developed using an integrated
water resources approach to balance water needs of
both the human and natural system environments in
the County's watersheds and estuaries. One of the key
features of this approach is that it takes advantage of
opportunities for restoring the natural ability of the
landscape to benefit the human environment and
protect the water quality, water quantity, and natural
systems in the County. This chapter discusses the
County's directive for the CCWMP, the general process
by which it was developed, and the organization of this
document.
Historically, south
Florida, including Collier
County, was
characterized by
overland water flow
through interconnected
sloughs and wetlands.
Most water flowed south
into the Rookery Bay and Ten Thousand Island
estuaries. Intense development has occurred in Collier
County over the past 50 years. In 1947, Congress
formed the Central and Southern Florida (CS&F) Flood
Control Project under which 1,400 miles of canals,
levees, and water control devices were constructed to
provide a means of growth in south Florida. More than
six million people subsequently moved to South Florida
between 1940 and 1965 alone (Grunwald 2006).
Growth has continued to recent years. According to the
2010 Census data, population increased by about 27
percent between 2000 and 2009.
Water control projects, particularly canal systems, have
severely impacted small- and large- scale processes
throughout the County. Canals drain surface waters
and groundwater and subsequently alter freshwater
discharges to estuaries. Construction of the Golden
Gate Canal network in the 1960s and subsequent
development along the west coast changed regional
flow patterns to the estuaries, lowering groundwater
elevations, draining wetlands, and increasing pollutant
loads to Naples Bay.
The drainage system in the study area has been
statutorily administered through the SFWMD Big
Cypress Basin Board since 1977. The Big Cypress Basin
and Collier County maintain the primary and secondary
canal system in the study area, respectively, and
through a rigorous water control operation schedule
work to reduce the impacts of the existing
infrastructure. In spite of such rigid operation, the
canals continue to have significant impacts on the
area’s natural resources.
In terms of the natural system, urbanization and
coastal development physically replaced native
habitats, increased surface water runoff, and reduced
water infiltration to the aquifers (aquifer recharge).
Consequences of these early water control actions
include altered salinity regimes in the estuaries,
degraded water quality, reduced water supply
availability, and fish and wildlife habitat losses in many
areas throughout the County. Altered salinity regimes
may in turn impact the ecology and productivity of an
estuary. Reduced flows and subsequently increased
salinities can shift seagrass species composition and
location, reduce oyster populations due to increased
parasitism and species competition, reduce primary
productivity, and alter the life cycles of fish. The
ecological effects of increased flows due to increased
groundwater discharges include algal bloom initiation
and eutrophication as a result of nutrient inputs, as
well as contamination due to metals.
Collier County is developing Watershed Management Plans (WMPs) to protect the County’s estuarine and wetland systems, consistent with Florida Statute (Subsection 163.3177 (5)(d)). Under the statute, “a Conservation Element that addresses the conservation, use, and protection of natural resources in the area . . . is required as part of Local Government Comprehensive Plans.” This WMP specifically addresses the Conservation and Coastal Management Elements of the County Comprehensive Growth Management Plan.

Introduction
V O L 1 COLLIER COUNTY WATERSHED
P A G E 2 MANAGEMENT PLAN – DRAFT
Specific impacts of altered flows include increased
freshwater discharges to the Naples Bay estuary by as
much as 10 times compared with pre-development
conditions and altered the timing and volume of flows
to the other estuaries. Variation in freshwater flow can
result in increased loading and transport of materials
and organisms, dilution or mobilization of
contaminants, a shift or compression of the salinity
gradient, increase in stratification, and decreased water
residence time. Freshwater flow accounts for the
primary physical variability in estuaries and can be an
issue where a substantial fraction of the fresh water
has been diverted (Kimmerer 2002).
The decline in groundwater elevations has led to a
dramatic decline in natural wetland systems in the
County, including nearly 70 percent of the wetlands in
the Golden Gate – Naples Bay watershed. Intense
development has occurred in Collier County in recent
years. According to the 2010 Census data, population
increased by about 27 percent between 2000 and 2009.
As development continues, the risk of impacting the
natural system will increase. In addition, external
factors such as sea level rise will result in further
environmental pressures.
The CCWMP is intended to evaluate these issues with
respect to pre-development conditions and develop
recommendations for water management actions that
will help restore surface water quality and freshwater
flows, groundwater quality and recharge, and the
condition of natural systems in the County.
Collier County encompasses an area of approximately
2,000 square miles. The CCWMP was developed to
address conditions in the approximately 1,400-square-
mile area of historical anthropogenic impacts located
west of the Big Cypress Preserve. The study area
includes three highest priority watersheds:
Cocohatchee-Corkscrew, Golden Gate, and Rookery Bay
(Figure 1.1). In addition, the plan included an
assessment of the Faka Union, Fakahatchee, and
Okaloacoochee / State Road (SR) 29 watersheds as a
single unit due to the lower existing level of land
development coupled with the on-going
implementation of significant restoration projects. The
plan includes the assessment of all estuary systems in
Collier County Wiggins Pass, Naples Bay, Rookery
Bay, and the Ten Thousand Islands.
Figure 1-1. Collier County Watersheds and Estuaries
Watershed Management Plan Directive
Collier County is developing the watershed
management plans with the purpose of protecting the
County's estuarine and wetland systems, consistent
with Florida Statute (Subsection 163.3177 (5)(d)). The
goal is to develop a mechanism for the conservation,
use, and protection of natural resources in the area,
including air, water, water recharge areas, wetlands,
water wells, estuarine marshes, soils, beaches, shores,
flood plains, rivers, bays, lakes, harbors, forests, fisheries
and wildlife, marine habitat, minerals, and other natural
and environmental resources. Applicable Elements of
the Collier County's Growth Management Plan (GMP)
addressed by the plan include Conservation and
Coastal Management and Drainage.
The development of WMPs is specifically called out
under Goal 2 of the Conservation and Coastal
Management Element, Protection of Surface and
Estuarine Water Resources, by which the County
committed to complete the prioritization and begin the
process of preparing Watershed Management Plans,
which contain appropriate mechanisms to protect the

Introduction
V O L 1 COLLIER COUNTY WATERSHED
P A G E 3 MANAGEMENT PLAN – DRAFT
County's estuarine and wetland systems. All but four
(denoted with an asterisk) of the 13 goals identified
(and listed below) in the Conservation and Coastal
Management Elements are addressed in the CCWMP:
1. Protection of natural resources
2. Protection of surface and estuarine water
resources
3. Protection of groundwater resources
4. Protection of freshwater resources
5. Protection of mineral and soil resources*
6. Protection of native vegetation and wildlife habitat
7. Protection of fisheries and wildlife
8. Maintenance of existing air quality*
9. Management of hazardous materials and
hazardous wastes*
10. Protection of coastal resources
11. Protection of historic resources*
12. Hurricane evacuation and sheltering
13. Avoiding duplication of regulations
In addition to the goals stated in the GMP, the CCWMP
also addressed issues of flood protection levels of
service.
Watershed Management Plan Development
This CCWMP was developed following completion of
the Southwest Florida Feasibility Study (SWFFS). The
SWFFS was developed by the U.S. Army Corps of
Engineers in cooperation with the South Florida Water
Management District (SFWMD) and is a continuation of
the earlier Southwest Florida Study that provided a
framework to address aquatic ecosystems health;
water flows; water supply; wildlife, biological diversity
and natural habitat; the region's economic viability;
and property rights in southwest Florida. The SWFFS
includes a preliminary feasibility analysis of alternative
solutions to issues identified in the SWFFS so that a
viable plan can be authorized and funded.
The CCWMP development consisted of an assessment
of existing and pre-development conditions,
development of performance measures to evaluate
anticipated success of proposed projects, analysis of
alternatives, and a list of recommendations for
implementation of specific watershed management
projects and initiatives for both the watersheds and
estuaries. More specifically, CCWMP is intended to:
Restore historical water quantity and estuarine
discharges
Improve water quality within the watersheds and
estuaries
Address flood control and water supply issues
Watershed Management Plan Document Organization
This WMP describes the link between water quality,
water quantity, and natural systems issues in Collier
County watersheds and estuaries and provides
recommendations for projects intended to address
these issues and comply with Federal, State, and local
regulations. Proposed improvements anticipated as a
result of the proposed projects, as well as planning-
level cost estimates for the recommended projects, are
included in this CCWMP. The document is organized by
Elements for consistency with the work elements
outlined in the County’s Scope of Work and then
grouped into four volumes. The first three volumes
provide a description of the analysis, conclusions, and
recommendations of the CCWMP. Volume 4 provides
technical details of the assessments that support the
plan’s conclusions and recommendations. Further
details of the report contents are provided below.
Volume 1
Volume 1 presents a summary of existing conditions in
the watersheds and estuaries and the performance
measures developed for evaluating potential projects.
Volume 1 addresses Elements 1 through 3 of the
CCWMP scope of services. Because of the extent of the
analyses completed for the CCWMP, the detailed
analyses are presented in technical memos in Volume 4
of this report.
Introduction. This introduction presents an overview
of the purpose and development of the CCWMP, as well
as the organization.
Element 1, Assessment of Existing Conditions –
Watersheds. Existing and pre-development conditions
are characterized for the Cocohatchee-Corkscrew,
Golden Gate – Naples Bay, Rookery Bay, and the
combined Faka Union, Okaloacoochee / State Road 29
(SR 29), and Fakahatchee watersheds to assess changes
in the systems and the potential for restoration via

Introduction
V O L 1 COLLIER COUNTY WATERSHED
P A G E 4 MANAGEMENT PLAN – DRAFT
management actions. This element addresses surface
and groundwater quantity and quality, as well as
natural systems conditions in the watersheds.
Element 2, Assessment of Existing Conditions –
Estuaries. Similarly, existing conditions in Wiggins
Pass, Naples Bay, Rookery Bay, and Ten Thousand
Islands estuaries were characterized and evaluated in
terms of potential management actions. This section
addresses volume, timing, and quality of freshwater
inflows to the estuary; quality of receiving waters in the
estuary; and coastal habitats.
Element 3, Development of Performance Measures.
Performance measures were developed for
quantitatively assessing watershed and estuary
conditions and providing a measure of improvement
anticipated as a result of implementing proposed
management actions. Performance measures were
developed for surface water quantity, surface water
pollutant loads associated with human activity,
aquifer/hydrogeology conditions, and conditions of the
natural system.
Volume 2
Volume 2 is a stand-alone report that describes the
structural best management practices (BMPs)
recommended for implementation. Volume 2 describes
the identification, screening, evaluation, and ranking of
recommendations for addressing water resource issues
in the County. Project implementation rankings are
based on the anticipated improvements in the system
due to proposed projects. Priority improvements are
recommended and described for each watershed.
Volume 3
Volume 3 was prepared as a stand-alone document to
describe the non-structural (policy) initiatives
recommended for implementation as part of the
watershed management plan. The non-structural,
initiatives are designed to help bridge the gap between
the benefits expected from structural projects and the
long-term approaches needed to address water
quantity, water quality, and resource protection in
Collier County as land development continues.
Volume 4
Volume 4 is a compilation as separate sections, of the
individual technical memoranda completed to address
existing conditions in the County’s watersheds and
estuaries. Volume 4 presents detailed descriptions of
the analyses conducted, with supplemental appendices
as appropriate, of the applied methodologies and
corresponding results of the work conducted as part of
the development of the CCWMP. Volume 4 also
includes a complete list of project references. Volumes
1 through 3 include separate sections on the cited
literature.

V O L 1 COLLIER COUNTY WATERSHED
P A G E 5 MANAGEMENT PLAN – DRAFT
SUMMARY ASSESSMENT OF EXISTING CONDITIONS – WATERSHED
1.1: Surface Water Quantity
Stormwater runoff and base flow account for about 15 and 8 percent, respectively, of the
annual rainfall in Collier County watersheds. Groundwater that enters the canal network as
base flow makes up approximately 36 percent of the total fresh water discharged into the
canals.
Introduction
Surface water budgets, based on results from the
Collier County MIKE SHE/MIKE11 Existing Conditions
Model (ECM) are summarized here. Potential issues
identified during the water budgeting process are
presented. Water budget components, surface and
groundwater budgets, base flow and structure
operations, and canal capacity are also presented.
The water budget schematic presented in Figure 1-2
illustrates that the primary inflows to the watershed
are precipitation and applied irrigation. Water
accumulates on the land surface as basin storage, runs
off as overland flow, or seeps into the ground
(infiltration/percolation). Overland flow can evaporate,
discharge into the canal, or be conveyed across
watershed boundaries. Water that seeps into the soils
can be assimilated by plants or percolate into the
Water Table aquifer. Water can subsequently be
assimilated by plants, flow across the watershed
boundary, be pumped for potable water supply (PWS)
and irrigation, or percolate into underlying aquifers.
Residual water is stored in the aquifer. Similar
processes occur in each of the deeper aquifers.
Methods
Data from the MIKE SHE/MIKE11 model results were
extracted and processed to create water budgets for
the entire study area and each of the watersheds.
Water budgets were prepared for a wet and a dry year
relative to average annual conditions and for the
simulation period of January 1, 2002, through October
31, 2007. Budgets were developed for different time
periods based on data availability. Finally, seasonal
water budgets were developed for each watershed.
Results for Study Area
Average water year and seasonal water budgets were
generated for each of the watersheds in Collier County.
The average water year budget for the entire study
area is shown in Figure 1-3 and indicates that rainfall
during the 4-month wet season represents about 54
percent of the total annual amount and that most is lost
through evapotranspiration (ET), which ranges
between 50 and 60 percent in the wet season for all
watersheds. During the dry season, ET losses equal
precipitation in all watersheds except Golden Gate –
Naples Bay. In this watershed, ET is about 80 percent of
precipitation due to the high level of urban
development, as water is quickly routed to the drainage
network.
Figure 1-2. Surface Water Flow Schematic

Summary Assessment of Existing Conditions – Watershed
V O L 1 COLLIER COUNTY WATERSHED
P A G E 6 MANAGEMENT PLAN – DRAFT
Figure 1-3. Average Water Year (2003–2007) Water Budget
Runoff and base flow are important components of the
water budget and represent about 15 and 8 percent of
annual rainfall (8.3 and 4.7 inches, respectively): the
volume of groundwater that enters the canal network
as base flow makes up approximately 36 percent of the
total fresh water discharged into the canals. During the
wet period, runoff is about 70 percent of the total water
contributions to the canal network. In the dry season,
the runoff volume declines to about 44 percent of the
total contribution to the canals. Therefore, most of the
canal flow is base flow, and is explained by the
response of runoff to varying meteorological
conditions, while base flow is relatively stable. The
ratio of average runoff to average rainfall ranges from
20 percent in the wet season to 6 percent in the dry
season. On the other hand, baseflow (wet season = 2.62
inches and dry season = 1.93 inches) remains at about
8 percent of rainfall. Dry season irrigation accounts for
85 percent of the annual irrigation demand.
Finally, the water budget also includes watershed
storage. Change in storage as an annual average is
negligible: about 2.5 inches of storage is lost in the dry
season, but that volume is recovered in the wet season.
To assess system characteristics under critical
conditions, water budgets were developed for both the
driest dry season and the wettest wet season in the
simulation period. Total precipitation during this
totaled about 17 inches, or about 33 percent less than
the average dry season rainfall for the entire simulation
period.
Results confirm that the change in runoff volume is
much larger than the change in precipitation. Results of
the annual and seasonal water budgets indicate that
management of both runoff and base flow are key to
reducing the volume of water discharged to the
estuaries. During the dry season, reduced base flow to
the canal network appears to be more critical.
During extreme dry weather, irrigation and pumping
for PWS increase substantially and watershed storage
decreases substantially. Similar to the annual average
analysis, irrigation and pumping are drastically
reduced during extreme wet weather conditions and
the watershed storage is quickly recovered.
Results for Watershed
Cocohatchee-Corkscrew Watershed. Model results
indicate that the annual average runoff volume is
approximately 14 percent of rainfall, mostly from
urban and agricultural development. For example, the
2003 wet season results indicate that runoff was more
than 9 inches, of which 8.5 inches came from urban and
agricultural development. The average water year
budget for the watershed is shown in Figure 1-4.

Summary Assessment of Existing Conditions – Watershed
V O L 1 COLLIER COUNTY WATERSHED
P A G E 7 MANAGEMENT PLAN – DRAFT
Figure 1-4. Average Water Year Budget – Cocohatchee-Corkscrew Watershed
Water runoff contributions from natural areas are
small because most water is stored in Corkscrew
Swamp. In addition, there is a large component of
overland runoff flow that leaves the Cocohatchee-
Corkscrew watershed and enters the Golden Gate–
Naples Bay, Faka Union, Okaloacoochee/SR 29, and
Fakahatchee watersheds during large rainfall events
due to the little difference in elevation at the watershed
ridges. In terms of baseflow, the amount relative to
runoff is only half of that computed for the entire study
area. This can be attributed to the low density of canals
in the watershed.
Golden Gate-Naples Bay Watershed. The most
conspicuous feature of this watershed is that baseflow
is the primary source of water to the canals and often
makes up more than 70 percent of the dry season
flows. This can be attributed to the high density of
canals in the watershed. Reducing base flows to the
canals may substantially reduce the volume of water
discharging to the Naples Bay estuary. The average
water year budget for the watershed is in Figure 1-5.
Figure 1-5. Average Water Year Budget – Golden Gate-Naples Bay Watershed
Runoff exceeds 19 percent of rainfall and occurs
primarily during the rainy season. As in the
Cocohatchee – Corkscrew watershed, most of the
runoff is from coastal urban development. The volume
of water leaving the watershed via overland and
aquifer flow is low and is directly influenced by the
canal network that drains the Water Table aquifer and
directs water to the estuary.
The Rookery Bay watershed has urban development
west of the Henderson Creek Canal, while the central
portion of the watershed is mostly undeveloped and
includes Henderson Strand and portions of the
Picayune Strand State Forest. The southeast portion of
the watershed is agricultural. In general, the proportion
of runoff relative to precipitation (11 percent) is low
compared to the other watersheds and is most likely
due to the lack of development in large parts of the
watershed. Water budget results are in Figure 1-6.
Figure 1-6. Average Annual Water Budget – Rookery Bay Watershed
Seasonally, surface water runoff makes up 60 percent
of canal flow during the wet season and base flow
contributes more than 70 percent of canal flow during
the dry season. Wet season runoff is due primarily to
urban and agricultural areas; while dry season base
flow contributions are primarily in the Henderson
Creek Canal.
Faka Union, Okaloacoochee/SR 29, and
Fakahatchee watersheds. The northern portion of the
Okaloacoochee/SR 29 and Fakahatchee watersheds
include large areas of agriculture, while the northern
part of the Faka Union watershed includes more rural
residential areas. The remainder of the watershed
consists of wetlands or other natural areas. However,
portions of the Golden Gate canal network drain large
portions of the natural areas in the southern Faka
Union watershed. The average water year budget for
the watershed is shown in Figure 1-7.

Summary Assessment of Existing Conditions – Watershed
V O L 1 COLLIER COUNTY WATERSHED
P A G E 8 MANAGEMENT PLAN – DRAFT
Figure 1-7. Average Water Year Budget – Faka Union, Okaloacoochee/SR 29, and Fakahatchee Watersheds
In the wet season, base flow in these watersheds is
equal to approximately 120 percent of runoff, but
during the dry season, the volume of base flow is more
than 8 times that of runoff. Model results indicate that
base flow is primarily in the Faka Union watershed,
although there are base flow contributions to the State
Road 29 Canal in the Okaloacoochee/SR 29 watershed.
The Picayune Strand Restoration Project is expected to
greatly reduce the volume of base flow in these
combined watersheds.
Water budget results indicate a small loss in stored
water over the simulation period. This is possibly the
result of high base flow contributions to the canal
network in the Faka Union watershed or groundwater
pumping for potable water supply and agricultural
irrigation in the northern parts of the study area.
Further site specific analyses would be required to
quantity actual causes of the storage loss.
Conclusions
Stormwater runoff and groundwater discharges to the
canal network via base flow are critical water budget
processes in the watershed as a whole. Management
actions that alleviate impacts of increased development
are necessary to reduce the adverse effects of the
existing, limited conveyance capacity of the canal
system.
Annual and seasonal average stormwater runoff
volumes are greatly influenced by precipitation
and, consequently, relatively small variations in
precipitation result in large changes in the volume
of runoff.
Base flow contributions increase with canal
density. Reducing base flow would alter the volume
and timing of water delivered to the estuaries.
Based on the relationship of base flows and
difference in ground and surface water elevations
(Figure 1-8), managing canal stage to groundwater
elevations is important to reducing base flows to
the canals.
Existing control structures limit the ability to stage
water at higher elevations in canals and new and
replacement structures that can be changed with
seasonal groundwater head elevations are
recommended. Greater flexibility in managing
water levels in the canals to reduce base flow
contributions to estuaries should be part of the
design for new or replacement control structures.
Figure 1-8. Relationship of Base flow and (Head – Stage) Elevation Difference
No net loss or gain in watershed storage was
documented for the simulation period. Annual
storage losses in the dry season corresponded with
high base flow contributions and pumping from the
Water Table and Lower Tamiami aquifers for
potable and irrigation water supply needs.
Lowering the water surface in the canal network
prior to large storm events is an important
management tool to provide storage within the
canal network and to mitigate flooding risks.
Water inflow and outflow patterns among
watersheds are similar. The notable exception is
the large base flow and runoff component in the
Naples-Golden Gate basin when compared with the
other watershed.

Summary Assessment of Existing Conditions – Watershed
V O L 1 COLLIER COUNTY WATERSHED
P A G E 9 MANAGEMENT PLAN – DRAFT
1.2: In-Stream Surface Water Quality
In-stream water quality was evaluated in the context of the Total Maximum Daily Load
(TMDL) impairment process. Results are consistent with FDEP’s findings. Detailed site
specific analyses are necessary to establish cause-effect relationships for the potential
impairments.
Introduction
In-stream water quality in the study area was
characterized based on comparisons to the State’s
water quality standards per FDEP’s TMDL impairment
analysis. Screening criteria were used for parameters
that do not have a numerical standard. Analyses
included: 1) review of relevant reports from local, state,
and regional agencies, 2) review of relevant water
quality data, 3) identification of water quality concerns
that may require source verification or restoration
measures., 4) identification of factor(s) that may affect
conclusions related to TMDL impairment, and 5) an
overview of factor(s) that strongly influence water
quality in Collier County’s watersheds.
Methods
In-stream water quality was evaluated for potential
impairments by first characterizing long term water
quality in each of the six watersheds and then
evaluating water quality with respect to FDEP
thresholds for water quality impairments. Water
parameters examined included color, dissolved oxygen,
chlorophyll-a, total nitrogen, total phosphorus, iron,
fecal coliform bacteria, and un-ionized ammonia.
Results
Per the data analysis, the fourteen FDEP identified
water body identification (WBID) basins previously
verified as impaired by FDEP were confirmed to be
impaired. An additional 16 WBIDs were identified as
potentially impaired, or “basins of concern” by FDEP
standards. Impairments relate primarily to low
dissolved oxygen concentrations (Figure 1-9). The
potential new impairments, which will have to be
verified by FDEP, may be due to the use of additional
data available for this study, compared to the FDEP
databases, as well as differences in the timeframe used
in the analysis. The data analysis indicated also that
with the exception of Lake Trafford (Figure 1-10),
watersheds are not characterized by high levels of total
nitrogen or total phosphorus. Chlorophyll-a, total
phosphorus, and total suspended solids concentrations
were within the range of the regulatory standards and
screening levels for all six watersheds. Therefore,
further study to be conducted as part of the TMDL
program is necessary prior to the County commiting to
implement water quality improvement projects.
Figure 1-9. WBIDs Impaired for Dissolved Oxygen
Another impairment parameter is fecal coliforms.
Before any action is taken to address this issue, the
County should wait for further guidance by FDEP. The
agency is looking into this issue on a statewide basis.

Summary Assessment of Existing Conditions – Watershed
V O L 1 COLLIER COUNTY WATERSHED
P A G E 10 MANAGEMENT PLAN – DRAFT
Cocohatchee-Corkscrew Watershed
Water quality assessments conducted as part of this
project indicated three potential parameters of
concern: color, dissolved oxygen, and fecal coliform
bacteria. Statistical data analyses were conducted to
identify the most likely cause of the low dissolved
oxygen levels in the watershed. Those analyses
indicated that color resulting from discharges from
wetland systems may be the primary causative factor.
This finding applies primarily to the Corkscrew marsh
and potentially the area downstream from the marsh.
Nutrient loading from urban runoff may also contribute
to low dissolved oxygen levels in the western portion of
the watershed. The area around Immokalee is likely
impacted by urban and agricultural runoff.
Figure 1-10. Collier County Nutrient Impairment
Groundwater is also a potential contributor to low
dissolved oxygen levels as baseflow represents about
23 percent of the average annual flow and 36 percent
of the dry season flow. Baseflow occurs primarily in the
areas near the coast and into the Cocohatchee Canal
adjacent to Immokalee Road.
A review of water quality data completed during this
project indicated that concentrations of chlorophyll-a
and nutrients have been below FDEP’s screening
criteria, including in the Lake Trafford basin. The
results for Lake Trafford are most likely due to the
sediment removal projects being conducted in the lake.
Continued coordination with FDEP is necessary to
confirm this finding and define the next courses of
action in the TMDL process.
Golden Gate-Naples Bay Watershed
Based upon the evaluation of the long term stations
within the watershed, 3 parameters of “potential
concern” were identified: dissolved oxygen, color, and
iron. The extensive development (61 percent) of the
watershed, significant baseflow contributions, and
runoff from forested areas may all influence dissolved
oxygen concentrations in the watershed. Groundwater,
which is low in dissolved oxygen concentration,
represents 58 percent of the annual flow and 70
percent of the dry season flow from the Golden Gate –
Naples Bay watershed However, as potential man-
made impacts cannot be discarded, further site-specific
analyses in coordination with FDEP are required to
verify the dissolved oxygen impairments and to
identify the causes of the impairment. In terms of the
iron impairment, results from a computerized water
quality model of the watershed, discussed in Volume 4,
have indicated that it may be the result of groundwater
contributions to the canal network. Iron concerns and
recommended courses of action will need to be defined
during the next FDEP assessment cycle.
Rookery Bay Watershed
None of the WBIDs that comprised the Rookery Bay
watershed were identified by FDEP as impaired for
dissolved oxygen. However, based on the evaluation of
the long term water quality data, dissolved oxygen was
identified as being of “potential concern”. Statistical
relationships conducted as part of this project, which
are described in Volume 4, suggests that total
phosphorus may be indirectly responsible for the low
dissolved oxygen by stimulating algae growth that in
turn may deplete waters of oxygen. However, the
statistical relationship is weak. In addition, chlorophyll-
a and nutrient values were found to be consistently
below FDEP’s screening critaria. Pollutant loads from
developed land uses, significant baseflow
contributions, and runoff from forested areas may all
influence dissolved oxygen concentrations in the
watershed. Further analyses are needed to identify the
actual cause of the low dissolved oxygen
concentrations.

Summary Assessment of Existing Conditions – Watershed
V O L 1 COLLIER COUNTY WATERSHED
P A G E 11 MANAGEMENT PLAN – DRAFT
Faka Union, Fakahatchee, and Okaloacoochee/SR 29 Watersheds
Some of the WBIDs in these watersheds have been
found impaired for dissolved oxygen, fecal coliform,
and iron. The evaluation of the long term water quality
data from this watershed confirmed the impairments.
Regression analyses conducted as part of this project
(see Volume 4) suggest that low dissolved oxygen
concentrations in discharge waters in the watershed
may be due to color. That is consistent with the
characteristics of these watersheds, as 86 percent of
the area is comprised of natural areas. High color is
typical of water discharged from forested areas.
Other factors that can affect dissolved oxygen
concentrations are baseflow contributions and the
discharge of pollutants from areas impacted by human
activity. More detailed studies are necessary to define
the actual cause of the impairment.
In terms of iron concentrations, similar to the
conditions in the Golden Gate- Naples Bay watershed,
the source of the elevated concentrations is likely to be
baseflow. However, the presence of areas where
hydrologic processes have been altered (i.e., the
Southern Golden Gate Estates drainage canals) suggests
that further analysis is necessary to determine the
actual cause of the observed impairment.
Conclusions
The FDEP has identified multiple impairments of
individual WBIDs for several water quality parameters
in Collier County. The data analyses for individual
WBIDS conducted as part of this project, which use all
the FDEP data plus new data collected specifically for
this project, are consistent with the FDEP findings.
Additional potential water quality impairments were
also identified. Impairments for parameters such as
dissolved oxygen and iron could be attributed to
several causes including pollutant loading from
developed areas, water color from natural landscape
discharges, and groundwater contributions (baseflow)
to the surface water flows.
The data analyses conducted by either FDEP as part of
the TMDL implementation process or as part of this
study are not sufficient to determine impairment.
Establishment of a cause versus effect relationship
through more detailed analysis is necessary. Those
efforts should be coordinated with FDEP. Ideally
conclusions are reached as part of the work necessary
prior to the TMDL development stage of the TMDL
program.
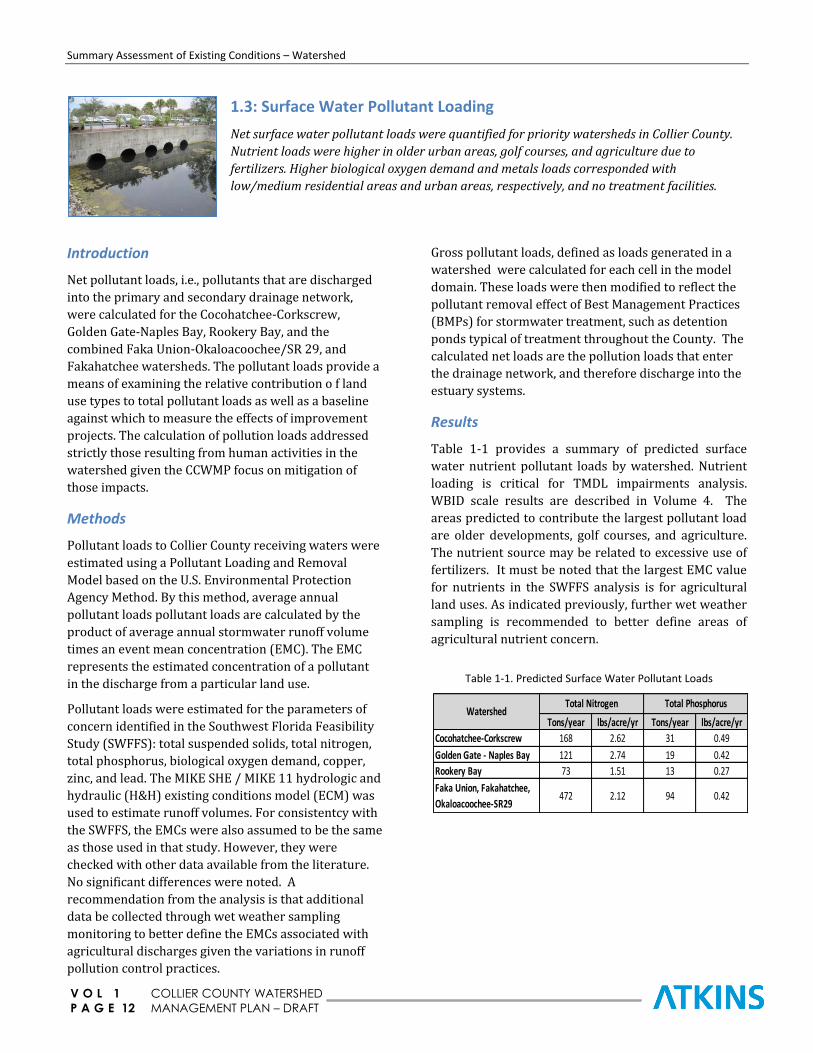
Summary Assessment of Existing Conditions – Watershed
V O L 1 COLLIER COUNTY WATERSHED
P A G E 12 MANAGEMENT PLAN – DRAFT
1.3: Surface Water Pollutant Loading
Net surface water pollutant loads were quantified for priority watersheds in Collier County.
Nutrient loads were higher in older urban areas, golf courses, and agriculture due to
fertilizers. Higher biological oxygen demand and metals loads corresponded with
low/medium residential areas and urban areas, respectively, and no treatment facilities.
Introduction
Net pollutant loads, i.e., pollutants that are discharged
into the primary and secondary drainage network,
were calculated for the Cocohatchee-Corkscrew,
Golden Gate-Naples Bay, Rookery Bay, and the
combined Faka Union-Okaloacoochee/SR 29, and
Fakahatchee watersheds. The pollutant loads provide a
means of examining the relative contribution o f land
use types to total pollutant loads as well as a baseline
against which to measure the effects of improvement
projects. The calculation of pollution loads addressed
strictly those resulting from human activities in the
watershed given the CCWMP focus on mitigation of
those impacts.
Methods
Pollutant loads to Collier County receiving waters were
estimated using a Pollutant Loading and Removal
Model based on the U.S. Environmental Protection
Agency Method. By this method, average annual
pollutant loads pollutant loads are calculated by the
product of average annual stormwater runoff volume
times an event mean concentration (EMC). The EMC
represents the estimated concentration of a pollutant
in the discharge from a particular land use.
Pollutant loads were estimated for the parameters of
concern identified in the Southwest Florida Feasibility
Study (SWFFS): total suspended solids, total nitrogen,
total phosphorus, biological oxygen demand, copper,
zinc, and lead. The MIKE SHE / MIKE 11 hydrologic and
hydraulic (H&H) existing conditions model (ECM) was
used to estimate runoff volumes. For consistentcy with
the SWFFS, the EMCs were also assumed to be the same
as those used in that study. However, they were
checked with other data available from the literature.
No significant differences were noted. A
recommendation from the analysis is that additional
data be collected through wet weather sampling
monitoring to better define the EMCs associated with
agricultural discharges given the variations in runoff
pollution control practices.
Gross pollutant loads, defined as loads generated in a
watershed were calculated for each cell in the model
domain. These loads were then modified to reflect the
pollutant removal effect of Best Management Practices
(BMPs) for stormwater treatment, such as detention
ponds typical of treatment throughout the County. The
calculated net loads are the pollution loads that enter
the drainage network, and therefore discharge into the
estuary systems.
Results
Table 1-1 provides a summary of predicted surface
water nutrient pollutant loads by watershed. Nutrient
loading is critical for TMDL impairments analysis.
WBID scale results are described in Volume 4. The
areas predicted to contribute the largest pollutant load
are older developments, golf courses, and agriculture.
The nutrient source may be related to excessive use of
fertilizers. It must be noted that the largest EMC value
for nutrients in the SWFFS analysis is for agricultural
land uses. As indicated previously, further wet weather
sampling is recommended to better define areas of
agricultural nutrient concern.
Table 1-1. Predicted Surface Water Pollutant Loads
Tons/year lbs/acre/yr Tons/year lbs/acre/yr
Cocohatchee-Corkscrew 168 2.62 31 0.49
Golden Gate - Naples Bay 121 2.74 19 0.42
Rookery Bay 73 1.51 13 0.27
Faka Union, Fakahatchee,
Okaloacoochee-SR29472 2.12 94 0.42
Total Nitrogen Total PhosphorusWatershed

Summary Assessment of Existing Conditions – Watershed
V O L 1 COLLIER COUNTY WATERSHED
P A G E 13 MANAGEMENT PLAN – DRAFT
1.4: Hydrogeology
Understanding the interaction of the surface water and the groundwater systems and the
highly dynamic transfer of water between one system and the other is a critical aspect of the
watershed management planning process
The groundwater resource in Collier County is essential
to meet agricultural and urban needs, as well as to
maintain the characteristics of the natural system.
Therefore, understanding the interaction of the surface
water and the groundwater systems and the highly
dynamic transfer of water between one system and the
other is a critical aspect of the watershed management
planning process.
In the MIKE SHE Existing Conditions Model (ECM)
developed as part of this project, the subsurface model
includes the unsaturated and saturated zones. The
unsaturated zone in South Florida is shallow and the
soils are sandy and highly permeable, except in
wetlands where a surface deposit of fine-grained
sediment may be present. Soil porosities are typically
high even compared to those for regular sandy soils.
The ECM was based on the soil types and properties
from the Southwest Florida Feasibility Study (SWFFS).
In the SWFFS, soil types were classified into six
different hydrologic response groups. Hydraulic
parameters were defined for each soil profile.
The saturated zone has a complex stratigraphy. The
primary aquifers that underlie Collier County in order
of increasing depth: Water Table, Lower Tamiami,
Sandstone unit of the Upper Hawthorn (Sandstone),
and the Mid-Hawthorn. These hydrogeologic units are
generally comprised of stratified layers of porous
media having high transmissivities with relatively thin
layers of silt and clay rich units that comprise the
confining units. The Water Table aquifer is also
referred to as the Surficial aquifer.
In the ECM, each aquifer is represented as individual
computational layers. Each computational layer is
made up of an aquifer and overlying confining unit.
Generally the upper aquifers exhibit significant
interaction. Potentiometric elevation data from existing
monitoring wells indicate variable amounts of
communication between the Mid-Hawthorn and the
overlying Sandstone Aquifer. In the northern parts of
the study area, the potentiometric surface of the Mid-
Hawthorn is similar to the overlying layers, indicating
less confinement. However, the heads in the few wells
screened in the Mid-Hawthorn in the southern part of
Collier County indicate greater confinement. In the
southern part of the County, the Mid Hawthorn is very
thick and in the north it is relatively thin. The
confinement is the result of reduced transmissivity, a
function of the vertical conductivity and thickness of
the unit. Since the vertical conductivity is uniform
throughout the computational layer, the confinement is
the result of the increased thickness of the aquifer
layer.
The primary hydrogeological parameters used in the
ECM, horizontal and vertical hydraulic conductivities,
leakance, and storage parameters were derived from
the SWFFS and included revisions made during the
calibration of subsequent modeling efforts, such as the
Lee County DR/GR model. The hydrogeologic
parameters are associated with each computational
layer, which is made up of an aquifer and overlying
confining unit. Therefore the hydrogeologic
parameters are composites of parameters representing
the combined parameter estimates of the geologic units
that make up each computational layer. Groundwater
budgets and annual and seasonal groundwater levels
for current conditions in Collier County watersheds
were developed using the ECM. This groundwater
assessment provides a means of identifying potential
locations for future water supply withdrawals that also
minimize impacts to natural systems such as wetlands.

Summary Assessment of Existing Conditions – Watershed
V O L 1 COLLIER COUNTY WATERSHED
P A G E 14 MANAGEMENT PLAN – DRAFT
1.5: Groundwater Quantity
A water supply analysis was completed for Collier County to assess the change from pre-
development to existing conditions and the effects of increased urban and agricultural water
supply demands with respect to minimum aquifer levels. Results indicate groundwater level
declines of more than 5 feet in some parts of the County and additional declines are
anticipated if withdrawals are increased.
Introduction
The Collier County Existing Conditions Model (CC ECM)
was used to simulate the hydrodynamics of the Collier
County aquifer systems. Groundwater budgets were
developed to assess aquifer conditions including the
lateral flow of water across and within model basin
boundaries, and the flow of water between aquifers.
Annual and seasonal aquifer specific water budgets
were generated for the model simulation period of
January 1, 2002, through October 31, 2007.
A conceptual groundwater budget (Figure 1-11)
illustrates inflows (primarily percolation to underlying
layers), outflows (discharge to canals, pumping, etc.),
and storage. Water that infiltrates into the soils may be
assimilated by vegetation or percolate into the upper
portion of the Water Table aquifer. The water can be
removed from the Water Table aquifer by vegetation,
lateral flows, water supply withdrawals, or percolation
to adjacent aquifers. Any residual water is stored in the
aquifer(s).
Average annual and seasonal (wet and dry)
groundwater budgets were developed for each aquifer
system. The budget included both the natural processes
and groundwater demands. Average annual
groundwater elevations, as well as annual fluctuations
were also calculated and mapped. The analysis
considered differences in seasonal elevations to
identify areas of extreme drawdown.
Groundwater Demands
An important component of the groundwater budget is
water demands, which include public supply, private
domestic consumption, and irrigation for agriculture
and golf courses. The average annual public water
demand over the ECM simulation period was about 46
mgd. In the CC ECM, pumping rates were defined by
time series of reported monthly pumping for each well.
The majority of potable water supply wells are located
in the Golden Gate-Naples Bay, Rookery Bay, and Faka
Union watersheds (Figure 1-12), but most water supply
withdrawals are from the Lower Tamiami aquifer from
wells located in the Golden Gate watershed.
The domestic groundwater demand from private wells
(Figure 1-13) amounts to about 7.5 mgd and represents
approximately 16 percent of the public supply demand.
Agricultural and golf course irrigation (Figure 1-14)
use substantial amounts of water throughout Collier
County. In the CC ECM, irrigated agricultural areas
were defined from water use permits issued by the
SFWMD. Model results indicated that irrigation for
agriculture is on the same order of magnitude as public
supply. The majority of the irrigated agricultural and
pasture lands are in the northeastern part of the
County in the Cocohatchee-Corkscrew, Faka Union,
Fakahatchee, and Okaloacoochee/SR 29 watersheds.
The golf course irrigation demand is about 2.5 mgd.
Golf courses are located in the urbanized coastal areas
in the Golden Gate – Naples Bay watershed.
OL Boundary Flow
River
Ground Surface
Infiltration Drainage
Recharge to SZ
Base Flow
Irrigation
Overland Storage
Total Evapotranspiration
Runoff (OL to River)
Exchange with Deeper Aquifers
Unsaturated Zone
Water Table Aquifer
Precipitation
Aquifer Boundary Flow
Pumping for Irrigation and PWS
Figure 1-11. Conceptual Groundwater Budget
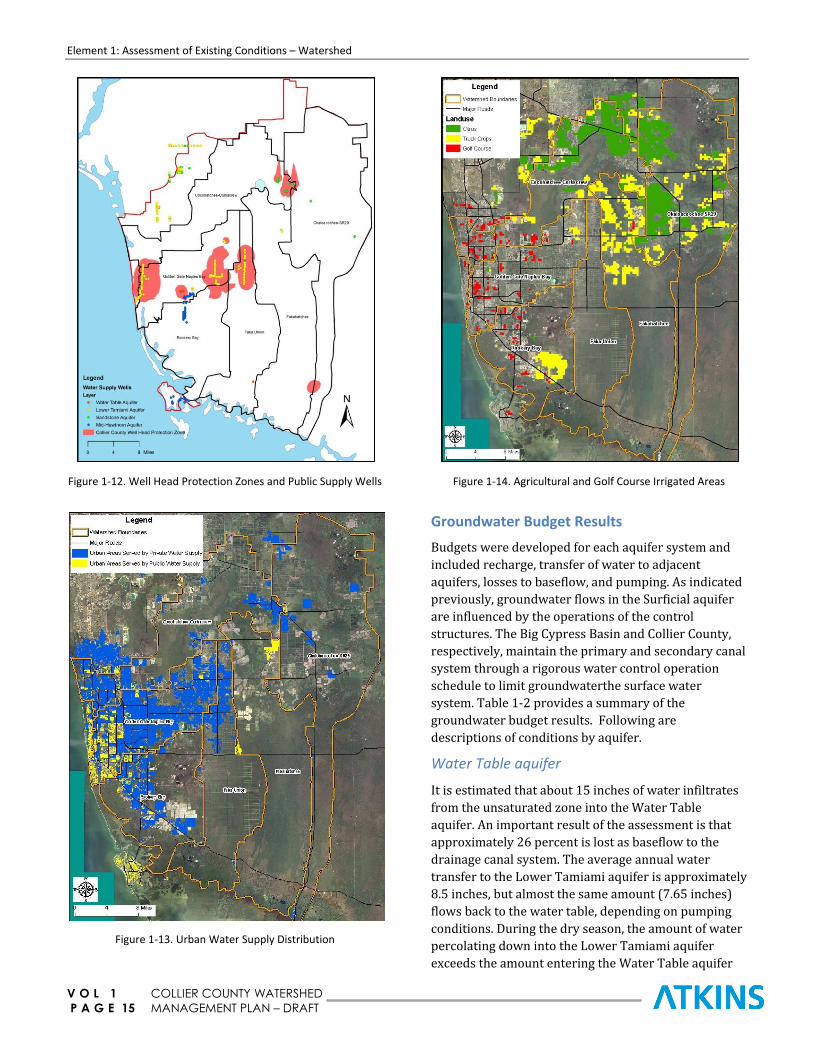
Element 1: Assessment of Existing Conditions – Watershed
V O L 1 COLLIER COUNTY WATERSHED
P A G E 15 MANAGEMENT PLAN – DRAFT
Figure 1-12. Well Head Protection Zones and Public Supply Wells
Figure 1-13. Urban Water Supply Distribution
Figure 1-14. Agricultural and Golf Course Irrigated Areas
Groundwater Budget Results
Budgets were developed for each aquifer system and
included recharge, transfer of water to adjacent
aquifers, losses to baseflow, and pumping. As indicated
previously, groundwater flows in the Surficial aquifer
are influenced by the operations of the control
structures. The Big Cypress Basin and Collier County,
respectively, maintain the primary and secondary canal
system through a rigorous water control operation
schedule to limit groundwaterthe surface water
system. Table 1-2 provides a summary of the
groundwater budget results. Following are
descriptions of conditions by aquifer.
Water Table aquifer
It is estimated that about 15 inches of water infiltrates
from the unsaturated zone into the Water Table
aquifer. An important result of the assessment is that
approximately 26 percent is lost as baseflow to the
drainage canal system. The average annual water
transfer to the Lower Tamiami aquifer is approximately
8.5 inches, but almost the same amount (7.65 inches)
flows back to the water table, depending on pumping
conditions. During the dry season, the amount of water
percolating down into the Lower Tamiami aquifer
exceeds the amount entering the Water Table aquifer

Element 1: Assessment of Existing Conditions – Watershed
V O L 1 COLLIER COUNTY WATERSHED
P A G E 16 MANAGEMENT PLAN – DRAFT
from the overlying soils and, together with increased
water withdrawals, results in an average net loss (2.19
inches) of aquifer storage. Most of that is recovered
during the wet season. Annually, an average 0.44 inch
of water is pumped from the Water Table aquifer. Close
to 90 percent of the pumping occurs during the dry
season when demand is higher.
The Cocohatchee-Corkscrew watershed had the
greatest proportion of annual average recharge to the
Lower Tamiami aquifer: more than 25 percent of the
water entering the Water Table aquifer reached the
Lower Tamiami aquifer. Infiltration was lower in the
Golden Gate Naples Bay (19 percent) and Rookery Bay
watersheds (10 percent). In the eastern watersheds,
there is net upward movement of water from the
Lower Tamiami aquifer into the Water Table aquifer
due to the difference in head elevation resulting from
evapotranspiration from the extensive wetlands in the
watersheds. The canal network also influences
groundwater elevations and contributes to long term
changes in the water table elevation.
The seasonal average groundwater surface elevation
maps for the Water Table Aquifer and Lower Tamiami
aquifers indicate a shift in the isohyetal lines. This is
most evident is near the coast in Naples and in the
Rookery Bay and Faka Union watersheds where the 5-
and 10-foot elevation contours shift as much as 3 miles
further inland during the dry season. This shift is
influence by increased groundwater pumping and may
also be indicative of potential risks to water supply due
to salt water intrusion.
Lower Tamiami aquifer
As indicated above, the average annual inflow to the
Lower Tamiami aquifer from the water table aquifer is
0.85 inches. In addition, there is a net annual inflow
from the underlying Sandstone Aquifer of 1.5 inches.
The net inflow appears to be driven by water
withdrawals for potable water and irrigation that
create a hydraulic gradient. There is a net loss of water
(1.9 inches) from the Lower Tamiami to the Sandstone
aquifer in the Cocohatchee-Corkscrew watershed,
suggesting that this watershed is a primary source of
recharge to the Sandstone aquifer system. There are
net water inflows to the Lower Tamiami from the
Sandstone aquifer in the Golden Gate- Naples Bay (0.14
inch), Rookery Bay (0.78 inch) and the eastern (3.43
inches) watersheds. In the Golden Gate-Naples Bay and
Rookery Bay watersheds, the net gain is likely the
result of withdrawals for water supply. The net loss in
the eastern watersheds is probably due to agricultural
pumping to meet irrigation needs. Although not as
drastic as in the Water Table aquifer, the Lower
Tamiami also looses about 6 percent of the inflow as
drainage canal baseflow.
Sandstone aquifer
No annual change in water storage was identified for
the Sandstone aquifer, indicating equal seasonal
inflows and outflows. There is a net loss of 1.5 inches of
water from the Sandstone aquifer to the overlying
Lower Tamiami aquifer, and a net gain of 0.3 inches
from the underlying Mid-Hawthorn. The estimated net
annual loss of water is 0.76 inch and is due primarily
due to dry season withdrawals for water supply.
Boundary inflows account make up for the losses and
results in no net change in storage.
In this aquifer system, the Cocohatchee-Corkscrew
watershed has a net inflow of water from the Lower
Tamiami aquifer of 1.93 inches annually, and a net loss
to the Mid-Hawthorn Aquifer of 0.05 inch annually. The
other watersheds showed a net loss to the overlying
Lower Tamiami aquifer and a net gain from the
underlying Mid-Hawthorn Aquifer. The inflows from
the Mid-Hawthorn are less than 1 inch annually and
indicate little interaction between the Sandstone and
Mid-Hawthorn aquifer systems
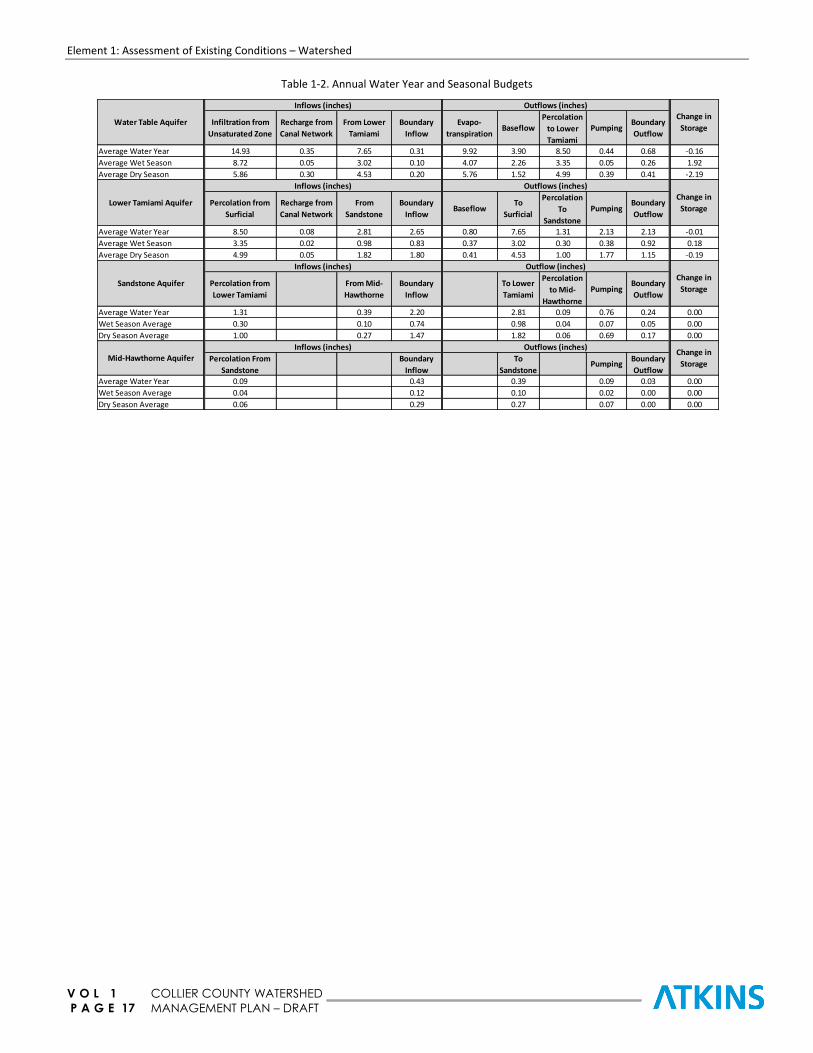
Element 1: Assessment of Existing Conditions – Watershed
V O L 1 COLLIER COUNTY WATERSHED
P A G E 17 MANAGEMENT PLAN – DRAFT
Table 1-2. Annual Water Year and Seasonal Budgets
Average Water Year 14.93 0.35 7.65 0.31 9.92 3.90 8.50 0.44 0.68 -0.16
Average Wet Season 8.72 0.05 3.02 0.10 4.07 2.26 3.35 0.05 0.26 1.92
Average Dry Season 5.86 0.30 4.53 0.20 5.76 1.52 4.99 0.39 0.41 -2.19
Average Water Year 8.50 0.08 2.81 2.65 0.80 7.65 1.31 2.13 2.13 -0.01
Average Wet Season 3.35 0.02 0.98 0.83 0.37 3.02 0.30 0.38 0.92 0.18
Average Dry Season 4.99 0.05 1.82 1.80 0.41 4.53 1.00 1.77 1.15 -0.19
Average Water Year 1.31 0.39 2.20 2.81 0.09 0.76 0.24 0.00
Wet Season Average 0.30 0.10 0.74 0.98 0.04 0.07 0.05 0.00
Dry Season Average 1.00 0.27 1.47 1.82 0.06 0.69 0.17 0.00
Average Water Year 0.09 0.43 0.39 0.09 0.03 0.00
Wet Season Average 0.04 0.12 0.10 0.02 0.00 0.00
Dry Season Average 0.06 0.29 0.27 0.07 0.00 0.00
Mid-Hawthorne Aquifer Percolation From
Sandstone
Boundary
Inflow
Recharge from
Canal Network
From
Sandstone
Boundary
InflowBaseflow
Change in
Storage
Inflows (inches) Outflows (inches)
To
SandstonePumping
Boundary
Outflow
Inflows (inches) Outflow (inches)
Change in
StorageSandstone Aquifer
Lower Tamiami Aquifer Boundary
Outflow
Percolation from
Lower Tamiami
From Mid-
Hawthorne
Boundary
Inflow
To Lower
Tamiami
Percolation
to Mid-
Hawthorne
PumpingBoundary
Outflow
Percolation from
Surficial
Percolation
to Lower
Tamiami
PumpingBoundary
Outflow
Change in
Storage
Change in
Storage
Outflows (inches)
Outflows (inches)
Percolation
To
Sandstone
Pumping
Evapo-
transpirationBaseflow
To
Surficial
Water Table Aquifer Infiltration from
Unsaturated Zone
Recharge from
Canal Network
From Lower
Tamiami
Inflows (inches)
Inflows (inches)
Boundary
Inflow

Element 1: Assessment of Existing Conditions – Watershed
V O L 1 COLLIER COUNTY WATERSHED
P A G E 18 MANAGEMENT PLAN – DRAFT
Mid-Hawthorn aquifer
The Mid-Hawthorn has little interaction with the
overlying aquifer systems. Less than 0.3 inch of water
moves between the Sandstone in Mid-Hawthorn
Aquifers across the study area. Withdrawals from this
aquifer are limited, but occur during the dry season.
Most of the pumping is in the Golden Gate – Naples Bay
watershed at the Collier County wellfield. Smaller
volumes are pumped from the Rookery Bay and
Cocohatchee-Corkscrew watersheds. There is no net
storage change in the Mid-Hawthorn aquifer as a result
of inflows and withdrawals.
Groundwater Aquifer Levels
Average annual and seasonal fluctuations in
groundwater surface levels (elevations) were predicted
and mapped for each of the aquifer systems.
Water Table aquifer
The gradient of the average annual groundwater
surface (Figure 1-15) is approximately 0.8 foot/mile
(0.016 percent) from the northeastern part of the
county, north of Immokalee, to the southwest. The
water surface gradient generally follows the
topographic slope of approximately 1.0 foot per mile
(0.020 percent). At a location north of Immokalee, the
Water Table aquifer exceeds 30 feet in elevation, while
groundwater elevations in the underlying Lower
Tamiami aquifer only reaches these levels during the
wet season, suggesting a perched water table.
Predicted annual fluctuation in the Water Table aquifer
(Figure 1-16) illustrates the difference between the
average annual maximum groundwater elevation and
the average annual minimum groundwater elevation.
Red areas indicate greater fluctuation in the
groundwater surface. These large fluctuations are
attributed to groundwater pumping to meet potable
water supply and irrigation demand during the dry
season. The extents of the areas of high demand are
related to the horizontal conductivity of the aquifers
and connectivity to other aquifers.
Lower Tamiami aquifer
The average annual groundwater surface elevations
and annual fluctuation in groundwater head elevations
are mapped in Figures 1-17 and 1-18. Results indicate a
high demand on this aquifer during the dry season in
the Okaloacoochee/SR 29 and Fakahatchee
watersheds, consistent with the agricultural and golf
course withdrawals exceed 9 and 12 inches,
respectively, from the Lower Tamiami aquifer during
the dry season.
Sandstone aquifer
Average annual groundwater surface elevations are
mapped in Figure 1-19. Similar to the Lower Tamiami
aquifer, an area of higher groundwater elevations
occurs north of Immokalee. Annual fluctuations in head
elevations for the Sandstone aquifer (Figure 1-20)
indicate a high demand on this aquifer during the dry
season. The Lee County wellfield draws from the
Sandstone aquifer and is the likely cause of the
drawdown in the northern portion of the Cocohatchee-
Corkscrew watershed. However, there is little pumping
directly from the Sandstone aquifer in the Faka Union
and Okaloacoochee/SR 29 watersheds, indicating
water is migrating from the Sandstone aquifer into the
Lower Tamiami aquifer in response to withdrawals. In
fact, more than 3 inches of groundwater migrates from
the Sandstone to the Lower Tamiami aquifer during the
average dry season.
Mid-Hawthorn aquifer
The depression in the Mid Hawthorn Aquifer at the
boundary between the Golden Gate – Naples Bay and
Rookery Bay (Figures 1-21 and 1-22) is likely due to
the is associated with the wellfield located there that
pumps water from the Mid-Hawthorn Aquifer. This
pattern of drawdown was not observed in the
Sandstone aquifer; indicating that there is little
interaction between the Mid-Hawthorn Aquifer and the
overlying Sandstone aquifer.
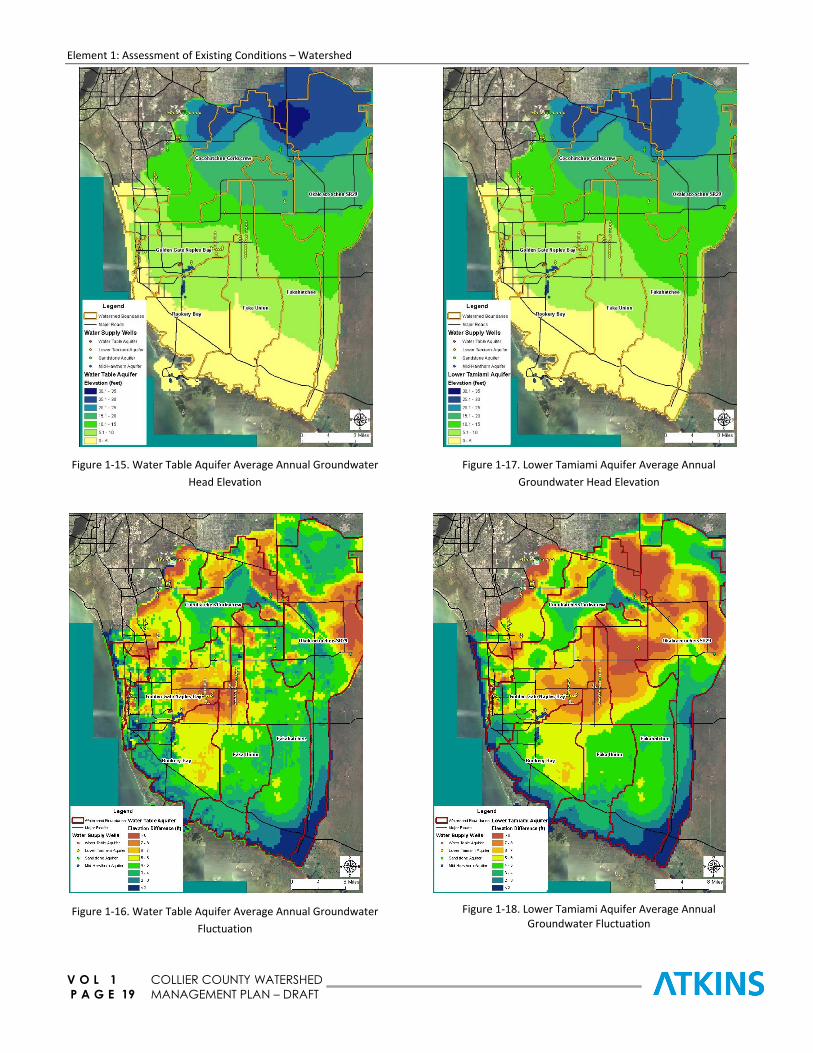
Element 1: Assessment of Existing Conditions – Watershed
V O L 1 COLLIER COUNTY WATERSHED
P A G E 19 MANAGEMENT PLAN – DRAFT
Figure 1-15. Water Table Aquifer Average Annual Groundwater
Head Elevation
Figure 1-16. Water Table Aquifer Average Annual Groundwater
Fluctuation
Figure 1-17. Lower Tamiami Aquifer Average Annual
Groundwater Head Elevation
Figure 1-18. Lower Tamiami Aquifer Average Annual Groundwater Fluctuation
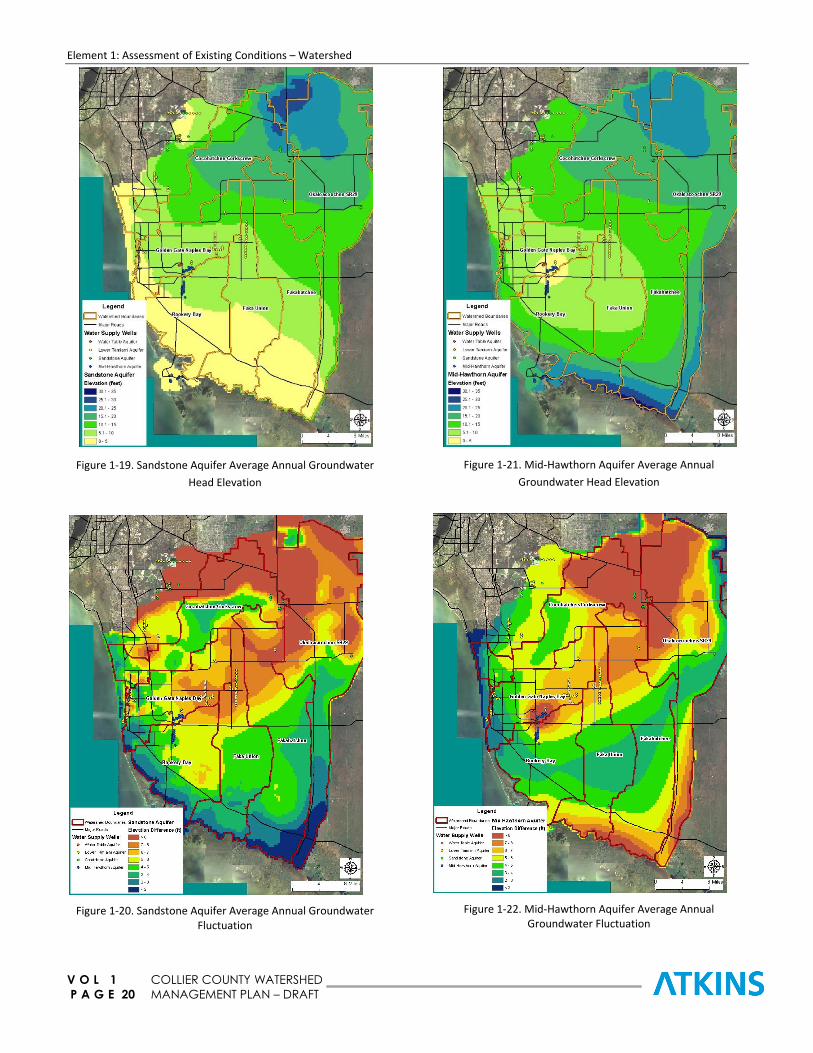
Element 1: Assessment of Existing Conditions – Watershed
V O L 1 COLLIER COUNTY WATERSHED
P A G E 20 MANAGEMENT PLAN – DRAFT
Figure 1-19. Sandstone Aquifer Average Annual Groundwater
Head Elevation
Figure 1-20. Sandstone Aquifer Average Annual Groundwater Fluctuation
Figure 1-21. Mid-Hawthorn Aquifer Average Annual
Groundwater Head Elevation
Figure 1-22. Mid-Hawthorn Aquifer Average Annual Groundwater Fluctuation
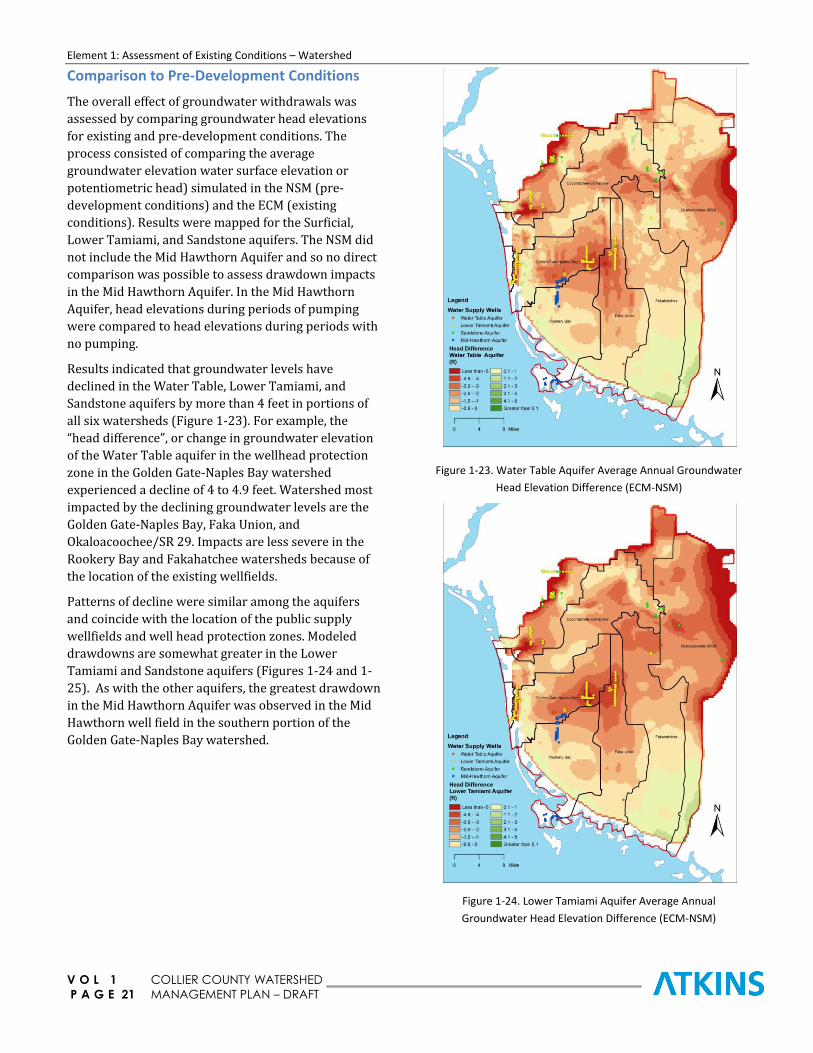
Element 1: Assessment of Existing Conditions – Watershed
V O L 1 COLLIER COUNTY WATERSHED
P A G E 21 MANAGEMENT PLAN – DRAFT
Comparison to Pre-Development Conditions
The overall effect of groundwater withdrawals was
assessed by comparing groundwater head elevations
for existing and pre-development conditions. The
process consisted of comparing the average
groundwater elevation water surface elevation or
potentiometric head) simulated in the NSM (pre-
development conditions) and the ECM (existing
conditions). Results were mapped for the Surficial,
Lower Tamiami, and Sandstone aquifers. The NSM did
not include the Mid Hawthorn Aquifer and so no direct
comparison was possible to assess drawdown impacts
in the Mid Hawthorn Aquifer. In the Mid Hawthorn
Aquifer, head elevations during periods of pumping
were compared to head elevations during periods with
no pumping.
Results indicated that groundwater levels have
declined in the Water Table, Lower Tamiami, and
Sandstone aquifers by more than 4 feet in portions of
all six watersheds (Figure 1-23). For example, the
“head difference”, or change in groundwater elevation
of the Water Table aquifer in the wellhead protection
zone in the Golden Gate-Naples Bay watershed
experienced a decline of 4 to 4.9 feet. Watershed most
impacted by the declining groundwater levels are the
Golden Gate-Naples Bay, Faka Union, and
Okaloacoochee/SR 29. Impacts are less severe in the
Rookery Bay and Fakahatchee watersheds because of
the location of the existing wellfields.
Patterns of decline were similar among the aquifers
and coincide with the location of the public supply
wellfields and well head protection zones. Modeled
drawdowns are somewhat greater in the Lower
Tamiami and Sandstone aquifers (Figures 1-24 and 1-
25). As with the other aquifers, the greatest drawdown
in the Mid Hawthorn Aquifer was observed in the Mid
Hawthorn well field in the southern portion of the
Golden Gate-Naples Bay watershed.
Figure 1-23. Water Table Aquifer Average Annual Groundwater
Head Elevation Difference (ECM-NSM)
Figure 1-24. Lower Tamiami Aquifer Average Annual
Groundwater Head Elevation Difference (ECM-NSM)

Element 1: Assessment of Existing Conditions – Watershed
V O L 1 COLLIER COUNTY WATERSHED
P A G E 22 MANAGEMENT PLAN – DRAFT
Figure 1-25. Sandstone Aquifer Average Annual Groundwater
Head Elevation Difference (ECM-NSM)
Effects of Increased Wellfield Pumping Rates
A computer model sensitivity run was conducted to
evaluate the effects of increasing pumping rates from
the existing wellfields. Although water demands in
Collier County are expected to increase by 50 percent
in the next 20 years, it was considered that an assumed
10 percent increase from the existing wellfields would
provide meaningful results to assess potential impacts.
For this sensitivity analysis, it was also assumed no
changes on irrigation or domestic self supply demands.
The initial sensitivity test consisted of comparing the
average annual minimum head elevation in each
aquifer predicted by the ECM against the average
annual head elevation in each aquifer as predicted by
the model with increased pumping. The results are
shown in maps that define the change in drawdown
resulting from the increased pumping in each aquifer.
Figures 1-26 – 1-29 show the increased drawdown in
each aquifer.
A second sensitivity test considered the effect of
increased pumping during a prolonged dry season. The
dry season of 2007 which began on November 1, 2006
and continued through June 2007 followed a wet
season with little rainfall. This average groundwater
elevation calculated for the dry season 2007 was used
to evaluate the effect of increased pumping during
prolonged drought conditions. Figures 1-30 – 1-33
show the extent of the increased drawdown during the
extended dry period.
In each of the aquifer systems, the extent of the
predicted areas influenced by pumping increases as a
result of increased pumping. The results show that
during periods of extended drought, the area of
influence extends from the City of Naples wellfield into
the northern portions of the Fakahatchee watershed
and that individual areas of influence have merged into
a single area of influence that encompasses almost the
entire area of the Golden Gate – Naples Bay watershed.
The results indicate that the availability of
groundwater is limited to meet long-term water supply
needs for Collier County. Increased pumping is
predicted to increase the risk of salt water intrusion
and potentially affect availability of water for domestic
self supply from the Water Table and Lower Tamiami
aquifer systems.
Figure 1-26. Water Table Aquifer Average Increase in Drawdown
with 10% Increase in Groundwater Withdrawal
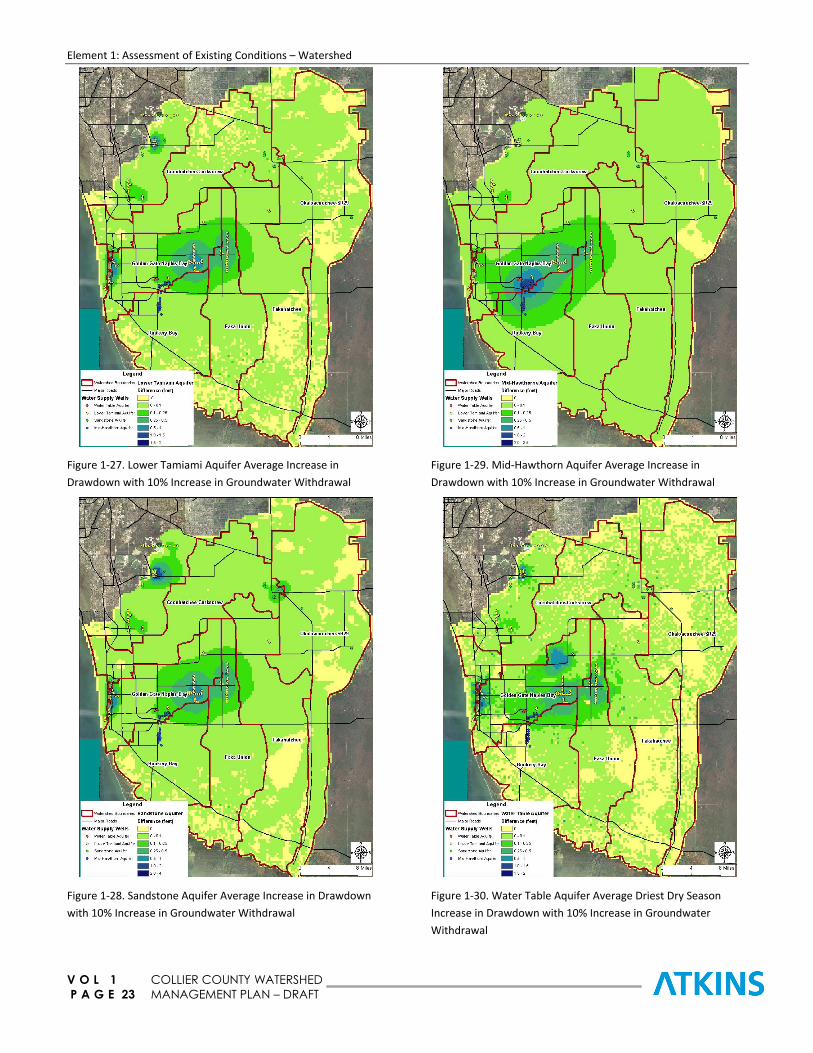
Element 1: Assessment of Existing Conditions – Watershed
V O L 1 COLLIER COUNTY WATERSHED
P A G E 23 MANAGEMENT PLAN – DRAFT
Figure 1-27. Lower Tamiami Aquifer Average Increase in
Drawdown with 10% Increase in Groundwater Withdrawal
Figure 1-28. Sandstone Aquifer Average Increase in Drawdown
with 10% Increase in Groundwater Withdrawal
Figure 1-29. Mid-Hawthorn Aquifer Average Increase in
Drawdown with 10% Increase in Groundwater Withdrawal
Figure 1-30. Water Table Aquifer Average Driest Dry Season
Increase in Drawdown with 10% Increase in Groundwater
Withdrawal

Element 1: Assessment of Existing Conditions – Watershed
V O L 1 COLLIER COUNTY WATERSHED
P A G E 24 MANAGEMENT PLAN – DRAFT
Figure 1-31. Lower Tamiami Aquifer Average Driest Dry Season
Increase in Drawdown with 10% Increase in Groundwater
Withdrawal
Figure 1-32. Sandstone Aquifer Average Driest Dry Season
Increase in Drawdown with 10% Increase in Groundwater
Withdrawal
Figure 1-33. Mid Hawthorn Aquifer Average Driest Dry Season
Increase in Drawdown with 10% Increase in Groundwater
Withdrawal

Element 1: Assessment of Existing Conditions – Watershed
V O L 1 COLLIER COUNTY WATERSHED
P A G E 25 MANAGEMENT PLAN – DRAFT
1.6: Groundwater Quality and Groundwater Pollutant Loads
Groundwater quality was characterized and pollutant loads to canals were estimated for
Collier County watersheds. Data indicated that dissolved oxygen concentration in
groundwater is significantly lower than the surface water standard, whereas total
nitrogen and phosphorus concentrations exceed corresponding surface water criteria. Iron
concentrations also exceed the surface water standard.
Introduction
Groundwater quality in the Cocohatchee-Corkscrew,
Golden Gate-Naples Bay, Rookery Bay, and the
combined Faka Union, Okaloacoochee/SR 29,
Fakahatchee watersheds was characterized and the
groundwater pollutant loads to the canals in the
watersheds were estimated. Pollutants identified for
analyses were dissolved oxygen, total nitrogen and
phosphorus, copper, and iron, based on National
Pollutant Discharge Elimination System (NPDES)
pollutant list. In addition, the analyses included a
preliminary regional assessment of the potential
impacts of septic tanks on groundwater quality in the
watersheds. This effort focused on the groundwater
quality in the Water Table and Lower Tamiami aquifer
systems. The other aquifers are confined and are not
known to interact with the surface water drainage
system.
Methods
Concentrations of the water quality parameters in the
groundwater in Collier County and estimates of
pollutant loads from the local aquifers into the surface
water hydrologic network that eventually reaches the
receiving estuaries were calculated.
Because groundwater systems are more regional in
nature when compared with surface water systems, a
Kriging interpolation method was applied to create
regional groundwater concentration maps for each
water quality constituent. For each well with available
data, median concentrations were calculated for each
water quality parameter of interest and groundwater
concentrations were predicted for each cell in the
hydrologic/hydraulic model domain. Consequently, the
groundwater quality analysis was consistent with the
surface water modeling approach.
Pollutant loads associated with groundwater discharges from the Surficial and Lower Tamiami aquifers to the surface water system were determined
based on the calculated baseflow to the drainage network and the predicted average concentrations of each parameter in groundwater.
Results
Dissolved Oxygen
Dissolved oxygen concentrations are not typically
monitored in groundwater. Therefore the data
available for analysis are limited and most are from
wells associated with the Gordon River and the
Picayune Strand. No groundwater quality data are
available for the Cocohatchee-Corkscrew, Fakahatchee,
and Okaloacoochee/SR 29 watersheds, or the eastern
portion of the Golden Gate watershed (Figure 1-34).
Figure 1-34. Dissolved Oxygen Concentration Interpolation
The data evaluation predicts that dissolved oxygen concentrations do not vary significantly across the study area and are less than 3.5 mg/L. Adamski (2001) states that dissolved-oxygen concentrations in ground
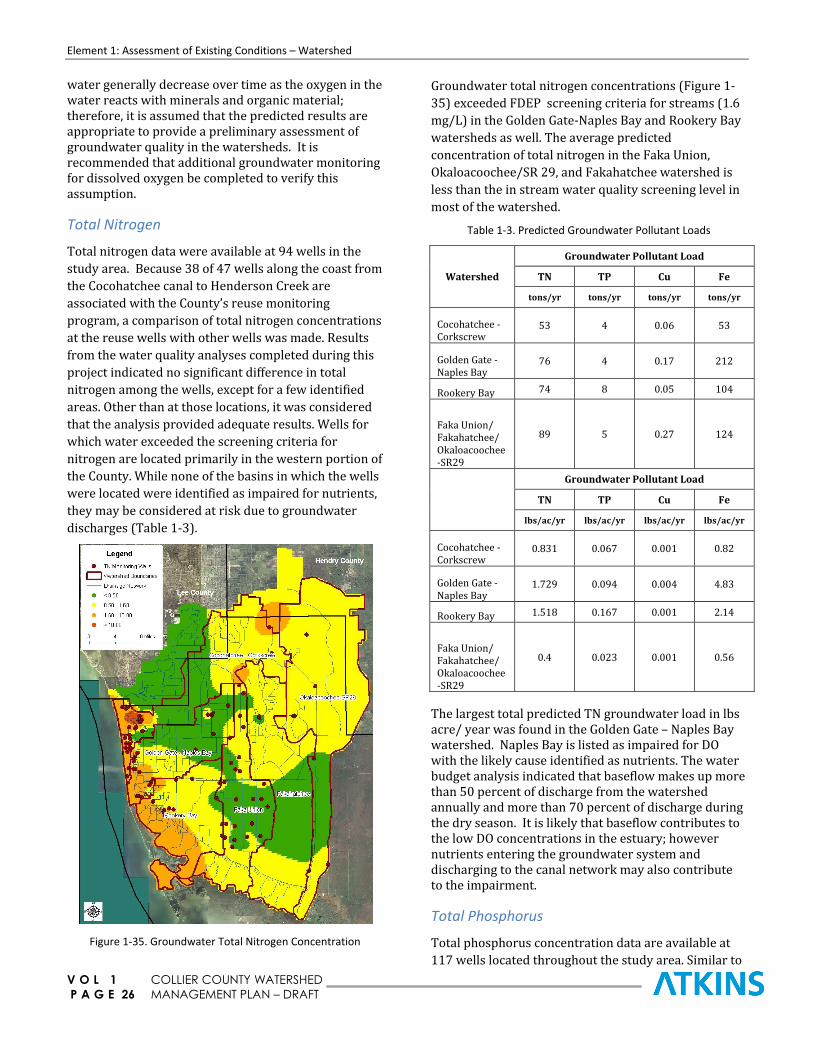
Element 1: Assessment of Existing Conditions – Watershed
V O L 1 COLLIER COUNTY WATERSHED
P A G E 26 MANAGEMENT PLAN – DRAFT
water generally decrease over time as the oxygen in the water reacts with minerals and organic material; therefore, it is assumed that the predicted results are appropriate to provide a preliminary assessment of groundwater quality in the watersheds. It is recommended that additional groundwater monitoring for dissolved oxygen be completed to verify this assumption.
Total Nitrogen
Total nitrogen data were available at 94 wells in the
study area. Because 38 of 47 wells along the coast from
the Cocohatchee canal to Henderson Creek are
associated with the County’s reuse monitoring
program, a comparison of total nitrogen concentrations
at the reuse wells with other wells was made. Results
from the water quality analyses completed during this
project indicated no significant difference in total
nitrogen among the wells, except for a few identified
areas. Other than at those locations, it was considered
that the analysis provided adequate results. Wells for
which water exceeded the screening criteria for
nitrogen are located primarily in the western portion of
the County. While none of the basins in which the wells
were located were identified as impaired for nutrients,
they may be considered at risk due to groundwater
discharges (Table 1-3).
Figure 1-35. Groundwater Total Nitrogen Concentration
Groundwater total nitrogen concentrations (Figure 1-
35) exceeded FDEP screening criteria for streams (1.6
mg/L) in the Golden Gate-Naples Bay and Rookery Bay
watersheds as well. The average predicted
concentration of total nitrogen in the Faka Union,
Okaloacoochee/SR 29, and Fakahatchee watershed is
less than the in stream water quality screening level in
most of the watershed.
Table 1-3. Predicted Groundwater Pollutant Loads
Watershed
Groundwater Pollutant Load
TN TP Cu Fe
tons/yr tons/yr tons/yr tons/yr
Cocohatchee - Corkscrew
53 4 0.06 53
Golden Gate - Naples Bay
76 4 0.17 212
Rookery Bay 74 8 0.05 104
Faka Union/ Fakahatchee/ Okaloacoochee-SR29
89 5 0.27 124
Groundwater Pollutant Load
TN TP Cu Fe
lbs/ac/yr lbs/ac/yr lbs/ac/yr lbs/ac/yr
Cocohatchee - Corkscrew
0.831 0.067 0.001 0.82
Golden Gate - Naples Bay
1.729 0.094 0.004 4.83
Rookery Bay 1.518 0.167 0.001 2.14
Faka Union/ Fakahatchee/ Okaloacoochee-SR29
0.4 0.023 0.001 0.56
The largest total predicted TN groundwater load in lbs acre/ year was found in the Golden Gate – Naples Bay watershed. Naples Bay is listed as impaired for DO with the likely cause identified as nutrients. The water budget analysis indicated that baseflow makes up more than 50 percent of discharge from the watershed annually and more than 70 percent of discharge during the dry season. It is likely that baseflow contributes to the low DO concentrations in the estuary; however nutrients entering the groundwater system and discharging to the canal network may also contribute to the impairment.
Total Phosphorus
Total phosphorus concentration data are available at
117 wells located throughout the study area. Similar to
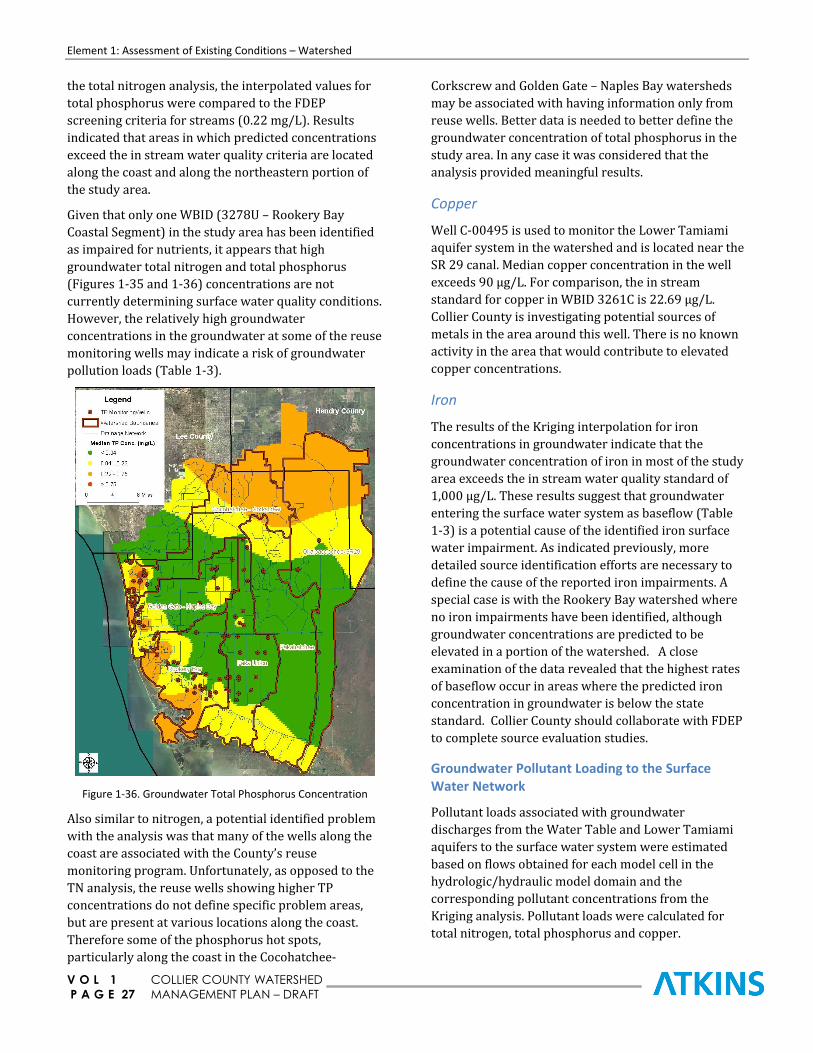
Element 1: Assessment of Existing Conditions – Watershed
V O L 1 COLLIER COUNTY WATERSHED
P A G E 27 MANAGEMENT PLAN – DRAFT
the total nitrogen analysis, the interpolated values for
total phosphorus were compared to the FDEP
screening criteria for streams (0.22 mg/L). Results
indicated that areas in which predicted concentrations
exceed the in stream water quality criteria are located
along the coast and along the northeastern portion of
the study area.
Given that only one WBID (3278U – Rookery Bay
Coastal Segment) in the study area has been identified
as impaired for nutrients, it appears that high
groundwater total nitrogen and total phosphorus
(Figures 1-35 and 1-36) concentrations are not
currently determining surface water quality conditions.
However, the relatively high groundwater
concentrations in the groundwater at some of the reuse
monitoring wells may indicate a risk of groundwater
pollution loads (Table 1-3).
Figure 1-36. Groundwater Total Phosphorus Concentration
Also similar to nitrogen, a potential identified problem
with the analysis was that many of the wells along the
coast are associated with the County’s reuse
monitoring program. Unfortunately, as opposed to the
TN analysis, the reuse wells showing higher TP
concentrations do not define specific problem areas,
but are present at various locations along the coast.
Therefore some of the phosphorus hot spots,
particularly along the coast in the Cocohatchee-
Corkscrew and Golden Gate – Naples Bay watersheds
may be associated with having information only from
reuse wells. Better data is needed to better define the
groundwater concentration of total phosphorus in the
study area. In any case it was considered that the
analysis provided meaningful results.
Copper
Well C-00495 is used to monitor the Lower Tamiami
aquifer system in the watershed and is located near the
SR 29 canal. Median copper concentration in the well
exceeds 90 µg/L. For comparison, the in stream
standard for copper in WBID 3261C is 22.69 µg/L.
Collier County is investigating potential sources of
metals in the area around this well. There is no known
activity in the area that would contribute to elevated
copper concentrations.
Iron
The results of the Kriging interpolation for iron
concentrations in groundwater indicate that the
groundwater concentration of iron in most of the study
area exceeds the in stream water quality standard of
1,000 µg/L. These results suggest that groundwater
entering the surface water system as baseflow (Table
1-3) is a potential cause of the identified iron surface
water impairment. As indicated previously, more
detailed source identification efforts are necessary to
define the cause of the reported iron impairments. A
special case is with the Rookery Bay watershed where
no iron impairments have been identified, although
groundwater concentrations are predicted to be
elevated in a portion of the watershed. A close
examination of the data revealed that the highest rates
of baseflow occur in areas where the predicted iron
concentration in groundwater is below the state
standard. Collier County should collaborate with FDEP
to complete source evaluation studies.
Groundwater Pollutant Loading to the Surface Water Network
Pollutant loads associated with groundwater
discharges from the Water Table and Lower Tamiami
aquifers to the surface water system were estimated
based on flows obtained for each model cell in the
hydrologic/hydraulic model domain and the
corresponding pollutant concentrations from the
Kriging analysis. Pollutant loads were calculated for
total nitrogen, total phosphorus and copper.

Element 1: Assessment of Existing Conditions – Watershed
V O L 1 COLLIER COUNTY WATERSHED
P A G E 28 MANAGEMENT PLAN – DRAFT
Results of the analysis conducted as part of this project
indicated that the majority of the area-wide pollution
load originates in the surface water system. About 26
and 12 percent of the total nitrogen and total
phosphorus load into the estuaries, respectively, are
from groundwater sources, whereas the groundwater
load of copper represents about 25 percent of the total.
It is to be noted, however, that Rookery Bay is the only
watershed for which the predicted total nitrogen load
from groundwater is approximately the same as the
surface water load. That can be attributed to the
estimated higher groundwater nitrogen concentrations
along the coast.
Assessment of Pollution Loads from Septic Tanks
Septic tanks are common in parts of Collier County that
are not served by sewer. They are also potential
sources of nutrient discharges into the receiving water
bodies by way of percolation into the Water Table
aquifer. The objective of this analysis was to provide a
preliminary and region-wide assessment of the
potential effect of septic tanks on the groundwater
concentrations of total nitrogen and total phosphorus.
This was done by first estimating the number of septic
tanks in each cell within the model domain and
subsequently conducting a correlation analysis
between septic tank density and constituent
concentration in the groundwater. Results of the
analysis indicated that, on a region-wide basis, there is
little correlation between total and nitrogen and total
phosphorus and septic tank density. It should be kept
in mind that this is a regional analysis that does not
reflect localized problems.
Conclusions
Kriging interpolation indicated that dissolved
oxygen concentrations in groundwater are less
than 1.5 mg/L throughout most of Collier County,
compared to the surface water standard of 5 mg/L.
Given the significant amount of baseflow entering
the system, it is likely that baseflow contributes to
the low dissolved oxygen levels in the canal
network, However, human activities are also
factors that can contribute to reduced dissolved
oxygen concentrations.
Total nitrogen concentrations in groundwater
exceed the corresponding screening criteria for
surface water in a large portion of the study area.
Total phosphorus concentrations exceed the
criteria along the coast and in the northern portion
of the study area.
Pollution load estimates indicate that groundwater
is a potential contributor to the nutrient
impairment in the Rookery Bay watershed.
Copper concentrations in groundwater are
typically low throughout the County, suggesting
that copper impairments in the canal network can
be attributed to surface runoff.
Iron concentrations in groundwater were elevated
relative to the Class 3 surface water standard in
several areas that correspond with identified
impairment locations in the canal network.
Groundwater appears to be a potential source of
iron to the surface water system.
A preliminary assessment indicated little
correlation between total nitrogen and total
phosphorus and septic tank density, suggesting
that septic tanks are not a water quality issue in
Collier County. However, as this is a regional
analysis, site specific studies in problem areas may
be appropriate to fully define the nutrient
contributions from septic tanks.
It was suspected that the use of data from wells in
the County’s reuse program may have introduced
bias in the analysis. A data review completed as
part of this project indicated that the results are
adequate.

Element 1: Assessment of Existing Conditions – Watershed
V O L 1 COLLIER COUNTY WATERSHED
P A G E 29 MANAGEMENT PLAN – DRAFT
1.7: Natural Systems: Reference Period Comparison
The conversion of natural wetlands and uplands represent a loss of nearly 273,000 acres (426
square miles) of wildlife habitat, natural water storage, filtration, and open recreational space in
these 6 watersheds.
Pre-development and current conditions were
compared to estimate the loss of native vegetation over
the past 50–60 years in the Cocohatchee-Corkscrew,
Golden Gate-Naples Bay, Rookery Bay, and combined
Faka Union, Okaloacoochee/SR 29, Fakahatchee
watersheds. Losses of native vegetation total nearly
273,000 acres. Losses were due to primarily urban
development and were most conspicuous in the Golden
Gate-Naples watershed.
Introduction
Vegetation changes were quantified as the change in
the number of acres for each vegetation community in
each watershed, and further analyzed to determine
losses as a result of conversion to specific types of
development. The pre-development data served as the
reference period or an index against which to evaluate
current vegetation conditions in evaluating the natural
system function. Changes in areal extent of natural
vegetation communities and the causes of those
changes are reported here.
Methods
Vegetation changes were quantified as the change in
number of acres in each vegetation community for each
watershed, and further examined to determine losses
due to conversion to specific types of development (i.e.,
change analysis). Changes were quantified from a
simple comparison of pre-development and current
vegetation data. Land use conversions were quantified
using a GIS digital overlay process that generates a
matrix of “from/to” changes in land use and cover (e.g.
cypress swamp to urban). Vegetation classes from
MIKE SHE, Florida Land Use and Cover and Forms
Classification System (FLUCCS), and the Southwest
Florida Feasibility Study (SWFFS) were developed as
part of a “crosswalk” so that comparisons between pre-
development and 2007 vegetation maps could be made.
Figure 1-37 shows a comparison of pre-development
and 2007 vegetation maps.
Results
Cocohatchee-Corkscrew Watershed
The Cocohatchee-Corkscrew Watershed had a nearly
85 percent reduction in acres of pre-development
uplands and a loss of more than 30 percent of pre-
development freshwater wetlands. Native uplands
were replaced by primarily agricultural land uses,
while urban development accounted for the greatest
loss of wetlands. In 2007, the watershed included 8,300
acres of undeveloped uplands (16 percent of the pre-
development acres) and 51,000 acres of freshwater
wetlands (71 percent of the pre-development acres).
Golden Gate-Naples Bay Watershed
The Golden Gate-Naples Bay watershed had the
greatest loss of pre-development vegetation
communities when compared with the other
watersheds, with a loss of almost 70 percent of wetland
acres and over 80 percent loss of native uplands. Unlike
the Cocohatchee-Corkscrew watershed, the largest
conversion of lands in the Golden Gate-Naples Bay
watershed occurred due to urban development. In
2007, there were just over 17,000 acres of wetlands
(31 percent of the pre-development amount) and
25,000 acres of undeveloped uplands (17 percent of
the pre-development amount) in the watershed.
Rookery Bay Watershed
The Rookery Bay Watershed had the smallest loss of
pre-development vegetation communities of the three
primary watersheds, with a loss of approximately 30
percent of wetland acreage and less than 50 percent of
native uplands. The Rookery Bay watershed still
included approximately 42,000 acres of wetlands (70
percent of the pre-development amount), 8,500 acres
of undeveloped uplands (52 percent of the pre-
development amount), and 16,000 acres of tidal
systems (87 percent of the pre-development amount).

Element 1: Assessment of Existing Conditions – Watershed
V O L 1 COLLIER COUNTY WATERSHED
P A G E 30 MANAGEMENT PLAN – DRAFT
Faka Union, Okaloacoochee/SR 29, and Fakahatchee Watersheds
These three watersheds were combined for analysis
because they were assigned lower priority relative to
the previously described three watersheds. As an
example, existing acres of wetlands make up 85 percent
of the pre-development acres freshwater wetlands and
87 percent of the former tidal wetlands. However, only
30 percent of the pre-development native uplands
remain. The largest conversion of lands in this set of
watersheds occurred due to agriculture.
Conclusions
The conversion of natural wetlands and uplands
represent a loss of nearly 273,000 acres (426 square
miles) of wildlife habitat, natural water storage,
filtration, and open recreational space in these 6
watersheds. Of the three primary watersheds, the
greatest percentage loss occurred due to urban
development in the Golden Gate-Naples Bay watershed,
with almost 60 percent of the watershed now
categorized as urban. In contrast, just 23 percent of the
lands within Rookery Bay watershed are categorized as
any type of development. Of the 273,000 acres of
natural lands converted to other land uses throughout
these six basins, agriculture accounts for approximately
97,000 acres (12 percent of the combined watershed
area).
Figure 1-37. Model-Wide Overview, Land Use and Land Cover Changes from Pre-Development to 2007

Element 1: Assessment of Existing Conditions – Watershed
V O L 1 COLLIER COUNTY WATERSHED
P A G E 31 MANAGEMENT PLAN – DRAFT
1.8: Natural Systems: Functional Assessment
A method was developed to assess and compare systems functions of existing and pre-
development conditions in the Collier County watershed and to quantify the loss of natural
system functions. The assessment will be used to develop performance measures against
which restoration project success can be measured under a later task (performance
measures are addressed in Chapter 2).
Introduction
A landscape-level functional assessment method was
developed and used to assess, and assign value to,
existing natural systems conditions in the Cocohatchee-
Corkscrew, Golden Gate-Naples Bay, Rookery Bay, and
the combined Faka Union, Okaloacoochee/SR 29,
Fakahatchee watersheds in Collier County. The same
method was developed for use as resource protection-
based performance measures for the evaluation of
proposed restoration projects (described in Chapter 2).
Methods
The Uniform Mitigation Assessment Method (UMAM,
Chapter 62-345 Florida Administrative Code) provided
the template from which to design the functional
assessment method for this project. Modifications from
UMAM were made to implement the functional
assessment at the watershed level, rather than the site-
specific level for which UMAM was designed
Similar to UMAM, the condition of a natural system for
the functional assessment addresses landscape
position, vegetation, and hydrology. Scores are
assigned on a scale of 1 to 10, based on the degree of
change compared to a reference (in this case pre-
development). A score of 10 is appropriate where a site
has retained optimal value (100 percent of the value
compared to the reference condition), 7 for moderate
value (70 percent of the value compared to the
reference condition), 4 for minimal value (40 percent of
the value compared to the reference condition), 0 for
no value. Whole-number scores between 1 and 9 are
used as appropriate to represent interpolated
conditions.
The functional assessment method applied herein
relied exclusively on available GIS data due to the
watershed-scale analysis required here and the
resolution available for the analyses and mapping is a
grid cell size of 1500 X 1500 feet. As indicated
previously, three independent scores, or indices, were
developed to evaluate the current condition with
respect to the appropriate referenced condition:
Vegetation Score
Hydrology Score
Landscape Suitability Index (LSI)
Vegetation scores (Figure 1-38) represent the value of
the landscape (cells) based on the degree to which the
pre-development vegetation persists under existing
conditions. For example, dramatic conversions from
pre-development wet prairie vegetation to a developed
urban land use, for example, would be assigned low
scores, while little or no change in vegetation cover
(i.e., no change from pre-development, or shift to
another natural vegetation classification) would be
scored higher. The scores for agriculture and other
developed areas reflect the degree of support for
wetland resources. Scores are assigned to each
community based on the information listed below and
are based on conversion between FLUCCS designations
and the previously developed Pre-Development
Vegetation Map (PDVM). No other values were
assigned during this evaluation.
Score=10. Natural water systems that are present
in both existing and pre-development conditions
and areas that retained the same dominant stratum
and ecosystem type (freshwater forested wetland
to freshwater forested wetland).
Score=8. Areas where the vegetation has shifted,
but has retained the same ecosystem type
(forested freshwater wetland to herbaceous
freshwater wetland).
Score=6. Natural systems that have been converted
to an artificial water body.

Element 1: Assessment of Existing Conditions – Watershed
V O L 1 COLLIER COUNTY WATERSHED
P A G E 32 MANAGEMENT PLAN – DRAFT
Score=4. Natural systems that have been converted
to agriculture.
Score=0. Natural systems that have been converted
to a developed land use such as high density urban
or bare ground.
The hydrology score (Figure 1-39) is a measure of the
effects of depth and duration (hydroperiod) of
inundation and represents the functional value of a cell
based on the degree to which the cell retains the
hydrological characteristics of the pre-development
conditions. Pre-development hydrological conditions
are estimated based on the typical range of depth and
duration (hydroperiod) of inundation of the vegetation
community present on the PDVM. Like the vegetation
scores, no change from pre-development is scored 10,
while total loss of hydrology (e.g., a cell dominated by a
pre-development wetland or open water body but now
experiences no inundation) would result in a score of 0.
The LSI is an index of the effects of adjacent lands on
the target site and represents the degree to which
adjacent lands provide or inhibit connectivity, buffers,
and corridors. Higher scores (Figure 1-40) indicate
adjacent natural lands or lands conducive to wildlife
passage, while lower LSI scores are surrounded by land
uses that act as barriers. Even a natural preserve area
would score low if surrounded by commercial land
uses, while a parcel with otherwise poor conditions
would score high if surrounded by pasture or natural
areas. Cells were first assigned LSIs by FLUCCS codes,
e.g., natural systems and open water = 10, pine
plantation=9.4, crops=6.07, industrial=1.87, etc. An LSI
score for a cell was then calculated as the average of
the 8 surrounding cells.
Results
In general, the combined Faka Union,
Okaloacoochee/SR 29, and Fakahatchee watersheds
exhibited the highest functional value (the least change
from pre-development), when compared with the other
watersheds. The measured functional value was less in
the Rookery Bay and Cocohatchee-Corkscrew
watersheds, and least in the Golden Gate-Naples Bay
watershed (see Table 1-4).
Table 1-4. Average Functional Values of Non-Urban Lands, by Watershed
Watershed
Non-Urban Acres
Average Vegetation
Score
Average Hydrologic
Score Average LSI Score
Cocohatchee-Corkscrew
111,250 7 7 8
Golden Gate-Naples 36,627 5 6 6
Rookery Bay 83,105 8 6 9
Faka Union/ Okaloacoochee SR 29/ Fakahatchee
431,414 9 6 9
Figure 1-38. Vegetation, Functional Assessment

Element 1: Assessment of Existing Conditions – Watershed
V O L 1 COLLIER COUNTY WATERSHED
P A G E 33 MANAGEMENT PLAN – DRAFT
Figure 1-39. Combined Hydrology Score, Functional Assessment
Figure 1-40. Landscape Suitability Index (LSI)
Cocohatchee-Corkscrew Watershed
The functional assessment of the non-urban portions of
the Cocohatchee-Corkscrew indicates that the central
part of the watershed just east of Corkscrew Swamp
system maintains a high functional value, as measured
by all 3 parameters, while the northern and eastern
portions have relatively high hydrology and LSI scores
and moderate vegetation scores due to non-pasture
agricultural lands. The LSI is high (7 or greater)
throughout the non-urban portion of the watershed
due to natural and agricultural land uses. Vegetation
and hydrology scores are somewhat lower due to
conversion to agricultural uses.
Golden Gate-Naples Bay Watershed
Nearly 60 percent (over 50,000 acres) of the Golden
Gate-Naples Bay watershed is urban land not suitable
for large ecological
restoration projects.
Even the non-urban
areas have relatively
low ecological value,
with an average
vegetation score of 5
and hydrology and
LSI scores of 6.
However, this present opportunities for both
restoration of natural areas, and improved urban
landscape through policy changes regarding new
development.
Rookery Bay Watershed
The functional assessment in this watershed reflects
the low proportion (30 percent) of the watershed that
has been converted to urban or agricultural uses.
Scores are low in the vicinity of Belle Meade and
Tamiami Trail, but relatively higher in the remainder of
the watershed. Overall, functional values are higher
than in Golden Gate-Naples and Cocohatchee-
Corkscrew watersheds, with a watershed-wide average
LSI score of 9 and average vegetation score of 8.
The large extent of undeveloped and agricultural lands
in this watershed provides opportunities for
restoration, while the functional values indicate
opportunities for improvements via hydrological
restoration throughout these lands.
Faka Union, Okaloacoochee/SR 29, and Fakahatchee Watersheds
These watersheds, individually and as a whole, retain
relatively high functional value, with average

Element 1: Assessment of Existing Conditions – Watershed
V O L 1 COLLIER COUNTY WATERSHED
P A G E 34 MANAGEMENT PLAN – DRAFT
vegetation and LSI scores of 9, and hydrological score
average of 6. The mapped scores indicate higher
vegetation and LSI scores south of I-75 than north, and
higher hydrology scores in the north than in the south.
Resource Protective Areas
Results of this analysis were also used to identify
resource protective areas that are not included in any
of the existing land conservation or land protection
programs such that recommendations about protection
measures can be assessed as part of the WMP. The
methodology consisted of comparing the total extent of
the identified resource protective lands with the extent
of the areas included in the existing programs. Results
shown in Figure 1-41indicate that much of the
identified resource-protective lands are currently
included in the existing conservation and protection
programs. Recommendations regarding protection for
the areas not currently protected are described in
Volume 3 of the WMP.
Conclusions
Vegetation, hydrology, and landscape scores were
developed to assess functional values of the natural
system. These scores can be used as indicators of
hydrologic restoration and will provide opportunities
for quantifying the impact of future natural resources
restoration programs in Collier County. As expected,
the areas most impacted by human activities,
particularly in the Golden Gate – Naples Bay and
Rookery Bay watersheds received the lowest scores,
whereas the Faka Union, Okaloacoochee/SR 29, and
Fakahatchee watersheds, individually and as a whole,
have retained relatively high functional values,
Figure 1-41. Resource Protective Lands not Currently Protected

V O L 1 COLLIER COUNTY WATERSHED
P A G E 35 MANAGEMENT PLAN – DRAFT
SUMMARY ASSESSMENT OF EXISTING CONDITIONS – ESTUARIES
1.9: Volume and Timing of Freshwater Inflows
The volume and timing of freshwater inflows to the Wiggins Pass, Naples Bay, Rookery Bay, and
Ten Thousand Islands estuaries were compared for existing and pre-development conditions as a
means to define water surplus and deficit targets for potential restoration projects in Collier
County.
Introduction
Historical fresh water flow patterns in Collier County
have changed over the years due to increased
development. The consequences have been increased
freshwater flows into the estuaries and changes to the
estuarine systems resulting from reduced salinity and
increased deliveries of organic sediments. Quantifying
these changes is important to developing any
restoration projects.
Methods
The changes in freshwater flows (surplus and deficits)
into the estuaries were assessed by comparing existing
conditions with natural (or pre-development)
conditions through the use of hydrology/hydraulic
models. The results provide a means with which to
determine the monthly water surplus or deficit targets
for restoration.
Existing freshwater discharges from the watershed into
the estuaries were characterized based on results of
the MIKE SHE/ MIKE 11 Existing Conditions model
(ECM), which represents 2007 land use conditions in
Collier County and was calibrated against surface water
stage and flow and groundwater elevation data.
Predevelopment conditions were characterized using
the results of the Natural Systems Model (NSM), which
was developed for the Southwest Florida Feasibility
Study (SWFFS) area. The NSM represents land use and
conveyance systems under pre-development
conditions. Also, it assumes the absence of the existing
water control structures. A full description of the model
can be found in the report titled “Final Report, Natural
Systems Model (NSM) Scenario Southwest Florida
Feasibility Study” (SDI, 2007). The model domain
includes the BCB as well as the Caloosahatchee and
Estero River Basins.
The results of the ECM and NSM comparisons were
validated against salinity:flow analysis conducted using
available salinity and flow data to create salinity:flow
relationships. Flow deficits or surpluses required to
reach historical salinity targets were calculated at each
of the monitoring stations shown in Figure 1-42. These
results were then compared with those from the ECM
and NSM analysis.
Results
The analysis included average annual, seasonal, and
monthly assessments of flow comparisons. Figures 1-
43 and 1-44 (red bars) depict the average surplus
and/or deficit of fresh water inflows to each of the
estuaries during the wet and dry seasons, respectively,
based on the ECM to NSM comparison. More detailed
discussions are included in Volume 4 of this report.
Following are summaries of finding for each estuary.
Wiggins Pass Estuary
Analyses results indicate that Wiggins Pass is
experiencing a surplus of approximately two inches of
freshwater inflows compared to pre-development
conditions during the wet season. This is likely due to
new development in the western portion of the
watershed, particulatly along the Cocohatchee canal.
The monthkly flow analysis indicate that flow increases
begin earlier in the year and continue longer than in
the pre-development period.
Naples Bay Estuary
The magnitude of development experienced by this
watershed, coupled with the extensive network of
drainage canals and the substantial disruption of
drainage patterns (the Golden Gate Main Canal
effectively increased the extent of the watershed
drainage area from approximately 50 to approximately
135 square miles), has created an average freshwater

Summary Assessment of Existing Conditions – Estuaries
V O L 1 COLLIER COUNTY WATERSHED
P A G E 36 MANAGEMENT PLAN – DRAFT
surplus of close to 20 inches during the wet season. A
surplus of close to seven inches has also been
estimated for the dry season. The dry season surplus
occurred in June, November, and December. The excess
flows during November and December shown by the
monthly analysis are likely due to delayed runoff
resulting from above-average rainfall during 2003 and
2005. The results do not indicate a significant change in
the timing of discharges. These results are consistent
with previous studies (Black, Crow, and Eidsness, 1974;
SFWMD, 2007).
Figure 1-42. Flow and Salinity Monitoring
Stations in Collier County
Rookery Bay Estuary
The main impact of human activities in terms of
freshwater discharges from the watershed have related
to timing. The ECM vs. NSM results indicate a small
flow deficit during the dry season (October through
May) and a flow surplus during the wet season (June
through September). Results of the ECM and the NSM
indicate that the total average annual volume
discharged to the estuary is similar. During the dry
season, the flow surplus can be attributed to the flow
contributions from the secondary and uncontrolled
releases to the estuary systems.
Ten Thousand Islands Estuary
The Ten Thousand Islands Estuary receives freshwater
discharges from the Faka Union, Okaloacoochee / SR
29, and Fakahatchee watersheds. Control structures
manage the discharge from the Faka Union and SR 29
canals into the estuary. Model results indicate that a
freshwater surplus is discharged to the estuary
primarily during the wet season. The excess wet season
flow is dominated by discharges from the largely
impacted Faka Union watershed and not from the
Okaloacoochee/SR 29 and Fakahatchee watersheds,
which have been impacted by development to a much
smaller degree.
Figure 1-43. Average Wet Season Freshwater Surplus/Deficit in
Collier County Estuaries
Figure 1-44. Average Dry Season Freshwater Surplus/Deficit in
Collier County Estuaries
Salinity Analysis
The ECM and NSM results were further verified by
conducting a salinity analysis that consisted of
analyzing measured salinities at the discharge points
and comparing them to a location that has been subject
to minimum historical development impacts. The
estuarine surplus or deficit of freshwater discharges
was then estimated based on calculated salinity vs. flow

Summary Assessment of Existing Conditions – Estuaries
V O L 1 COLLIER COUNTY WATERSHED
P A G E 37 MANAGEMENT PLAN – DRAFT
relationships. Results are also shown in Figures 1-43
and 1-44 (green bars).
The similarity of the ECM vs. NSM results to those from
the salinity analysis (for wet and dry seasons) provides
confidence in the results of the overall analysis.
For the Rookery Bay estuary, the salinity analysis
indicates a wet season deficit and a wet season surplus.
The difference between the results of the salinity and
model analyses is that the salinity analysis includes
flows from the Henderson Creek Canal, which drains
approximately 40 percent of the watershed. In contrast,
the ECM vs. NSM analysis considers flows from the
entire watershed and includes the urbanized Lely Area
in the western portion of the watershed and the
agricultural areas in the southeastern portion of the
watershed.
The salinity analysis also shows that during the dry
season there is a flow deficit from the primary canals to
the Wiggins Pass, Rookery Bay, and Ten Thousand
Islands estuaries. This is not unexpected, given the
most downstream control structures in the
Cocohatchee, Henderson Creek, and Faka Union Canals
often prevent flows during the dry season.
Conclusions
Results of the ECM and NSM models were used to
characterize the freshwater discharges into Collier
County estuaries. Model results are comparable and
validate the use of the ECM to evaluate potential
restoration projects. Compared with pre-development
conditions, discharges to Wiggins Pass, Naples Bay, and
Ten Thousand Islands estuaries are excessive during
the wet season.
In the Rookery Bay estuary, the difference in timing
flows to the estuary appears more important: the
system receives too much water during the wet season
and too little water during the dry season.
The pre-development flow estimates generated from
the NSM offer a baseline against which surplus or
deficit flow targets for restoration projects can be
measured (performance measures are discussed in
Chapter 2).

Summary Assessment of Existing Conditions – Estuaries
V O L 1 COLLIER COUNTY WATERSHED
P A G E 38 MANAGEMENT PLAN – DRAFT
1.10: Quality of Freshwater Inflows
Water quality of freshwater flows entering the Wiggins Pass, Naples Bay, Rookery Bay, and
Ten Thousand Islands estuaries is characterized here. Annual pollutant loads were
calculated for each watershed and for basins (designated with water body identification
numbers, “WBIDs”) in the watersheds.
Introduction
Water quality was characterized for 6 watersheds that
discharge fresh water to these 4 estuaries. The Wiggins
Pass estuary receives runoff from the Cocohatchee-
Corkscrew watershed. The Golden Gate-Naples Bay and
Rookery Bay watersheds discharge into Naples Bay and
Rookery Bay estuaries, respectively. Three watersheds
comprise the drainage area to the Ten Thousand
Islands estuary: Faka Union, Okaloacoochee/SR 29, and
Fakahatchee.
Methods
Water quality data used in this analysis were acquired
from the Impaired Waters Rule (IWR) Run 39 data
(provided by FDEP), Florida STORET data warehouse,
Collier County, City of Naples, and the Rookery Bay
National Estuarine Research Reserve. Data were
screened through a quality assurance and control
procedure and data from the most downstream
monitoring stations were included for the analysis.
Percent exceedances were calculated for dissolved
oxygen, total phosphorus, total nitrogen, and fecal
coliform bacteria concentrations with respect to the
state water quality standards. As no numeric State
standards exist for nutrients, data were compared to
FDEP’s screening criteria for streams. In addition, at
the direction of the County, data were compared to
FDEP’s Hendry Creek TMDL concentrations because of
the potential of those standards being used in the
future for assessing fresh water outfalls in Collier
County.
Results
Wiggins Pass
Wiggins Pass is the receiving water for the
Cocohatchee-Corkscrew watershed. The estuary is
presently listed as impaired for three water quality
parameters; dissolved oxygen, fecal coliform and iron.
Available data indicate that the dissolved oxygen
concentration in the watershed discharge may be
affecting the estuary because it generally falls below
the 4 mg/L estuarine standard. Low oxygen levels may
be attributed to high nutrient concentrations from
runoff or other sources that subsequently stimulate
plant growth, which in turn may deplete oxygen from
the water. However, measured total nitrogen and total
phosphorus concentrations do not exceed FDEP’s
screening criteria for streams, although they exceed the
Hendry Creek TMDL target. Low dissolved oxygen
concentrations may be impacted by baseflow
(groundwater) discharges from the watershed, as
groundwater is predicted to be low in dissolved oxygen
and baseflow represents up to 35 percent of the canal
flow in the dry season, and over 23 percent as an
annual average.
In terms of fecal coliform bacteria, because the data
available shows some exceedences of the estuarine
standard, there is the possibility that the estuary is
affected by watershed discharges. However, bacteria
source evaluations are necessary to confirm the
condition.
No data for iron is available at the sampling stations considered for data analysis. However, there is data from groundwater samples that indicates groundwater iron concentrations are high enough to account for the surface water concentrations. The water quality model developed for the Golden Gate watershed also suggested groundwater discharges may be a potential source of iron. Other activities such as mine drainage, sewage treatment plant outfalls, or landfill leachate from industrial scrap yards (e.g., junkyards for cars) are also potential sources that should be investigated.
Naples Bay Estuary
Naples Bay is presently listed as impaired for four
parameters: dissolved oxygen, fecal coliform bacteria,
copper, and iron. Naples Bay receives water from the
Golden Gate- Naples Bay watershed and Gordon River

Summary Assessment of Existing Conditions – Estuaries
V O L 1 COLLIER COUNTY WATERSHED
P A G E 39 MANAGEMENT PLAN – DRAFT
Extension. Analyses of data available from two stations
and analyzed for the TMDL planning period and the
four stations with data available for the verified period
indicate that dissolved oxygen concentrations in the
discharges do not meet the estuary water quality
standard. Low dissolved oxygen concentration may be
attributable to excessive nutrient concentrations but
neither total nitrogen nor total phosphorus
concentrations in the discharges exceed the Florida
stream criteria standards. Therefore, it is unclear if
total nitrogen and total phosphorus in discharges from
the watershed are causing the lower dissolved oxygen
levels. Like Wiggins Pass, low dissolved oxygen
concentrations in the estuary may be impacted by
baseflow discharges from the drainage canals.
Groundwater is predicted to be low in dissolved oxygen
concentration and baseflow in the watershed
represents as much as 70 percent of the canal flow in
the dry season and about 58 percent as an annual
average. Additional monitoring should be conducted to
evaluate the effect of any nutrient loading that may
occur as a result of human activities.
Fecal coliform bacteria concentrations exceeded the
state standard at most discharge locations. Therefore,
there is a possibility that the estuary is affected by
watershed discharges of fecal coliform bacteria.
Bacteria source evaluations are necessary to confirm
this condition.
Similar to the discussion for Wiggins Pass, it is possible
that groundwater discharges through the canal system
are a source of elevated iron concentrations. In fact, the
water quality model developed for the Golden Gate
watershed (discussed in Volume 4) predicts high
concentration of iron in canal discharge during dry
periods.
The source of copper in the estuary could be due to
human activity, such as algaecide applications used to
prevent algae growth. Sources of high copper
concentrations could also include leachate from
boardwalks and pilings that are constructed from
pressure-treated lumber.
Rookery Bay Estuary
Rookery Bay is the receiving water for the Rookery Bay
watershed and is presently listed as impaired for
dissolved oxygen and fecal coliform. This estuary is also
listed impaired for nutrients, which are potential
causes of low dissolved oxygen concentrations.
Data available at the two stations analyzed for planning
period conditions and the four stations with data
available for the verified period analysis indicate that
the dissolved oxygen concentration in the discharges
do not meet the estuary water quality standard. Low
dissolved oxygen concentrations in the drainage canals
could be attributed to excessive nutrient
concentrations, as well as groundwater inflows.
The estuarine water quality criterion for fecal coliform
bacteria is exceeded between approximately 60 and 75
percent of the time at the watershed discharge point. It
is therefore likely that the estuary is affected by
watershed discharges. Additional bacteria source
evaluations are necessary to verify the sources of fecal
coliform in the estuary.
Ten Thousand Islands Estuary
The Ten Thousand Islands is the receiving water for the
Faka-Union, Okaloacoochee/SR 29, and Fakahatchee
watersheds and is presently not listed as impaired for
any parameter. The watersheds remain relatively
undeveloped in comparison with the three priority
watersheds. Therefore, the estuary has not been
subject to significant impacts from human activity.
Conclusions
Wiggins Pass, Naples Bay, and Rookery Bay have been
found impaired for dissolved oxygen and fecal coliform
bacteria. Rookery Bay is also impaired for nutrients.
The discharges to the estuaries have concentrations of
dissolved oxygen and fecal coliform bacteria that may
affect the estuarine water quality. The causes of low
dissolved oxygen concentration may include high
nutrients concentrations, baseflow (groundwater)
discharges, and potentially water color. Additional
monitoring is needed to determine if low dissolved
oxygen concentrations are due to natural processes or
due to human activity.
Other parameters of impairment concern are iron and
copper. Iron appears to result from the groundwater
discharges throughout the canal network, although
other man-made sources are possible. High copper
concentrations may be the result of human activity
such as the use of copper sulfate as an algaecide to
prevent algae growth in ponds or leaching from
boardwalks and pilings.
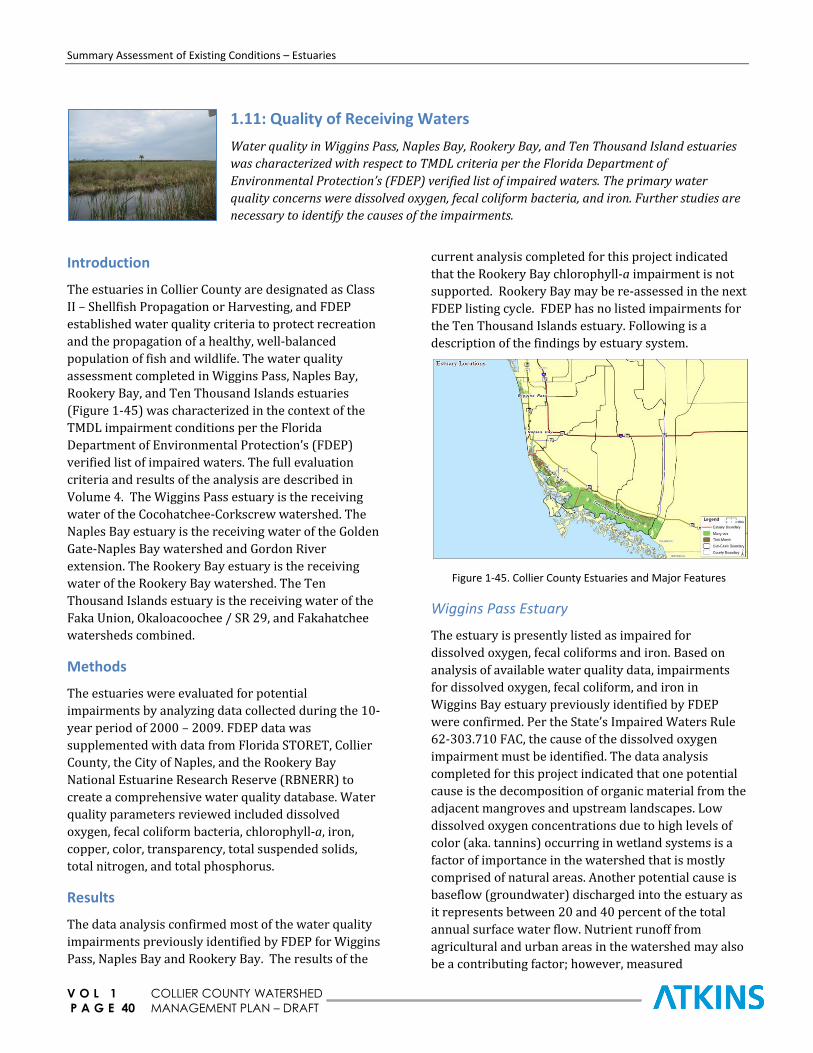
Summary Assessment of Existing Conditions – Estuaries
V O L 1 COLLIER COUNTY WATERSHED
P A G E 40 MANAGEMENT PLAN – DRAFT
1.11: Quality of Receiving Waters
Water quality in Wiggins Pass, Naples Bay, Rookery Bay, and Ten Thousand Island estuaries
was characterized with respect to TMDL criteria per the Florida Department of
Environmental Protection’s (FDEP) verified list of impaired waters. The primary water
quality concerns were dissolved oxygen, fecal coliform bacteria, and iron. Further studies are
necessary to identify the causes of the impairments.
Introduction
The estuaries in Collier County are designated as Class
II – Shellfish Propagation or Harvesting, and FDEP
established water quality criteria to protect recreation
and the propagation of a healthy, well-balanced
population of fish and wildlife. The water quality
assessment completed in Wiggins Pass, Naples Bay,
Rookery Bay, and Ten Thousand Islands estuaries
(Figure 1-45) was characterized in the context of the
TMDL impairment conditions per the Florida
Department of Environmental Protection’s (FDEP)
verified list of impaired waters. The full evaluation
criteria and results of the analysis are described in
Volume 4. The Wiggins Pass estuary is the receiving
water of the Cocohatchee-Corkscrew watershed. The
Naples Bay estuary is the receiving water of the Golden
Gate-Naples Bay watershed and Gordon River
extension. The Rookery Bay estuary is the receiving
water of the Rookery Bay watershed. The Ten
Thousand Islands estuary is the receiving water of the
Faka Union, Okaloacoochee / SR 29, and Fakahatchee
watersheds combined.
Methods
The estuaries were evaluated for potential
impairments by analyzing data collected during the 10-
year period of 2000 – 2009. FDEP data was
supplemented with data from Florida STORET, Collier
County, the City of Naples, and the Rookery Bay
National Estuarine Research Reserve (RBNERR) to
create a comprehensive water quality database. Water
quality parameters reviewed included dissolved
oxygen, fecal coliform bacteria, chlorophyll-a, iron,
copper, color, transparency, total suspended solids,
total nitrogen, and total phosphorus.
Results
The data analysis confirmed most of the water quality
impairments previously identified by FDEP for Wiggins
Pass, Naples Bay and Rookery Bay. The results of the
current analysis completed for this project indicated
that the Rookery Bay chlorophyll-a impairment is not
supported. Rookery Bay may be re-assessed in the next
FDEP listing cycle. FDEP has no listed impairments for
the Ten Thousand Islands estuary. Following is a
description of the findings by estuary system.
Figure 1-45. Collier County Estuaries and Major Features
Wiggins Pass Estuary
The estuary is presently listed as impaired for
dissolved oxygen, fecal coliforms and iron. Based on
analysis of available water quality data, impairments
for dissolved oxygen, fecal coliform, and iron in
Wiggins Bay estuary previously identified by FDEP
were confirmed. Per the State’s Impaired Waters Rule
62-303.710 FAC, the cause of the dissolved oxygen
impairment must be identified. The data analysis
completed for this project indicated that one potential
cause is the decomposition of organic material from the
adjacent mangroves and upstream landscapes. Low
dissolved oxygen concentrations due to high levels of
color (aka. tannins) occurring in wetland systems is a
factor of importance in the watershed that is mostly
comprised of natural areas. Another potential cause is
baseflow (groundwater) discharged into the estuary as
it represents between 20 and 40 percent of the total
annual surface water flow. Nutrient runoff from
agricultural and urban areas in the watershed may also
be a contributing factor; however, measured

Summary Assessment of Existing Conditions – Estuaries
V O L 1 COLLIER COUNTY WATERSHED
P A G E 41 MANAGEMENT PLAN – DRAFT
concentrations of total nitrogen and total phosphorus
are below FDPE’s screening criteria. Source
identification studies are recommended to further
determine the cause of the impairment.
Atkins confirmed the listed impairment for fecal
coliforms. Source identification studies are
recommended to determine whether anthropogenic
factors are the source of the elevated bacteria
concentrations. Currently, the FDEP is evaluating the
application of the State standard (Bartlett, 2010) and
the County should continue to work with the agency to
address the issue.
In terms of iron concentrations, the sources may be the
result of human activity or the sources may be due to
groundwater contributions. As indicated above,
baseflow represents between 20 and 40 percent of the
total annual surface water flow in the Cocohatchee
watershed. In addition, the results of a water quality
computer model developed for the Golden Gate
watershed have shown that iron concentrations remain
high in the drainage canals during dry periods when
the flow consists primarily or baseflow. Source
identification assessments are necessary to identify the
source of impairment.
Naples Bay Estuary
An analysis of available water quality data completed
as part of this project confirmed the dissolved oxygen,
fecal coliform, iron, and copper impairments identified
previously by FDEP for the Naples Bay estuary. The
dissolved oxygen impairment may be attributed to
nutrient inputs, however measured nutrient
concentrations are less than 15 percent of FDEP’s
screening criteria. Low dissolved oxygen
concentrations may also be the result of baseflow
discharges, since it represents 58 percent of the
average annual flow into the estuary, and is as high at
73 percent during the dry season. Other potential
causes of the dissolved oxygen impairment include
elevated total suspended solids loads if sufficient
organic material is available for decomposition, and the
stratification caused by stormwater discharges. Further
study is needed to identify the actual causes of the
dissolved oxygen impairment.
In addition to dissolved oxygen, the Naples Bay Estuary
was found to be impaired for fecal coliform. Elevated
fecal coliform bacteria concentrations in Naples Bay
may be caused by discharges from the watershed;
however, none of the water bodies in the watershed
have been declared impaired for this parameter. As in
Wiggins Pass, source identification studies are
recommended to determine whether anthropogenic
factors are the source of the elevated bacteria
concentrations.
Similar to the Wiggins Pass Estuary, the iron
impairment may be a result of human activity or may
be due to groundwater influence. The Golden Gate
watershed computer model (discussed in Volume 4)
has shown that iron concentrations remain high in the
drainage canals during dry periods because the flow is
primarily baseflow. Source identification assessments
are necessary to further verify the cause of the
impairment.
Sources of copper appear to be due to human activity.
The source of copper in the estuary could be due to
human activity, such as algaecide applications used to
prevent algae growth. Sources of high copper
concentrations could also include leachate from
boardwalks and pilings that are constructed from
pressure-treated lumber. It is possible that the siting of
the sampling stations near boardwalks and pilings
contributed to the overall determination of copper
impairment. The City of Naples and FDEP are
completing additional copper sampling to try and
identify the sources of this impairment.
Rookery Bay Estuary
Based on analysis of available water quality data,
Atkins confirmed FDEP’s Rookery Bay impairments for
dissolved oxygen and fecal coliform. However, FDEP’s
assessment that the estuary is impaired for
chlorophyll-a was not confirmed. The designated
impairment for chlorophyll-a may be re-assessed by
FDEP as part of the next impairment cycle.
Similar to the other estuaries, the dissolved oxygen
impairment may be attributed to nutrient loading from
runoff; however, the measured concentrations of total
nitrogen and total phosphorus are approximately 10
percent of the FDEP’s screening criteria. The dissolved
oxygen impairment may also be attributed to the
decomposition of organic material from the adjacent
wetlands and upstream landscapes (McCormick, 1997),
or from baseflow discharges that represent 45 percent
of the total annual flow and 71 percent of the dry
season flow in the drainage canals. Source
identification studies are recommended to further
determine the cause of the impairment.
The Rookery Bay Estuary was also found to be
impaired for fecal coliform. Elevated fecal coliform

Summary Assessment of Existing Conditions – Estuaries
V O L 1 COLLIER COUNTY WATERSHED
P A G E 42 MANAGEMENT PLAN – DRAFT
bacteria concentrations may be caused by discharges
from the watershed; however, as in the Naples Bay
Estuary, none of the water bodies in the watershed
have been declared impaired for this parameter.
Source identification studies are also recommended for
this estuary system.
Ten Thousand Islands Estuary
Based on analysis of available water quality data, FDEP
has determined that the Ten Thousand Islands estuary
is not impaired for any water quality parameter.
Conclusions
The Wiggins Bay, Naples Bay, and Rookery Bay
estuaries were found to be impaired for dissolved
oxygen and fecal coliforms. Wiggins Bay was also found
to be impaired for iron, and Naples Bay was found to be
impaired for iron and copper. The Ten Thousand
Islands estuary was not found to be impaired for any
water quality parameter. It is recommended that
Collier County work with the FDEP to determine the
sources for the identified impairments in Wiggins,
Naples, and Rookery Bay estuaries.
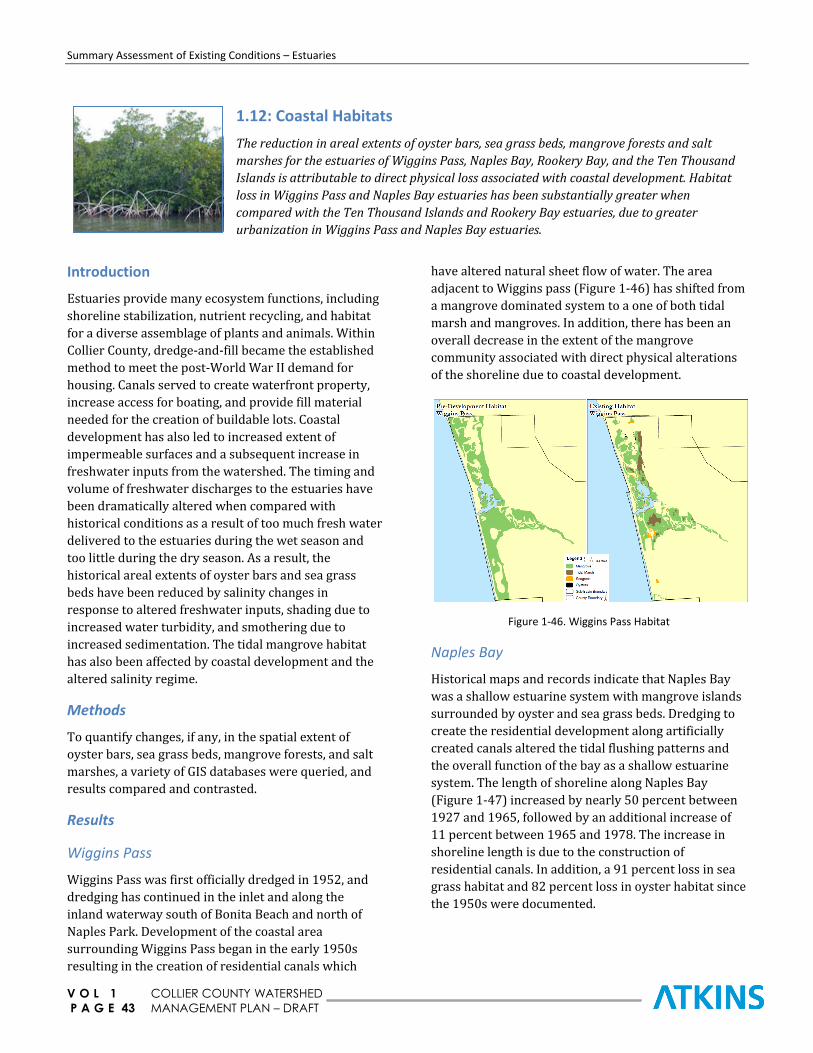
Summary Assessment of Existing Conditions – Estuaries
V O L 1 COLLIER COUNTY WATERSHED
P A G E 43 MANAGEMENT PLAN – DRAFT
1.12: Coastal Habitats
The reduction in areal extents of oyster bars, sea grass beds, mangrove forests and salt
marshes for the estuaries of Wiggins Pass, Naples Bay, Rookery Bay, and the Ten Thousand
Islands is attributable to direct physical loss associated with coastal development. Habitat
loss in Wiggins Pass and Naples Bay estuaries has been substantially greater when
compared with the Ten Thousand Islands and Rookery Bay estuaries, due to greater
urbanization in Wiggins Pass and Naples Bay estuaries.
Introduction
Estuaries provide many ecosystem functions, including
shoreline stabilization, nutrient recycling, and habitat
for a diverse assemblage of plants and animals. Within
Collier County, dredge-and-fill became the established
method to meet the post-World War II demand for
housing. Canals served to create waterfront property,
increase access for boating, and provide fill material
needed for the creation of buildable lots. Coastal
development has also led to increased extent of
impermeable surfaces and a subsequent increase in
freshwater inputs from the watershed. The timing and
volume of freshwater discharges to the estuaries have
been dramatically altered when compared with
historical conditions as a result of too much fresh water
delivered to the estuaries during the wet season and
too little during the dry season. As a result, the
historical areal extents of oyster bars and sea grass
beds have been reduced by salinity changes in
response to altered freshwater inputs, shading due to
increased water turbidity, and smothering due to
increased sedimentation. The tidal mangrove habitat
has also been affected by coastal development and the
altered salinity regime.
Methods
To quantify changes, if any, in the spatial extent of
oyster bars, sea grass beds, mangrove forests, and salt
marshes, a variety of GIS databases were queried, and
results compared and contrasted.
Results
Wiggins Pass
Wiggins Pass was first officially dredged in 1952, and
dredging has continued in the inlet and along the
inland waterway south of Bonita Beach and north of
Naples Park. Development of the coastal area
surrounding Wiggins Pass began in the early 1950s
resulting in the creation of residential canals which
have altered natural sheet flow of water. The area
adjacent to Wiggins pass (Figure 1-46) has shifted from
a mangrove dominated system to a one of both tidal
marsh and mangroves. In addition, there has been an
overall decrease in the extent of the mangrove
community associated with direct physical alterations
of the shoreline due to coastal development.
Figure 1-46. Wiggins Pass Habitat
Naples Bay
Historical maps and records indicate that Naples Bay
was a shallow estuarine system with mangrove islands
surrounded by oyster and sea grass beds. Dredging to
create the residential development along artificially
created canals altered the tidal flushing patterns and
the overall function of the bay as a shallow estuarine
system. The length of shoreline along Naples Bay
(Figure 1-47) increased by nearly 50 percent between
1927 and 1965, followed by an additional increase of
11 percent between 1965 and 1978. The increase in
shoreline length is due to the construction of
residential canals. In addition, a 91 percent loss in sea
grass habitat and 82 percent loss in oyster habitat since
the 1950s were documented.

Summary Assessment of Existing Conditions – Estuaries
V O L 1 COLLIER COUNTY WATERSHED
P A G E 44 MANAGEMENT PLAN – DRAFT
Figure 1-47. Naples Bay Habitat
Rookery Bay
The Rookery Bay watershed has been dramatically
altered by channel construction and current estuarine
salinity regimes are more strongly influenced by canal
management than by tides or rainfall.
Based on assessments of the rates of vertical accretion
in the mangrove forests within Rookery Bay (Figure 1-
48), elevations of the mangrove forest have kept pace
with sea level rise over approximately the past 70
years. This finding supports the importance of
mangroves as a stabilizing influence on shorelines and
preventing erosion in coastal regions. Rookery Bay has
experienced an overall decrease in the combined
mangrove and salt marsh habitat within its estuary
boundaries.
Figure 1-48. Rookery Bay Habitat
Ten Thousand Islands
Within the Ten Thousand Islands estuary, the natural
spatial and temporal variation in salinities has been
substantially and adversely affected by upstream water
management. The Ten Thousand Islands estuary is a
complex community of mangrove islands, oyster beds
and shallow lagoons. The Ten Thousand Islands
mangrove system (Figure 1-49) appears to have
declined slightly in areal extent, but has also apparently
transitioned into tidal marsh.
Figure 1-49. Ten Thousand Islands Mangrove
Conclusions
The loss of coastal habitats in Collier County’s estuaries
is due primarily to direct physical loss associated with
coastal development. However, habitat loss in the
Wiggins Pass and Naples Bay estuaries has been
substantially greater when compared with the Ten
Thousand Islands and Rookery Bay estuaries. In the
Wiggins Pass estuary, the combined acreage of salt
marsh and mangroves has declined by 29 percent over
pre-development conditions. Acres of salt marsh and
mangrove have declined by approximately 76 percent
over time in Naples Bay. In contrast, the less-impacted
estuaries of Rookery Bay and the Ten Thousand Islands
have experienced salt marsh and mangrove declines of
12 and 5 percent, respectively.
For Wiggins Pass and Naples Bay, the amount of loss of
salt marsh and mangrove reflects the greater degree of
development pressures. Less development in the
coastal reaches of the Rookery Bay estuary reflects the
protection this area has received through various land
acquisition activities (e.g. the 110,000-acre Rookery
Bay National Estuarine Research Reserve). Direct loss
of salt marsh and mangrove habitat is even less in the
Ten Thousand Islands; however the remaining
estuarine habitats have been adversely affected by
alterations in the timing and quantity of freshwater
inflows.
In addition to the reduced ecosystem functioning of
estuarine ecosystems due to alterations in the timing
and quantity of freshwater inflow, Collier County’s
Summary Assessment of Existing Conditions – Estuaries
V O L 1 COLLIER COUNTY WATERSHED
P A G E 45 MANAGEMENT PLAN – DRAFT
more urbanized estuaries (e.g., Wiggins Pass and
Naples Bay) have also experienced large-scale habitat
losses due to direct physical alterations of the
shoreline. For Wiggins Pass and Naples Bay, re-creating
a more natural hydrologic inflow pattern might not be
sufficient for restoring past estuarine functions, since
many of the physical features formed by oyster reefs
and sea grass meadows have been lost over time. In
contrast, the majority of tidal marsh and mangrove
systems are still intact in Rookery Bay and the Ten
Thousand Islands. What remains to be accomplished in
Rookery Bay and Ten Thousand Islands appears to be
restoration of a more natural pattern of freshwater
inflow for these less-developed estuaries, a feasible
option that will be fully developed as part of this
project.

V O L 1 COLLIER COUNTY WATERSHED
P A G E 46 MANAGEMENT PLAN – DRAFT
SUMMARY DEVELOPMENT OF PERFORMANCE MEASURES
Performance measures were developed for freshwater discharge to estuaries, pollutant loads,
aquifer recharge, and natural systems using the same approach of comparing pre-development
with existing conditions to establish a performance score against which to evaluate the success
of proposed projects.
Performance measures are tools based on a set of
indicators used in project planning to predict (or
evaluate) the degree to which proposed alternative
plans are likely to meet restoration objectives and to
assess the success of implemented plans in meeting
restoration objectives (CERP 2007). For example, most
performance measures for the Everglades restoration
projects were developed through conceptual models
that identified key stressors and attributes of the
natural system. Attributes are biological and ecological
indicators in the natural system that respond to effects
of stressors. Performance measures for other
watershed processes are based on estimates of
potential impacts to the natural system.
The intent of the performance measures developed for
the CCWMP was to maintain consistency with this
concept, as developed by the CERP program. Therefore,
performance measures for natural systems, freshwater
discharge to the estuaries, pollutant loads, and aquifer
characteristics were developed based on the concepts
outlined below.
The performance measure must address indicators
that represent attributes or stressors of natural or
human systems that the proposed project or
management action is expected to affect.
The performance targets, e.g., reduced pollutant
loads, must reflect the desired restoration
condition, which is the maximum level of
restoration possible given the existing
development conditions.
The performance measure must provide an
understanding of system-wide responses relative
to how project implementation will meet
improvement and/or restoration goals
The approach to developing the performance measures
was based on “restoring” the system as close as
possible to the original condition, while being
cognizant of the limitations imposed by existing land
use conditions and economic constraints.
The maximum level of restoration, then, would be pre-
development conditions. The NSM was used to provide
the pre-development, or baseline condition. The
County’s ECM was used to characterize existing
conditions. The difference between the two gives the
total restoration possible, without restraints of existing
development and cost and provides a means of
evaluating the improvement, or “lift” anticipated as a
result of implementing a project. The process applied
to the development of individual performance
measures is described in the following sections.

Summary Development of Performance Measures
V O L 1 COLLIER COUNTY WATERSHED
P A G E 47 MANAGEMENT PLAN – DRAFT
2.1: Natural Systems
Functional assessment scores, or performance measures, were calculated for the watersheds in
Collier County. Average scores are lower for the Golden Gate-Naples Bay watershed due to
extensive canals systems and development and suggest that hydrologic restoration may
provide the greatest opportunity for measurable improvement in functional value in the
County.
Introduction
Performance measure development for the natural
systems component of the CCWMP was accomplished
as part of the Functional Assessment. Under this task,
pre-development and current conditions were
compared and losses and conversions of native plant
communities in Collier County watersheds over the
past 50–60 years were estimated via a change analysis
of land use cover data. The 1942 Collier County soils
map provided additional data to characterize pre-
development characteristics in the watersheds. The
vegetation and soils data are reported and analyzed for
the first three watersheds individually and the other
three watersheds collectively.
Methods
Results of an analysis of changes in areal extent of
natural communities and the causes of those changes
(described in Volume 4) were used to evaluate current
watershed functions (Functional Assessment). The pre-
development data serve as the reference period, or
baseline index against which to evaluate current land
cover data. The modified UMAM scoring provided a
landscape scale functional assessment adequate to
identify resource protection areas. Performance
measures were established prior to the development of
proposed project alternatives and were used to:
Evaluate how well proposed alternatives meet
specific project objectives.
Examine the applicability and feasibility of specific
alternative analyses.
Address the issues identified in the assessment of
existing conditions, including surface water,
groundwater, and natural systems.
Similar to performance measures developed for
freshwater discharges and groundwater, performance
scores were calculated that provide a baseline
conditions against which the success of proposed
projects can be measured.
Resource protection scores represent the function, or
value, of the landscape based on the degree to which
the existing conditions are the same as pre-
development. The difference in scores between pre-
development and existing conditions provides the
baseline against which to evaluate the result of a
project, such as removing a control structure or filling a
canal. If the anticipated improvement, or “lift” score
from the proposed project is greater than the
performance score, one can conclude that the project
will have a net benefit on the system. Hydrology and
landscape (LSI) scores are developed similarly.
Dramatic conversions from pre-development wet
prairie vegetation to a developed urban land use, for
example, would be assigned low scores, while little or
no change in vegetation cover (i.e., no change from pre-
development, or shift to another natural vegetation
classification) would be scored higher.
Results
Performance measures developed for this CCWMP are
simply the hydrology and LSI scores developed for the
functional assessment. The LSI and hydrology scores
were developed as a means of characterizing existing
baseline data (in numerical form) for natural
conditions and, therefore, provide the conditions
against which proposed projects can be measured. The
vegetation score is not as applicable for evaluating the
results of hydrological restoration projects because
proposed projects will not focus on active vegetation
management (although shifts in vegetation are
expected to occur over time, commensurate with
changes in hydrology).
The performance measures developed, i.e., the LSI and
hydrology scores (refer to Volume 4 for further detail
on development of scores), are suitable for small-scale
site-level assessments (i.e., for projects that have little
or no affect on the score of a 1500-X-1500-foot cell) or
as modeled performance measures for larger-scale
projects. The functional value of proposed projects will

Summary Development of Performance Measures
V O L 1 COLLIER COUNTY WATERSHED
P A G E 48 MANAGEMENT PLAN – DRAFT
be assessed using the UMAM functional value
calculation below:
Resource Protection Value = [(Anticipated Score-
Existing Score)/Maximum Score] x Number of Acres
where:
Performance Measure = Resource Protection Value
Anticipated Score = anticipated hydrology index or LSI
Existing Score = Hydrology score OR LSI
based on existing conditions
Maximum Score = 10
Number of Acres = Acres of site being evaluated
As an example, consider a 500-acre proposed project
area with a current hydrology score of 6. Rehydration
of the site by filling a drainage ditch to the elevation of
the surrounding area is reasonably expected to
increase the hydrology score to 8. The hydrologic
functional value of this proposed project would be 100
((8-6)/10) X 500 acres). Likewise, LSI functional values
would improve within, and adjacent to, projects that
include restoration to more-natural conditions,
conservation easements, transfers of development
rights, or other similar means of improving the degree
of resource protection to adjacent areas.
Conclusions
Resource protection scores, or performance measures,
are presented in Table 2-1 for the watersheds in Collier
County. Average scores are lower in the Golden Gate-
Naples Bay watershed due to extensive canals systems
and development and indicate that hydrologic
restoration may provide the greatest opportunity for
measurable improvement in functional value in Collier
County.
Table 2-1. Existing Conditions Average Resource Protection Scores of Non-Urban Lands, by Watershed
Watershed
Non-Urban Acres
Average Vegetation
Score
Average Hydro Score
Average LSI Score
Cocohatchee-Corkscrew
111,250 7 7 8
Golden Gate-Naples
36,627 5 6 6
Rookery Bay 83,105 8 6 9
Faka Union/ Fakahatchee/ Okaloacoochee- SR 29
431,414 9 6 9
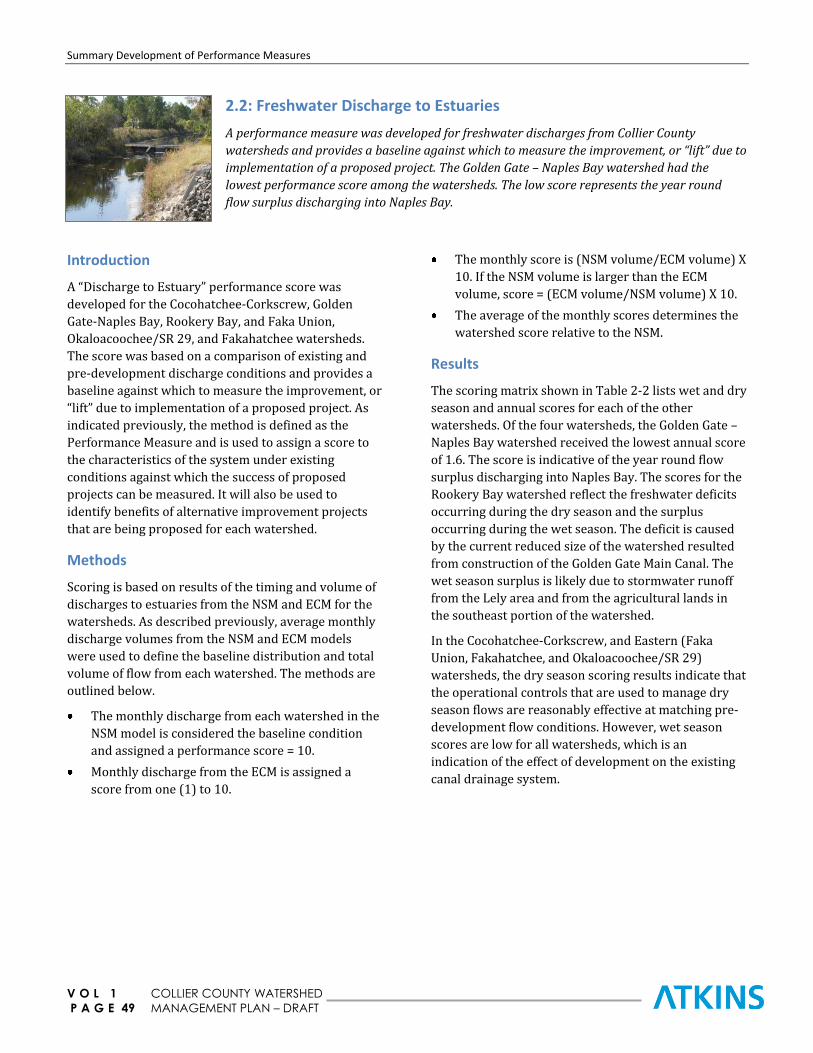
Summary Development of Performance Measures
V O L 1 COLLIER COUNTY WATERSHED
P A G E 49 MANAGEMENT PLAN – DRAFT
2.2: Freshwater Discharge to Estuaries
A performance measure was developed for freshwater discharges from Collier County
watersheds and provides a baseline against which to measure the improvement, or “lift” due to
implementation of a proposed project. The Golden Gate – Naples Bay watershed had the
lowest performance score among the watersheds. The low score represents the year round
flow surplus discharging into Naples Bay.
Introduction
A “Discharge to Estuary” performance score was
developed for the Cocohatchee-Corkscrew, Golden
Gate-Naples Bay, Rookery Bay, and Faka Union,
Okaloacoochee/SR 29, and Fakahatchee watersheds.
The score was based on a comparison of existing and
pre-development discharge conditions and provides a
baseline against which to measure the improvement, or
“lift” due to implementation of a proposed project. As
indicated previously, the method is defined as the
Performance Measure and is used to assign a score to
the characteristics of the system under existing
conditions against which the success of proposed
projects can be measured. It will also be used to
identify benefits of alternative improvement projects
that are being proposed for each watershed.
Methods
Scoring is based on results of the timing and volume of
discharges to estuaries from the NSM and ECM for the
watersheds. As described previously, average monthly
discharge volumes from the NSM and ECM models
were used to define the baseline distribution and total
volume of flow from each watershed. The methods are
outlined below.
The monthly discharge from each watershed in the
NSM model is considered the baseline condition
and assigned a performance score = 10.
Monthly discharge from the ECM is assigned a
score from one (1) to 10.
The monthly score is (NSM volume/ECM volume) X
10. If the NSM volume is larger than the ECM
volume, score = (ECM volume/NSM volume) X 10.
The average of the monthly scores determines the
watershed score relative to the NSM.
Results
The scoring matrix shown in Table 2-2 lists wet and dry
season and annual scores for each of the other
watersheds. Of the four watersheds, the Golden Gate –
Naples Bay watershed received the lowest annual score
of 1.6. The score is indicative of the year round flow
surplus discharging into Naples Bay. The scores for the
Rookery Bay watershed reflect the freshwater deficits
occurring during the dry season and the surplus
occurring during the wet season. The deficit is caused
by the current reduced size of the watershed resulted
from construction of the Golden Gate Main Canal. The
wet season surplus is likely due to stormwater runoff
from the Lely area and from the agricultural lands in
the southeast portion of the watershed.
In the Cocohatchee-Corkscrew, and Eastern (Faka
Union, Fakahatchee, and Okaloacoochee/SR 29)
watersheds, the dry season scoring results indicate that
the operational controls that are used to manage dry
season flows are reasonably effective at matching pre-
development flow conditions. However, wet season
scores are low for all watersheds, which is an
indication of the effect of development on the existing
canal drainage system.

Summary Development of Performance Measures
V O L 1 COLLIER COUNTY WATERSHED
P A G E 50 MANAGEMENT PLAN – DRAFT
Table 2-2. Discharge to Estuary Performance Scores
Watershed Annual Score
Dry Season Score
Wet Season Score
Golden Gate-Naples Bay
1.6 1.9 1.0
Cocohatchee-Corkscrew
5.4 6.9 2.5
Rookery Bay 4.3 3.1 6.8
Faka Union/ Fakahatchee/ Okaloacoochee- SR 29
5.6 7.4 2.0
Conclusions
To evaluate the alternative scenarios, a similar scoring
methodology will be used. The calculated monthly
flows for each scenario will be compared to the NSM
calculated monthly flows. For instance, for a project
implemented in the Golden Gate Naples Bay watershed
that leads to a reduction in flow to the estuary, the
calculated monthly flow for September might be
5.0 inches. In the ECM, the score for September is one
(1), but for the alterative, the score would be two (2):
(0.78/5.0) x 10 = 2, where:
0.78 = the NSM monthly flow for September, and
5.0 = the Alternative monthly flow for September
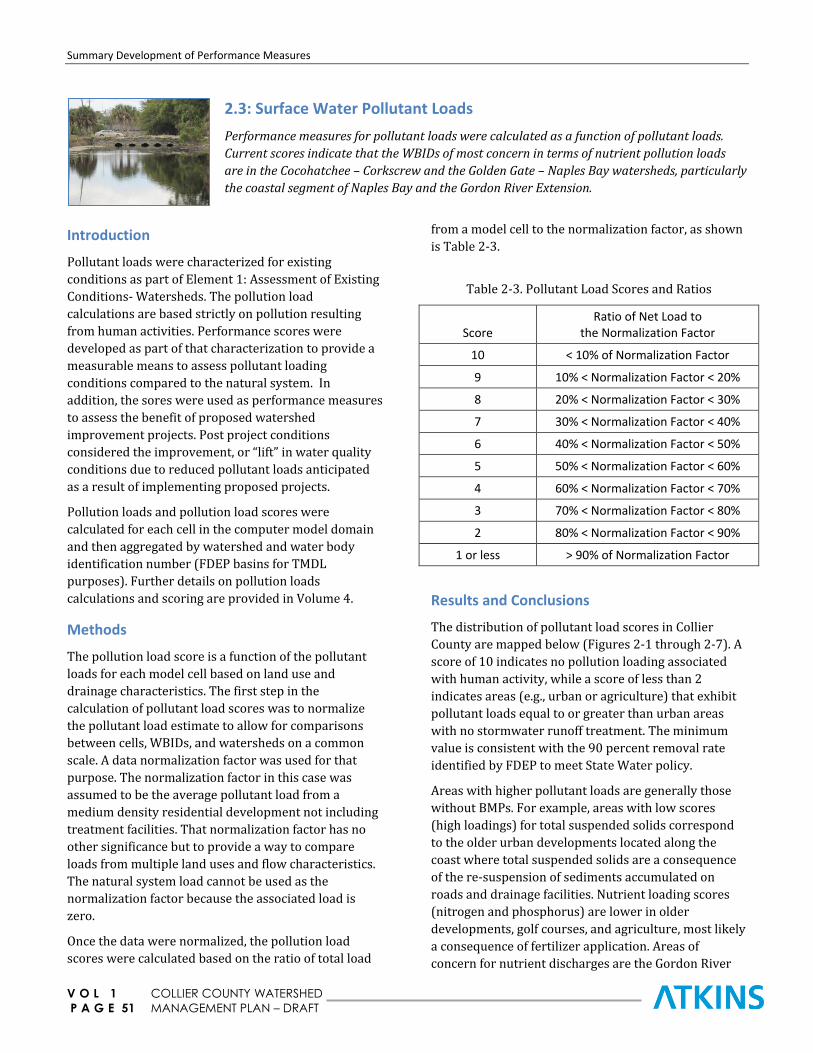
Summary Development of Performance Measures
V O L 1 COLLIER COUNTY WATERSHED
P A G E 51 MANAGEMENT PLAN – DRAFT
2.3: Surface Water Pollutant Loads
Performance measures for pollutant loads were calculated as a function of pollutant loads.
Current scores indicate that the WBIDs of most concern in terms of nutrient pollution loads
are in the Cocohatchee – Corkscrew and the Golden Gate – Naples Bay watersheds, particularly
the coastal segment of Naples Bay and the Gordon River Extension.
Introduction
Pollutant loads were characterized for existing
conditions as part of Element 1: Assessment of Existing
Conditions- Watersheds. The pollution load
calculations are based strictly on pollution resulting
from human activities. Performance scores were
developed as part of that characterization to provide a
measurable means to assess pollutant loading
conditions compared to the natural system. In
addition, the sores were used as performance measures
to assess the benefit of proposed watershed
improvement projects. Post project conditions
considered the improvement, or “lift” in water quality
conditions due to reduced pollutant loads anticipated
as a result of implementing proposed projects.
Pollution loads and pollution load scores were
calculated for each cell in the computer model domain
and then aggregated by watershed and water body
identification number (FDEP basins for TMDL
purposes). Further details on pollution loads
calculations and scoring are provided in Volume 4.
Methods
The pollution load score is a function of the pollutant
loads for each model cell based on land use and
drainage characteristics. The first step in the
calculation of pollutant load scores was to normalize
the pollutant load estimate to allow for comparisons
between cells, WBIDs, and watersheds on a common
scale. A data normalization factor was used for that
purpose. The normalization factor in this case was
assumed to be the average pollutant load from a
medium density residential development not including
treatment facilities. That normalization factor has no
other significance but to provide a way to compare
loads from multiple land uses and flow characteristics.
The natural system load cannot be used as the
normalization factor because the associated load is
zero.
Once the data were normalized, the pollution load
scores were calculated based on the ratio of total load
from a model cell to the normalization factor, as shown
is Table 2-3.
Table 2-3. Pollutant Load Scores and Ratios
Score Ratio of Net Load to
the Normalization Factor
10 < 10% of Normalization Factor
9 10% < Normalization Factor < 20%
8 20% < Normalization Factor < 30%
7 30% < Normalization Factor < 40%
6 40% < Normalization Factor < 50%
5 50% < Normalization Factor < 60%
4 60% < Normalization Factor < 70%
3 70% < Normalization Factor < 80%
2 80% < Normalization Factor < 90%
1 or less > 90% of Normalization Factor
Results and Conclusions
The distribution of pollutant load scores in Collier
County are mapped below (Figures 2-1 through 2-7). A
score of 10 indicates no pollution loading associated
with human activity, while a score of less than 2
indicates areas (e.g., urban or agriculture) that exhibit
pollutant loads equal to or greater than urban areas
with no stormwater runoff treatment. The minimum
value is consistent with the 90 percent removal rate
identified by FDEP to meet State Water policy.
Areas with higher pollutant loads are generally those
without BMPs. For example, areas with low scores
(high loadings) for total suspended solids correspond
to the older urban developments located along the
coast where total suspended solids are a consequence
of the re-suspension of sediments accumulated on
roads and drainage facilities. Nutrient loading scores
(nitrogen and phosphorus) are lower in older
developments, golf courses, and agriculture, most likely
a consequence of fertilizer application. Areas of
concern for nutrient discharges are the Gordon River
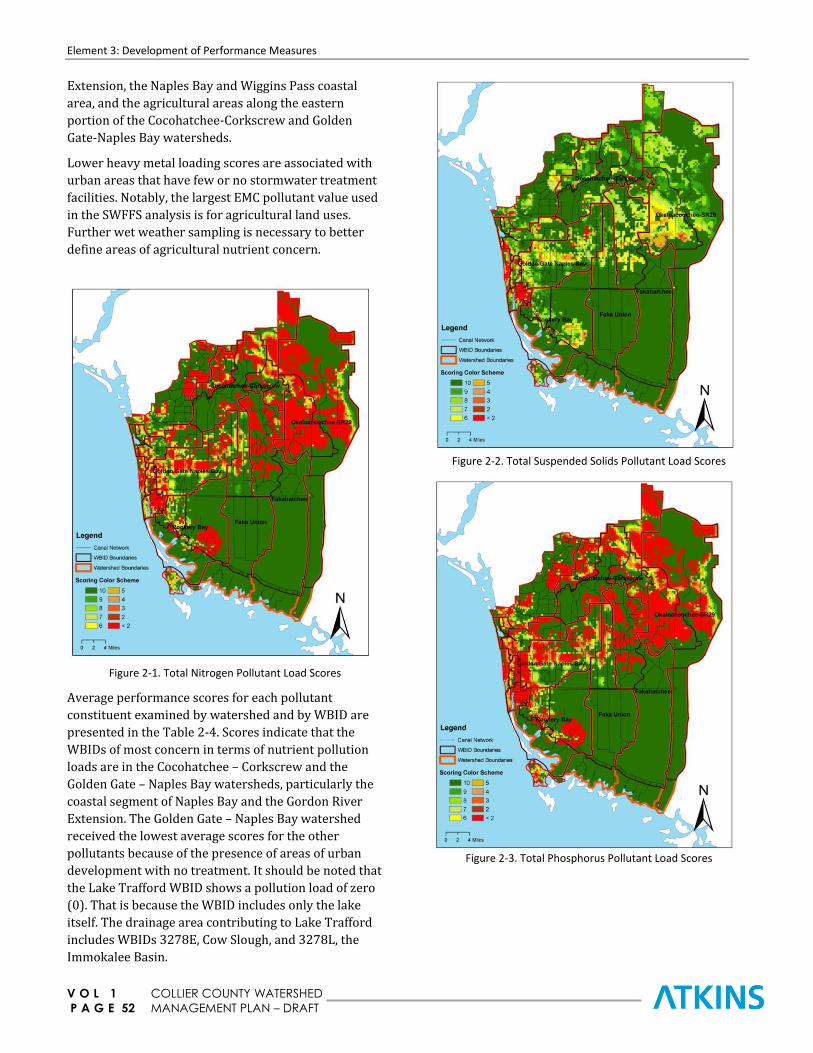
Element 3: Development of Performance Measures
V O L 1 COLLIER COUNTY WATERSHED
P A G E 52 MANAGEMENT PLAN – DRAFT
Extension, the Naples Bay and Wiggins Pass coastal
area, and the agricultural areas along the eastern
portion of the Cocohatchee-Corkscrew and Golden
Gate-Naples Bay watersheds.
Lower heavy metal loading scores are associated with
urban areas that have few or no stormwater treatment
facilities. Notably, the largest EMC pollutant value used
in the SWFFS analysis is for agricultural land uses.
Further wet weather sampling is necessary to better
define areas of agricultural nutrient concern.
Figure 2-1. Total Nitrogen Pollutant Load Scores
Average performance scores for each pollutant
constituent examined by watershed and by WBID are
presented in the Table 2-4. Scores indicate that the
WBIDs of most concern in terms of nutrient pollution
loads are in the Cocohatchee – Corkscrew and the
Golden Gate – Naples Bay watersheds, particularly the
coastal segment of Naples Bay and the Gordon River
Extension. The Golden Gate – Naples Bay watershed
received the lowest average scores for the other
pollutants because of the presence of areas of urban
development with no treatment. It should be noted that
the Lake Trafford WBID shows a pollution load of zero
(0). That is because the WBID includes only the lake
itself. The drainage area contributing to Lake Trafford
includes WBIDs 3278E, Cow Slough, and 3278L, the
Immokalee Basin.
Figure 2-2. Total Suspended Solids Pollutant Load Scores
Figure 2-3. Total Phosphorus Pollutant Load Scores

Element 3: Development of Performance Measures
V O L 1 COLLIER COUNTY WATERSHED
P A G E 53 MANAGEMENT PLAN – DRAFT
Figure 2-4. BOD-5 Pollutant Load Scores
Figure 2-5. Copper (Cu) Pollutant Load Scores
Figure 2-6. Lead (Pb) Pollutant Load Scores
Figure 2-7. Zinc (Zn) Pollutant Load Scores

Summary Development of Performance Measures
V O L 1 COLLIER COUNTY WATERSHED
P A G E 54 MANAGEMENT PLAN – DRAFT
Table 2-4. Pollutant Load Performance Measures, by WBID and Watershed
Watershed WBID WBID Name BOD-5 TP TN TSS Zinc Copper Lead
Cocohatchee-Corkscrew
3259A COCOHATCHEE RIVER 8 8 7 8 8 8 8
3259B DRAINAGE TO CORKSCREW 7 0 2 9 8 9 8
3259W LAKE TRAFFORD 10 10 10 10 10 10 10
3259Z LITTLE HICKORY BAY 6 5 5 7 7 7 7
3278C COCOHATCHEE GOLF COURSE
DISCHARGE 8 7 5 7 8 6 8
3278D COCOHATCHEE (INLAND
SEGMENT) 8 4 4 9 8 8 8
3278E COW SLOUGH 8 4 4 9 9 9 9
3278F CORKSCREW MARSH 9 5 6 10 9 10 9
3278L IMMOKALEE BASIN 7 1 2 8 8 8 8
Average
8.2 3.8 4.5 9.3 8.5 9.1 8.5
Golden Gate - Naples Bay
3278K GORDON RIVER EXTENSION 5 2 1 6 6 5 6
3278R NAPLES BAY (COASTAL
SEGMENT) 0 0 0 0 1 0 0
3278S NORTH GOLDEN GATE 6 6 5 8 8 8 7
Average
5.3 5.1 4.2 7.0 7.1 7.0 6.2
Rookery Bay
3278U ROOKERY BAY (COASTAL
SEGMENT) 10 8 9 10 10 10 10
3278V ROOKERY BAY (INLAND EAST
SEGMENT) 9 6 7 10 10 10 9
3278Y ROOKERY BAY (INLAND WEST
SEGMENT) 9 7 6 9 9 8 9
Average
9.3 6.7 7.4 9.8 9.8 9.7 9.3
Faka Union/ Fakahatchee/
Okaloacoochee/ SR29
3278H FAKA UNION (NORTH SEGMENT) 8 8 8 10 9 10 9
3278I FAKA UNION (SOUTH SEGMENT) 10 10 10 10 10 10 10
3259I CAMP KEAIS 7 0 1 9 8 9 8
3278G FAKAHATCHEE STRAND 10 10 10 10 10 10 10
3261C BARRON RIVER CANAL 10 10 10 10 10 10 10
3278T OKALOACOOCHEE SLOUGH 9 4 5 10 9 10 9
3278W SILVER STRAND 5 0 0 8 7 8 7
Average
8.6 5.8 6.2 9.6 9.0 9.6 9.0
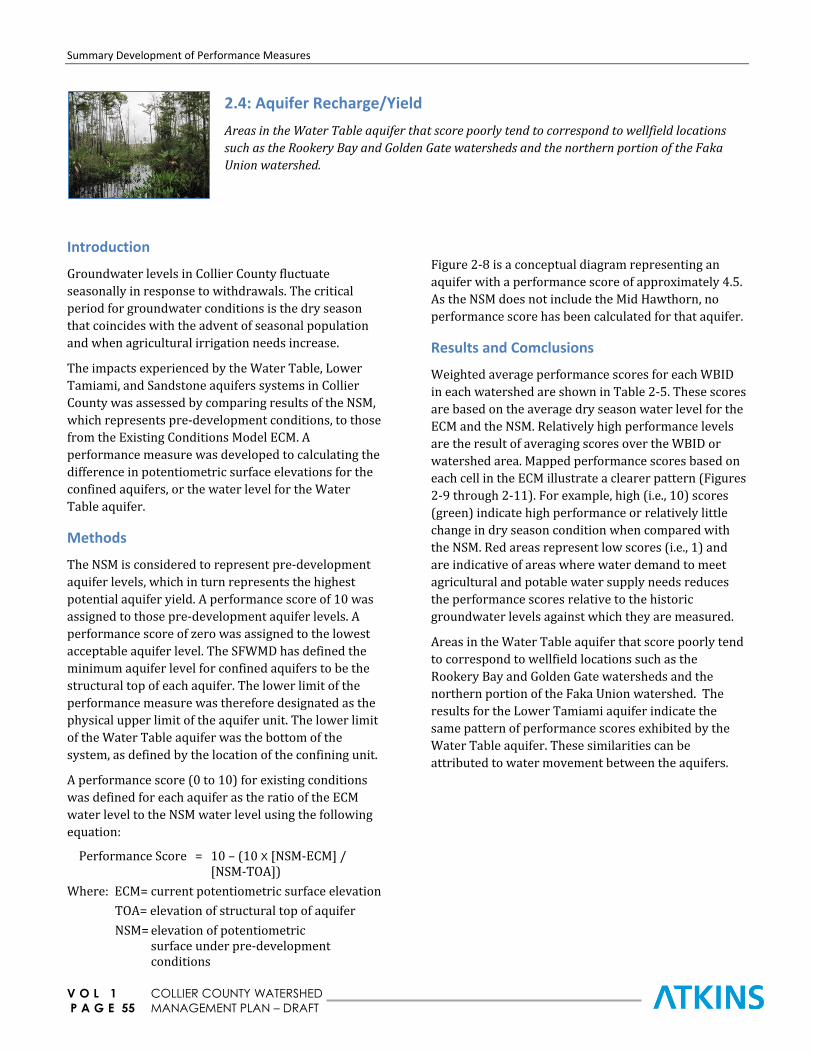
Summary Development of Performance Measures
V O L 1 COLLIER COUNTY WATERSHED
P A G E 55 MANAGEMENT PLAN – DRAFT
2.4: Aquifer Recharge/Yield
Areas in the Water Table aquifer that score poorly tend to correspond to wellfield locations
such as the Rookery Bay and Golden Gate watersheds and the northern portion of the Faka
Union watershed.
Introduction
Groundwater levels in Collier County fluctuate
seasonally in response to withdrawals. The critical
period for groundwater conditions is the dry season
that coincides with the advent of seasonal population
and when agricultural irrigation needs increase.
The impacts experienced by the Water Table, Lower
Tamiami, and Sandstone aquifers systems in Collier
County was assessed by comparing results of the NSM,
which represents pre-development conditions, to those
from the Existing Conditions Model ECM. A
performance measure was developed to calculating the
difference in potentiometric surface elevations for the
confined aquifers, or the water level for the Water
Table aquifer.
Methods
The NSM is considered to represent pre-development
aquifer levels, which in turn represents the highest
potential aquifer yield. A performance score of 10 was
assigned to those pre-development aquifer levels. A
performance score of zero was assigned to the lowest
acceptable aquifer level. The SFWMD has defined the
minimum aquifer level for confined aquifers to be the
structural top of each aquifer. The lower limit of the
performance measure was therefore designated as the
physical upper limit of the aquifer unit. The lower limit
of the Water Table aquifer was the bottom of the
system, as defined by the location of the confining unit.
A performance score (0 to 10) for existing conditions
was defined for each aquifer as the ratio of the ECM
water level to the NSM water level using the following
equation:
Performance Score = 10 – (10 X [NSM-ECM] / [NSM-TOA])
Where: ECM= current potentiometric surface elevation
TOA= elevation of structural top of aquifer
NSM= elevation of potentiometric surface under pre-development conditions
Figure 2-8 is a conceptual diagram representing an
aquifer with a performance score of approximately 4.5.
As the NSM does not include the Mid Hawthorn, no
performance score has been calculated for that aquifer.
Results and Comclusions
Weighted average performance scores for each WBID
in each watershed are shown in Table 2-5. These scores
are based on the average dry season water level for the
ECM and the NSM. Relatively high performance levels
are the result of averaging scores over the WBID or
watershed area. Mapped performance scores based on
each cell in the ECM illustrate a clearer pattern (Figures
2-9 through 2-11). For example, high (i.e., 10) scores
(green) indicate high performance or relatively little
change in dry season condition when compared with
the NSM. Red areas represent low scores (i.e., 1) and
are indicative of areas where water demand to meet
agricultural and potable water supply needs reduces
the performance scores relative to the historic
groundwater levels against which they are measured.
Areas in the Water Table aquifer that score poorly tend
to correspond to wellfield locations such as the
Rookery Bay and Golden Gate watersheds and the
northern portion of the Faka Union watershed. The
results for the Lower Tamiami aquifer indicate the
same pattern of performance scores exhibited by the
Water Table aquifer. These similarities can be
attributed to water movement between the aquifers.
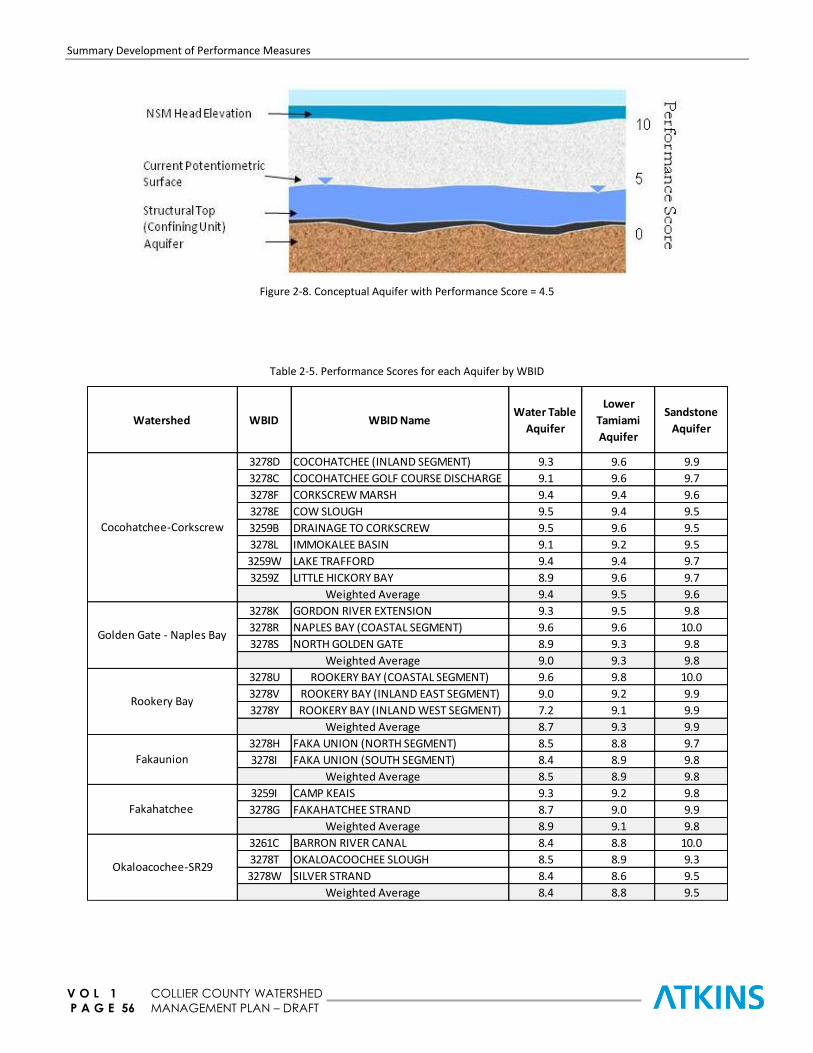
Summary Development of Performance Measures
V O L 1 COLLIER COUNTY WATERSHED
P A G E 56 MANAGEMENT PLAN – DRAFT
Figure 2-8. Conceptual Aquifer with Performance Score = 4.5
Table 2-5. Performance Scores for each Aquifer by WBID
Watershed WBID WBID NameWater Table
Aquifer
Lower
Tamiami
Aquifer
Sandstone
Aquifer
3278D COCOHATCHEE (INLAND SEGMENT) 9.3 9.6 9.9
3278C COCOHATCHEE GOLF COURSE DISCHARGE 9.1 9.6 9.7
3278F CORKSCREW MARSH 9.4 9.4 9.6
3278E COW SLOUGH 9.5 9.4 9.5
3259B DRAINAGE TO CORKSCREW 9.5 9.6 9.5
3278L IMMOKALEE BASIN 9.1 9.2 9.5
3259W LAKE TRAFFORD 9.4 9.4 9.7
3259Z LITTLE HICKORY BAY 8.9 9.6 9.7
9.4 9.5 9.6
3278K GORDON RIVER EXTENSION 9.3 9.5 9.8
3278R NAPLES BAY (COASTAL SEGMENT) 9.6 9.6 10.0
3278S NORTH GOLDEN GATE 8.9 9.3 9.8
9.0 9.3 9.8
3278U ROOKERY BAY (COASTAL SEGMENT) 9.6 9.8 10.0
3278V ROOKERY BAY (INLAND EAST SEGMENT) 9.0 9.2 9.9
3278Y ROOKERY BAY (INLAND WEST SEGMENT) 7.2 9.1 9.9
8.7 9.3 9.9
3278H FAKA UNION (NORTH SEGMENT) 8.5 8.8 9.7
3278I FAKA UNION (SOUTH SEGMENT) 8.4 8.9 9.8
8.5 8.9 9.8
3259I CAMP KEAIS 9.3 9.2 9.8
3278G FAKAHATCHEE STRAND 8.7 9.0 9.9
8.9 9.1 9.8
3261C BARRON RIVER CANAL 8.4 8.8 10.0
3278T OKALOACOOCHEE SLOUGH 8.5 8.9 9.3
3278W SILVER STRAND 8.4 8.6 9.5
8.4 8.8 9.5
Okaloacochee-SR29
Cocohatchee-Corkscrew
Golden Gate - Naples Bay
Rookery Bay
Fakaunion
Fakahatchee
Weighted Average
Weighted Average
Weighted Average
Weighted Average
Weighted Average
Weighted Average

Summary Development of Performance Measures
V O L 1 COLLIER COUNTY WATERSHED
P A G E 57 MANAGEMENT PLAN – DRAFT
A low scoring area in the Okaloacoochee / SR 29
watershed corresponds with agricultural areas with
significant irrigation demands. The southern Faka
Union watershed was also scored poorly. This result is
likely due to the presence of the canal network that has
effectively drained the historical wetlands. Results are
similar in a portion of the Golden Gate – Naples Bay
watershed. These canals also influence the
groundwater elevations and contribute to lower head
elevations in the Water Table aquifer. Changes in
structure operations could have a positive influence on
groundwater elevation and availability in the
watershed.
Differences in defined boundary conditions between
the ECM and NSM are the likely cause of the low scores
along the watershed boundaries for the Water Table
and Lower Tamiami aquifers.
Figure 2-9. Water Table Aquifer Average Dry Season
Performance Score
Figure 2-10. Lower Tamiami Aquifer Average Dry Season
Performance Score
Figure 2-11. Sandstone Aquifer Average Dry Season
Performance Score

References
V O L 1 COLLIER COUNTY WATERSHED
P A G E 58 MANAGEMENT PLAN – DRAFT
LITERATURE CITED
Adamski, James C. and Leel Knowles, Jr. 2001. Ground-Water Quality of the Surficial Aquifer System and the Upper
Floridan Aquifer, Ocala National Forest and Lake County, Florida, 1990 – 99. U.S. Department of the Interior,
U.S. Geological Survey, Water-Resources Investigations Report 01-4008.
Bartlett, Drew, FDEP Director, Division of Environmental Assessment and Restoration, 2010, Personal Communication
Black, Crow, and Eidsness, Inc. 1974. Hydrologic Study of the G. A. C. Canal Network. Gainesville, FL. Project no. 449-
73-53.
CERP. 2007. “Development and Application of Comprehensive Everglades Restoration Plan System-wide Performance
Measures.” Restoration Coordination and Verification, Comprehensive Everglades Restoration Plan, Central
and Southern Florida Project
Grunwald, Michael. 2006. "The Swamp: Everglades, Florida and the Politics of Paradise." Simon and Schuster, New
York, New York
Kimmerer, W. J. 2002. "Physical, biological, and management responses to variable freshwater flow into the San
Francisco Estuary." Estuaries 25: 1275-1290.
McCormick, P.V., M.J. Chimney, and D.R. Swift. 1997. Diel oxygen profiles and water-column community metabolism in the Florida Everglades, U.S.A. Archive fhr Hydrobiologie 140:117-129.
SDI Environmental Services, Inc., BPC Group Inc. and DHI, Inc. 2007. “Final Report, Natural Systems Model (NSM)
Scenario Southwest Florida Feasibility Study”
South Florida Water Management District. January 2007. Naples Bay Surface Water Improvement and Management
Plan.

CCoolllliieerr CCoouunnttyy WWaatteerrsshheedd MMooddeell
UUppddaattee aanndd PPllaann DDeevveellooppmmeenntt