CCK ANNUAL REPORT 2009-2010 CONTENTS - ca.go.ke · HRA Human Resources and Administration ... IT...
31
CONTENTS CCK ANNUAL REPORT 2009-2010 Pg 2 Acronyms and Abbreviations Pg 4 Board of Directors Pg 6 Chairman’s Foreword Pg 8 Director-General’s Word Pg 12 Corporate Governance Pg 13 Organizational Structure Pg 14 Commission’s Mandate Pg 15 CHAPTER 1 Macro-Economic Environment Pg 19 CHAPTER 2 Management of Scarce Resources Pg 57 ANNEX: SELECTED KEY COMMUNICATIONS STATISTICS AND ECONOMIC INDICATORS Annex 1: Communications Statistics Annex 2: Economic Indicators 2009 Pg 24 CHAPTER 3 Promoting Competition and Innovation Pg 45 CHAPTER 5 Meeting Universal Access Objectives Pg 34 CHAPTER 4 Ensuring Compliance and Empowering Consumers Pg 47 CHAPTER 6 Capacity Building, Improvement of Systems and Working Environment Pg 54 CHAPTER 8 Financial Information Pg 51 CHAPTER 7 Corporate Communication and International Liaison
Transcript of CCK ANNUAL REPORT 2009-2010 CONTENTS - ca.go.ke · HRA Human Resources and Administration ... IT...

CONTENTSCCK ANNUAL REPORT 2009-2010
Pg 2 Acronyms and Abbreviations
Pg 4 Board of Directors
Pg 6 Chairman’s Foreword
Pg 8 Director-General’s Word
Pg 12 Corporate Governance
Pg 13 Organizational Structure
Pg 14 Commission’s Mandate
Pg 15CHAPTER 1Macro-EconomicEnvironment
Pg 19CHAPTER 2Management of Scarce Resources
Pg 57ANNEX: SELECTED KEY COMMUNICATIONS STATISTICS AND ECONOMIC INDICATORS
Annex 1: Communications Statistics
Annex 2: Economic Indicators 2009
Pg 24CHAPTER 3Promoting Competition and Innovation
Pg 45CHAPTER 5Meeting Universal Access Objectives
Pg 34CHAPTER 4Ensuring Compliance and Empowering Consumers
Pg 47CHAPTER 6Capacity Building, Improvement of Systems and Working Environment
Pg 54CHAPTER 8Financial Information
Pg 51CHAPTER 7Corporate Communication and International Liaison

Acronyms and abbreviations
Vice President Kalonzo Musyoka is received by CCK Director General Charles J.K. Njoroge and ICANN President Rod Beckstrom at the 37th ICANN meeting in Nairobi. Looking on is Information and Communication Permanent Secretary Dr. Bitange Ndemo (extreme left).
ICANN Meeting
ASP Applications Service Provider BPO Business Process Outsourcing BTS Base Transmitter Stations CA Consumer Affairs CCK Communications Commission of KenyaCDMA Code Division Multiple Access CEP Consumer Education Outreach Programme CPR Communication and Public Relations CS Commission SecretaryCSP Contents Services Provider CSR Corporate Social Responsibility CTMA Competition, Tariffs and Market Analysis CTO Commonwealth Telecommunications Organization DCNO Data Carrier Network Operator DTC Digital Television Committee DVB-H Digital Video Broadcasting-Handheld EACO East African Communications OrganisationsESAMI Eastern and Southern Africa Management Institute FA Finance and Accounts FONN Fibre Optic National Network FSM Frequency Spectrum Management GDP Gross Domestic Product HRA Human Resources and Administration ICT Information and Communications Technology IMIS Integrated Management Information SystemIPTV Internet Protocol Television ISP Internet Service ProvidersIT Information Technology ITU International Telecommunication Union
KACC Kenya Anti-Corruption Commission KBC Kenya Broadcasting Corporation LA Legal Affairs LCS Licensing, Compliance and Standards LLO Local Loop Operator NFP Network Facilities Provider PAPU Pan African Postal Union PCK Postal Corporation of Kenya PROC Procurement RFID Radio Frequency Identification SMS Short Message ServiceSP&B Special Projects and BroadcastingTEAMS The East African Marine System TKL Telkom Kenya Limited UAE United Arab Emirates ULF Unified Licensing Framework UPU Universal Postal Union USAID United States Agency for International Development USTTI United States Telecommunications Training Institute VCT Voluntary Counselling and Testing VoIP Voice over Internet Protocol VSAT Very Small Aperture TerminalWRC World Radio-communications ConferenceMOS Mean Opinion ScorePESQ Perceptual Evaluation of Speech QualitydBm Decibels (dB) measurement (m) RxLev Received signal levelWSIS World Summit on the Information Society
CCK ANNUAL REPORT 2009 - 20102 CCK ANNUAL REPORT 2009 - 2010 3

CHARLES J.K. NJOROGEDIRECTOR-GENERALMr. Charles J.K. Njoroge is the Director-General and Chief Executive Officer of the Communications Commission of Kenya (CCK). He holds an M.A in Development Economics from Dalhousie University, Canada, a B.A in Economics from the University of Nairobi, and a Postgraduate Certificate in Telecommunications Regulation from the University of Westminster, UK. Mr. Njoroge was appointed to the position on 21st July 2008.
HON. ENG. PHILIP O. OKUNDI (CHAIRMAN)Hon. Eng. Philip O. Okundi is the Chairman of the Board of Directors of the Communications Commission of Kenya. He was appointed to the position in October 2008. He holds a Msc. in Telecommunications Systems Engineering from the University of Essex and a BSc. in Electrical and Telecommunications Engineering from the University of Westminster. He is a fellow of the Institution of Engineers of Kenya and the UK, a registered Engineer and a Chartered Electrical Engineer (UK).
SHEILA KIAMBATI (ALTERNATE DIRECTOR)Ms. Sheila Kiambati is the Deputy Secretary in the Ministry of Finance. A Bachelor of Arts graduate of the University of Nairobi, Ms Kiambati also holds a postgraduate diploma in Financial Management. She has undertak-en a host of other courses in both local and overseas institutions. She is the Alternate Director to the Permanent Secretary in the Ministry of Finance.
FRANCIS KIMEMIA(DIRECTOR)Mr Kimemia is the Permanent Secretary in the Office of the President in charge of Internal Security.
BOARD OF DIRECTORS
DR. BITANGE NDEMO(DIRECTOR)Dr. Bitange Ndemo is the Permanent Secretary in the Ministry of Information and Communications. He holds a PhD in Industrial Economics from the University of Sheffield, UK, an MBA and Bachelor’s degree in Finance and Accounting from the University of Minnesota.
EUNICE MARANYA OMBATI(DIRECTOR)Ms. Eunice Maranya-Ombati holds an MBA from USIU-(San Diego) and a BSC in Agriculture from the University of Nairobi. She was appointed to the CCK Board on 19th November 2007 for a three-year term.
JOSEPH KANJA KINYUA (DIRECTOR)Mr. Joseph K. Kinyua is the Permanent Secretary in the Ministry of Finance. He holds a Bachelor’s and Master’s degrees in Economics from the University of Nairobi.
KARIITHI NJOGU (DIRECTOR)Mr Kariithi holds two MSc. degrees in Human Biology and in Management and Organization Development from Loughborough University of Technology in the UK. He is serving his second term on the CCK Board, which he joined on 1st October 2006.
HENRY MUNG’ASIA (ALTERNATE DIRECTOR)Mr. Henry M. Mung’asia is the Deputy Secretary in the Ministry of Information and Communications. A Bachelor of Arts (Hons) graduate of the University of Nairobi, Mr. Mung’asia has undertaken courses in Advanced Public Administration (APA) and in National Defense at the Kenya Institute of Administration and the National Defense College, respectively. He is the Alternate Director to the Permanent Secretary in the Ministry of Information and Communications.
JOHNSON S. MUSENGI (DIRECTOR)A professional computer programmer, Mr Musengi holds a postgraduate diploma in Maritime Studies and Port Operations from the University of Wales. Mr. Musengi completed his final term on the CCK Board on 27th September 2009.
ALICE MUNYUA(DIRECTOR)Ms Munyua holds an M.A. in Social Communications from the Pontifi-cal Gregorian University in Rome, Italy. She has also trained in gender mainstreaming, Internet law and negotiation skills at various reputa-ble institutions. She is serving her second three-year term on the CCK Board. She joined the CCK Board on 11th May 2005.
MATEI MULILI NDETI (DIRECTOR)Mr. Ndeti holds a Msc. in Electrical Engineering from North Carolina A&T State Uni-versity and a Bsc. in Systems Engineering from Wright State University,USA. He was ap-pointed to the CCK Board on 7th November 2008 for a three-year term.
JOHN OMO (COMMISSION SECRETARY)Mr. John Omo holds a Master of Laws degree from the University of Sheffield, UK, and a first degree in Law from the University of Nairobi. He is the Secretary to the Board and Head of the Legal Affairs Division at CCK.
JOE KAMAU(DIRECTOR)Mr. Joe Kamau holds an MBA in Finance from the USA. He also has done various post-graduate courses in International Business. Mr. Kamau was appointed to the CCK Board on 19th November 2007 for a three-year term.
CCK ANNUAL REPORT 2009 - 20104
Chairman’s foreward
Hon. Eng. Philip O. Okundi
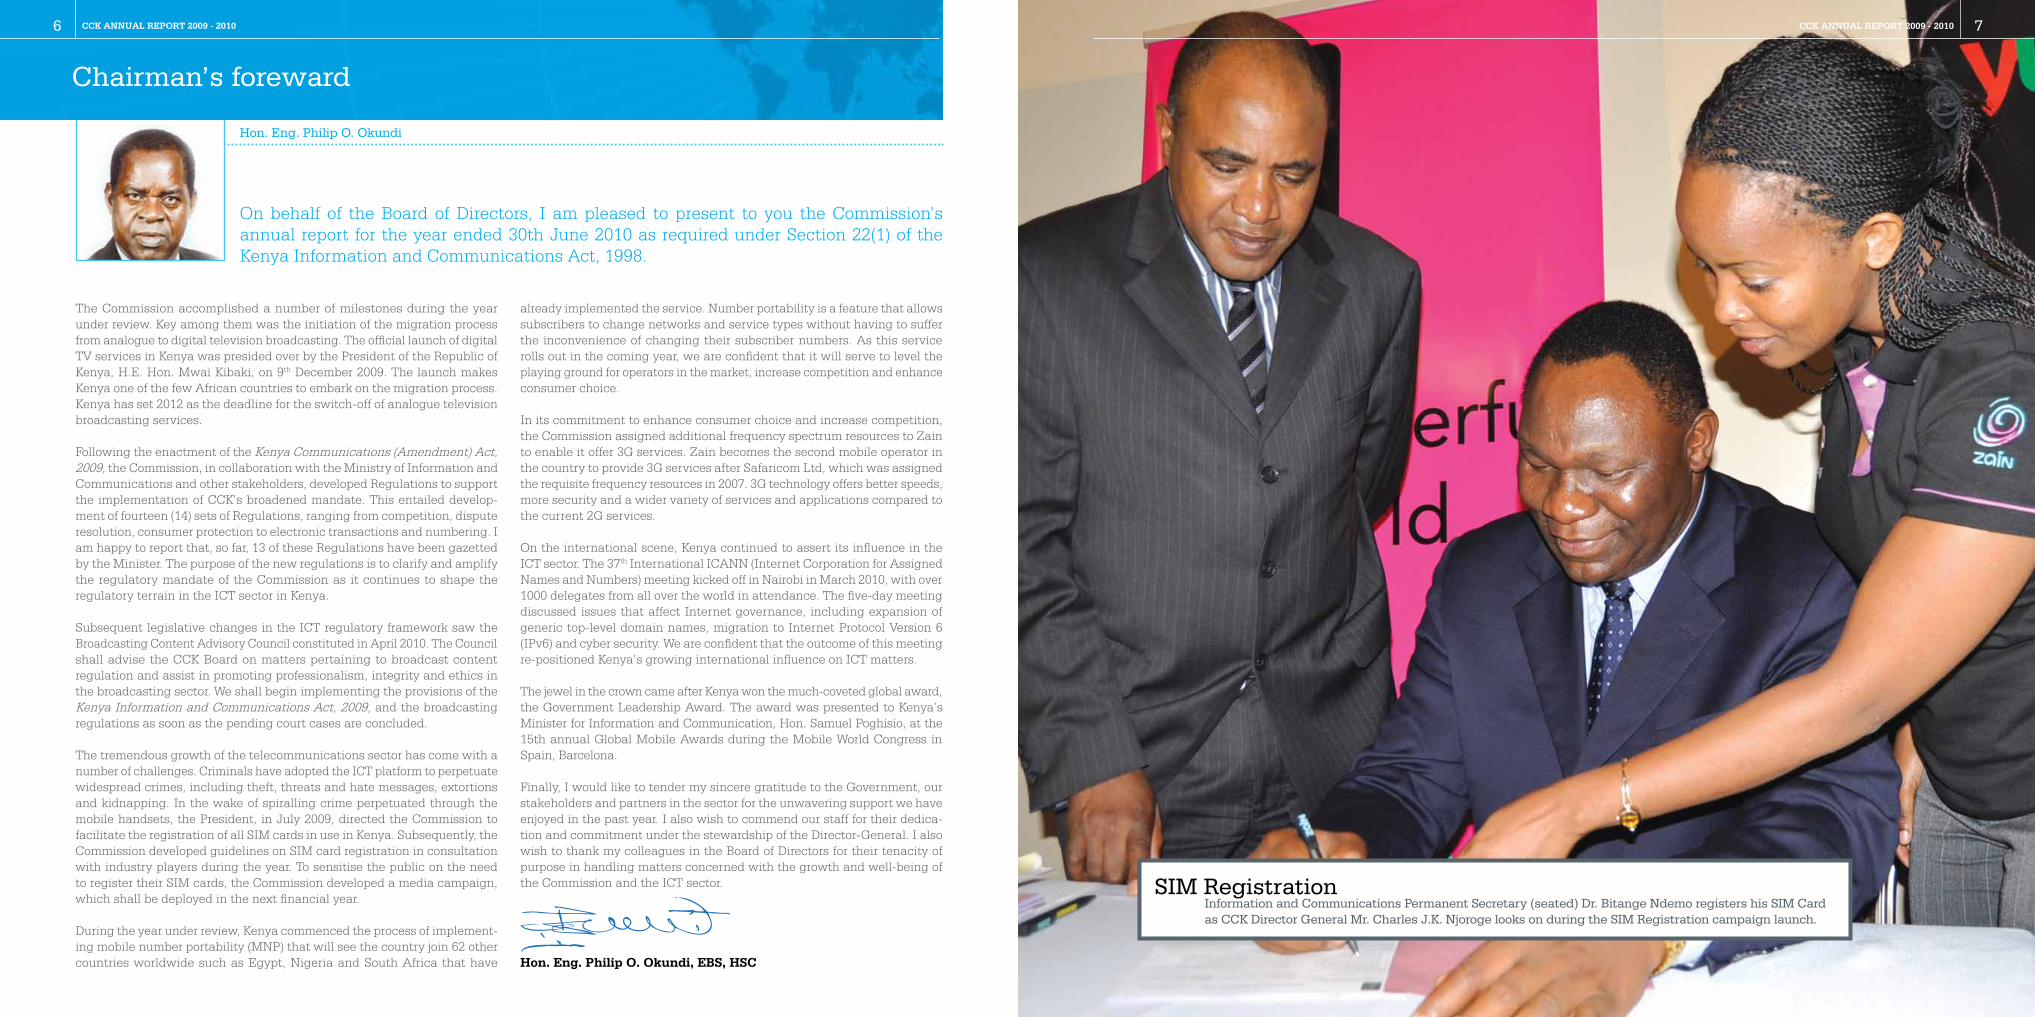
Information and Communications Permanent Secretary (seated) Dr. Bitange Ndemo registers his SIM Card as CCK Director General Mr. Charles J.K. Njoroge looks on during the SIM Registration campaign launch.
SIM Registration
The Commission accomplished a number of milestones during the year under review. Key among them was the initiation of the migration process from analogue to digital television broadcasting. The official launch of digital TV services in Kenya was presided over by the President of the Republic of Kenya, H.E. Hon. Mwai Kibaki, on 9th December 2009. The launch makes Kenya one of the few African countries to embark on the migration process. Kenya has set 2012 as the deadline for the switch-off of analogue television broadcasting services.
Following the enactment of the Kenya Communications (Amendment) Act, 2009, the Commission, in collaboration with the Ministry of Information and Communications and other stakeholders, developed Regulations to support the implementation of CCK’s broadened mandate. This entailed develop-ment of fourteen (14) sets of Regulations, ranging from competition, dispute resolution, consumer protection to electronic transactions and numbering. I am happy to report that, so far, 13 of these Regulations have been gazetted by the Minister. The purpose of the new regulations is to clarify and amplify the regulatory mandate of the Commission as it continues to shape the regulatory terrain in the ICT sector in Kenya.
Subsequent legislative changes in the ICT regulatory framework saw the Broadcasting Content Advisory Council constituted in April 2010. The Council shall advise the CCK Board on matters pertaining to broadcast content regulation and assist in promoting professionalism, integrity and ethics in the broadcasting sector. We shall begin implementing the provisions of the Kenya Information and Communications Act, 2009, and the broadcasting regulations as soon as the pending court cases are concluded.
The tremendous growth of the telecommunications sector has come with a number of challenges. Criminals have adopted the ICT platform to perpetuate widespread crimes, including theft, threats and hate messages, extortions and kidnapping. In the wake of spiralling crime perpetuated through the mobile handsets, the President, in July 2009, directed the Commission to facilitate the registration of all SIM cards in use in Kenya. Subsequently, the Commission developed guidelines on SIM card registration in consultation with industry players during the year. To sensitise the public on the need to register their SIM cards, the Commission developed a media campaign, which shall be deployed in the next financial year.
During the year under review, Kenya commenced the process of implement-ing mobile number portability (MNP) that will see the country join 62 other countries worldwide such as Egypt, Nigeria and South Africa that have
already implemented the service. Number portability is a feature that allows subscribers to change networks and service types without having to suffer the inconvenience of changing their subscriber numbers. As this service rolls out in the coming year, we are confident that it will serve to level the playing ground for operators in the market, increase competition and enhance consumer choice.
In its commitment to enhance consumer choice and increase competition, the Commission assigned additional frequency spectrum resources to Zain to enable it offer 3G services. Zain becomes the second mobile operator in the country to provide 3G services after Safaricom Ltd, which was assigned the requisite frequency resources in 2007. 3G technology offers better speeds, more security and a wider variety of services and applications compared to the current 2G services.
On the international scene, Kenya continued to assert its influence in the ICT sector. The 37th International ICANN (Internet Corporation for Assigned Names and Numbers) meeting kicked off in Nairobi in March 2010, with over 1000 delegates from all over the world in attendance. The five-day meeting discussed issues that affect Internet governance, including expansion of generic top-level domain names, migration to Internet Protocol Version 6 (IPv6) and cyber security. We are confident that the outcome of this meeting re-positioned Kenya’s growing international influence on ICT matters.
The jewel in the crown came after Kenya won the much-coveted global award, the Government Leadership Award. The award was presented to Kenya’s Minister for Information and Communication, Hon. Samuel Poghisio, at the 15th annual Global Mobile Awards during the Mobile World Congress in Spain, Barcelona.
Finally, I would like to tender my sincere gratitude to the Government, our stakeholders and partners in the sector for the unwavering support we have enjoyed in the past year. I also wish to commend our staff for their dedica-tion and commitment under the stewardship of the Director-General. I also wish to thank my colleagues in the Board of Directors for their tenacity of purpose in handling matters concerned with the growth and well-being of the Commission and the ICT sector.
Hon. Eng. Philip O. Okundi, EBS, HSC
On behalf of the Board of Directors, I am pleased to present to you the Commission’s annual report for the year ended 30th June 2010 as required under Section 22(1) of the Kenya Information and Communications Act, 1998.
CCK ANNUAL REPORT 2009 - 20106 CCK ANNUAL REPORT 2009 - 2010 7

To mark the 10th Anniversary, the Commission carried a publicity campaign dubbed ‘Opening your World’ with a tagline ‘tumetoka mbali’ (we’ve come a long way). Our publicity focus captured the yester years when making a telephone call or acquiring any other communications service required significant effort.
The year under review has been positive as it has seen more growth in the Information and Communications Technology (ICT) sector. The growth coincided with positive signs of economic recovery which became visible in early 2010 in many countries across the world. The Kenyan economy recorded a modest growth of 2.6 percent in 2009 compared to 1.6 percent recorded in 2008.
The improved performance of the economy is attributed mainly to increased activities in the tourism sector, resilience in the building and construction industry, and the Government’s intervention through an Economic Stimulus Package. The Transport and Communications sector recorded a 6.4 percent growth compared to 3.1 percent in 2008, accounting for 9.8 percent of total GDP in 2009 relative to 10.4 percent attained in 2008. This performance was mainly driven by the Posts and Telecommunications sub-sector which experienced a 10 percent growth compared to 7.9 percent recorded in 2008.
The communications industry has been characterized by rapid changes that have blurred the line between specific technologies. In response to the reality of technological convergence, the Government enacted the Kenya Communications (Amendment) Act, 2009, in January 2010 which expanded CCK’s mandate into broadcast content regulation and facilitation of e-transactions. To bring the new law into operation, 14 sets of regulations were developed, 13 of which the Minister for Information Communications gazetted during the year under review.
The mobile telecommunications sector continued to experience increased competition, which led the four mobile operators to expand their network coverage. As a result, mobile penetration increased from 46.8 percent by 30th June 2009 to 51.2 percent by 30th June 2010. During the year, mobile telephony posted a 15.5 percent growth in subscriber base to stand at 20.1 million by June 2010 up from 17.4 million in 2009.
In tandem with the increase in service uptake, there was a notable increase in crimes perpetrated through the mobile handset. In an effort to stem the vice, the Commission carried out a media campaign to sensitise Kenyans
on the need to register their SIM cards. The campaign is expected to be completed during the first quarter of the next financial year.
To further enhance competition in mobile telecommunications, the Commission provided an ASP licence to M/s Porting Access (Kenya) Limited for provision of number portability services in Kenya, through a competitive bidding process. The service is expected to be in place during the next financial year.
The Internet market remained on a growth trajectory during the year under review. By 30th June 2010, the country had an estimated 7.832 million Internet users, representing a 114.7% increase compared to 59.8% growth recorded the previous year. Despite this impressive growth, Internet penetration still continues to lag behind that of other communications services. Mobile data/Internet subscriptions became the key driver of growth in Internet penetration, mainly as a result of price reductions and innovative service offerings such as connectivity to social networking sites, which is quite popular with the youth. Despite the lack of a national broadband policy, competition reigned supreme in the local broadband market during the year under review. In this regard, the Commission issued Telkom Kenya (on behalf the East African Submarine cable System-EASSy) with a Submarine Cable Landing Rights licence, bringing to three the number of players in this market. During the year under review, CCK issued Essar Telecom Kenya Limited with an international gateway systems and services licence.
The Commission licensed 42 new postal/courier operators while 47 licensees wound up operations citing high operating costs, under-pricing of services by unlicensed operators and intensified competition from established operators. As a result, the total number of licensees went down to 159 from 164 in the previous year. The Commission continued in its efforts to promote postal/courier development in the country through hosting the second postal/courier forum in April 2010. The recommendations from the forum will inform the review of regulatory policies and procedures for the sub-sector in the future.
In respect to broadcasting, suspension of processing of applications for broad-casting licences and frequencies which commenced in 2008/09 remained in force to allow completion of a broadcasting regulatory framework. To ensure a smooth transition to digital TV broadcasting, the Commission assigned the Public National Broadcaster (i.e. the Kenya Broadcasting Corporation) with the necessary spectrum resources in Nairobi to facilitate the establishment of a digital television broadcasting signal distribution platform. The said platform was set up during the review period and accommodated a total of 13 TV
broadcasters as at June 2010. During the year under review, the Commission continued facilitating the work of the Digital Transition Committee (DTC) with a view to ensuring that the country migrates to digital TV broadcasting by the set switch over date of 30 June 2012.
In furtherance of its mandate in e-commerce, the Commission participated in the development of Electronic Transaction Regulations which were subse-quently gazetted by the Minister for Information and Communications. To manage national cyber threats in a coordinated manner, the Commission initiated the process of establishing a national Computer Emergency Response Team (CERT), known as Kenya national Computer Incidence Response Team Coordination Centre (KE-CIRT CC). The Centre is expected to be in place during the next financial year.
During the period under review, the Commission, through its Consumer Education Programme, distributed a total of 67,900 information materials (20 different types) through Postal Corporation of Kenya (PCK) outlets countrywide. These materials covered various topics including child safety and Internet use; electromagnetic energy and human health; warranties, quality of service and service level agreement (SLA). The Commission shall continue protecting the rights of consumers in the prevailing multi-operator environment through a multiplicity of interventions, including consumer education.
During the year under review, the Government in consultation with the Commission, developed and gazetted the Kenya Information and Commu-nications (Universal Access and Service) Regulations, 2010, to provide a framework for the management of the Universal Service Fund (USF). The fund is expected to leverage operation and service provision in un-served and under-served areas through provision of subsidies in addition to supporting ICT innovations and capacity building. To ensure that the USF meets its objectives, the Commission during the year under review commenced two studies aimed at assisting the Commission develop and implement effective, targeted and sustainable universal access programmes. The two studies are the National ICT Survey and the ICT Access Gap Study.
During the year under review, the Commission continued to undertake modernization of its systems, re- engineering of internal processes and human resources capacity building. In this regard, the Commission increased its human capital through recruitment of 14 additional staff, bringing the total staff establishment to 150. The enhancement of staff numbers was motivated mainly by the expansion of the Commission’s regulatory scope and jurisdiction.
During the year under review, there was a continued effort towards sensi-tizing the staff on HIV/AIDS through workshops organized for all staff. To competently and transparently carry out its mandate, the Commission continued to implement the Corruption Prevention Plans through carrying
out corruption eradication awareness to staff and through integrity training. The Commission shall sustain integrity awareness and training in line with the Commission’s policy of zero tolerance to corruption.
The Commission, having attained ISO 9001:2000 certification in May 2009, continued to fulfil the requirements of the Quality Management System (QMS). During the year under review, the Commission undertook an ISO Management Review as required under the standard to ensure that the standard remains suitable, adequate and effective and to assess opportunities for improvement. The Commission also initiated the process of upgrading its QMS to the ISO 9001: 2008 Edition during the year under review.
As a good corporate citizen, the Commission carried out a number of Corporate Social Responsibility (CSR) activities during the year. The most notable were support to the Mater Heart Run (for the sixth year running), and sponsorship of the Sports Personality of the Year Awards (SOYA) and the Kalasha Awards for the Film and Television Industry in Kenya. The Commission shall remain active in the CSR space in line with the provisions of the approved CSR Policy.
At the international level, the Commission continued to discharge its responsibilities as the designated Government representative to international organizations dealing with ICTs to which Kenya is affiliated. In this regard, the Commission participated and hosted various conferences, study group meetings and other fora organized by the said international organizations. The most notable was the hosting of the 37th International meeting for the Internet Corporation for Assigned Names and Numbers (ICANN).
In conclusion, the year under review witnessed many positive activities aimed at growing the ICT industry. The Commission owes these achievements to its hardworking and dedicated staff, industry partners and investors. I also wish to express my gratitude to the dynamic CCK Board and to the Ministry for Information and Communications for their continued support and good will.
Charles J.K. Njoroge, EBS
Director General’s Word (continued)
Charles J.K. Njoroge
The year under review coincided with the 10th Anniversary of the Commission and, indeed, a decade of a liberalized communications market. As we celebrated the anniversary, we reflected on the tremendous changes in the industry that had taken place during the period under review.
Director General’s Word
CCK ANNUAL REPORT 2009 - 20108 CCK ANNUAL REPORT 2009 - 2010 9

CCK staff pose for a group photo moments after participating in the 2010 Mater Heart Run
MATER Heart Run
CCK ANNUAL REPORT 2009 - 201010 CCK ANNUAL REPORT 2009 - 2010 11

Governance of the Commission is vested in the Board of Directors whose powers are set out in the Kenya Information and Communications Act, 1998. The Board thus provides leadership and vision for the Commission in the fulfilment of its statutory mandate.
THE BOARD OF DIRECTORS
1. Role of the BoardIn undertaking its responsibilities, the Board is guided by the Board Charter, which enumerates the functions and responsibilities of the Board. The principal role and responsibility of the Board is to establish long term goals for the Commission and ensure that effective plans are developed and implemented within a commonly agreed organizational structure. This entails among others:
i) Determining the vision, purpose and values of the Commission; ii) Ensuring that the CCK’s management puts in place structures to achieve the Commission’s purposes and objectives;iii) Identifying and managing key risk areas; iv) Setting targets, monitoring performance and determining the key performance indicators for the Commission; v) Ensuring preparation of financial statements and reports, commu- nication and disclosure of information to the stakeholders; and vi) Assessing its performance and effectiveness as a whole and that of individual directors.
2. Composition of the BoardThe Commission’s Board comprises 11 Directors who possess, among other attributes the following skills, competencies and experiences: sound business judgment and acumen; integrity; knowledge, understanding and experience in the law, customs and values that govern activities of the Commission; independence of thought and time to devote to the Commission.
The day-to-day running of the Commission is in the hands of the Director General who is an ex-officio member of the Board.
3. Board MeetingsThe Board is expected to meet at least four times within the year. However, due to the nature of its work, it may be necessary to meet more often. There were nine full Board meetings during the year under review.
4. Board CommitteesUnder Section 9 of the Kenya Information and Communications Act, 1998, as amended, the Board is authorized to delegate any of its functions or duties to any committee of the Board or any member or agent of the Commission. The Board, therefore, has four Standing Committees, namely: Finance, Audit, Staff Matters, and Technical. Board and Committee agendas are structured in such a manner as to assist the Board to meet its responsibilities.
The Finance Committee is responsible for, among others, accounting and financial management policies of the Commission. This Committee met four times in the year under review.
The Audit Committee, among other things, reviews internal and external audit reports and recommendations to ensure that where major deficiencies or breakdowns in controls or procedures have been identified, appropriate and prompt remedial actions are taken by management.
The Staff Matters Committee is responsible for, among others, development of human resources and related policies and their implementation. This Committee met three times in the year under review. The Technical Commit-tee deals with technical issues such as the granting of licences and it met six times in the year under review.
5. Induction and Continuing EducationAs a matter of course, the Management provides an orientation programme for new Board Directors. The programme includes presentations on the functions of the various departments in the Commission, its compliance programmes, Code of Conduct, management structure and, internal and external audit programmes as well as directors’ rights, duties and responsibilities.
The Directors undergo training on corporate governance and communica-tions regulation in addition to attending local, regional and international conferences, workshops and benchmark visits to various jurisdictions to gain better insights into global best practices in ICT regulation.
During the year under review, four Directors undertook a benchmarking mission to Spain aimed at learning from a well established regulatory authority in light of the Commission’s expanded regulatory mandate into broadcasting and electronic transactions.
Director (CTMA)
Director (FSM)
Director (LCS)
Director (HRA)
KEY
Director (F&A)
Director General
Board of Directors
Director (CA) (CS)
Director (SP&B)
Assistant Director (CPR)
Assistant Director (IAS)
Assistant Director (IT)
Manager(PROC)
Corporate Governance Organisation Structure
CPR | Communication and Public Relations PROC | Procurement LCS | Licensing, Compliance and Standards CA| Consumer Affairs
IT | Information Technology CTMA | Competition, Tariffs and Market Analysis HRA | Human Resources and Administration CS | Commission Secretary
IAS | Internal Audit Services FSM | Frequency Spectrum Management F&A | Finance and Accounts SP&B | Special Projects and Broadcasting
Malaysia Board TripThe CCK Board of Directors pose with the Chairman and CEO of the Malaysian Communications and Multimedia Commission during a benchmark visit to Malaysia.
CCK ANNUAL REPORT 2009 - 201012 CCK ANNUAL REPORT 2009 - 2010 13

The Communications Commission of Kenya is the regulatory authority for the communications sector in Kenya.
Established in 1999 by the Kenya Communications Act (KCA) No. 2 of 1998, CCK’s initial mandate was regulation of the telecommunications and postal/courier services and the management of the country’s radiofrequency spectrum.
In recognition of the rapid changes and developments in technology which have blurred the traditional distinctions between telecommunications, Information Technology (IT) and broadcasting, the Government enacted the Kenya Communications (Amendment) Act, 2009, in January 2009. This statute enhanced the regulatory scope and jurisdiction of CCK, and effectively transformed it to a converged regulator of the info-communications sector.
CCK is now responsible for facilitating the development of the information and communications sectors (including broadcasting, multimedia, telecommunications and postal services) and electronic commerce.
Commission’s Mandate
MacroeconomicEnvironment
Chapter 1 »
CCK ANNUAL REPORT 2009 - 201014 CCK ANNUAL REPORT 2009 - 2010 15

1.1 Global Economy Positive signs of economic recovery became visible in early 2010 in many countries across the world, spearheaded by emerging markets such as China and India, which achieved healthy GDP growth rates in 2009.
1.2 Global and Regional Information and Communications Technologies Industry
Globally, Information and Communication Technologies (ICTs) are recognized as important enablers of renewed and sustainable growth in many economies of the world. ICTs’ unique function as a key element of infrastructure for efficient industries and a critical productivity enhancer is crucial for sustain-ing recovery and laying the foundations for economies that are competitive in the long term. Besides supporting economic sustainability, ICTs have played a leading role in fostering environmental and social sustainability both within its own sector and as an economy-wide enabling infrastructure. Not only is the ICT industry increasingly adopting measures and strategies to reduce the sector’s energy footprint, but it is also developing innovative solutions to cut down energy consumption in other sectors of the economy (Global Information Technology Report, 2009/10).
Technological readiness is one of the key parameters for measuring a country’s economic competitiveness. This parameter measures the agility with which an economy adopts existing technologies to enhance the productivity of its industries. In today’s globalized economy, technology has increasingly become an important element for firms to compete and prosper. In particular, ICTs have evolved into the “general purpose technology” currently, given the critical spill-overs to the other economic sectors and their role as efficient infrastructure for commercial transactions. Therefore, ICT access and usage are included in this parameter as essential components.
In this context, whether the technology used has or has not been developed within national borders is irrelevant for its effect on competitiveness. The central point is that the firms operating in the country have access to advanced products and blueprints and the ability to use them. Among the main sources of foreign technology, Foreign Direct Investment (FDI) often plays a key role. In this respect, it is particularly worrisome that, after four years of solid growth resulting in a record global FDI stock of US$1.9 trillion in 2007, FDI declined by an estimated 15 percent in 2008 and further deterioration was expected for 2009, especially for developing countries. This development is due to shortages in finance and a more risk averse attitude of businesses. It is important to note that, in this context, the level of technology available to firms in a country needs to be distinguished from the country’s ability to innovate and expand the frontiers of knowledge (Global Competitiveness Report, 2009/10).
As far as social sustainability is concerned, ICTs have continued to enable greater access to basic services by all segments of society and improving the ways basic services such as education, finance, and healthcare are provided to citizens. ICTs offer revolutionary and more comprehensive communication channels and innovative ways of interacting and networking, thanks notably to Web 2.0 and mobile telephony applications. Leveraging on ICT capabilities
has many benefits for the many stakeholders and can significantly improve their effectiveness of operations and quality of services.
The ICT revolution has had a considerable impact on the postal industry. Postal enterprises which are managed in the traditional government mould have generally been late adopters of ICTs, partly because they are subject to fewer competitive pressures, compared with those that are expected to function as profit-making businesses. However, today almost every postal enterprise, irrespective of whether it operates in a protected or liberalized market, or whether it operates as a government corporation or as a private company, either uses or is keen to use ICTs.
Worldwide, migration to digital terrestrial television broadcasting is well in progress, creating new business opportunities for broadcast equipment manufacturers, content providers, television broadcasters and broadband service providers among others. Digital television broadcasting has helped to address concerns associated with analogue broadcasting which include poor quality of service; limited channel capacity; high set up and operation costs; frequent interferences in broadcasting bands; limited scope for future expansion and innovation. Furthermore, new ways to distribute content such as Internet Protocol Television (IPTV) and mobile TV are creating further opportunities for innovation and growth. The number of high-definition TV (HDTV) channels and HD-capable TV sets available to the consumer is on the rise.
In a nutshell, the boundaries of the ICT sector are shifting, and this change has become accentuated over the last few years as there is increasing convergence of technologies and digital media. For example, the boundaries between “traditional” ICT sectors and the consumer electronics sectors are blurring as devices such as television sets now routinely incorporate Internet access as a standard feature. The same is true for the software and entertainment sectors, as movies and other types of content are increasingly placed, processed, and shared on digital media.
1.3 Local EnvironmentAs shown in Table 1.1, the economy recorded a modest growth of 2.6 percent in 2009 compared to 1.6 percent recorded in 2008. The improved perform-ance can be attributed mainly to increased activities in the tourism sector, resilience in the building and construction industry, and the Government’s intervention through the Economic Stimulus Package. On the other hand, a mixture of unfavourable weather and sluggish internal and external demands restrained growth during the period under review.
Gross Domestic Product (GDP) per capita decreased from Kshs. 35,553 to Kshs. 35,461 over the same period. This decline could be as a result of a 2.6 percent contraction in the Agriculture and Forestry sector which is slower than the 4.1 percent contraction recorded in 2008. Key sectors that recorded impressive growth in 2009 include Hotels and Restaurants, Construction, Transport and Communications and Financial Intermediation. Manufacturing and Wholesale and Retail trade maintained positive growths, though slower than those recorded in 2008, while Mining and Quarrying, and Electricity and Water recorded substantial decline in the year under review.
The Transport and Communications sector recorded a 6.4 percent growth compared to 3.1 percent in 2008, accounting for 9.8 percent of total GDP in 2009 compared to 10.4 percent in 2008. This performance was mainly driven by the Posts and Telecommunications sub-sector which experienced a 10 percent growth compared to 7.9 percent recorded in 2008.
The postal and telecommunications sub-sector maintained a 2.8 percent contribution to GDP in 2009, with mobile telephony posting 15.5 percent growth in subscriber base to stand at 20.1 million by June 2010 up from 17.4 million in 2009.
Table 1.1: Selected Economic Indicators+INDICATOR 2005 2006 2007 2008 2009*Population (Millions) 35.1 36.1 37.2 38.3 39.4GDP at market prices (in KES .Min.) 1,415,724 1,622,591 1,828,788 2,077,433 2,273,685Growth of GDP at Constant (2001) Prices (%) 5.9 6.3 7.0 1.6 2.6GDP Per Capita (in 2001 Prices) (Kshs.) 33,442 34,574 35,969 35,553 35,461Transport and Communication GDP at Current Prices (Kshs. Millions) 145,524 171,993 194,093 216,959 223,807Postal and telecommunications GDP (Kshs. Millions) 36,242 43,251 54,964 58,213 64,269Transport and Communication as % of GDP 10.3 10.6 10.6 10.4 9.8Postal and telecommunications as % of GDP 2.6 2.7 3.0 2.8 2.8Growth of Transport and Communication at Constant (2001) Prices (%) 9.0 11.4 15.1 3.1 6.4Growth of Postal and telecommunications at Constant (2001) Prices (%) 17.7 16.5 30.3 7.9 10.0Private sector wage employment in transport and communications (‘000s) 75.1 90.9 117.8 120.3 124.7Public sector wage employment in transport and communications (‘000s) 38.9 40.2 36.1 36.9 38.4Consumer Prices, Annual Average [Index numbers October 1997=100] 180.23 191.11 199.24 231.48 252.89CPI Annual Inflation Rate (Overall) % 10.0 6.0 4.3 16.2 9.2* Provisional; +Revised
Source: Adapted from Economic Survey, 2010
During the period under review, the mobile telephony market continued to experience increased competition which saw the expansion of existing networks by the four mobile operators, namely Celtel Kenya Limited (Zain), Safaricom Limited, Telkom Kenya Limited (Orange) and Essar Telecoms Kenya Limited (yu). As a result, consumers enjoyed significant tariff reductions and increased access to communications services as evidenced by an increase in mobile penetration from 46.8 percent by 30th June 2009 to 51.2 percent by 30th June 2010.
At the end of the year under review there were an estimated 7.832 million Internet users in the country, representing a 114.7 percent increase compared to 59.8 percent increase recorded the previous year. The increase in the number of Internet users could be attributed to price reduction and innovative offerings such as connectivity to social networking sites through the mobile phones, a service that has gained popularity among the young in the country.
CHAPTER 1 Macro-Economic Environment Macroeconomic Environment (continued)
BCACBroadcast Content Advisory Council (BCAC) members together with CCK Director General and some senior CCK managers during the induction of the BCAC.
CCK ANNUAL REPORT 2009 - 201016 CCK ANNUAL REPORT 2009 - 2010 17

The public and private sectors continued to invest in roll-out and expansion of broadband infrastructure in an effort to ensure access to high speed data communications services by all. During the period under review, in addition to the South Africa-East Africa submarine cable system (SEACOM), The East African Marine System (TEAMS) cable system landed, linking Kenya’s coastal town of Mombasa and Fujairah. These cable systems are expected to provide affordable high speed Internet connectivity and redundancy to international communications networks.
During the year under review, the liberalized broadcasting sub-sector remained competitive with increased demand for broadcast frequencies and channels. The transition from analogue to digital TV broadcasting scheduled to end by 2012 is expected to increase efficiency in the use of radio spectrum, increase content plurality and diversity, and provide high quality digital signal. Furthermore the Broadcasting Content Advisory Council was established to enforce content regulation.
In the East Africa Community (EAC), Kenya continues to be the major communications and financial hub in the region. It is the largest economy in the region and enjoys good international and regional connectivity which include transportation linkages and ICT infrastructure. The three undersea cable systems are expected to not only provide redundancy but also spur further growth in the communications industry, thus increasing the country’s competitiveness. Improved international and regional connectivity via high quality and cost efficient ICT infrastructure is also expected to promote trade, investment and Business Process Outsourcing (BPO).
In the past two years Kenya’s economy has been hit by consecutive social and economic shocks such as post-election violence, the global financial crisis, food and oil price increases and drought, causing a significant reduction in growth. Despite these shocks, the economy is expected to experience positive growth of between 4.0 to 5.0 percent in the year 2010. This growth will be driven mainly by increased investment in key sectors such as agriculture, services, infrastructure, health and education.
The economy is likely to benefit from global economic recovery through improved demand for Kenyan exports as well as improved tourist arrivals. With the coming into effect of the East Africa Community (EAC) common market protocol on 1st July 2010, the country is expected to benefit from increased trade with other EAC member countries due to the expanded market (Economic Survey 2010).
Macroeconomic Environment (continued)
Management ofScarce Resources
Chapter 2 »
CCK ANNUAL REPORT 2009 - 201018 CCK ANNUAL REPORT 2009 - 2010 19

CHAPTER 2 Management of Scarce Resources
One of the key mandates of the Commission is the management of radio frequency spectrum and numbering resources which are the most essential but scarce inputs in the provision of ICT services. Due to increased demand for ICT services, the Commission continued to receive and respond to the changing and increasing demands for these resources.
2.1 Frequency Management Management of the radio frequency spectrum ensures efficient utilization of the scarce resource through planning, licensing/assigning, monitoring and coordination of the radio frequency resource. During the year under review, the Commission assigned frequencies for various systems/services as follows: 2.1.1 Fixed Links As shown in Table 2.1, the Commission assigned a total of 823 frequencies to various operators for deployment of new links to provide various radiocommu-nications services during the year under review. A total of 512 fixed links were decommissioned mainly due to increased availability of optic fibre networks. Overall, the number of fixed links increased by 311, mainly as a result of expansion of mobile networks.
Table 2.1: New Fixed LinksFrequency Band Number of New Links No. of Decommissioned Links Growth in the No. of Fixed Links
400MHz 28 - 28
1.5 GHz - 70 -70
2GHz - 6 -6
2.5GHz - 4 -4
4GHz - 11 -11
6GHz 8 48 -40
7/8GHz 208 143 65
10.5GHz - 9 -9
11 GHz 9 8 1
13GHz 347 207 140
15GHz 157 1 156
18GHz - 2 -2
23GHz 63 3 60
38GHz 3 - 3
Total 823 512 311
Source: The Communications Commission of Kenya
The total number of additional fixed links rose from 253 in 2008/09 to 311 in 2009/10. This is illustrated in Figure 2.1.
Figure 2.1: Total number of additional Fixed Links
2.1.2 Fixed Wireless Access Systems During the year under review, the Fixed Wireless Access (FWA) radiocommunications networks in the 3.5 GHz frequency band were expanded into 239 additional sites for the provision of data services.
2.1.3 Satellite Systems During the year, the Commission assigned frequencies within the C and Ku bands to four private Very Small Aperture Terminal (VSAT) applicants compared to 25 in 2008/09.Two satellite hubs were decommissioned during the year largely as a result of the transfer of international connectivity services to cheaper submarine optic fibre cables.
2.1.4 Mobile Cellular Services The total number of transceivers deployed by cellular mobile operators increased from 43,913 in 2008/2009 to 56,679 in 2009/10 as shown in Table 2.2.
Table 2.2: Total number of transceivers deployed in the mobile networksOperator Technology 2005/06 2006/07 2007/08 2008/09 2009/10Essar Telecoms (yu) 2G - - - 1,107 3,639Telkom Kenya (Orange) 2G - - - 3,501 3,458Celtel Kenya (Zain) 2G 2,108 2,949 4,752 6,440 6,966
Safaricom 2G 8,566 12,058 16,784 30,426 39,0483G - - 126 2,439 3,568
Source: The Communications Commission of Kenya
During the year, the Commission assigned 5MHz (duplex) each in the 2100 MHz frequency band to Celtel Kenya and Telkom Kenya for their 3G trials. To encourage the rollout and uptake of the 3G services as well as reduce barriers to the deployment of 3G technology, the Commission reduced the initial licence fee for 3G spectrum from USD 25 million to USD 10 million. Following this reduction, Celtel Kenya Limited paid the requisite fee and was subsequently assigned 10MHz (duplex) in the 2100 MHz frequency band for commercial deployment of 3G services.
3G technology, which is spectrum efficient and cost effective, supports a diverse range of services and provision of better quality service.
2.1.5 Private Land Mobile Services As shown in Table 2.3, the Commission assigned frequencies to 61 fixed and 376 portable/mobile stations in the VHF band during the year under review. The Commission also assigned frequencies in the HF band to 15 fixed and 13 portable/mobile stations.
Table 2.3: Additional Stations in Private Land Mobile NetworksFrequency Band Station Type 2005/06 2006/07 2007/08 2008/09 2009/10
VHFFixed 85 97 140 85 61Mobile /Portable 422 401 571 440 376Total 507 498 711 525 437
HFFixed 22 14 48 14 15Mobile / Portable 29 39 24 16 13Total 51 53 72 30 28
Source: The Communications Commission of Kenya
In addition, the Commission issued licences for the expansion of 23 existing networks; and renewed 357 Land Mobile networks, 389 Aircraft and 19 Amateur licences. The Commission also cancelled licences for 39 Land Mobile radio networks comprising 30 VHF, and four HF networks, and five Aircraft radio stations.
Source: The Communications Commission of Kenya
2005/06
0 200 200
311
253
372
331
1,224
600
Number
800 1,000 1,200 1,400
2006/07
2007/08
2008/09
2009/10
Fina
ncia
l Yea
r
CCK ANNUAL REPORT 2009 - 201020 CCK ANNUAL REPORT 2009 - 2010 21

Table 2.6: Numbering Resources Assigned
Type of Resource 2005/06 2006/07 2007/08 2008/09 2009/10Mobile National Destination Codes 10 16 24 8 4Mobile Subscriber Number Capacity 10,000,000 16,000,000 24,000,000 8,000,000 4,000,000Numbers for Fixed Telephony 1,625,000 1,629,000 1,729,000 50,000 900,025Toll Free Numbers - 5,010 15,010 50 1Premium Rate Numbers - - - - 1,000National Signalling Point Codes 228 233 361 1 1International Signalling Point Codes 2 6 6 2 1Network Colour Codes - - - 1 -
Source: The Communications Commission of Kenya
The decline in the mobile subscriber number capacity assigned could be explained by entry of two more mobile operators in 2008/09 while the sharp increase in numbers for fixed telephony could be attributed to the ULF regime which allows operators to provide a multiplicity of services, including fixed.
To ensure efficient utilization of the numbering space, the Commission carried out a numbering audit in order to establish levels of number usage. Out of a total of 47,263,375 assigned numbers, 29,201,897 were found to be in use as at 30th June 2010, representing a utilization rate of 61.8 percent compared to 64.7 percent recorded in the previous year. The decline in utilization rate was attributed to licensees who indicated that they were in the process of activat-ing the un-utilized numbers. Some operators were yet to roll out fixed networks and some of the un-utilized numbers were returned to the Commission. To ensure that numbering resources are utilized efficiently, the Commission will continue carrying out numbering utilization audits with a view to recalling numbers that remain un-utilized within six months after assignment.
The total number of authorised private radiocommunications stations as at 30th June 2010 is shown in Table 2.4.
Table 2.4: Number of Private Radiocommunication StationsFrequency Band No. of Fixed Stations No. of Mobile/Portable Stations30-136 MHz 211 843138-170 MHz 2,774 18,228170-470 MHz 411 7,627
Source: The Communications Commission of Kenya
2.1.6 Broadcasting Services Suspension of processing of applications for broadcasting licences and frequencies which commenced in 2008/09 financial year remained in force to allow completion of a broadcasting regulatory framework..
In preparation for the transition to digital broadcasting, the Commission assigned two digital TV broadcasting frequencies to Kenya Broadcasting Corpora-tion (KBC) in Nairobi for digital television signal distribution. KBC has since established a digital television broadcasting signal distribution platform that accommodated 13 TV broadcasters as at June 2010. The platform is expected to ease the process of migration from analogue to digital TV broadcasting.
The Commission continued to facilitate the transition to digital TV broadcasting by providing secretariat and logistical support to the Digital Migration Committee (DTC) and supporting the launch of the digital TV pilot project in Nairobi. The nationwide simulcast is expected to be achieved by 17th June 2012 in preparation for the International Telecommunication Union (ITU) stipulated global switchover deadline of 17th June 2015. The migration from analogue to digital TV broadcasting is expected to enhance the quality of broadcasting services and usher in a variety of advanced features to the benefit of the consumers. 2.1.7 Radio Alarm Services By 30th June 2010, the Commission had licensed four new alarm networks. . As shown in table 2.5, the total number of alarm units in the country reduced from 31,680 in 2008/09 to 30,429 in 2009/10, as a result of decreased demand in the number of alarm units.
Table 2.5: Number of Alarm Networks and UnitsFinancial Year No. of Alarm Networks No. of Alarm Units2007/08 171 28,3962008/09 175 31,6802009/10 179 30,429
Source: The Communications Commission of Kenya
2.1.8 Management of Numbering Resources As a part of its mandate, the Commission manages and assigns numbering resources to licensed telecommunication service providers. During the review period, the Commission assigned a total of 4,000,000 and 900,025 numbers to fixed and mobile operators, respectively. The Commission also assigned 1,000 numbers for premium rate services and one each for national and international signalling point code to facilitate interconnection between operators within and outside the country. This is shown in Table 2.6.
Management of Scarce Resources (continued)Management of Scarce Resources (continued)
Mobile Number PortabilityCCK Director General Charles J.K. Njoroge (left) hands over the ASP licence to Porting Access Kenya CEO Ronald Vlasman and Chairman Patrick Musimba (centre).
CCK ANNUAL REPORT 2009 - 201022 CCK ANNUAL REPORT 2009 - 2010 23

Promoting Competition and Innovation
Chapter 3 »
The ICT sector continued to post considerable growth with the mobile telecoms sub-sector spearheading the expansion. Mobile diffusion and subscriptions grew with new products being developed to meet consumer demands. Competition is generally recognised as a driver of good market outcomes such as low prices, increased investment and innovation as well as increased access to ICT services. In its endeavour to promote competition, the Commission continued to issue licences in various market segments and initiated studies aimed at reviewing interconnection and infrastructure sharing framework, and assessing the status of competition in the telecommunications market.
3.1 Licensing and Network ExpansionsTo enhance competition and expand consumer choice, the Commission continued to issue licences to new and existing players in the telecommunications and postal/courier sub-sectors. 3.1.1 Telecoms Licensing In addition to issuing licences to new applicants, the Commission issued licences to existing licensees who voluntarily migrated to the Unified Licens-ing Framework (ULF). The issuance of a ULF licence to Celtel Kenya Limited during the year under review saw all the cellular operators migrate to ULF framework. The Commission also issued an Application Service Provider (ASP) licence to M/S Porting Access (Kenya) Limited for provision of number portability services in Kenya.
The Commission issued a Submarine Cable Landing Rights licence to Telkom Kenya Limited, bringing the total number of such licences to three. This licence will facilitate the rollout of the submarine cable funded by the East African countries popularly called the Eastern Africa Submarine Cable System (EASSy). Essar Telecom Kenya Limited was also issued with an international gateway systems and services licence. Table 3.1 shows a summary of the licence issued in the year under review.
Table 3.1: Unified Licensing Framework (ULF) Licensees July 2008 to June 2010
September 2008 to June 2009 July 2009 to June 2010As at 30th June 2010
Licence CategoryLicenseesMigrated
to ULF
NewLicencesIssued
TotalLicensees
Migrated to ULF
New LicencesIssued Total ULF
Licensees
Submarine Cable Landing Rights (SCR) - 2 2 - 1 1 3International Gateway Systems & Services (IGS) 7 - 7 - 1 1 8Network Facilities Provider-Tier 1 (NFP T1) 3 - 3 1 - 1 4Network Facilities Provider-Tier 2 (NFP T2) 5 1 6 3 - 3 9Network Facilities Provider – Tier 3 (NFP T3) 3 - 3 - 1 1 4Applications Service Providers (ASP) 16 1 17 14 15 29 46Content Service Providers (CSP) 14 9 23 2 1 3 26Business Processes Outsourcing (BPO) - 3 3 - 4 4 7Telecommunications Contractors (TEC) 33 21 54 73 56 129 183Technical Personnel (TP) 15 25 40 50 81 131 171Telecommunications Equipment Vendors (V) - 36 36 - 41 41 77Total 96 98 194 143 201 344 538
Source: The Communications Commission of Kenya
CHAPTER 3 Promoting Competition and Innovation
CCK ANNUAL REPORT 2009 - 201024 CCK ANNUAL REPORT 2009 - 2010 25

At the end of the financial year, as shown in Table 3.2, a total of 1,225 licensees, majority of who were vendors and contractors, remained under the old licensing framework. The Commission continued to encourage the licensees to voluntarily migrate to the ULF framework. However, vendor and contractor, and technical personnel licence holders were compulsorily issued with ULF licence upon seeking renewal of their licences.
Table 3.2: Growth in Number of LicencesLicence Category 2004/05 2005/06 2006/07 2007/08 Sep 2008 2009/10*Vendors and Contractors 846 867 887 917 937 831Technical Personnel 207 257 287 315 326 261Internet Service Providers 59 72 83 108 - 84Value Added Service Providers 24 34 44 65 73 36Public Data Network Operators 11 16 17 24 - -Local Loop Operators 10 19 23 31 - -VSAT Terminal (through local Hubs) 548 673 971 1,025 1,067 -VSAT Terminal (through external Hubs) 78 101 110 121 133 -Commercial VSAT Hub Operators* 3 4 4 - - 1IBGO 4 6 8 - - 5DCNO - - 7 12 14 6Global Mobile Personal Communications by Satellite Service Providers (GMPCS)
1 2 2 3 - 1
Business Processes Outsourcing 1 2 18 18 -Total 1,792 2,051 2,445 2,639 2,568 1,225
* Licensees who have not migrated to the ULF frameworkSource: The Communications Commission of Kenya
3.1.2 Postal Licensing and Network Development During the year under review, the Commission licensed 42 new operators while 47 licensees wound up operations citing high operating costs, under pricing of services by unlicensed operators and competition from established operators. As a result, the total number of licensees went down to 159 from 164 in the previous year. Intra-country postal/courier operators continued to be the largest category of operators, increasing from 88 in 2008/09 to 91 in 2009/10 thus accounting for 57.2 percent of the total number of postal/courier licensees as depicted in Table 3.3.
Table 3.3: Number of Licensed Postal and Courier OperatorsFinancial Year/ Category of Operator 2005/06 2006/07 2007/08 2008/09 2009/10Public postal licensee 1 1 1 1 1International operators 12 13 14 15 12International Inbound operators 9 11 11 11 9Regional operators 7 9 10 11 12Intra-country operators 47 66 75 88 91Intra-city operators 28 33 36 38 33Document exchange operators 1 1 1 1 1Total 105 134 148 164 159
Source: The Communications Commission of Kenya
Promoting Competition and Innovation (continued)
Private letter boxes are still the most widely used avenues by the public postal licensee for delivering postal items. The number of installed boxes increased from 412,006 in 2008/09 to 414,756 in 2009/10 despite the decline in post office outlets from 710 to 700 over the same period. This is shown in Table 3.4. Postal operators recognize that they must embrace new technologies in their operations to remain relevant in the current ICT environment. The public postal operator continued to automate its postal outlet counters which increased from 430 in 2008/09 to 445 in 2009/10 as shown in table 3.4
Table 3.4: Postal and Courier Network IndicatorsNetwork 2005/06 2006/207 2007/08 2008/09 2009/10Postal Corporation of Kenya 1 1 1 1 1Total Post Offices 768 721 744 710 700Departmental Offices 498 498 495 495 504Sub-Post Offices 270 223 249 198 196
Private Letter boxesInstalled 400,016 411,716 414,616 412,006 414,756Rented 308,760 321,217 335,438 340,148 342,739Un-let 92,476 90,499 79,178 71,859 72,017
Letter Posting Boxes 1,049 966 827 890 890Public Counter Positions 1,388 1,388 1,390 1,279 1,339Automated Public Counters 79 79 94 430 445Non-Automated Public Counters 1,309 1,309 1,296 849 894Stamp Vending Licensees 4,242 4,125 4,609 4,505 5,136Stamp Vending Machines - 264 246 280 280Private Operator Outlets 521 554 606 622 601Total Outlets (Post offices + Private Operators Outlets) 1289 1,275 1,350 1,332 1,301
Source: The Communications Commission of Kenya
3.2 Services
3.2.1 Telecommunication Services During the period under review, competition continued to thrive in the telecommunications market. This could be attributed to the Unified Licensing Framework (ULF) introduced in the preceding year in September 2008. This licensing framework, with its inherent features of service and technological neutrality as well as reduced number of licence categories, has seen many players join the industry ranging from network providers to vendors. Furthermore, development in the sector has been driven mainly by innovations in wireless technology that have made it possible for provision of competitive and quality services.
3.2.1.1 Fixed Network Voice Services By June 2010, only Telkom Kenya Limited and Flashcom Kenya Limited, a Local Loop Operator (LLO), offered fixed network voice services, after EM Communications (Popote) ceased operations during the year.
Promoting Competition and Innovation (continued)
CCK ANNUAL REPORT 2009 - 201026 CCK ANNUAL REPORT 2009 - 2010 27

Nu
mb
ers
Year
Capacity
Mobile Subscribers
2,000,0002005/06 2006/07 2007/08 2008/09 2009/10
7,000,000
12,000,00010,600,000
6,484,791
18,200,000
25,964,700
29,400,000
46,462,948
17,362,257
20,119,304
12,933,653
9,304,818
17,000,000
22,000,000
27,000,000
32,000,000
37,000,000
42,000,000
47,000,000
The total fixed line (including wireless) subscribers declined from 696,501 in June 2009 to 460,114 in June 2010 leading to a decrease in fixed tele-density from 1.8 percent to 1.2 percent at the end of the period under review. In addition, the fixed wireline capacity decreased from 485,581 in March 2009 to 421,528 in June 2010 as shown in Table 3.5.
Table 3.5: Fixed Network Growth IndicatorsFinancial Year 2005/06 2006/07 2007/08 2008/09 2009/10Wireline Capacity 516,993 505,103 512,281 485,581* 421,528Wireline Connections 293,364 263,122 252,615 247,972 234,522Wireless Connections (Include LLO subscribers) - 84,104 274,449 419,047 225,592Total Connections (Wireline and Wireless) 293,364 347,226 527,064 696,501 460,114Urban Wireline Connections 279,079 251,924 246,927 240,533 227,486
Rural Wireline Connections 14,285 11,198 5,688 7,439 7,036
International Outgoing Traffic (Minutes) 46,957,348 27,363,876 15,582,304 14,471,643 14,761,211International Incoming Traffic (Minutes) 113,692,918 85,672,270 83,148,332 88,538,230 38,550,399 Traffic to Mobile networks (Minutes) 150,000,000 124,378,826 98,238,064 34,103,924 31,024,688Payphones 7,232 5,045 5,513 4,681* 4,681**Data up to March 2009Source: The Communications Commission of Kenya
The fixed wireline connections in the rural areas declined by 5.4 percent compared to 30.8 percent increase reported the previous year. Similarly, the connections in urban areas declined by 5.4 percent compared to 2.6 percent decline reported the previous year.
The overall decline in total fixed connections from 969,501 recorded in June 2009 to 460,114 in June 2010 is mainly attributable to a decline in fixed wireless connections that decreased by 46.2 percent due to increased competition from mobile service providers.
Figure 3.1 shows declining trends for wireline and wireless fixed connections.
Source: The Communications Commission of Kenya
Figure 3.1: TKL’s Subscriber Growth Trends
Wireless Connections Wireless Connections
2005/06
50,000
100,000
150,000
200,000
250,000
300,000293,364
263,122 247,972
419,047
234,522
225,592274,449
350,000
400,000
450,000
0
2006/07 2007/08 2008/09 2009/10
252,615
As shown in Figure 3.2, fixed international traffic (both outgoing and incoming) declined for the fifth year in a row.
Figure 3.2 : Fixed Network International Traffic volumes
Source: The Communications Commission of Kenya
This decline in both incoming and outgoing international traffic could be attributed to stiff competition in the international voice services market mainly from the mobile operators and the use of Voice over Internet Protocol (VoIP). Moreover, the increasing uptake of other Internet telephony services such as Skype and Google talk as well as video and instant messaging over the Internet could also have contributed to the slow-down of the international traffic over fixed line.
3.2.1.2 Mobile Network ServicesAt the end of June 2010, there were four licensed mobile operators namely Celtel Kenya (Zain), Safaricom Limited, Essar Telecoms Kenya Limited (yu), and Telkom Kenya Limited (Orange). The mobile telecommunications market registered a 15.5 percent growth in number of subscribers and increased competition among operators. As shown in Figure 3.3, the mobile business segment registered 20.1 million subscribers up in June 2010 from 17.4 million subscribers as at 30th June 2009 while mobile penetration increased from 46.8 percent in June 2009 to 51.2 percent in 30th June 2010, which is still below the world average of 67.0 percent (ITU, 2010).
Figure 3.3 : Mobile Operator’s Capacity and Subscribers
2005/06
2006/07
2007/08
2008/09
2009/10
10,000,000
14,761,211
14,471,643
15,582,304
27,363,876
46,957,348
30,000,000 50,000,000 70,000,000 90,000,000 110,000,000
Traffic Volume
International Incoming Traffic (Minutes)
International Outgoing Traffic (Minutes)
Fin
anci
al Y
ear
130,000,000
38,550,399
88,538,230
83,148,322
85,672,270
113,692,918
Promoting Competition and Innovation (continued) Promoting Competition and Innovation (continued)
Source: The Communications Commission of Kenya
CCK ANNUAL REPORT 2009 - 201028 CCK ANNUAL REPORT 2009 - 2010 29

Implementation of ULF framework, technological convergence and increased competition spurred product and service innovations in addition to competitive pricing. Further, the growth witnessed in the mobile segment could be attributed to affordability of handsets and aggressive marketing through increased offers and promotions.
The number of prepaid subscriptions continued to outstrip post-paid customers. During the year under review, there were 180,613 post-paid subscriptions against 19.9 million pre-paid subscribers, representing 99 percent of the total subscriptions. This trend is consistent with developing countries where prepaid service is prevalent. This could be due to its ease and convenience of subscription and low value prepay calling cards, which are as low as KES 5.00, making this service affordable to majority of the population.
As indicated in Table 3.6, the volume of SMS messages decreased by 2.43 percent to reach 2,662,653,719 down from 2,728,869,614 in June 2009. This reduction may be attributed to reduction in voice tariffs and promotions special offers on voice services.
Table 3.6: Mobile Network Growth IndicatorsType 2004/05 2005/06 2006/07 2007/08 2008/09 2009/10
Capacity 6,800,000 10,600,000 18,200,000 25,964,700 29,400,000 46,628,948
No. of Subscribers 4,611,970 6,484,791 9,304,818 12,933,653 17,362,257 20,119,304
No. of Transceivers - - - 21,662 43,913 56,679
SMS - 201,445,683 315,557,601 287,145,378 2,728,869,614 2,662,653,719Source: The Communications Commission of Kenya
During the year under review, mobile networks recorded increased international incoming traffic of 570,367,665 minutes up from 401,449,742 recorded at the end of June 2009. Similarly, international outgoing traffic increased to 220,133,307 from 172,998,132 minutes recorded the previous year. These represented increases in international incoming and outgoing traffic of 42.1 percent and 27.2 percent, respectively.
The use of mobile technology in money transfer services continued to expand with the launch of the yu cash by Essar Telecoms Kenya Limited, bringing the number of mobile operators offering money transfer services to three including Safaricom’s Mpesa and Celtel’s Zap. Telkom Kenya is also expected to launch this service during the next financial year. The money transfer service has enabled un-banked population in Kenya to access financial services.
3.2.1.3 Internet Services Internet penetration in Kenya, although showing an impressive growth, is still way behind that of other ICT services despite the critical role the World Wide Web plays in socio-economic development. The percentage of population that has Internet access reached 19.9 percent during the year under review, an increase of 10.5 percentage points from the previous year.
The total number of Internet subscriptions increased to 3.1 million in June 2010 from 1.8 million the previous year, representing a 69.8 percent increase. The growth is attributable to terrestrial mobile data/internet subscriptions through GPRS/EDGE and 3G networks, which accounted for 98.8 percent of the total subscriptions. A summary of Internet subscriptions is shown in Table 3.7.
Table 3.7: Internet Subscriptions and Estimated Internet UsersSubscriptions/Users 2008/09 2009/10Terrestrial mobile data/Internet subscriptions 1,562,065 3,059,906Terrestrial wireless data/Internet subscriptions 8,602 22,134Satellite data/Internet subscriptions 26 953Fixed Digital Subscriber Line (DSL) data/Internet subscriptions 7,822 9,631Fixed fibre optic data/Internet subscriptions 851 4,303Fixed cable modem (Dial Up) data/Internet subscriptions 21 25Total internet subscriptions 1,824,203 3,096,952Estimated Internet users* 3,648,406 7,832,352
Source: The Communications Commission of Kenya
Promoting Competition and Innovation (continued) Promoting Competition and Innovation (continued)
At the end of the year under review, there were an estimated 7.83 million Internet users in the country up from 3.64 million in the previous year, represent-ing an increase of 114.7 percent. The growth could be attributed to aggressive promotions especially from mobile operators, and increased access to social networking sites through mobile phones by the youth in the country.
In order to improve the uptake of Internet services, the Commission, through the community ICT tele-centres, continued to partner with implementing agencies on the development of local content that is geared towards assisting communities access information that is beneficial in their day- to- day activities.
3.2.1.4 Broadband Broadband connectivity is still at a nascent stage in the country (in Kenya, broadband is defined as data speeds greater than or equal to 256Kbps in one or both directions). Even though Kenya is yet to adopt a broadband policy, major initiatives have been made to ensure that the country does not lag behind in ICT developments. During the year under review, two undersea optic fibre cables, SEACOM and East African Submarine Cable System (EASSy), landed in Mombasa in addition to TEAMS, which had landed earlier in the previous year. This increased the total available undersea fibre optic capacity to 199.626 Gbps excluding EASSy while leased undersea capacity grew to 20,000 Mbps. However, satellite leased capacity declined significantly from 2,746.55 Mbps to 425 Mbps due to increased uptake of the cheaper fibre optic capacity by the operators. In addition, international leased bandwidth increased remarkably by 642.2 percent to reach 20,384.12 Mbps from 2,746.55 Mbps in June 2009 as shown in Table 3.8.
Table 3.8: International Leased BandwidthYear 2007/08 2008/09 2009/10International undersea bandwidth (Mbps) excluding EASSy - - 20,000.00International Satellite bandwidth (Mbps) 909.44 2,746.55 384.12Total international bandwidth (Mbps) 909.44 2,746.55 20,384.12
Source: The Communications Commission of Kenya
The international undersea bandwidth accounted for 98.1 percent of the total international bandwidth. This increase in bandwidth coupled with a significant reduction in prices from USD 3,000 to USD 600 coincided with the increasing demand for bandwidth as innovative services such as mobile broadband modems.
In addition to the private sector’s initiative of increasing access to broadband through the expansion of terrestrial optic fibre networks, the Government through the Fibre Optic National Network (FONN) project, continued with its effort to connect all districts in Kenya to the national broadband infrastructure. This initiative is aimed at attracting and stimulating the private sector to participate in the provision of telecommunication services in rural areas.
At the end of the review period, the total number of broadband subscriptions stood at 18,626 excluding mobile broadband.
3.2.1.5 Electronic Transactions The Kenya Information and Communications Act, 1998, mandates the Commission to regulate electronic transactions. During the period under review, the Commission participated in the development of Electronic Transaction Regulations which were later gazetted by the Minister for Information and Communications. The regulations allow the Commission to develop guidelines to steer the growth of electronic transactions and e-commerce in the country.
During the period under review, the Commission also continued to provide public policy oversight in the administration and management of the dot KE country code Top Level Domain (ccTLD). This was done mainly through participation in the Kenya Network Information Centre (KENIC) Board. In addition, the Commission initiated the process of establishing a national Computer Emergency Response Team (CERT), known as Kenya national Computer Incidence Response Team Coordination Centre (KE-CIRT CC). The KE-CIRT CC will enable the Commission manage, in a coordinated manner, national cyber threats and as a result enhance cyber security in the country.
3.2.2 Postal and Courier Services The Commission continued to develop mechanisms to promote postal/courier development in the country during the year under review. These included collaborative efforts in ensuring a consultative approach to regulation of this sub-sector. In this vein, the Commission hosted the second postal/courier forum in April 2010 which attracted about 100 participants from industry stakeholders. The recommendations from the forum shall inform future review of regulatory policies and procedures for the sub-sector.
CCK ANNUAL REPORT 2009 - 201030 CCK ANNUAL REPORT 2009 - 2010 31

Promoting Competition and Innovation (continued) Promoting Competition and Innovation (continued)
In the coming year, the Commission plans to review the monopoly status in reserved postal services which has been in force since 1999 with a view to assessing the extent to which the intended objectives and expected benefits have been realized. The primary purpose of the reserved services was to guarantee the provision of universal services by the incumbent thereby sustaining the very basic human right to information. In addition, it was aimed at giving the incumbent time, to restructure and commercialise in readiness for competition. The results of the review shall establish whether or not further liberalization would be necessary with a view to promoting further competition in the sub-sector.
3.4 Emerging Issues and InnovationsThe Commission undertakes research on emerging issues and new technolo-gies in the ICT sector with a view to keeping the Commission abreast of new developments in the sector. During the year under review, the Commission developed information papers aimed at informing the regulatory framework on the following emerging issues and innovations.
3.4.1 ICT and Climate ChangeGreenhouse gases (GHG) which include carbon dioxide and methane have been noted to accelerate warming of the planet, rise in sea level, ocean acidification, intensification of existing epidemics, migration and population displacement and loss of biodiversity. On their part, consumption of ICT services and products contributes approximately 2.5 percent of GHG emission.
However, deployment and use of environmentally benign ICT technologies such as renewable energy (solar, wind, etc), and sensor lighting among others can mitigate the GHG emissions. Moreover, use of ICTs to create awareness and improve monitoring and forecasting systems can promote sustainable consumption and development.
3.4.2 High Altitude Platform Systems High Altitude Platform Systems (HAPS) is a technology that utilizes balloons, airships or Unmanned Aerial Systems (UAS) located in the stratosphere at altitudes of between three (3) to22 km and can cover a service area of up to 1,000 km diameter. HAPS is a promising new environment friendly technol-ogy that combines the benefits of terrestrial and satellite communication systems for delivering broadband communications to users at a low cost.
Some of the HAPS systems under development or on trial include those utilizing airship technologies such as Sky Station, StratSat, stratospheric platform system and Airborne Relay Communications (ARC) System. It also includes aircraft technologies such as High Altitude Long Operation (HALO)-Proteus, SkyTower, Aerial Vehicle Communications System (AVCS) and Heliplat (HELIos PLATform). The key regulatory concerns identified regarding HAPS systems include the need for coordination with aviation and frequency management authorities.
3.4.3 Electronic Number Mapping Electronic Number Mapping (ENUM) is the process of unifying the telephone number systems of the Public Switched Telephone Network (PSTN) with the Internet addressing and identification name spaces. Telephone number mapping systems provide facilities to determine applicable Internet commu-nications servers responsible for servicing a given telephone number by simple lookups in the Domain Name System (DNS). ENUM allows the use of a traditional telephone number in the context of different communication media such as e-mail and VOIP, and therefore could facilitate the easier penetration of new applications and services into the mass market.
3.4.4 Next Generation NetworksConvergence of technologies has led to the emergence of Next Generation Networks (NGN) that enable delivery of multiple services independent of, and over different access and core networks. This trend of separation of infrastructure and services as well as emergence of “disruptive” technologies such as VoIP challenges existing regulatory models in dealing with licensing, competition, interconnection, universal access and other regulatory issues. The NGN environment demands a regulatory framework that is service and technology neutral, fosters competition and innovation, promotes efficient spectrum management, provides a non-discriminatory interconnection and infrastructure sharing framework, enhances ENUM, ensures universal access and protects consumers and stakeholders.
3.4.5 Safer Internet Day Concept PaperCreating awareness on child online protection regarding Internet and mobile phones usage and safety is a pertinent issue not only to the Commission but also at a global level. The ITU Child Online Protection initiative and the Safer Internet Day (SID) initiative driven by Insafe are examples of international initiatives designed to address child and young people online safety issues. Insafe is a European network of awareness centres promoting safe and responsible use of Internet and mobile devices to young people.
The SID is a day marked in February each year to promote safer and more responsible use of online technology and mobile phones, especially amongst children and young people across the world. The marking of this day has gained popularity in many countries, (both developed and developing) as it provides an opportunity for the government, network operators, service and content providers, civil society to cooperate in various awareness raising activities.
3.4.6 Broadband PolicyIn spite of the increased access, it is recognized that there is no broadband policy in Kenya that would guide the development of broadband services. Consequently, during the financial year, the Commission carried out a review of broadband policies in various jurisdictions including Australian, India, South African and United States to inform the development of a broadband policy for Kenya.
3.3 Tariffs and Competition
3.3.1 TelecommunicationsDuring the financial year, the Commission completed a study on assessment of competition in the telecommunications market and its contribution to GDP. The aim of the study was to identify relevant markets, designation of operators with Significant Market Power (SMP) and recommend appropriate regula-tory intervention. In addition, the Commission carried out a review of the 2006 network cost study to come up with new fixed and mobile interconnection rates as well as broadband interconnection and infrastructure sharing frameworks. The findings and recommendations of the two studies are expected to be implemented in the next financial year.
3.3.1.1 Fixed and Mobile Network Services During the period under review, competition in the fixed and mobile voice services intensified with retail price reductions, promotions and special offers driving call charges to lower levels. The Commission continued to implement the Third Phase of the cost-based Interconnection Determination No. 1 of 2007 on fixed and mobile interconnection rates issued in February 2009. Consequently, the market experienced further reductions in prepaid tariffs, with an average tariff reduction of 44.1 percent for prepaid calls within the same network and 31.5 percent for prepaid calls to other networks while post-paid tariffs remained relatively stable. This is shown in Figure 3.4.
Figure 3.4: Average Voice Tariff Trends
Source: The Communications Commission of KenyaAt the end of review period, the Minutes of Use (MOU) per subscriber per month increased by 52.7 percent from 65.7 minutes the previous year to 100.3 minutes. The growth in MOU is attributable to reduction in tariffs.
In order to enhance consumer choice, promote competition and ensure efficient use of numbering resources in a multi-operator environment, the Commission continued with preparations for the development of a framework for Mobile Number Portability (MNP). During the year under review, the Commission held a public consultation on the introduction of Service Provider Number Portability (SPNP). This consultation was initiated on the back of a favourable regulatory environment which includes the ULF regime and interconnection framework that is expected to narrow the on-net and off-net tariff differentials. This consultation culminated in the award of a licence to M/S Porting Access Kenya Limited to set up and run the necessary infrastructure. Furthermore, the Commission also initiated the process of developing number portability guidelines to facilitate the provision of MNP services in Kenya in the next financial year.
Upon implementation, MNP will enable subscribers to retain their telephone numbers when changing service providers, service types, and/or locations. 3.3.2.1 Internet and BroadbandThe landing of three undersea optic fibre cables has resulted into a significant reduction in wholesale prices for bandwidth as most of the operators migrate from costly satellite international connectivity to fibre. Despite this reduction, there has not been a commensurate reduction in retail bandwidth prices.
3.3.2 Postal and Courier ServicesThe tariffs for reserved postal services (which are regulated-postage for letters up to 350 grams, private letter box and bag rentals) remained unchanged for the second consecutive year. This trend partly reflects the sustained competition in the sub-sector that could have dissuaded the designated postal licensee from seeking any tariff adjustments.
Charges to same network (prepaid)
Charges to a fixed network (prepaid)Charges to another mobile network (prepaid)
Charges to same network (postpaid)
Charges to a fixed network (postpaid)Charges to another mobile network (postpaid)
27.00
24.00
21.00
18.00
15.00
12.00
9.00
6.00
3.00
0.002006
10.00
12.25
14.50
19.5017.6817.00
13.28
12.51
12.1912.0011.45
11.34
8.22
5.624.78
3.94
12.31
12.31
7.056.195.34
10.989.78
8.38
19.50
19.16
22.12
25.65
23.73
25.53
16.20
2007 2008 2009 2010
Pri
ce in
Ksh
per
Min
ute
CCK ANNUAL REPORT 2009 - 201032 CCK ANNUAL REPORT 2009 - 2010 33

Ensuring Compliance and Empowering Consumers
Chapter 4 »
The Commission is charged with the responsibility of ensuring that licensees comply with the Act, Regulations and licence conditions. It is also responsible for empowering and protecting consumers of ICT services, with respect to prices charged, and the quality and variety of services offered.
4.1 Monitoring and Enforcing Compliance To ensure that licensees comply with the various requirements under the Act, the Commission carries out inspections on frequency spectrum and quality of service, type approval of ICT equipment and certification of network installations. In order to mitigate and resolve cases of interference among radio spectrum users, the Commission carries out frequency spectrum monitoring. Quality of service measurement and monitoring is carried out on cellular mobile networks to verify operators’ compliance with agreed quality of service targets.
Type-approval of telecommunications equipment and certification of network installations are undertaken to ensure conformance with set equipment specifications and installation standards. The Commission carries out inspections to determine operators’ adherence to specific provisions of licence conditions and to identify illegal operators.
4.1.1 Inspections During the year under review, the Commission carried out inspections of telecommunication, network installations and certifications, postal/courier and radiocommunication facilities as demonstrated below.
4.1.1.1 Telecommunications In the telecommunications sub-sector, inspections were carried out to verify accuracy of information in the compliance returns submitted to the Commis-sion, assess licensees’ compliance with licence conditions and investigate existence of any illegal operators with a view to taking appropriate remedial actions. Table 4.1 gives a summary of inspections carried out during the year under review.
Table 4.1 Summary of Telecom Licensees Inspected
Category of licenseVerification of Compliance
ReturnsQuestionnaire
AuditGeneral Licence
Conditions
Content Service Provider (CSP) 6 14 3Application Service Provider (ASP) 11 8 6Network Facilities Provider (NFP) 5 3 8Data Carrier Network Operator (DCNO) 7 - -International Backbone and Gateway Operator (IB&GO) - - 1Public Data Network Operator (PDNO) 1 - 1Internet Service Provider (ISP) 6 - 1Local Loop Operator (LLO) 5 - 3Cable Television (CaTV) - - 3Business Process Outsourcing (BPO) - - 2International Gateway Services (IGS) - 1 -Value Added Services (VAS) - - 1Illegal Operations (Unlicensed Operators) - - -Cable Television (CaTV) – Operating illegally without a licence - - -Six resellers of telecommunication services who were dealers of a licensee were operating without licences.
- - -
Source: Communications Commission of Kenya
During the course of the inspections, the Commission identified seven illegal service providers in operation. Out of the Seven, one was offering CaTV services without a licence, and the case was handed over to the Police for further action while six of the illegal service providers were dealers of one of the licensees of the Commission. The licensee was subsequently penalised for facilitating illegal provisions.
CHAPTER 4 Ensuring Compliance and Empowering Consumers
CCK ANNUAL REPORT 2009 - 201034 CCK ANNUAL REPORT 2009 - 2010 35
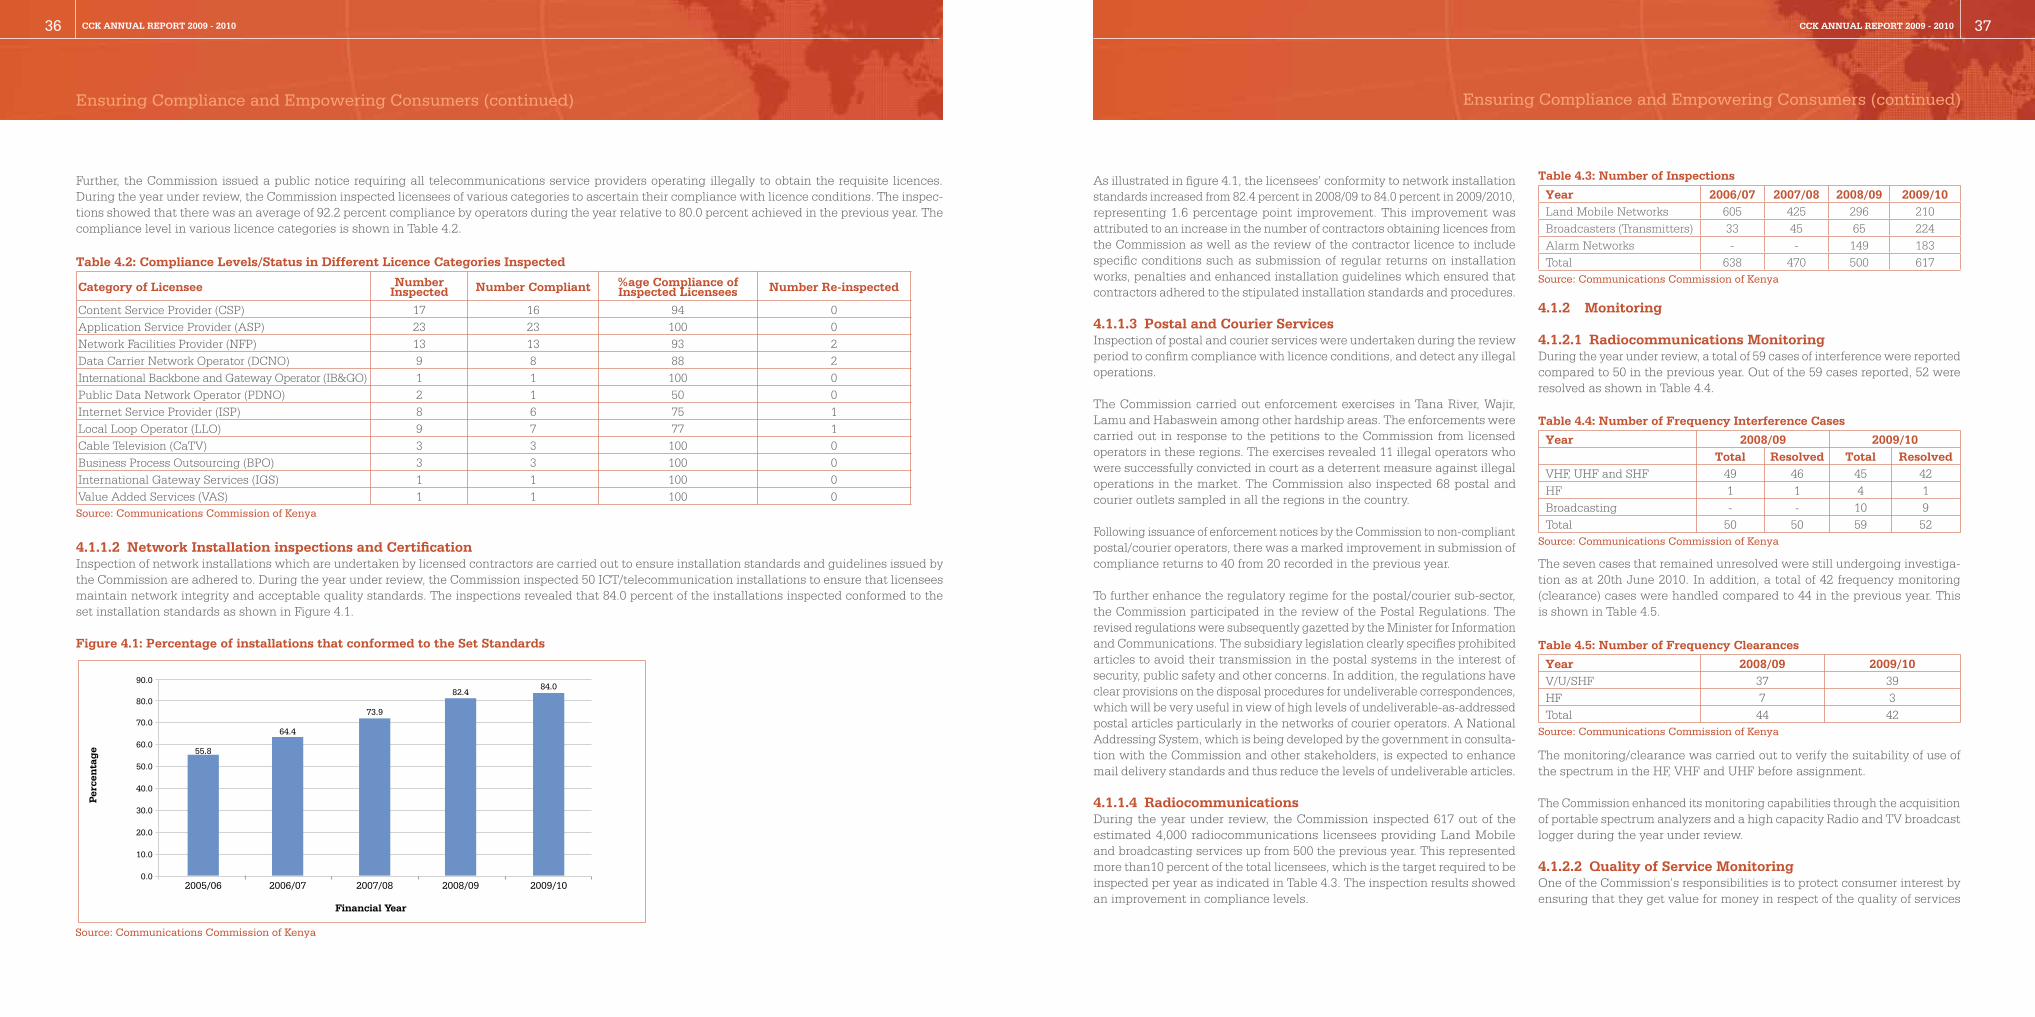
Further, the Commission issued a public notice requiring all telecommunications service providers operating illegally to obtain the requisite licences. During the year under review, the Commission inspected licensees of various categories to ascertain their compliance with licence conditions. The inspec-tions showed that there was an average of 92.2 percent compliance by operators during the year relative to 80.0 percent achieved in the previous year. The compliance level in various licence categories is shown in Table 4.2.
Table 4.2: Compliance Levels/Status in Different Licence Categories Inspected
Category of Licensee Number Inspected Number Compliant %age Compliance of
Inspected Licensees Number Re-inspected
Content Service Provider (CSP) 17 16 94 0Application Service Provider (ASP) 23 23 100 0Network Facilities Provider (NFP) 13 13 93 2Data Carrier Network Operator (DCNO) 9 8 88 2International Backbone and Gateway Operator (IB&GO) 1 1 100 0Public Data Network Operator (PDNO) 2 1 50 0Internet Service Provider (ISP) 8 6 75 1Local Loop Operator (LLO) 9 7 77 1Cable Television (CaTV) 3 3 100 0Business Process Outsourcing (BPO) 3 3 100 0International Gateway Services (IGS) 1 1 100 0Value Added Services (VAS) 1 1 100 0Source: Communications Commission of Kenya
4.1.1.2 Network Installation inspections and CertificationInspection of network installations which are undertaken by licensed contractors are carried out to ensure installation standards and guidelines issued by the Commission are adhered to. During the year under review, the Commission inspected 50 ICT/telecommunication installations to ensure that licensees maintain network integrity and acceptable quality standards. The inspections revealed that 84.0 percent of the installations inspected conformed to the set installation standards as shown in Figure 4.1.
Figure 4.1: Percentage of installations that conformed to the Set Standards
Perc
enta
ge
Financial Year
0.02005/06 2006/07 2007/08 2008/09 2009/10
10.0
20.0
55.8
64.4
73.9
82.484.0
30.0
40.0
50.0
60.0
70.0
80.0
90.0
Ensuring Compliance and Empowering Consumers (continued) Ensuring Compliance and Empowering Consumers (continued)
As illustrated in figure 4.1, the licensees’ conformity to network installation standards increased from 82.4 percent in 2008/09 to 84.0 percent in 2009/2010, representing 1.6 percentage point improvement. This improvement was attributed to an increase in the number of contractors obtaining licences from the Commission as well as the review of the contractor licence to include specific conditions such as submission of regular returns on installation works, penalties and enhanced installation guidelines which ensured that contractors adhered to the stipulated installation standards and procedures.
4.1.1.3 Postal and Courier Services Inspection of postal and courier services were undertaken during the review period to confirm compliance with licence conditions, and detect any illegal operations.
The Commission carried out enforcement exercises in Tana River, Wajir, Lamu and Habaswein among other hardship areas. The enforcements were carried out in response to the petitions to the Commission from licensed operators in these regions. The exercises revealed 11 illegal operators who were successfully convicted in court as a deterrent measure against illegal operations in the market. The Commission also inspected 68 postal and courier outlets sampled in all the regions in the country.
Following issuance of enforcement notices by the Commission to non-compliant postal/courier operators, there was a marked improvement in submission of compliance returns to 40 from 20 recorded in the previous year.
To further enhance the regulatory regime for the postal/courier sub-sector, the Commission participated in the review of the Postal Regulations. The revised regulations were subsequently gazetted by the Minister for Information and Communications. The subsidiary legislation clearly specifies prohibited articles to avoid their transmission in the postal systems in the interest of security, public safety and other concerns. In addition, the regulations have clear provisions on the disposal procedures for undeliverable correspondences, which will be very useful in view of high levels of undeliverable-as-addressed postal articles particularly in the networks of courier operators. A National Addressing System, which is being developed by the government in consulta-tion with the Commission and other stakeholders, is expected to enhance mail delivery standards and thus reduce the levels of undeliverable articles.
4.1.1.4 RadiocommunicationsDuring the year under review, the Commission inspected 617 out of the estimated 4,000 radiocommunications licensees providing Land Mobile and broadcasting services up from 500 the previous year. This represented more than10 percent of the total licensees, which is the target required to be inspected per year as indicated in Table 4.3. The inspection results showed an improvement in compliance levels.
Table 4.3: Number of Inspections
Year 2006/07 2007/08 2008/09 2009/10Land Mobile Networks 605 425 296 210Broadcasters (Transmitters) 33 45 65 224Alarm Networks - - 149 183Total 638 470 500 617
Source: Communications Commission of Kenya
4.1.2 Monitoring
4.1.2.1 Radiocommunications Monitoring During the year under review, a total of 59 cases of interference were reported compared to 50 in the previous year. Out of the 59 cases reported, 52 were resolved as shown in Table 4.4.
Table 4.4: Number of Frequency Interference Cases
Year 2008/09 2009/10Total Resolved Total Resolved
VHF, UHF and SHF 49 46 45 42HF 1 1 4 1Broadcasting - - 10 9Total 50 50 59 52
Source: Communications Commission of Kenya
The seven cases that remained unresolved were still undergoing investiga-tion as at 20th June 2010. In addition, a total of 42 frequency monitoring (clearance) cases were handled compared to 44 in the previous year. This is shown in Table 4.5.
Table 4.5: Number of Frequency Clearances
Year 2008/09 2009/10V/U/SHF 37 39HF 7 3Total 44 42
Source: Communications Commission of Kenya
The monitoring/clearance was carried out to verify the suitability of use of the spectrum in the HF, VHF and UHF before assignment.
The Commission enhanced its monitoring capabilities through the acquisition of portable spectrum analyzers and a high capacity Radio and TV broadcast logger during the year under review.
4.1.2.2 Quality of Service Monitoring One of the Commission’s responsibilities is to protect consumer interest by ensuring that they get value for money in respect of the quality of services
Source: Communications Commission of Kenya
CCK ANNUAL REPORT 2009 - 201036 CCK ANNUAL REPORT 2009 - 2010 37

provided. The Commission uses Key Performance Indicators (KPIs) to measure the quality of service for purposes of ensuring that licensees maintain accept-able quality of service (QoS) as per the set targets. To this end, the Commission published eight KPI parameters for mobile operators in the Kenya Gazette, six of which had been published in 2008/09. The two additional parameters were “handover success rate” and “received signal strength.” A summary of the KPIs for mobile operators and the thresholds are shown in Table 4.6.
Table 4.6: Quality of Service Parameters for Mobile Services and their Thresholds
No. KPI/ Parameter Target/Threshold for 2009/10 Target/Threshold in 3 years1 Completed calls 90% 95%2 Call Set Up Success Rate (CSSR) 90% 95%3 Dropped calls 2% 2%4 Blocked Calls 10% 5%5 Call Set UP Time <13.5 sec <13.5 sec6 Speech Quality (MOS PESQ) 95% of calls to have MOS >.2.7 95% of calls to have MOS >.3.17 Handover Success Rate 85% 95%
8 Received Signal Strength (RxLev)Outdoor =-102 dBm, Indoor = -95 dBm, In car =-100 dBm
Outdoor = -102 dBm,Indoor = -95 dBm, In car = -100 dBm
Source: Communications Commission of Kenya
During the period under review, the Commission carried out an assessment of quality of service levels attained by cellular mobile networks to determine their compliance with set targets. The results of the assessment and compliance status are summarized in the Table 4.7.
Table 4.7: Mobile Operators’ Compliance with Quality of Service Parameters
QoS Parameter2012/13)Targets
2009/ 10 to 2011/12 Targets
Safaricom Limited Celtel Kenya Limited (Zain)
Essar Telecoms Kenya Limited (Yu)
Telkom Kenya Limited (Orange)
Achieved Status Achieved Status Achieved Status Achieved StatusCompleted Calls 95% 90% 80.08 N/C 87.3 N/C 88.88 N/C 71.28 N/CCall Set up Success rate
95% 90% 82.64 N/C 90.04 C 90.9 C 73.68 N/C
Dropped Calls 2% 2% 2.48 N/C 1.36 C 2.36 N/C 2.92 N/CBlocked calls 5% 10% 17.54 N/C 9.76 C 8.28 C 26.04 N/C
Speech Quality (MOS Values)
<13.5 sec95% of samples >2.7
92.24 N/C 97.2 C 87.18 N/C 94.4 N/C
Handover Success Rate
95% of calls to have MOS >.3.1
85% 99.47 C 98.44 C 97.56 C 97.74 C
Call Set up Time 95% <13.5 Secs 4.80 C 4.788 C 19.648 N/C 4.906 C
Signal Strength (RxLev-dBm)
Outdoor =-102 dBm, Indoor = -95 dBm, In car =-100 dBm
Outdoor -102 dBm
-89.9 C -74.4 C -71.5 C -76.8 C
Source: Communications Commission of Kenya
Ensuring Compliance and Empowering Consumers (continued) Ensuring Compliance and Empowering Consumers (continued)
The operators are required under their respective licences to meet at least 80 percent of the total number of parameters in order to be deemed compliant. Table 4.8 provides a summary of the percentage compliance achieved by each operator.
Table 4.8: Mobile Operators’ Overall Compliance with Quality of Service Targets
OperatorTarget QoS Parameters Performance Achieved
Number Percentage (%) Number Percentage (%)Safaricom Ltd 8 80 3 37.5Celtel Kenya Ltd 8 80 7 87.5Telkom Kenya Ltd 8 80 3 37.5Essar Telecom (K) Ltd 8 80 4 50.0
Source: Communications Commission of Kenya
From Table 4.8, it is noted that only one operator, Celtel Kenya Limited, achieved 80 percent of the total eight (8) parameters. Subsequently, the Commission issued warning letters to the operators who did not achieve the targets.
4.1.2.3 Emissions from Radiocommunication Installations The rapid growth in mobile telephony has been characterized by growth in wireless infrastructure such as Base Transceiver Stations (BTS), relay stations and support systems such as power supplies. The increased presence of mobile systems and devices has raised public concerns on health issues associated with exposure to electromagnetic emissions from radio frequency (RF) sources.
The RF radiation from ICT infrastructure and devices, which is similar to visible light, infrared radiation and other forms of electromagnetic radiation with relatively low frequencies, is non-ionizing. This is because it does not have sufficient energy to ionize biological material like other types of electromagnetic radiation such as the X-ray and gamma radiations which are referred to as ionizing radiation.
Unlike ionizing radiation, RF exposure is not known to cause cancer. However, exposure to very high levels of RF radiation can be harmful due to rapid heating of biological tissue and the body’s inability to cope with or dissipate the excessive heat that is generated.
Monitoring of RF emissions from ICT infrastructure located near residential and commercial areas, and areas that are routinely accessible by the public and workers is necessary to ensure that emissions are within approved limits. In this regard, the Commission in conjunction with Radiation Protection Board (RPB), undertook RF radiation measurements at BTS stations across the country during the year under review. The results of this exercise will be released in the next financial year.
4.1.2.4 Returns from Operators One of the primary mandates of the Commission is to ensure that licensees conform to the terms and conditions of their licences which include submis-sion of compliance returns. The returns enable the Commission to determine if licensees are offering services according to the terms and conditions of their licences. It also helps the Commission collect data on the industry in respect of revenues, investments, networks, services offered, subscribers, prices charged, service outlets, infrastructure utilization, and employment levels, etc.
CCK ANNUAL REPORT 2009 - 201038 CCK ANNUAL REPORT 2009 - 2010 39

During the year under review, the Commission received compliance returns from 143 licensees out of the 156 in operation. This represented a compliance rate of 92 percent compared to 76 percent recorded in the 2008/2009 financial year, as shown in Table 4.9, posting an improvement of 16 percentage points.
Table 4.9: Compliance Returns Status 2009/10
Licence CategoryTotal No. of Licensees
Operational Licensees Licensees that Submitted ReturnsNumber Percentage %) Number Percentage (%)
Network Facilities Provider (NFP) 18 12 67 12 100Applications Service Provider (CSP) 57 38 67 33 87Content Service Provider (CSP) 86 31 36 24 77International Systems and Services 11 10 91 10 100Submarine Cable Landing Rights 3 2 67 2 100Business Process Outsourcing (BPO) 25 4 16 3 75Data Carrier Network Operator (DCNO) 4 4 100 4 100Public Data Network Operator (PDNO) 12 7 58 7 100Local Loop Operator (LLO) 12 8 67 8 100Internet Service Provider (ISP) 59 25 42 25 100Premium Rate Services (PRS) 34 15 44 15 100Total 321 156 49 143 92
Source: Communications Commission of Kenya
Despite the improvement in operational compliance, the increase from 42 percent in 2008/09 to 49 percent in 2009/10 is generally low. The low levels of compliance was attributed to service providers who received licences in the categories of BPO, CSP, ISP and PRS but were unable to commence service provision due to market related conditions, including competition as a result of implementation of the ULF regime. In addition, operators cited lack of spectrum, high costs of bandwidth and lack of sufficient funds as reasons for low operational compliance.
To ensure that the licensed service providers comply with licence conditions, the Commission issued 12 penalty notices on account of non-submission of returns, and 34 notices to revoke licences due to failure to pay operational fees. Three revocation notices were also issued due to non-operation.
4.1.3 Type Approval The Commission type approves telecommunications equipment in order to guarantee the safety of users, interoperability of networks and efficient utilization of frequency resources. During the review period, the Commission received and processed 113 type approval applications compared to 177 in the previous year. Details concerning equipment type and numbers are shown in Table 4.10.
Ensuring Compliance and Empowering Consumers (continued) Ensuring Compliance and Empowering Consumers (continued)
Table 4.10: Type Approval Applications Handled
Equipment TypeNumber of Equipment
2005/06 2006/07 2007/08 2008/09 2009/10Data Routers 2 13 6 4 4Gateway/Switches/PABX 10 9 11 5 4PSTN/IP Server Equipment - - 9 - -Wireless Terminals/System 33 15 11 16 -Transceiver-VHF/UHF 19 14 16 11 5Transceiver-HF 1 - 3 2 -Transceiver-Citizen Band (CB) 5 6 - - 1Low Power Wireless Terminal 1 - 29 46 15Satellite Terminal 5 - 2 - -Alarm Transmitter 1 - - - 1Broadcast Equipment 9 5 7 5 11VSAT Equipment (Transceiver, BUC, HPA, etc) 14 4 13 11 4GSM Interface & BTS 1 - 1 45 8CDMA Interface - - 2 - -VOIP Terminal - - - 2 -Telephone Set 1 2 2 2 6Payphone - - 1 - 1GSM Mobile Phone 2 4 9 18 33CDMA Telephone Set 14 6 5 5 -Fax Machine 1 - 2 5 -Modem - - - - 4Set-top box - - - - 8Microwave Equipment - - - - 7Mapping system - - - - 1Accepted 119 75 129 177 113Rejected 1 3 0 0 0Total 120 78 129 177 113
Source: Communications Commission of Kenya
The Commission also received and processed 63 applications for equipment import clearance. Further, the Commission continued with the process of procuring a conformance testing equipment to enhance type approval. The equipment, which is expected in the next financial year, will improve the Commission’s type approval processes.
4.2 Empowering and Protecting the Consumer
4.2.1 Consumer Education and InformationThe Commission recognizes the critical need to continuously create consumer awareness on issues of concern to consumers as well as those that adversely impact on them. The Commission seeks to achieve this objective by means of nation-wide Consumer Education Outreach Programmes (CEP) geared towards equipping consumers with skills, information and knowledge to enable them make informed decisions regarding the choice of products and services in the communications market.
During the period under review, the Commission, through its CEP, distributed a total of 67,900 information materials (20 different types) through Postal Corporation of Kenya (PCK) countrywide. These materials covered various topics including child safety and Internet use; electromagnetic energy and human health; warranties, quality of service and service level agreement (SLA).
CCK ANNUAL REPORT 2009 - 201040 CCK ANNUAL REPORT 2009 - 2010 41

The Commission commenced development of content on various aspects of postal and courier services during the second phase of its consumer education programme expected to be completed in the next financial year.
Recognizing that many children have access to Internet in recent years, the Commission commenced content development on Child Online Protection with a view to ensuring that parents and guardians become aware of the dangers that await children on the World Wide Web. Additionally, the Commission commenced the development of content on E-waste.
4.2.2 Customer Service Delivery The Commission sustained its efforts of ensuring that members of the public are aware of CCK’s commitment to provide its services to the highest standards possible. During the 2009/10 financial year, the Commission distributed 3,500 copies of its Service Charter to industry stakeholders and the general public during various meetings and other events organized or attended by the Commission. During the year under review, the Commission continued to review its charter to bring it in tandem with the latest developments in the industry and to incorporate the provisions of the Kenya Communications (Amendment) Act, 2009, and the Kenya Information and Communications Regulations, 2010. Further, the Commission undertook an independent survey to determine the level of customer satisfaction with regard to the Commission’s service delivery. The results of the survey indicated a Customer Satisfaction Index (CSI) of 84.9 percent representing an improvement of 1.9 percentage points over the previous year.
4.2.3 Consumer Protection One of the crucial roles of the Commission is the protection of consumers of ICT services in Kenya. The Commission’s approach to consumer protec-
tion has, over the years, been through interventions on behalf of consum-ers, consumer empowerment and provision of information. This approach recognizes that the creation of a level playing field for service providers does not always address all challenges consumers are faced with, especially in a technology-driven sector. It is also recognized that Kenya is a country in which literacy levels are not sufficiently high to enable the majority of consumers easily understand marketing communications and be able to make the right product and service choices.
During the year under review, the Commission convened a stakeholders workshop on electronic waste whose theme was “E-Waste: Impacts, Challenges and the Role of Government, Service Providers and the Consumer.” The workshop sought to create awareness on the dangers of inappropriate handling of electronic waste in the country. It brought together government agencies, research organizations, academic institutions, consumer organizations and equipment recyclers.
4.2.4 Consumer Complaints Resolution and EnquiriesThe Commission continued to facilitate the resolution of consumer complaints and enquiries. During the reporting period, the Commission received 151 complaints, reflecting a decrease of 39.6 percent compared to 250 reported in the previous year. This could be attributed to the need to continuously inform consumers of the Commission’s role as a second port of call in the complaint resolution process.
Most complaints related to defective communications equipment-especially mobile phone handsets, billing, service interruptions and quality of service, which collectively accounted for about 65.6 percent of the total complaints received.
Ensuring Compliance and Empowering Consumers (continued) Ensuring Compliance and Empowering Consumers (continued)
0
1
1
4
6
7
12
24
2230
5
2
23
4 8 12
Number of Complaints
16 20 24 28 32
Defective Terminal EquipmentQuality of Service (Voice & Data)
Fradulent Calls/SMSBilling
Unfair Trading PracticesConfidentiality/Privacy Breaches
Service Provisioning Delays/Failures/Termination
Frequency InterferenceMisleading Advertisements
Unauthorized Charges/Subscriptions
5
4
Electromagnetic Radiation
Inappropriate Media ContentTariffs
2
NuisanceCriminal use of service/facilities
Delivery Delays
1
1
1
Service Interruptions
Others
Other complaints were on service provisioning delays/failures/termination, which accounted for 7.9 percent. A categorization of complaints received is summarised in Figure 4.2. Out of the 151 complaints received, 82 were resolved while 69 were in the procress of being resolved at the end of the financial year as shown in Table 4.11.
Table 4.11: Status of Complaints Resolution in 2009/10Complaints
Category Total Number Resolved In ProgressDefective Terminal Equipment 30 14 16Quality of Service (Voice & Data) 22 12 10Fraudulent Calls/SMS 1 1 -Billing 24 9 15Unfair Trading Practices 2 2 -Confidentiality/Privacy Breaches 4 3 1Service Provisioning Delays/Failures/Termination 12 6 6Frequency Interference 1 1 -Misleading Advertisements 5 1 4Unauthorized Charges/Subscriptions 7 5 2Electromagnetic Radiation 1 1 -Inappropriate Media Content 5 3 2Tariffs 1 1 -Nuisance 6 3 3Criminal use of services/facilities 2 - 2Delivery Delays 4 4 -Service Interruptions 23 15 8Others 1 1 -Total 151 82 69
Source: Communications Commission of Kenya
The complaints resolution rate rose to 54.3 percent from 20.0 percent in the previous year as illustrated in Figure 4.3.
Table 4.11: Status of Complaints Resolution in 2009/10
Source: Communications Commission of Kenya
Source: Communications Commission of Kenya
54%Resolved 46%
In Progress
CCK ANNUAL REPORT 2009 - 201042 CCK ANNUAL REPORT 2009 - 2010 43

During the period under review, a total of 39 consumer enquiries were received, most of which were related to broadcast content and digital migration (25.6 percent) while enquiries on issues not relevant to the Commission accounted for 35.9 percent of the total received. Table 4.12 provides more details on the enquiries handled by the Commission in the 2009/2010 financial year.
Table 4.12: Number of Enquiries in 2009/2010Enquiries
Category Received Resolved In ProgressE-commerce 1 1 -Broadcasting 10 8 2Commission’s Services 7 7 -Safe use of facilities and services 4 4 -Subscriber confidentiality 1 1 -Commission’s discharge of its mandate 2 2 -Others 14 14 -Total 39 37 2
Source: Communications Commission of Kenya
During the period under review, out of a total of 39 enquiries received, 94.9 percent were responded to as shown in Figure 4.4.
Source: Communications Commission of Kenya
To enhance complaint resolution and response to enquiries, the Commission designed and uploaded complaints and enquiries forms on to its website to assist consumers easily submit their complaints. The Commission also developed a mechanism through which consumers can provide feedback by means of a web form on the corporate website.
In addition, the Commission commenced use of a computer application for the management of consumer complaints as part of the Commission’s Integrated Management Information System (IMIS). The use of the said application has improved the tracking of complaints handled at any given time.
It is worth noting that during the year under review, 56 percent of the consumer complaints and enquiries received were via e-mail, 15 percent by telephone, 15 percent reported at Commission Offices, 11 percent by letters and the remaining three percent were reported through fax and print media.
The Consumer Protection Regulations, 2010, gazetted by the Minister for Information and Communication are expected to enhance the complaint resolu-tion process. Furthermore, the expected enactment of the proposed Consumer Protection Bill will further boost consumer confidence by way of making it easier for consumers to seek redress.
Ensuring Compliance and Empowering Consumers (continued)
94.9%
5.1%
Resolved
Unresolved
Meeting Universal Access Objectives
Chapter 5 »
CCK ANNUAL REPORT 2009 - 201044 CCK ANNUAL REPORT 2009-2010 45

The Commission’s vision is to ensure ‘access to communications services by all in Kenya by 2030’. Access to communication services has now become a human right to which all Kenyans in all parts of this country, including the high cost areas, are entitled.
The greatest challenge has been how to ensure provision of services to areas that do not have sufficient commercial incentives to attract private operators and require deliberate intervention strategies and mechanisms because of the perceived low returns on investments.
During the year under review, the Commission undertook the following initiatives towards achieving universal access.
5.1 Implementation of the Universal Service FundTo achieve universal access in the country, the Government, in consultation with the Commission developed and gazetted the Kenya Information and Communications (Universal Access and Service) Regulations, 2010, to provide a framework for the management of the Universal Service Fund (USF). The Regulations were developed through a consultative process involving all stakeholders and entailed several workshops and comments/views on the Universal Service Consultative Paper No 2/2009.
The USF is expected to leverage operation and service provision in un-served and under-served areas through provision of subsidies in addition to support-ing ICT innovations and capacity building.
5.2 Universal Access Studies The USF, as envisaged in the Kenya Information and Communications, Act 1998, seeks to address the challenges that the ICT sector faces including network roll-out, accessibility, affordability, capacity building and innova-tion within a proper framework. In order to ensure that the USF meets its objectives, the Commission, during the year under review, commenced two studies aimed at assisting the Commission develop and implement effective, targeted and sustainable universal access programmes. The two studies are the National ICT Survey and the ICT Access Gap Study.
5.2.1 The National ICT Survey During the year under review, the Commission entered into a contractual arrangement with the Kenya National Bureau of Statistics (KNBS) to carry out the National ICT Survey. The survey sought to collect, collate and analyse data relating to ICT access and usage in Kenya. It captures household and individual data and information on internationally recognized ICT indicators. Data and information from this survey shall be used in the ICT Access Gaps Study. The survey is expected to be completed in the next financial year.
5.2.2 The ICT Access Gaps Study In order to identify the ICT gaps in the country and the challenges facing ICT service provision in the sector, the Commission contracted Apoyo Consultaria Limited to undertake ICT Access Gaps Study. The key objective of the study is to establish the market efficiency and true access gaps with respect to the ICT services. The gaps identified will form the basis on which estimates for the incentives required to stimulate investment in high cost areas (areas where the cost of service provision is perceived to be high) shall be derived.
The results of the study will provide policy makers and the Commission with current data on deficiencies in service provision in the sector. In addition, the data will form the bedrock for designing and building sustainable universal access programmes, including subsidy levels and other regulatory measures to influence the spread and utilization of communications services in the country.
5.2.3 Universal Access Pilot ProjectsIn the last five years, the Commission has been implementing a number of pilot projects which include the School-based ICT Centres and the Community ICT Access Points to provide a learning ground for future roll-out of similar projects countrywide
During the year, the Commission, through its ‘ICTs for People with Disabilities’ Project, established the following eight ICT centres in learning institutions for Persons with Disabilities:
• Thika High School for the Blind• Machakos Technical Institute for the Blind• Kibos Special School for the Blind• St Lucy Secondary School for the Blind• Joyland Special Secondary School for the Physically Handicapped• Mombasa Secondary School for the Physically Handicapped• Rev Muhoro School for the Deaf and• Kuja Secondary School for the Deaf.
Under this project, the Commission provided requisite hardware and software and two-year support for Internet connectivity.
CHAPTER 5 Meeting Universal Access Objectives
Capacity Building, Improvement of Systems
and Working Environment
Chapter 6 »
CCK ANNUAL REPORT 2009 - 201046 CCK ANNUAL REPORT 2009 - 2010 47

the male/female ratio to 3:2. Further, the Commission developed a Disability Mainstreaming Policy and constituted a Disability Mainstreaming Committee to spearhead issues that affect people with special needs.
6.3 Automation of the Commission’s Processes The Commission continued to automate its internal processes, through an Integrated Management Information System (IMIS), in an effort to enhance operational efficiency and effectiveness. During the year under review, the Commission developed the Frequency Spectrum Management (FSM) module and customized all the other system modules. The integrated system will facilitate centralization of information within the Commission through a single database, improve workflow, increase the level of transparency and enhance the efficiency of access to information within the Commission.
In order to boost storage capacity of the Commission’s servers, the Commission installed an ultra modern network storage solution. The solution assists in accommodating the growing storage requirements from IMIS and other already existing systems. The storage further enhanced backup and disaster recovery facilities thus ensuring business continuity with minimal down time. In order to complement IMIS and the back-up systems, the Commission acquired modern desktop computers and laptops.
6.4 Procurement and Disposal The Commission continued to procure goods, services and works in accordance with the Public Procurement and Disposal Act, 2005 and Regulations, 2006. This ensured fairness, transparency and accountability in the tendering processes. Out of the total number of contracts awarded for supply of goods, services and works during the year under review, 15 were worth at least Kshs. 5 million each as shown in Table 6.1.
Table 6.1: Tenders Awarded Over 5 MillionItem description Firm Awarded the Tender Tender AmountTender for provision of Internet connectivity to the eight schools Jamii Telkom Ltd Kshs 7, 839,744Provision of consultancy services to undertake a study on ICT Access Gaps in Kenya Apoyo Consultoria S.A.C USD 298,557.60Supply, delivery, installation and commissioning of radio tv broadcast logger New Edge Solutions Ltd USD 297,612.74Supply, installation and commissioning of network storage solution Gestalt and Gild Ltd Kshs 9,539,364Tender for syndicated data to measure consumer trends Steadman Group Ltd Kshs 8,203,420Tender for review of the cost study Analysys Mason USD 843,427.74Tender for supply, installation, testing and commissioning of Government of Kenya Internet Exchange Point (GIXP)
Kenya Data Networks Ltd Kshs 22,082,500.86
Provision of gala dinner for ICANN delegates Carnivore Restaurant Kshs 10,635,000Tender for supply and delivery of portable radio frequency monitoring receivers Protea Electronics(PTY) Ltd Euro 111,780Tender for SIM card campaign and sensitization Scanad Kshs 34,538,156.59
Tender for Insurance Brokerage services
• Alexander Forbes• Utmost Insurance
Brokers• Prime Mover Insurance
Brokers
Kshs 8,457,793.00
Tender for construction of the car park sheds for monitoring vehicles TKM Maestro Ltd Kshs 7,232,562Tender for architectural consultancy for interior design services at CCK Centre Adventis Inhouse Africa Ltd Kshs 7,262,064
Tender for management of UPU event organization and provision of dinnerTop Image Ltd Kshs 17,442,991.20Carnivore Restaurant Kshs 7,585,000
Tender for telecom conformance analyzer Hermon Laboratories USD 303,440Source: Communications Commission of Kenya
To ensure economy and efficiency in procurement, the Commission continued to implement the supplier monitoring and evaluation system developed during the previous year.
Efficient delivery of service is a key component for any progressive organisa-tion. The attainment of such efficiency by any institution requires human, financial and other resources backed by appropriate coordination to ensure that they are applied in the most cost-effective way possible. Towards this end, the Commission continued to undertake modernization of its systems, re-engineering of internal processes and human resources capacity building during the year. The Commission also undertook various initiatives to improve the working environment and ensure quality manage-ment systems.
6.1 Human Resource Capacity Development It is recognised that development of human capital is the most important function of any organization. The Commission develops capacity of staff and also contributes to building capacity in the ICT industry by availing training and internship opportunities to industry and students, respectively.
6.1.1 Human Capital Cognizant of the dynamism of the ICT sector, it is vital to maintain a highly skilled and motivated workforce. The ICT sector is characterised by rapid innovation coupled with convergence, which speedily render regulatory practices obsolete. This peculiarity creates a huge demand for capacity build-ing especially for regulatory institutions and allocation of requisite resources. During the year under review, the Commission increased its human capital through recruitment of 14 additional staff due to its expanded mandate. This brought the total number of staff to 150 out of which 41 percent were female and 59 percent male. The Commission trained a total of 122 staff on management (69), technical (40) and development (13) courses. Other areas in which staff were trained included professional, integrity and procurement. The total number of staff trained represented 80.3 percent of the workforce, comprising 45 percent female and 55 percent male.
During the year under review, the Commission engaged an independent consultant to carry out job analysis and evaluation; review the organization structure and remuneration; skill gap analysis; staff establishment and propose motivational strategies. This assignment was aimed at aligning the organization structure to commission’s expanded mandate as well as the dynamic changes in the ICT sector. In addition, it was aimed at putting in place competitive terms and conditions of service that are able to attract, motivate and retain highly talented, qualified and competent staff. The report was completed and submitted to the Commission for consideration. 6.1.2 Attachment and Internship ProgrammeIn line with its policy to encourage transfer of knowledge between the industry and academia, the Commission offered opportunities for attachments and internships to 65 students (35 male and 30 female), mainly from local universities and colleges. One-day learning visits for students from four local learning institutions were also facilitated for exposure.
6.2 Improvement of the Working Environment The Commission recognizes the importance of a conducive, healthy, safe, secure and a corruption-free working environment as one of the strategies to motivate staff in order to enhance productivity, efficiency and improve service delivery to the public.
6.2.1 Occupational Health and Safety The Commission, during the review period, landscaped the area around the prefabricated buildings at the Commission’s Headquarters to provide a serene ambience. Further, to ensure safety and improve the environment, various obsolete items were disposed of. Servicing and maintenance of fire extinguishers and suppression systems were undertaken, and a refresher course for fire marshals conducted.
6.2.2 Campaign against HIV/AIDSIn the fight against HIV/AIDS, the Commission has in place a comprehensive HIV and AIDS Policy whose focus is on the prevention, education, advocacy and counselling for infected and affected. The Commission also sets aside funds to support the campaign and the fight against AIDS. During the year under review, the Commission carried out a behaviour change sensitiza-tion campaign among the entire workforce jointly with the United Nations Development Programme (UNDP).
6.2.3 Anti-Corruption StrategiesThe Commission has in place an Anti-Corruption Policy, Corruption Prevention/Integrity Committees, Code of Conduct, and Corruption Prevention Plans. During the year under review, a workshop on integrity and good governance for new staff was carried out. Members of integrity committee attended a workshop on ethical leadership.
The Commission continued to implement the Corruption Prevention Plan, carried out corruption eradication awareness to staff through the Commis-sion’s Electronic Bulletin, intranet and as a statutory obligation submitted quarterly reports to the Kenya Anti-Corruption Commission (KACC). The Commission also distributed copies of the Public Officers Ethics Act, 2003 as amended, to sensitise staff on the Code of Conduct and ethical behaviour for public officers.
6.2.4 Prevention of Drug and Substance AbuseDuring the period under review, the Commission put in place an Alcohol and Drug Abuse Policy to help employees and their families address challenges of drugs and substance abuse. In a bid to create awareness on drugs and substance abuse, the Commission also sensitized staff through training of workplace counsellors.
6.2.5 Gender and Disability MainstreamingThe Commission developed a Gender Mainstreaming Policy to guide mainstreaming of gender issues at the Commission. During the year under review, out of the 14 staff employed, 50 percent were female. Thus bringing
CHAPTER 6 Capacity Building, Improvement of Systems and Working Environment Capacity Building, Improvement of Systems & Working Environment (continued)
CCK ANNUAL REPORT 2009 - 201048 CCK ANNUAL REPORT 2009 - 2010 49

During the year under review, the Commission identified and disposed of assorted items, including obsolete furniture, typewriters, computers, telephone headsets and old newspapers and magazines through a public auction at the Commission’s headquarters.
6.5 ISO 9001:2000 CERTIFICATION The Commission, having attained ISO 9001:2000 certification in May 2009, continued to fulfil the requirements thereof. ISO requires an institution that has been certified to maintain the Quality Management System (QMS) through continual improvement and compliance with surveillance audits. During the year under review, the Commission undertook an ISO Management Review as required under the standard to ensure that the QMS remains suitable, adequate and effective and to assess opportunities for improvement. The Commission was also audited by the Société Generale de Surveillance (SGS) for conformance to the ISO 9001:2000 requirements.
In November 13, 2008, the ISO 9001:2000 was revised to ISO 9001:2008 and all organizations accredited to the old standard were required to upgrade to the new standard by 12th November 2010. During the year under review, the Commission embarked on the process of re-certification to the new standard.
Capacity Building, Improvement of Systems & Working Environment (continued)
Corporate Communicationand International Liaison
Chapter 7 »
CCK ANNUAL REPORT 2009 - 201050 CCK ANNUAL REPORT 2009 - 2010 51

Pursuant to its mandate of ensuring that Kenya meets its obligations under regional and international treaties or agreements relating to provision of ICT services, the Commission continued to participate in local, regional and international efforts aimed at contributing to policy development and initiatives. The Commission also continued to participate in local ICT industry initiatives through stakeholder consultative forums and making a positive contribution to the society.
7.1 Engaging with Local Community and Stakeholders The Commission continued to make a difference in the Kenyan society through carrying out Corporate Social Responsibility (CSR) programmes, engaging and interacting with stakeholders in the ICT sector through public consultations and exhibitions among other activities.
7.1.1 Corporate Social Responsibility As a good corporate citizen, the Commission was involved in a number of CSR activities aimed at giving back to the society. During the end-of-year festive season, the Commission donated food items and basic provisions to the less privileged and vulnerable members of society. The beneficiaries included Nyumba ya Wazee, Shangilia Mtoto wa Afrika Children Home and prisoners at the Lang’ata Women’s Prison.
Other CSR activities undertaken included support to the Mater Heart Run for the sixth year running, sponsorship of the Sports Personality of the Year Awards (SOYA) and Kalasha awards for the Film and Television industry in Kenya. SOYA Kenya is an annual event which rewards excellence and exemplary performance among sportsmen and women in Kenya. Support to Kalasha was provided with a view to promoting the development of local content in the country.
7.1.2 Public and Stakeholder Consultations In accordance with the Commission’s tradition of subjecting key regulatory decisions to a process of public consultation, the Commission conducted a number of stakeholder consultations during the year. The most notable included consultations on the development of subsidiary legislation in support of the Kenya Information and Communications Act, 1998 as amended. During the year, the Commission hosted a corporate golf tournament for licensees and other stakeholders in the coastal city of Mombasa. The golf event, which has now become a fixture of the CCK calendar, will in future be held in a different region each year to ensure that the Commission interacts with ICT consumers and licensees in all regions of the country in line with its national mandate.
7.1.3 Exhibitions and Promotional Activities During the year, the Commission in conjunction with the Ministry of Informa-tion and Communications, Kenya ICT Board and the Kenya Business Process Outsourcing and Contact Centre Society participated in the International Telecommunication Union (ITU) Telecom World 2009 Exhibition and Forum held in Geneva, Switzerland.
The participation was aimed at positioning Kenya as an ICT investment hub as well as showcasing the country’s successes in the ICT sector. The Kenya
Pavilion at the ITU Telecom World 2009 attracted a number of dignitaries including the President of Rwanda, H.E. Paul Kagame, the President of Zimbabwe, H.E. Robert Mugabe, the Prime Minister of Tanzania, the Right Honourable Mizengo Kayanza Peter Pinda, and the Secretary General of the ITU, Dr. Hamadoun Touré. The participation witnessed a spike in the number of enquiries from investors who visited the Kenya Pavilion.
Closer home, the Commission also participated in the Public Service Week for the second year running. The Public Service Week is an annual event aimed at facilitating greater interaction between the Government (including State Corporations) and the public. The Commission shall continue participating in this event with a view to ensuring that it interacts much more with the public and ICT consumers.
7.1.4 Website Re-design The Commission completed the redesign of its corporate website during the year under review. The redesign was aimed at enhancing the website’s content, functionality, interactivity and visual appeal. The Commission shall continue enhancing the corporate website with a view to ensuring that it meets the diverse information needs of our stakeholders.
7.2 Celebration of 10th Anniversary The Commission commemorated its 10th anniversary during the year under review. The anniversary was marked through a number of activities including the production and airing of a corporate media campaign and documentary, which were geared towards highlighting the benefits that the Commission has conferred to the Kenyan society in its first decade of existence. In addition, the Commission mounted an industry exhibition at which licensees showcased the various ICT services and products in the market place by dint of the Commission’s regulatory facilitation.
The anniversary celebrations culminated in a gala dinner patronized by a vast array of stakeholders, including licensees, Government, international organizations in the field of communications and ICT regulators in the region. The Vice President of the Republic of Kenya, Hon. Kalonzo Musyoka, graced the reception on behalf of His Excellency President Mwai Kibaki. In his speech, the President paid a glowing tribute to the Commission for its sterling performance in overseeing the fast growth of the ICT sector.
7.3 International Relations and Liaison
7.3.1 Regional and International Meetings and Conferences In the international scene, the Commission participated in various meetings and fora in line with its statutory mandate. The Commission also met all its obligations to the said organizations during the period under review.
In addition, the Commission hosted key personalities, delegations and meetings in the country during the year. Of special note was the Secretary General of the International Telecommunication Union (ITU), Dr. Hamadoun Tourè. During his visit, Dr. Tourè participated in a ceremony to witness the landing of the third undersea fibre optic cable, EASSy, in Mombasa. The Commission further hosted the 37th Annual Meeting of the International
Corporation for Assigned Names and Numbers (ICANN) -the body responsible for the global coordination of Internet resources. The Pan African Postal Union (PAPU) Forum on ‘The Nairobi Postal Strategy and Beyond’ was also hosted in Nairobi, and brought together participants from the entire African region.
During the year under review, the Commission continued to participate actively in national preparations for the Universal Postal Union (UPU) Postal Strategy Conference scheduled to take place in September 2010 in Nairobi. This Conference will prepare a roadmap for the next World Postal Strategy expected to be adopted in Doha in 2012.
In addition, the Commission participated in meetings and conferences organ-ized by various international organizations to which Kenya is affiliated. The most notable included the ITU Council, the Administrative Councils of ATU and PAPU, as well as the UPU Council of Administration ( which Kenya chairs) and Postal Operations Council (POC). The Commission also participated in the East Africa Communications Organisations (EACO) meetings.
During the year, the Commission participated in a number of events organ-ized by the organs of the International Telecommunication Union (ITU). The most notable were the World Telecommunications Standardization Assembly (WTSA), World Telecommunications Development Council (WTDC), and ITU Study Groups (ITU-R, ITU-T and ITU-D) dealing with technical, operational and administrative issues.
7.3.2 Benchmarking The Commission hosted a number of delegations and missions during the year. The Commission hosted delegations from the Uganda Communica-tions Commission (UCC), Tanzania Communications Regulatory Authority (TCRA), the Rwanda Utilities Regulatory Authority (RURA) and the Ethiopian Telecommunications Authority (ETA) among others on benchmarking missions in the country.
7.4 Industry ICT Initiatives The Commission participated in various initiatives and forums aimed at developing the ICT industry. During the year under review, the Commis-sion participated in various Internet Governance meetings. The meetings provided a platform where various stakeholders discussed issues relating to Internet public policy and management, and Internet number resources such as Internet Protocol version 4 (IPv4) and version 6 (IPv6) addresses, and Autonomous System Numbers (ASN). These meetings included those of ICANN and the African Network Information Centre (AfriNIC).
In an effort to facilitate the country’s transition from IPv4 to IPv6, the Commis-sion participated in the country’s National Taskforce on the transition. The Ministry of Information and Communications chaired the taskforce made up of members from the Government, private sector, academia, research institutions and the civil society. During the year under review, the taskforce facilitated a number of capacity building initiatives, as well as importation of equipment required for the establishment of a national IPv6 Test-bed.The Commission commenced the process of deploying a Government Internet Exchange Point (GIXP). The GIXP will act as a centralized clearing house
for Government entities by facilitating direct connectivity between different government entities and provide Internet Exchange Point (IXP) redundancy.
During the review period, the Commission partnered with ITU in dealing with cyber security management through capacity building, information sharing and benchmarks. As a result, the Commission commenced the process of establishing a national Computer Emergency Response Team (CERT) known as the Kenya national Computer Incidence Response Team (KE-CIRT). The team will be responsible for monitoring and assessing cyber security threats, providing advice for improving cyber security and cooperating with stakeholders and mitigating cyber crime, among others.
In order to develop a National Addressing System for the country, a Taskforce comprising the Ministry of Information and Communications (MOIC), Ministry of Local Government, Ministry of Nairobi Metropolitan Development, Ministry of Lands, City Council of Nairobi, PCK, Kenya ICT Board, CCK, Nairobi Central Business District Association and Kenya Alliance of Resident Associations was constituted.
During the review period, the Commission participated in and supported a workshop organized by the Ministry of Information and Communications aimed at coming up with a report to guide the development of a National Physical Address System for Kenya. The development of the addressing system will facilitate efficient provision of services such as water, energy, postal and courier, waste collection, household surveys, emergency response and will be useful to tourists. It is also essential for opening bank accounts, voting registration, acquiring passports among others.
CHAPTER 7 Corporate Communication and International Liaison
Corporate Communication and International Liaison (continued)
Rwanda’s President, His Excellency Paul Kagame (right) visits Kenya Pavilion at the ITU Telecom World 2009 exhibition in Geneva. He was received at the stand by among others the Minister for Information and Communications (2nd right), Hon. Samuel Poghisio, CCK Board Chairman Hon. Eng. Philip O. Okundi (extreme left) and CCK Director General Charles J.K. Njoroge (middle).
ITU World 2009
CCK ANNUAL REPORT 2009 - 201052 CCK ANNUAL REPORT 2009 - 2010 53

FinancialInformation
Chapter 8 »
8.1 Statements of Directors’ Responsibilities The Kenya Information and Communications Act, 1998, provides that the Directors shall cause to be kept proper books of accounts and records of income, expenditure, assets and liabilities of the Commission.
The Directors are also required to prepare and submit financial statements for each financial year, which include a statement of income and expenditure and a statement showing the assets and liabilities of the Commission as at the end of the financial year.
The Board of Directors accepts responsibility for the annual financial statements contained in this report which have been prepared using appropriate accounting policies supported by reasonable and prudent judgment and estimates, in conformity with Generally Accepted Accounting Practice (GAAP), International Accounting Standards (IAS) and in the manner required by the Kenya Information and Communications Act, 1998, as amended.
Hon. Eng. Philip O. Okundi, EBS, HSC (Chairman)
.............................................................................................................
Mr. Charles J.K. Njoroge, EBS (Director General)
.............................................................................................................
Date ..................................................................................
Annual Reports & Accounts 2008/09 The draft annual accounts for the 2009/2010 financial year are currently under audit. Therefore, the finance report contained herein is for the audited report for 2008/09.
8.2 IncomeA total of Kshs.4.6 billion was earned by the Commission during the financial year 2008/09. This is an improvement on the income reported in the year 2007/08 of Kshs. 3.5 billion. Frequency Spectrum Management fees comprised the Commission’s main income stream as it accounted for 81 percent of total income. Income from annual operating licence fees amounted to Kshs. 552 million, increasing by Kshs. 69 million from Kshs. 483 million recorded the previous year.
In the 2008/09 financial year, interest income increased to Kshs. 276 million up from Kshs. 122 million in the previous year. This was brought about by an increase in the cash balances held by the Commission and a stabilization of the interest rates on Treasury Bills in which the Commission invests cash that is not required for immediate use.
8.3 Operating ExpenditureDuring the 2008/09 financial year, Kshs. 1.064 billion was spent on operations of the Commission compared to Kshs. 946 million during the previous period. The expense items included in the operating expenditure are salaries and allowances, travelling, training, professional fees, subscriptions, universal access obligation, National Communications Secretariat, Corporate Affairs, printing and stationery, medical expenses, postage and telephone and other expenses incurred in the day to day running of the Commission.
8.4 Capital ExpenditureThe total capital expenditure for the year 2008/2009 was Kshs.80 million compared to Ksh 47.45million the year 2007/2008. The items accounting for this expenditure include motor vehicles, equipment, furniture and fittings, buildings and improvements, and software development. 8.5 Surplus The resultant surplus before tax for the 2008/09 financial year was Kshs. 3.6 billion, reflecting an increase of 38 percent over the surplus registered in the 2007/08 financial year of Kshs. 2.6 billion. The Commission paid a total of Kshs. 1.07 billion as corporation tax during the 2008/2009 financial year, and has made a provision of Kshs1.18 billion for 2009/2010 financial year. The surplus after tax for 2008/2009 grew from Kshs.1.8 billion to Kshs. 2.5 billion, representing a growth of 39%. The Commission paid Kshs 1.0 billion to the Government in dividends for the financial year 2008/2009. The audited income statement for the 2008/09 financial year is reproduced in Table 8.1.
CHAPTER 8 Financial Information
24th September 2009
CCK ANNUAL REPORT 2009 - 201054 CCK ANNUAL REPORT 2009 - 2010 55

Table 8.1: Income and Expenditure Account of the Year Ended 30 June 2009
2009 2008 Kshs’000 Kshs’000 Income 4,639,422 3,559,746 Operating expenses 1,064,629 946,428 Surplus for the year 3,574,793 2,613,318 Less Corporation Tax 1,072,438 783,995 Less Proposed dividends 1,000,000 -Net surplus 1,502,355 1,829,322
Source: Communications Commission of Kenya
Balance SheetDuring the 2008/2009 financial year, the total assets of the Commission amounted to Kshs 9.4 billion, comprising net non-current assets of Kshs. 1.46 billion, investment in KCCT of Kshs. 2.4 billion, cash and cash equivalent of Kshs 4.6 billion and net debtors of Kshs. 918 million.
Table 8.2: Balance Sheet as at 30 June 2009
2009 2008 Kshs’000 Kshs’000 ASSETS Non Current Assets Property, plant and equipment 1,464,783 1,493,769 Investment In KCCT 2,404,266 2,404,266 3,869,049 3,898,035 Current Assets Debtors 918,563 483,127 Cash and cash equivalent 4,635,702 3,380,788 5,554,264 3,863,915 TOTAL ASSETS 9,423,314 7,761,950 EQUITY AND LIABILITIES Capital and Reserves Owners equity 741,965 741,965 Revaluation reserve 380,681 380,681 Retained surplus 5,841,643 5,333,991 6,964,289 6,456,637 Current Liabilities Proposed dividends-Unpaid 2,000,000 1,000,000 Corporation Tax for the year 210,043 159,264 Creditors 248,981 146,049 2,459,024 1,305,312 TOTAL EQUITY AND LIABILITIES 9,423,314 7,761,950
Source: Communications Commission of Kenya
8.7 Capital and ReservesThe current liabilities of the Commission at the close of the 2008/09 financial year stood at Kshs.2.5 billion, comprising tax payable, suppliers’ liabilities and proposed dividend to the Treasury. An extract of the balance sheet statements for the financial year 2008/09 is reproduced in Table 8.2.
8.8 Annual Budget Estimates and Revised BudgetIn accordance with Section 19 of the Kenya Information and Communica-tions Act, 1998, and the provisions of the Exchequer and Audit Regulations, the estimates of revenue and expenditure of the Commission for the year 2010/2011 were prepared and submitted to the Ministry of Information and Communications. The total estimated income is Kshs.4.4 billion, while operating expenditure is estimated at Kshs.1.66 billion. The total budgeted capital expenditure for the 2010/2011 year is Kshs 210.9 million.
Financial Information (continued)
Selected Key CommunicationsStatistics and Economic Indicators
ANNEX »MATER Heart RunCCK Director General Charles J.K. Njoroge hands a Ksh 500,000 cheque to Mater Hospital CEO John Muriithi in support of the 2010 Mater Heart Run
CCK ANNUAL REPORT 2009 - 201056

Annex 1: Communications StatisticsIndicator 2001/02 2002/03 2003/04 2004/05 2005/06 2006/07 2007/08 2008/09 2009/10Fixed telephony capacity Wire line 490,000 508,000 508,000 513,820 516,993 505,103 512,281 485,581 421,528Wire line Connections 328,116 328,358 299,225 278,867 293,364 339,229 527,064 247,972 234,522Wireless Connections - - - - - 84,107 274,449 448,529 225,592Total Wire line & Wireless Connections 328,116 328,358 299,225 278,867 293,364 347,226 527,064 696,501 460,114Mobile telephony capacity 1,500,000 2,00,000 3,935,000 6,800,000 10,600,000 18,200,000 25,964,700 29,400,000 46,628,948Connections 944,128 1,590,286 2,546,157 4,479,375 6,484,791 9,304,818 12,933,653 17,362,257 20,119,304Total postal Outlets 891 890 872 861 768 721 744 710 700Private letter boxes 394,121 397,731 395,811 399,667 400,016 411,716 414,616 412,006 414,756Letter posting boxes 1,137 1,138 1,120 1,049 1,049 966 827 890 890Public counter positions 1,429 1,394 1,378 1,377 1,388 1,388 1,390 1,279 1,339Stamp vending licenses 299 4,466 3,733 4,088 4,242 4,125 4,609 4,505 5,136Stamp vending machines - - - - - 264 246 280 280Private operator outlets 320 330 341 437 521 554 606 622 601
Source: Communications Commission of Kenya
Annex 2: Economic Indicators 2009 Indicator 2001 2002 2003 2004 2005 2006 2007 2008 2009*Population (Millions) 30.9 31.8 33.2 34.2 35.1 36.1 37.2 38.3 39.4Growth of GDP at Constant (2001) Prices (%) 4.5 0.6 2.9 5.1 5.9 6.3 7.0 1.6 2.6GDP Per Capita (in 2001 Prices) (KShs) - - 31,825 32,463 33,442 34,574 35,969 35,553 35,461Consumer Prices, Annual Average [Index numbers October 1997=100] 131.0 133.6 146.7 163.7 180.2 191.1 199.2 231.5 252.89CPI Inflation Rate (Overall) % 5.8 2 9.8 11.6 10.0 6.0 4.3 16.2 9.2*ProvisionalSource: Adapted from the Economic Survey, 2010
Source: Communications Commission of Kenya
ANNEXSelected Key Communication Statistics and Economic Indicators
NotesCCK ANNUAL REPORT 2009 - 201058 CCK ANNUAL REPORT 2009 - 2010 59

NotesCCK ANNUAL REPORT 2009 - 201060