Appraisal Management & Appraisals: Compliance & Best Practices for Vendor Selection
CCAR: An Appraisal of Current Practices
› White Paper
ContentsOverview ............................................................................. 1
Risk Process Management and Governance .............. 1
Formal Controls Process .......................................................1
Improved Efficiency ..............................................................2
Risk and Finance Integration ...............................................2
Data ...........................................................................................2
Scenario Development .................................................... 2
Scenario Sources ...................................................................2
Management Involvement ..................................................2
Development Process ...........................................................2
Challenges ..............................................................................3
CCAR Modeling Overview ............................................. 3
Model Monitoring .................................................................3
Integration With the Operating Plan .................................3
Model Maturity .......................................................................3
CCAR Modeling ................................................................ 3
Types of Models .....................................................................3
CCAR/DFAST Models ...........................................................4
Credit Loss Modeling............................................................5
Revenue and Balance Sheet Modeling ............................5
Board and Management Engagement ....................... 6
Model Governance at the Executive and Board Levels ........................................................................................6
Management Judgment ......................................................6
Documentation ......................................................................7
Implications ........................................................................ 7
Conclusion .......................................................................... 8
Authors
Laurent Birade, Principal Solutions Architect, Americas Risk Practice, SAS
Ravi Chari, Systems Engineer Manager, Americas Risk Practice, SAS
Tom Kimner, Director, Americas Risk Practice, SAS
Craig LeBlanc, Principal Business Solutions Manager, Americas Risk Practice, SAS
Tara Heusé Skinner, Systems Engineer Manager, Americas Risk Practice, SAS
1
OverviewSince the Federal Reserve’s introduction of the Comprehensive Capital Analysis and Review (CCAR) process in 2010, supervisory expectations for all aspects of capital requirements have been significantly heightened for the largest and most complex US banks. In its CCAR 2013 review document (August 2013), the Fed cited current practices by bank holding companies (BHCs) as well as outlined best and suboptimal practices. Many of SAS’ bank customers must now adhere to an even more stringent requirement for creation of a sound and robust capital planning and stress testing program.
In our research of those customers’ current practices, a pattern of issues emerged:
• Data structure and validation. Position data and exposure data necessary for capital calculations must be cleansed and transformed at the required level to accurately reflect the current book of business.
• Risk and financial reconciliation. The risk data used must be reconciled with finance data (GL) before it is reported to regulators for capital adequacy.
• Capital calculation updates. When capital calculation rules change, the latest rules must be applied consistently and as intended in the regulation.
• Risk reporting. All necessary reports and schedules need to be updated and submitted appropriately.
• Auditability. Transparency must be demonstrated down to the source data level. And banks need to be able to document all capital classification and computation rules to a sufficient degree to meet regulatory requirements during the auditing and review process.
This paper highlights how banks are addressing these issues and what they recommend to support current industry practices for risk process management and governance; scenario development; modeling; board management and engagement; and documentation. The observations are based on the report Dodd-Frank Act Stress Test 2014: Supervisory Stress Test Methodology and Results (DFAST 2014), which focused on the assessment framework used to review the capital plans from both quantitative and qualitative perspectives as well as interactions with most of the top 30 CCAR and DFAST (Dodd-Frank Act Stress Test) banks under the Fed or Office of Comptroller of Currency’s (OCC) supervision.
Risk Process Management and GovernanceIn Comprehensive Capital Analysis and Review 2014: Assessment Framework and Results, particular attention was given to the processes surrounding the development and implementation of BHC stress scenarios to ensure that they are robust and capture firm-specific vulnerabilities and risks, and that the translation of the scenario into loss, revenue and capital projections was sound in concept and implementation. There was also an assessment of whether the broader capital planning process is overseen by a robust governance process and is conducted in a well-controlled manner. The qualitative aspects include overall governance, model governance, the formal controls process, incorporation of management judgment, and documentation.
Formal Controls ProcessAs the CCAR regulation evolves, it is clear that, although Sarbanes-Oxley (SOX) and other regulations have more mature and tighter controls, CCAR’s focus on forward-looking projections presents particular challenges. CCAR activities are significantly more rigorous than those surrounding SOX’s historical compliance reporting.
The Fed’s expectations for better and more robust controls are increasing. In addition, banks anticipate that the Fed will want controls, including management control thresholds, to be moved earlier in the process of projecting capital under stress. This would enable management to review or challenge every step of the capital planning process – including scenario creation, loss modeling and net interest income projections – not just the results. The forward-looking projections help bank management understand the cause and effect of the stress test results.
Generally, banks state that meeting these expectations requires centralization. Each process surrounding the development and implementation of the BHC’s stress scenario has a flow chart, and like SOX, the process is designed to identify control gaps, establish controls, assign owners, and test and certify the controls.
This is all thoroughly documented (in some cases, using a risk and controls self-assessment-like workflow) and updated as the processes evolve to stay current with business needs. The documentation is useful to internal audit groups as they provide SOX testing for CCAR and helps identify the impact of any last-minute changes to the models. (Changes are made through the governance process because nonvalidated models are not used.)
2
DataThere are differing points of view regarding the creation of a single data repository for the Q/M and A processes. Some believe that a common data repository is unnecessary; they are comfortable with the current understanding and reconciliation effort and with their internal models. Others, though none have completed a central repository to date, see an opportunity to bring much needed data into a single place and are actively pursuing this avenue. A central repository used to source all Q/M data and A process actuals also serves as the central data repository for the modeling projections, further improving process efficiency.
Scenario DevelopmentThe scenarios for CCAR and DFAST models are reminiscent of the federal government’s Supervisory Capital Assessment Process (SCAP) exercise, as idiosyncratic baseline, adverse and severely adverse scenarios are required. These scenarios are considered “first generation” as banks predict that projections of noninterest income, noninterest expense, and net interest income in the PPNR forecasting models of the Fed are expected to change. The banks expect volatility.
Scenario SourcesSome banks engage third-party consultants to assist with their forecasting. These consultants solicit input through workshops and interviews on operational-risk events (on both high and low levels) from various committees, lines of business, finance and other areas in the organization. Others have experienced problems with vendor forecasts and actually change them based on their own empirical knowledge.
Management InvolvementManagement is highly involved at the onset of the process to review all second-tier macro and micro variables used in the process. As there are questions from bank management on how the Fed creates the derived macro and micro variables, most are of the opinion that the Fed should release a much broader set of variables, with a focus on regional variables, to help bank management better relate macro factors to their portfolios.
Development ProcessRisks identified and cataloged in inventories feed the scenario process. Scenarios are created for a global view as well as regional and local views. Key measures include macro variables related to non-interest expense and non-interest income related to the balance sheet. Scenarios include changes in gross
Capital planning typically works better during the quarterly/monthly (Q/M) planning review cycle than it does during the annual (A) review. Given that the Q/M review cycle is still a fairly mechanical exercise with regard to historical data collection, the control governance has been less challenging as banks are good at putting controls on data transfer first.
The A review, however, applies to more divisions in the bank. And because the various divisions have not traditionally interacted on efforts such as these, tight reconciliation of data used for credit, treasury, ALM, and balance sheet projections is often arduous. The establishment of controls for the different data transfers (e.g., credit to finance, treasury to finance, ALM to finance) and judgmental adjustments (usually made on top of data transfers) is one of the most challenging aspects of orchestrating the forward-looking forecast of the balance sheet. Another key aspect of governance for the A review is the reconciliation between actuals for the FR Y-9C and FR Y-14A. This is still very much a manual process that requires a new set of controls and signoffs.
Improved EfficiencyBanks describe a desired future state regarding data management and technology, including improved infrastructure (to reduce data movements) and improved data management from source systems through final submission.
Staffing is a drag on efficiency. The taxing CCAR demands increase the threat of burnout in human resources, and banks are finding it difficult to find and retain qualified staff. To address this dilemma, banks employ automation capabilities (better, faster model validation), and create an organizational design that can satisfy multiple regulations at the same time. Without these adjustments, we expect compliance deadlines to be missed regularly.
Risk and Finance IntegrationThe lack of integration between risk and finance continues to plague most organizations. Calculations are developed in silos. Lines of business, pre-provision net revenue (PPNR), and credit models are handled by different departments with separate software solutions and tools. Banks believe that a central hub that consolidates risk and finance data and metrics from various calculation engines and data repositories is an appropriate trade-off for having a single, costly solution to cover all areas. The central hub would integrate the data from disparate parts of the organization, create a single version of the truth, and reduce the manual processes currently in use.
3
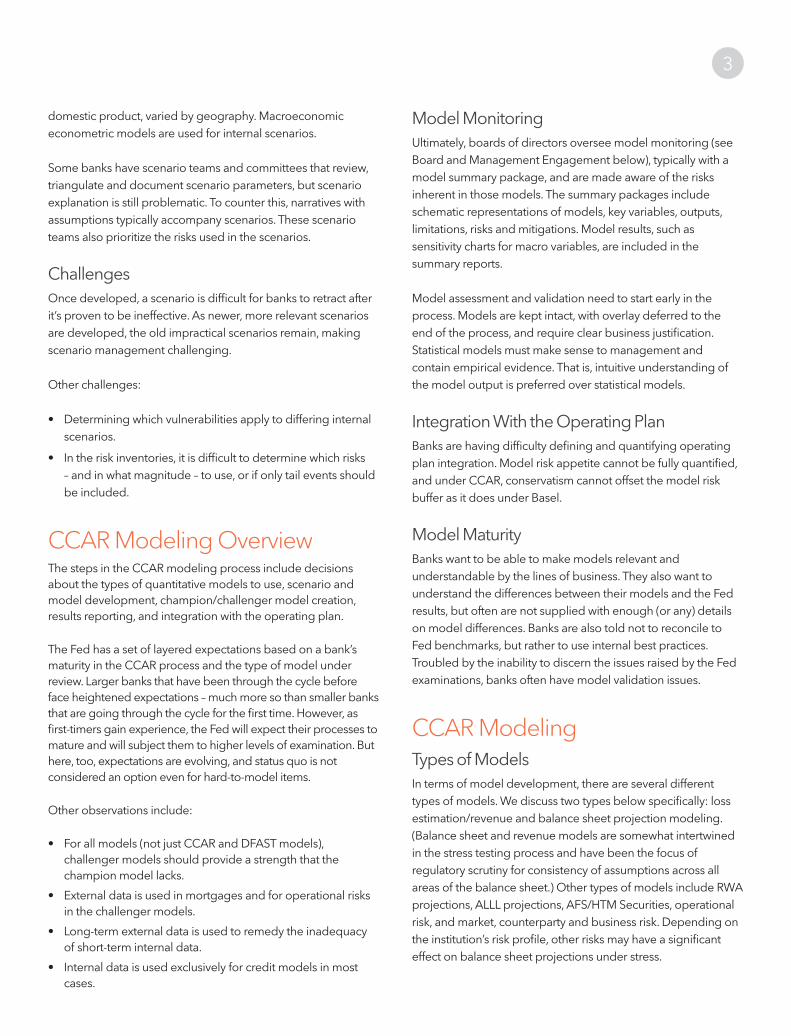
Model MonitoringUltimately, boards of directors oversee model monitoring (see Board and Management Engagement below), typically with a model summary package, and are made aware of the risks inherent in those models. The summary packages include schematic representations of models, key variables, outputs, limitations, risks and mitigations. Model results, such as sensitivity charts for macro variables, are included in the summary reports.
Model assessment and validation need to start early in the process. Models are kept intact, with overlay deferred to the end of the process, and require clear business justification. Statistical models must make sense to management and contain empirical evidence. That is, intuitive understanding of the model output is preferred over statistical models.
Integration With the Operating PlanBanks are having difficulty defining and quantifying operating plan integration. Model risk appetite cannot be fully quantified, and under CCAR, conservatism cannot offset the model risk buffer as it does under Basel.
Model MaturityBanks want to be able to make models relevant and understandable by the lines of business. They also want to understand the differences between their models and the Fed results, but often are not supplied with enough (or any) details on model differences. Banks are also told not to reconcile to Fed benchmarks, but rather to use internal best practices. Troubled by the inability to discern the issues raised by the Fed examinations, banks often have model validation issues.
CCAR ModelingTypes of ModelsIn terms of model development, there are several different types of models. We discuss two types below specifically: loss estimation/revenue and balance sheet projection modeling. (Balance sheet and revenue models are somewhat intertwined in the stress testing process and have been the focus of regulatory scrutiny for consistency of assumptions across all areas of the balance sheet.) Other types of models include RWA projections, ALLL projections, AFS/HTM Securities, operational risk, and market, counterparty and business risk. Depending on the institution’s risk profile, other risks may have a significant effect on balance sheet projections under stress.
domestic product, varied by geography. Macroeconomic econometric models are used for internal scenarios.
Some banks have scenario teams and committees that review, triangulate and document scenario parameters, but scenario explanation is still problematic. To counter this, narratives with assumptions typically accompany scenarios. These scenario teams also prioritize the risks used in the scenarios.
ChallengesOnce developed, a scenario is difficult for banks to retract after it’s proven to be ineffective. As newer, more relevant scenarios are developed, the old impractical scenarios remain, making scenario management challenging.
Other challenges:
• Determiningwhichvulnerabilitiesapplytodifferinginternalscenarios.
• Intheriskinventories,itisdifficulttodeterminewhichrisks– and in what magnitude – to use, or if only tail events should be included.
CCAR Modeling OverviewThe steps in the CCAR modeling process include decisions about the types of quantitative models to use, scenario and model development, champion/challenger model creation, results reporting, and integration with the operating plan.
The Fed has a set of layered expectations based on a bank’s maturity in the CCAR process and the type of model under review. Larger banks that have been through the cycle before face heightened expectations – much more so than smaller banks that are going through the cycle for the first time. However, as first-timers gain experience, the Fed will expect their processes to mature and will subject them to higher levels of examination. But here, too, expectations are evolving, and status quo is not considered an option even for hard-to-model items.
Other observations include:
• Forallmodels(notjustCCARandDFASTmodels),challenger models should provide a strength that the champion model lacks.
• Externaldataisusedinmortgagesandforoperationalrisksin the challenger models.
• Long-termexternaldataisusedtoremedytheinadequacyof short-term internal data.
• Internaldataisusedexclusivelyforcreditmodelsinmostcases.
4
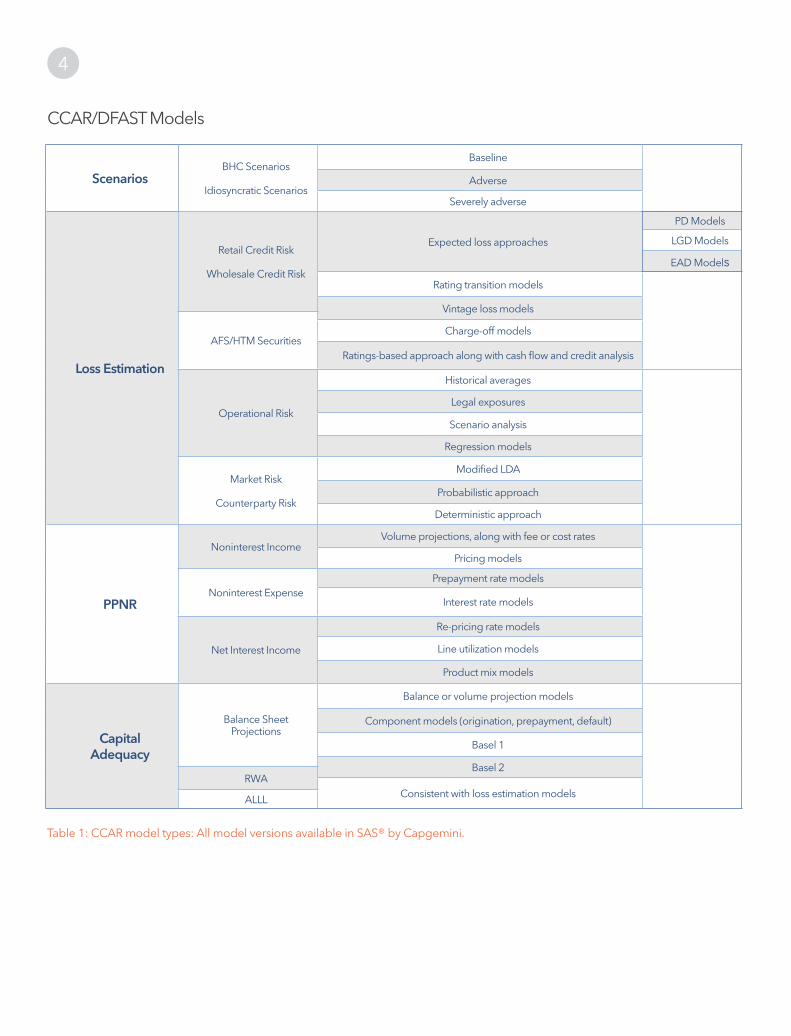
CCAR/DFAST Models
ScenariosBHC Scenarios
Idiosyncratic Scenarios
Baseline
Adverse
Severely adverse
Loss Estimation
Retail Credit Risk
Wholesale Credit Risk
Expected loss approaches
Rating transition models
Vintage loss models
AFS/HTM SecuritiesCharge-off models
Ratings-based approach along with cash flow and credit analysis
Operational Risk
Historical averages
Legal exposures
Scenario analysis
Regression models
Market Risk
Counterparty Risk
Modified LDA
Probabilistic approach
Deterministic approach
PPNR
Noninterest IncomeVolume projections, along with fee or cost rates
Pricing models
Noninterest ExpensePrepayment rate models
Interest rate models
Net Interest Income
Re-pricing rate models
Line utilization models
Product mix models
Capital Adequacy
Balance Sheet Projections
Balance or volume projection models
Component models (origination, prepayment, default)
Basel 1
Basel 2RWA
Consistent with loss estimation modelsALLL
PD Models
LGD Models
EAD Models
Table 1: CCAR model types: All model versions available in SAS® by Capgemini.
5
There are two main classes of models – commercial real estate lending (CRE) and commercial and industrial lending (C&I) – for which the methodology standard seems to differ. Two prevalent methodologies seen in application today are a conditional migration matrix-based approach for the C&I portfolio and a bottom-up loan-level approach, computing PD and LGD at a loan level based on condition scorecard inputs like loan-to-value and debt service coverage (LTV/DSC) thresholds for the CRE portfolio.
Numerous banks struggle with the champion/challenger model concepts and hire external firms to create or augment their models with challengers. Scarce data for wholesale models makes this a bigger challenge than on the retail side. Empirical loss rates are almost always used as some type of benchmark for longer-dated segments where some data is available.
The Fed provides a summary description for its own projection estimates of losses, which helps to explain and reconcile differences in stress test results. As seen in retail models, large differences will attract more scrutiny, documentation and explanation, and reasoning for any bank management overrides.
Revenue and Balance Sheet ModelingRevenue and balance projections are items that have been forecasted by the financial planning and analysis teams for many years, but banks have not typically performed rigorous projections based on conditional macroeconomic scenarios. The tight interaction between PPNR, balances and credit losses, for example, typically makes it hard to accurately project these numbers into future quarters. The Fed is often concerned that loss projections, PPNR and balances are not consistent with one another.
The two types of models that seem to cause the most issues and raise concern in banks’ abilities to model appropriately (i.e., within reasonable range of what the Fed may estimate) are the production loan growth models and deposit models. The former includes current balance sheet runoff and new business, and poses a problem only in the sense that the Fed assumes a fairly stable growth assumption, thereby inducing potential reconciliation issues. The latter poses a different kind of problem since steep deposit runoff assumptions significantly affect liquidity and can cause bank failure.
Production Growth Models
Most problems with production growth models center on sales production models and the Fed’s contradictory view of assigning an across-the-board growth rate for the differing
Credit Loss ModelingOne of the more mature areas of model development is the credit loss estimation for which several best practice methodologies have surfaced and which the Fed even provides a summary description in its 2014 Supervisory Stress Test Methodology and Results. Here the Fed describes how it estimates losses for the bank’s portfolio – signaling its view of best practices for loss estimation. In earlier similar documents from the Fed, descriptions of what makes up strong versus weak practices in this area are represented.
We have observed that once a large difference in stress test results (such as loss estimates) occurs, it is important – though not required – for banks to be able to reconcile their results with the Fed. Attention is being paid to these differences since large deltas often require much more detailed documentation and justification. In some circumstances, the ability to reconcile model results proves quite challenging; the Fed provides only high-level details of its modeling approach.
All banks with which we have discussed these issues have said that there are typically two sets of models – one for retail and one for the wholesale portfolio (accrual) – each consisting of several subsegment models.
In retail modeling, trending is detailed in probability of default and loss-given default (PD/LGD) modeling, roll-rate migration, and simple empirical charge-off models for the less (material) homogeneous segments. In some cases, banks extend their roll-rate matrices to more granular matrices (current, delinquent, charge to current, 30, 60, 90 and charge-offs) as per instructions from their supervisors. However, this was not the case with other banks where simple current/delinquent/charge-offs drew no special mention. For some, there has been strong Fed emphasis to benchmark internal models with industry data for certain segments (mortgages, HELOC and a few others), but the feedback from the institutions varied.
Each of these models differs in terms of advancement, such as using historical roll rates versus roll rates conditional on macro factors, or even a more granular approach where the roll-rates relationships are regressed based on macro and micro factors as well as the probability of payoff, and default being estimated by regression. Another method seen in the largest institutions is the hazard approach, which typically requires a more robust analytical infrastructure for large portfolios.
In wholesale modeling, calculations are made at the loan level with reporting by segments. There are many segmentation dimensions, but industry is one of the most statistically significant.
6
key challenge that executives usually face is the level of detail and granularity of information that they need to provide the board, as well as the frequency of updates.
Board Oversight
The boards of most banks oversee CCAR through their risk or capital management committees or some other board subset. Most typically, the board approves scenarios and is involved in a formal scenario signoff. It is expected that scenarios not only need to mature, but also that banks need more of them. The importance of the narrative accompanying these scenarios cannot be overlooked.
Model Monitoring
Boards oversee but do not manage model monitoring through the governance process. They are informed of the models used for CCAR at a high level – typically with a model summary package – and of the risks inherent in those models. More engagement by the board of directors in the CCAR process is desired.
Management JudgmentFollowing the model outputs, the results should be analyzed from a business and statistical perspective. Banks usually override insignificant output. An override decision and its business justification must be well-documented. The same should also be communicated to the senior management and board for their approval.
Banks should also develop a process for incorporating expert opinion during an override. The expert panel should include representatives from multiple groups, including lines of business, risk, and audit. This will ensure that the override process has sufficient governance and meets the board and Fed’s expectations.
Aspects that are important from a management override perspective:
1. Can the model be used from a statistical perspective? As an example, does the model have a reasonable R2 and are the coefficients significant?
2. Does the model output make reasonable sense from a business perspective?
3. If not, what is the process for incorporating expert opinion?
4. What is the governance process around the override?
portfolios. Since banks may be benchmarked against Fed models, there is an obvious reconciliation issue that appears early in the forecasting exercise. Additionally, production models pose significant issues, and banks are being pressured to improve the sophistication of their models.
Some of the key difficulties lie in the complexity under which a single regression model projects growth under duress. The current business runoff, impact of credit losses, and new business generation from a volume and price perspective need to be modeled simultaneously and consistently across all quarters. A very good article from an ex-Fed supervisor1 -turned-lobbyist goes into lengthy detail about this issue and proposes some solutions for the modeling of balance sheet growth and revenue projections.
Deposit Models
Deposit models are also problematic. Any type of runoff stress model – similar to those applied for the Basel III LCR calculation – indicates bank failure. There does not seem to be a viable answer other than banks need to keep liability assumptions reasonable and to the level seen in previous crises. This has not been a focus area for Fed examinations so far, and we have not encountered a bank with matters requiring attention focused on deposit modeling.
It is in the opinion of some banks that this will change once the Basel III liquidity rules phase in and more scrutiny on liquidity risk is applied through the supervisory review process. It remains to be seen whether assumptions similar to DFAST and Basel III on deposit runoff will ever require consistency given the difference in lag of the stress period – one being a 30-day stress followed by a return to normal, and the other a nine-quarter projection of the balance sheet.
Board and Management Engagement Model Governance at the Executive and Board LevelsThe Fed recommends that banks get their boards and senior management involved early in the process (as opposed to just getting the final results approved) and urges improved board communication, including regular, periodic updates. However, a
1 Schuermann, Til; Duane, Michael and Reynolds, Peter. Stress Testing Bank Profitability (Sept. 22, 2013). Available at SSRN: ssrn.com/abstract=2333951 or dx.doi.org/10.2139/ssrn.2333951
7
ImplicationsIn our research, we find that many banks recognize that they do not have sufficient infrastructure and data management capabilities to address many issues brought about by CCAR and DFAST compliance activities. They also use external core banking systems for transactional or operational processing, which limit their analytical and modeling practices.
Regulatory data mapping and data transformation issues alone can be challenging for these companies, even before considering issues related to computing exposures, applying the correct RWA ratios, and aggregating the appropriate capital levels. Data and analytic process issues are especially challenging for less sophisticated institutions, such as:
• Data availability. Data collection and availability at the right level of granularity are crucial to any regulatory capital review. If data is not available, the regulatory rules currently in effect may severely penalize a bank, overburdening it with a capital requirement far exceeding its actual risk levels.
• Data gaps. Initial and ongoing efforts to identify the critical data needed to effectively generate the appropriate exposure calculations, to attribute the applicable risk weights, and to transform these metrics into the correct categories within the regulatory reporting taxonomy require a thorough understanding of the source position data and target reporting framework. Differences in individual banking systems and operational processes can require substantial efforts in determining data gaps and evaluating appropriate reconciliation procedures to address these gaps. An additional hindrance exists – the Fed’s reporting framework has yet to be completely crafted.
• Model risk and model breakdowns. The 2007-09 financial crisis revealed that models that work well under steady-state conditions may break down rapidly under stressful conditions. No amount of historical modeling will capture the effects of markets when the performance is outside historical levels. Banks, therefore – apart from continually testing variables and recalibrating models – should have a mechanism to incorporate such correlation breakdowns to make the regulatory capital process meaningful.
• Firmwide view. CCAR requires, as do other regulatory requirements for capital, the application of calculations at varying levels of granularity across multiple lines of business. Banks aggregate information across banking divisions via manual extractions from business units. Manual intervention efforts are also subject to computation and aggregation error. Their inability to aggregate information across banking divisions using technology and automation is quite challenging.
DocumentationEarly in the CCAR life cycle, banks struggled with documentation (How much? How detailed? What format?), and the emphasis was on indiscriminately giving any and everything they had to Fed examiners. However, the Fed favors submission of a summary document along with the full documentation. Typically, the summary is a narrative on the process, models and justification rather than statistical justification and elaborate quantitative explanations. This practice resulted from the need to better inform internal management on the processes while providing the level of detail required by management sitting in Fed reviews.
The Fed is particularly interested in seeing sufficient and appropriate documentation delivered with the results. Some of the documentation requirements of the Fed are:
1. Complete inventory of all models used in the CCAR process.
2. Specifics of model validation and all statistical parameters.
3. Details of management overrides along with business justification and governance process.
4. Outline of macroeconomic scenarios used in the stress testing process and documentation explaining how the most important variables affect the metric that has been incorporated. If additional variables have been used, a document highlighting their role in the stress testing process.
5. Inventory of the internal controls, policies and processes.
6. Specifics about the involvement of senior management and the board in the stress testing and CCAR process.
7. Explanation of the reconciliation of the numbers with the FR Y-9C.
8. Particulars of capital assessment and capital plans and how the capital plans are consistent with the overall capital adequacy assessment program.
9. Description of data quality and reconciliation checks.
One significant observation around model and process documentation was that historically, most model validation groups were made solely of quantitative analysts. Now banks are moving those with domain expertise and business experience into the model validation groups to help provide, in better layman’s terms, explanation of practices in the modeling and validation processes to regulators.
8
• Process reusability. Smaller firms may not be able to capitalize on the ability to leverage the time and money invested in developing a regulatory process. Nor can they apply this investment to areas such as economic capital modeling, capital allocation, scenario analysis and stress testing, or management decision making. Banks with a fragmented stream of solutions to handle one or more parts of CCAR face considerable difficulties in synchronizing the data and computations. The consequence of this is that future iterations of the regulatory capital process can be out of sequence or process steps can be missed, causing inaccurate capital calculations.
ConclusionIt’s old news, but worth repeating, that banks were ill-prepared for the events that led to the 2007-2009 financial crisis. Their risk management practices just were not equipped for such dramatic changes in the market. Five years later, regulators are still working to find the optimal balance between over- and under-regulating. The evolution of the regulations may be good for society but tough for banks.
Our customers have helped us outline some problems they face in gaining full and efficient compliance with regulations such as CCAR, Basel III and Dodd-Frank. The hard truth is that these problems will probably continue – and even change – as the regulation continues to evolve. But banks can improve their response by implementing changes and improvements, such as creating a central data repository, incorporating automation capabilities, and improving integration across silos.
SAS® Capital Planning and Management provides a high-quality, integrated risk data infrastructure. Now banks can extract, integrate and validate risk data; get a comprehensive view of risk across types; and distribute incentives for consistent optimization of risk-adjusted returns throughout the organization.
Read more about SAS Capital Planning and Management.

To contact your local SAS office, please visit: sas.com/offices
SAS and all other SAS Institute Inc. product or service names are registered trademarks or trademarks of SAS Institute Inc. in the USA and other countries. ® indicates USA registration. Other brand and product names are trademarks of their respective companies. Copyright © 2014, SAS Institute Inc. All rights reserved.
107211_S127594.0614