CBMS Core Indicators, by Municipality, Province of ... · CBMS Core Indicators, by Municipality,...
32
380 The Many Faces of Poverty (Volume 3) CBMS Cor CBMS Cor CBMS Cor CBMS Cor CBMS Core Indicators, by Municipality e Indicators, by Municipality e Indicators, by Municipality e Indicators, by Municipality e Indicators, by Municipality, Pr , Pr , Pr , Pr , Province of Zamboanga del Sur ovince of Zamboanga del Sur ovince of Zamboanga del Sur ovince of Zamboanga del Sur ovince of Zamboanga del Sur, 2006-2009 , 2006-2009 , 2006-2009 , 2006-2009 , 2006-2009 Number of Number of Number of Number of Number of children children children children children (6-12 years (6-12 years (6-12 years (6-12 years (6-12 years old) old) old) old) old) Children not attending Children not attending Children not attending Children not attending Children not attending elementar elementar elementar elementar elementary school y school y school y school y school (6-12 years old) (6-12 years old) (6-12 years old) (6-12 years old) (6-12 years old) Children not attending Children not attending Children not attending Children not attending Children not attending high school high school high school high school high school (13-16 years old) (13-16 years old) (13-16 years old) (13-16 years old) (13-16 years old) Number of Number of Number of Number of Number of children children children children children (13-16 (13-16 (13-16 (13-16 (13-16 years old) years old) years old) years old) years old) Number of Number of Number of Number of Number of children children children children children (6-16 years (6-16 years (6-16 years (6-16 years (6-16 years old) old) old) old) old) Children not attending Children not attending Children not attending Children not attending Children not attending school school school school school (6-16 years old) (6-16 years old) (6-16 years old) (6-16 years old) (6-16 years old) Municipality Municipality Municipality Municipality Municipality Pr Pr Pr Pr Propor opor opor opor oportion tion tion tion tion Pr Pr Pr Pr Propor opor opor opor oportion tion tion tion tion Pr Pr Pr Pr Propor opor opor opor oportion tion tion tion tion Magnitude Magnitude Magnitude Magnitude Magnitude Magnitude Magnitude Magnitude Magnitude Magnitude Magnitude Magnitude Magnitude Magnitude Magnitude Households with income below the Households with income below the Households with income below the Households with income below the Households with income below the pover pover pover pover poverty thr ty thr ty thr ty thr ty threshold eshold eshold eshold eshold Households with income below the Households with income below the Households with income below the Households with income below the Households with income below the food threshold food threshold food threshold food threshold food threshold Households who experienced food Households who experienced food Households who experienced food Households who experienced food Households who experienced food shor shor shor shor shortage tage tage tage tage Municipality Municipality Municipality Municipality Municipality Pr Pr Pr Pr Propor opor opor opor oportion tion tion tion tion Pr Pr Pr Pr Propor opor opor opor oportion tion tion tion tion Pr Pr Pr Pr Propor opor opor opor oportion tion tion tion tion Magnitude Magnitude Magnitude Magnitude Magnitude Magnitude Magnitude Magnitude Magnitude Magnitude Magnitude Magnitude Magnitude Magnitude Magnitude 7817 4463 4650 7650 3049 1537 3860 6080 3337 4263 7649 4998 5577 7041 13513 2756 3974 2841 3016 2534 3799 5454 3160 6147 3104 1901 1351 1076 2843 487 354 1120 1528 1245 1548 2239 1181 1615 1752 2923 507 889 592 622 509 837 1570 689 1073 24.3 30.3 23.1 37.2 16.0 23.0 29.0 25.1 37.3 36.3 29.3 23.6 29.0 24.9 21.7 18.4 22.4 20.8 20.6 20.1 22.0 28.9 21.8 17.5 4713 2580 2610 4399 1872 841 2373 3464 1923 2240 4503 3078 2984 4264 7805 1537 2423 1669 1715 1486 2112 3251 1718 3558 2029 1464 1224 2549 857 408 1406 1644 1208 1476 2160 1492 1867 1866 3254 734 1010 932 851 847 795 1619 979 1509 892 43.1 56.7 46.9 58.0 45.8 48.5 59.3 47.5 62.9 65.9 48.0 48.5 62.6 43.8 41.9 47.8 41.7 55.8 49.6 57.0 37.6 50.0 57.0 42.4 48.0 12530 7043 7260 12049 4921 2378 6233 9544 5260 6503 12152 8076 8561 11305 21318 4293 6397 4510 4731 4020 5911 8705 4878 9705 4964 2160 1839 1131 3675 573 333 1309 1714 1264 1784 2676 1520 1977 1759 2920 596 1038 736 690 677 703 1839 716 1286 771 17.2 26.1 15.6 30.5 11.6 14.0 21.0 18.0 24.0 27.4 22.0 18.8 23.1 15.6 13.7 13.9 16.2 16.3 14.6 16.8 11.9 21.2 14.7 13.3 15.5 6029 3192 4035 5372 2831 1115 3441 4372 2869 3026 5899 5211 3961 4569 8086 2693 3527 2370 2771 2327 3048 4729 2465 5423 2864 64.8 66.9 73.7 69.0 78.0 63.4 86.8 64.6 85.0 68.0 68.5 80.4 72.5 53.2 48.1 80.4 71.9 72.8 78.3 77.4 72.2 76.0 76.2 74.4 74.1 4717 2260 3478 4297 2483 778 3078 3591 2622 2301 4850 4448 3177 3212 5317 2263 2837 1943 2294 1911 2480 3941 2058 4358 2320 50.7 47.3 63.5 55.2 68.4 44.2 77.6 53.0 77.7 51.7 56.3 68.6 58.1 37.4 31.6 67.6 57.9 59.7 64.8 63.6 58.7 63.3 63.7 59.8 60.1 411 0 1 774 6 38 4 537 0 833 284 1456 641 46 156 46 52 118 22 247 57 152 112 320 42 4.4 0.0 0.0 10.0 0.2 2.2 0.1 7.9 0.0 18.7 3.3 22.5 11.8 0.5 1.0 1.4 1.1 3.6 0.6 8.2 1.3 2.5 3.5 4.4 1.1 AURORA BAYOG DUMALINAO DUMINGAG GUIPOS JOSEFINA KUMALARANG LABANGAN LAKEWOOD LAPUYAN MAHAYAG MARGOSATUBIG MIDSALIP MOLAVE PAGADIAN CITY PITOGO RAMON MAGSAYSAY SAN MIGUEL SAN PABLO SOMINOT TABINA TAMBULIG TIGBAO TUKURAN VINCENZO SAGUN AURORA BAYOG DUMALINAO DUMINGAG GUIPOS JOSEFINA KUMALARANG LABANGAN LAKEWOOD LAPUYAN MAHAYAG MARGOSATUBIG MIDSALIP MOLAVE PAGADIAN CITY PITOGO RAMON MAGSAYSAY SAN MIGUEL SAN PABLO SOMINOT TABINA TAMBULIG TIGBAO TUKURAN VINCENZO SAGUN
Transcript of CBMS Core Indicators, by Municipality, Province of ... · CBMS Core Indicators, by Municipality,...

380
The Many Faces of Poverty (Volume 3)
CBMS CorCBMS CorCBMS CorCBMS CorCBMS Core Indicators, by Municipalitye Indicators, by Municipalitye Indicators, by Municipalitye Indicators, by Municipalitye Indicators, by Municipality, Pr, Pr, Pr, Pr, Province of Zamboanga del Surovince of Zamboanga del Surovince of Zamboanga del Surovince of Zamboanga del Surovince of Zamboanga del Sur, 2006-2009, 2006-2009, 2006-2009, 2006-2009, 2006-2009
Number ofNumber ofNumber ofNumber ofNumber ofch i ld rench i ld rench i ld rench i ld rench i ld ren
(6-12 years(6-12 years(6-12 years(6-12 years(6-12 yearso l d )o l d )o l d )o l d )o l d )
Chi ldren not attendingChi ldren not attendingChi ldren not attendingChi ldren not attendingChi ldren not attendingelementarelementarelementarelementarelementar y schooly schooly schooly schooly school
(6-12 years old)(6-12 years old)(6-12 years old)(6-12 years old)(6-12 years old)
Chi ldren not attendingChi ldren not attendingChi ldren not attendingChi ldren not attendingChi ldren not attendinghigh schoolhigh schoolhigh schoolhigh schoolhigh school
(13-16 years old)(13-16 years old)(13-16 years old)(13-16 years old)(13-16 years old)
Number ofNumber ofNumber ofNumber ofNumber ofch i ld rench i ld rench i ld rench i ld rench i ld ren(13-16(13-16(13-16(13-16(13-16
years old)years old)years old)years old)years old)
Number ofNumber ofNumber ofNumber ofNumber ofch i ld rench i ld rench i ld rench i ld rench i ld ren
(6-16 years (6-16 years (6-16 years (6-16 years (6-16 yearso l d )o l d )o l d )o l d )o l d )
Chi ldren not attendingChi ldren not attendingChi ldren not attendingChi ldren not attendingChi ldren not attendingschoo lschoo lschoo lschoo lschoo l
(6-16 years old)(6-16 years old)(6-16 years old)(6-16 years old)(6-16 years old)
Munic ipal i tyMunic ipal i tyMunic ipal i tyMunic ipal i tyMunic ipal i ty
P rP rP rP rP r opo ropo ropo ropo ropo r t i o nt i o nt i o nt i o nt i o nP rP rP rP rP r opo ropo ropo ropo ropo r t i o nt i o nt i o nt i o nt i o nP rP rP rP rP r opo ropo ropo ropo ropo r t i o nt i o nt i o nt i o nt i o n Magn i t udeMagn i t udeMagn i t udeMagn i t udeMagn i t udeMagn i t udeMagn i t udeMagn i t udeMagn i t udeMagn i t udeMagn i t udeMagn i t udeMagn i t udeMagn i t udeMagn i t ude
Households with income below theHouseholds with income below theHouseholds with income below theHouseholds with income below theHouseholds with income below thepoverpoverpoverpoverpover ty thrty thrty thrty thrty thresholdesholdesholdesholdeshold
Households with income below theHouseholds with income below theHouseholds with income below theHouseholds with income below theHouseholds with income below thefood thresholdfood thresholdfood thresholdfood thresholdfood threshold
Households who experienced foodHouseholds who experienced foodHouseholds who experienced foodHouseholds who experienced foodHouseholds who experienced foodsho rsho rsho rsho rsho r t a get aget aget aget age
Munic ipal i tyMunic ipal i tyMunic ipal i tyMunic ipal i tyMunic ipal i ty
P rP rP rP rP r opo ropo ropo ropo ropo r t i o nt i o nt i o nt i o nt i o n P rP rP rP rP r opo ropo ropo ropo ropo r t i o nt i o nt i o nt i o nt i o n P rP rP rP rP r opo ropo ropo ropo ropo r t i o nt i o nt i o nt i o nt i o nMagn i t udeMagn i t udeMagn i t udeMagn i t udeMagn i t udeMagn i t udeMagn i t udeMagn i t udeMagn i t udeMagn i t udeMagn i t udeMagn i t udeMagn i t udeMagn i t udeMagn i t ude
78174463465076503049153738606080333742637649499855777041135132756397428413016253437995454316061473104
190113511076284348735411201528124515482239118116151752292350788959262250983715706891073
24.330.323.137.216.023.029.025.137.336.329.323.629.024.921.718.422.420.820.620.122.028.921.817.5
47132580261043991872841237334641923224045033078298442647805153724231669171514862112325117183558
2029146412242549857408140616441208147621601492186718663254734101093285184779516199791509892
43.156.746.958.045.848.559.347.562.965.948.048.562.643.841.947.841.755.849.657.037.650.057.042.448.0
125307043726012049492123786233954452606503121528076856111305213184293639745104731402059118705487897054964
2160183911313675573333130917141264178426761520197717592920596103873669067770318397161286771
17.226.115.630.511.614.021.018.024.027.422.018.823.115.613.713.916.216.314.616.811.921.214.713.315.5
6029319240355372283111153441437228693026589952113961456980862693352723702771232730484729246554232864
64.866.973.769.078.063.486.864.685.068.068.580.472.553.248.180.471.972.878.377.472.276.076.274.474.1
471722603478429724837783078359126222301485044483177321253172263283719432294191124803941205843582320
50.747.363.555.268.444.277.653.077.751.756.368.658.137.431.667.657.959.764.863.658.763.363.759.860.1
41101
7746384
5370
8332841456641461564652118222475715211232042
4.40.00.010.00.22.20.17.90.018.73.322.511.80.51.01.41.13.60.68.21.32.53.54.41.1
AURORABAYOGDUMALINAODUMINGAGGUIPOSJOSEFINAKUMALARANGLABANGANLAKEWOODLAPUYANMAHAYAGMARGOSATUBIGMIDSALIPMOLAVEPAGADIAN CITYPITOGORAMON MAGSAYSAYSAN MIGUELSAN PABLOSOMINOTTABINATAMBULIGTIGBAOTUKURANVINCENZO SAGUN
AURORABAYOGDUMALINAODUMINGAGGUIPOSJOSEFINAKUMALARANGLABANGANLAKEWOODLAPUYANMAHAYAGMARGOSATUBIGMIDSALIPMOLAVEPAGADIAN CITYPITOGORAMON MAGSAYSAYSAN MIGUELSAN PABLOSOMINOTTABINATAMBULIGTIGBAOTUKURANVINCENZO SAGUN

The Many Faces of Poverty (Volume 3)
381
Unemployment rateUnemployment rateUnemployment rateUnemployment rateUnemployment rate(15 years old and above)(15 years old and above)(15 years old and above)(15 years old and above)(15 years old and above)
Persons who arePersons who arePersons who arePersons who arePersons who arevict ims of cr imesvict ims of cr imesvict ims of cr imesvict ims of cr imesvict ims of cr imes
Number of persons in theNumber of persons in theNumber of persons in theNumber of persons in theNumber of persons in thelabor forcelabor forcelabor forcelabor forcelabor force
(15 years old and above)(15 years old and above)(15 years old and above)(15 years old and above)(15 years old and above)
Munic ipal i tyMunic ipal i tyMunic ipal i tyMunic ipal i tyMunic ipal i ty CBMS CompositeCBMS CompositeCBMS CompositeCBMS CompositeCBMS CompositeInd icatorInd icatorInd icatorInd icatorInd icator
P rP rP rP rP r opo ropo ropo ropo ropo r t i o nt i o nt i o nt i o nt i o nP rP rP rP rP r opo ropo ropo ropo ropo r t i o nt i o nt i o nt i o nt i o nMagn i t udeMagn i t udeMagn i t udeMagn i t udeMagn i t ude Magn i t udeMagn i t udeMagn i t udeMagn i t udeMagn i t ude
CBMS CorCBMS CorCBMS CorCBMS CorCBMS Core Indicators, by Municipalitye Indicators, by Municipalitye Indicators, by Municipalitye Indicators, by Municipalitye Indicators, by Municipality, Pr, Pr, Pr, Pr, Province of Zamboanga del Surovince of Zamboanga del Surovince of Zamboanga del Surovince of Zamboanga del Surovince of Zamboanga del Sur, 2006-2009, 2006-2009, 2006-2009, 2006-2009, 2006-2009
1385963466892137224750279146348867434968681200011040861812712240304058732439224476394052328631431790086954
172587
115104017314227292041507242182941135611956332669353235
1.20.11.38.40.01.43.71.60.60.41.713.70.31.71.22.80.83.01.30.80.50.80.80.40.5
551225050221466
199270
738758751112613239490119021
0.10.10.00.00.00.60.10.40.00.90.10.02.60.20.10.00.00.80.10.20.50.30.10.30.1
AURORABAYOGDUMALINAODUMINGAGGUIPOSJOSEFINAKUMALARANGLABANGANLAKEWOODLAPUYANMAHAYAGMARGOSATUBIGMIDSALIPMOLAVEPAGADIAN CITYPITOGORAMON MAGSAYSAYSAN MIGUELSAN PABLOSOMINOTTABINATAMBULIGTIGBAOTUKURANVINCENZO SAGUN
1.92.02.02.22.01.82.52.02.42.42.02.62.51.51.42.42.02.22.52.61.82.32.42.21.9

382
The Many Faces of Poverty (Volume 3)
CBMS Poverty Maps: Zamboanga del Sur
Map 2. Proportion of Children under 5 Years Old who Died, by Barangay, 2006-2009
Map 1. Proportion of Children under 5 Years Old who Died, by Municipality, 2006-2009
DUMINGAG
MIDSALIP
MAHAYAG
AURORA
TUKURAN
LABANGAN
PAGADIAN CITY
SAN PABLO
GUIPOS
DINAS
TABINAPITOGO
DIMATALINGVINCENZO A. SAGUN
MARGOSATUBIG
LAPUYAN
KUMALARANG
BAYOGLAKEWOOD
RAMON MAGSAYSAY
SOMINOT
MOLAVE
JOSEFINA
TAMBULIG
DUMALINAO
TIGBAO
SAN MIGUEL
0.6 1.8
0.6
1.1
1.40.3
0.3
1.30.6
1.2
0.2
0.50.3
0.6
1.6 0.3
0.2
1.4
0.3
0.1
0.20.5
1.4
0.8
0.5
M unic ip a l it y M ag ni t ud e P ro p o r t io nM ahayag 86 1.8
Lapuyan 48 1.6
V incenzo Sagun 28 1.4
Tambulig 50 1.4
Tigbao 30 1.4
Somino t 22 1.3Labangan 49 1.2Josef ina 10 1.1M argosatub ig 26 0.8Dumingag 28 0.6M idsalip 21 0.6Kumalarang 13 0.6M o lave 26 0.6Lakewood 11 0.5Pitogo 10 0.5Tukuran 21 0.5A urora 18 0.3Ramon M agsaysay 8 0.3San Pablo 6 0.3B ayog 8 0.3San M iguel 5 0.3Pagadian City 22 0.2Guipos 4 0.2Tab ina 4 0.2Dumalinao 2 0.1
C hi ld ren und er 5 year s o ld w ho d ied
M unic i p a l i t y B a r a ng a y M a g ni t ud e P r o p o r t i o n
M ahayag Paraiso 55 2 5.9
Tig b ao Lib ayo y 2 2 2 1.8
Tamb uligSag rad a Famil ia 18 15.0
So mino t Pict uran 9 11.0
Lap uyan Pant ad 4 10 .8Tamb ulig A ng eles 12 9 .5
D uming ag Saad 11 8 .6
R amo n M ag saysay W akat 2 7.4M id salip Pawan 6 5.8
A uro raA lang -alang 3 5.7
B o t t o m 10 B a r a ng a y s

The Many Faces of Poverty (Volume 3)
383
Map 3. Proportion of Women who Died Due to Pregnancy-Related Causes,by Municipality, 2006-2009
Map 4. Proportion of Women who Died Due to Pregnancy-Related Causes,by Barangay, 2006-2009
DUMINGAG
MIDSALIP
MAHAYAG
AURORA
TUKURAN
LABANGAN
PAGADIAN CITY
SAN PABLO
GUIPOS
DINAS
TABINAPITOGO
DIMATALINGVINCENZO A. SAGUN
MARGOSATUBIG
LAPUYAN
KUMALARANG
BAYOGLAKEWOOD
RAMON MAGSAYSAY
SOMINOT
MOLAVE
JOSEFINA
TAMBULIG
DUMALINAO
TIGBAO
SAN MIGUEL
0.1 0.3
0.2
1.5
0.7
0.5
0.4
0.0
0.60.3
0.0
0.3
0.0 0.3
0.7
0.03.2
1.5
0.5
0.50.3
0.0
0.00.0
0.6
CBMS Poverty Maps: Zamboanga del Sur
M unic ip a l i t y M ag ni t ud e P ro p o r t io nPitogo 1 3.2
Josef ina 1 1.5
V incenzo Sagun 6 1.5
San Pablo 2 0.7
Tambulig 4 0.7
Somino t 2 0.6Tigbao 2 0.6M argosatubig 3 0.5A urora 4 0.5San M iguel 1 0.5Tukuran 3 0.4M idsalip 2 0.3Lapuyan 2 0.3Dumalinao 1 0.3Pagad ian Cit y 5 0.3M ahayag 2 0.3M o lave 2 0.2Dumingag 1 0.1B ayog 0 0.0Guipos 0 0.0Kumalarang 0 0.0Labangan 0 0.0Lakewood 0 0.0Ramon M agsaysay 0 0.0Tabina 0 0.0
W o men d eat hs d ue t o p reg nancy- re la t ed causes
M uni c ip a l i t y B ar ang a y M a g ni t ud e P r o p o r t i o n
Dumalinao Pant ad 1 100 .0
Jo sef ina Sebukang 1 100 .0
Tamb uligB ag -ong Tabo go n 2 2 0.0
A urora W at erf all 1 14 .3
Pit og o Colo jo 1 11.1San M ig uel Ocap an 1 11.1
M idsalipNew Kat ip unan 1 8 .3
San Pab lo Tand ubuay 1 8 .3Tigb ao Libayoy 1 7.7
A urora B ayabas 1 7.1San Pab lo Lumb ayao 1 7.1
B o t t o m 11 B ar a ng a ys

384
The Many Faces of Poverty (Volume 3)
Map 6. Proportion of Children 0-5 Years Old who are Malnourished, by Barangay,2006-2009
Map 5. Proportion of Children 0-5 Years Old who are Malnourished,by Municipality, 2006-2009
DUMINGAG
MIDSALIP
MAHAYAG
AURORA
TUKURAN
LABANGAN
PAGADIAN CITY
SAN PABLO
GUIPOS
DINAS
TABINAPITOGO
DIMATALINGVINCENZO A. SAGUN
MARGOSATUBIG
LAPUYAN
KUMALARANG
BAYOGLAKEWOOD
RAMON MAGSAYSAY
SOMINOT
MOLAVE
JOSEFINA
TAMBULIG
DUMALINAO
TIGBAO
SAN MIGUEL
2.73.6
5.6
3.1
1.50.9
2.4
7.3
3.4
1.33.6
2.72.8
3.1
1.0
0.5 1.8
4.0
0.11.6
5.9
6.7
7.9
6.43.1
CBMS Poverty Maps: Zamboanga del Sur
M unic ip a l i t y M ag ni t ud e P ro p o r t io nLapuyan 280 7.9
Tukuran 362 7.3
M argosatubig 271 6.7
Somino t 128 6.4
V incenzo Sagun 136 5.9
Josef ina 62 5.6San Pablo 93 4.0M ahayag 210 3.6Tigbao 89 3.6Labangan 163 3.4Kumalarang 89 3.1M o lave 176 3.1M idsalip 134 3.1B ayog 91 2.8Dumingag 150 2.7Lakewood 67 2.7A urora 153 2.4Dumalinao 66 1.8Pitogo 37 1.6Tambulig 62 1.5Pagad ian Cit y 147 1.3San M iguel 21 1.0Ramon M agsaysay 27 0.9Guipos 11 0.5Tabina 2 0.1
M alno ur ished chi ld ren ( 0 - 5 years o ld )
M unic ip a l i t y B arang ay M ag ni t ud e Pro p o r t io n
Lapuyan Salambuyan 104 81.9
Kumalarang M ahayahay 54 76 .1
Lapuyan Talabab 42 70.0San Pablo Bubual 35 53.8
M idsalip B ib ilop 69 53 .1Lapuyan Tugaya 28 51.9
Bayog Bantal 33 49.3
Tukuran San Antonio 18 35.3
Lapuyan Pantad 13 34.2
Bayog Canoayan 34 30.4
B o t t o m 10 B arang ays
The Many Faces of Poverty (Volume 3)
385
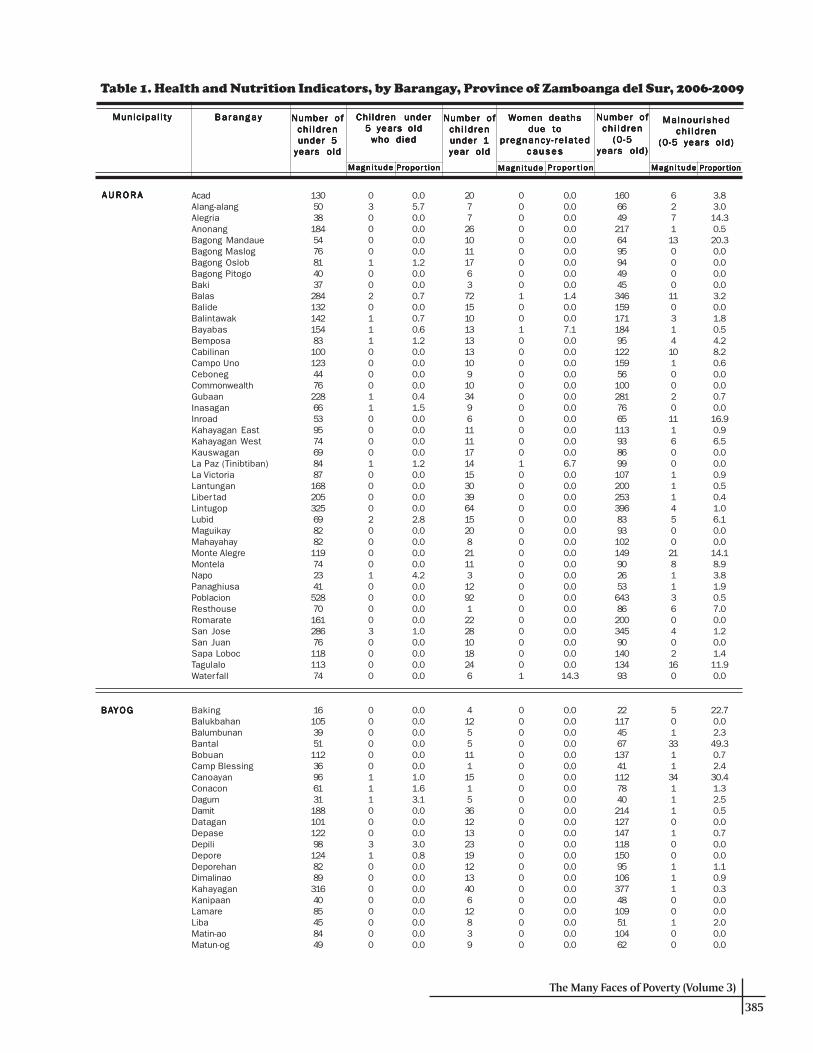
Table 1. Health and Nutrition Indicators, by Barangay, Province of Zamboanga del Sur, 2006-2009
Munic ipal i tyMunic ipal i tyMunic ipal i tyMunic ipal i tyMunic ipal i ty Ba r anga yBa ranga yBa ranga yBa ranga yBa ranga y Number ofNumber ofNumber ofNumber ofNumber ofch i ld rench i ld rench i ld rench i ld rench i ld ren
(0-5(0-5(0-5(0-5(0-5years old)years old)years old)years old)years old)
Malnour ishedMalnour ishedMalnour ishedMalnour ishedMalnour ishedch i ld rench i ld rench i ld rench i ld rench i ld ren
(0-5 years old)(0-5 years old)(0-5 years old)(0-5 years old)(0-5 years old)
PrPrPrPrProporoporoporoporopor t iont iont iont iont ion
Chi ldren underChi ldren underChi ldren underChi ldren underChi ldren under5 years old5 years old5 years old5 years old5 years old
who diedwho diedwho diedwho diedwho died
Number ofNumber ofNumber ofNumber ofNumber ofch i ld rench i ld rench i ld rench i ld rench i ld renunder 1under 1under 1under 1under 1year oldyear oldyear oldyear oldyear old
Women deathsWomen deathsWomen deathsWomen deathsWomen deathsdue todue todue todue todue to
p regnancy - re la tedpregnancy - re la tedpregnancy - re la tedpregnancy - re la tedpregnancy - re la tedcausescausescausescausescauses
Magn i tudeMagn i tudeMagn i tudeMagn i tudeMagn i tude Magn i tudeMagn i tudeMagn i tudeMagn i tudeMagn i tude P rP rP rP rP ropo ropo ropo ropo ropo r t i ont iont iont iont ion Magn i tudeMagn i tudeMagn i tudeMagn i tudeMagn i tude PrPrPrPrProporoporoporoporopor tiontiontiontiontion
Number ofNumber ofNumber ofNumber ofNumber ofch i ld rench i ld rench i ld rench i ld rench i ld renunder 5under 5under 5under 5under 5
years oldyears oldyears oldyears oldyears old
AURORAAURORAAURORAAURORAAURORA AcadAlang-alangAlegriaAnonangBagong MandaueBagong MaslogBagong OslobBagong PitogoBakiBalasBalideBalintawakBayabasBemposaCabilinanCampo UnoCebonegCommonwealthGubaanInasaganInroadKahayagan EastKahayagan WestKauswaganLa Paz (Tinibtiban)La VictoriaLantunganLiber tadLintugopLubidMaguikayMahayahayMonte AlegreMontelaNapoPanaghiusaPoblacionResthouseRomarateSan JoseSan JuanSapa LobocTagulaloWaterfall
BABABABABAYOGYOGYOGYOGYOG BakingBalukbahanBalumbunanBantalBobuanCamp BlessingCanoayanConaconDagumDamitDataganDepaseDepiliDeporeDeporehanDimalinaoKahayaganKanipaanLamareLibaMatin-aoMatun-og
1305038184547681403728413214215483100123447622866539574698487168205325698282119742341528701612867611811374
03000010020111000011000010000200001000030000
0.05.70.00.00.00.01.20.00.00.70.00.70.61.20.00.00.00.00.41.50.00.00.00.01.20.00.00.00.02.80.00.00.00.04.20.00.00.00.01.00.00.00.00.0
20772610111763721510131313109103496111117141530396415208211131292122281018246
00000000010010000000000010000000000000000001
0.00.00.00.00.00.00.00.00.01.40.00.07.10.00.00.00.00.00.00.00.00.00.00.06.70.00.00.00.00.00.00.00.00.00.00.00.00.00.00.00.00.00.014.3
16066492176495944945346159171184951221595610028176651139386991072002533968393102149902653643862003459014013493
62711300001103141010020111600111450021811360402160
3.83.014.30.520.30.00.00.00.03.20.01.80.54.28.20.60.00.00.70.016.90.96.50.00.00.90.50.41.06.10.00.014.18.93.81.90.57.00.01.20.01.411.90.0
161053951112369661311881011229812482893164085458449
0000001110003100000000
0.00.00.00.00.00.01.01.63.10.00.00.03.00.80.00.00.00.00.00.00.00.0
4125511115153612132319121340612839
0000000000000000000000
0.00.00.00.00.00.00.00.00.00.00.00.00.00.00.00.00.00.00.00.00.00.0
22117456713741112784021412714711815095106377481095110462
501331134111010011100100
22.70.02.349.30.72.430.41.32.50.50.00.70.00.01.10.90.30.00.02.00.00.0

386
The Many Faces of Poverty (Volume 3)
BABABABABAYOGYOGYOGYOGYOG Pangi (San Isidro)PoblacionPulang BatoSalawaganSigacadSupon
DUMALINAODUMALINAODUMALINAODUMALINAODUMALINAO AnonangBagaBag-ong MisamisBag-ong SilaoBaloboanBanta-aoBibilikCalingayanCamaligCamangaCuatro-cuatroLocubanMalasikMama (San Juan)Matab-angMecolongMetokongMotosawaPag-asa (Pob.)Paglaum (Pob.)PantadPiniglibanoRebokonSan AgustinSibucaoSumadatTikwasTinaTubo-PaitUpper Dumalinao
DUMINGAGDUMINGAGDUMINGAGDUMINGAGDUMINGAG Bagong KauswaganBagong SilangBag-ong ValenciaBucayanCalumanggiCanibonganCaridadDanluganDapiwakDatu TotocanDiludDitulanDulianDulopGuintanananGuitranGumpinganLa FortunaLabangonLiber tadLicabangLipawanLower LandingLower TimonanMacasingMahayahayMalagaladManlabayMaralagMarangan
Table 1. Health and Nutrition Indicators, by Barangay, Province of Zamboanga del Sur, 2006-2009
Munic ipal i tyMunic ipal i tyMunic ipal i tyMunic ipal i tyMunic ipal i ty Ba r anga yBa ranga yBa ranga yBa ranga yBa ranga y Number ofNumber ofNumber ofNumber ofNumber ofch i ld rench i ld rench i ld rench i ld rench i ld ren
(0-5(0-5(0-5(0-5(0-5years old)years old)years old)years old)years old)
Malnour ishedMalnour ishedMalnour ishedMalnour ishedMalnour ishedch i ld rench i ld rench i ld rench i ld rench i ld ren
(0-5 years old)(0-5 years old)(0-5 years old)(0-5 years old)(0-5 years old)
PrPrPrPrProporoporoporoporopor t iont iont iont iont ion
Chi ldren underChi ldren underChi ldren underChi ldren underChi ldren under 5 years old 5 years old 5 years old 5 years old 5 years old
who diedwho diedwho diedwho diedwho died
Number ofNumber ofNumber ofNumber ofNumber ofch i ld rench i ld rench i ld rench i ld rench i ld renunder 1under 1under 1under 1under 1year oldyear oldyear oldyear oldyear old
Women deathsWomen deathsWomen deathsWomen deathsWomen deathsdue todue todue todue todue to
p regnancy - re la tedpregnancy - re la tedpregnancy - re la tedpregnancy - re la tedpregnancy - re la tedcausescausescausescausescauses
Magn i tudeMagn i tudeMagn i tudeMagn i tudeMagn i tude Magn i tudeMagn i tudeMagn i tudeMagn i tudeMagn i tude P rP rP rP rP ropo ropo ropo ropo ropo r t i ont iont iont iont ion Magn i tudeMagn i tudeMagn i tudeMagn i tudeMagn i tude PrPrPrPrProporoporoporoporopor tiontiontiontiontion
Number ofNumber ofNumber ofNumber ofNumber ofch i ld rench i ld rench i ld rench i ld rench i ld renunder 5under 5under 5under 5under 5
years oldyears oldyears oldyears oldyears old
4640951886069
000001
0.00.00.00.00.01.4
8841110510
000000
0.00.00.00.00.00.0
61504681068078
033020
0.00.64.40.02.50.0
1079419866553140945512076996897591043956521805468348941652481471316163
000000000000000010000010000000
0.00.00.00.00.00.00.00.00.00.00.00.00.00.00.00.02.50.00.00.00.00.00.30.00.00.00.00.00.00.0
20031850192115900111090628014540213024905
000000000000000000001000000000
0.00.00.00.00.00.00.00.00.00.00.00.00.00.00.00.00.00.00.00.0
100.00.00.00.00.00.00.00.00.00.0
1351092510484601551127115290120781146611950657022664814001132042971791617181
00010110140101612001212303141020
0.00.00.01.00.01.70.60.01.42.60.00.80.014.01.51.70.00.01.40.91.62.50.80.01.50.32.20.60.024.7
29507362708814793117122951164216874993044172101141772101336811644154197116
000000020001002100010200300000
0.00.00.00.00.00.00.02.10.00.00.00.90.00.02.61.00.00.00.01.00.02.50.00.04.20.00.00.00.00.0
698914153212202812208101218252015241428289264313025
000000000000000000000000000000
0.00.00.00.00.00.00.00.00.00.00.00.00.00.00.00.00.00.00.00.00.00.00.00.00.00.00.00.00.00.0
326084758310717611614314711614157220941273566205125176982541598713062182225138
023120800093001016000910150393513
0.03.33.61.42.40.04.50.00.00.07.82.10.00.010.612.60.00.00.07.20.60.00.43.10.02.314.51.62.29.4

The Many Faces of Poverty (Volume 3)
387
DUMINGAGDUMINGAGDUMINGAGDUMINGAGDUMINGAG New BasakSaadSalvadorSan JuanSan Pablo (Pob.)San Pedro (Pob.)San VicenteSenoteSinonokSunopTagunTamurayanUpper LandingUpper Timonan
GU IPOSGUIPOSGUIPOSGUIPOSGUIPOS Bagong OroquietaBaguitanBalongatingCanunanDacsolDagohoyDalapangDataganGulingKatipunanLintumLitanMagtingPoblacion (Guipos)ReglaSikatunaSingclot
JOSEF INAJOSEF INAJOSEF INAJOSEF INAJOSEF INA Bogo CalabatDawa (Diwa)EbarleGumahan (Pob.)LeonardoLitapanLower Bagong TudelaMansanasMoradjiNemeñoNopulanSebukangTagaytay HillUpper Bagong Tudela
KUMALARANGKUMALARANGKUMALARANGKUMALARANGKUMALARANG BogayoBolisongBoyugan EastBoyugan WestBualanDiploGawilGusomKitaan DagatLantawanLimamawanMahayahayPangiPicananPoblacionSalagmanokSecadeSuminalum
Table 1. Health and Nutrition Indicators, by Barangay, Province of Zamboanga del Sur, 2006-2009
Munic ipal i tyMunic ipal i tyMunic ipal i tyMunic ipal i tyMunic ipal i ty Ba r anga yBa ranga yBa ranga yBa ranga yBa ranga y Number ofNumber ofNumber ofNumber ofNumber ofch i ld rench i ld rench i ld rench i ld rench i ld ren
(0-5(0-5(0-5(0-5(0-5years old)years old)years old)years old)years old)
Malnour ishedMalnour ishedMalnour ishedMalnour ishedMalnour ishedch i ld rench i ld rench i ld rench i ld rench i ld ren
(0-5 years old)(0-5 years old)(0-5 years old)(0-5 years old)(0-5 years old)
PrPrPrPrProporoporoporoporopor t iont iont iont iont ion
Chi ldren underChi ldren underChi ldren underChi ldren underChi ldren under5 years old5 years old5 years old5 years old5 years old
who diedwho diedwho diedwho diedwho died
Number ofNumber ofNumber ofNumber ofNumber ofch i ld rench i ld rench i ld rench i ld rench i ld renunder 1under 1under 1under 1under 1year oldyear oldyear oldyear oldyear old
Women deathsWomen deathsWomen deathsWomen deathsWomen deathsdue todue todue todue todue to
p regnancy - re la tedpregnancy - re la tedpregnancy - re la tedpregnancy - re la tedpregnancy - re la tedcausescausescausescausescauses
Magn i tudeMagn i tudeMagn i tudeMagn i tudeMagn i tude Magn i tudeMagn i tudeMagn i tudeMagn i tudeMagn i tude P rP rP rP rP r opo ropo ropo ropo ropo r t i ont iont iont iont ion Magn i tudeMagn i tudeMagn i tudeMagn i tudeMagn i tude PrPrPrPrProporoporoporoporopor tiontiontiontiontion
Number ofNumber ofNumber ofNumber ofNumber ofch i ld rench i ld rench i ld rench i ld rench i ld renunder 5under 5under 5under 5under 5
years oldyears oldyears oldyears oldyears old
9311711829216323666381594554154111
011300010000100
0.08.62.50.00.00.01.50.00.00.00.01.80.00.0
14271555047781597122218
10000000000000
6.70.00.00.00.00.00.00.00.00.00.00.00.00.0
11413513934262397808098715565190138
375203458001000
2.65.23.65.90.00.85.36.38.40.00.015.40.00.0
15913111821751579495204135745250340974680
10000001000001010
0.60.00.00.00.00.00.01.00.00.00.00.00.00.30.02.10.0
00000000000000000
00000000000000000
0.00.00.00.00.00.00.00.00.00.00.00.00.00.00.00.00.0
199153152254596711511723916187686040311756104
00002001000100070
0.00.00.00.03.40.00.00.90.00.00.01.50.00.00.012.50.0
927434138534913754232752822158
22111000000003
2.12.62.90.71.90.00.00.00.00.00.00.00.01.9
0612100000020034
00000000000100
0.00.00.00.00.00.00.00.00.00.00.0
100.00.00.0
1119344176696217955242973527183
12010000091161022
10.80.02.30.00.00.00.00.017.32.416.52.90.012.0
134791141332923211495107173157862255429790114
310000011003002020
2.21.30.00.00.00.00.01.00.90.00.05.00.00.00.40.02.20.0
11190192517231300602246121817
000000000000000000
0.00.00.00.00.00.00.00.00.00.00.00.00.00.00.00.00.00.0
16410014217053289140111134223971113279666121108142
10110101000540082200
0.60.00.70.60.00.30.00.90.00.00.076.10.00.01.218.20.00.0

388
The Many Faces of Poverty (Volume 3)
Table 1. Health and Nutrition Indicators, by Barangay, Province of Zamboanga del Sur, 2006-2009
Munic ipal i tyMunic ipal i tyMunic ipal i tyMunic ipal i tyMunic ipal i ty Ba r anga yBa ranga yBa ranga yBa ranga yBa ranga y Number ofNumber ofNumber ofNumber ofNumber ofch i ld rench i ld rench i ld rench i ld rench i ld ren
(0-5(0-5(0-5(0-5(0-5years old)years old)years old)years old)years old)
Malnour ishedMalnour ishedMalnour ishedMalnour ishedMalnour ishedch i ld rench i ld rench i ld rench i ld rench i ld ren
(0-5 years old)(0-5 years old)(0-5 years old)(0-5 years old)(0-5 years old)
PrPrPrPrProporoporoporoporopor t iont iont iont iont ion
Chi ldren underChi ldren underChi ldren underChi ldren underChi ldren under5 years old5 years old5 years old5 years old5 years old
who diedwho diedwho diedwho diedwho died
Number ofNumber ofNumber ofNumber ofNumber ofch i ld rench i ld rench i ld rench i ld rench i ld renunder 1under 1under 1under 1under 1year oldyear oldyear oldyear oldyear old
Women deathsWomen deathsWomen deathsWomen deathsWomen deathsdue todue todue todue todue to
p regnancy - re la tedpregnancy - re la tedpregnancy - re la tedpregnancy - re la tedpregnancy - re la tedcausescausescausescausescauses
Magn i tudeMagn i tudeMagn i tudeMagn i tudeMagn i tude Magn i tudeMagn i tudeMagn i tudeMagn i tudeMagn i tude P rP rP rP rP r opo ropo ropo ropo ropo r t i ont iont iont iont ion Magn i tudeMagn i tudeMagn i tudeMagn i tudeMagn i tude PrPrPrPrProporoporoporoporopor tiontiontiontiontion
Number ofNumber ofNumber ofNumber ofNumber ofch i ld rench i ld rench i ld rench i ld rench i ld renunder 5under 5under 5under 5under 5
years oldyears oldyears oldyears oldyears old
LABANGANLABANGANLABANGANLABANGANLABANGAN BagalupaBalimbinganBinayanBokongBulanitCogonanComboDalapangDimasangcaDipayaLangapodLantianLower Campo IslamLower PulacanLower Sang-anNew LabanganNoboranOld LabanganSan IsidroSanta CruzTapodocTawagan NorteUpper Campo IslamUpper PulacanUpper Sang-an
LAKEWOODLAKEWOODLAKEWOODLAKEWOODLAKEWOOD Bagong KahayagBakingBiswanganBululawanDagumGasaGatubLukuanMatalangPoblacion (Lakewood)Sapang PinolesSebugueyTiwalesTubod
LAPUYLAPUYLAPUYLAPUYLAPUYANANANANAN BulawanCarpocDangananDansalDumaraLinokmadalumLuananLubusanMahalingebMandegMaralagMaruingMolumPampangPantadPingalayPoblacionSalambuyanSan JoseSayogTabonTalababTiguhaTininghalangTipasanTugaya
871191091882342421212486474207179146128103239152148142137126198114341140
40017300011117011322102020
4.40.00.00.52.91.20.00.00.01.30.50.60.75.20.04.41.91.31.40.70.01.00.00.60.0
16299243941164981544242423175118282023923216131
0000000000000000000000000
0.00.00.00.00.00.00.00.00.00.00.00.00.00.00.00.00.00.00.00.00.00.00.00.00.0
1071421422212822921442917996249212169148126290181182165171159241130415174
12812411221018012000410230234161
0.91.45.60.50.714.08.37.20.018.80.05.70.00.00.01.45.51.11.80.01.31.23.13.90.6
1851821491036355112461104897779110278
10000200080000
0.50.00.00.00.03.50.00.00.01.60.00.00.00.0
364013211612228197514172129
00000000000000
0.00.00.00.00.00.00.00.00.00.00.00.00.00.0
2292181781229366141511336089392132350
413506430877316
1.70.51.74.10.09.12.85.90.01.37.57.62.34.6
17218488132389673126526199213938933805889648465849230999048
00120320111511439411011132
0.00.01.11.50.03.02.70.01.91.61.02.31.11.110.83.61.54.02.02.10.02.00.41.03.24.0
24501834522132414516382416522126192119104621186
00000000000100001000000000
0.00.00.00.00.00.00.00.00.00.00.02.60.00.00.00.00.80.00.00.00.00.00.00.00.00.0
2082191071564511980153667211525710510938966991275550676027612211154
000102252403121401303
10460042002128
0.00.00.00.60.018.56.31.36.10.02.64.713.30.034.20.00.481.910.90.00.070.00.00.018.951.9

The Many Faces of Poverty (Volume 3)
389
Table 1. Health and Nutrition Indicators, by Barangay, Province of Zamboanga del Sur, 2006-2009
Munic ipal i tyMunic ipal i tyMunic ipal i tyMunic ipal i tyMunic ipal i ty Ba r anga yBa ranga yBa ranga yBa ranga yBa ranga y Number ofNumber ofNumber ofNumber ofNumber ofch i ld rench i ld rench i ld rench i ld rench i ld ren
(0-5(0-5(0-5(0-5(0-5years old)years old)years old)years old)years old)
Malnour ishedMalnour ishedMalnour ishedMalnour ishedMalnour ishedch i ld rench i ld rench i ld rench i ld rench i ld ren
(0-5 years old)(0-5 years old)(0-5 years old)(0-5 years old)(0-5 years old)
PrPrPrPrProporoporoporoporopor t iont iont iont iont ion
Chi ldren underChi ldren underChi ldren underChi ldren underChi ldren under5 years old5 years old5 years old5 years old5 years old
who diedwho diedwho diedwho diedwho died
Number ofNumber ofNumber ofNumber ofNumber ofch i ld rench i ld rench i ld rench i ld rench i ld renunder 1under 1under 1under 1under 1year oldyear oldyear oldyear oldyear old
Women deathsWomen deathsWomen deathsWomen deathsWomen deathsdue todue todue todue todue to
p regnancy - re la tedpregnancy - re la tedpregnancy - re la tedpregnancy - re la tedpregnancy - re la tedcausescausescausescausescauses
Magn i tudeMagn i tudeMagn i tudeMagn i tudeMagn i tude Magn i tudeMagn i tudeMagn i tudeMagn i tudeMagn i tude P rP rP rP rP r opo ropo ropo ropo ropo r t i ont iont iont iont ion Magn i tudeMagn i tudeMagn i tudeMagn i tudeMagn i tude PrPrPrPrProporoporoporoporopor tiontiontiontiontion
Number ofNumber ofNumber ofNumber ofNumber ofch i ld rench i ld rench i ld rench i ld rench i ld renunder 5under 5under 5under 5under 5
years oldyears oldyears oldyears oldyears old
Bag-ong BalambanBag-ong DalagueteBoniaoDelusomDiwanGuripanKaangayanKabuhiLourmahLower Salug DakuLower Santo NiñoMaluboManguilesMarabanan (Balanan)PanagaanParaisoPedaganPoblacionPugwanSan IsidroSan JoseSan VicenteSanta CruzSicpaoTuboranTulanTumapicUpper Salug DakuUpper Santo Niño
MAHAMAHAMAHAMAHAMAHAYYYYYAGAGAGAGAG
MARGOSATUBIGMARGOSATUBIGMARGOSATUBIGMARGOSATUBIGMARGOSATUBIG BalintawakBularongDigonGuinimananIgat IslandJosefinaKalianKolotLimabatongLimamawanLumbogMagahisPoblacionSaguaTalanusaTiguianTulapoc
MIDSALIPMIDSALIPMIDSALIPMIDSALIPMIDSALIP BacahanBalonaiBibilopBuloronCabaloranCanipay NorteCanipay SurCumaronDakayakanDuelicDumalinaoEcuanGolictopGuinabotGuitalosGumaKahayaganLicuro-anLumpunid
14951159132136182230171145218135881586612915780566127336207721213271149612899201
200122003002023550213200102003
1.30.00.00.81.41.10.00.02.00.00.02.20.02.92.325.90.00.40.80.91.00.00.00.30.02.00.00.01.5
2161919304020292530202227131521168221602481671221642142
10000000000010000000000000000
4.50.00.00.00.00.00.00.00.00.00.00.03.60.00.00.00.00.00.00.00.00.00.00.00.00.00.00.00.0
17663190161161219268208178258169105188801561909170614240924788149400140115152117257
5512222046402215180021821211028661207
2.87.96.31.21.29.117.21.90.00.81.214.39.60.00.01.119.80.38.50.20.40.01.32.04.35.27.90.02.7
659214061223912694217611520857
13266958207191
101030403101101010
1.50.00.70.01.30.01.50.01.70.90.01.70.71.40.00.50.0
172028153319487342235112081564335
10001000000010000
5.60.00.00.02.90.00.00.00.00.00.00.00.50.00.00.00.0
80104163782571083214821013125771
15747672243229
221451524147121518478212434
2.51.98.66.45.822.24.414.95.711.57.05.65.02.61.49.914.8
851839222516713087115351307150101789254397899
0001100100012000100
0.00.00.00.40.60.00.00.90.00.00.02.01.90.00.00.02.50.00.0
10191336321814188151710101017951117
0000000000000000000
0.00.00.00.00.00.00.00.00.00.00.00.00.00.00.00.00.00.00.0
11621813225919416210314742152866112789118714894123
20690000010001000500
1.70.053.10.00.00.00.00.02.40.00.00.00.80.00.00.010.40.00.0

390
The Many Faces of Poverty (Volume 3)
MIDSALIPMIDSALIPMIDSALIPMIDSALIPMIDSALIP MatalangNew KatipunanNew UnidosPaliliPawanPiliPisomponganPiwanPoblacion APoblacion BSigapodTimbaboyTulbongTuluan
MOLAMOLAMOLAMOLAMOLAVEVEVEVEVE AliciaAriosaBagong ArgaoBagong GutlangBlanciaBogo CapalaranCuloDalaonDipoloDontulanGonosanLower DimalinaoLower DimorokMabuhayMadasigon (Pob.)Makuguihon (Pob.)Maloloy-on (Pob.)MiliganParasanRizalSanto RosarioSilangitSimataSudlonUpper Dimorok
PPPPPAGADIAN CITYAGADIAN CITYAGADIAN CITYAGADIAN CITYAGADIAN CITY AlegriaBalangasan (Pob.)BalintawakBaloyboanBanaleBogoBombaBuenavistaBulatokBulawanDampalanDanluganDaoDataganDeborokDitorayDumagocGatas (Pob.)GubacGubangKagawasanKahayaganKalasanKawitLa SuerteLalaLapidianLenienza
Table 1. Health and Nutrition Indicators, by Barangay, Province of Zamboanga del Sur, 2006-2009
Munic ipal i tyMunic ipal i tyMunic ipal i tyMunic ipal i tyMunic ipal i ty Ba r anga yBa ranga yBa ranga yBa ranga yBa ranga y Number ofNumber ofNumber ofNumber ofNumber ofch i ld rench i ld rench i ld rench i ld rench i ld ren
(0-5(0-5(0-5(0-5(0-5years old)years old)years old)years old)years old)
Malnour ishedMalnour ishedMalnour ishedMalnour ishedMalnour ishedch i ld rench i ld rench i ld rench i ld rench i ld ren
(0-5 years old)(0-5 years old)(0-5 years old)(0-5 years old)(0-5 years old)
PrPrPrPrProporoporoporoporopor t iont iont iont iont ion
Chi ldren underChi ldren underChi ldren underChi ldren underChi ldren under5 years old5 years old5 years old5 years old5 years old
who diedwho diedwho diedwho diedwho died
Number ofNumber ofNumber ofNumber ofNumber ofch i ld rench i ld rench i ld rench i ld rench i ld renunder 1under 1under 1under 1under 1year oldyear oldyear oldyear oldyear old
Women deathsWomen deathsWomen deathsWomen deathsWomen deathsdue to pregnancy-due to pregnancy-due to pregnancy-due to pregnancy-due to pregnancy-
related causesrelated causesrelated causesrelated causesrelated causes
Magn i tudeMagn i tudeMagn i tudeMagn i tudeMagn i tude Magn i tudeMagn i tudeMagn i tudeMagn i tudeMagn i tude P rP rP rP rP ropo ropo ropo ropo ropo r t i ont iont iont iont ion Magn i tudeMagn i tudeMagn i tudeMagn i tudeMagn i tude PrPrPrPrProporoporoporoporopor tiontiontiontiontion
Number ofNumber ofNumber ofNumber ofNumber ofch i ld rench i ld rench i ld rench i ld rench i ld renunder 5under 5under 5under 5under 5
years oldyears oldyears oldyears oldyears old
15094621259749125661672112001387899
00016000006010
0.00.00.00.85.80.00.00.00.00.02.90.01.30.0
33115201422310313843181724
01000000001000
0.08.30.00.00.00.00.00.00.00.02.30.00.00.0
18310971154116591538320126324417493109
013809234003005
0.00.94.25.20.015.315.04.80.00.01.20.00.04.6
121112108105233228568211282791415767131349408331201138124469516927993
0001339120000031100100010
0.00.00.00.91.31.31.60.50.70.00.00.00.00.00.90.20.30.00.00.80.00.00.00.40.0
3020201941399641581727131323686665342718715374919
0000001000000010000000000
0.00.00.00.00.00.01.00.00.00.00.00.00.00.01.40.00.00.00.00.00.00.00.00.00.0
14714113812927727268625434189171698515642948341224816315061115202336119
100231875220310000424300701210
0.70.00.01.61.16.610.98.70.03.45.80.00.00.00.95.00.70.00.04.70.00.91.00.30.0
598721618538191288132228961082123151143189564224312151117226489614264229
0300400000001000100001020011
0.00.30.00.01.00.00.00.00.00.00.00.00.30.00.00.00.20.00.00.00.00.80.00.30.00.01.50.4
10173351267185223351821375620316126292214184
10817231038
0200100000000000000000000000
0.01.10.00.01.50.00.00.00.00.00.00.00.00.00.00.00.00.00.00.00.00.00.00.00.00.00.00.0
701051200102479110358163268118128247379138391046662757146591492776811417075282
0208020009001031004210050111006
0.01.94.00.04.20.00.05.50.00.00.80.00.80.70.00.00.67.41.80.00.03.40.01.40.90.00.02.1

The Many Faces of Poverty (Volume 3)
391
PPPPPAGADIAN CITYAGADIAN CITYAGADIAN CITYAGADIAN CITYAGADIAN CITY Lizon ValleyLumadLumbiaMacasingMangaMuricayNapolanPalpalanPedulonanPoloyaganSan Francisco (Pob.)San Jose (Pob.)San Pedro (Pob.)Santa Lucia (Pob.)Santa MariaSantiago (Pob.)Santo NiñoTawagan SurTigumaTuburan (Pob.)TulanganTulawasWhite Beach
P ITOGOP ITOGOP ITOGOP ITOGOP ITOGO BalabawanBalong-balongColojoLiasanLiguacLimbayanLower Paniki-anMatin-aoPanubiganPoblacion (Pitogo)Punta FlechaSan IsidroSugbay DosTongaoUpper Paniki-an
RAMON MAGSARAMON MAGSARAMON MAGSARAMON MAGSARAMON MAGSAYSAYSAYSAYSAYSAYYYYY Bagong OponBambong DakuBambong DiutBobonganCampo IVCampo VCanianganDipalusanEastern BobonganEsperanzaGapasanKatipunanKauswaganLower SambulawanMabiniMagsaysayMalatingParadisePasingkalanPoblacionSan FernandoSanto RosarioSapa AndingSinaguingSwitchUpper LaperianWakat
Table 1. Health and Nutrition Indicators, by Barangay, Province of Zamboanga del Sur, 2006-2009
Munic ipal i tyMunic ipal i tyMunic ipal i tyMunic ipal i tyMunic ipal i ty Ba r anga yBa ranga yBa ranga yBa ranga yBa ranga y Number ofNumber ofNumber ofNumber ofNumber ofch i ld rench i ld rench i ld rench i ld rench i ld ren
(0-5(0-5(0-5(0-5(0-5years old)years old)years old)years old)years old)
Malnour ishedMalnour ishedMalnour ishedMalnour ishedMalnour ishedch i ld rench i ld rench i ld rench i ld rench i ld ren
(0-5 years old)(0-5 years old)(0-5 years old)(0-5 years old)(0-5 years old)
PrPrPrPrProporoporoporoporopor t iont iont iont iont ion
Chi ldren underChi ldren underChi ldren underChi ldren underChi ldren under5 years old5 years old5 years old5 years old5 years old
who diedwho diedwho diedwho diedwho died
Number ofNumber ofNumber ofNumber ofNumber ofch i ld rench i ld rench i ld rench i ld rench i ld renunder 1under 1under 1under 1under 1year oldyear oldyear oldyear oldyear old
Women deathsWomen deathsWomen deathsWomen deathsWomen deathsdue todue todue todue todue to
p regnancy - re la tedpregnancy - re la tedpregnancy - re la tedpregnancy - re la tedpregnancy - re la tedcausescausescausescausescauses
Magn i tudeMagn i tudeMagn i tudeMagn i tudeMagn i tude Magn i tudeMagn i tudeMagn i tudeMagn i tudeMagn i tude P rP rP rP rP r opo ropo ropo ropo ropo r t i ont iont iont iont ion Magn i tudeMagn i tudeMagn i tudeMagn i tudeMagn i tude PrPrPrPrProporoporoporoporopor tiontiontiontiontion
Number ofNumber ofNumber ofNumber ofNumber ofch i ld rench i ld rench i ld rench i ld rench i ld renunder 5under 5under 5under 5under 5
years oldyears oldyears oldyears oldyears old
2931032531331832222037740237136817910825227221896483564911398
10010201011000100000000
0.30.00.00.70.00.90.01.30.04.21.40.00.00.03.80.00.00.00.00.00.00.00.0
41183428373737695125422243284614945641822
00000010000000010000000
0.00.00.00.00.00.02.60.00.00.00.00.00.00.00.03.40.00.00.00.00.00.00.0
354124296161216276255964626874472111273328425610280440261135117
900240100000400110048030
2.50.00.014.90.00.40.00.00.00.00.00.90.00.03.00.40.00.00.52.00.02.20.0
13917153111951471506130054182901667894
101301012010000
0.70.01.92.60.00.70.01.60.70.00.50.00.00.00.0
2080005000000015
001000000000000
0.00.011.10.00.00.00.00.00.00.00.00.00.00.00.0
16620866132106173178663606121710720299123
7090002200100016
4.20.013.60.00.00.01.13.00.00.00.50.00.00.013.0
45534312018490676076204127151533465724878982625461135861399125
200000000101010000000000102
4.30.00.00.00.00.00.00.00.00.50.00.70.02.90.00.00.00.00.00.00.00.00.00.00.70.07.4
0108244725151211361536142151312122543015222026130
000000000000000000000000000
0.00.00.00.00.00.00.00.00.00.00.00.00.00.00.00.00.00.00.00.00.00.00.00.00.00.00.0
56705414620711282688724214618469447686599211631360771731151649635
176001000000020021003000103
1.810.011.10.00.00.90.00.00.00.00.00.00.04.50.00.03.41.10.00.05.00.00.00.00.60.08.6

392
The Many Faces of Poverty (Volume 3)
SAN MIGUELSAN MIGUELSAN MIGUELSAN MIGUELSAN MIGUEL BetinanBulawanCalubeConcepcionDao-anDumalianFatimaLangilanLantawanLaperianLibugananLimonanMatiOcapanPoblacionSan IsidroSayogTapian
SAN PSAN PSAN PSAN PSAN PABLOABLOABLOABLOABLO Bag-ong MisamisBubualButonCulasianDaplayanKalilanganKapamanokKondumLumbayaoMabuhayMarcos VillageMiasinMolansongPantadPaoPayagPoblacion (San Pablo)PongapongSacbulanSagasanSan JuanSeniorSonggoyTandubuayTaniapanTicala IslandTubo-paitVillakapa
SOMINOTSOMINOTSOMINOTSOMINOTSOMINOT Bag-ong BaroyBag-ong OroquietaBarubuhanBulanayDataganEastern PoblacionLantawanLiber tadLumangoyNew CarmenPicturanPoblacionRizalSan MiguelSanto NiñoSawaTungawanUpper Sicpao
Table 1. Health and Nutrition Indicators, by Barangay, Province of Zamboanga del Sur, 2006-2009
Munic ipal i tyMunic ipal i tyMunic ipal i tyMunic ipal i tyMunic ipal i ty Ba r anga yBa ranga yBa ranga yBa ranga yBa ranga y Number ofNumber ofNumber ofNumber ofNumber ofch i ld rench i ld rench i ld rench i ld rench i ld ren
(0-5(0-5(0-5(0-5(0-5years old)years old)years old)years old)years old)
Malnour ishedMalnour ishedMalnour ishedMalnour ishedMalnour ishedch i ld rench i ld rench i ld rench i ld rench i ld ren
(0-5 years old)(0-5 years old)(0-5 years old)(0-5 years old)(0-5 years old)
PrPrPrPrProporoporoporoporopor t iont iont iont iont ion
Chi ldren underChi ldren underChi ldren underChi ldren underChi ldren under5 years old5 years old5 years old5 years old5 years old
who diedwho diedwho diedwho diedwho died
Number ofNumber ofNumber ofNumber ofNumber ofch i ld rench i ld rench i ld rench i ld rench i ld renunder 1under 1under 1under 1under 1year oldyear oldyear oldyear oldyear old
Women deathsWomen deathsWomen deathsWomen deathsWomen deathsdue to pregnancy-due to pregnancy-due to pregnancy-due to pregnancy-due to pregnancy-
related causesrelated causesrelated causesrelated causesrelated causes
Magn i tudeMagn i tudeMagn i tudeMagn i tudeMagn i tude Magn i tudeMagn i tudeMagn i tudeMagn i tudeMagn i tude P rP rP rP rP ropo ropo ropo ropo ropo r t i ont iont iont iont ion Magn i tudeMagn i tudeMagn i tudeMagn i tudeMagn i tude PrPrPrPrProporoporoporoporopor tiontiontiontiontion
Number ofNumber ofNumber ofNumber ofNumber ofch i ld rench i ld rench i ld rench i ld rench i ld renunder 5under 5under 5under 5under 5
years oldyears oldyears oldyears oldyears old
71978979188962675995669160821102935313634
101000000001010001
1.40.01.10.00.00.00.00.00.00.00.00.60.00.90.00.00.02.9
11410632222124108308632160
000000000000010000
0.00.00.00.00.00.00.00.00.00.00.00.00.011.10.00.00.00.0
82118110101220109309712172772031031303446416245
001010101009041003
0.00.00.90.00.50.03.30.00.80.00.04.40.03.10.30.00.06.7
4550219610150104266645608841894371202699768314935135117373951
0001001000000000010300000000
0.00.00.01.00.00.01.00.00.00.00.00.00.00.00.00.00.01.40.04.20.00.00.00.00.00.00.00.0
067201011190134717314313356193300112421211
0000000010000000000000010000
0.00.00.00.00.00.00.00.07.10.00.00.00.00.00.00.00.00.00.00.00.00.00.08.30.00.00.00.0
47652612412063116348155731015211662822288211383375943157138474667
03515010021130111000600401000003
0.053.83.84.00.01.60.00.02.51.817.80.021.28.60.00.02.60.00.04.80.01.70.00.00.00.00.04.5
5456689510396535246927328794399535165128
000111001193001040
0.00.00.01.01.01.00.00.02.11.111.01.00.00.01.00.02.40.0
8713181816914815145325423113422
000000000011000000
0.00.00.00.00.00.00.00.00.00.06.71.90.00.00.00.00.00.0
606485119130116706255109953341214711440211160
001413911933116351000103
0.00.016.510.96.99.512.94.85.50.916.810.50.80.00.00.04.71.9

The Many Faces of Poverty (Volume 3)
393
Table 1. Health and Nutrition Indicators, by Barangay, Province of Zamboanga del Sur, 2006-2009
Munic ipal i tyMunic ipal i tyMunic ipal i tyMunic ipal i tyMunic ipal i ty Ba r anga yBa ranga yBa ranga yBa ranga yBa ranga y Number ofNumber ofNumber ofNumber ofNumber ofch i ld rench i ld rench i ld rench i ld rench i ld ren
(0-5(0-5(0-5(0-5(0-5years old)years old)years old)years old)years old)
Malnour ishedMalnour ishedMalnour ishedMalnour ishedMalnour ishedch i ld rench i ld rench i ld rench i ld rench i ld ren
(0-5 years old)(0-5 years old)(0-5 years old)(0-5 years old)(0-5 years old)
PrPrPrPrProporoporoporoporopor t iont iont iont iont ion
Chi ldren underChi ldren underChi ldren underChi ldren underChi ldren under5 years old5 years old5 years old5 years old5 years old
who diedwho diedwho diedwho diedwho died
Number ofNumber ofNumber ofNumber ofNumber ofch i ld rench i ld rench i ld rench i ld rench i ld renunder 1under 1under 1under 1under 1year oldyear oldyear oldyear oldyear old
Women deathsWomen deathsWomen deathsWomen deathsWomen deathsdue todue todue todue todue to
p regnancy - re la tedpregnancy - re la tedpregnancy - re la tedpregnancy - re la tedpregnancy - re la tedcausescausescausescausescauses
Magn i tudeMagn i tudeMagn i tudeMagn i tudeMagn i tude Magn i tudeMagn i tudeMagn i tudeMagn i tudeMagn i tude P rP rP rP rP r opo ropo ropo ropo ropo r t i ont iont iont iont ion Magn i tudeMagn i tudeMagn i tudeMagn i tudeMagn i tude PrPrPrPrProporoporoporoporopor tiontiontiontiontion
Number ofNumber ofNumber ofNumber ofNumber ofch i ld rench i ld rench i ld rench i ld rench i ld renunder 5under 5under 5under 5under 5
years oldyears oldyears oldyears oldyears old
TAB INATAB INATAB INATAB INATAB INA Abong-abongBaganianBaya-bayaCapisanConcepcionCulabayDoña JosefinaLumbiaMabuhayMalimManikaanNew OroquietaPoblacionSan FranciscoTultolan
TAMBUL IGTAMBUL IGTAMBUL IGTAMBUL IGTAMBUL IG Alang-alangAngelesBag-ong KauswaganBag-ong TabogonBalugoCabganCalolotDimalinaoFabian (Balucot)GabunonHappy Valley (Pob.)KapalaranLibatoLimamawanLower LiasanLower Lodiong (Pob.)Lower TiparakLower UsoganMaya-mayaNew Village (Pob.)PelocobanRiverside (Pob.)Sagrada FamiliaSan JoseSan VicenteSumaligTuluanTungawanUpper LiasonUpper LodiongUpper Tiparak
T IGBAOT IGBAOT IGBAOT IGBAOT IGBAO BegongBusolCalumaDiana CountrysideGuinlinLacarayanLacupayanLibayoyLimasLongmotMaragangMateNangan-nanganNew TuburanNiloTigbaoTimolanUpper Nilo
1583169193114179659016119397905697080
000000002001010
0.00.00.00.00.00.00.00.01.20.00.01.10.01.40.0
31532722263313141440191491914
000000000000000
0.00.00.00.00.00.00.00.00.00.00.00.00.00.00.0
193384111119149220811021942281131086898399
000000002000000
0.00.00.00.00.00.00.00.01.00.00.00.00.00.00.0
941148642167202105601251931536177363819712984381437714210262763611161204231166
012023011000110000000011801810000
0.09.50.04.51.80.00.91.60.00.00.01.61.30.00.00.00.00.00.00.00.00.715.00.01.32.20.90.00.00.00.0
15171383134151224382811115333121572613242151464201651032
0102000000000000000000100000000
0.05.60.020.00.00.00.00.00.00.00.00.00.00.00.00.00.00.00.00.00.00.04.50.00.00.00.00.00.00.00.0
117140100561942391237314323318774974748229160101441799716511473884271451424837198
22004000100890001056000123330003
1.71.40.00.02.10.00.00.00.70.00.010.89.30.00.00.00.60.011.43.40.00.00.016.43.40.72.10.00.00.01.5
31164666792979079121114195107101681162466070
0000001221210030000
0.00.00.00.00.00.01.121.80.81.70.50.00.04.20.00.00.00.0
507121318151512222327922132742413
000000010100000000
0.00.00.00.00.00.00.07.70.04.20.00.00.00.00.00.00.00.0
368837690106128113100148141225133116781432957485
0432110002148134100000
0.04.83.92.20.97.80.00.01.49.93.60.829.312.80.00.00.00.0

394
The Many Faces of Poverty (Volume 3)
Table 1. Health and Nutrition Indicators, by Barangay, Province of Zamboanga del Sur, 2006-2009
Munic ipal i tyMunic ipal i tyMunic ipal i tyMunic ipal i tyMunic ipal i ty Ba r anga yBa ranga yBa ranga yBa ranga yBa ranga y Number ofNumber ofNumber ofNumber ofNumber ofch i ld rench i ld rench i ld rench i ld rench i ld ren
(0-5(0-5(0-5(0-5(0-5years old)years old)years old)years old)years old)
Malnour ishedMalnour ishedMalnour ishedMalnour ishedMalnour ishedch i ld rench i ld rench i ld rench i ld rench i ld ren
(0-5 years old)(0-5 years old)(0-5 years old)(0-5 years old)(0-5 years old)
PrPrPrPrProporoporoporoporopor t iont iont iont iont ion
Chi ldren underChi ldren underChi ldren underChi ldren underChi ldren under5 years old5 years old5 years old5 years old5 years old
who diedwho diedwho diedwho diedwho died
Number ofNumber ofNumber ofNumber ofNumber ofch i ld rench i ld rench i ld rench i ld rench i ld renunder 1under 1under 1under 1under 1year oldyear oldyear oldyear oldyear old
Women deathsWomen deathsWomen deathsWomen deathsWomen deathsdue to pregnancy-due to pregnancy-due to pregnancy-due to pregnancy-due to pregnancy-
related causesrelated causesrelated causesrelated causesrelated causes
Magn i tudeMagn i tudeMagn i tudeMagn i tudeMagn i tude Magn i tudeMagn i tudeMagn i tudeMagn i tudeMagn i tude P rP rP rP rP r opo ropo ropo ropo ropo r t i ont iont iont iont ion Magn i tudeMagn i tudeMagn i tudeMagn i tudeMagn i tude PrPrPrPrProporoporoporoporopor tiontiontiontiontion
Number ofNumber ofNumber ofNumber ofNumber ofch i ld rench i ld rench i ld rench i ld rench i ld renunder 5under 5under 5under 5under 5
years oldyears oldyears oldyears oldyears old
TUKURANTUKURANTUKURANTUKURANTUKURAN AlindahawBaclayBalimbinganBuenasuerteCamangaCurvadaLaperianLiber tadLower BayaoLuy-aManilanManlayagMilitarNavalanPanduma SeniorSambulawanSan AntonioSan Carlos (Pob.)Santo Niño (Pob.)Santo RosarioSugodTabuanTaguloTinotunganUpper Bayao
VINCENZO SAGUNVINCENZO SAGUNVINCENZO SAGUNVINCENZO SAGUNVINCENZO SAGUN AmbulonBui-osCogonDananKabatanKapataganLimasonLinoguayanLumbalLunibMaculayMarayaSagucanWaling-waling
257155389218118421354106926711824417331016742242777271061477611883
2010111010100000117000220
0.80.02.60.00.50.50.50.00.90.01.50.00.00.00.00.02.30.40.90.00.00.02.61.70.0
42256193942341211310214131533084216381535152514
0000001000001000000010000
0.00.00.00.00.00.02.90.00.00.00.00.02.40.00.00.00.00.00.00.06.30.00.00.00.0
3091934511722322026164117109771382932053811915130094232136190102140104
37622674370011014308173518925491022301
12.03.14.422.23.11.814.20.00.00.913.010.110.23.94.518.335.33.02.712.56.65.321.621.41.0
809812820128711913886124132115125111168
22118011701022
2.42.00.80.52.70.00.71.15.30.00.90.01.81.2
2218244477242621252112261549
00012110010000
0.00.00.02.22.54.03.70.00.04.50.00.00.00.0
89119150237339143167103148165150151138198
1301112154615414244122
14.60.07.35.14.42.83.614.62.78.516.02.68.71.0

The Many Faces of Poverty (Volume 3)
395
Map 7. Proportion of Households Living in Makeshift Housing, by Municipality,2006-2009
Map 8. Proportion of Households Living in Makeshift Housing, by Barangay, 2006-2009
DUMINGAG
MIDSALIP
MAHAYAG
AURORA
TUKURAN
LABANGAN
PAGADIAN CITY
SAN PABLO
GUIPOS
DINAS
TABINAPITOGO
DIMATALINGVINCENZO A. SAGUN
MARGOSATUBIG
LAPUYAN
KUMALARANG
BAYOGLAKEWOOD
RAMON MAGSAYSAY
SOMINOT
MOLAVE
JOSEFINA
TAMBULIG
DUMALINAO
TIGBAO
SAN MIGUEL
3.12.3
4.8
8.1
2.8
6.1
8.4
4.1
2.23.6
1.9
4.714.4
5.12.9
8.5 4.9 3.8
4.44.83.9
1.9
3.93.3
1.3
CBMS Poverty Maps: Zamboanga del Sur
M unic ip a l it y M ag ni t ud e P ro p o r t io nTigbao 462 14 .4
Kumalarang 337 8.5
Tukuran 611 8.4
Josef ina 143 8.1
A urora 570 6.1
B ayog 245 5.1Guipos 176 4.9San M iguel 157 4.8M o lave 411 4.8Pagadian Cit y 773 4.7San Pablo 154 4.4Ramon M agsaysay 202 4.1V incenzo Sagun 151 3.9Lapuyan 173 3.9Dumalinao 209 3.8M idsalip 196 3.6Pitogo 111 3.3Dumingag 242 3.1Lakewood 96 2.9Tambulig 176 2.8M ahayag 195 2.3Somino t 67 2.2Labangan 127 1.9M argosatub ig 121 1.9Tab ina 53 1.3
Ho useho ld s l iving in makeshi f t ho using
M unicip al i t y B ar a ng ay M a g ni t ud e P r o p o r t io n
San Pablo M abuhay 6 1 92 .4
M idsalip New Kat ip unan 104 8 1.3
Tigb ao Timolan 8 5 80 .2Kumalarang Guso m 71 71.7
Pag adian Cit y Palp alan 74 6 0.7Tigb ao B uso l 53 57.0
Pag adian Cit y B aloyb oan 6 9 56 .6
Tukuran Sambulawan 128 49 .4Tigb ao Limas 8 1 4 7.1
M o lave Silang it 6 3 43 .8
B o t t o m 10 B ar ang ay s

396
The Many Faces of Poverty (Volume 3)
Map 10. Proportion of Households who are Informal Settlers, by Barangay, 2006-2009
Map 9. Proportion of Households who are Informal Settlers,by Municipality, 2006-2009
DUMINGAG
MIDSALIP
MAHAYAG
AURORA
TUKURAN
LABANGAN
PAGADIAN CITY
SAN PABLO
GUIPOS
DINAS
TABINAPITOGO
DIMATALINGVINCENZO A. SAGUN
MARGOSATUBIG
LAPUYAN
KUMALARANG
BAYOGLAKEWOOD
RAMON MAGSAYSAY
SOMINOT
MOLAVE
JOSEFINA
TAMBULIG
DUMALINAO
TIGBAO
SAN MIGUEL
2.41.4
2.3
2.4
5.1
2.0
2.8
3.12.5
4.1
6.1 2.5
6.6
5.5
7.0
4.4
4.1
4.4
2.6
5.4
1.4
3.6
3.2
2.32.2
CBMS Poverty Maps: Zamboanga del Sur
M unic ip a l i t y M ag ni t ud e P ro p o r t io nGuipos 255 7.0
Lakewood 219 6.6
Pagad ian Cit y 989 6.1
Tigbao 174 5.5
M argosatubig 347 5.4
Tambulig 312 5.1San M iguel 143 4.4B ayog 210 4.4Labangan 272 4.1Kumalarang 159 4.1San Pablo 124 3.6Dumalinao 174 3.2Somino t 92 3.1Ramon M agsaysay 137 2.8Lapuyan 113 2.6M idsalip 136 2.5Tukuran 180 2.5Josef ina 42 2.4Dumingag 181 2.4M o lave 198 2.3Tabina 94 2.3Pitogo 72 2.2A urora 187 2.0V incenzo Sagun 55 1.4M ahayag 121 1.4
Ho useho ld s w ho are inf o rmal se t t le rs
M u ni c i p a l i t y B a r a n g a y M a g ni t u d e P r o p o r t i o n
Tamb ulig A ng eles 10 0 4 8 .1
Pag ad ian C it y San Ped ro (Po b .) 10 9 4 1.3
Guip o s D at ag an 52 3 9 .1Guip o s D ag o ho y 4 7 3 8 .8
Lakewo o d B aking 9 5 3 7.4Guip o s M ag t ing 2 5 3 4 .2
Tig b ao B uso l 3 0 3 2 .3
Kumalarang M ahayahay 3 5 3 2 .1San M ig uel Lap er ian 3 0 2 7.5
D uming ag Suno p 17 2 3 .0
B o t t o m 10 B a r a n g a y s

The Many Faces of Poverty (Volume 3)
397
Map 11. Proportion of Households without Access to Safe Water Supply,by Municipality, 2006-2009
Map 12. Proportion of Households without Access to Safe Water Supply,by Barangay, 2006-2009
DUMINGAG
MIDSALIP
MAHAYAG
AURORA
TUKURAN
LABANGAN
PAGADIAN CITY
SAN PABLO
GUIPOS
DINAS
TABINAPITOGO
DIMATALINGVINCENZO A. SAGUN
MARGOSATUBIG
LAPUYAN
KUMALARANG
BAYOGLAKEWOOD
RAMON MAGSAYSAY
SOMINOT
MOLAVE
JOSEFINA
TAMBULIG
DUMALINAO
TIGBAO
SAN MIGUEL
21.120.0
14.6
17.6
25.920.2
47.530.8
20.028.6
18.6
27.9
14.1
30.5 9.4 20.2
15.9
26.7
16.7
14.335.0
19.9
26.2
20.2
14.9
CBMS Poverty Maps: Zamboanga del Sur
M unic ip a li t y M ag ni t ud e Pr o p o r t io nSomino t 1426 47.5
Pitogo 1144 35.0
M idsalip 1652 30.8
Tigbao 969 30.5
B ayog 1360 28.6
San M iguel 894 27.9San Pablo 943 26.7M argosatub ig 1693 26.2Tambulig 1599 25.9Dumingag 1645 21.1Lapuyan 897 20.2Ramon M agsaysay 987 20.2Tukuran 1466 20.2Lakewood 663 20.0M ahayag 1717 20.0V incenzo Sagun 766 19.9Kumalarang 732 18.6Josef ina 309 17.6Dumalinao 904 16.7A urora 1481 15.9Labangan 999 14.9M o lave 1249 14.6Tab ina 602 14.3Guipos 510 14.1Pagadian Cit y 1526 9 .4
Ho useho ld s w i t ho ut access t o sa f e w at er sup p ly
M u n i c i p a l i t y B a r a n g a y M a g n i t u d e P r o p o r t i o n
T ig b ao Lacar ay an 110 10 0 .0
M ahayagB ag - o ng D alag uet e 9 7 10 0 .0
Pi t o g o T o ng ao 8 5 10 0 .0
T amb uligU p p er Lo d io ng 8 4 10 0 .0
M id salip Piw an 8 0 10 0 .0
So mino tB ag - o ng B aro y 73 10 0 .0
T ukur anSant o R o sar io 54 10 0 .0
A ur o r a N ap o 4 2 10 0 .0
M ar g o sat ub ig Ig at Is land 3 15 9 9 .4
M ahayag M alub o 152 9 9 .3Pi t o g o Punt a F lecha 2 6 8 9 9 .3
B o t t o m 11 B a r a n g a y s

398
The Many Faces of Poverty (Volume 3)
Map 14. Proportion of Households without Access to Sanitary Toilet Facilities,by Barangay, 2006-2009
Map 13. Proportion of Households without Access to Sanitary Toilet Facilities,by Barangay, 2006-2009
DUMINGAG
MIDSALIP
MAHAYAG
AURORA
TUKURAN
LABANGAN
PAGADIAN CITY
SAN PABLO
GUIPOS
DINAS
TABINAPITOGO
DIMATALINGVINCENZO A. SAGUN
MARGOSATUBIG
LAPUYAN
KUMALARANG
BAYOGLAKEWOOD
RAMON MAGSAYSAY
SOMINOT
MOLAVE
JOSEFINA
TAMBULIG
DUMALINAO
TIGBAO
SAN MIGUEL
19.217.8
17.6
20.4
35.526.0
35.041.3
21.2
26.6 26.1
31.7
21.120.0
27.2
14.5 25.3
50.030.140.3
11.9
18.9
35.519.3
33.4
CBMS Poverty Maps: Zamboanga del Sur
M unic ip a l it y M ag ni t ud e P ro p o r t io nSan Pablo 1759 50 .0
M idsalip 2240 41.3
Lapuyan 1783 40.3
Tambulig 2199 35.5
Pitogo 1187 35.5
Somino t 1044 35.0Kumalarang 1250 33.4Tukuran 2298 31.7San M iguel 974 30.1Tigbao 869 27.2Labangan 1789 26.6A urora 2423 26.1Ramon M agsaysay 1269 26.0Dumalinao 1374 25.3Pagadian Cit y 3466 21.2Lakewood 707 21.1Josef ina 350 20.4B ayog 950 20.0Tab ina 813 19 .3Dumingag 1485 19 .2M argosatub ig 1221 18 .9M ahayag 1525 17.8M o lave 1510 17.6Guipos 525 14 .5V incenzo Sagun 458 11.9
Ho useho ld s w i t ho ut access t o sani t a ry t o ile t f ac i li t y
M un i c i p a l i t y B a r a ng a y M a g ni t u d e P r o p o r t i o n
M id sal ip Piw an 8 0 10 0 .0
Tamb ulig A ng eles 2 0 8 9 9 .5
Kumalarang B ualan 14 1 9 7.9
Tuk uran B al imb ing an 6 1 9 6 .8
M id sal ip Pil i 8 7 9 6 .7
M id sal ip B alo nai 2 4 5 9 6 .5
Tuk uran Sant o R o sar io 52 9 6 .3
San Pab lo Kali lang an 71 9 5.9
Tamb ulig C ab g an 2 8 3 9 5.9
San Pab lo T icala Is land 53 9 3 .0
B o t t o m 10 B a r a n g a y s
The Many Faces of Poverty (Volume 3)
399
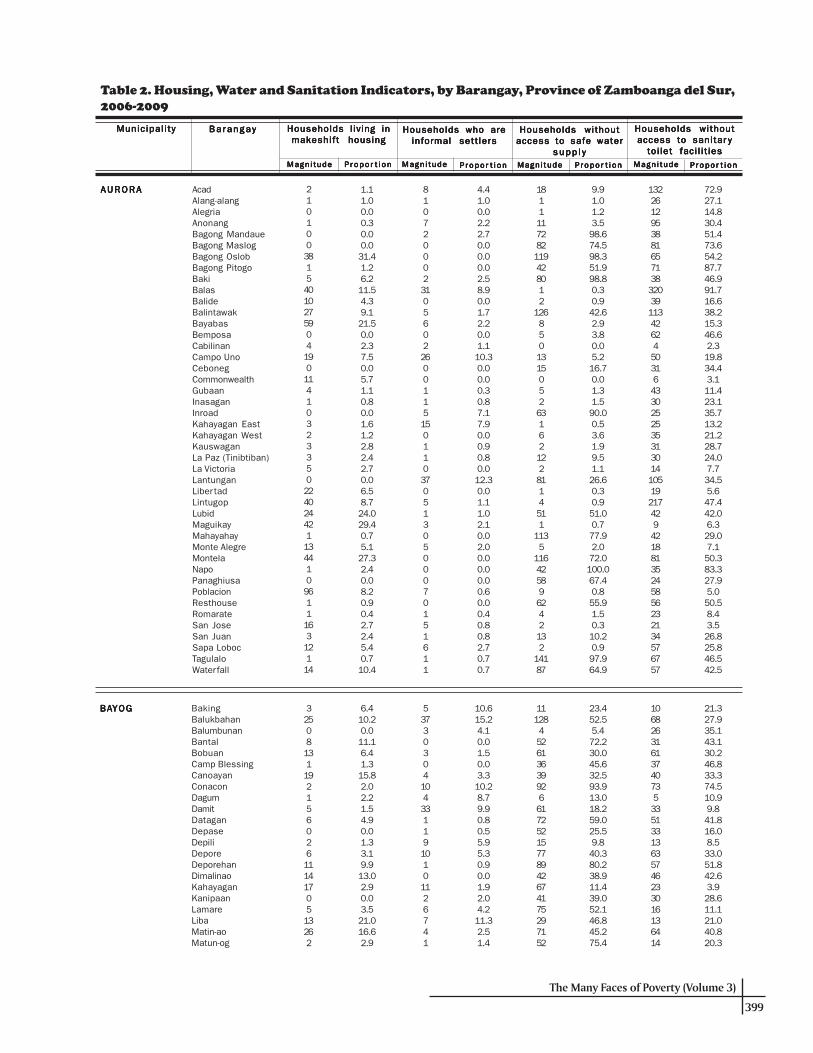
Table 2. Housing, Water and Sanitation Indicators, by Barangay, Province of Zamboanga del Sur,2006-2009
Households l iv ing inHouseholds l iv ing inHouseholds l iv ing inHouseholds l iv ing inHouseholds l iv ing inmakeshift housingmakeshift housingmakeshift housingmakeshift housingmakeshift housing
Households who areHouseholds who areHouseholds who areHouseholds who areHouseholds who areinformal sett lersinformal sett lersinformal sett lersinformal sett lersinformal sett lers
Households withoutHouseholds withoutHouseholds withoutHouseholds withoutHouseholds withoutaccess to safe wateraccess to safe wateraccess to safe wateraccess to safe wateraccess to safe water
supp l ysupp l ysupp l ysupp l ysupp l y
Households withoutHouseholds withoutHouseholds withoutHouseholds withoutHouseholds withoutaccess to sanitaraccess to sanitaraccess to sanitaraccess to sanitaraccess to sanitar yyyyy
toi let faci l i t iestoi let faci l i t iestoi let faci l i t iestoi let faci l i t iestoi let faci l i t ies
Ba ranga yBa ranga yBa ranga yBa ranga yBa ranga yMunic ipal i tyMunic ipal i tyMunic ipal i tyMunic ipal i tyMunic ipal i ty
P rP rP rP rP r opo ropo ropo ropo ropo r t i o nt i o nt i o nt i o nt i o nP rP rP rP rP r opo ropo ropo ropo ropo r t i o nt i o nt i o nt i o nt i o n P rP rP rP rP r opo ropo ropo ropo ropo r t i o nt i o nt i o nt i o nt i o n P rP rP rP rP r opo ropo ropo ropo ropo r t i o nt i o nt i o nt i o nt i o nMagn i tudeMagn i tudeMagn i tudeMagn i tudeMagn i tude Magn i tudeMagn i tudeMagn i tudeMagn i tudeMagn i tude Magn i tudeMagn i tudeMagn i tudeMagn i tudeMagn i tude Magn i tudeMagn i tudeMagn i tudeMagn i tudeMagn i tude
AURORAAURORAAURORAAURORAAURORA AcadAlang-alangAlegriaAnonangBagong MandaueBagong MaslogBagong OslobBagong PitogoBakiBalasBalideBalintawakBayabasBemposaCabilinanCampo UnoCebonegCommonwealthGubaanInasaganInroadKahayagan EastKahayagan WestKauswaganLa Paz (Tinibtiban)La VictoriaLantunganLiber tadLintugopLubidMaguikayMahayahayMonte AlegreMontelaNapoPanaghiusaPoblacionResthouseRomarateSan JoseSan JuanSapa LobocTagulaloWaterfall
BABABABABAYOGYOGYOGYOGYOG BakingBalukbahanBalumbunanBantalBobuanCamp BlessingCanoayanConaconDagumDamitDataganDepaseDepiliDeporeDeporehanDimalinaoKahayaganKanipaanLamareLibaMatin-aoMatun-og
2101003815401027590419011410323350224024421134410961116312114
1.11.00.00.30.00.031.41.26.211.54.39.121.50.02.37.50.05.71.10.80.01.61.22.82.42.70.06.58.724.029.40.75.127.32.40.08.20.90.42.72.45.40.710.4
810720002310560226001151501103705130500070151611
4.41.00.02.22.70.00.00.02.58.90.01.72.20.01.110.30.00.00.30.87.17.90.00.90.80.012.30.01.11.02.10.02.00.00.00.00.60.00.40.80.82.70.70.7
1811117282119428012
1268501315052631621228114511
1135
116425896242132
14187
9.91.01.23.598.674.598.351.998.80.30.942.62.93.80.05.216.70.01.31.590.00.53.61.99.51.126.60.30.951.00.777.92.072.0100.067.40.855.91.50.310.20.997.964.9
132261295388165713832039113426245031643302525353130141051921742942188135245856232134576757
72.927.114.830.451.473.654.287.746.991.716.638.215.346.62.319.834.43.111.423.135.713.221.228.724.07.734.55.647.442.06.329.07.150.383.327.95.050.58.43.526.825.846.542.5
325081311921560261114170513262
6.410.20.011.16.41.315.82.02.21.54.90.01.33.19.913.02.90.03.521.016.62.9
537303041043311910101126741
10.615.24.10.01.50.03.310.28.79.90.80.55.95.30.90.01.92.04.211.32.51.4
1112845261363992661725215778942674175297152
23.452.55.472.230.045.632.593.913.018.259.025.59.840.380.238.911.439.052.146.845.275.4
1068263161374073533513313635746233016136414
21.327.935.143.130.246.833.374.510.99.841.816.08.533.051.842.63.928.611.121.040.820.3

400
The Many Faces of Poverty (Volume 3)
Table 2. Housing, Water and Sanitation Indicators, by Barangay, Province of Zamboanga del Sur,2006-2009
Households l iv ing inHouseholds l iv ing inHouseholds l iv ing inHouseholds l iv ing inHouseholds l iv ing inmakeshift housingmakeshift housingmakeshift housingmakeshift housingmakeshift housing
Households who areHouseholds who areHouseholds who areHouseholds who areHouseholds who areinformal sett lersinformal sett lersinformal sett lersinformal sett lersinformal sett lers
Households withoutHouseholds withoutHouseholds withoutHouseholds withoutHouseholds withoutaccess to safe wateraccess to safe wateraccess to safe wateraccess to safe wateraccess to safe water
supp l ysupp l ysupp l ysupp l ysupp l y
Households withoutHouseholds withoutHouseholds withoutHouseholds withoutHouseholds withoutaccess to sanitaraccess to sanitaraccess to sanitaraccess to sanitaraccess to sanitar yyyyy
toi let faci l i t iestoi let faci l i t iestoi let faci l i t iestoi let faci l i t iestoi let faci l i t ies
Ba ranga yBa ranga yBa ranga yBa ranga yBa ranga yMunic ipal i tyMunic ipal i tyMunic ipal i tyMunic ipal i tyMunic ipal i ty
P rP rP rP rP r opo ropo ropo ropo ropo r t i o nt i o nt i o nt i o nt i o nP rP rP rP rP r opo ropo ropo ropo ropo r t i o nt i o nt i o nt i o nt i o n P rP rP rP rP r opo ropo ropo ropo ropo r t i o nt i o nt i o nt i o nt i o n P rP rP rP rP r opo ropo ropo ropo ropo r t i o nt i o nt i o nt i o nt i o nMagn i tudeMagn i tudeMagn i tudeMagn i tudeMagn i tude Magn i tudeMagn i tudeMagn i tudeMagn i tudeMagn i tude Magn i tudeMagn i tudeMagn i tudeMagn i tudeMagn i tude Magn i tudeMagn i tudeMagn i tudeMagn i tudeMagn i tude
BABABABABAYOGYOGYOGYOGYOG Pangi (San Isidro)PoblacionPulang BatoSalawaganSigacadSupon
DUMALINAODUMALINAODUMALINAODUMALINAODUMALINAO AnonangBagaBag-ong MisamisBag-ong SilaoBaloboanBanta-aoBibilikCalingayanCamaligCamangaCuatro-cuatroLocubanMalasikMama (San Juan)Matab-angMecolongMetokongMotosawaPag-asa (Pob.)Paglaum (Pob.)PantadPiniglibanoRebokonSan AgustinSibucaoSumadatTikwasTinaTubo-PaitUpper Dumalinao
DUMINGAGDUMINGAGDUMINGAGDUMINGAGDUMINGAG Bagong KauswaganBagong SilangBag-ong ValenciaBucayanCalumanggiCanibonganCaridadDanluganDapiwakDatu TotocanDiludDitulanDulianDulopGuintanananGuitranGumpinganLa FortunaLabangonLiber tadLicabangLipawanLower LandingLower TimonanMacasingMahayahayMalagaladManlabayMaralagMarangan
1508151
1.26.17.30.55.00.9
323121703
3.52.811.09.10.02.6
44433834515
51.25.234.91.644.613.0
17473515227
19.85.732.18.021.86.1
4201001103401100113532123201301361000
20.70.02.60.00.01.30.40.02.714.712.20.00.00.71.018.05.91.97.97.40.00.80.50.05.11.50.40.00.00.0
460941901206111042210173312151611421
2.03.60.05.83.21.33.90.00.90.70.03.28.90.70.021.63.90.90.03.93.02.40.21.25.93.94.12.21.80.9
3922565025759102131030004238936812974047773730
1.553.865.83.94.60.00.943.553.237.421.354.50.00.00.021.65.983.22.015.71.023.611.70.01.61.728.520.42.70.0
77533511047133322710563764101173371733749501387070401212478
37.931.292.10.88.159.558.124.424.33.762.219.752.067.81.038.272.515.92.08.549.040.721.941.427.39.74.46.73.670.9
061613186330250341111513128811071212
0.08.710.90.92.915.32.22.81.70.01.32.70.00.73.84.82.11.02.65.30.51.52.33.11.00.50.02.93.47.1
0220008110228114621304466101156
0.02.91.40.00.00.03.00.95.81.21.34.31.10.23.82.64.51.01.60.01.93.01.72.41.00.01.30.41.43.5
5139158
111028797968122019096159431273644716173016496113
6.818.86.113.97.894.10.025.745.748.244.76.522.747.391.46.518.841.766.51.230.334.84.66.729.48.165.32.50.37.6
146106214697273342732351884917144394753123222146520141136
1.466.76.85.620.440.03.366.145.120.717.817.439.847.054.47.429.843.049.52.925.19.09.28.713.932.827.05.93.221.3

The Many Faces of Poverty (Volume 3)
401
Table 2. Housing, Water and Sanitation Indicators, by Barangay, Province of Zamboanga del Sur,2006-2009
Households l iv ing inHouseholds l iv ing inHouseholds l iv ing inHouseholds l iv ing inHouseholds l iv ing inmakeshift housingmakeshift housingmakeshift housingmakeshift housingmakeshift housing
Households who areHouseholds who areHouseholds who areHouseholds who areHouseholds who areinformal sett lersinformal sett lersinformal sett lersinformal sett lersinformal sett lers
Households withoutHouseholds withoutHouseholds withoutHouseholds withoutHouseholds withoutaccess to safe wateraccess to safe wateraccess to safe wateraccess to safe wateraccess to safe water
supp l ysupp l ysupp l ysupp l ysupp l y
Households withoutHouseholds withoutHouseholds withoutHouseholds withoutHouseholds withoutaccess to sanitaraccess to sanitaraccess to sanitaraccess to sanitaraccess to sanitar yyyyy
toi let faci l i t iestoi let faci l i t iestoi let faci l i t iestoi let faci l i t iestoi let faci l i t ies
Ba ranga yBa ranga yBa ranga yBa ranga yBa ranga yMunic ipal i tyMunic ipal i tyMunic ipal i tyMunic ipal i tyMunic ipal i ty
P rP rP rP rP r opo ropo ropo ropo ropo r t i o nt i o nt i o nt i o nt i o nP rP rP rP rP r opo ropo ropo ropo ropo r t i o nt i o nt i o nt i o nt i o n P rP rP rP rP r opo ropo ropo ropo ropo r t i o nt i o nt i o nt i o nt i o n P rP rP rP rP r opo ropo ropo ropo ropo r t i o nt i o nt i o nt i o nt i o nMagn i tudeMagn i tudeMagn i tudeMagn i tudeMagn i tude Magn i tudeMagn i tudeMagn i tudeMagn i tudeMagn i tude Magn i tudeMagn i tudeMagn i tudeMagn i tudeMagn i tude Magn i tudeMagn i tudeMagn i tudeMagn i tudeMagn i tude
DUMINGAGDUMINGAGDUMINGAGDUMINGAGDUMINGAG New BasakSaadSalvadorSan JuanSan Pablo (Pob.)San Pedro (Pob.)San VicenteSenoteSinonokSunopTagunTamurayanUpper LandingUpper Timonan
GU IPOSGUIPOSGUIPOSGUIPOSGUIPOS Bagong OroquietaBaguitanBalongatingCanunanDacsolDagohoyDalapangDataganGulingKatipunanLintumLitanMagtingPoblacion (Guipos)ReglaSikatunaSingclot
JOSEF INAJOSEF INAJOSEF INAJOSEF INAJOSEF INA Bogo CalabatDawa (Diwa)EbarleGumahan (Pob.)LeonardoLitapanLower Bagong TudelaMansanasMoradjiNemeñoNopulanSebukangTagaytay HillUpper Bagong Tudela
KUMALARANGKUMALARANGKUMALARANGKUMALARANGKUMALARANG BogayoBolisongBoyugan EastBoyugan WestBualanDiploGawilGusomKitaan DagatLantawanLimamawanMahayahayPangiPicananPoblacionSalagmanokSecadeSuminalum
201042520208203211
10.38.82.14.81.22.92.50.07.12.70.04.00.95.1
281201420020173025
14.50.91.00.03.63.00.01.50.023.05.20.00.92.3
22358272916418158291947233
1.020.230.164.37.12.351.360.451.839.232.262.710.11.4
165102147128572334190346
0.557.053.133.31.71.810.042.520.445.932.20.015.02.8
919104001
116003022001
3.07.30.30.03.80.00.00.835.50.00.03.00.03.60.00.00.7
111781004755274151525138108
3.76.62.32.90.038.82.939.12.11.911.815.234.22.15.112.55.3
13765834079121
1244440231428
0.314.318.62.332.10.046.20.80.60.597.644.454.83.80.652.55.3
1463830501762567423505031202713
4.724.32.38.747.214.036.542.12.11.918.150.568.55.112.733.88.6
925020400015122362
5.315.50.06.93.70.00.00.019.71.71.33.55.821.2
47422702614021
2.44.46.20.71.88.10.01.57.91.72.60.03.80.3
103850063671424019438
60.65.076.90.05.53.512.25.118.43.425.833.382.72.7
2725387121783524304091167
15.915.758.52.411.019.816.325.568.651.725.815.821.222.9
10002207111104424
1811611
0.50.00.00.01.40.40.071.77.62.40.039.31.41.118.79.90.60.5
152121170160003520237686
7.01.60.61.10.73.70.017.80.00.00.032.114.26.50.73.75.03.0
02376064267108100
11414610666472
0.017.84.33.40.01.320.767.775.02.40.00.082.641.41.041.039.835.3
255275118141536846602119647993178783941
11.840.345.766.797.912.734.785.244.851.230.257.157.226.519.648.424.222.2

402
The Many Faces of Poverty (Volume 3)
LABANGANLABANGANLABANGANLABANGANLABANGAN BagalupaBalimbinganBinayanBokongBulanitCogonanComboDalapangDimasangcaDipayaLangapodLantianLower Campo IslamLower PulacanLower Sang-anNew LabanganNoboranOld LabanganSan IsidroSanta CruzTapodocTawagan NorteUpper Campo IslamUpper PulacanUpper Sang-an
LAKEWOODLAKEWOODLAKEWOODLAKEWOODLAKEWOOD Bagong KahayagBakingBiswanganBululawanDagumGasaGatubLukuanMatalangPoblacion (Lakewood)Sapang PinolesSebugueyTiwalesTubod
LAPUYLAPUYLAPUYLAPUYLAPUYANANANANAN BulawanCarpocDangananDansalDumaraLinokmadalumLuananLubusanMahalingebMandegMaralagMaruingMolumPampangPantadPingalayPoblacionSalambuyanSan JoseSayogTabonTalababTiguhaTininghalangTipasanTugaya
Table 2. Housing, Water and Sanitation Indicators, by Barangay, Province of Zamboanga del Sur,2006-2009
Households l iv ing inHouseholds l iv ing inHouseholds l iv ing inHouseholds l iv ing inHouseholds l iv ing inmakeshift housingmakeshift housingmakeshift housingmakeshift housingmakeshift housing
Households who areHouseholds who areHouseholds who areHouseholds who areHouseholds who areinformal sett lersinformal sett lersinformal sett lersinformal sett lersinformal sett lers
Households withoutHouseholds withoutHouseholds withoutHouseholds withoutHouseholds withoutaccess to safe wateraccess to safe wateraccess to safe wateraccess to safe wateraccess to safe water
supp l ysupp l ysupp l ysupp l ysupp l y
Households withoutHouseholds withoutHouseholds withoutHouseholds withoutHouseholds withoutaccess to sanitaraccess to sanitaraccess to sanitaraccess to sanitaraccess to sanitar yyyyy
toi let faci l i t iestoi let faci l i t iestoi let faci l i t iestoi let faci l i t iestoi let faci l i t ies
Ba ranga yBa ranga yBa ranga yBa ranga yBa ranga yMunic ipal i tyMunic ipal i tyMunic ipal i tyMunic ipal i tyMunic ipal i ty
P rP rP rP rP r opo ropo ropo ropo ropo r t i o nt i o nt i o nt i o nt i o nP rP rP rP rP r opo ropo ropo ropo ropo r t i o nt i o nt i o nt i o nt i o n P rP rP rP rP r opo ropo ropo ropo ropo r t i o nt i o nt i o nt i o nt i o n P rP rP rP rP r opo ropo ropo ropo ropo r t i o nt i o nt i o nt i o nt i o nMagn i tudeMagn i tudeMagn i tudeMagn i tudeMagn i tude Magn i tudeMagn i tudeMagn i tudeMagn i tudeMagn i tude Magn i tudeMagn i tudeMagn i tudeMagn i tudeMagn i tude Magn i tudeMagn i tudeMagn i tudeMagn i tudeMagn i tude
0617301215030523710310318496
0.02.50.52.21.00.09.40.34.10.09.31.50.81.14.20.30.01.44.01.30.51.51.81.32.7
81661231111325671820530181537921315
5.66.72.93.810.20.30.84.01.73.11.92.17.57.43.110.07.37.31.23.04.30.40.54.52.3
03435354763140425454190972471889511311120820
0.015.016.710.915.321.70.812.235.333.316.85.70.03.34.90.719.190.038.047.90.52.09.311.90.0
135314841242438378628915343572240114138747154243281034
7.322.06.726.340.985.364.823.951.754.948.012.623.88.124.238.157.035.428.323.31.07.912.914.81.8
10040075290610034
3.00.01.90.00.07.12.440.30.00.70.90.00.05.9
119510141010501571149
3.337.44.70.43.210.14.96.90.01.86.11.40.98.7
59054108925361353981379107
1.535.425.04.270.625.317.518.196.411.90.93.768.718.7
7246401961575523544741369462
21.618.118.67.949.657.626.631.951.95.736.043.981.711.0
13120233741103511405501910209513
5.24.70.01.34.92.47.92.41.29.42.51.47.52.90.03.65.110.71.30.02.60.03.13.60.83.8
111502035506010656701019030
0.40.40.93.30.01.70.01.86.04.70.01.70.00.70.04.35.83.90.01.50.01.43.20.02.50.0
379569173511193325159152361
1934543609317387
14.737.55.059.111.528.512.411.438.823.612.625.435.42.19.50.719.925.35.355.40.012.210.85.132.59.0
3780929822712457334549178369736112260464136501480608346
14.731.676.763.636.759.227.334.338.842.541.249.924.570.857.180.626.726.054.755.464.918.927.843.870.359.0

The Many Faces of Poverty (Volume 3)
403
Bag-ong BalambanBag-ong DalagueteBoniaoDelusomDiwanGuripanKaangayanKabuhiLourmahLower Salug DakuLower Santo NiñoMaluboManguilesMarabanan (Balanan)PanagaanParaisoPedaganPoblacionPugwanSan IsidroSan JoseSan VicenteSanta CruzSicpaoTuboranTulanTumapicUpper Salug DakuUpper Santo Niño
MAHAMAHAMAHAMAHAMAHAYYYYYAGAGAGAGAG
MARGOSATUBIGMARGOSATUBIGMARGOSATUBIGMARGOSATUBIGMARGOSATUBIG BalintawakBularongDigonGuinimananIgat IslandJosefinaKalianKolotLimabatongLimamawanLumbogMagahisPoblacionSaguaTalanusaTiguianTulapoc
MIDSALIPMIDSALIPMIDSALIPMIDSALIPMIDSALIP BacahanBalonaiBibilopBuloronCabaloranCanipay NorteCanipay SurCumaronDakayakanDuelicDumalinaoEcuanGolictopGuinabotGuitalosGumaKahayaganLicuro-anLumpunid
21
11510611010800110025116000200013
0.71.039.20.40.02.33.20.00.30.03.10.00.00.80.30.00.02.10.50.21.30.00.00.01.20.00.00.03.3
51001910311402227054116001000100
1.61.00.00.00.43.40.30.00.93.01.50.00.81.70.73.80.04.50.52.60.00.00.50.00.00.00.40.00.0
8973
184426342159001
15218110225461358610141041701651170
2.6100.01.075.417.924.012.259.60.00.00.499.371.586.488.233.343.20.732.30.03.168.90.511.29.850.50.43.70.0
167513429249410914423219752162656634752110151254070528664641
5.277.345.711.910.335.732.45.212.88.87.349.08.352.521.736.142.06.211.116.511.316.619.711.231.985.12.624.310.5
144174200350791325
0.72.11.70.82.22.60.40.00.01.31.20.03.00.62.70.51.6
292474707491
198515433
1.34.80.93.32.22.61.40.02.41.72.20.87.53.10.912.610.4
16817011931513163501772913351319111294166
10.743.130.099.299.484.012.374.661.012.33.228.24.955.899.121.952.4
144551513935318
12132119
58372
10262
9.323.92.112.544.022.46.011.941.713.62.77.322.24.31.823.819.6
20161081501412000004
1.00.00.51.75.64.10.72.40.00.53.11.41.20.00.00.00.00.01.9
13231010311035311016854
6.30.81.42.95.71.50.70.50.01.63.94.40.61.00.012.213.35.31.9
89205342561714495086341380871425456
43.483.716.37.234.53.69.623.998.055.12.362.123.60.080.60.870.069.225.9
252454932137422463461354375237324287437
12.296.523.69.277.821.316.430.790.270.73.153.632.32.967.618.346.778.717.1
Table 2. Housing, Water and Sanitation Indicators, by Barangay, Province of Zamboanga del Sur,2006-2009
Households l iv ing inHouseholds l iv ing inHouseholds l iv ing inHouseholds l iv ing inHouseholds l iv ing inmakeshift housingmakeshift housingmakeshift housingmakeshift housingmakeshift housing
Households who areHouseholds who areHouseholds who areHouseholds who areHouseholds who areinformal sett lersinformal sett lersinformal sett lersinformal sett lersinformal sett lers
Households withoutHouseholds withoutHouseholds withoutHouseholds withoutHouseholds withoutaccess to safe wateraccess to safe wateraccess to safe wateraccess to safe wateraccess to safe water
supp l ysupp l ysupp l ysupp l ysupp l y
Households withoutHouseholds withoutHouseholds withoutHouseholds withoutHouseholds withoutaccess to sanitaraccess to sanitaraccess to sanitaraccess to sanitaraccess to sanitar yyyyy
toi let faci l i t iestoi let faci l i t iestoi let faci l i t iestoi let faci l i t iestoi let faci l i t ies
Ba ranga yBa ranga yBa ranga yBa ranga yBa ranga yMunic ipal i tyMunic ipal i tyMunic ipal i tyMunic ipal i tyMunic ipal i ty
P rP rP rP rP r opo ropo ropo ropo ropo r t i o nt i o nt i o nt i o nt i o nP rP rP rP rP r opo ropo ropo ropo ropo r t i o nt i o nt i o nt i o nt i o n P rP rP rP rP r opo ropo ropo ropo ropo r t i o nt i o nt i o nt i o nt i o n P rP rP rP rP r opo ropo ropo ropo ropo r t i o nt i o nt i o nt i o nt i o nMagn i tudeMagn i tudeMagn i tudeMagn i tudeMagn i tude Magn i tudeMagn i tudeMagn i tudeMagn i tudeMagn i tude Magn i tudeMagn i tudeMagn i tudeMagn i tudeMagn i tude Magn i tudeMagn i tudeMagn i tudeMagn i tudeMagn i tude

404
The Many Faces of Poverty (Volume 3)
MIDSALIPMIDSALIPMIDSALIPMIDSALIPMIDSALIP MatalangNew KatipunanNew UnidosPaliliPawanPiliPisomponganPiwanPoblacion APoblacion BSigapodTimbaboyTulbongTuluan
MOLAMOLAMOLAMOLAMOLAVEVEVEVEVE AliciaAriosaBagong ArgaoBagong GutlangBlanciaBogo CapalaranCuloDalaonDipoloDontulanGonosanLower DimalinaoLower DimorokMabuhayMadasigon (Pob.)Makuguihon (Pob.)Maloloy-on (Pob.)MiliganParasanRizalSanto RosarioSilangitSimataSudlonUpper Dimorok
PPPPPAGADIAN CITYAGADIAN CITYAGADIAN CITYAGADIAN CITYAGADIAN CITY AlegriaBalangasan (Pob.)BalintawakBaloyboanBanaleBogoBombaBuenavistaBulatokBulawanDampalanDanluganDaoDataganDeborokDitorayDumagocGatas (Pob.)GubacGubangKagawasanKahayaganKalasanKawitLa SuerteLalaLapidianLenienza
Table 2. Housing, Water and Sanitation Indicators, by Barangay, Province of Zamboanga del Sur,2006-2009
Households l iv ing inHouseholds l iv ing inHouseholds l iv ing inHouseholds l iv ing inHouseholds l iv ing inmakeshift housingmakeshift housingmakeshift housingmakeshift housingmakeshift housing
Households who areHouseholds who areHouseholds who areHouseholds who areHouseholds who areinformal sett lersinformal sett lersinformal sett lersinformal sett lersinformal sett lers
Households withoutHouseholds withoutHouseholds withoutHouseholds withoutHouseholds withoutaccess to safe wateraccess to safe wateraccess to safe wateraccess to safe wateraccess to safe water
supp l ysupp l ysupp l ysupp l ysupp l y
Households withoutHouseholds withoutHouseholds withoutHouseholds withoutHouseholds withoutaccess to sanitaraccess to sanitaraccess to sanitaraccess to sanitaraccess to sanitar yyyyy
toi let faci l i t iestoi let faci l i t iestoi let faci l i t iestoi let faci l i t iestoi let faci l i t ies
Ba ranga yBa ranga yBa ranga yBa ranga yBa ranga yMunic ipal i tyMunic ipal i tyMunic ipal i tyMunic ipal i tyMunic ipal i ty
P rP rP rP rP r opo ropo ropo ropo ropo r t i o nt i o nt i o nt i o nt i o nP rP rP rP rP r opo ropo ropo ropo ropo r t i o nt i o nt i o nt i o nt i o n P rP rP rP rP r opo ropo ropo ropo ropo r t i o nt i o nt i o nt i o nt i o n P rP rP rP rP r opo ropo ropo ropo ropo r t i o nt i o nt i o nt i o nt i o nMagn i tudeMagn i tudeMagn i tudeMagn i tudeMagn i tude Magn i tudeMagn i tudeMagn i tudeMagn i tudeMagn i tude Magn i tudeMagn i tudeMagn i tudeMagn i tudeMagn i tude Magn i tudeMagn i tudeMagn i tudeMagn i tudeMagn i tude
11041040100390100
0.581.31.40.03.70.00.60.00.09.70.00.50.00.0
201400009451633
1.10.01.42.40.00.00.00.02.91.01.97.93.32.7
781271210971891088041741100
46.799.216.264.565.798.964.3100.01.34.21.55.40.00.0
12624431187387129801838185496278
69.618.858.169.867.096.776.8100.05.89.669.324.667.472.9
30514343275120751361319213112631558
0.00.02.10.78.71.03.320.72.40.02.86.60.91.30.71.73.05.414.20.42.143.80.410.74.7
0532818515179230431152995328392
0.02.41.318.33.71.31.64.71.81.71.20.03.61.30.12.04.62.32.31.22.25.61.11.81.2
96.342.96.432.00.26.30.658.30.281.091.340.87.34.00.40.30.30.07.80.820.238.252.58.80.6
701532012637122581646956881965191123925237481241032339
36.672.28.582.47.530.66.045.613.948.334.925.059.18.40.11.66.16.410.52.751.186.136.54.522.7
1849115491256
211194230318932201721955148451
4272569713423025746124720310004240010
3.71.69.856.61.20.67.59.80.01.44.218.11.00.52.82.57.70.02.70.50.00.00.04.22.90.00.02.7
6275122270111515554110841340180
157108127
5.51.62.00.83.71.215.64.73.70.74.21.29.10.51.40.09.63.02.72.00.09.60.016.57.43.112.01.9
116120022823023026135249201059205220271127620025
10.43.678.118.013.717.50.413.56.597.120.22.20.30.014.336.20.20.04.510.60.014.423.42.845.60.00.06.7
2710211517115412944751181554838731330138654
1372
30780674745
24.86.144.913.919.224.074.120.012.70.768.113.58.118.69.919.035.53.034.531.04.473.34.330.958.425.847.012.1

The Many Faces of Poverty (Volume 3)
405
PPPPPAGADIAN CITYAGADIAN CITYAGADIAN CITYAGADIAN CITYAGADIAN CITY Lizon ValleyLumadLumbiaMacasingMangaMuricayNapolanPalpalanPedulonanPoloyaganSan Francisco (Pob.)San Jose (Pob.)San Pedro (Pob.)Santa Lucia (Pob.)Santa MariaSantiago (Pob.)Santo NiñoTawagan SurTigumaTuburan (Pob.)TulanganTulawasWhite Beach
P ITOGOP ITOGOP ITOGOP ITOGOP ITOGO BalabawanBalong-balongColojoLiasanLiguacLimbayanLower Paniki-anMatin-aoPanubiganPoblacion (Pitogo)Punta FlechaSan IsidroSugbay DosTongaoUpper Paniki-an
RAMON MAGSARAMON MAGSARAMON MAGSARAMON MAGSARAMON MAGSAYSAYSAYSAYSAYSAYYYYY Bagong OponBambong DakuBambong DiutBobonganCampo IVCampo VCanianganDipalusanEastern BobonganEsperanzaGapasanKatipunanKauswaganLower SambulawanMabiniMagsaysayMalatingParadisePasingkalanPoblacionSan FernandoSanto RosarioSapa AndingSinaguingSwitchUpper LaperianWakat
Table 2. Housing, Water and Sanitation Indicators, by Barangay, Province of Zamboanga del Sur,2006-2009
Households l iv ing inHouseholds l iv ing inHouseholds l iv ing inHouseholds l iv ing inHouseholds l iv ing inmakeshift housingmakeshift housingmakeshift housingmakeshift housingmakeshift housing
Households who areHouseholds who areHouseholds who areHouseholds who areHouseholds who areinformal sett lersinformal sett lersinformal sett lersinformal sett lersinformal sett lers
Households withoutHouseholds withoutHouseholds withoutHouseholds withoutHouseholds withoutaccess to safe wateraccess to safe wateraccess to safe wateraccess to safe wateraccess to safe water
supp l ysupp l ysupp l ysupp l ysupp l y
Households withoutHouseholds withoutHouseholds withoutHouseholds withoutHouseholds withoutaccess to sanitaraccess to sanitaraccess to sanitaraccess to sanitaraccess to sanitar yyyyy
toi let faci l i t iestoi let faci l i t iestoi let faci l i t iestoi let faci l i t iestoi let faci l i t ies
Ba ranga yBa ranga yBa ranga yBa ranga yBa ranga yMunic ipal i tyMunic ipal i tyMunic ipal i tyMunic ipal i tyMunic ipal i ty
P rP rP rP rP r opo ropo ropo ropo ropo r t i o nt i o nt i o nt i o nt i o nP rP rP rP rP r opo ropo ropo ropo ropo r t i o nt i o nt i o nt i o nt i o n P rP rP rP rP r opo ropo ropo ropo ropo r t i o nt i o nt i o nt i o nt i o n P rP rP rP rP r opo ropo ropo ropo ropo r t i o nt i o nt i o nt i o nt i o nMagn i tudeMagn i tudeMagn i tudeMagn i tudeMagn i tude Magn i tudeMagn i tudeMagn i tudeMagn i tudeMagn i tude Magn i tudeMagn i tudeMagn i tudeMagn i tudeMagn i tude Magn i tudeMagn i tudeMagn i tudeMagn i tudeMagn i tude
33144051607400543110463013488421
24017725811206491091785714372316092
6.40.03.72.70.720.40.30.82.70.03.76.641.39.910.311.83.320.81.82.60.04.11.6
8.80.69.60.01.95.60.060.70.00.03.00.51.16.40.09.50.70.01.07.97.319.20.8
144438100621404132221114958215321160
38.52.58.238.023.90.413.233.64.14.31.20.30.40.61.310.21.246.11.25.80.97.3
2234375170651287601531179920
16128905284850
60.32.58.019.426.022.732.862.30.031.91.81.539.354.40.033.40.54.57.18.57.321.840.7
3341912130102023724
1.11.03.40.55.90.59.22.70.07.90.70.06.24.211.5
16124026460101533
0.42.00.91.02.60.011.43.61.20.00.40.04.11.81.4
01746030437
144101983
2680
1148517
0.057.851.315.028.13.462.990.219.92.499.30.031.0100.08.2
501406611047619070185076461017669
17.946.756.455.030.729.939.362.537.70.028.138.327.445.833.2
02011311550531061000101181811714880
0.015.212.81.23.833.10.05.21.62.62.50.40.00.00.00.70.00.68.73.20.815.30.41.83.55.50.0
10322818330535223701193223311152
9.82.32.30.82.710.92.13.10.01.31.21.82.32.44.54.60.00.69.20.51.71.81.21.44.810.33.1
1536995418482333379227845481312011315110404312451
14.727.310.53.71.72.412.749.51.18.513.628.225.692.96.036.011.67.758.320.112.499.116.119.50.416.977.3
564631547943368028645951352645523444354849445475284429
54.934.836.022.427.125.927.183.314.716.524.318.341.731.069.234.449.326.317.08.540.839.621.834.112.330.343.9

406
The Many Faces of Poverty (Volume 3)
SAN MIGUELSAN MIGUELSAN MIGUELSAN MIGUELSAN MIGUEL BetinanBulawanCalubeConcepcionDao-anDumalianFatimaLangilanLantawanLaperianLibugananLimonanMatiOcapanPoblacionSan IsidroSayogTapian
SAN PSAN PSAN PSAN PSAN PABLOABLOABLOABLOABLO Bag-ong MisamisBubualButonCulasianDaplayanKalilanganKapamanokKondumLumbayaoMabuhayMarcos VillageMiasinMolansongPantadPaoPayagPoblacion (San Pablo)PongapongSacbulanSagasanSan JuanSeniorSonggoyTandubuayTaniapanTicala IslandTubo-paitVillakapa
SOMINOTSOMINOTSOMINOTSOMINOTSOMINOT Bag-ong BaroyBag-ong OroquietaBarubuhanBulanayDataganEastern PoblacionLantawanLiber tadLumangoyNew CarmenPicturanPoblacionRizalSan MiguelSanto NiñoSawaTungawanUpper Sicpao
Table 2. Housing, Water and Sanitation Indicators, by Barangay, Province of Zamboanga del Sur,2006-2009
Households l iv ing inHouseholds l iv ing inHouseholds l iv ing inHouseholds l iv ing inHouseholds l iv ing inmakeshift housingmakeshift housingmakeshift housingmakeshift housingmakeshift housing
Households who areHouseholds who areHouseholds who areHouseholds who areHouseholds who areinformal sett lersinformal sett lersinformal sett lersinformal sett lersinformal sett lers
Households withoutHouseholds withoutHouseholds withoutHouseholds withoutHouseholds withoutaccess to safe wateraccess to safe wateraccess to safe wateraccess to safe wateraccess to safe water
supp l ysupp l ysupp l ysupp l ysupp l y
Households withoutHouseholds withoutHouseholds withoutHouseholds withoutHouseholds withoutaccess to sanitaraccess to sanitaraccess to sanitaraccess to sanitaraccess to sanitar yyyyy
toi let faci l i t iestoi let faci l i t iestoi let faci l i t iestoi let faci l i t iestoi let faci l i t ies
Ba ranga yBa ranga yBa ranga yBa ranga yBa ranga yMunic ipal i tyMunic ipal i tyMunic ipal i tyMunic ipal i tyMunic ipal i ty
P rP rP rP rP r opo ropo ropo ropo ropo r t i o nt i o nt i o nt i o nt i o nP rP rP rP rP r opo ropo ropo ropo ropo r t i o nt i o nt i o nt i o nt i o n P rP rP rP rP r opo ropo ropo ropo ropo r t i o nt i o nt i o nt i o nt i o n P rP rP rP rP r opo ropo ropo ropo ropo r t i o nt i o nt i o nt i o nt i o nMagn i tudeMagn i tudeMagn i tudeMagn i tudeMagn i tude Magn i tudeMagn i tudeMagn i tudeMagn i tudeMagn i tude Magn i tudeMagn i tudeMagn i tudeMagn i tudeMagn i tude Magn i tudeMagn i tudeMagn i tudeMagn i tudeMagn i tude
11303600370002421552112
0.76.60.03.01.80.00.027.20.00.00.07.11.00.69.52.24.33.6
21437172803022311019158
1.40.53.23.02.212.46.96.10.027.51.96.80.56.23.31.12.014.5
10812317213900
113374762135233292621
77.763.40.871.34.065.20.083.125.342.757.439.81.220.40.39.910.338.2
2276878868510705155331162911364224124
15.83.653.577.226.561.633.352.234.950.030.634.214.370.211.124.216.243.6
0001213113615201291115103070520
0.00.00.00.61.21.316.01.22.792.43.71.30.00.51.66.72.70.74.00.70.03.50.03.50.08.62.50.0
241512815210011265018201825113000
2.64.32.42.97.310.77.72.40.90.00.07.23.03.14.70.04.51.40.011.84.36.01.90.51.80.00.00.0
78016162247913552412671
100151458411640504414567938
98.70.038.10.637.632.040.715.150.036.40.717.08.60.580.611.23.440.632.810.583.358.880.00.52.396.698.843.7
63622695987159981175311045598447725187862865457973536873
79.768.161.953.759.495.930.410.573.625.839.071.955.630.167.735.118.035.770.256.258.377.481.839.141.293.086.183.9
010001201931820404031
0.01.20.00.00.06.30.018.83.411.31.80.02.40.02.30.01.00.4
51039125224217402123
7.11.20.021.40.61.05.12.02.32.51.80.24.15.30.04.94.01.3
7315815017749485761391042216570231314671
100.01.241.481.597.825.74.084.285.486.993.73.797.692.113.331.748.530.1
2055052146307328671209559243623011889
27.86.235.728.380.715.773.027.775.379.585.610.014.247.41.273.239.538.5

The Many Faces of Poverty (Volume 3)
407
TAB INATAB INATAB INATAB INATAB INA Abong-abongBaganianBaya-bayaCapisanConcepcionCulabayDoña JosefinaLumbiaMabuhayMalimManikaanNew OroquietaPoblacionSan FranciscoTultolan
TAMBUL IGTAMBUL IGTAMBUL IGTAMBUL IGTAMBUL IG Alang-alangAngelesBag-ong KauswaganBag-ong TabogonBalugoCabganCalolotDimalinaoFabian (Balucot)GabunonHappy Valley (Pob.)KapalaranLibatoLimamawanLower LiasanLower Lodiong (Pob.)Lower TiparakLower UsoganMaya-mayaNew Village (Pob.)PelocobanRiverside (Pob.)Sagrada FamiliaSan JoseSan VicenteSumaligTuluanTungawanUpper LiasonUpper LodiongUpper Tiparak
T IGBAOT IGBAOT IGBAOT IGBAOT IGBAO BegongBusolCalumaDiana CountrysideGuinlinLacarayanLacupayanLibayoyLimasLongmotMaragangMateNangan-nanganNew TuburanNiloTigbaoTimolanUpper Nilo
Table 2. Housing, Water and Sanitation Indicators, by Barangay, Province of Zamboanga del Sur,2006-2009
Households l iv ing inHouseholds l iv ing inHouseholds l iv ing inHouseholds l iv ing inHouseholds l iv ing inmakeshift housingmakeshift housingmakeshift housingmakeshift housingmakeshift housing
Households who areHouseholds who areHouseholds who areHouseholds who areHouseholds who areinformal sett lersinformal sett lersinformal sett lersinformal sett lersinformal sett lers
Households withoutHouseholds withoutHouseholds withoutHouseholds withoutHouseholds withoutaccess to safe wateraccess to safe wateraccess to safe wateraccess to safe wateraccess to safe water
supp l ysupp l ysupp l ysupp l ysupp l y
Households withoutHouseholds withoutHouseholds withoutHouseholds withoutHouseholds withoutaccess to sanitaraccess to sanitaraccess to sanitaraccess to sanitaraccess to sanitar yyyyy
toi let faci l i t iestoi let faci l i t iestoi let faci l i t iestoi let faci l i t iestoi let faci l i t ies
Ba ranga yBa ranga yBa ranga yBa ranga yBa ranga yMunic ipal i tyMunic ipal i tyMunic ipal i tyMunic ipal i tyMunic ipal i ty
P rP rP rP rP r opo ropo ropo ropo ropo r t i o nt i o nt i o nt i o nt i o nP rP rP rP rP r opo ropo ropo ropo ropo r t i o nt i o nt i o nt i o nt i o n P rP rP rP rP r opo ropo ropo ropo ropo r t i o nt i o nt i o nt i o nt i o n P rP rP rP rP r opo ropo ropo ropo ropo r t i o nt i o nt i o nt i o nt i o nMagn i tudeMagn i tudeMagn i tudeMagn i tudeMagn i tude Magn i tudeMagn i tudeMagn i tudeMagn i tudeMagn i tude Magn i tudeMagn i tudeMagn i tudeMagn i tudeMagn i tude Magn i tudeMagn i tudeMagn i tudeMagn i tudeMagn i tude
4221030043022822
1.20.41.20.80.00.90.00.01.30.80.01.42.82.11.5
115255532511123322
3.41.01.23.82.31.52.21.31.73.00.61.43.42.11.5
843715516110341967361656354041
25.57.08.839.227.73.025.412.222.39.89.140.03.541.731.5
5696455230692115386253471762726
17.018.426.540.313.720.515.79.612.516.930.133.617.528.420.5
11000182072131171003454020121141828139
7.00.00.00.07.20.70.08.00.80.37.313.81.00.00.00.91.53.46.50.01.80.08.30.912.63.21.02.81.43.63.0
1100062001148374957071565111631222211611
0.648.10.07.38.00.04.74.53.312.31.07.34.97.60.02.16.04.18.13.70.92.22.10.91.83.91.00.31.47.13.7
1185125657803804070
1012760370024298000
439187072841
0.688.599.279.331.10.01.390.91.70.01.60.099.027.885.710.90.00.03.21.330.92.90.00.00.077.394.90.098.6100.00.3
12089916228310467356541169449433772957215422476264441194263552
0.699.578.61.224.795.943.776.114.620.89.613.092.250.561.410.92.719.691.96.847.48.132.65.623.478.460.414.586.366.30.7
525319270130813110255160850
8.757.01.09.221.80.09.20.047.11.40.40.80.028.423.515.080.20.0
533020206374902344711
8.932.32.00.01.60.04.22.84.11.93.20.02.13.41.812.10.90.8
86802886981100
112221114105562163212
14.587.028.087.879.0100.00.099.112.850.915.80.056.770.50.516.21.99.4
1083449298172223345943831633420742418
18.237.049.029.665.365.515.529.526.243.113.523.764.938.69.219.022.614.2

408
The Many Faces of Poverty (Volume 3)
TUKURANTUKURANTUKURANTUKURANTUKURAN
VINCENZO SAGUNVINCENZO SAGUNVINCENZO SAGUNVINCENZO SAGUNVINCENZO SAGUN AmbulonBui-osCogonDananKabatanKapataganLimasonLinoguayanLumbalLunibMaculayMarayaSagucanWaling-waling
Table 2. Housing, Water and Sanitation Indicators, by Barangay, Province of Zamboanga del Sur,2006-2009
Households l iv ing inHouseholds l iv ing inHouseholds l iv ing inHouseholds l iv ing inHouseholds l iv ing inmakeshift housingmakeshift housingmakeshift housingmakeshift housingmakeshift housing
Households who areHouseholds who areHouseholds who areHouseholds who areHouseholds who areinformal sett lersinformal sett lersinformal sett lersinformal sett lersinformal sett lers
Households withoutHouseholds withoutHouseholds withoutHouseholds withoutHouseholds withoutaccess to safe wateraccess to safe wateraccess to safe wateraccess to safe wateraccess to safe water
supp l ysupp l ysupp l ysupp l ysupp l y
Households withoutHouseholds withoutHouseholds withoutHouseholds withoutHouseholds withoutaccess to sanitaraccess to sanitaraccess to sanitaraccess to sanitaraccess to sanitar yyyyy
toi let faci l i t iestoi let faci l i t iestoi let faci l i t iestoi let faci l i t iestoi let faci l i t ies
Ba ranga yBa ranga yBa ranga yBa ranga yBa ranga yMunic ipal i tyMunic ipal i tyMunic ipal i tyMunic ipal i tyMunic ipal i ty
P rP rP rP rP r opo ropo ropo ropo ropo r t i o nt i o nt i o nt i o nt i o nP rP rP rP rP r opo ropo ropo ropo ropo r t i o nt i o nt i o nt i o nt i o n P rP rP rP rP r opo ropo ropo ropo ropo r t i o nt i o nt i o nt i o nt i o n P rP rP rP rP r opo ropo ropo ropo ropo r t i o nt i o nt i o nt i o nt i o nMagn i tudeMagn i tudeMagn i tudeMagn i tudeMagn i tude Magn i tudeMagn i tudeMagn i tudeMagn i tudeMagn i tude Magn i tudeMagn i tudeMagn i tudeMagn i tudeMagn i tude Magn i tudeMagn i tudeMagn i tudeMagn i tudeMagn i tude
94300835403231311626
128621228020612
2.316.60.00.02.110.31.30.01.61.225.41.83.019.51.149.47.24.116.10.01.00.03.50.51.1
197213134113201355003676143404
4.92.73.26.70.30.91.31.00.51.81.60.03.51.60.90.00.00.64.711.16.81.12.30.02.3
663591913312971010
13012046123272707191954657147644
1.524.393.797.48.63.531.397.10.076.998.427.933.28.55.20.085.517.60.6
100.031.62.58.135.525.3
12610061344533968410239741459062215625194400529345549546
32.839.196.817.311.89.730.980.856.023.260.787.924.519.640.323.961.418.228.296.350.015.931.244.626.4
AlindahawBaclayBalimbinganBuenasuerteCamangaCurvadaLaperianLiber tadLower BayaoLuy-aManilanManlayagMilitarNavalanPanduma SeniorSambulawanSan AntonioSan Carlos (Pob.)Santo Niño (Pob.)Santo RosarioSugodTabuanTaguloTinotunganUpper Bayao
100221423168443371
0.60.00.00.43.715.21.18.14.316.41.91.23.50.3
0150125852100331
0.00.51.90.02.11.82.92.51.13.80.01.21.50.3
1310162782311530331031621122148
7.445.723.816.54.14.01.815.217.638.69.98.561.042.7
311253615892630284524162342
17.75.420.412.910.23.29.615.214.916.914.86.511.512.1

The Many Faces of Poverty (Volume 3)
409
Map 15. Proportion of Children 6-12 years old Not Attending Elementary School,by Municipality, 2006-2009
Map 16. Proportion of Children 6-12 years old Not Attending Elementary School,by Barangay, 2006-2009
DUMINGAG
MIDSALIP
MAHAYAG
AURORA
TUKURAN
LABANGAN
PAGADIAN CITY
SAN PABLO
GUIPOS
DINAS
TABINAPITOGO
DIMATALINGVINCENZO A. SAGUN
MARGOSATUBIG
LAPUYAN
KUMALARANG
BAYOGLAKEWOOD
RAMON MAGSAYSAY
SOMINOT
MOLAVE
JOSEFINA
TAMBULIG
DUMALINAO
TIGBAO
SAN MIGUEL
37.229.3
24.9
23.0
28.9
24.3
17.5
22.420.1
29.0
37.330.3
21.8 21.7
25.1
23.116.0
20.620.836.3
29.0
23.6
22.718.4
22.0
DUMINGAG
MIDSALIP
MAHAYAG
AURORA
TUKURAN
LABANGAN
PAGADIAN CITY
SAN PABLO
GUIPOS
DINAS
TABINAPITOGO
DIMATALINGVINCENZO A. SAGUN
MARGOSATUBIG
LAPUYAN
KUMALARANG
BAYOGLAKEWOOD
RAMON MAGSAYSAY
SOMINOT
MOLAVE
JOSEFINA
TAMBULIG
DUMALINAO
TIGBAO
SAN MIGUEL
37.2 29.3
24.9
23.0
28.9
24.3
17.5
22.420.1
29.0
37.330.3
21.8 21.7
25.1
23.116.0
20.620.836.3
29.0
23.6
22.718.4
22.0
CBMS Poverty Maps: Zamboanga del Sur
M unic ip a l i t y M ag ni t ud e P ro p o r t io nLakewood 1245 37.3
Dumingag 2843 37.2
Lapuyan 1548 36 .3
B ayog 1351 30 .3
M ahayag 2239 29 .3
Kumalarang 1120 29 .0M idsalip 1615 29 .0Tambulig 1570 28 .9Labangan 1528 25.1M o lave 1752 24 .9A urora 1901 24 .3M argosatubig 1181 23 .6Dumalinao 1076 23.1Josef ina 354 23 .0V incenzo Sagun 704 22 .7Ramon M agsaysay 889 22 .4Tabina 837 22 .0Tigbao 689 21.8Pagad ian Cit y 2923 21.7San M iguel 592 20 .8San Pablo 622 20 .6Somino t 509 20.1Pitogo 507 18 .4Tukuran 1073 17.5Guipos 487 16 .0
C hi ld ren no t at t end ing e lement ary scho o l
( 6 - 12 year s o ld )
M unic ip a l it y B ar a ng ay M a g ni t ud e P r o p o r t io n
Duming ag Labang on 178 84 .8
M ahayag Panag aan 165 77.5
Duming ag Canibo ngan 115 73 .2
Duming ag Dilud 102 71.3
Lakewo od Tiwales 9 4 71.2
Duming ag Danlug an 91 71.1
Duming ag La Fortuna 9 3 71.0
Duming ag Dulian 8 3 68 .6Lakewo od M atalang 8 0 67.8
San Pablo Senior 51 65.4
B o t t o m 10 B ar ang a ys

410
The Many Faces of Poverty (Volume 3)
CBMS Poverty Maps: Zamboanga del Sur
Map 18. Proportion of Children 13-16 years old Not Attending High School,by Barangay, 2006-2009
Map 17. Proportion of Children 13-16 years old Not Attending High School,by Municipality, 2006-2009
DUMINGAG
MIDSALIP
MAHAYAG
AURORA
TUKURAN
LABANGAN
PAGADIAN CITY
SAN PABLO
GUIPOS
DINAS
TABINAPITOGO
DIMATALINGVINCENZO A. SAGUN
MARGOSATUBIG
LAPUYAN
KUMALARANG
BAYOGLAKEWOOD
RAMON MAGSAYSAY
SOMINOT
MOLAVE
JOSEFINA
TAMBULIG
DUMALINAO
TIGBAO
SAN MIGUEL
58.048.0
43.8
48.5
50.041.762.6
57.0
43.1
42.4
47.5
41.9
62.956.7
57.0
59.3
65.9 55.8
45.8 46.9
49.6
47.837.648.0
48.5
M unic ip a l it y M ag ni t ud e P ro p o r t io nLapuyan 1476 65.9
Lakewood 1208 62.9
M idsalip 1867 62.6
Kumalarang 1406 59 .3
Dumingag 2549 58 .0
Somino t 847 57.0Tigbao 979 57.0B ayog 1464 56.7San M iguel 932 55.8Tambulig 1619 50 .0San Pablo 851 49.6Josef ina 408 48.5M argosatub ig 1492 48.5M ahayag 2160 48.0V incenzo Sagun 892 48.0Pitogo 734 47.8Labangan 1644 47.5Dumalinao 1224 46.9Guipos 857 45.8M o lave 1866 43.8A urora 2029 43.1Tukuran 1509 42.4Pagadian Cit y 3254 41.9Ramon M agsaysay 1010 41.7Tab ina 795 37.6
C hi ld ren no t at t end ing hig h scho o l ( 13 - 16 years o ld )
M unicip al i t y B arang ay M ag ni t ud e Pro p o r t io n
M idsalip Balonai 125 99.2
Lakewood M atalang 77 98.7
Lakewood Dagum 69 95.8
San Pablo Ticala Island 22 95.7
Dumingag Saad 61 95.3
Bayog Balukbahan 136 95.1
M idsalip Piwan 33 94.3
Dumingag Labangon 93 93.9Dumingag Dilud 72 93.5
Dumingag Canibongan 68 91.9
B o t t o m 10 B arang ays

The Many Faces of Poverty (Volume 3)
411
Map 19. Proportion of Children 6-16 years old Not Attending School,by Municipality, 2006-2009
Map 20. Proportion of Children 6-16 years old Not Attending School,by Barangay, 2006-2009
DUMINGAG
MIDSALIP
MAHAYAG
AURORA
TUKURAN
LABANGAN
PAGADIAN CITY
SAN PABLO
GUIPOS
DINAS
TABINAPITOGO
DIMATALINGVINCENZO A. SAGUN
MARGOSATUBIG
LAPUYAN
KUMALARANG
BAYOGLAKEWOOD
RAMON MAGSAYSAY
SOMINOT
MOLAVE
JOSEFINA
TAMBULIG
DUMALINAO
TIGBAO
SAN MIGUEL
30.522.0
15.6
14.0
21.2
17.2
13.3
16.2
16.823.1
18.0
13.7
24.026.1
14.7
11.6 15.6
14.6
13.911.915.5
18.8
27.4 16.3
21.0
CBMS Poverty Maps: Zamboanga del Sur
M unic ip a l it y M ag ni t ud e P ro p o r t io nDumingag 3675 30.5
Lapuyan 1784 27.4
B ayog 1839 26.1
Lakewood 1264 24.0
M idsalip 1977 23.1
M ahayag 2676 22.0Tambulig 1839 21.2Kumalarang 1309 21.0M argosatub ig 1520 18 .8Labangan 1714 18 .0A urora 2160 17.2Somino t 677 16 .8San M iguel 736 16 .3Ramon M agsaysay 1038 16 .2Dumalinao 1131 15.6M o lave 1759 15.6V incenzo Sagun 771 15.5Tigbao 716 14 .7San Pablo 690 14 .6Josef ina 333 14 .0Pitogo 596 13 .9Pagadian Cit y 2920 13 .7Tukuran 1286 13 .3Tab ina 703 11.9Guipos 573 11.6
C hi ld ren no t at t end ing scho o l ( 6 - 16 years o ld )
M unic ip a l i t y B arang ay M ag ni t ud e Pro p o r t io n
Dumingag Labangon 251 81.2
Dumingag Canibongan 169 73.2
Dumingag La Fortuna 139 73.2
M ahayag Panagaan 267 70.6
Dumingag Dilud 153 69 .5
Dumingag Dulian 129 69.4
Dumingag Danlugan 143 69 .1
Lakewood Tiwales 124 64.9Bayog Balukbahan 210 63 .1
San Pablo Senio r 74 60.2
B o t t o m 10 B arang ays