CBI Trade Statistics: Grains and Pulses in Europe Trade Statistics: Grains and Pulses in ......
26
CBI Trade Statistics: Grains and Pulses in Europe
Transcript of CBI Trade Statistics: Grains and Pulses in Europe Trade Statistics: Grains and Pulses in ......
CBI | Market Intelligence Product Factsheet Cloves in Germany | 1
CBI Trade Statistics:
Grains and Pulses in Europe

CBI | Market Intelligence Trade Statistics Grains and Pulses in Europe | 2
Introduction
Cereals, seeds and pulses are generally major commodities that are widely cultivated and traded within the European
Union (EU). The supply market for major staple foods is very locally oriented, with relatively stable levels of supply and
demand. Opportunities for small and medium-sized suppliers from developing countries are best found in smaller-scale
products, product differentiation (organic) and specific consumer trends (healthy, authentic, gluten-free). It is important to
note, however, that smaller niche markets are accompanied by greater risk and volatility.
Import
Cereals
EU Import of cereals in millions of tons (incl. wheat, rice and corn)
Source: Eurostat (Comext); figure created by ICI Business
*Statistics for ‘EU’ refer to the EU-28 member states
*Developing countries are defined by the OECD DAC list of 2014
Largest EU importers of Cereals (2014) in millions of tons
Source: Eurostat (Comext); figure created by ICI Business
0
10
20
30
40
50
60
2010 2011 2012 2013 2014Developing countries EU Other
0
2
4
6
8
10
12
14
Developing countries EU Other
CBI | Market Intelligence Trade Statistics Grains and Pulses in Europe | 3
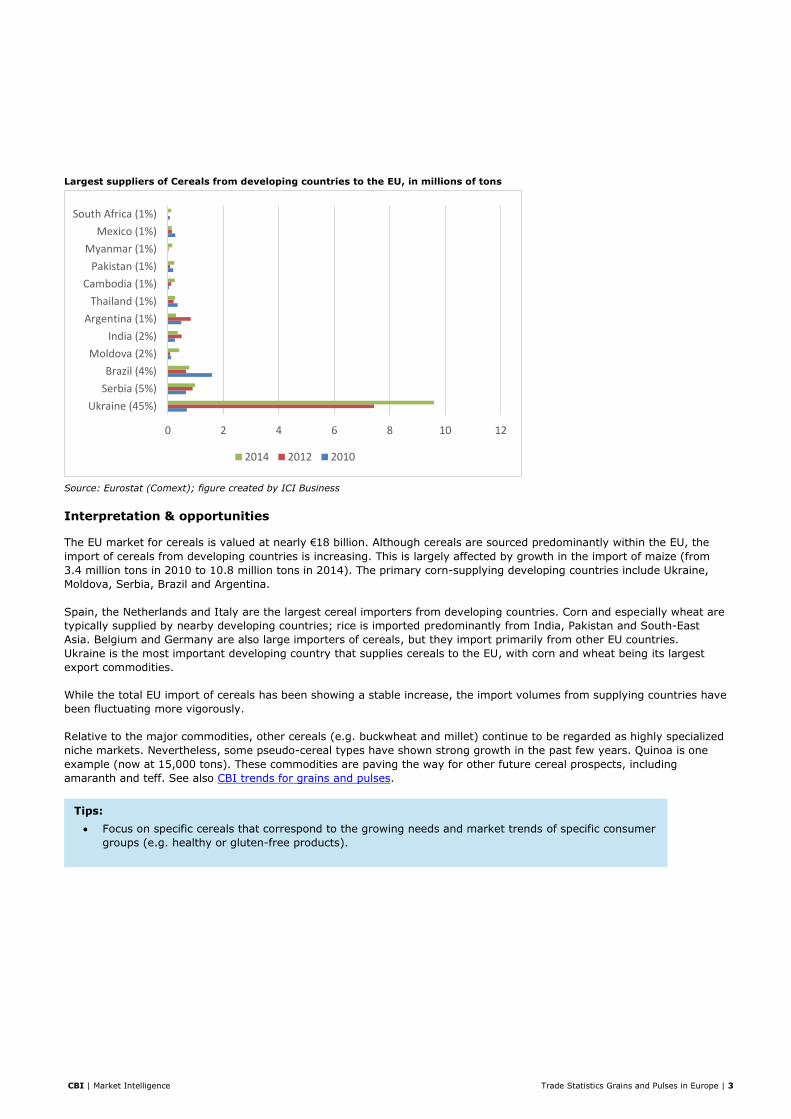
Largest suppliers of Cereals from developing countries to the EU, in millions of tons
Source: Eurostat (Comext); figure created by ICI Business
Interpretation & opportunities
The EU market for cereals is valued at nearly €18 billion. Although cereals are sourced predominantly within the EU, the
import of cereals from developing countries is increasing. This is largely affected by growth in the import of maize (from
3.4 million tons in 2010 to 10.8 million tons in 2014). The primary corn-supplying developing countries include Ukraine,
Moldova, Serbia, Brazil and Argentina.
Spain, the Netherlands and Italy are the largest cereal importers from developing countries. Corn and especially wheat are
typically supplied by nearby developing countries; rice is imported predominantly from India, Pakistan and South-East
Asia. Belgium and Germany are also large importers of cereals, but they import primarily from other EU countries.
Ukraine is the most important developing country that supplies cereals to the EU, with corn and wheat being its largest
export commodities.
While the total EU import of cereals has been showing a stable increase, the import volumes from supplying countries have
been fluctuating more vigorously.
Relative to the major commodities, other cereals (e.g. buckwheat and millet) continue to be regarded as highly specialized
niche markets. Nevertheless, some pseudo-cereal types have shown strong growth in the past few years. Quinoa is one
example (now at 15,000 tons). These commodities are paving the way for other future cereal prospects, including
amaranth and teff. See also CBI trends for grains and pulses.
0 2 4 6 8 10 12
Ukraine (45%)
Serbia (5%)
Brazil (4%)
Moldova (2%)
India (2%)
Argentina (1%)
Thailand (1%)
Cambodia (1%)
Pakistan (1%)
Myanmar (1%)
Mexico (1%)
South Africa (1%)
2014 2012 2010
Tips:
Focus on specific cereals that correspond to the growing needs and market trends of specific consumer
groups (e.g. healthy or gluten-free products).

CBI | Market Intelligence Trade Statistics Grains and Pulses in Europe | 4
Seeds
EU Import of Seeds, in millions of tons (incl. soybeans, sunflower seeds and rapeseed)
Source: Eurostat (Comext); figure created by ICI Business
Largest EU importers of Seeds (2014), in millions of tons
Source: Eurostat (Comext); figure created by ICI Business
0
2
4
6
8
10
12
14
16
2010 2011 2012 2013 2014
Developing countries EU Other
0
1
2
3
4
5
6
7
8
9
10
Developing countries EU Other

CBI | Market Intelligence Trade Statistics Grains and Pulses in Europe | 5
Largest suppliers of Seeds from developing countries to the EU, in millions of tons
Source: Eurostat (Comext); figure created by ICI Business
Interpretation & opportunities
The EU seed market is valued at more than €13 billion, with a steady rate of growth and a relatively large import volume
from outside the EU. Germany is the largest overall importer of seeds in the EU, although the Netherlands and Spain
import a greater share from developing countries.
The main seed imports are soybeans (Brazil, Paraguay), rapeseed (EU, Australia, and Ukraine) and sunflower seeds
(Eastern EU, France). These seeds are primarily destined for the processing industry (e.g. vegetable oil).
Edible seeds on a smaller scale include linseeds (around 800,000 tons), sesame seeds (160,000 tons), hemp seeds,
pumpkin seeds, chia seeds and poppy seeds.
0
1
2
3
4
5
6
7
2010 2012 2014
Tip:
If you are not a large exporter, look for niche markets and find partners that fit your company profile.
Large commodities are related to large-scale production, while very small niche products can be more
profitable. It is important to bear in mind, however, that these markets may pose higher risks and be
less stable.

CBI | Market Intelligence Trade Statistics Grains and Pulses in Europe | 6
Pulses
EU Import of Pulses, in thousands of tons
Source: Eurostat (Comext); figure created by ICI Business
Largest EU importers of Pulses (2014), in thousands of tons
Source: Eurostat (Comext); figure created by ICI Business
0
100
200
300
400
500
600
700
2010 2011 2012 2013 2014
Developing countries EU Other
0
50
100
150
200
250
300
350
Developing countries EU Other

CBI | Market Intelligence Trade Statistics Grains and Pulses in Europe | 7
Largest suppliers of Pulses from developing countries to the EU, in thousands of tons
Source: Eurostat (Comext); figure created by ICI Business
Interpretation & opportunities
The total import value of pulses has been increasing each year, reaching €1.2 billion in 2014. The import volume has
remained relatively stable at slightly more than 1.5 million tons. In 2014, developing countries supplied around 30% of the
pulses to Europe.
Italy, Spain and the UK are the largest importers of pulses from developing countries. Their imports consist mainly of
kidney beans and white pea beans, which together with chick peas represent more than 70% of the total import value
from developing countries.
Pulses are imported from many different regions in the world. China, Argentina and Ukraine are the largest suppliers,
providing around 23% of the total supply of pulses to the EU.
Despite the scale of these large commodities, the market for pulses in Europe (especially Northern and Western EU) is
underdeveloped compared to worldwide trade. There is room for growth in both common pulses (kidney beans, chick peas,
lentils) and growing niches, including cow peas (over 6,000 tons) and pigeon peas (1,600 tons). See also CBI trends for
grains and pulses.
Large commodities are accompanied by heavy competition. For example, it would be difficult to match the competitive
position of Turkey in lentils. In this case, product differentiation is important (e.g. by producing organic lentils or niche
varieties).
0
20
40
60
80
100
120
140
160
180
2010 2012 2014
Tip:
Pulses are produced worldwide. Check with experienced EU buyers to identify which pulses and niches
have higher demand or potential.

CBI | Market Intelligence Trade Statistics Grains and Pulses in Europe | 8
Export
Cereals
EU Export of Cereals (incl. wheat, rice and corn), in millions of tons
Source: Eurostat (Comext); figure created by ICI Business
* Statistics for ‘EU’ refer to the EU-28 member states
*Developing countries are defined by the OECD DAC list of 2014
Largest EU exporters of Cereals (2014), in millions of tons
Source: Eurostat (Comext); figure created by ICI Business
0
10
20
30
40
50
60
2010 2011 2012 2013 2014
Developing countries EU Other
0
5
10
15
20
25
30
35
Developing countries EU Other

CBI | Market Intelligence Trade Statistics Grains and Pulses in Europe | 9
Trade hubs and destination countries for cereal grains
Image created by ICI Business
Interpretation & opportunities
France, Germany and Romania are the largest exporters of cereals in the EU. Their exports consist predominantly of locally
produced wheat and corn. With regard to rice, another large commodity, Spain and Italy are large exporters (local
production), as are the Netherlands and Belgium (trade).
Most cereals are produced within the EU and do not have well defined trade hubs. The Netherlands and Belgium are the
primary points of entry for the shipping of niche products.
Seeds
EU Export of Seeds, in millions of tons (incl. soybeans and rapeseed)
Tips:
For major commodities, focus on the countries with high demand and low internal production.
Suppliers of more exotic grains or pseudo grains should look for specialized EU markets and importers
(e.g. through the following website: http://www.organic-bio.com/en/directory/cereals).

CBI | Market Intelligence Trade Statistics Grains and Pulses in Europe | 10
Source: Eurostat (Comext); figure created by ICI Business
Largest EU exporters of Seeds (2014), in millions of tons
Source: Eurostat (Comext); figure created by ICI Business
0
2
4
6
8
10
12
14
2010 2011 2012 2013 2014
Developing countries EU Other
0
0,5
1
1,5
2
2,5
Developing countries EU Other

CBI | Market Intelligence Trade Statistics Grains and Pulses in Europe | 11
Trade hubs and destination countries for Seeds
Image created by ICI Business
Interpretation & opportunities
The total export value of seeds was nearly €6 billion euros in 2014. The main destination markets for seeds are Germany
(rape, soy), Spain (soy, sunflower) and Italy (mainly soy).
The Netherlands and Belgium are trade hubs for more exotic seeds.
Some products pose difficult competition, including rapeseed, which is exported predominantly from France and Poland,
and sunflower seeds, which are supplied largely by Romania and Bulgaria.
Tip:
It is easier to supply seeds that are less likely to be produced in or near Europe, such as sesame
seeds, soybeans or chia (niche).
CBI | Market Intelligence Trade Statistics Grains and Pulses in Europe | 12
Pulses
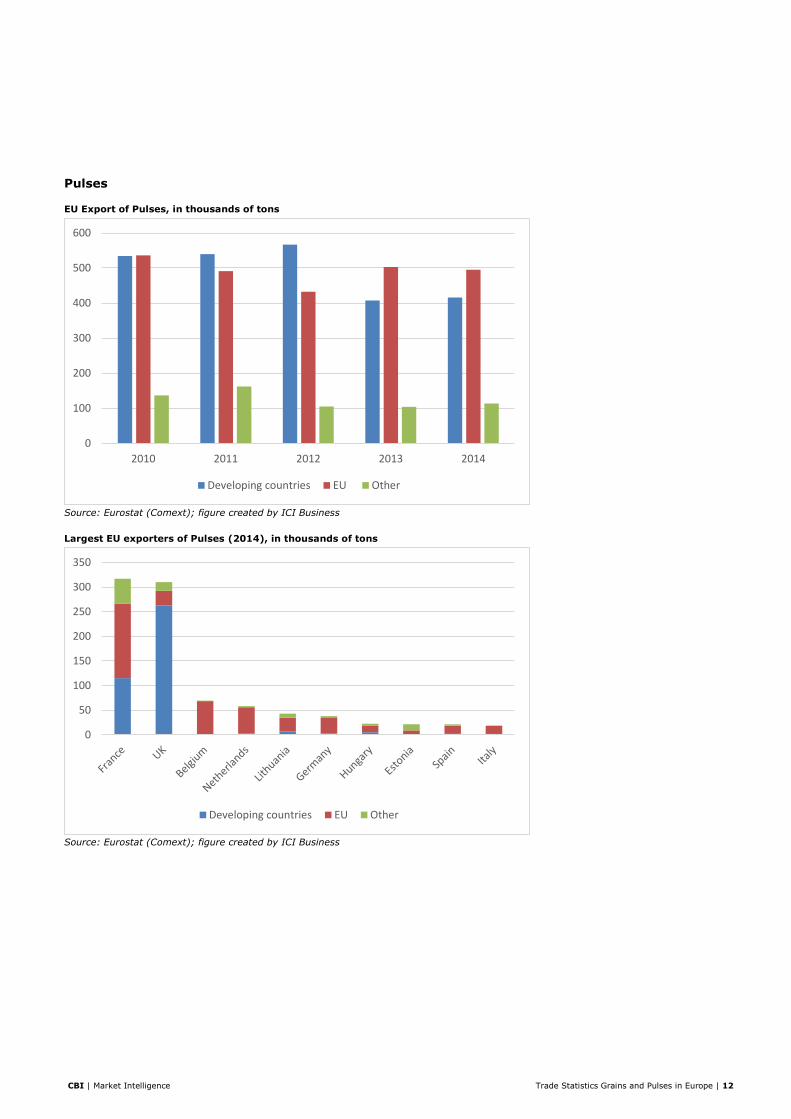
EU Export of Pulses, in thousands of tons
Source: Eurostat (Comext); figure created by ICI Business
Largest EU exporters of Pulses (2014), in thousands of tons
Source: Eurostat (Comext); figure created by ICI Business
0
100
200
300
400
500
600
2010 2011 2012 2013 2014
Developing countries EU Other
0
50
100
150
200
250
300
350
Developing countries EU Other

CBI | Market Intelligence Trade Statistics Grains and Pulses in Europe | 13
Trade hubs and destination countries for Pulses
Image created by ICI Business
Interpretation & opportunities
The UK and France are by far the largest exporters of pulses, especially broad beans. Egypt is one of their principal buyers,
in addition to being a major producer itself.
Potential competition can be expected from France, which is both a major producer and major consumer, in addition to
being a net exporter to other EU countries. Poland is a significant producer, although its exports remain small. Trade hubs
for pulses include the Netherlands and Belgium.
Tip:
Pulses that are not produced and exported by the EU offer the best opportunity for exporters from
developing countries. The most promising types of pulses include kidney beans and chick peas, as well
as the more exotic types (e.g. cow peas, pigeon peas, black-eyed peas and lima beans).

CBI | Market Intelligence Trade Statistics Grains and Pulses in Europe | 14
Production
Cereals
EU productions of major cereals, in millions of tons
Source: Faostat; figure created by ICI Business
*Statistics for ‘EU’ refer to the EU-28 member states
EU productions of specific cereals, in millions of tons
Source: Faostat; figure created by ICI Business
0
50
100
150
200
250
300
2009 2010 2011 2012 2013
Barley
Maize
Wheat
0
5
10
15
20
25
30
35
40
45
2009 2010 2011 2012 2013
Other / mixed grains
Paddy rice
Oats
Rye
CBI | Market Intelligence Trade Statistics Grains and Pulses in Europe | 15
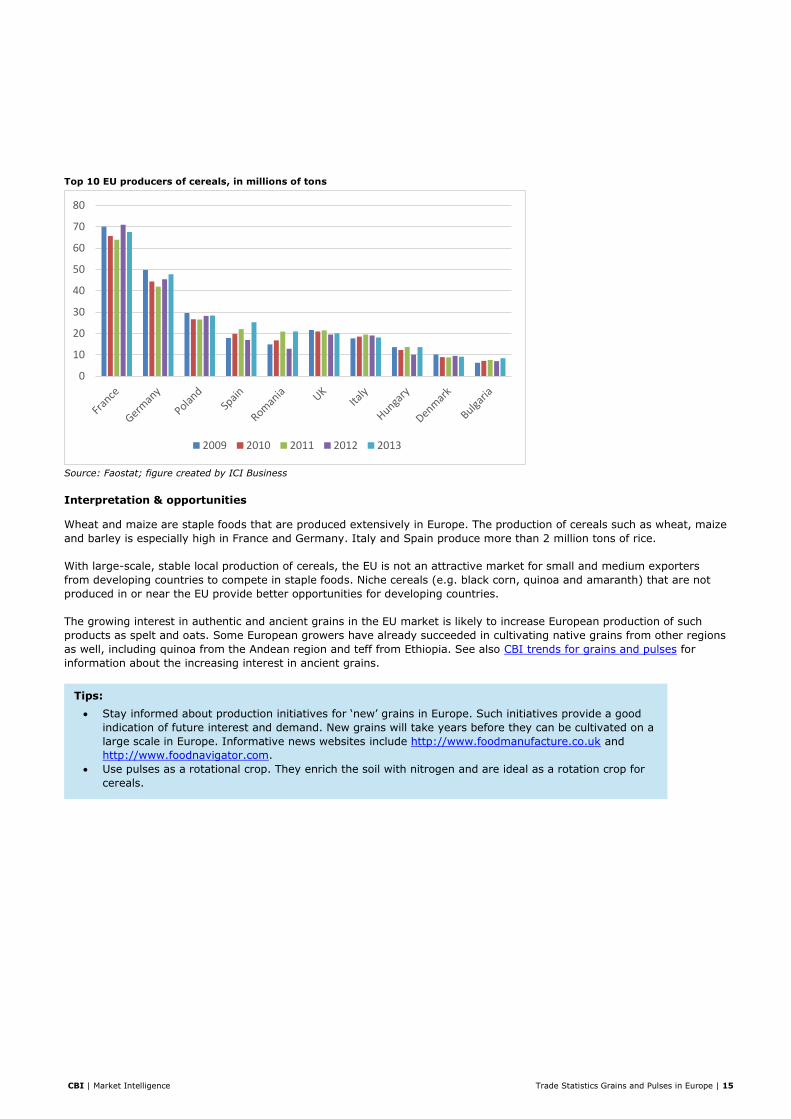
Top 10 EU producers of cereals, in millions of tons
Source: Faostat; figure created by ICI Business
Interpretation & opportunities
Wheat and maize are staple foods that are produced extensively in Europe. The production of cereals such as wheat, maize
and barley is especially high in France and Germany. Italy and Spain produce more than 2 million tons of rice.
With large-scale, stable local production of cereals, the EU is not an attractive market for small and medium exporters
from developing countries to compete in staple foods. Niche cereals (e.g. black corn, quinoa and amaranth) that are not
produced in or near the EU provide better opportunities for developing countries.
The growing interest in authentic and ancient grains in the EU market is likely to increase European production of such
products as spelt and oats. Some European growers have already succeeded in cultivating native grains from other regions
as well, including quinoa from the Andean region and teff from Ethiopia. See also CBI trends for grains and pulses for
information about the increasing interest in ancient grains.
0
10
20
30
40
50
60
70
80
2009 2010 2011 2012 2013
Tips:
Stay informed about production initiatives for ‘new’ grains in Europe. Such initiatives provide a good
indication of future interest and demand. New grains will take years before they can be cultivated on a
large scale in Europe. Informative news websites include http://www.foodmanufacture.co.uk and
http://www.foodnavigator.com.
Use pulses as a rotational crop. They enrich the soil with nitrogen and are ideal as a rotation crop for
cereals.

CBI | Market Intelligence Trade Statistics Grains and Pulses in Europe | 16
Seeds EU production of major commodity seeds, in thousands of tons
Source: Faostat; figure created by ICI Business
EU production of specific seeds (excluding cottonseed), in thousands of tons
Source: Faostat; figure created by ICI Business
0
5000
10000
15000
20000
25000
30000
35000
2009 2010 2011 2012 2013
Soybeans
Sunflower seed
Rapeseed
0
100
200
300
400
500
600
2009 2010 2011 2012 2013
Other (oil)seeds
Poppy seed
Hemp seed
Mustard seed
Linseed

CBI | Market Intelligence Trade Statistics Grains and Pulses in Europe | 17
Top 10 EU producers of seeds, in thousands of tons
Source: Faostat; figure created by ICI Business
Interpretation & opportunities
Annual European production of the major seed commodities (rapeseed, sunflower, soybeans) is stable between 27 and 32
million tons.
The production of lower-volume seeds (e.g. linseed, mustard seeds and poppy seeds) is decreasing and could eventually
evolve into an opportunity for external suppliers.
France and Germany are the leading producers of seeds, although rapeseed accounts for more than 85% of their
production. Eastern Europe is also very productive in rapeseed and sunflower seed. Seeds that are not commonly
cultivated in Europe include sesame, safflower and chia.
0
1000
2000
3000
4000
5000
6000
7000
8000
2009 2010 2011 2012 2013
Tip:
Production and prices of seeds can be volatile, especially for newer niche products. Try to arrange
supplying contracts with your buyers.

CBI | Market Intelligence Trade Statistics Grains and Pulses in Europe | 18
Pulses
EU Production of major pulses, in thousands of tons
Source: Faostat; figure created by ICI Business
EU Production of specific pulses, in thousands of tons
Source: Faostat; figure created by ICI Business
0
500
1000
1500
2000
2500
3000
3500
2009 2010 2011 2012 2013
Dry broad & horsebeansDry peas
0
200
400
600
800
1000
1200
1400
2009 2010 2011 2012 2013
Other pulses
Chick peas
Lentils
Lupins
Dry beans

CBI | Market Intelligence Trade Statistics Grains and Pulses in Europe | 19
Top 10 EU producers of pulses, in thousands of tons
Source: Faostat; figure created by ICI Business
Interpretation & opportunities
Beans and peas come in many varieties, and they are widely produced throughout the world. Dry peas and broad beans
are the most common varieties in the EU. The health-food trend is likely to increase the popularity of pulses, potentially
pushing internal EU production as well.
0
200
400
600
800
1000
1200
1400
1600
1800
2009 2010 2011 2012 2013
Tip:
Use pulses as a rotational crop. They enrich the soil with nitrogen and are ideal as a rotation crop for
cereals.

CBI | Market Intelligence Trade Statistics Grains and Pulses in Europe | 20
Consumption
Cereals
EU consumption of major cereals, in millions of tons
Source: Faostat and Eurostat (Market Access Database); figure created by ICI Business
*Statistics for ‘EU’ refer to the EU-28 member states
EU consumption of specific cereals, in millions of tons
Source: Faostat and Eurostat (Market Access Database); figure created by ICI Business
0
50
100
150
200
250
300
2009 2010 2011 2012 2013
Barley
Maize
Wheat
0
5
10
15
20
25
30
35
40
45
2009 2010 2011 2012 2013
Rye Oats Paddy rice Other cereals
CBI | Market Intelligence Trade Statistics Grains and Pulses in Europe | 21
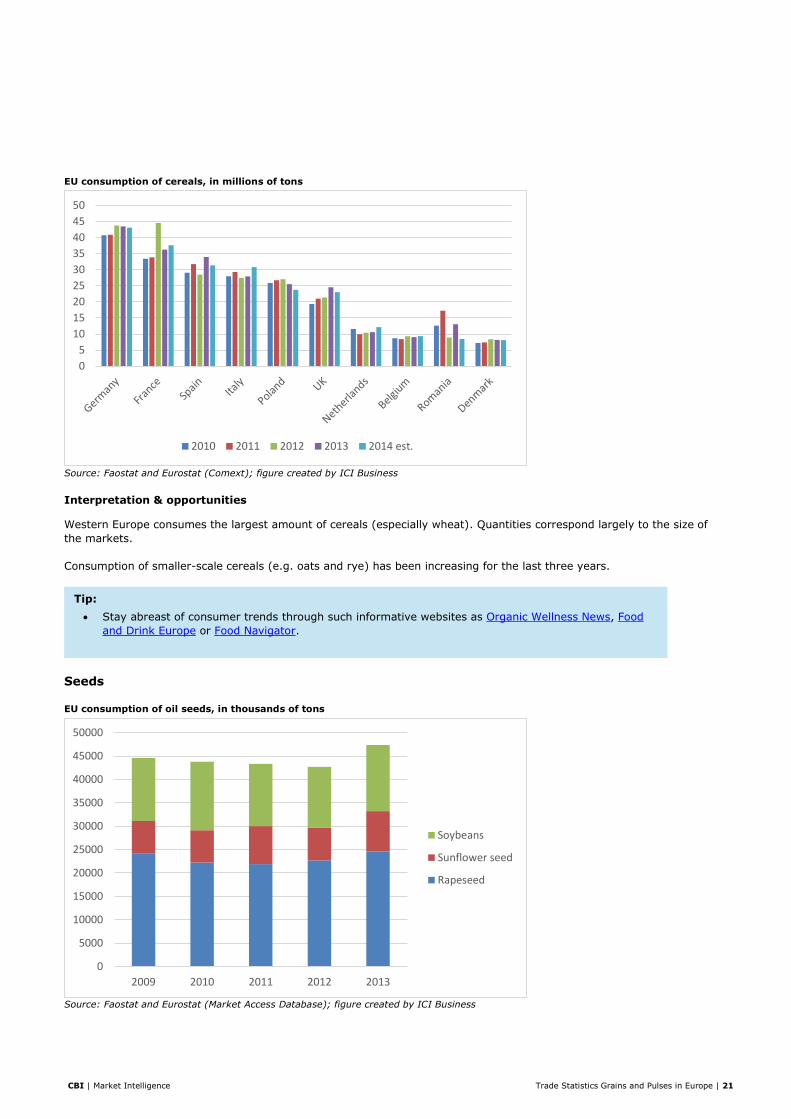
EU consumption of cereals, in millions of tons
Source: Faostat and Eurostat (Comext); figure created by ICI Business
Interpretation & opportunities
Western Europe consumes the largest amount of cereals (especially wheat). Quantities correspond largely to the size of
the markets.
Consumption of smaller-scale cereals (e.g. oats and rye) has been increasing for the last three years.
Seeds
EU consumption of oil seeds, in thousands of tons
Source: Faostat and Eurostat (Market Access Database); figure created by ICI Business
0
5
10
15
20
25
30
35
40
45
50
2010 2011 2012 2013 2014 est.
0
5000
10000
15000
20000
25000
30000
35000
40000
45000
50000
2009 2010 2011 2012 2013
Soybeans
Sunflower seed
Rapeseed
Tip:
Stay abreast of consumer trends through such informative websites as Organic Wellness News, Food
and Drink Europe or Food Navigator.
CBI | Market Intelligence Trade Statistics Grains and Pulses in Europe | 22
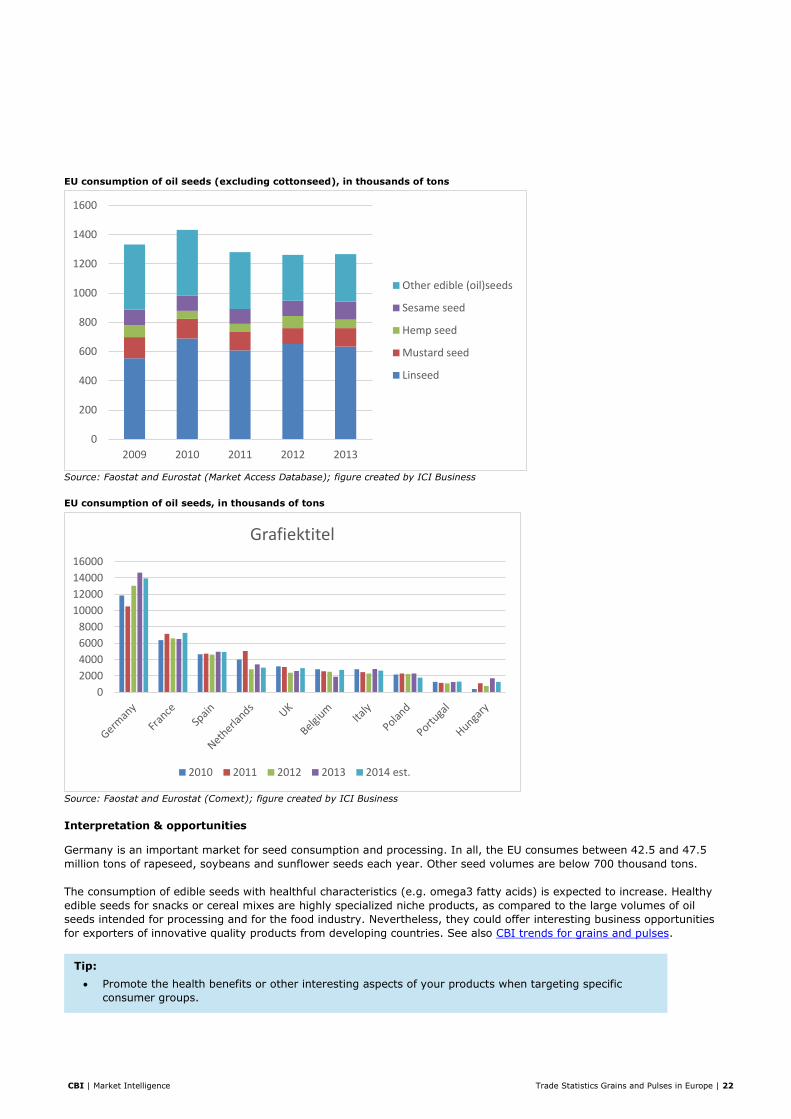
EU consumption of oil seeds (excluding cottonseed), in thousands of tons
Source: Faostat and Eurostat (Market Access Database); figure created by ICI Business
EU consumption of oil seeds, in thousands of tons
Source: Faostat and Eurostat (Comext); figure created by ICI Business
Interpretation & opportunities
Germany is an important market for seed consumption and processing. In all, the EU consumes between 42.5 and 47.5
million tons of rapeseed, soybeans and sunflower seeds each year. Other seed volumes are below 700 thousand tons.
The consumption of edible seeds with healthful characteristics (e.g. omega3 fatty acids) is expected to increase. Healthy
edible seeds for snacks or cereal mixes are highly specialized niche products, as compared to the large volumes of oil
seeds intended for processing and for the food industry. Nevertheless, they could offer interesting business opportunities
for exporters of innovative quality products from developing countries. See also CBI trends for grains and pulses.
0
200
400
600
800
1000
1200
1400
1600
2009 2010 2011 2012 2013
Other edible (oil)seeds
Sesame seed
Hemp seed
Mustard seed
Linseed
0
2000
4000
6000
8000
10000
12000
14000
16000
Grafiektitel
2010 2011 2012 2013 2014 est.
Tip:
Promote the health benefits or other interesting aspects of your products when targeting specific
consumer groups.

CBI | Market Intelligence Trade Statistics Grains and Pulses in Europe | 23
Pulses
EU consumption of pulses, in thousands of tons
Source: Faostat and Eurostat (Market Access Database); figure created by ICI Business
EU consumption of pulses, in thousands of tons
Source: Faostat and Eurostat (Comext); figure created by ICI Business
Interpretation & opportunities
Dry peas (Pisum sativum) and dry beans (Phaseolus vulgaris) are the most commonly consumed pulses in Europe. France,
Spain and the UK are the leading consumers of pulses.
Compared to other regions, the consumption of pulses in Europe is low, and pulses are usually sold as canned products.
Dry beans do not fit the trend of convenience and lack a modern image. Increased publicity, the promotion of health
benefits and product innovation will be key drivers in helping to develop consumption in the coming years.
The Food and Agriculture Organization (FAO) has designated 2016 as the Year of the Pulses. This means that pulses will be
promoted worldwide, thus potentially increasing their consumption in Europe as well.
0
500
1000
1500
2000
2500
3000
3500
4000
4500
5000
2009 2010 2011 2012 2013
Other pulses
Chick peas
Lentils
Broad & horse beans
Dry beans
Dry peas
0
200
400
600
800
1000
1200
2010 2011 2012 2013 2014 est.
CBI | Market Intelligence Trade Statistics Grains and Pulses in Europe | 24
Useful resources
Branch-specific organizations
Coceral
European association representing trade in cereals, rice, feedstuffs, oilseeds, olive oil, oils and fats, and agro supply
Health Grain Forum
Initiative for the promotion of science and communication concerning the production and consumption of healthy cereal
foods
Databases
European Grain
Platform connecting buyers and sellers of grains
Organic-Bio
Database containing buyers and suppliers of organic food ingredients and products
Europages
European business database
Kompass
International business database
Trade fairs
Eventseye
Database containing trade fairs and expositions
SIAL
Trade fair for food products
Anuga
Trade fair for food products
Biofach
Trade fair for organic food products
Certified Food
Trade fair for certified raw materials and semi-finished products
News sites
Organic & Wellness News
News site containing news about organic and sustainable trade
Food Navigator
News site containing trends and developments in the food industry
Food Manufacture
Online news service about food and beverage developments in Europe
Tip:
Differentiate your product from the standard canned beans. Try to focus on the health-food trend or
add value through storytelling.
Keep in mind that new product innovations in Europe demand top-quality ingredients, great flavours
and outstanding presentation.
CBI | Market Intelligence Trade Statistics Grains and Pulses in Europe | 25
Export requirements
ITC Standards Map
Overview of various standards and certification schemes
EU Export Help
Information about exporting to Europe
Statistics
Market Access Database
European trade statistics
ITC Trademap
Global trade statistics
FAOSTAT
Production statistics
CBI Market Intelligence
P.O. Box 93144
2509 AC The Hague
The Netherlands
www.cbi.eu/market-information
This survey was compiled for CBI by ICI Business | Michel Peperkamp
in collaboration with CBI sector expert Paula Salazar.
Disclaimer CBI market information tools: http://www.cbi.eu/disclaimer
October 2015