
Cause of death and premature mortality in Cape Town, 2001 - 2006 ...
99
Cause of death and premature mortality in Cape Town, 2001 - 2006 Pam Groenewald, Debbie Bradshaw, Johan Daniels, Richard Matzopoulos, David Bourne, David Blease, Nesbert Zinyakatira and Tracey Naledi October 2008
-
Upload
doankhuong -
Category
Documents
-
view
215 -
download
1
Transcript of Cause of death and premature mortality in Cape Town, 2001 - 2006 ...
Cause of death and premature mortality in
Cape Town, 2001 - 2006
Pam Groenewald, Debbie Bradshaw,
Johan Daniels, Richard Matzopoulos,
David Bourne, David Blease, Nesbert Zinyakatira
and Tracey Naledi
October 2008
Copyright
Copyright 2008. All material in this report may be reproduced and copied for
non-commercial purposes: citation as to source, however, is required.
This report is disseminated by the South African Medical Research Council with
permission of the Western Cape Provincial Department of Health and the City of
Cape Town.
Suggested citation
Groenewald P, Bradshaw D, Daniels J, Matzopoulos R, Bourne D, Blease D,
Zinyaktira N, Naledi NT. Cause of death and premature mortality in Cape Town,
2001-2006. Cape Town: South African Medical Research Council, 2008.
ISBN: 978-1-920014-63-6
Acknowledgements
This report forms part of a joint collaboration between the Western Cape
Provincial Department of Health and the City of Cape Town and forms part of the
Western Cape Burden of Disease Reduction Project co-ordinated by Prof Jonny
Myers of the University of Cape Town. We wish to thank the City of Cape Town
team who collect the data on which this report is based. We appreciate the
critical review provided by Dr Najma Shaikh and are indebted to Elize de Kock for
assisting with the typing and layout of the document.
Copies of the report
Copies of the report can be downloaded from
www.mrc.ac.za/bod.bod.htm www.capetown.gov.za/health www.capegateway.gov.za/health
Contents
Foreword…………………………………………………………………………………….………………….………i
Abstract ................................................................................................ii
Introduction ......................................................................................... 1
Methods and data quality ...................................................................... 3
Cause of death data ............................................................................. 3
Missing and ill-defined information.......................................................... 4
Old, interim and new sub-districts .......................................................... 5
Population estimates for the health sub-districts......................................11
Results.................................................................................................12
Overview of mortality in Cape Town.......................................................12
Age standardised rates.....................................................................12
Trends in premature mortality...........................................................15
Sub-district variations ......................................................................17
Important conditions ...........................................................................21
HIV and TB.....................................................................................21
Variation between sub-districts.....................................................21
Age and gender differences..........................................................22
Injuries..........................................................................................23
Non-communicable diseases .............................................................32
Child and adolescent health ..............................................................40
Infant mortality...........................................................................41
Infants in the neonatal period .......................................................44
Child mortality (1 - 4 years)..........................................................48
Children of 5-9 years ...................................................................53
Children of 10 - 14 years..............................................................54
Children of 15 - 19 years..............................................................55
Women’s health ..............................................................................56
Men’s health ...................................................................................59
Discussion ...........................................................................................61
Recommendations ...............................................................................65
References...........................................................................................67
Appendices
List of Tables
Table 1: Socio-economic indicators for Cape Town by old and interim sub-districts 11 Table 2: Leading 10 causes of premature mortality (YLLs) for Cape Town and
current sub-districts, 2006 ................................................................ 18 Table 3: Comparison of National, Western Cape, and Cape Town
age-standardised mortality rates for non-communicable diseases ........... 33 Table 4: Epidemiological transition of cardiovascular diseases (Yusuf et al.22)........ 35 Table 5: Age distribution of deaths in those aged 19 years and under
(2003, 2004, 2006).......................................................................... 38 Table 6: Childhood mortality rates, Cape Town, pooled estimates
(2003, 2004, 2006).......................................................................... 41
List of Figures
Figure 1: New Health sub-districts of Cape Town.................................................. 8 Figure 2: Old health sub-districts of Cape Town ................................................... 9 Figure 3: Comparison of premature mortality rates by cause group across old
and new sub-districts, Cape Town, 2004 ............................................. 10 Figure 4: Age distribution of deaths by cause group and gender,Cape Town, 2006.. 13 Figure 5: Age-standardised mortality rate by broad cause group by sex for Cape
Town, 2001 - 2006 (2005 excluded due to incomplete data) .................. 14 Figure 6: Age-standardised mortality rate for broad cause groups by
sub-district, 2006............................................................................. 15 Figure 7: Top 10 causes of premature mortality (YLLs) for persons, Cape Town,
2001 and 2006 ................................................................................ 16 Figure 8: Top 10 causes of premature mortality (YLLs) by sex for Cape Town, ...........
for the years 2001 and 2006 ............................................................. 17 Figure 9: Age-standardised premature mortality rates per 100 000 by
broad cause group for Cape Town sub-districts, 2003 and 2006.............. 19 Figure 10: YLLs per 100 000 by cause group and HIV/AIDS for Cape Town
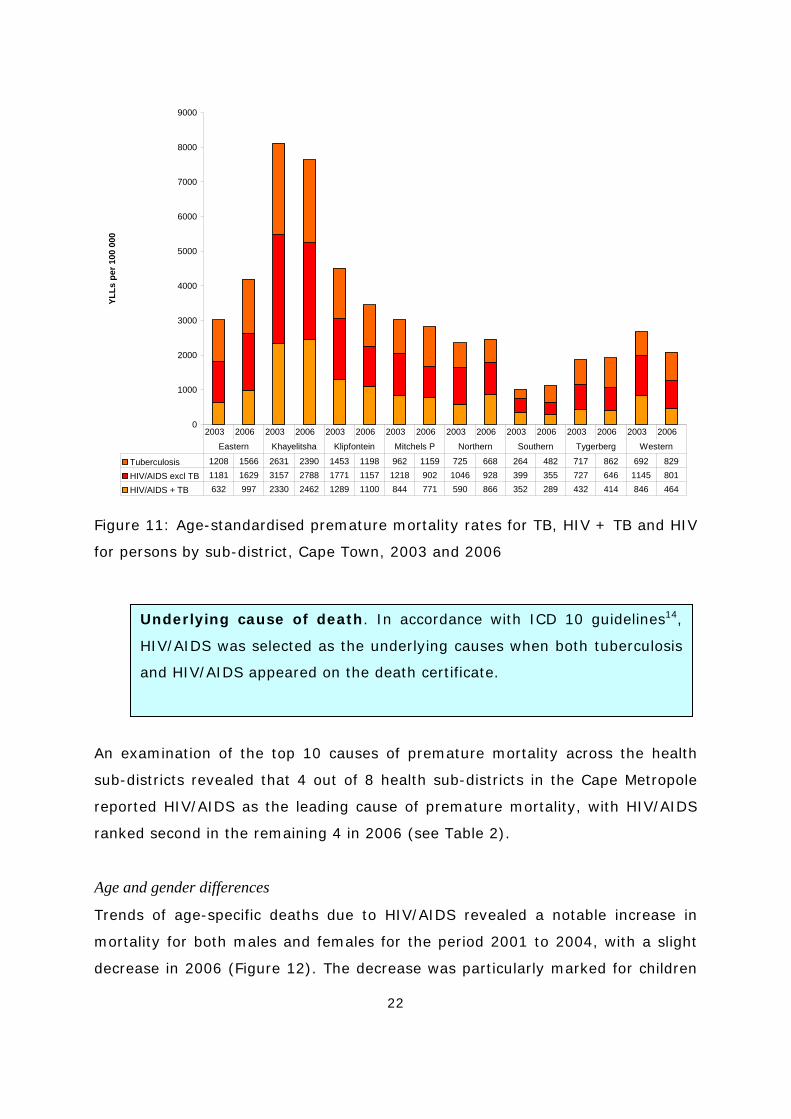
current sub-districts, 2003 and 2006 .................................................. 20 Figure 11: Age-standardised premature mortality rates for TB, HIV + TB and
HIV for persons by sub-district, Cape Town, 2003 and 2006................... 22 Figure 12: Age-specific death rates for HIV and TB by gender, Cape Town,
2001 and 2006 ................................................................................ 23
Figure 13: Age-standardised death rates (pooled estimates) due to injuries by
sub-district, Cape Town, 2003, 2004, 2006.......................................... 25 Figure 14: Firearm and non-firearm homicide rates in Cape Town, 2001 - 2005 ....... 26 Figure 15: Age-standardised death rates (pooled) due to homicide by sub-district,
for persons, Cape Town, 2003, 2004, 2006.......................................... 27 Figure 16: Age-specific homicide death rates by gender, Cape Town, 2001 - 2006 Figure 17: Age-standardised death rates (pooled estimates) ................................. 30 due to road traffic injuries by sub-district, for persons, Cape Town
(2003, 2004, 2006).......................................................................... 30 Figure 18: Age-standardised cause of death rates for non-communicable
diseases by sub-district, for persons, Cape Town (pooled estimates
2003, 2004, 2006) ........................................................................... 34 Figure 19: Age-standardised death rates for IHD, stroke, hypertension and
diabetes by gender and sub-district, Cape Town (pooled estimates
2003, 2004, 2006) ........................................................................... 36 Figure 20: Trends in age-standardised death rates per 100 000 population for
selected non-communicable diseases, Cape Town, 2001 – 2006
(2005 excluded) .............................................................................. 37 Figure 21: Age-standardised death rates for COPD and lung cancer by gender and
sub-district, Cape Town (pooled estimates 2003, 2004, 2006)................ 38 Figure 22: Age-standardised death rates for oesophageal cancer and colon
cancer by gender and sub-district, Cape Town (pooled estimates
2003, 2004, 2006) ........................................................................... 39 Figure 23: Trends in infant mortality rate per 1000 live births, Cape Town,
2001 – 2006 (Please note that data for 2005 were incomplete) .............. 42 Figure 24: Trends in <1 year mortality rates per 100 000 population for
selected conditions, Cape Town, 2001 – 2006 ...................................... 43 Figure 25: Infant mortality rates per 1000 live births by sub-district, Cape Town,
2003 – 2006 (data for 2005 are only considered complete for Khayelitsha
and Southern) ................................................................................. 44 Figure 26: Neonatal cause of death profile, Cape Town, 2003. 2004, 2006 ............. 45 Figure 27: Leading causes of deaths in early neonatal infants (0 - 7 days)
and late neonatal infants (8 - 30 days), Cape Town, pooled estimate
(2003, 2004 and 2006)..................................................................... 46 Figure 28: Cause of death profile, post-neonatal infants (1-11 months),
Cape Town, 2003, 2004 and 2006 ...................................................... 47 Figure 29: Leading causes of deaths in post-neonatal infants (1 – 11 months),
Cape Town, pooled estimates (2003, 2004 and 2006) ........................... 48 Figure 30: Trend in 1 – 4-year mortality rates per 100 000, Cape Town,
2001 – 2006 (2005 data excluded since incomplete) ............................. 49
Figure 31: Trend in 1 – 4-year mortality rates per 100 000 population for
selected conditions, Cape Town 2001 – 2006 (excluding 2005).............. 50 Figure 32: 1 – 4-year mortality rates per 100 000 by sub-district, Cape Town,
(pooled rates 2003, 2004, 2006)........................................................ 51 Figure 33: Cause of death profile, children 1 – 4 years, Cape Town pooled
estimates (2003, 2004, 2006) ........................................................... 52 Figure 34: Leading causes of death in the 1 – 4-year age group, Cape Town
pooled estimates (2003, 2004, 2006) ................................................. 52 Figure 35: Leading causes of death in 5 – 9-year age group, Cape Town
pooled estimate, (2003, 2004, 2006).................................................. 53 Figure 36: Leading causes of death in 10 – 14-year age group, Cape Town
pooled estimate (2003, 2004, 2006)................................................... 54 Figure 37: Leading causes of death in 15 – 19-year age group, Cape Town
pooled estimates (2003, 2004, 2006) ................................................. 55 Figure 38: Age-standardised mortality rates for cervix and breast cancer by
sub-district, Cape Town (pooled estimates 2003, 2004, 2006)................ 57 Figure 39: Premature mortality (YLLs) cause profile for women of 15+ years,
Cape Town, 2006............................................................................. 58 Figure 40: Premature mortality (YLLs) cause profile for men 15+ years,
Cape Town, 2006............................................................................. 59 Figure 41: Age-standardised mortality rates for prostate cancer by sub-district,
Cape Town (pooled estimates 2003, 2004, 2006) ................................. 60
i
Foreword
Estimation of the burden of disease and its disaggregation by demographic and
spatial variables is essential in order to be able to carry out effective planning
and implementation of targeted interventions, and to address inequities. As is
evident from this report, this has relevance not just for the health sector but for
all sectors concerned about development and the well-being of the community.
In our district it is HIV, TB, homicide and road traffic injuries that account for
almost half of all the premature deaths. Only by advocating for an integrated,
multi-sectoral approach will these components of the burden be successfully
prevented. The health sector plays a critical role in the prevention of diseases
through its preventative, promotive and curative interventions; however, often it
can only intervene when disease is already evident. Global evidence shows that
preventative efforts which take place in schools, workplaces and communities are
just as important in addressing the burden of disease through the health
services.
Partnerships are therefore very important in reducing the burden of disease. It
gives us great pleasure to present this report, which is the result of a partnership
between the City of Cape Town, Western Cape Department of Health, Medical
Research Council and University of Cape Town within the Western Cape Burden
of Disease Reduction project, where other partners are also involved.
This report highlights the geographical areas and demographic groups that
should be prioritized and targeted in the district. We are committed to ensuring
that the results and recommendations of this report feed into the integrated
planning and decision-making cycle of City Health and Metro District Health
Services in the Provincial Government. We are also committed to advocating for
appropriate action within the broader provincial government and the City of Cape
Town to effectively address this burden.

ii
We would like to thank all our staff, the Medical Research Council Burden of
Disease Research Unit and the School of Public Health of the University of Cape
Town, without whom this report would not have been possible. We would also
like to thank the Department of Home Affairs, which graciously allowed us to
access the death notification forms from their offices.
Dr Ivan Bromfield
Executive Director: City Heath
City of Cape Town
Dr Keith Cloete
Chief Director: Metro District Health Services
Western Cape Department of Health
iii
Abstract
Mortality surveillance is a central aspect of the information required to identify
the health needs of a community, monitor progress in the implementation of
programmes and track changes over time. Although cause of death data have
been collected in the Cape Town Metropole for more than 100 years, the system
has been revamped in recent years to provide the City with more relevant
information. The first report covered data for the year 2001 and provided insight
into the mortality differentials between sub-districts as well as identifying the
major causes of premature mortality, which were characterized as a quadruple
burden of disease (infectious diseases; injuries, especially among young adults;
non-communicable diseases later in life; and the growing HIV/AIDS epidemic).
The second report covered a detailed analysis of the cause of death data for the
Cape Town Metropole for the period 2001 to 2004. This is the third report and
covers the period 2001 to 2006 (data for 2005 omitted since they were
incomplete).
The information in this report has been collected directly from the local offices of
the Department of Home Affairs and supplemented by information collected from
the local mortuaries. The cause of death coding was done by trained clerks at the
City of Cape Town. Deaths were analysed by age, cause and gender for 8 new
sub-districts from 2003 until 2006. Premature mortality and age-standardised
rates were calculated and compared across sub-districts. Temporal trends are
given for major cause groupings. Up-to-date population estimates for each sub-
district and estimates of the completeness of death registration were calculated.
Key findings and recommendations:
• HIV/AIDS mortality has increased dramatically since 2001; however, it
appears to have stabilised since 2004, possibly demonstrating the impact of
the prevention of mother-to-child transmission (PMTCT) and antiretroviral
(ARV) programmes. It remains a leading cause of premature mortality across
sub-districts, highlighting the need to strengthen intersectoral prevention
iv
strategies and to continue to strengthen the health service response.
HIV/AIDS is particularly high in the sub-district of Khayelitsha and is
accompanied by very high TB mortality.
• Injury-related mortality remains extremely high. Although there was evidence
of a declining trend until 2004, there was an increase until 2006.
Furthermore, injury mortality rates - particularly homicide and road traffic
injuries - are still among the highest in the world, particularly for men. Of
particular concern are the high homicide and road traffic injury fatality rates
among the male youth. Urgent attention needs to be given to identifying and
implementing strategies to prevent injuries. Interventions to address the high
burden of violence and homicide must be planned, implemented, monitored
and evaluated multi-sectorally. National Injury Mortality Surveillance System
(NIMSS) data for Cape Town confirm a strong association between alcohol
and fatal injuries. Other substances of abuse are also likely to be important
contributors, but routine data were not collected.
• Mortality rates due to non-communicable diseases are high, with variations
along the lines of the epidemiological transition. Non-communicable diseases
account for a high proportion of premature mortality, particularly among adult
women. Smoking rates are particularly high in the coloured population,
especially among females. The emerging epidemic of non-communicable
diseases must be tackled through strengthening primary care management,
promoting healthy lifestyles and addressing upstream risk factors, the “cause
of causes”.
• Child mortality appears to have remained constant over this period, but there
was a noticeable increase in mortality from low birthweight until 2004 that
needs further investigation. There is a suggestion that child mortality due to
HIV/AIDS has started decreasing (however, this study period covers only the
beginning of the full-scale PMTCT roll-out).
v
• During this period the mortality differentials between sub-districts remained
fairly static. Given the current sub-district boundaries, Khayelitsha stands out
as having the highest rates of premature mortality. Trends indicate that
although child mortality has improved and HIV/AIDS mortality may have
decreased, mortality from interpersonal violence has increased. However, it is
likely that some other suburbs, such as Nyanga and Gugulethu, experience
similarly high mortality. Equity must be prioritised in resource allocation
between the sub-districts to address the greatest needs.
• The continued success and improvement of this mortality surveillance system
depends on departments from the various spheres of government
collaborating to ensure the availability of quality information that can
influence decision making.
1
Introduction
Cause of death data form an essential component of the health information
system. Such data are required to identify the health needs of a community,
monitor progress in the implementation of programmes and track changes over
time. They need to be timeous, reliable and relevant. In the context of limited
resources and disparities, sub-population data become critical to identify and
monitor inequalities in health status and to inform the process of prioritisation of
interventions, services and research at a local level.
The City of Cape Town has collected cause of death statistics for more than 100
years as part of its public health programme. An evaluation of the statistical
system identified the need for standardization of the coding and a more public
health-oriented analysis of the statistics. The first report on the cause of death
and premature mortality study done in the Cape Town Metropole in 20011
highlighted the fact that HIV/AIDS had created a quadruple burden of disease
together with injuries, the degenerative, chronic diseases and childhood illnesses
and other infectious diseases, particularly tuberculosis (TB). There were marked
variations in the levels of mortality across the city, with some sub-districts
having rates that were twice as high as others. These disparities reflected socio-
economic differences embedded in the city.
The collection of cause of death statistics developed in the City of Cape Town has
been extended to the Boland/Overberg region and has played an important role
in monitoring and planning for that health region.2 This region has since been
sub-divided into Overberg district and the eastern part of Cape Winelands. As
part of the collaborative Burden of Disease Reduction Project initiated by the
Western Cape Provincial Government, the surveillance system is currently being
implemented in the other health districts of the province in a process to cover
mortality in all the health districts of the Western Cape, using a common
methodology of data collection and analysis.

2
A second mortality report for the City of Cape Town covered a detailed analysis
of the cause of death data for the period 2001 to 20043 and incorporated an
assessment of the priority programmes. This third report presents the key
findings from the trend analysis of the cause of death statistics for Cape Town
Metropole for 2001 until 2006 and the 8 new sub-districts for 2003-2006.
Analysis of the trend in causes of death and premature mortality focuses on the
five programme priorities that have been identified by the City of Cape Town and
the Provincial Department of Health4 in line with National Policy.5 These include:
HIV/AIDS
TB
Chronic Diseases
Child Health
Woman’s Health.
3
Methods and data quality
Cause of death data
Cape Town has a well established system of routinely compiling cause of death
statistics. The City of Cape Town Health Department regularly collects copies of
death certificates from the regional offices of the Department of Home Affairs
that fall in the City. These include the offices of Bellville, Cape Town, Wynberg,
Khayelitsha, Mitchell’s Plain and Nyanga. The underlying cause of death is
identified and coded using a shortlist based on ICD-106 (Table 2 –web version
only, http://www.who.int/bulletin) including the most prevalent conditions in
Cape Town, as well as diseases of public health importance. The list also allows
for the capture of selected combinations of diseases such as diabetes and
ischaemic heart disease (IHD), which are difficult to attribute to a single cause.
Deaths attributed to HIV on the death certificates or obvious euphemisms for
AIDS were coded to HIV as the underlying cause. The combination of HIV and TB
on the death certificate was captured as a combination but analysed with HIV as
underlying cause for general comparison. Similarly, when diabetes was recorded
in association with a cardiovascular co-morbidity, diabetes was identified as the
underlying cause in the general analysis.
The data were captured into a customized data base. The mortality data for 2001
- 2006 were extracted, cleaned and analysed using Microsoft Excel and Stata
software. Stillbirths and duplicate records were excluded prior to any analysis.
The completeness of death registration for adults in the City of Cape Town during
the period 2001 until 2006 was estimated to be 96%, with the exception of 2005
where the completeness was 84%, about 55% for children 0 – 4 years, and
about 70% for infants (see Appendix 1).7 The total number of injury deaths
registered by the City of Cape Town comprised more than 90% of the injury
fatalities reported by the National Injury Mortality Surveillance System (NIMSS)8
for the City of Cape Town for all the years under study except 2003, where only
84% of the injury deaths reported by NIMSS were registered by the City of Cape
Town (see Appendix 2). One would expect the NIMSS to have slightly more
4
deaths registered than the City of Cape Town, since the City only registers
deaths for residents whereas NIMSS registers all injury deaths occurring in the
Cape Town Metro District. However, there were variations in the profile of the
manner of death. Homicide deaths registered on the City system accounted for
more than 90% of the homicide deaths registered on NIMSS, and are therefore
likely to be fairly complete. However, the number of deaths due to road traffic
injuries and suicide were lower (approximately 80% of NIMSS deaths), while
deaths due to unintentional injuries in the City system were higher than the
number reported by NIMSS.
After cleaning, the shortlist cause of death codes were aggregated according to
the South African National Burden of Disease Study,9 based on an adapted
version of the 1990 Global Burden of Disease Study.10 The Groups are:
Group I: the pre-transitional causes - communicable diseases, maternal
causes, perinatal conditions, and nutritional deficiencies. (HIV/AIDS is part
of Group I but is kept separate in the South African National Burden of
Disease analysis due to the size of the burden that it contributes in South
Africa.)
Group II: the non-communicable causes.
Group III: the injuries.
Missing and ill-defined information
The deaths at unknown ages were redistributed proportionally by age and sex for
each cause of death. The ill-defined cardiovascular deaths (e.g. heart failure)
were redistributed by age and sex across rheumatic heart disease, IHD,
hypertensive heart diseases, pulmonary heart diseases and other cardiovascular
diseases. The ill-defined respiratory deaths (respiratory failure) were
redistributed proportionally by age and sex across COPD, asthma and other
respiratory diseases. The deaths coded to ill-defined natural causes were
redistributed proportionally by age and sex across all pre-transitional and non-
5
communicable causes. The ill-defined injury deaths were redistributed
proportionally by age and sex across all intentional and unintentional causes.
Old, interim and new sub-districts
The data were analysed for each of the 8 current health sub-districts within the
Cape Town Metro District as shown in the map in Figure 1. The boundaries of the
sub-districts have been changed twice since 2001 and will be referred to as “old”,
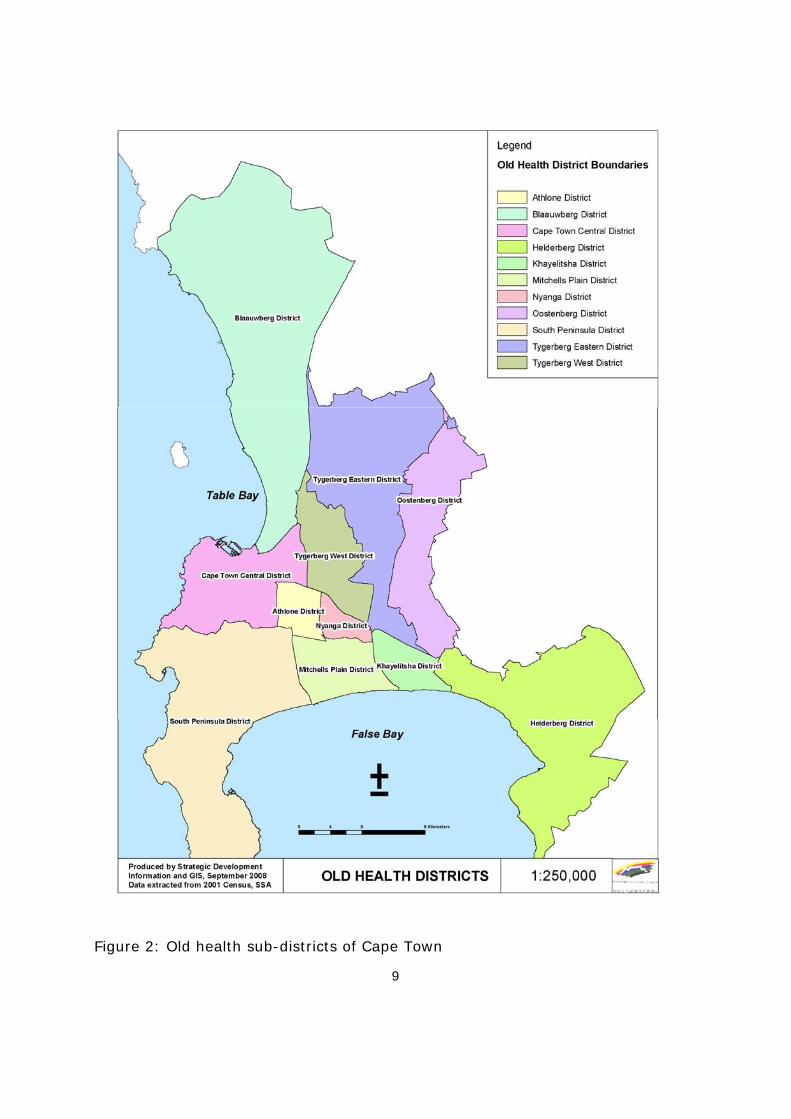
“interim” and “new”. The old health boundaries are shown in Figure 2.
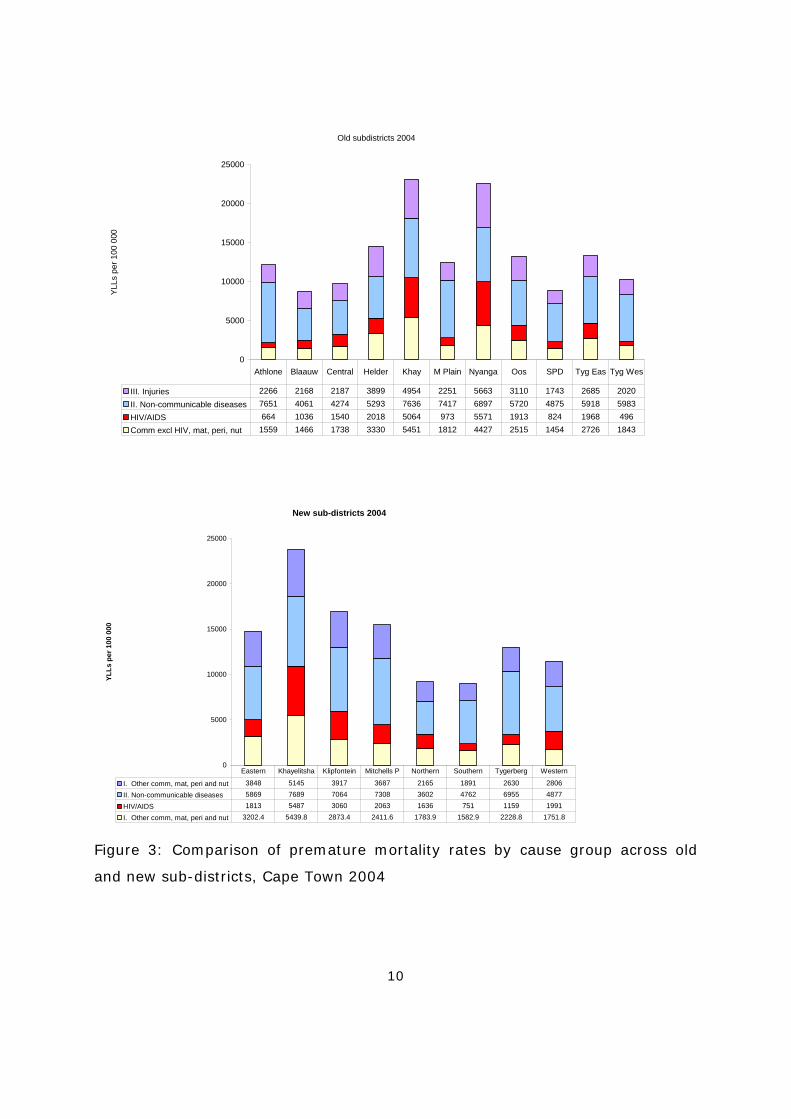
Preliminary analysis of the death data by the 11 old and the 8 new sub-districts
suggested that the new sub-district configuration masks some of the inequities in
mortality rates that were evident using the old boundaries. This is illustrated in
Figure 3, which shows the premature mortality rates in 2004 across old sub-
districts and the new sub-districts. In the old sub-districts, Nyanga and
Khayelitsha had the highest premature mortality rates. Based on the new
boundaries, the former Nyanga sub-district is divided between the new sub-
districts of Klipfontein and Mitchell’s Plain, making the rates for these sub-
districts higher. Table 1 shows the socio-economic conditions across sub-districts
using old and new boundaries.
Deaths were allocated to health sub-districts on the basis of the residential
address of the decedent. For this reason, amongst others, these data are not
suitable for analysis at facility level.
Population estimates for the health sub-districts
Population Censuses were conducted by Statistics South Africa in 1996 and 2001,
making it necessary to use projected population estimates for the years 2001 -
2006. It was decided against using the population estimates and projections from
the provincial Department of Health, since although based on the official
statistics from StatsSA, these had not adjusted for undercount in specific age
groups, and those currently available have not adjusted for the 2007 community
survey which showed that the previous estimates were far too low. Alternative
estimates were used that are consistent with the annual estimates of the total
population for the Cape Town Metropole from the demographic projections
6
undertaken by the University of Cape Town Centre for Actuarial Research for the
City of Cape Town.11 These yearly estimates were projected using the ASSA
(Actuarial Society of South Africa) model from 1985 to 2010, having made
adjustment to the 1996 and 2001 Census data and allowing for the impact of
AIDS.
Sub-district population estimates for new boundaries were estimated from the
estimates derived for the interim sub-districts. The populations by age and sex
for each of the interim health sub-districts were obtained from the community
profile data sets for the 1996 and 2001 Census and adjusted proportionately to
match the total population estimates derived by Dorrington11 for these years. It
should be noted that the 1996 Census had unspecified ages by sex which were
reapportioned to all the ages above 20, based on the assumption that age
reporting below 20 is more accurately and completely reported. The populations
in the interim health sub-districts were then interpolated and projected by age
and sex to 2010 using the ratio method, assuming an exponential rate of change
in the percentage distributions between the two Censuses and the percentage
distributions to approach a stable condition after 60 years from 2001 (i.e.
equilibrium is reached and that there is no further inter-district migration). The
distribution of the population by age was projected by interpolating between
1996 and 2001, and extrapolating after 2001. The population was effectively
adjusted, on a pro rata basis, so that the sum of the projected population by age
and sex in the 8 interim health sub-districts equalled the projected total
population for the Cape Town Metropole in the ASSA model.
The populations for the new health sub-districts were estimated from those of
the interim health sub-districts, based on an extrapolation of the proportional
composition of the new health districts when compared to the interim sub-
districts (by age and sex group). The common Census sub-place names were
identified for each of the new health sub-districts compared to the interim health
sub-districts to calculate the proportions in 1996 and 2001 for each age and sex
group. These proportions were extrapolated beyond 2001 and used to estimate

7
the new health sub-districts from the estimates of the interim health sub-
districts.
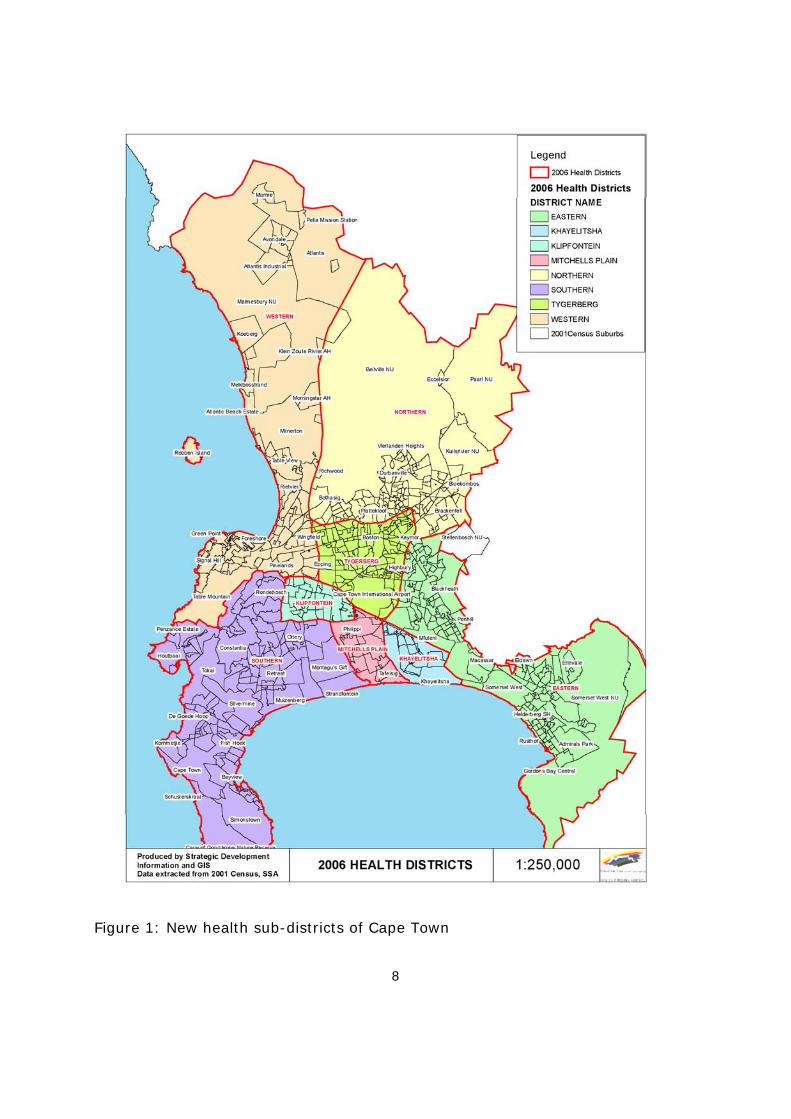
8
Figure 1: New health sub-districts of Cape Town
9
Figure 2: Old health sub-districts of Cape Town
10
Old subdistricts 2004
0
5000
10000
15000
20000
25000
YLLs
per
100
000
III. Injuries 2266 2168 2187 3899 4954 2251 5663 3110 1743 2685 2020II. Non-communicable diseases 7651 4061 4274 5293 7636 7417 6897 5720 4875 5918 5983HIV/AIDS 664 1036 1540 2018 5064 973 5571 1913 824 1968 496Comm excl HIV, mat, peri, nut 1559 1466 1738 3330 5451 1812 4427 2515 1454 2726 1843
Athlone Blaauw Central Helder Khay M Plain Nyanga Oos SPD Tyg Eas Tyg Wes
New sub-districts 2004
0
5000
10000
15000
20000
25000
YLLs
per
100
000
I. Other comm, mat, peri and nut 3848 5145 3917 3687 2165 1891 2630 2806
II. Non-communicable diseases 5869 7689 7064 7308 3602 4762 6955 4877
HIV/AIDS 1813 5487 3060 2063 1636 751 1159 1991
I. Other comm, mat, peri and nut 3202.4 5439.8 2873.4 2411.6 1783.9 1582.9 2228.8 1751.8
Eastern Khayelitsha Klipfontein Mitchells P Northern Southern Tygerberg Western
Figure 3: Comparison of premature mortality rates by cause group across old
and new sub-districts, Cape Town 2004
11
Table 1: Socio-economic indicators for Cape Town by old and interim sub-
districts (%)12,13
SUB-DISTRICT
Not on Medical
Aid
Informal dwelling
No
electricity
No piped water in dwelling or on site
Not
completed Matric
Unemployed
or the employable
Households
below poverty line
Old sub-districts
Athlone 75 4 1 1 75 25 24
Blaauwberg 57 8 9 6 64 20 24
Central 52 7 9 5 44 17 21
Helderberg 66 14 8 8 57 18 18
Khayelitsha 97 80 32 26 86 47 55
Mitchell’s Plain 81 6 4 5 80 24 18
Nyanga 97 64 54 29 85 50 57
Oostenberg 57 18 13 11 67 20 18
South 52 8 5 4 60 17 16
Tygerberg 55 7 6 5 54 18 16
Tygerberg 68 4 2 1 69 22 17
Interim sub-districts
Central 45 6 7 4 8 16 19
Eastern 70 14 9 8 16 20 18
Khayelitsha 99 80 32 26 26 47 55
Klipfontein 84 23 20 15 20 36 37
Mitchell’s Plain 88 41 23 21 20 33 30
N. Panorama 41 12 10 9 16 18 20
Southern 58 10 7 5 15 19 17
Tygerberg 49 4 2 0 15 22 17
Total 69 20 13 10 17 26 25
12
Results
Overview of mortality in Cape Town
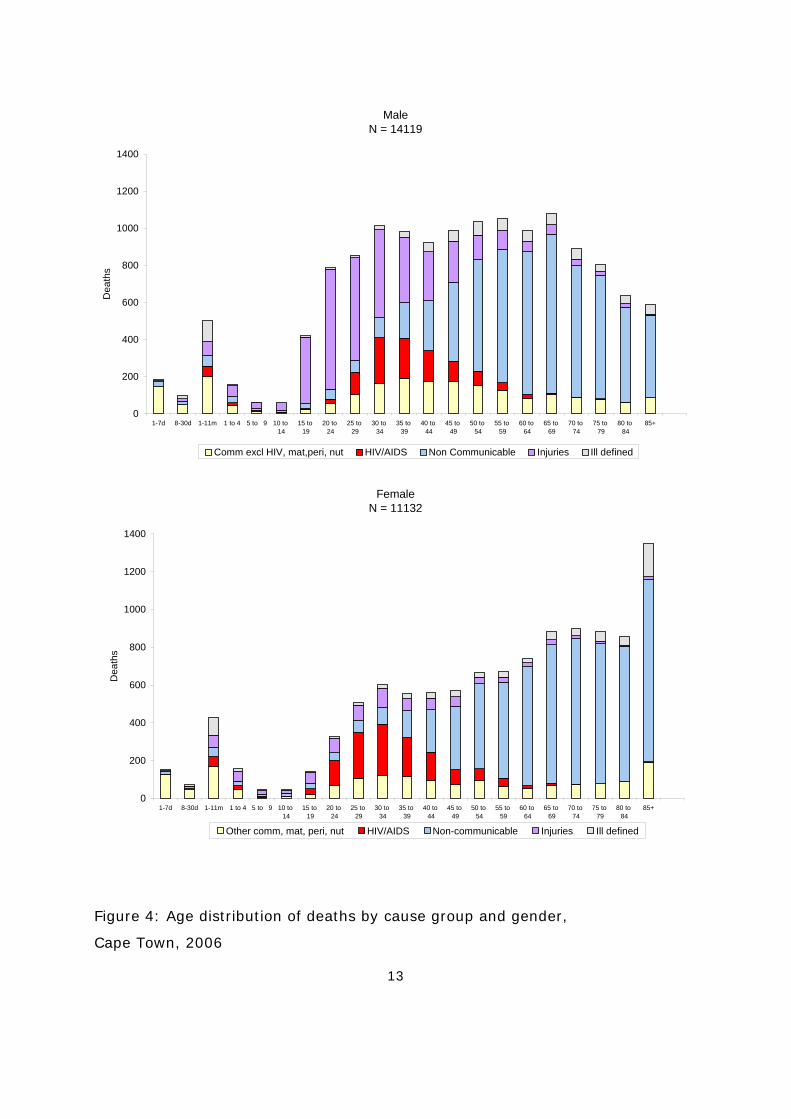
The age pattern of deaths in Cape Town in 2006 is shown for males and females
in Figure 4. This pattern is very similar to that observed in 2001,1 and is typical
of the quadruple burden of disease experienced by societies undergoing a
transition in their mortality patterns9: infectious disease mortality, primarily
among young children; high levels of mortality due to violence and injuries
among young adults; non-communicable diseases later in life; and the growing
HIV/AIDS epidemic impacting on young adults and young children. There are
considerable gender differences, with young adult males experiencing much
larger numbers of deaths than females, mainly due to violence and injuries.
HIV/AIDS accounts for a large proportion of deaths in young women.
Age-standardised rates
Figure 5 shows the trend in the age-standardised mortality rates. Please note
that data were incomplete during 2005, so these data were excluded. The overall
age-standardised mortality rate for females decreased slightly between 2001 and
2006. However, among women there was an increase in HIV/AIDS and other
group I cause mortality and a decrease in the non-communicable disease death
rate. The overall age-standardised mortality rate for males is much higher than
that for females and declined slightly during this period. The death rates from
injuries for men decreased markedly between 2002 and 2004 but increased
again in 2006. Mortality from non-communicable disease decreased, while there
was an increase in HIV/AIDS mortality rates.
Age standardisation. A technique which eliminates differences in observed
mortality rates caused by differences in the age structure of the population in
different areas.
13
MaleN = 14119
0
200
400
600
800
1000
1200
1400
1-7d 8-30d 1-11m 1 to 4 5 to 9 10 to 14
15 to 19
20 to 24
25 to 29
30 to 34
35 to 39
40 to 44
45 to 49
50 to 54
55 to 59
60 to 64
65 to 69
70 to 74
75 to 79
80 to 84
85+
Dea
ths
Comm excl HIV, mat,peri, nut HIV/AIDS Non Communicable Injuries Ill defined
FemaleN = 11132
0
200
400
600
800
1000
1200
1400
1-7d 8-30d 1-11m 1 to 4 5 to 9 10 to 14
15 to 19
20 to 24
25 to 29
30 to 34
35 to 39
40 to 44
45 to 49
50 to 54
55 to 59
60 to 64
65 to 69
70 to 74
75 to 79
80 to 84
85+
Dea
ths
Other comm, mat, peri, nut HIV/AIDS Non-communicable Injuries Ill defined
Figure 4: Age distribution of deaths by cause group and gender,
Cape Town, 2006
14
Males
0
200
400
600
800
1000
1200
1400
Dea
ths
per 1
00 0
00
Injuries 239 241 206 198 215
Non-communicable 803 763 752 740 697
HIV 53 69 81 79 73
Comm excl HIV, mat, peri, nut 168 172 157 164 174
2001 2002 2003 2004 2005 2006
Females
0
100
200
300
400
500
600
700
800
900
Dea
ths
per 1
00 0
00
Injuries 54 52 46 49 49
Non-communicable 574 550 549 542 509
HIV 58 69 80 83 79
Comm excl HIV, mat, peri, nut 113 110 106 103 119
2001 2002 2003 2004 2005 2006
Figure 5: Age-standardised mortality rate by broad cause group
by sex for Cape Town, 2001- 2006 (2005 excluded due to incomplete data)
2005
excluded
due to
incomplete
data
2005
excluded
due to
incomplete
data
15
0
200
400
600
800
1000
1200
1400
1600
1800
2000
Kha
yelit
sha
Eas
tern
Mitc
hels
Pla
in
Klip
font
ein
Tyge
rber
g
Wes
tern
Nor
ther
n
Sou
ther
n
Cap
e To
wn
Dea
ths
per 1
00 0
00
Other Communicable/mat/peri/nutrition HIV/AIDS Non-communicable diseases Injuries
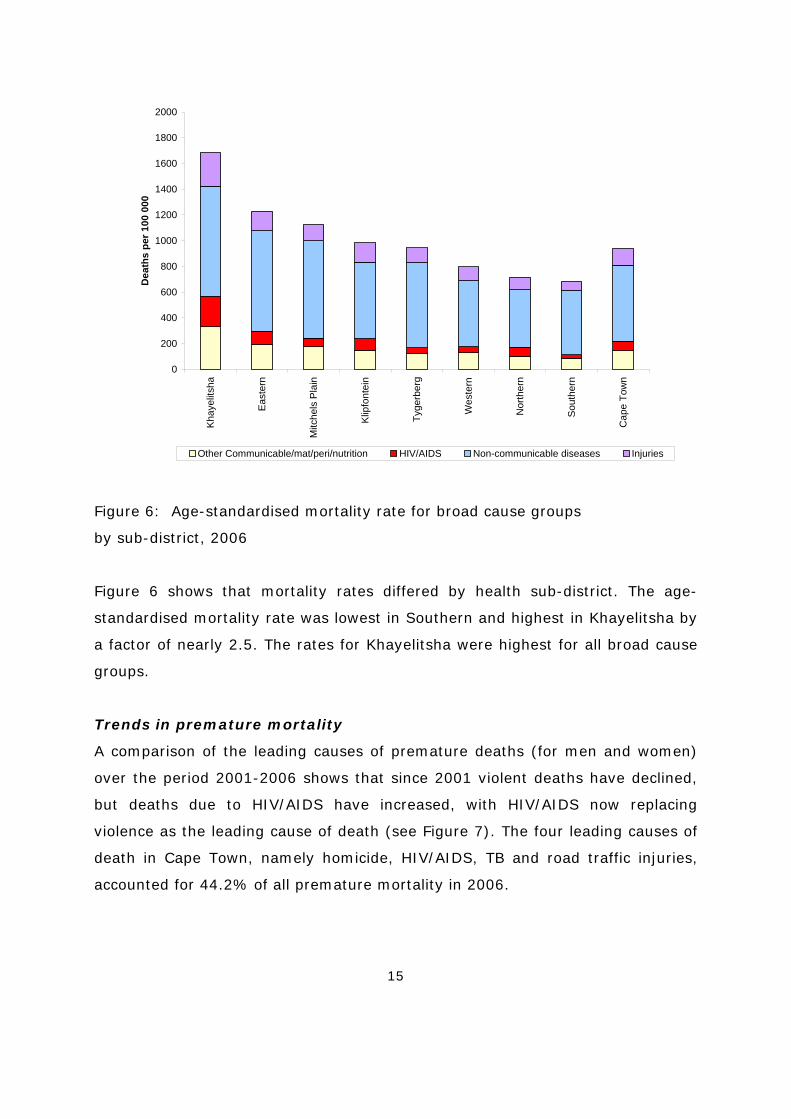
Figure 6: Age-standardised mortality rate for broad cause groups
by sub-district, 2006
Figure 6 shows that mortality rates differed by health sub-district. The age-
standardised mortality rate was lowest in Southern and highest in Khayelitsha by
a factor of nearly 2.5. The rates for Khayelitsha were highest for all broad cause
groups.
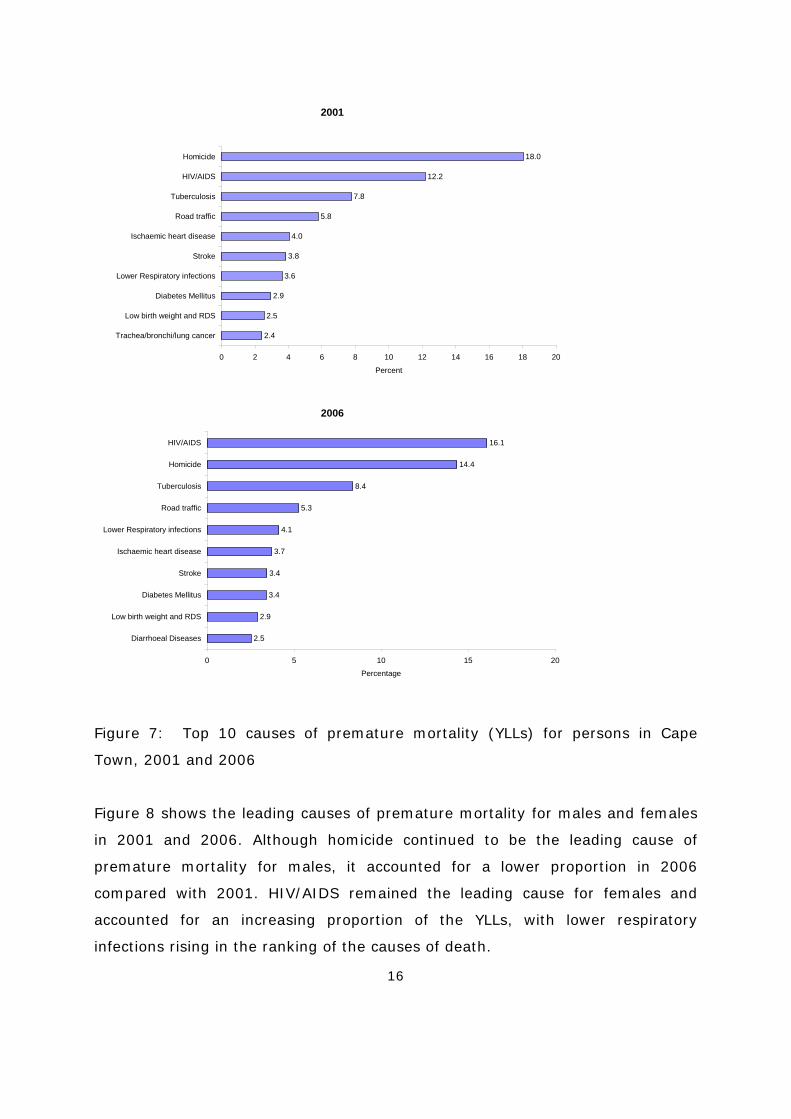
Trends in premature mortality
A comparison of the leading causes of premature deaths (for men and women)
over the period 2001-2006 shows that since 2001 violent deaths have declined,
but deaths due to HIV/AIDS have increased, with HIV/AIDS now replacing
violence as the leading cause of death (see Figure 7). The four leading causes of
death in Cape Town, namely homicide, HIV/AIDS, TB and road traffic injuries,
accounted for 44.2% of all premature mortality in 2006.
16
2001
18.0
12.2
7.8
5.8
4.0
3.8
3.6
2.9
2.5
2.4
0 2 4 6 8 10 12 14 16 18 20
Homicide
HIV/AIDS
Tuberculosis
Road traffic
Ischaemic heart disease
Stroke
Lower Respiratory infections
Diabetes Mellitus
Low birth weight and RDS
Trachea/bronchi/lung cancer
Percent
2006
16.1
14.4
8.4
5.3
4.1
3.7
3.4
3.4
2.9
2.5
0 5 10 15 20
HIV/AIDS
Homicide
Tuberculosis
Road traffic
Lower Respiratory infections
Ischaemic heart disease
Stroke
Diabetes Mellitus
Low birth weight and RDS
Diarrhoeal Diseases
Percentage
Figure 7: Top 10 causes of premature mortality (YLLs) for persons in Cape
Town, 2001 and 2006
Figure 8 shows the leading causes of premature mortality for males and females
in 2001 and 2006. Although homicide continued to be the leading cause of
premature mortality for males, it accounted for a lower proportion in 2006
compared with 2001. HIV/AIDS remained the leading cause for females and
accounted for an increasing proportion of the YLLs, with lower respiratory
infections rising in the ranking of the causes of death.
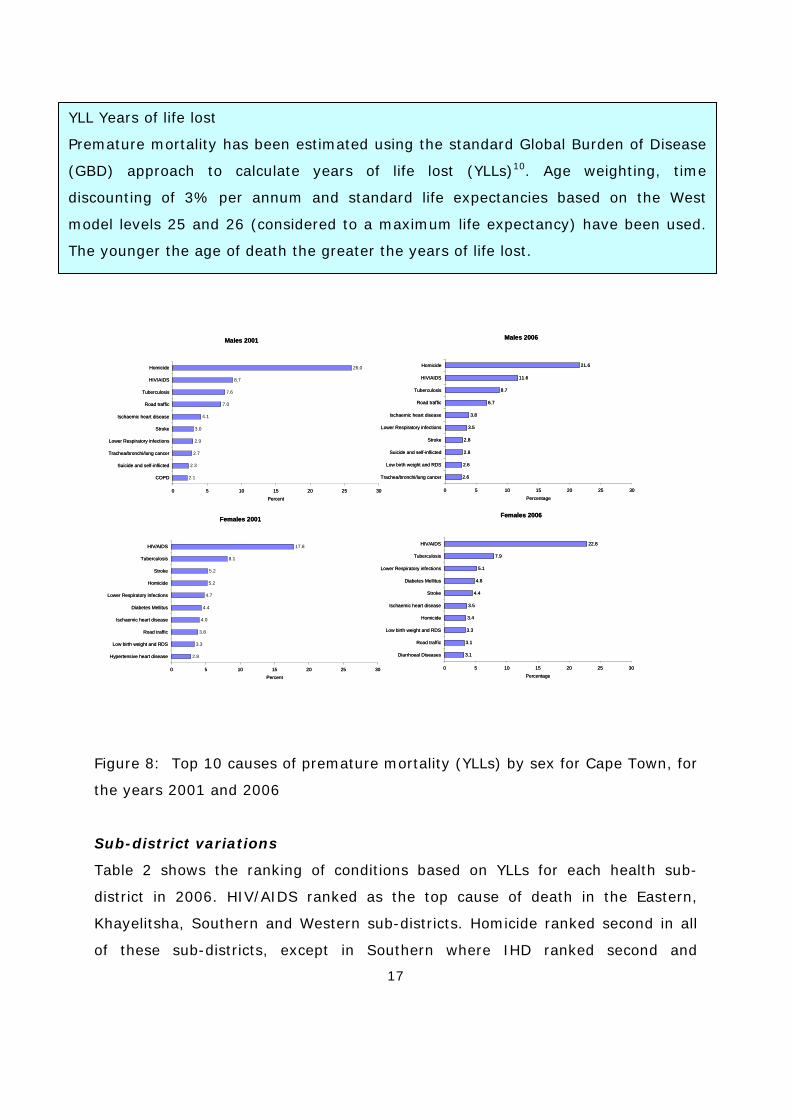
17
Figure 8: Top 10 causes of premature mortality (YLLs) by sex for Cape Town, for
the years 2001 and 2006
Sub-district variations
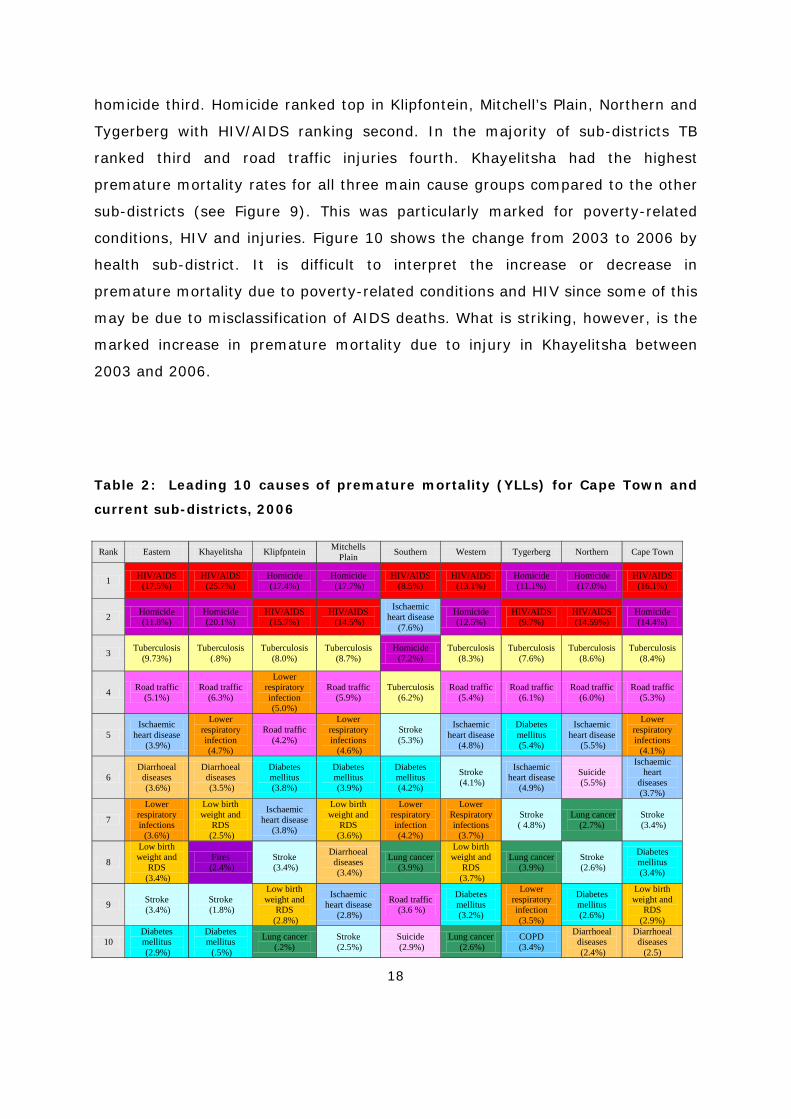
Table 2 shows the ranking of conditions based on YLLs for each health sub-
district in 2006. HIV/AIDS ranked as the top cause of death in the Eastern,
Khayelitsha, Southern and Western sub-districts. Homicide ranked second in all
of these sub-districts, except in Southern where IHD ranked second and
YLL Years of life lost
Premature mortality has been estimated using the standard Global Burden of Disease
(GBD) approach to calculate years of life lost (YLLs)10. Age weighting, time
discounting of 3% per annum and standard life expectancies based on the West
model levels 25 and 26 (considered to a maximum life expectancy) have been used.
The younger the age of death the greater the years of life lost.
Males 2001
26.0
8.7
7.6
7.0
4.1
3.0
2.9
2.7
2.3
2.1
0 5 10 15 20 25 30
Homicide
HIV/AIDS
Tuberculosis
Road traffic
Ischaemic heart disease
Stroke
Lower Respiratory infections
Trachea/bronchi/lung cancer
Suicide and self-inflicted
COPD
Percent
Males 2006
21.6
11.6
8.7
6.7
3.8
3.5
2.8
2.8
2.6
2.6
0 5 10 15 20 25 30
Homicide
HIV/AIDS
Tuberculosis
Road traffic
Ischaemic heart disease
Lower Respiratory infections
Stroke
Suicide and self-inflicted
Low birth weight and RDS
Trachea/bronchi/lung cancer
Percentage
Females 2006
22.8
7.9
5.1
4.8
4.4
3.5
3.4
3.3
3.1
3.1
0 5 10 15 20 25 30
HIV/AIDS
Tuberculosis
Lower Respiratory infections
Diabetes Mellitus
Stroke
Ischaemic heart disease
Homicide
Low birth weight and RDS
Road traffic
Diarrhoeal Diseases
Percentage
Females 2001
17.8
8.1
5.2
5.2
4.7
4.4
4.0
3.8
3.3
2.8
0 5 10 15 20 25 30
HIV/AIDS
Tuberculosis
Stroke
Homicide
Lower Respiratory infections
Diabetes Mellitus
Ischaemic heart disease
Road traffic
Low birth weight and RDS
Hypertensive heart disease
Percent
18
homicide third. Homicide ranked top in Klipfontein, Mitchell’s Plain, Northern and
Tygerberg with HIV/AIDS ranking second. In the majority of sub-districts TB
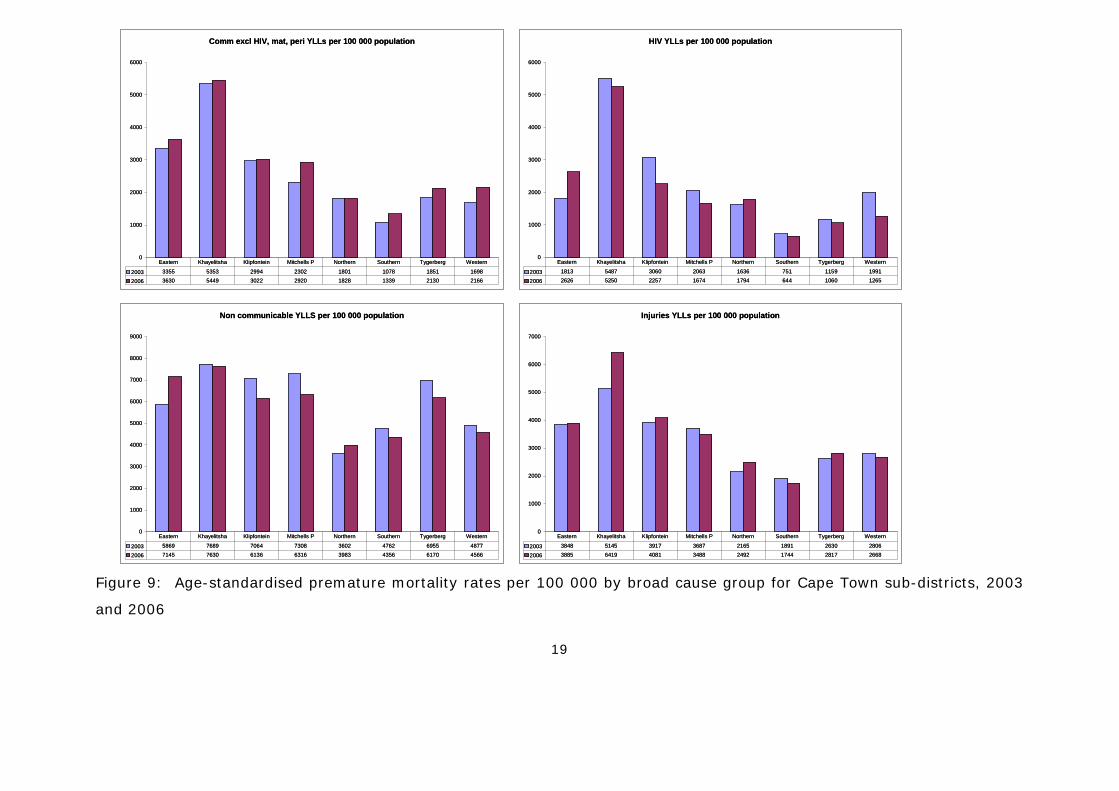
ranked third and road traffic injuries fourth. Khayelitsha had the highest
premature mortality rates for all three main cause groups compared to the other
sub-districts (see Figure 9). This was particularly marked for poverty-related
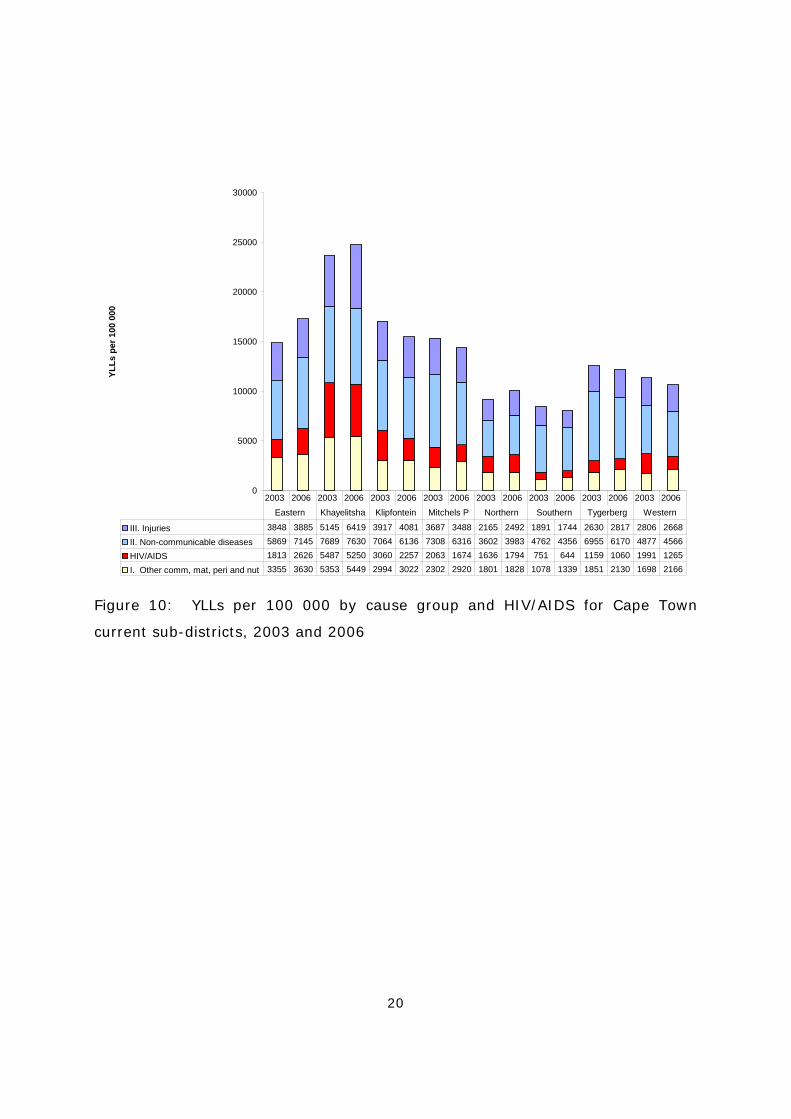
conditions, HIV and injuries. Figure 10 shows the change from 2003 to 2006 by
health sub-district. It is difficult to interpret the increase or decrease in
premature mortality due to poverty-related conditions and HIV since some of this
may be due to misclassification of AIDS deaths. What is striking, however, is the
marked increase in premature mortality due to injury in Khayelitsha between
2003 and 2006.
Table 2: Leading 10 causes of premature mortality (YLLs) for Cape Town and
current sub-districts, 2006
Rank Eastern Khayelitsha Klipfpntein Mitchells Plain Southern Western Tygerberg Northern Cape Town
1 HIV/AIDS (17.5%)
HIV/AIDS (25.7%)
Homicide (17.4%)
Homicide (17.7%)
HIV/AIDS (8.5%)
HIV/AIDS (13.1%)
Homicide (11.1%)
Homicide (17.0%)
HIV/AIDS (16.1%)
2 Homicide (11.8%)
Homicide (20.1%)
HIV/AIDS (15.7%)
HIV/AIDS (14.5%)
Ischaemic heart disease
(7.6%)
Homicide (12.5%)
HIV/AIDS (9.7%)
HIV/AIDS (14.59%)
Homicide (14.4%)
3 Tuberculosis (9.73%)
Tuberculosis (.8%)
Tuberculosis (8.0%)
Tuberculosis (8.7%)
Homicide (7.2%)
Tuberculosis (8.3%)
Tuberculosis (7.6%)
Tuberculosis (8.6%)
Tuberculosis (8.4%)
4 Road traffic (5.1%)
Road traffic (6.3%)
Lower respiratory infection (5.0%)
Road traffic (5.9%)
Tuberculosis (6.2%)
Road traffic (5.4%)
Road traffic (6.1%)
Road traffic (6.0%)
Road traffic (5.3%)
5 Ischaemic
heart disease (3.9%)
Lower respiratory infection (4.7%)
Road traffic (4.2%)
Lower respiratory infections (4.6%)
Stroke (5.3%)
Ischaemic heart disease
(4.8%)
Diabetes mellitus (5.4%)
Ischaemic heart disease
(5.5%)
Lower respiratory infections
(4.1%)
6 Diarrhoeal
diseases (3.6%)
Diarrhoeal diseases (3.5%)
Diabetes mellitus (3.8%)
Diabetes mellitus (3.9%)
Diabetes mellitus (4.2%)
Stroke (4.1%)
Ischaemic heart disease
(4.9%)
Suicide (5.5%)
Ischaemic heart
diseases (3.7%)
7
Lower respiratory infections
(3.6%)
Low birth weight and
RDS (2.5%)
Ischaemic heart disease
(3.8%)
Low birth weight and
RDS (3.6%)
Lower respiratory infection (4.2%)
Lower Respiratory infections
(3.7%)
Stroke ( 4.8%)
Lung cancer (2.7%)
Stroke (3.4%)
8
Low birth weight and
RDS (3.4%)
Fires (2.4%)
Stroke (3.4%)
Diarrhoeal diseases (3.4%)
Lung cancer (3.9%)
Low birth weight and
RDS (3.7%)
Lung cancer (3.9%)
Stroke (2.6%)
Diabetes mellitus (3.4%)
9 Stroke (3.4%)
Stroke (1.8%)
Low birth weight and
RDS (2.8%)
Ischaemic heart disease
(2.8%)
Road traffic (3.6 %)
Diabetes mellitus (3.2%)
Lower respiratory infection (3.5%)
Diabetes mellitus (2.6%)
Low birth weight and
RDS (2.9%)
10 Diabetes mellitus (2.9%)
Diabetes mellitus (.5%)
Lung cancer (.2%)
Stroke (2.5%)
Suicide (2.9%)
Lung cancer (2.6%)
COPD (3.4%)
Diarrhoeal diseases (2.4%)
Diarrhoeal diseases
(2.5)
19
Figure 9: Age-standardised premature mortality rates per 100 000 by broad cause group for Cape Town sub-districts, 2003
and 2006
Comm excl HIV, mat, peri YLLs per 100 000 population
0
1000
2000
3000
4000
5000
6000
2003 3355 5353 2994 2302 1801 1078 1851 1698
2006 3630 5449 3022 2920 1828 1339 2130 2166
Eastern Khayelitsha Klipfontein Mitchells P Northern Southern Tygerberg Western
HIV YLLs per 100 000 population
0
1000
2000
3000
4000
5000
6000
2003 1813 5487 3060 2063 1636 751 1159 1991
2006 2626 5250 2257 1674 1794 644 1060 1265
Eastern Khayelitsha Klipfontein Mitchells P Northern Southern Tygerberg Western
Non communicable YLLS per 100 000 population
0
1000
2000
3000
4000
5000
6000
7000
8000
9000
2003 5869 7689 7064 7308 3602 4762 6955 4877
2006 7145 7630 6136 6316 3983 4356 6170 4566
Eastern Khayelitsha Klipfontein Mitchells P Northern Southern Tygerberg Western
Injuries YLLs per 100 000 population
0
1000
2000
3000
4000
5000
6000
7000
2003 3848 5145 3917 3687 2165 1891 2630 2806
2006 3885 6419 4081 3488 2492 1744 2817 2668
Eastern Khayelitsha Klipfontein Mitchells P Northern Southern Tygerberg Western
20
0
5000
10000
15000
20000
25000
30000
YLLs
per
100
000
III. Injuries 3848 3885 5145 6419 3917 4081 3687 3488 2165 2492 1891 1744 2630 2817 2806 2668
II. Non-communicable diseases 5869 7145 7689 7630 7064 6136 7308 6316 3602 3983 4762 4356 6955 6170 4877 4566
HIV/AIDS 1813 2626 5487 5250 3060 2257 2063 1674 1636 1794 751 644 1159 1060 1991 1265
I. Other comm, mat, peri and nut 3355 3630 5353 5449 2994 3022 2302 2920 1801 1828 1078 1339 1851 2130 1698 2166
2003 2006 2003 2006 2003 2006 2003 2006 2003 2006 2003 2006 2003 2006 2003 2006
Eastern Khayelitsha Klipfontein Mitchels P Northern Southern Tygerberg Western
Figure 10: YLLs per 100 000 by cause group and HIV/AIDS for Cape Town
current sub-districts, 2003 and 2006

21
Important conditions
HIV and TB
The data for 2001 - 2006 show that HIV-related mortality has become the
leading cause of premature mortality in the city, and that TB remains the third.
HIV/AIDS and TB are closely linked. Aside from TB being one of the indicator
conditions for AIDS, there is clear evidence that the TB epidemic is being fuelled
by the HIV epidemic. These data therefore reflect the impact of the dual
HIV/AIDS and TB epidemics in this province. Where HIV/AIDS and TB were
reported on the death certificate, the underlying cause was assumed to be
HIV/AIDS, in accordance with ICD 10 guidelines.14 However, for TB programme
purposes this co-morbidity was recorded, and has been reported in Figure 10 as
“HIV/AIDS excluding TB” and “HIV/AIDS + TB”. In the rest of the document
figures reported for HIV/AIDS include both of the above. TB refers to deaths
certified with TB as the underlying cause with no mention of HIV/AIDS.
Variation between sub-districts
As with HIV prevalence patterns, there is evidence of wide differentials in the
HIV-related mortality rates by age, gender and geographical area.15 The HIV-
related premature mortality rates at the health sub-district level in the City of
Cape Town vary in terms of both magnitude and trends (Figure 11). Premature
mortality due to TB, HIV excluding TB and HIV/AIDS + TB were highest in
Khayelitsha and lowest in Southern in 2006. The rates in Khayelitsha were
almost 8x those in Southern. Eastern had the second highest premature
mortality rates in 2006 followed by Klipfontein. In the majority of sub-districts
the premature mortality rates for TB, HIV excluding TB and HIV + TB decreased
between 2003 and 2006. In contrast, there was a marked increase in premature
mortality rates for all three categories in Eastern. A slight increase in premature
mortality rates for HIV/AIDS and TB was noted in Eastern and Northern between
2003 and 2006.
22
0
1000
2000
3000
4000
5000
6000
7000
8000
9000YL
Ls p
er 1
00 0
00
Tuberculosis 1208 1566 2631 2390 1453 1198 962 1159 725 668 264 482 717 862 692 829
HIV/AIDS excl TB 1181 1629 3157 2788 1771 1157 1218 902 1046 928 399 355 727 646 1145 801
HIV/AIDS + TB 632 997 2330 2462 1289 1100 844 771 590 866 352 289 432 414 846 464
2003 2006 2003 2006 2003 2006 2003 2006 2003 2006 2003 2006 2003 2006 2003 2006
Eastern Khayelitsha Klipfontein Mitchels P Northern Southern Tygerberg Western
Figure 11: Age-standardised premature mortality rates for TB, HIV + TB and HIV
for persons by sub-district, Cape Town, 2003 and 2006
An examination of the top 10 causes of premature mortality across the health
sub-districts revealed that 4 out of 8 health sub-districts in the Cape Metropole
reported HIV/AIDS as the leading cause of premature mortality, with HIV/AIDS
ranked second in the remaining 4 in 2006 (see Table 2).
Age and gender differences
Trends of age-specific deaths due to HIV/AIDS revealed a notable increase in
mortality for both males and females for the period 2001 to 2004, with a slight
decrease in 2006 (Figure 12). The decrease was particularly marked for children
Underlying cause of death. In accordance with ICD 10 guidelines14,
HIV/AIDS was selected as the underlying causes when both tuberculosis
and HIV/AIDS appeared on the death certificate.

23
but was absent in the case of older females over 55 years, for whom there was a
slight increase. The highest rates were observed in women aged 25-34 years of
age and in men, a decade older, at 35-44 years of age.
Figure 12: Age-specific death rates for HIV and TB by gender,
Cape Town, 2001 and 2006
Figure 12 also shows the age-specific death rates due to TB. There are stark
differences by gender. Adult TB mortality rates were higher for males than
females. While there has been little change in the TB mortality rates for females,
there was a decline in the older ages for men to a low in 2004, which has
appeared to have reversed by 2006.
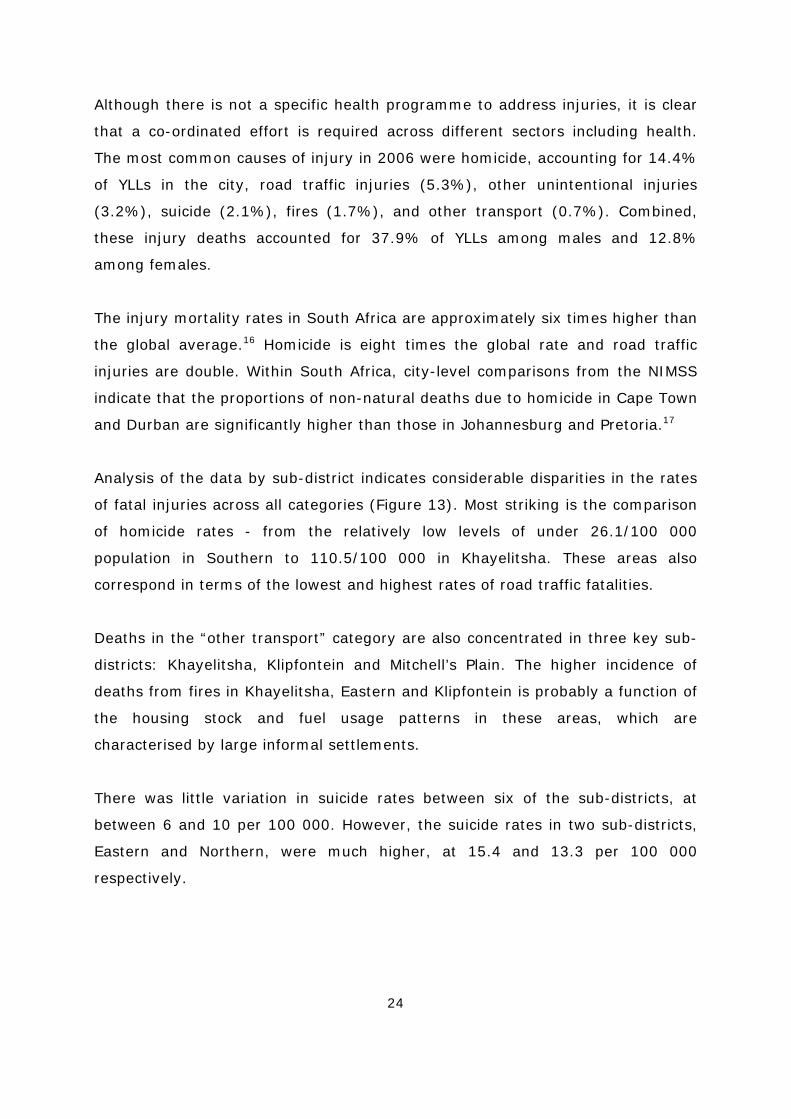
Injuries
Despite the dramatic increase in deaths due to HIV/AIDS between 2001 and
2004, deaths due to non-natural causes (i.e. violence and injuries) remain
among the greatest contributors to premature mortality among Capetonians.
HIV Males
0
50
100
150
200
0-4 5-14 15-24 25-34 35-44 45-54 55-64 65-74 75+
TB Males
0
50
100
150
200
0-4 5-14 15-24 25-34 35-44 45-54 55-64 65-74 75+
200120042006
TB Females
0
50
100
150
200
0-4 5-14 15-24 25-34 35-44 45-54 55-64 65-74 75+
200120042006
HIV Females
0
50
100
150
200
0-4 5-14 15-24 25-34 35-44 45-54 55-64 65-74 75+
200120042006
24
Although there is not a specific health programme to address injuries, it is clear
that a co-ordinated effort is required across different sectors including health.
The most common causes of injury in 2006 were homicide, accounting for 14.4%
of YLLs in the city, road traffic injuries (5.3%), other unintentional injuries
(3.2%), suicide (2.1%), fires (1.7%), and other transport (0.7%). Combined,
these injury deaths accounted for 37.9% of YLLs among males and 12.8%
among females.
The injury mortality rates in South Africa are approximately six times higher than
the global average.16 Homicide is eight times the global rate and road traffic
injuries are double. Within South Africa, city-level comparisons from the NIMSS
indicate that the proportions of non-natural deaths due to homicide in Cape Town
and Durban are significantly higher than those in Johannesburg and Pretoria.17
Analysis of the data by sub-district indicates considerable disparities in the rates
of fatal injuries across all categories (Figure 13). Most striking is the comparison
of homicide rates - from the relatively low levels of under 26.1/100 000
population in Southern to 110.5/100 000 in Khayelitsha. These areas also
correspond in terms of the lowest and highest rates of road traffic fatalities.
Deaths in the “other transport” category are also concentrated in three key sub-
districts: Khayelitsha, Klipfontein and Mitchell’s Plain. The higher incidence of
deaths from fires in Khayelitsha, Eastern and Klipfontein is probably a function of
the housing stock and fuel usage patterns in these areas, which are
characterised by large informal settlements.
There was little variation in suicide rates between six of the sub-districts, at
between 6 and 10 per 100 000. However, the suicide rates in two sub-districts,
Eastern and Northern, were much higher, at 15.4 and 13.3 per 100 000
respectively.
25
Injuries persons
0
50
100
150
200
250
Dea
ths
per 1
00 0
00
Homicide 64.9 110.5 79.0 68.0 38.7 26.1 42.3 43.1 57.5
Suicide 15.4 8.0 6.9 6.2 13.3 7.8 9.5 8.2 9.0
Other unint 13.6 18.4 18.8 12.7 10.0 18.3 14.9 23.2 17.2
Fires 11.4 21.1 9.1 7.1 3.5 5.6 5.3 7.8 8.0
Drowning 4.5 2.2 0.9 2.0 2.3 3.1 2.3 1.3 2.2
Other transport 3.9 5.4 5.1 4.6 2.6 1.4 3.9 2.7 3.5
Road Traffic 36.0 59.2 30.5 29.0 20.0 13.0 27.2 20.6 26.8
Eastern Khayelitsha Klipfontein Mitchels P Northern Southern Tygerberg Western Cape Town
Figure 13: Age-standardised death rates (pooled estimates)
due to injuries by sub-district, Cape Town 2003, 2004, 2006
Homicide remains the leading cause of premature mortality among males in Cape
Town, but its contribution to total YLLs in the city has dropped from 26% in 2001
to 21.6% in 2006. Similarly, the contribution of homicide to premature mortality
among females has dropped from 5.2% to 3.4%, and its rank dropped from
fourth to seventh position between 2001 and 2006.
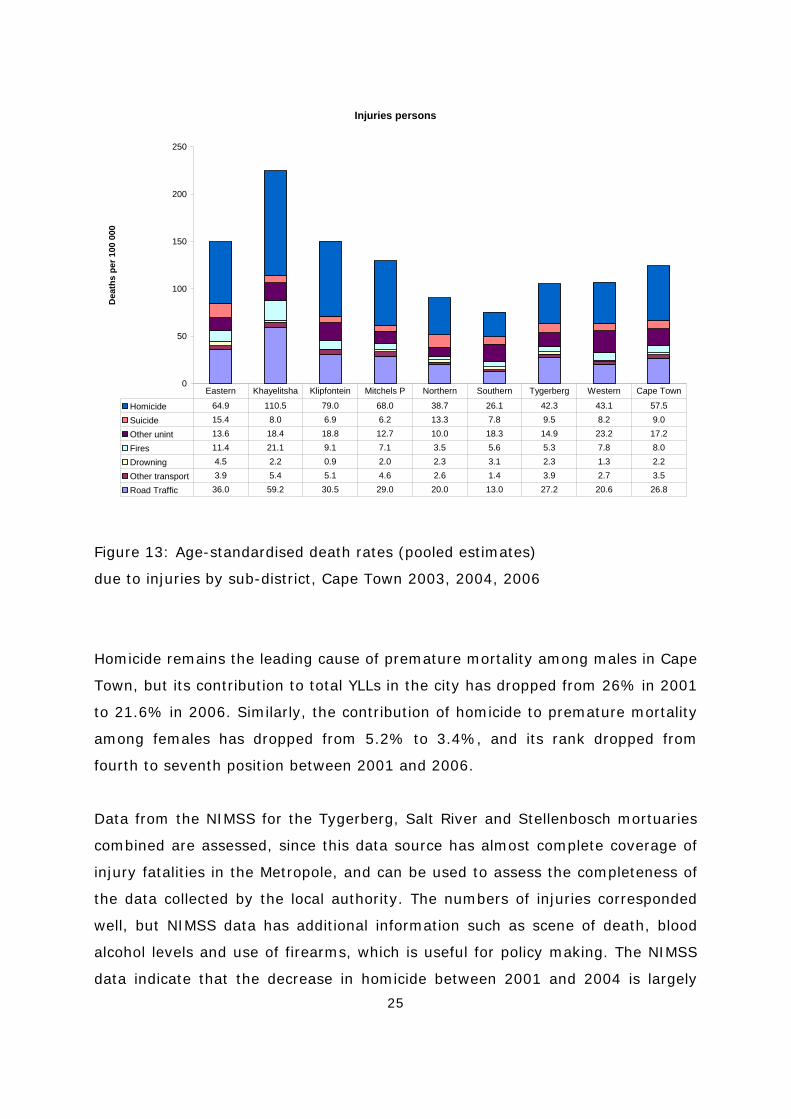
Data from the NIMSS for the Tygerberg, Salt River and Stellenbosch mortuaries
combined are assessed, since this data source has almost complete coverage of
injury fatalities in the Metropole, and can be used to assess the completeness of
the data collected by the local authority. The numbers of injuries corresponded
well, but NIMSS data has additional information such as scene of death, blood
alcohol levels and use of firearms, which is useful for policy making. The NIMSS
data indicate that the decrease in homicide between 2001 and 2004 is largely
26
due to the significant decrease in firearm-related homicides from 2002 to 2004,
whereas non-firearm homicide rates have remained fairly stable (Figure 14).8
Reasons for the decrease are uncertain, but heightened public awareness prior to
the introduction of stricter gun control legislation and the effectiveness of
targeted policing initiatives have been offered as possible contributing factors.
Figure 14: Firearm and non-firearm homicide rates in Cape Town, 2001 - 20058
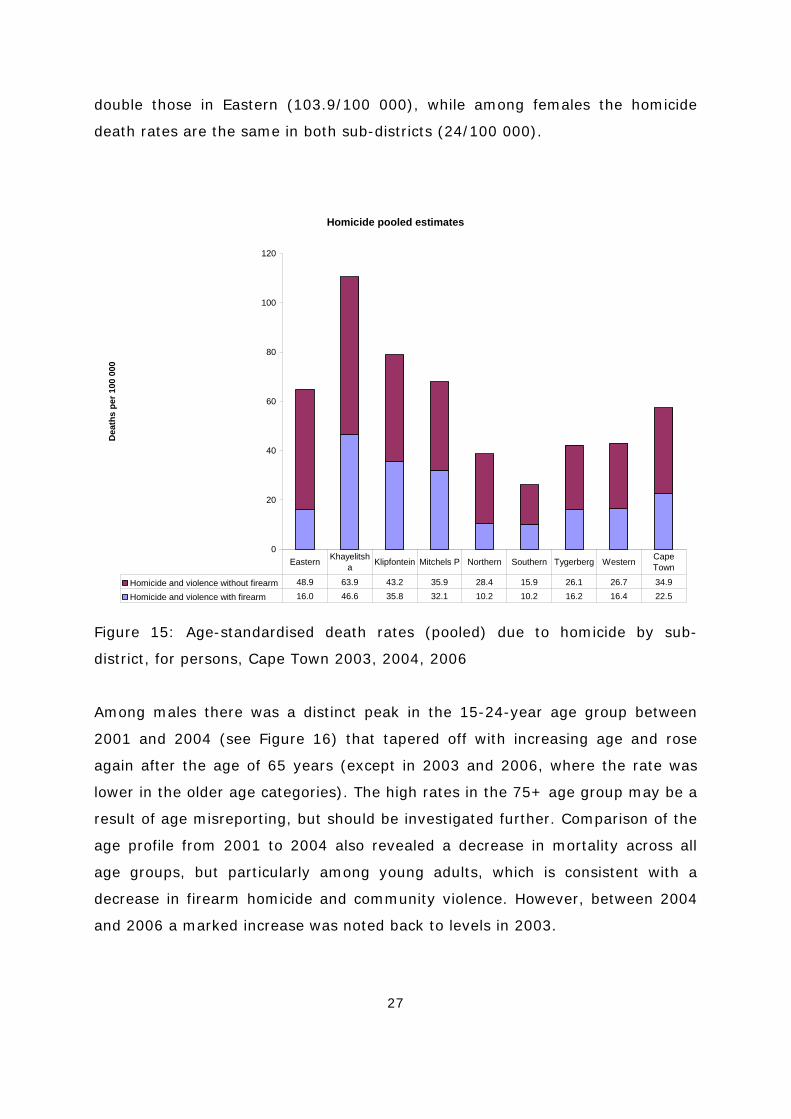
The analysis of homicide rates by sub-district has further implications for firearm
control interventions. As well as the high rates of gun violence in the sub-
districts already noted for high homicide rates (i.e. Khayelitsha and Klipfontein),
a disproportionately large percentage of firearm homicides were recorded in
Mitchell’s Plain and Klipfontein (Figure 15).
The gender ratio of homicide in Cape Town is 9 male deaths for every female
death, but homicide rates among females do not follow the same pattern as in
males across sub-districts. In males the pattern is similar to that in Figure 14,
where rates are highest in Khayelitsha followed by Klipfontein, Mitchell’s Plain
and then Eastern. The male homicide rates in Khayelitsha (204.8/100 000) are
05
1015202530354045
2001 2002 2003 2004 2005
Age
stan
dard
ised
mor
talit
y ra
te p
er10
0,00
0 po
pula
tion
Firearm homicide Non-firearm homicide
27
double those in Eastern (103.9/100 000), while among females the homicide
death rates are the same in both sub-districts (24/100 000).
Homicide pooled estimates
0
20
40
60
80
100
120
Dea
ths
per 1
00 0
00
Homicide and violence without firearm 48.9 63.9 43.2 35.9 28.4 15.9 26.1 26.7 34.9
Homicide and violence with firearm 16.0 46.6 35.8 32.1 10.2 10.2 16.2 16.4 22.5
Eastern Khayelitsha Klipfontein Mitchels P Northern Southern Tygerberg Western Cape
Town
Figure 15: Age-standardised death rates (pooled) due to homicide by sub-
district, for persons, Cape Town 2003, 2004, 2006
Among males there was a distinct peak in the 15-24-year age group between
2001 and 2004 (see Figure 16) that tapered off with increasing age and rose
again after the age of 65 years (except in 2003 and 2006, where the rate was
lower in the older age categories). The high rates in the 75+ age group may be a
result of age misreporting, but should be investigated further. Comparison of the
age profile from 2001 to 2004 also revealed a decrease in mortality across all
age groups, but particularly among young adults, which is consistent with a
decrease in firearm homicide and community violence. However, between 2004
and 2006 a marked increase was noted back to levels in 2003.
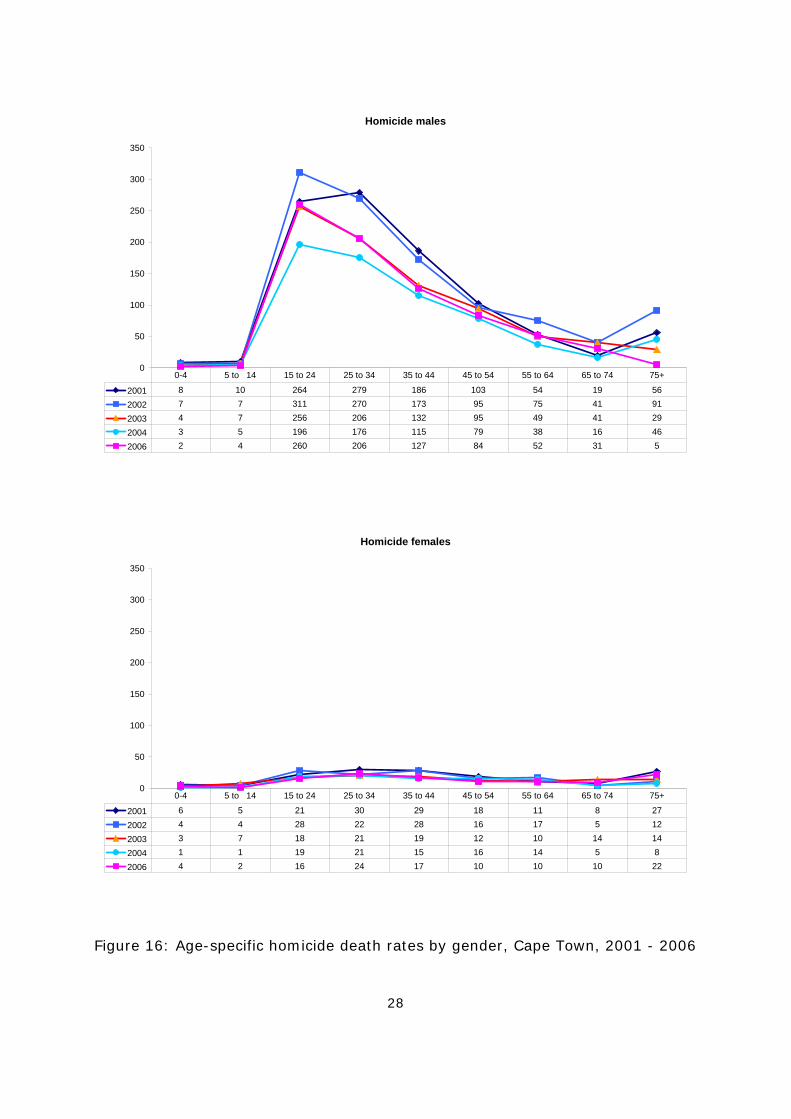
28
Homicide males
0
50
100
150
200
250
300
350
2001 8 10 264 279 186 103 54 19 56
2002 7 7 311 270 173 95 75 41 91
2003 4 7 256 206 132 95 49 41 29
2004 3 5 196 176 115 79 38 16 46
2006 2 4 260 206 127 84 52 31 5
0-4 5 to 14 15 to 24 25 to 34 35 to 44 45 to 54 55 to 64 65 to 74 75+
Homicide females
0
50
100
150
200
250
300
350
2001 6 5 21 30 29 18 11 8 27
2002 4 4 28 22 28 16 17 5 12
2003 3 7 18 21 19 12 10 14 14
2004 1 1 19 21 15 16 14 5 8
2006 4 2 16 24 17 10 10 10 22
0-4 5 to 14 15 to 24 25 to 34 35 to 44 45 to 54 55 to 64 65 to 74 75+
Figure 16: Age-specific homicide death rates by gender, Cape Town, 2001 - 2006
29
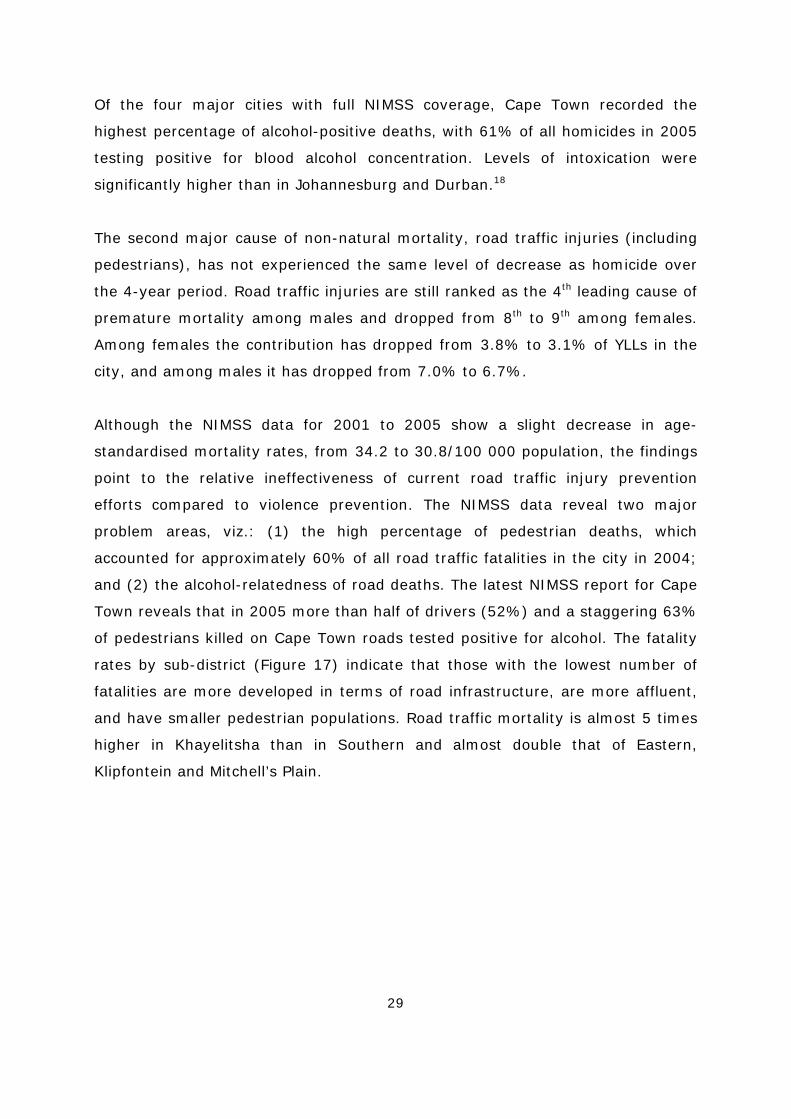
Of the four major cities with full NIMSS coverage, Cape Town recorded the
highest percentage of alcohol-positive deaths, with 61% of all homicides in 2005
testing positive for blood alcohol concentration. Levels of intoxication were
significantly higher than in Johannesburg and Durban.18
The second major cause of non-natural mortality, road traffic injuries (including
pedestrians), has not experienced the same level of decrease as homicide over
the 4-year period. Road traffic injuries are still ranked as the 4th leading cause of
premature mortality among males and dropped from 8th to 9th among females.
Among females the contribution has dropped from 3.8% to 3.1% of YLLs in the
city, and among males it has dropped from 7.0% to 6.7%.
Although the NIMSS data for 2001 to 2005 show a slight decrease in age-
standardised mortality rates, from 34.2 to 30.8/100 000 population, the findings
point to the relative ineffectiveness of current road traffic injury prevention
efforts compared to violence prevention. The NIMSS data reveal two major
problem areas, viz.: (1) the high percentage of pedestrian deaths, which
accounted for approximately 60% of all road traffic fatalities in the city in 2004;
and (2) the alcohol-relatedness of road deaths. The latest NIMSS report for Cape
Town reveals that in 2005 more than half of drivers (52%) and a staggering 63%
of pedestrians killed on Cape Town roads tested positive for alcohol. The fatality
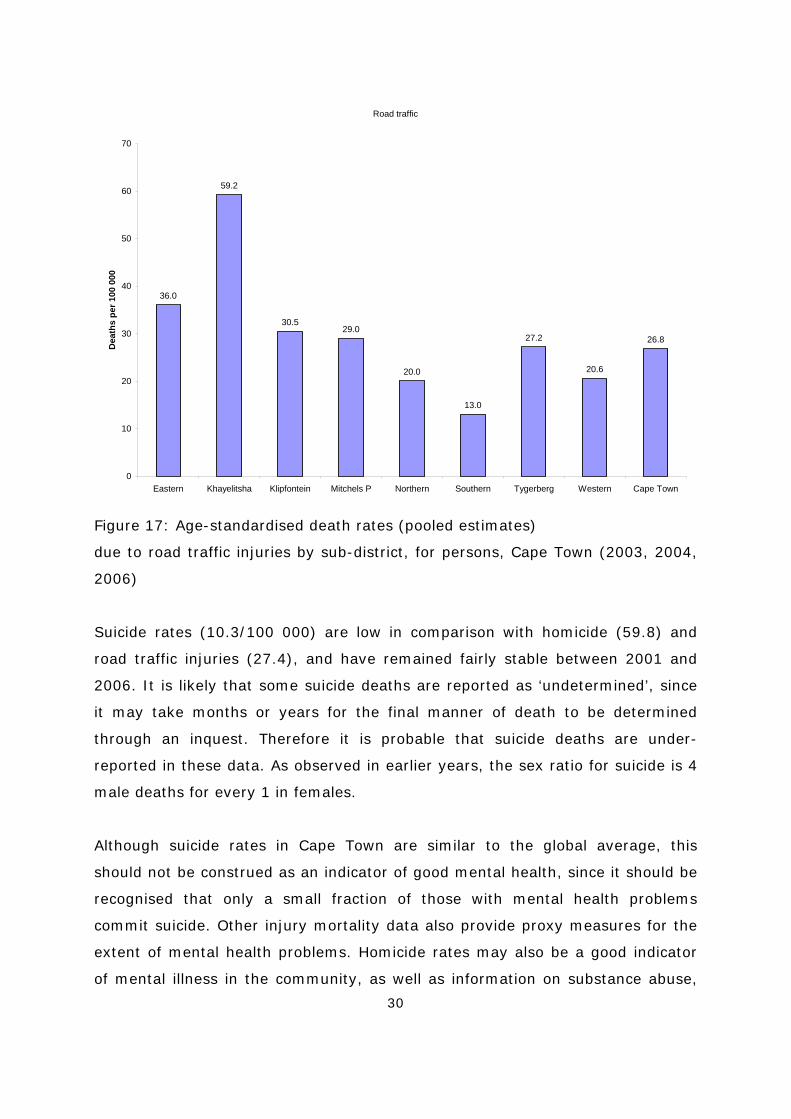
rates by sub-district (Figure 17) indicate that those with the lowest number of
fatalities are more developed in terms of road infrastructure, are more affluent,
and have smaller pedestrian populations. Road traffic mortality is almost 5 times
higher in Khayelitsha than in Southern and almost double that of Eastern,
Klipfontein and Mitchell’s Plain.
30
Road traffic
36.0
59.2
30.529.0
20.0
13.0
27.2
20.6
26.8
0
10
20
30
40
50
60
70
Eastern Khayelitsha Klipfontein Mitchels P Northern Southern Tygerberg Western Cape Town
Dea
ths
per 1
00 0
00
Figure 17: Age-standardised death rates (pooled estimates)
due to road traffic injuries by sub-district, for persons, Cape Town (2003, 2004,
2006)
Suicide rates (10.3/100 000) are low in comparison with homicide (59.8) and
road traffic injuries (27.4), and have remained fairly stable between 2001 and
2006. It is likely that some suicide deaths are reported as ‘undetermined’, since
it may take months or years for the final manner of death to be determined
through an inquest. Therefore it is probable that suicide deaths are under-
reported in these data. As observed in earlier years, the sex ratio for suicide is 4
male deaths for every 1 in females.
Although suicide rates in Cape Town are similar to the global average, this
should not be construed as an indicator of good mental health, since it should be
recognised that only a small fraction of those with mental health problems
commit suicide. Other injury mortality data also provide proxy measures for the
extent of mental health problems. Homicide rates may also be a good indicator
of mental illness in the community, as well as information on substance abuse,

31
which falls within the spectrum of mental illness. As indicated earlier in this
chapter, homicide rates in Cape Town are abnormally high, and the majority of
deaths due to violence and traffic were alcohol-positive. The importance of
recognising the weighty contribution of mental health problems to YLLs in the
province relates to the necessity to plan for mental health and substance abuse
services in the context of the Western Cape having the highest proportions of
premature deaths due to injuries in the country.
32
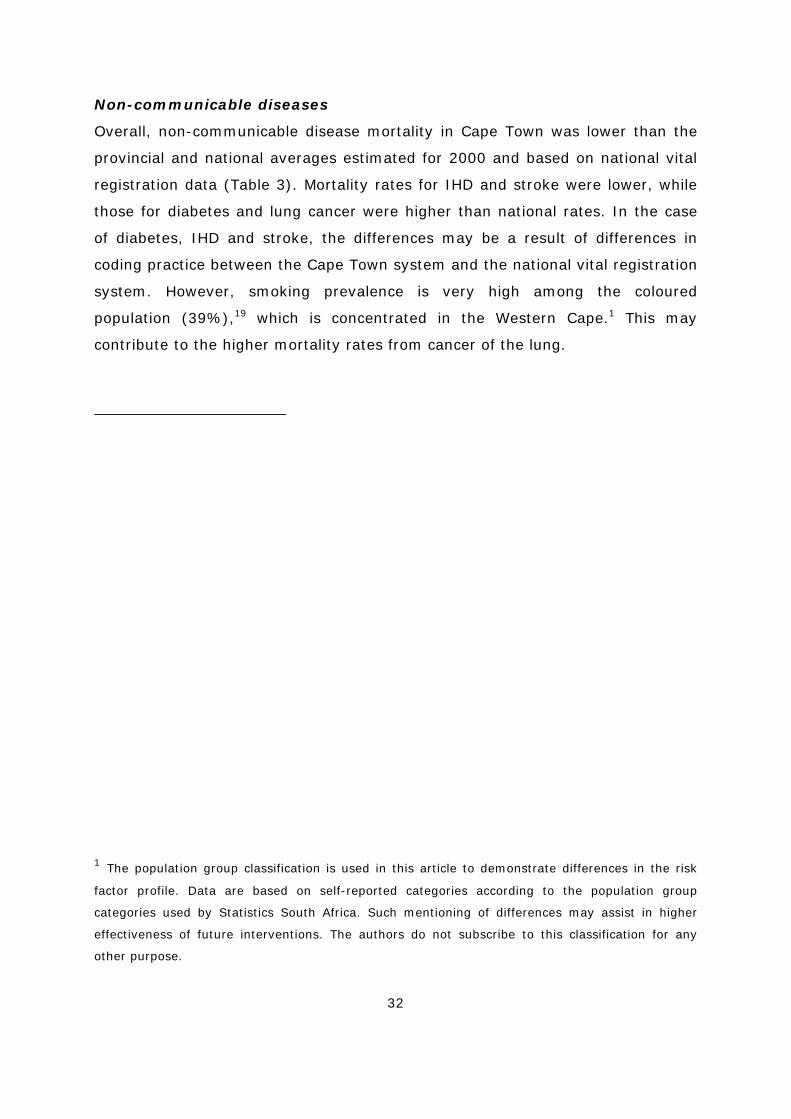
Non-communicable diseases
Overall, non-communicable disease mortality in Cape Town was lower than the
provincial and national averages estimated for 2000 and based on national vital
registration data (Table 3). Mortality rates for IHD and stroke were lower, while
those for diabetes and lung cancer were higher than national rates. In the case
of diabetes, IHD and stroke, the differences may be a result of differences in
coding practice between the Cape Town system and the national vital registration
system. However, smoking prevalence is very high among the coloured
population (39%),19 which is concentrated in the Western Cape.1 This may
contribute to the higher mortality rates from cancer of the lung.
1 The population group classification is used in this article to demonstrate differences in the risk
factor profile. Data are based on self-reported categories according to the population group
categories used by Statistics South Africa. Such mentioning of differences may assist in higher
effectiveness of future interventions. The authors do not subscribe to this classification for any
other purpose.
33
Table 3: Comparison of National, Western Cape, and Cape Town
age-standardised mortality rates for non-communicable diseases
Age-standardised mortality rates per 100 000 Condition
SA 200020 WC 200020 CT 2001 CT 2006
IHD 123 169 101 86
Hypertension 68 28 42 28
Stroke 124 122 86 77
Diabetes 53 52 63 65
Chronic Obstructive Pulmonary disease (COPD)
49 52 42 35
Lung cancer 24 56 41 40
Oesophageal cancer 17 15 12 11
Colon cancer 9 15 15 14
All non-communicable 756 768 674 590
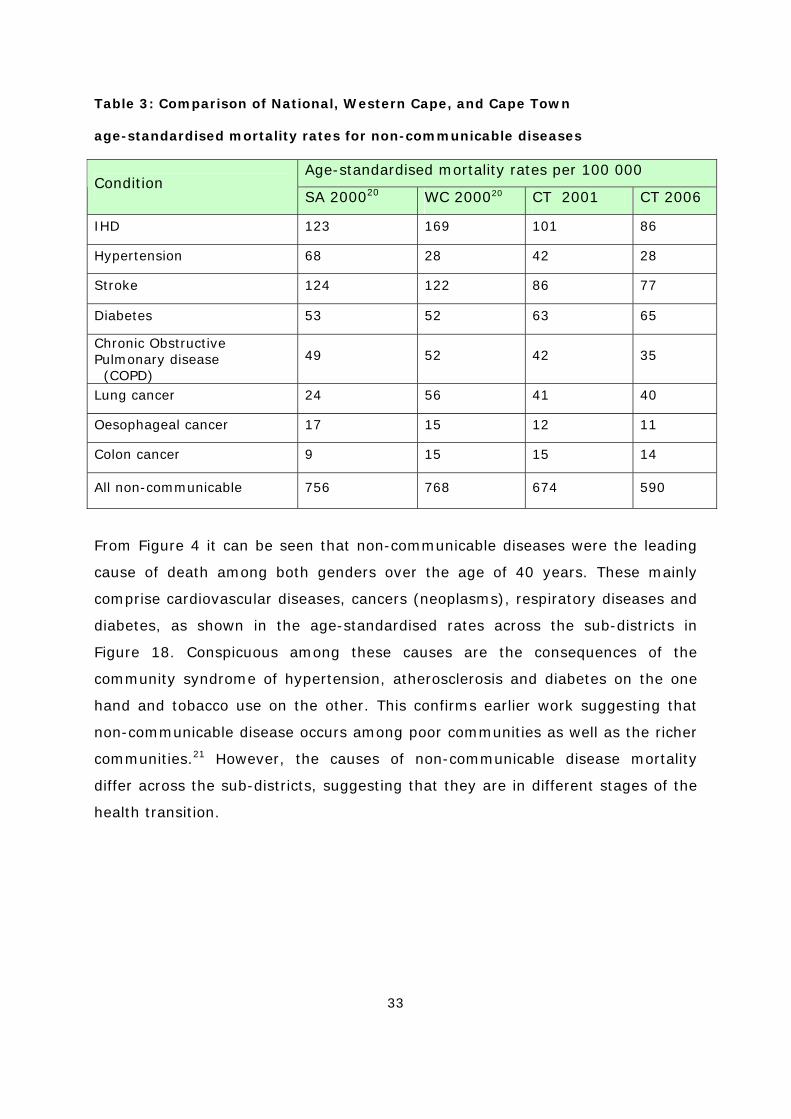
From Figure 4 it can be seen that non-communicable diseases were the leading
cause of death among both genders over the age of 40 years. These mainly
comprise cardiovascular diseases, cancers (neoplasms), respiratory diseases and
diabetes, as shown in the age-standardised rates across the sub-districts in
Figure 18. Conspicuous among these causes are the consequences of the
community syndrome of hypertension, atherosclerosis and diabetes on the one
hand and tobacco use on the other. This confirms earlier work suggesting that
non-communicable disease occurs among poor communities as well as the richer
communities.21 However, the causes of non-communicable disease mortality
differ across the sub-districts, suggesting that they are in different stages of the
health transition.
34
0
100
200
300
400
500
600
700
800
900D
eath
s pe
r 100
000
Other 75.2 103.2 74.7 79.4 52.5 60.2 73.8 65.4 69.9
Congenital abnormalities 4.5 4.4 2.6 4.5 3.0 3.6 3.5 2.9 3.7
Diabetes mellitus 57.3 107.3 97.6 140.2 33.4 47.4 85.1 51.3 67.8
Respiratory disease 68.3 97.1 64.3 82.0 34.0 48.7 69.6 48.2 59.1
Cardiovascular disease 324.9 317.3 268.2 321.8 172.2 207.5 285.8 222.8 249.2
Neoplasms 186.9 215.0 169.3 182.2 136.7 158.1 194.1 149.6 168.0
Eastern Khayelitsha Klipfontein Mitchels P Northern Southern Tygerberg Western Cape Town
Figure 18: Age-standardised cause of death rates for non-communicable diseases
by sub-district, for persons, Cape Town, (pooled estimates 2003, 2004, 2006)
The cardiovascular transition is described by Yusuf et al.22 as having 5 stages, as
shown in Table 4. As populations move from conditions of under-development
towards industrialised societies, the cardiovascular disease profile changes from
one related to infections and undernutrition. In the second stage, hypertensive
heart disease and haemorrhagic stroke predominate. This is followed by the
stage of increasing obesity, diabetes, all forms of stroke and IHD affecting young
ages. The fourth stage is indicated by a shift in the IHD and stroke mortality to
older ages, and is the current experience of many Western countries. Yusuf et al.
have added the final stage based on the experience in parts of Eastern Europe,
with the re-emergence of conditions related to infections and alcohol.

35
Table 4: Epidemiological transition of cardiovascular diseases (Yusuf et al.22)
Stages/ages CVD
deaths
% of total
Predominant CVD and risk factors
1. Pestilence and
famine
5 – 10 Rheumatic heart, infectious and
nutritional cardiomyopathies
2. Receding
pandemics
10 – 35 Hypertensive heart disease and
haemorrhagic stroke
3. Degenerative
diseases
35 – 50 All forms of stroke, IHD at young
ages,
increasing obesity and diabetes
4. Delayed
degenerative
disease
< 50 Stroke and IHD at old age
5. Regression and
social upheaval
35 – 50 Re-emergence of rheumatic heart
disease, infections, increased
alcoholism and violence, increased
CVD in young
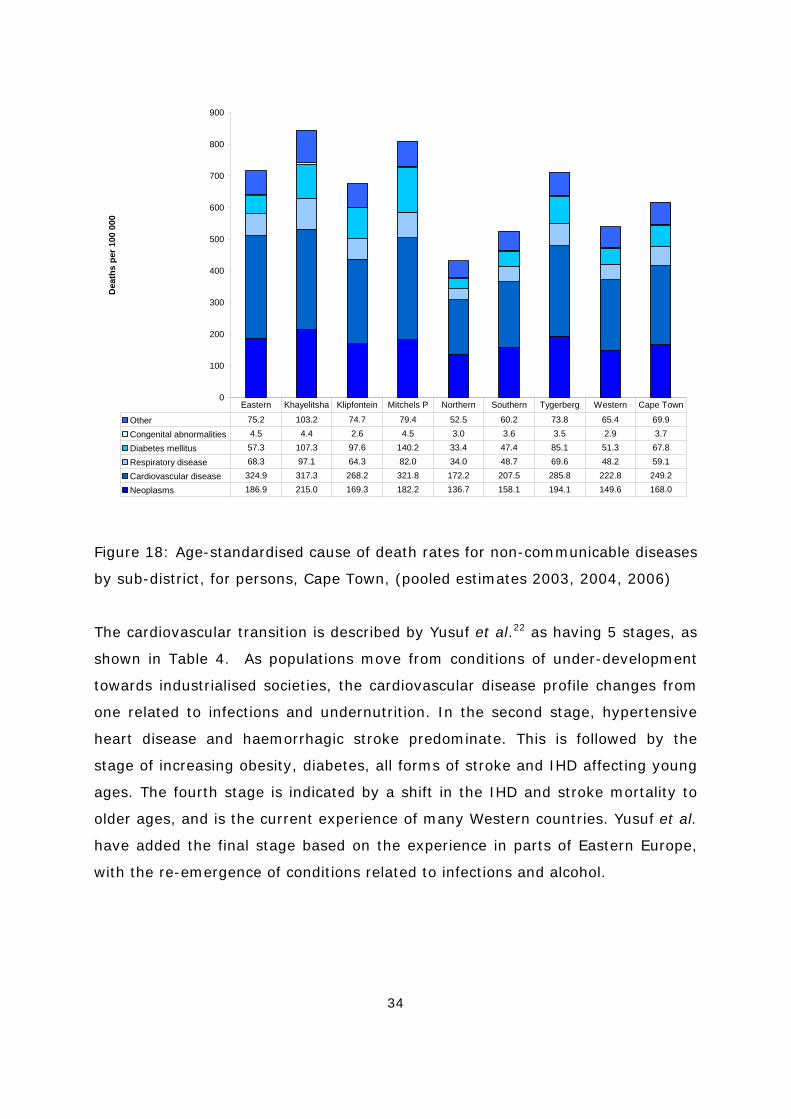
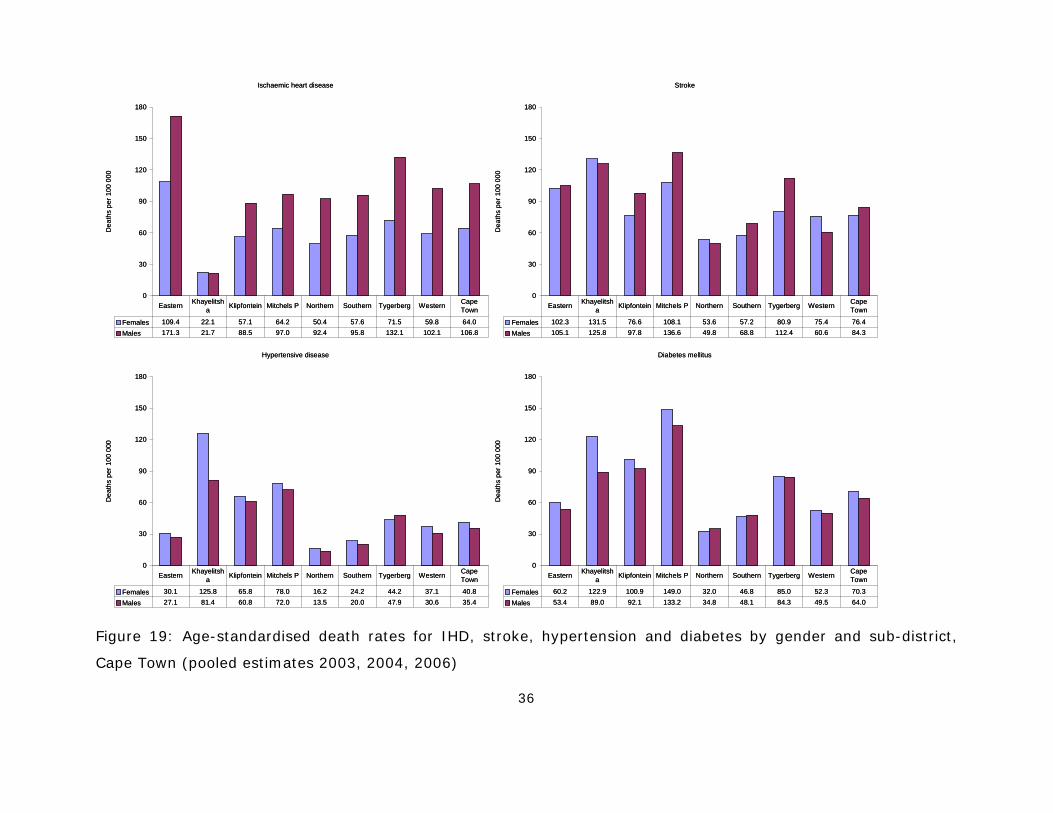
Figure 19 shows the variations in mortality resulting from IHD, stroke,
hypertensive disease and diabetes. IHD mortality is very high in Eastern and
Tygerberg but low in Khayelitsha. These rates would suggest that while
Khayelitsha is in the 3rd stage of the cardiovascular transition, some of the other
sub-districts are in a later stage. The rates are consistently higher for men.
Hypertension is very high in Khayelitsha and Mitchell’s Plain. Stroke is
particularly high in Mitchell’s Plain and Khayelitsha. Mitchell’s Plain and
Khayelitsha have high diabetes mellitus death rates. There is a marked excess of
female mortality from diabetes in Khayelitsha and Mitchell’s Plain.
36
Figure 19: Age-standardised death rates for IHD, stroke, hypertension and diabetes by gender and sub-district,
Cape Town (pooled estimates 2003, 2004, 2006)
Ischaemic heart disease
0
30
60
90
120
150
180D
eath
s pe
r 100
000
Females 109.4 22.1 57.1 64.2 50.4 57.6 71.5 59.8 64.0Males 171.3 21.7 88.5 97.0 92.4 95.8 132.1 102.1 106.8
Eastern Khayelitsha Klipfontein Mitchels P Northern Southern Tygerberg Western Cape
Town
Stroke
0
30
60
90
120
150
180
Dea
ths
per 1
00 0
00
Females 102.3 131.5 76.6 108.1 53.6 57.2 80.9 75.4 76.4Males 105.1 125.8 97.8 136.6 49.8 68.8 112.4 60.6 84.3
Eastern Khayelitsha Klipfontein Mitchels P Northern Southern Tygerberg Western Cape
Town
Hypertensive disease
0
30
60
90
120
150
180
Dea
ths
per 1
00 0
00
Females 30.1 125.8 65.8 78.0 16.2 24.2 44.2 37.1 40.8Males 27.1 81.4 60.8 72.0 13.5 20.0 47.9 30.6 35.4
Eastern Khayelitsha Klipfontein Mitchels P Northern Southern Tygerberg Western Cape
Town
Diabetes mellitus
0
30
60
90
120
150
180
Dea
ths
per 1
00 0
00
Females 60.2 122.9 100.9 149.0 32.0 46.8 85.0 52.3 70.3Males 53.4 89.0 92.1 133.2 34.8 48.1 84.3 49.5 64.0
Eastern Khayelitsha Klipfontein Mitchels P Northern Southern Tygerberg Western Cape
Town
37
0
20
40
60
80
100
120D
eath
s pe
r 100
000
pop
ulat
ion
Diabetes mellitus 63 64 66 73 65
Ischaemic heart disease 101 93 91 76 86
Stroke 86 89 82 71 77
Hypertensive heart disease 42 43 37 55 28
2001 2002 2003 2004 2006
Figure 20. Trends in age-standardised death rates per 100 000 population
for selected non-communicable diseases, Cape Town, 2001 - 2006 (2005
excluded)
Death rates due to IHD and stroke declined between 2001 and 2004,
while death rates due to diabetes and hypertensive disease increased
(Figure 20). However, these trends reversed between 2004 and 2006. It
is difficult to interpret these trends. While they could reflect the transition
of a stratified population, with part of the population in the more
advanced stages of the cardiovascular transition and part in the early
stages, they could also reflect specific trends in the major risk factors - a
possible reduction in smoking but worsening diet and physical inactivity.
Alternatively there might be health interventions (such as the
development of stroke units) that play a role, or perhaps the change in
the coding shortlist introduced during 2004 has contributed to the trend.
The data require more careful analysis to investigate this.
38
Figure 21 shows the mortality rates due to chronic obstructive pulmonary
disease (COPD). These are high in Mitchell’s Plain, Tygerberg and Eastern.
The gender differential consistently shows higher rates for men, which is
probably related to smoking. Mitchell’s Plain, Tygerberg and Klipfontein
also display high rates for lung cancer (Figure 19), and show the same
gender differential.
COPD
0
20
40
60
80
100
Dea
ths
per 1
00 0
00
Females 24.4 9.5 18.8 24.6 14.9 20.8 28.1 22.2 22.0Males 71.4 60.8 66.2 83.8 30.9 47.6 78.6 41.0 56.9
Eastern Khayelitsha Klipfontein Mitchels P Northern Southern Tygerberg Western Cape
Town
Lung Ca
0
20
40
60
80
100
Dea
ths
per 1
00 0
00
Females 25.8 24.4 18.7 30.9 27.1 20.7 30.5 25.5 24.8Males 56.1 63.2 71.6 77.6 40.9 54.2 82.8 44.4 59.4
Eastern Khayelitsha Klipfontein Mitchels P Northern Southern Tygerberg Western Cape
Town
Figure 21: Age-standardised death rates for COPD and lung cancer by
gender and sub-district, Cape Town, (pooled estimates 2003, 2004, 2006)
39
Cancer of the oesophagus (Figure 22) is very high in Khayelitsha. These
high rates may possibly be a result of migration from the Transkei, which
has very high rates. On the other hand, colon cancer (Figure 21) is very
low in Khayelitsha.
Oesophagus Ca
0
20
40
60
Dea
ths
per 1
00 0
00
Females 5.3 54.3 8.5 15.3 2.3 3.4 4.8 5.4 6.6Males 20.3 52.6 19.7 21.5 7.7 7.7 16.8 9.1 14.8
Eastern Khayelitsha Klipfontein Mitchels P Northern Southern Tygerberg Western Cape Town
Colon Ca
0
5
10
15
20
25
Dea
ths
per 1
00 0
00
Females 15.6 2.9 7.1 7.8 11.5 11.9 10.8 12.9 11.0Males 14.6 3.1 12.5 6.0 15.8 19.4 16.1 14.4 15.1
Eastern Khayelitsha Klipfontein Mitchels P Northern Southern Tygerberg Western Cape Town
Figure 22: Age-standardised death rates for oesophageal cancer and colon
cancer by gender and sub-district, Cape Town, (pooled estimates 2003,
2004, 2006)
40
Child and adolescent health
Trends in the mortality of children and adolescents can contribute to
assessing the impact of child health programmes and assist in identifying
priorities. In 2003, 2004 and 2006 there was a total of 7409 deaths in
children and adolescents up to 19 years of age. Table 5 shows the age
distribution of these deaths.
Table 5: Age distribution of deaths in those aged 19 years and under
(2003, 2004, 2006)
Age group Number of
deaths
% of child
deaths
Early neonatal (0 - 7 days) 1085 14.6
Late neonatal (8 - 30 days) 575 7.8
Post-neonatal infant (1 - 11
months)
2458 33.2
1 - 4 years 946 12.8
5 - 9 years 369 5.0
10 - 14 years 342 4.6
15 - 19 years 1634 22.1
Mortality rates by age group are shown in Table 6. The sex ratio for
infants’ deaths increased with age from 1.1 in the 1 - 4-year age group to
1.3 in the 5 - 14-year age group and 2.9 in the 15 - 19-year age group,
showing that male children are at a substantially higher risk of dying than
female children, particularly in the 15 - 19- year age group, as a result of
higher injury death rates.
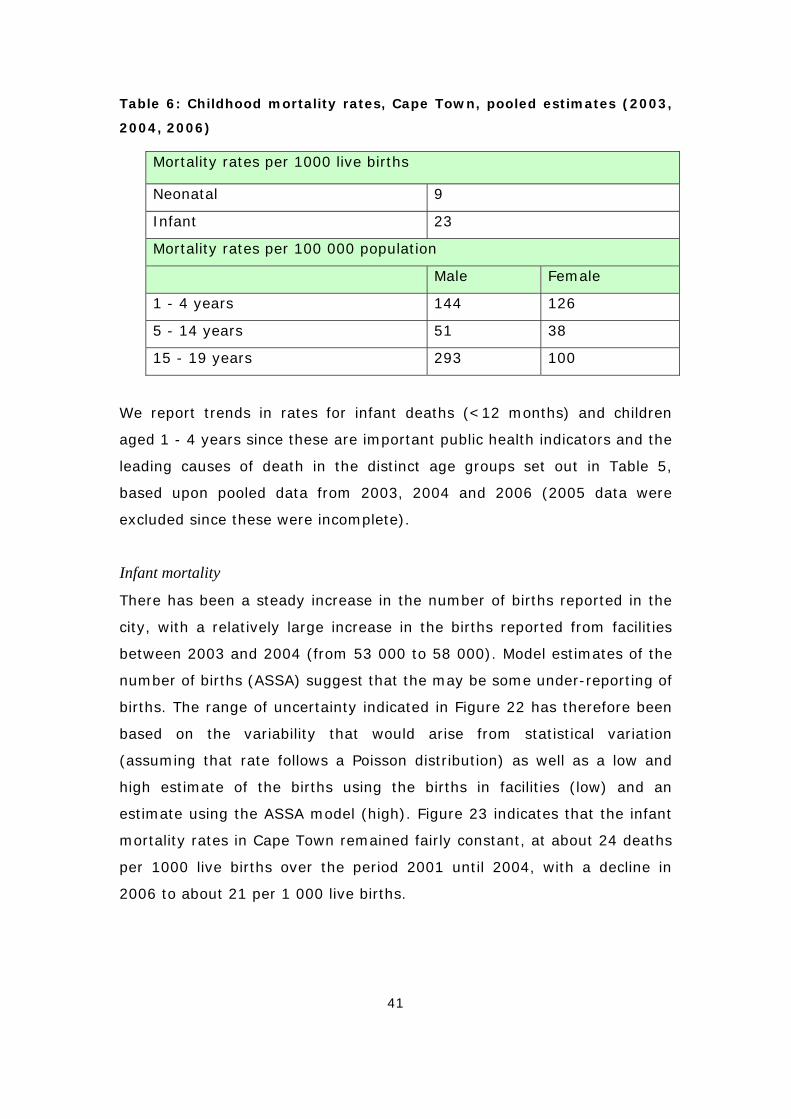
41
Table 6: Childhood mortality rates, Cape Town, pooled estimates (2003,
2004, 2006)
Mortality rates per 1000 live births
Neonatal 9
Infant 23
Mortality rates per 100 000 population
Male Female
1 - 4 years 144 126
5 - 14 years 51 38
15 - 19 years 293 100
We report trends in rates for infant deaths (<12 months) and children
aged 1 - 4 years since these are important public health indicators and the
leading causes of death in the distinct age groups set out in Table 5,
based upon pooled data from 2003, 2004 and 2006 (2005 data were
excluded since these were incomplete).
Infant mortality
There has been a steady increase in the number of births reported in the
city, with a relatively large increase in the births reported from facilities
between 2003 and 2004 (from 53 000 to 58 000). Model estimates of the
number of births (ASSA) suggest that the may be some under-reporting of
births. The range of uncertainty indicated in Figure 22 has therefore been
based on the variability that would arise from statistical variation
(assuming that rate follows a Poisson distribution) as well as a low and
high estimate of the births using the births in facilities (low) and an
estimate using the ASSA model (high). Figure 23 indicates that the infant
mortality rates in Cape Town remained fairly constant, at about 24 deaths
per 1000 live births over the period 2001 until 2004, with a decline in
2006 to about 21 per 1 000 live births.
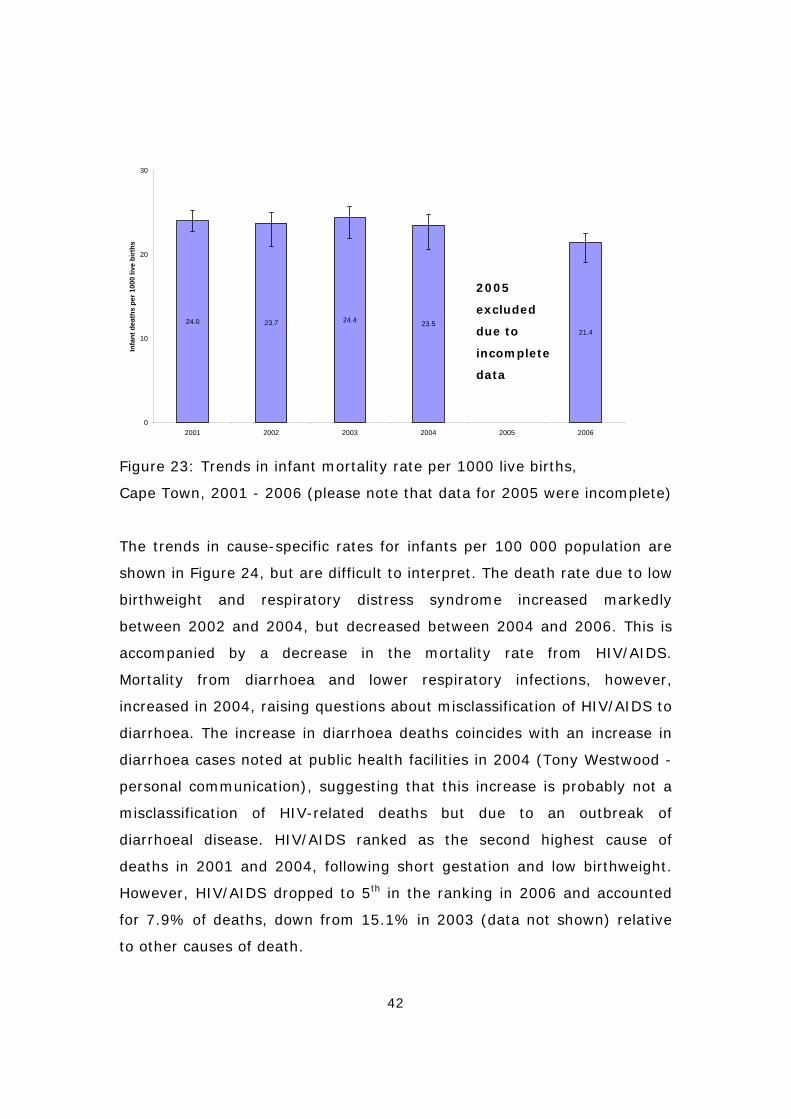
42
24.0 23.7 24.4 23.521.4
0
10
20
30
2001 2002 2003 2004 2005 2006
Infa
nt d
eath
s pe
r 100
0 liv
e bi
rths
Figure 23: Trends in infant mortality rate per 1000 live births,
Cape Town, 2001 - 2006 (please note that data for 2005 were incomplete)
The trends in cause-specific rates for infants per 100 000 population are
shown in Figure 24, but are difficult to interpret. The death rate due to low
birthweight and respiratory distress syndrome increased markedly
between 2002 and 2004, but decreased between 2004 and 2006. This is
accompanied by a decrease in the mortality rate from HIV/AIDS.
Mortality from diarrhoea and lower respiratory infections, however,
increased in 2004, raising questions about misclassification of HIV/AIDS to
diarrhoea. The increase in diarrhoea deaths coincides with an increase in
diarrhoea cases noted at public health facilities in 2004 (Tony Westwood -
personal communication), suggesting that this increase is probably not a
misclassification of HIV-related deaths but due to an outbreak of
diarrhoeal disease. HIV/AIDS ranked as the second highest cause of
deaths in 2001 and 2004, following short gestation and low birthweight.
However, HIV/AIDS dropped to 5th in the ranking in 2006 and accounted
for 7.9% of deaths, down from 15.1% in 2003 (data not shown) relative
to other causes of death.
2005
excluded
due to
incomplete
data
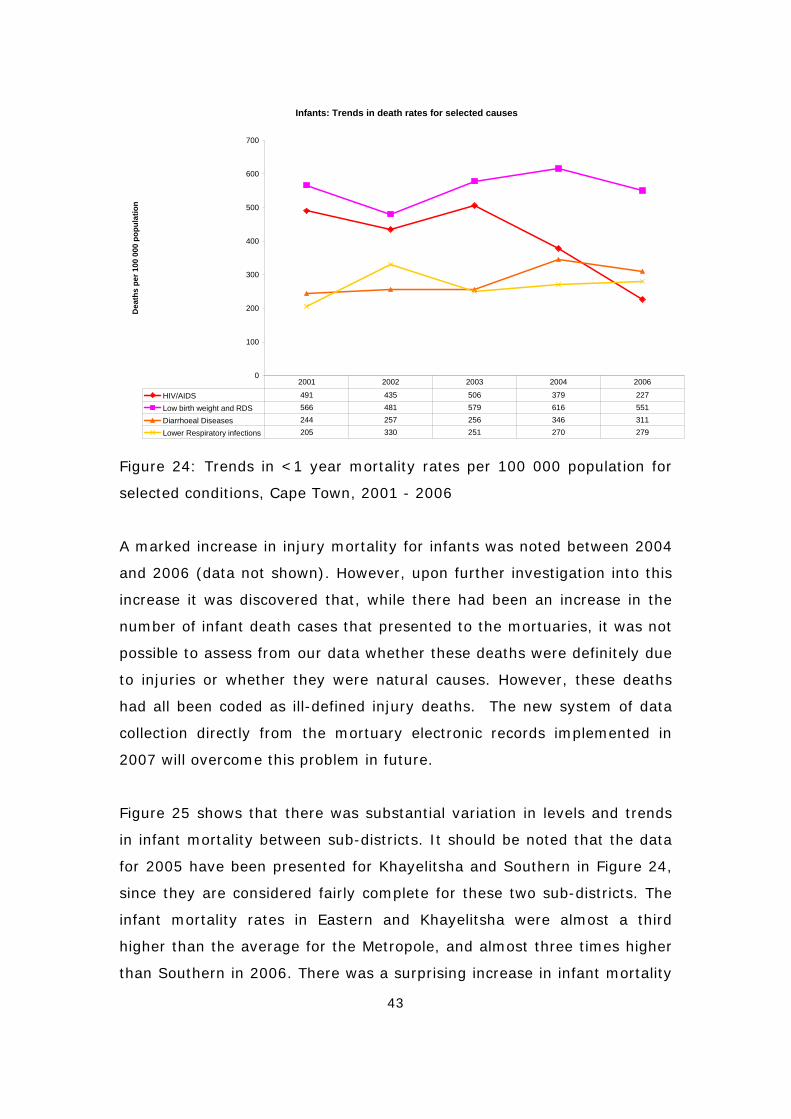
43
Infants: Trends in death rates for selected causes
0
100
200
300
400
500
600
700D
eath
s pe
r 100
000
pop
ulat
ion
HIV/AIDS 491 435 506 379 227
Low birth weight and RDS 566 481 579 616 551
Diarrhoeal Diseases 244 257 256 346 311
Lower Respiratory infections 205 330 251 270 279
2001 2002 2003 2004 2006
Figure 24: Trends in <1 year mortality rates per 100 000 population for
selected conditions, Cape Town, 2001 - 2006
A marked increase in injury mortality for infants was noted between 2004
and 2006 (data not shown). However, upon further investigation into this
increase it was discovered that, while there had been an increase in the
number of infant death cases that presented to the mortuaries, it was not
possible to assess from our data whether these deaths were definitely due
to injuries or whether they were natural causes. However, these deaths
had all been coded as ill-defined injury deaths. The new system of data
collection directly from the mortuary electronic records implemented in
2007 will overcome this problem in future.
Figure 25 shows that there was substantial variation in levels and trends
in infant mortality between sub-districts. It should be noted that the data
for 2005 have been presented for Khayelitsha and Southern in Figure 24,
since they are considered fairly complete for these two sub-districts. The
infant mortality rates in Eastern and Khayelitsha were almost a third
higher than the average for the Metropole, and almost three times higher
than Southern in 2006. There was a surprising increase in infant mortality
44
in Eastern in 2006, resulting in the rate being higher than in Khayelitsha,
in contrast with previous years. In Khayelitsha infant mortality appears to
have declined over the same period. This requires further investigation to
ensure that infant deaths from Khayelitsha have not been mistakenly
allocated to Eastern sub-district. Some areas have shown little change
over the period, while others have increased and yet others decreased.
IMR
0
5
10
15
20
25
30
35
40
45
Dea
ths
per 1
000
Live
birt
hs
2003 28.5 42.3 28.5 21.9 23.0 16.7 18.2 17.4 24.5
2004 22.0 36.0 28.3 24.1 19.9 20.0 18.8 16.5 23.2
2005 34.8 15.2
2006 32.2 31.5 25.2 21.9 20.8 11.9 17.0 14.0 21.4
Eastern Khayelitsha Klipfontein Mitchell's Plain Northern Southern Tygerberg Western Cape Town
Figure 25: Infant mortality rates per 1000 live births by sub-district,
Cape Town, 2003 - 2006 (data for 2005 are only considered complete for
Khayelitsha and Southern)
Infants in the neonatal period
The cause of death profile for all neonatal deaths (early and late) is shown
in Figure 26, and the leading causes for the early neonatal period (0 - 7
days) and the late neonatal period (8 - 30 days) are shown in Figure 27.
Unfortunately the shortlist codes available for causes of death during the
perinatal period are too abbreviated to allow for really meaningful analysis
of the cause profile for deaths of young babies, and the data should be
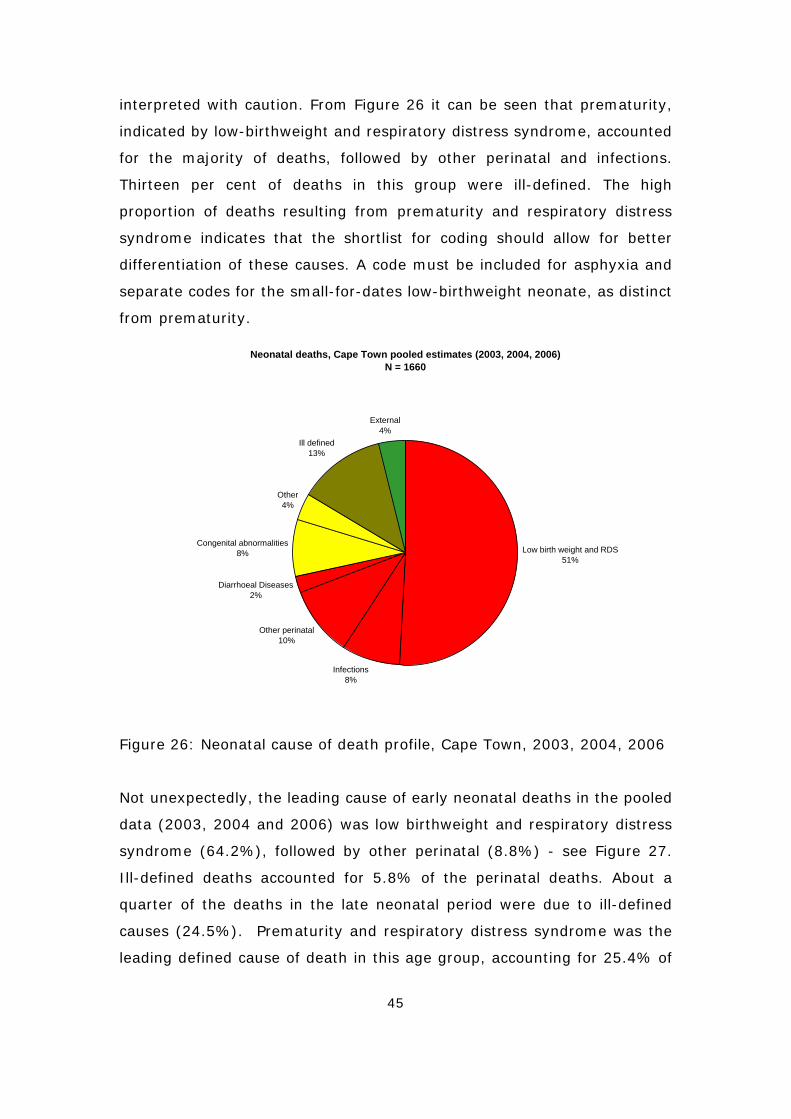
45
interpreted with caution. From Figure 26 it can be seen that prematurity,
indicated by low-birthweight and respiratory distress syndrome, accounted
for the majority of deaths, followed by other perinatal and infections.
Thirteen per cent of deaths in this group were ill-defined. The high
proportion of deaths resulting from prematurity and respiratory distress
syndrome indicates that the shortlist for coding should allow for better
differentiation of these causes. A code must be included for asphyxia and
separate codes for the small-for-dates low-birthweight neonate, as distinct
from prematurity.
Neonatal deaths, Cape Town pooled estimates (2003, 2004, 2006)N = 1660
Low birth weight and RDS51%
Infections8%
Other perinatal10%
Diarrhoeal Diseases2%
Congenital abnormalities8%
Other4%
Ill defined13%
External4%
Figure 26: Neonatal cause of death profile, Cape Town, 2003, 2004, 2006
Not unexpectedly, the leading cause of early neonatal deaths in the pooled
data (2003, 2004 and 2006) was low birthweight and respiratory distress
syndrome (64.2%), followed by other perinatal (8.8%) - see Figure 27.
Ill-defined deaths accounted for 5.8% of the perinatal deaths. About a
quarter of the deaths in the late neonatal period were due to ill-defined
causes (24.5%). Prematurity and respiratory distress syndrome was the
leading defined cause of death in this age group, accounting for 25.4% of
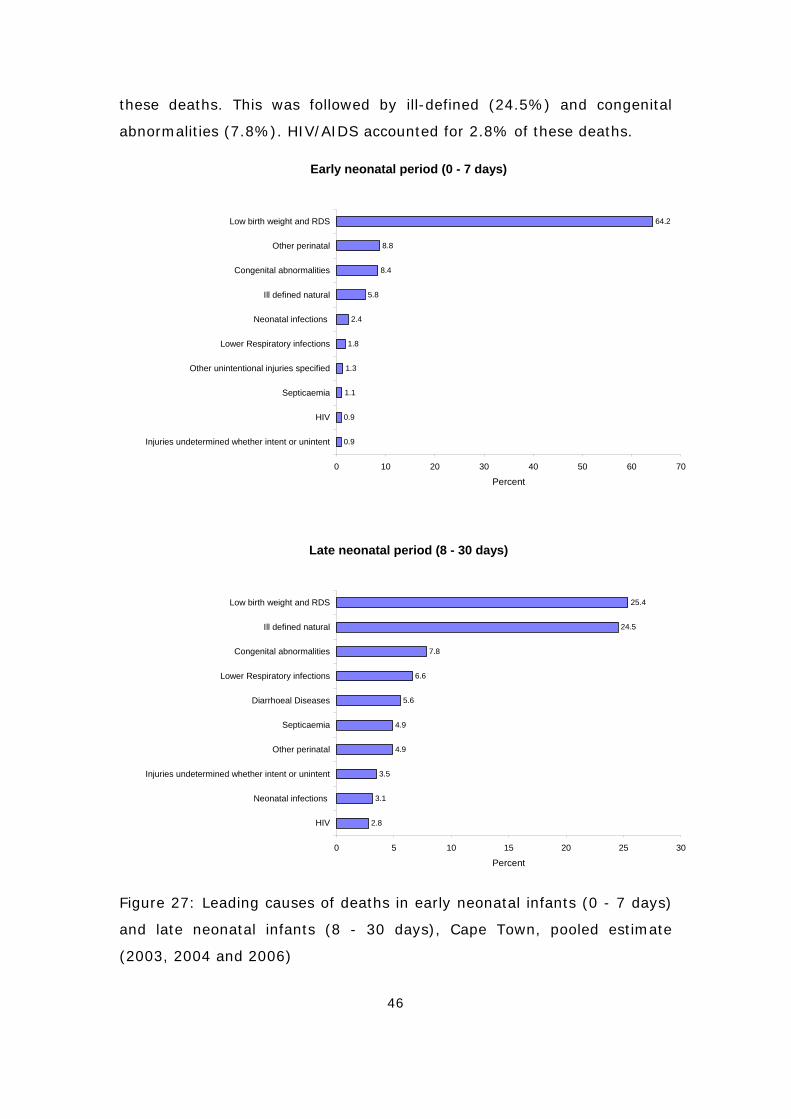
46
these deaths. This was followed by ill-defined (24.5%) and congenital
abnormalities (7.8%). HIV/AIDS accounted for 2.8% of these deaths.
Early neonatal period (0 - 7 days)
64.2
8.8
8.4
5.8
2.4
1.8
1.3
1.1
0.9
0.9
0 10 20 30 40 50 60 70
Low birth weight and RDS
Other perinatal
Congenital abnormalities
Ill defined natural
Neonatal infections
Lower Respiratory infections
Other unintentional injuries specified
Septicaemia
HIV
Injuries undetermined whether intent or unintent
Percent
Late neonatal period (8 - 30 days)
25.4
24.5
7.8
6.6
5.6
4.9
4.9
3.5
3.1
2.8
0 5 10 15 20 25 30
Low birth weight and RDS
Ill defined natural
Congenital abnormalities
Lower Respiratory infections
Diarrhoeal Diseases
Septicaemia
Other perinatal
Injuries undetermined whether intent or unintent
Neonatal infections
HIV
Percent
Figure 27: Leading causes of deaths in early neonatal infants (0 - 7 days)
and late neonatal infants (8 - 30 days), Cape Town, pooled estimate
(2003, 2004 and 2006)
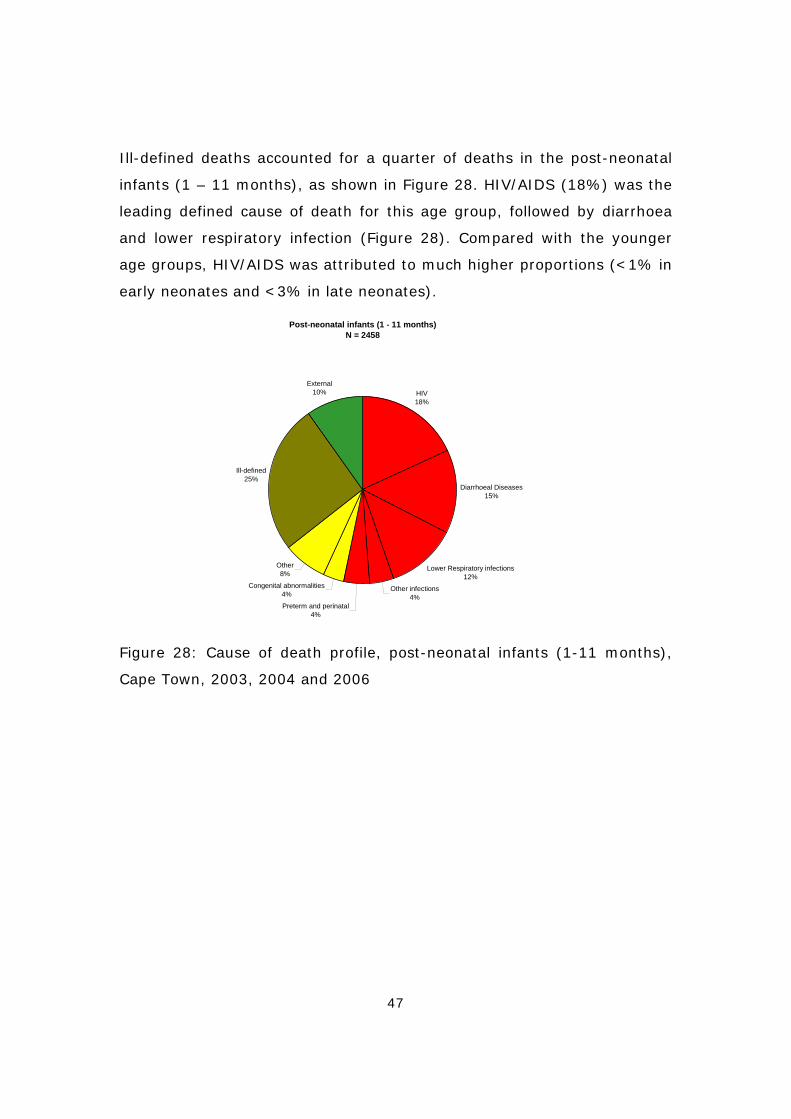
47
Ill-defined deaths accounted for a quarter of deaths in the post-neonatal
infants (1 – 11 months), as shown in Figure 28. HIV/AIDS (18%) was the
leading defined cause of death for this age group, followed by diarrhoea
and lower respiratory infection (Figure 28). Compared with the younger
age groups, HIV/AIDS was attributed to much higher proportions (<1% in
early neonates and <3% in late neonates).
Post-neonatal infants (1 - 11 months)N = 2458
HIV18%
Diarrhoeal Diseases15%
Lower Respiratory infections12%
Other infections4%
Preterm and perinatal4%
Congenital abnormalities4%
Other8%
Ill-defined25%
External10%
Figure 28: Cause of death profile, post-neonatal infants (1-11 months),
Cape Town, 2003, 2004 and 2006

48
25.2
18.0
14.6
12.1
4.3
3.9
3.6
3.2
2.6
1.8
1.2
1.1
1.0
0.7
0.6
0 5 10 15 20 25 30
Ill defined natural
HIV
Diarrhoeal Diseases
Lower Respiratory infections
Other unintentional injuries specified
Injuries undetermined whether intent or unintent
Congenital abnormalities
Low birth weight and RDS
Other respiratory
Septicaemia
Protein-energy malnutrition
Bacterial Meningitis and meningococcaemia
Tuberculosis
Neonatal infections
Remainder of endocrine, nutritional and metabolic disorders
Percent
Figure 29: Leading causes of deaths in post- neonatal infants
(1 – 11 months), Cape Town pooled estimates (2003, 2004 and 2006)
Child mortality (1 - 4 years)
In contrast to the relatively steady trend in infant mortality, there was a
slight increase in the 1 - 4-year mortality rates between 2001 and 2002,
followed by a decrease to 2004 and again in 2006. The decrease was
mainly due to a drop in infectious diseases, including HIV/AIDS and
nutritional conditions (Figure 30). A decrease in the HIV/AIDS death rate
would be expected due to the roll-out of the PMTCT programme which
commenced in 2001, and the availability of ARVs in public hospitals since
2003, but it is encouraging to note the decrease in the other infections
and nutritional conditions as well. It should be noted that the marked
decline in the HIV/AIDS mortality rate in 2006 in this age group was
accompanied by an increase in the other infections and nutritional
conditions. It is not clear whether this is a result of changes in the
classification of HIV as the underlying cause of death or whether it is the
result of a real change in the causes of deaths. However, the combined
rate for these conditions declined overall.
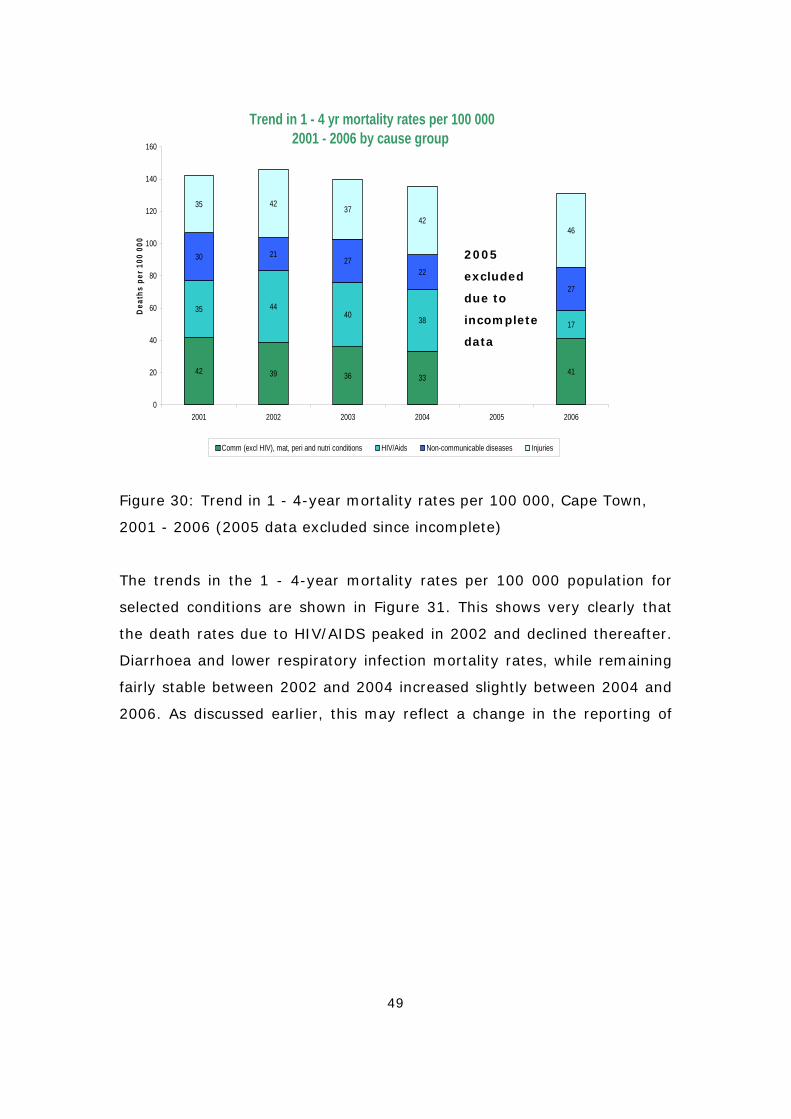
49
Trend in 1 - 4 yr mortality rates per 100 0002001 - 2006 by cause group
42 39 36 3341
35 4440 38 17
30 2127
22
27
35 4237
4246
0
20
40
60
80
100
120
140
160
2001 2002 2003 2004 2005 2006
Dea
ths
per 1
00 0
00
Comm (excl HIV), mat, peri and nutri conditions HIV/Aids Non-communicable diseases Injuries
Figure 30: Trend in 1 - 4-year mortality rates per 100 000, Cape Town,
2001 - 2006 (2005 data excluded since incomplete)
The trends in the 1 - 4-year mortality rates per 100 000 population for
selected conditions are shown in Figure 31. This shows very clearly that
the death rates due to HIV/AIDS peaked in 2002 and declined thereafter.
Diarrhoea and lower respiratory infection mortality rates, while remaining
fairly stable between 2002 and 2004 increased slightly between 2004 and
2006. As discussed earlier, this may reflect a change in the reporting of
2005
excluded
due to
incomplete
data
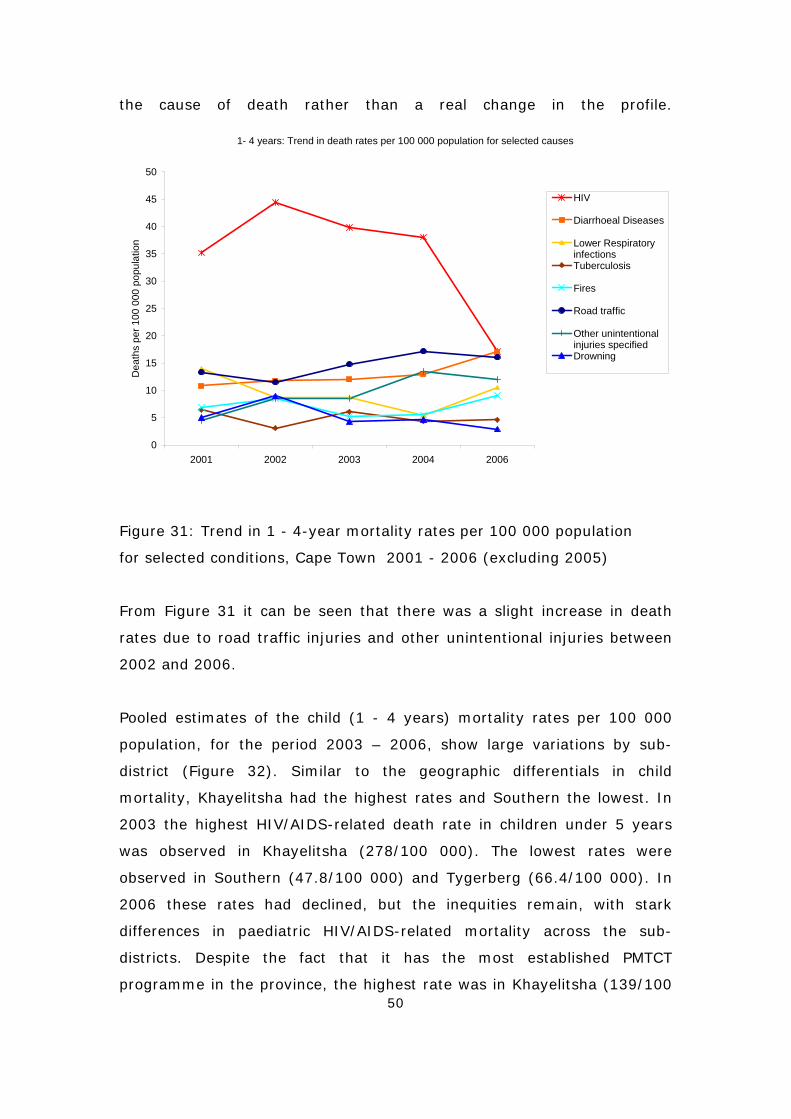
50
the cause of death rather than a real change in the profile.
1- 4 years: Trend in death rates per 100 000 population for selected causes
0
5
10
15
20
25
30
35
40
45
50
2001 2002 2003 2004 2006
Dea
ths
per 1
00 0
00 p
opul
atio
n
HIV
Diarrhoeal Diseases
Lower RespiratoryinfectionsTuberculosis
Fires
Road traffic
Other unintentionalinjuries specifiedDrowning
Figure 31: Trend in 1 - 4-year mortality rates per 100 000 population
for selected conditions, Cape Town 2001 - 2006 (excluding 2005)
From Figure 31 it can be seen that there was a slight increase in death
rates due to road traffic injuries and other unintentional injuries between
2002 and 2006.
Pooled estimates of the child (1 - 4 years) mortality rates per 100 000
population, for the period 2003 – 2006, show large variations by sub-
district (Figure 32). Similar to the geographic differentials in child
mortality, Khayelitsha had the highest rates and Southern the lowest. In
2003 the highest HIV/AIDS-related death rate in children under 5 years
was observed in Khayelitsha (278/100 000). The lowest rates were
observed in Southern (47.8/100 000) and Tygerberg (66.4/100 000). In
2006 these rates had declined, but the inequities remain, with stark
differences in paediatric HIV/AIDS-related mortality across the sub-
districts. Despite the fact that it has the most established PMTCT
programme in the province, the highest rate was in Khayelitsha (139/100
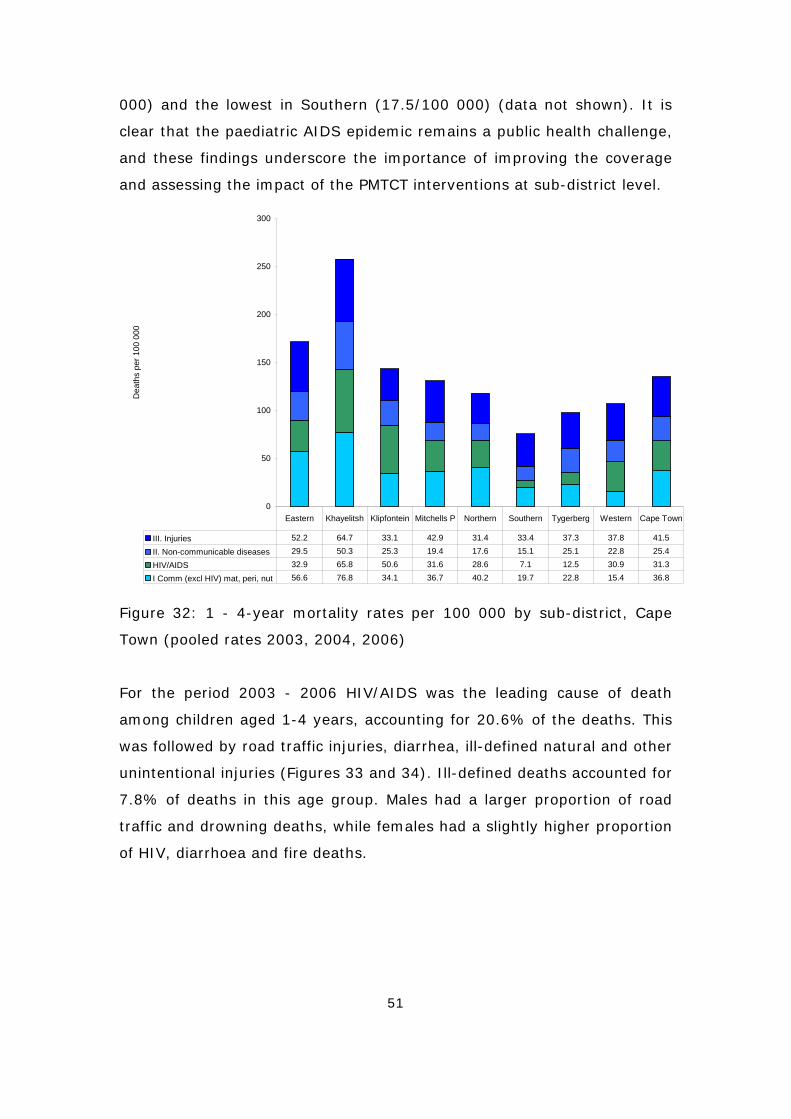
51
000) and the lowest in Southern (17.5/100 000) (data not shown). It is
clear that the paediatric AIDS epidemic remains a public health challenge,
and these findings underscore the importance of improving the coverage
and assessing the impact of the PMTCT interventions at sub-district level.
0
50
100
150
200
250
300
Dea
ths
per 1
00 0
00
III. Injuries 52.2 64.7 33.1 42.9 31.4 33.4 37.3 37.8 41.5
II. Non-communicable diseases 29.5 50.3 25.3 19.4 17.6 15.1 25.1 22.8 25.4
HIV/AIDS 32.9 65.8 50.6 31.6 28.6 7.1 12.5 30.9 31.3
I Comm (excl HIV) mat, peri, nut 56.6 76.8 34.1 36.7 40.2 19.7 22.8 15.4 36.8
Eastern Khayelitsh Klipfontein Mitchells P Northern Southern Tygerberg Western Cape Town
Figure 32: 1 - 4-year mortality rates per 100 000 by sub-district, Cape
Town (pooled rates 2003, 2004, 2006)
For the period 2003 - 2006 HIV/AIDS was the leading cause of death
among children aged 1-4 years, accounting for 20.6% of the deaths. This
was followed by road traffic injuries, diarrhea, ill-defined natural and other
unintentional injuries (Figures 33 and 34). Ill-defined deaths accounted for
7.8% of deaths in this age group. Males had a larger proportion of road
traffic and drowning deaths, while females had a slightly higher proportion
of HIV, diarrhoea and fire deaths.
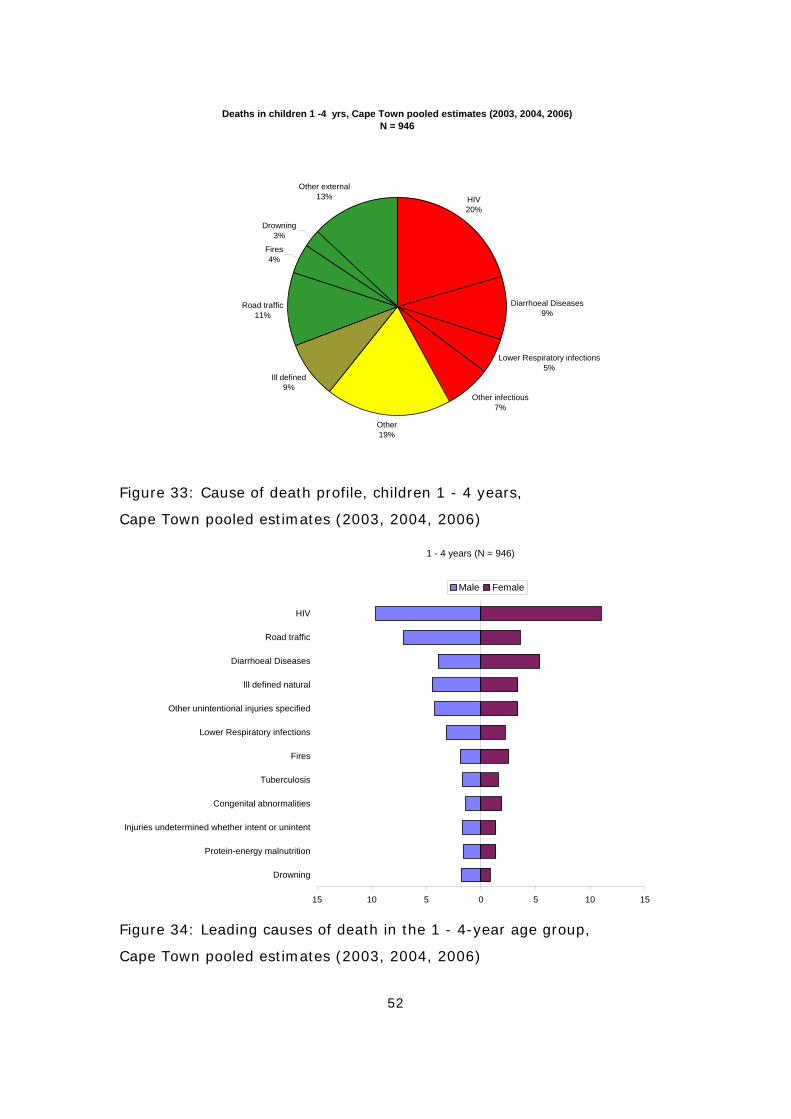
52
Deaths in children 1 -4 yrs, Cape Town pooled estimates (2003, 2004, 2006)N = 946
HIV20%
Diarrhoeal Diseases9%
Lower Respiratory infections5%
Other infectious7%
Other19%
Ill defined9%
Road traffic11%
Fires 4%
Drowning3%
Other external13%
Figure 33: Cause of death profile, children 1 - 4 years,
Cape Town pooled estimates (2003, 2004, 2006)
1 - 4 years (N = 946)
15 10 5 0 5 10 15
HIV
Road traffic
Diarrhoeal Diseases
Ill defined natural
Other unintentional injuries specified
Lower Respiratory infections
Fires
Tuberculosis
Congenital abnormalities
Injuries undetermined whether intent or unintent
Protein-energy malnutrition
Drowning
Male Female
Figure 34: Leading causes of death in the 1 - 4-year age group,
Cape Town pooled estimates (2003, 2004, 2006)
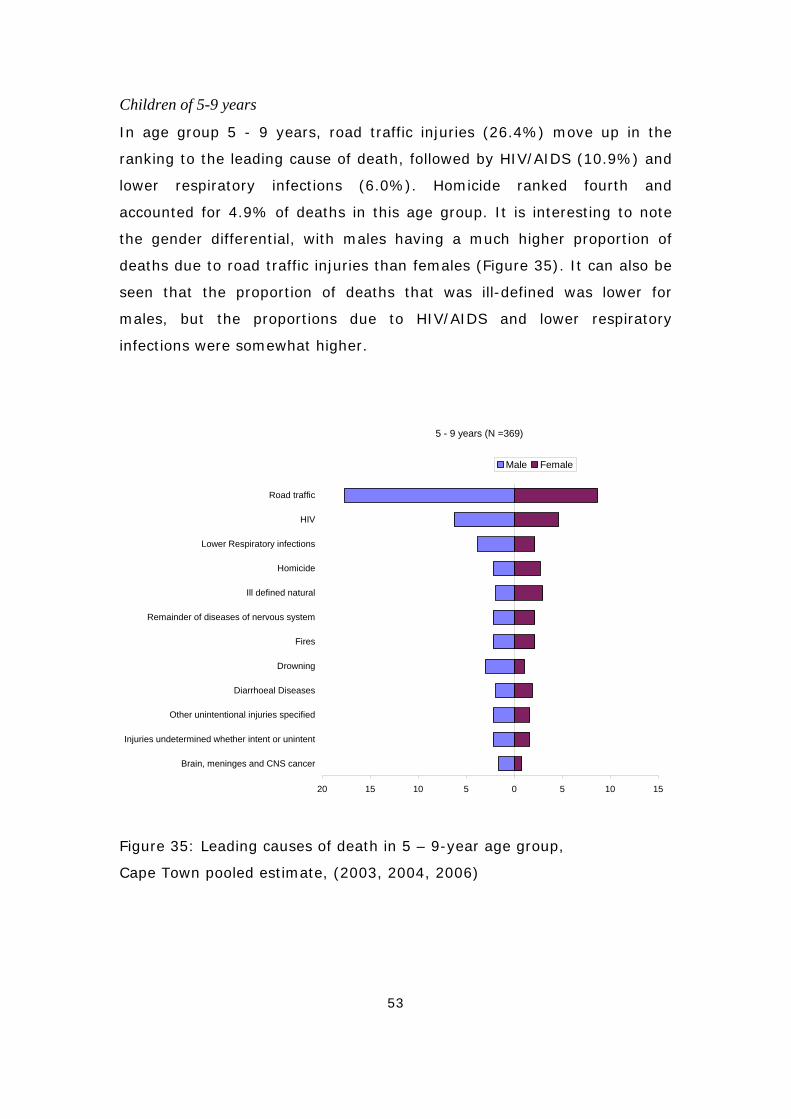
53
Children of 5-9 years
In age group 5 - 9 years, road traffic injuries (26.4%) move up in the
ranking to the leading cause of death, followed by HIV/AIDS (10.9%) and
lower respiratory infections (6.0%). Homicide ranked fourth and
accounted for 4.9% of deaths in this age group. It is interesting to note
the gender differential, with males having a much higher proportion of
deaths due to road traffic injuries than females (Figure 35). It can also be
seen that the proportion of deaths that was ill-defined was lower for
males, but the proportions due to HIV/AIDS and lower respiratory
infections were somewhat higher.
5 - 9 years (N =369)
20 15 10 5 0 5 10 15
Road traffic
HIV
Lower Respiratory infections
Homicide
Ill defined natural
Remainder of diseases of nervous system
Fires
Drowning
Diarrhoeal Diseases
Other unintentional injuries specified
Injuries undetermined whether intent or unintent
Brain, meninges and CNS cancer
Male Female
Figure 35: Leading causes of death in 5 – 9-year age group,
Cape Town pooled estimate, (2003, 2004, 2006)
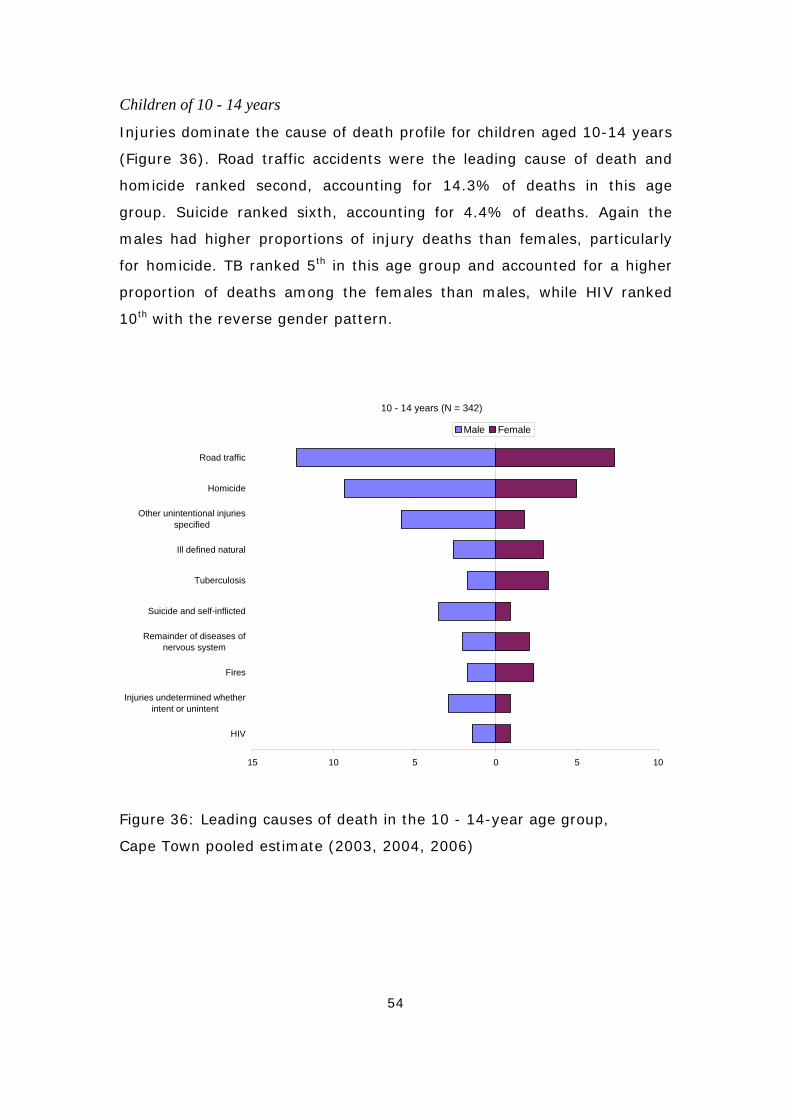
54
Children of 10 - 14 years
Injuries dominate the cause of death profile for children aged 10-14 years
(Figure 36). Road traffic accidents were the leading cause of death and
homicide ranked second, accounting for 14.3% of deaths in this age
group. Suicide ranked sixth, accounting for 4.4% of deaths. Again the
males had higher proportions of injury deaths than females, particularly
for homicide. TB ranked 5th in this age group and accounted for a higher
proportion of deaths among the females than males, while HIV ranked
10th with the reverse gender pattern.
10 - 14 years (N = 342)
15 10 5 0 5 10
Road traffic
Homicide
Other unintentional injuriesspecified
Ill defined natural
Tuberculosis
Suicide and self-inflicted
Remainder of diseases ofnervous system
Fires
Injuries undetermined whetherintent or unintent
HIV
Male Female
Figure 36: Leading causes of death in the 10 - 14-year age group,
Cape Town pooled estimate (2003, 2004, 2006)
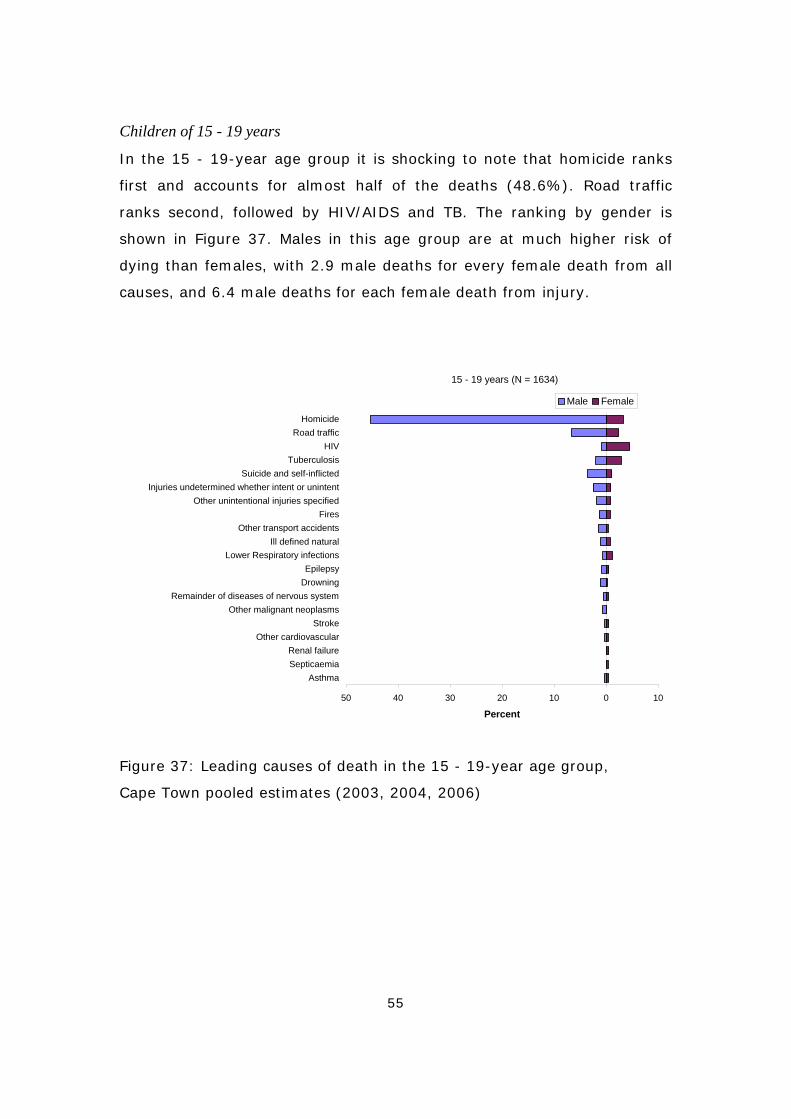
55
Children of 15 - 19 years
In the 15 - 19-year age group it is shocking to note that homicide ranks
first and accounts for almost half of the deaths (48.6%). Road traffic
ranks second, followed by HIV/AIDS and TB. The ranking by gender is
shown in Figure 37. Males in this age group are at much higher risk of
dying than females, with 2.9 male deaths for every female death from all
causes, and 6.4 male deaths for each female death from injury.
15 - 19 years (N = 1634)
50 40 30 20 10 0 10
HomicideRoad traffic
HIVTuberculosis
Suicide and self-inflictedInjuries undetermined whether intent or unintent
Other unintentional injuries specifiedFires
Other transport accidentsIll defined natural
Lower Respiratory infectionsEpilepsy
DrowningRemainder of diseases of nervous system
Other malignant neoplasmsStroke
Other cardiovascularRenal failureSepticaemia
Asthma
Percent
Male Female
Figure 37: Leading causes of death in the 15 - 19-year age group,
Cape Town pooled estimates (2003, 2004, 2006)

56
Women’s health
The City of Cape Town has introduced a women’s health programme that
aims to improve reproductive health services and provide cervical cancer
screening. Maternal mortality and cervical cancer mortality rates are
therefore important indicators. However, in the context of women’s health
it is useful to review breast cancer mortality as well as the overall
mortality pattern among adult women.
From 2001 to 2004 there were 33 deaths reported as being due to
maternal conditions on death notifications for Cape Town. This gives a
maternal mortality ratio of 15 deaths per 100 000 births, somewhat lower
than the maternal mortality ratio of 112 per 100 000 for deliveries in
health facilities in 2002 that was reported by Fawcus et al.23 based on a
review of the Peninsula Maternal and Neonatal Service data. The most
recent report from the Confidential Enquiry into Maternal Deaths based on
the notifications of maternal deaths indicates that there were 207
maternal deaths in the whole of the Western Cape Province between 2002
and 2004. Since approximately half the deaths in the Western Cape occur
in the Cape Town Metropole, one might expect about 100 maternal deaths
during this period, suggesting that maternal deaths are under-reported on
the death notification. While it would be useful for the programme to
obtain the data collected by the province through the confidential enquiry,
the quality of the cause of death data regarding maternal deaths also
needs to be improved. Training is needed to sensitise the coders on the
one hand and improve quality of certification on the other.
Death from cancer of the cervix is eminently preventable through early
detection. The screening programme aims to identify cases of cancer in
the early stage of the disease when appropriate treatment can prevent the
fatal consequence. In contrast, there is no public programme for breast
cancer screening since such a programme is much more costly. Age-
standardised rates for cervical cancer and breast cancer mortality are
shown for the sub-districts of Cape Town in Figure 38. Overall, the age-
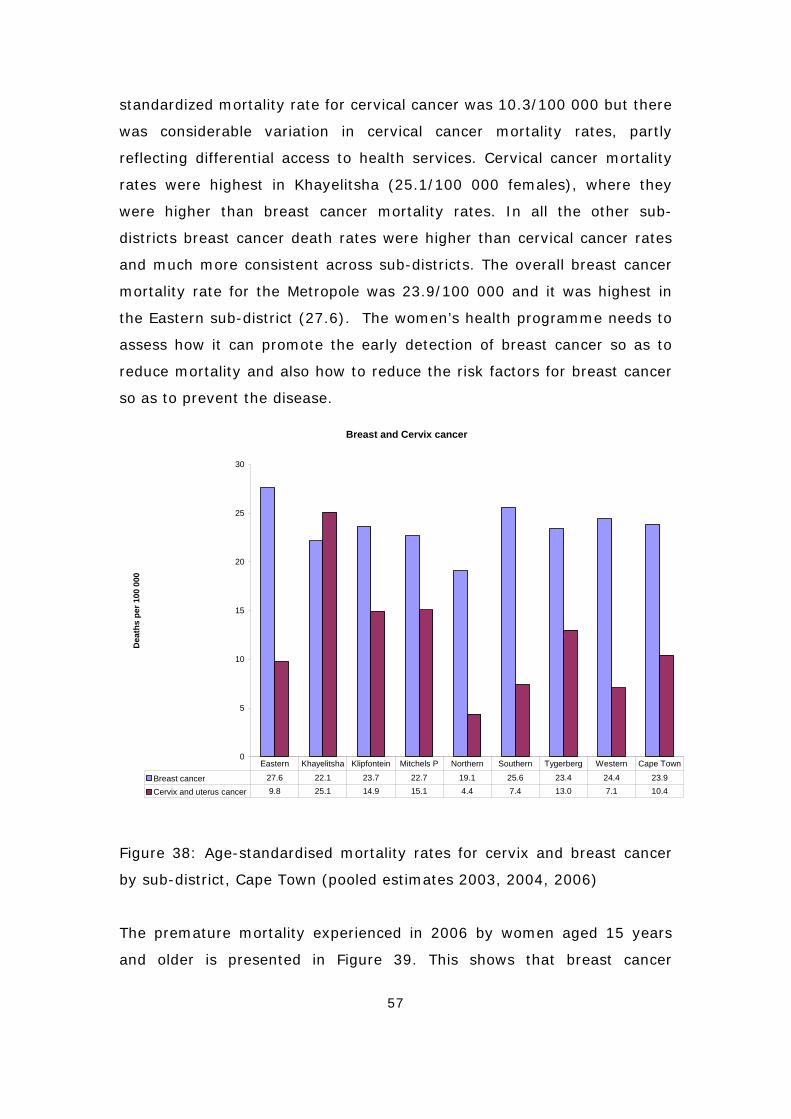
57
standardized mortality rate for cervical cancer was 10.3/100 000 but there
was considerable variation in cervical cancer mortality rates, partly
reflecting differential access to health services. Cervical cancer mortality
rates were highest in Khayelitsha (25.1/100 000 females), where they
were higher than breast cancer mortality rates. In all the other sub-
districts breast cancer death rates were higher than cervical cancer rates
and much more consistent across sub-districts. The overall breast cancer
mortality rate for the Metropole was 23.9/100 000 and it was highest in
the Eastern sub-district (27.6). The women’s health programme needs to
assess how it can promote the early detection of breast cancer so as to
reduce mortality and also how to reduce the risk factors for breast cancer
so as to prevent the disease.
Breast and Cervix cancer
0
5
10
15
20
25
30
Dea
ths
per 1
00 0
00
Breast cancer 27.6 22.1 23.7 22.7 19.1 25.6 23.4 24.4 23.9
Cervix and uterus cancer 9.8 25.1 14.9 15.1 4.4 7.4 13.0 7.1 10.4
Eastern Khayelitsha Klipfontein Mitchels P Northern Southern Tygerberg Western Cape Town
Figure 38: Age-standardised mortality rates for cervix and breast cancer
by sub-district, Cape Town (pooled estimates 2003, 2004, 2006)
The premature mortality experienced in 2006 by women aged 15 years
and older is presented in Figure 39. This shows that breast cancer
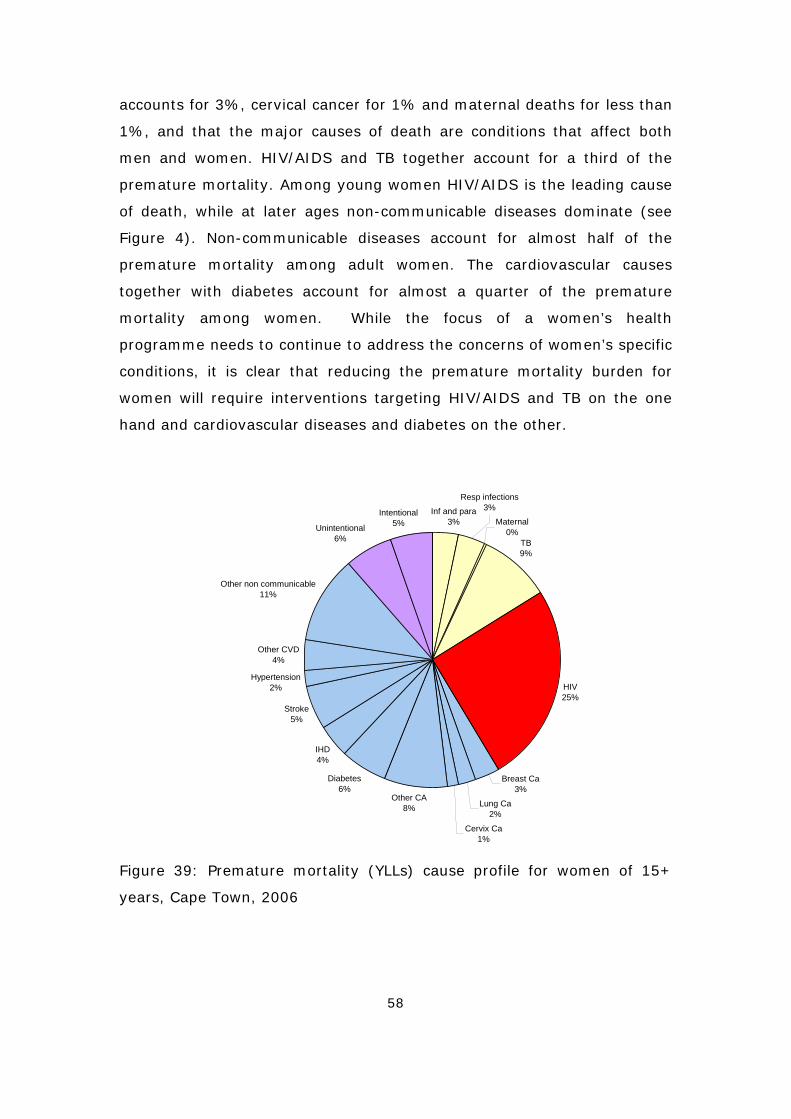
58
accounts for 3%, cervical cancer for 1% and maternal deaths for less than
1%, and that the major causes of death are conditions that affect both
men and women. HIV/AIDS and TB together account for a third of the
premature mortality. Among young women HIV/AIDS is the leading cause
of death, while at later ages non-communicable diseases dominate (see
Figure 4). Non-communicable diseases account for almost half of the
premature mortality among adult women. The cardiovascular causes
together with diabetes account for almost a quarter of the premature
mortality among women. While the focus of a women’s health
programme needs to continue to address the concerns of women’s specific
conditions, it is clear that reducing the premature mortality burden for
women will require interventions targeting HIV/AIDS and TB on the one
hand and cardiovascular diseases and diabetes on the other.
Inf and para3%
TB9%
HIV25%
Breast Ca3%
Lung Ca2%
Cervix Ca1%
Other CA8%
Diabetes6%
IHD4%
Stroke5%
Hypertension2%
Other CVD4%
Other non communicable11%
Unintentional 6%
Intentional5% Maternal
0%
Resp infections3%
Figure 39: Premature mortality (YLLs) cause profile for women of 15+
years, Cape Town, 2006
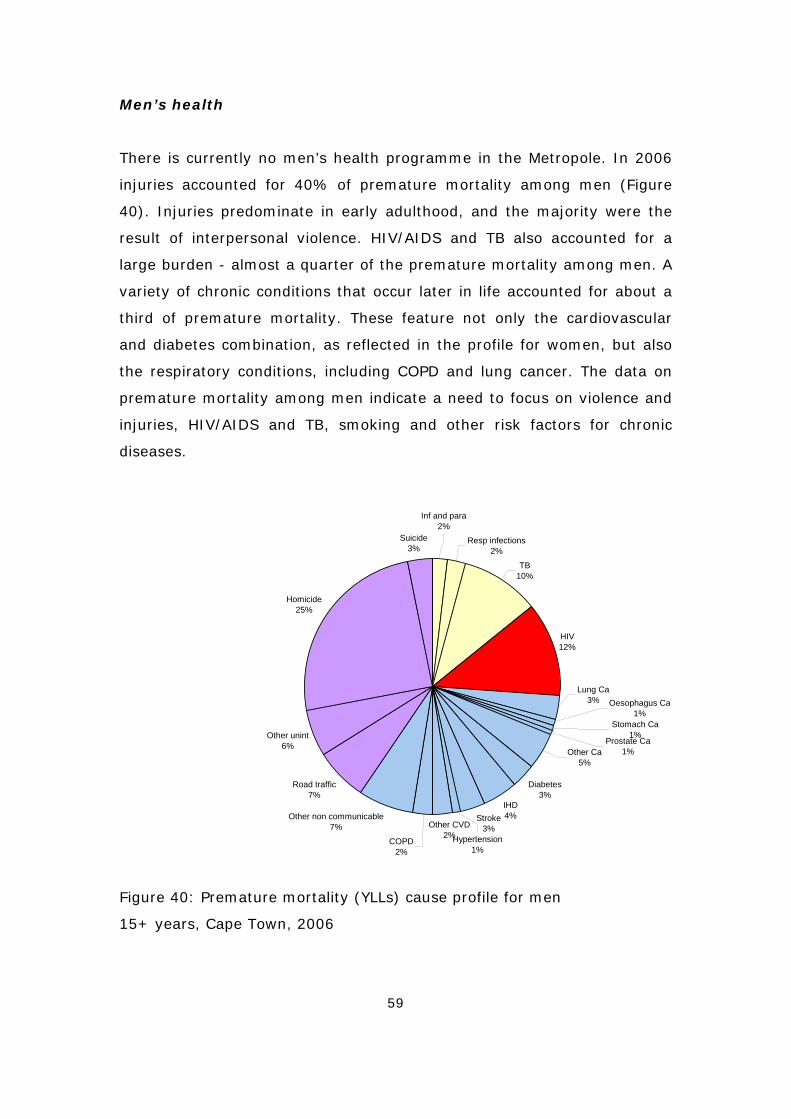
59
Men’s health
There is currently no men’s health programme in the Metropole. In 2006
injuries accounted for 40% of premature mortality among men (Figure
40). Injuries predominate in early adulthood, and the majority were the
result of interpersonal violence. HIV/AIDS and TB also accounted for a
large burden - almost a quarter of the premature mortality among men. A
variety of chronic conditions that occur later in life accounted for about a
third of premature mortality. These feature not only the cardiovascular
and diabetes combination, as reflected in the profile for women, but also
the respiratory conditions, including COPD and lung cancer. The data on
premature mortality among men indicate a need to focus on violence and
injuries, HIV/AIDS and TB, smoking and other risk factors for chronic
diseases.
Resp infections2%
TB10%
HIV12%
Diabetes3%
IHD4%Stroke
3%Other CVD2%
COPD2%
Other non communicable7%
Road traffic7%
Other unint6%
Homicide25%
Suicide3%
Lung Ca3%
Hypertension1%
Inf and para2%
Other Ca5%
Prostate Ca1%
Oesophagus Ca1%
Stomach Ca1%
Figure 40: Premature mortality (YLLs) cause profile for men
15+ years, Cape Town, 2006
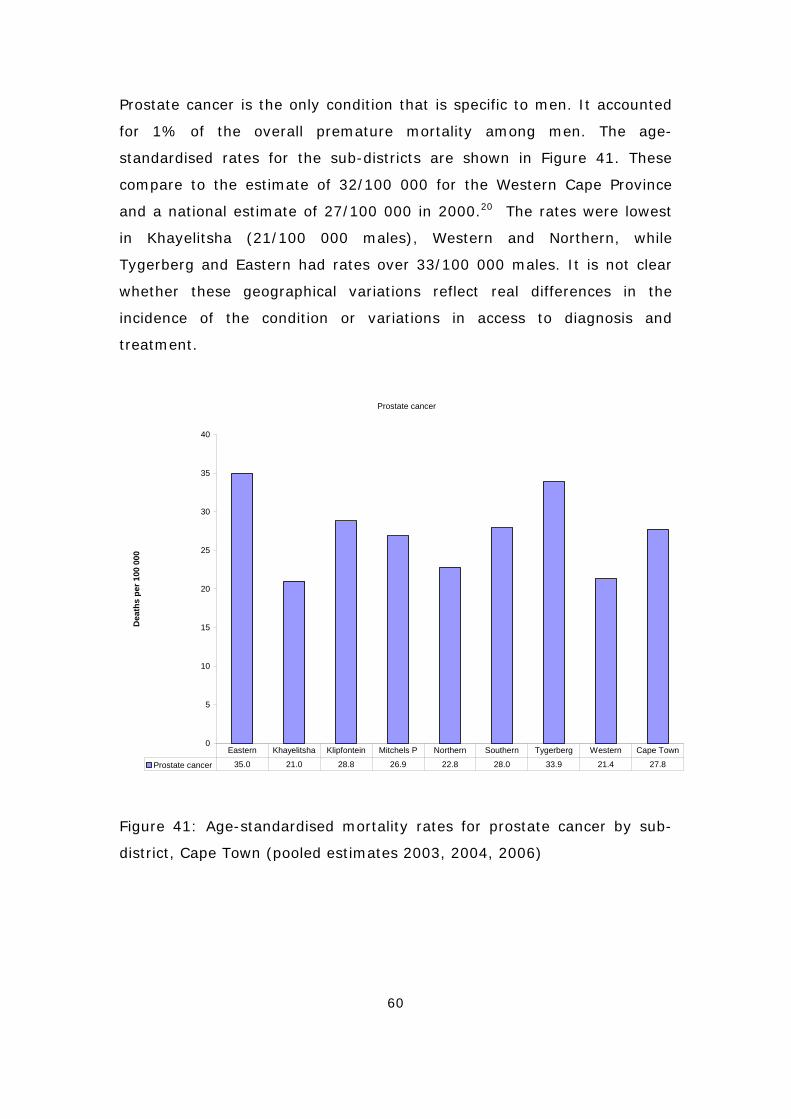
60
Prostate cancer is the only condition that is specific to men. It accounted
for 1% of the overall premature mortality among men. The age-
standardised rates for the sub-districts are shown in Figure 41. These
compare to the estimate of 32/100 000 for the Western Cape Province
and a national estimate of 27/100 000 in 2000.20 The rates were lowest
in Khayelitsha (21/100 000 males), Western and Northern, while
Tygerberg and Eastern had rates over 33/100 000 males. It is not clear
whether these geographical variations reflect real differences in the
incidence of the condition or variations in access to diagnosis and
treatment.
Prostate cancer
0
5
10
15
20
25
30
35
40
Dea
ths
per 1
00 0
00
Prostate cancer 35.0 21.0 28.8 26.9 22.8 28.0 33.9 21.4 27.8
Eastern Khayelitsha Klipfontein Mitchels P Northern Southern Tygerberg Western Cape Town
Figure 41: Age-standardised mortality rates for prostate cancer by sub-
district, Cape Town (pooled estimates 2003, 2004, 2006)
61
Discussion
The Cape Town routine local mortality surveillance system provides a
wealth of data on the health of the population in Cape Town. This second
report in the Burden of Disease Reduction project has provided an
opportunity to assess priority programmes in terms of mortality. The
analysis also points to emerging health issues and vulnerable groups who
can be identified and targeted for interventions. Unfortunately, during
2005 data collection became a problem, and the data for this year are not
complete enough to assess trends.
It is clear that HIV/AIDS mortality for young adults increased dramatically
since 2001, but it appears to have stabilised in 2004, possibly
demonstrating the impact of the ARV programmes. HIV/AIDS mortality in
children appears to have declined since 2001, which may reflect
successful introduction of the PMTCT programme. However, ongoing
monitoring is required in order to confirm these trends. The coding
practice with regard to HIV/AIDS used in the Metropole is different from
that used by StatsSA, where euphemisms and abbreviations for HIV such
as ‘RVD’ and ‘immune suppression’ are not coded to HIV. It is considered
that the interpretive coding practice used in the Metropole provides more
meaningful statistics regarding HIV/AIDS. Nonetheless, the tendency of
doctors to certify the indicator conditions and not disclose HIV would
result in an under-estimate of the HIV/AIDS mortality rates.
Despite the potential under-estimation, in 2006 HIV/AIDS was the either
the most common or the second most common cause of premature
mortality in each sub-district, and accounted for 16% of the burden in the
Metropole. Continued efforts to reduce the spread of HIV and provide
appropriate treatment and care for people with AIDS is therefore a
priority.
62
Mortality due to injuries, particularly homicide, is extremely high in the
City of Cape Town. There is evidence of a declining trend until 2004, but
mortality due to injuries has increased since then, with homicide mortality
rates reaching 2003 levels in 2006. Injury mortality rates, particularly
homicide and road traffic injuries, remain among the highest in the world.
The homicide rates are exceedingly high for men. Of particular concern
are the high homicide and road traffic injury fatality rates among the male
youth and children aged 10-14. This is likely to be linked to alcohol and
other substance abuse, but limited routine data are collected regarding
substances used. Urgent attention needs to be given to identifying the risk
factors involved and developing strategies to prevent injuries (inevitably
be multi-sectoral and multilevel).
Mortality rates due to non-communicable diseases are relatively high, with
geographic variations suggesting different staging of the epidemiological
transition. Diabetes mortality rates are very high when compared to
developed countries, suggesting that there is scope for better
management of the condition, particularly at primary care level. While the
mortality rates for other cardiovascular conditions are lower than the
national average, they nonetheless can be reduced further through health
promotion, improved risk factor management at primary care, and
secondary prevention after a cardiovascular event. Tobacco control efforts
should be strengthened - smoking rates are high among men of all groups
and coloured and white women.19
Child mortality (<5 years) appears to have remained constant over this
period (2001 - 2006), with the indication of a slight drop in 2006. The
cause of death is unknown in a large proportion of the under 1-year olds,
particularly those aged 1 - 11 months. This needs further investigation.
While the data suggest that child mortality due to HIV/AIDS has started
decreasing, HIV/AIDS remains a leading cause of death in children under
5 years of age, and highlights the need to strengthen the link of the
PMTCT interventions to other child health programmes beyond the first
few months of life. Attention must be given to promoting safe infant
63
feeding. Cape Town experienced an increase in the diarrhoea death rate in
2004 that was accompanied by an increase in the number of cases
attending hospital; this appears to be related to an outbreak rather than
being related to HIV/AIDS.
Khayelitsha has a considerably higher burden of premature mortality than
other sub-districts, with a rate of 250 YLLs per 1000 population. Overall,
premature mortality in Khayelitsha decreased until 2004 and then
increased. However, not all causes of death displayed the same secular
trend. The infant mortality rate declined consistently between 2003 and
2006, but Khayelitsha remains one of areas with the highest rates.
The initial decrease in the overall premature mortality rate was mainly due
to a reduction in injuries. This may be partly due to an intervention by the
Department of Safety and Security which prioritised certain police stations
(including Khayelitsha) for additional resources and attention. In
Khayelitsha, for example, an operational centre and two new police
stations were built and resourced, sector policing was introduced,
community partnerships were forged and shebeen trading hours were
restricted. However, since 2005 the injury mortality rate has increased
and reached 2003 levels in 2006. HIV/AIDS mortality increased until 2004
and declined by 2006. However, compared with other sub-districts,
premature mortality rates from HIV/AIDS or TB remain highest in this
sub-district. Non-communicable diseases are also a major cause of
mortality in this area. Stroke, hypertensive heart disease and diabetes
mortality rates are also high, particularly for women.
We consider the Cape Town surveillance system to consist of fairly robust
statistics for between 2001 and 2004 and for 2006. Assessment of the
completeness of adult death data indicates that there is little under-
registration in these years; however, there was significant under-
registration in 2005 due to problems with data collection. Estimates of the
population at sub-district level are from the projections done for the City
using the ASSA model. The number of births is taken from the City of
64
Cape Town’s birth data. It should be recognised that there is a level of
uncertainty in these numbers. In addition, the higher caseload recorded
by the NIMSS for injuries underscores the importance of developing a
sustainable mortuary-based data collection system. The province has gone
some way in developing such a system, with the implementation of an
electronic data collection system at all the mortuaries. They have also
expanded the mortality surveillance to cover the whole of the Western
Cape, and it will now possible to link the electronic mortuary data with the
death surveillance data, which should improve the completeness and
quality of the data in future.

65
Recommendations
Analysis of the 2001 mortality data for the City of Cape Town highlighted
the differentials in levels of mortality across the city as well as the
quadruple burden that is experienced across all the sub-districts. An
analysis of the emerging trends in mortality has been undertaken covering
the period 2001 - 2006. This shows that HIV/AIDS has taken over from
homicide as the leading cause of premature mortality, partly as a result of
a decline in homicides in this period as well as an increase in HIV/AIDS.
TB, road traffic injuries, diabetes, stroke and IHD have all remained
among the leading causes of premature mortality.
The broad recommendations made on the basis of the 2001 data are still
highly pertinent. While there are indications that there were some gains in
reducing the high levels of deaths due to violence and homicide, these
appear to have been lost after 2004. The extremely high mortality rates
(particularly in some areas, such as Khayelitsha) highlight the urgency of
addressing the underlying determinants of the high levels of violence.
Efforts to curb the HIV/AIDS epidemic as well as TB need to continue to
be strengthened. The emerging epidemic of non-communicable diseases
must also be tackled through strengthening primary care management on
the one hand and promoting healthy lifestyles on the other. Finally, equity
must be prioritised in resource allocation between the sub-districts.
Focusing on child health shows that the effective implementation of the
PMTCT programme will impact on mortality in the age group 1 - 4 years
(still high beyond neonatal phase - and this needs more serious policy and
programme input), and that there is a need to investigate the large
proportion of ill-defined causes of death, particularly among infants. Road
traffic injuries and other unintentional injuries among young children and
homicide among older children are also issues of concern, particularly for
boys aged 10 - 14 years. The inequities in health status are marked in the
66
child mortality indicators, making these mortality rates a sensitive
indicator to monitor progress in reducing these inequities in the future.
The high disease burden experienced by Khayelitsha points to the need for
equity to be prioritised in resource allocation between the sub-districts. It
must also be noted that the change to new health sub-districts has
masked some of the inequalities in health status that were previously
observed. In 2001 - 2004 the former sub-district of Nyanga had high
mortality, but it is no longer possible to assess the trend for these areas.
The local mortality surveillance system is providing mortality information
for the region. Integration with Home Affairs, the mortuaries and NIMSS
has been achieved and will help in ensuring the sustainability of the
system, improving the quality of the data collected and improving
utilization of the results. However, integration with other systems such as
StatsSA, South African Police Services and the Departments of Transport
and Education must be improved.
Interventions must be planned, implemented, monitored and evaluated
multi-sectorally. Vulnerable groups/areas identified through the system
must be targeted for interventions. Men’s health has traditionally been
overlooked, which is of concern given the high death rates among young
adult men. Injuries are the predominant cause of death among men, for
which structural and social interventions are urgently needed - particularly
given the increasing trend in injury mortality noted in recent years.
67
References
1 Groenewald P, Bradshaw D, Nojilana B, Bourne D, Nixon J, Mahomed H and
Daniels J. Cape Town Mortality, 2001: Cause of death and premature
mortality. Cape Town: City of Cape Town, South African Medical Research
Council, University of Cape Town, November 2003.
2 Groenewald P, van Niekerk M, Jefferies D and van Niekerk W. Cause of death
and premature mortality in the Boland Overberg region 2004. Information
Management, Boland Overberg Regional Office, Department of Health, PGWC:
December 2005.
3 Groenewald P, Bradshaw D, Daniels J, Matzopoulos R, Bourne D, Shaikh N,
Blease D, Zinyaktira N and Naledi NT. Cause of death and premature mortality
in Cape Town, 2001-2004. Cape Town: South African Medical Research
Council, 2007.
4 Western Cape Department of Health. Provincial Priorities: Annual Performance
Plan 2006/07 Western Cape Department of Health. Western Cape Department
of Health, 2006. p59.
5 National Department of Health, 2004. Strategic Priorities for the National
Health System 2004 -2009. Pretoria: Department of Health, 2004.
6 Bradshaw D, Groenewald P, Bourne D, Mahomed H, Nojilana B, Daniels J,
and Nixon J. Making cause of death statistics useful for public health at local
level in the City of Cape Town. Bull World Health Org 2006, 84(3): 211-217.
7 Zinyakatira N. Preparatory work for MPhil thesis at UCT, 2006.
8 Matzopoulos R (editor). A profile of fatal injuries in South Africa: 6th annual
report of the National Injury Mortality Surveillance System, 2004. Cape Town:
Crime, Violence and Injury Lead Programme, Medical Research
Council/University of South Africa, 2005
9 Bradshaw D, Groenewald P, Laubscher R, Nannan N, Nojilana B, Norman R,
Pieterse D and Schneider M. Initial burden of disease estimates for South
Africa, 2000. Cape Town: South African Medical Research Council, 2003.
10 Murray CJ, Lopez AD. The Global Burden of Disease: a comprehensive
assessment of mortality and disability from diseases, injuries and risk factors
in 1990 and projected to 2020. Vol. 1, Global Burden of Disease and Injury
series. Boston: Harvard School of Public Health on behalf of the World Health
Organization and the World Bank, 1996.
68
11 Dorrington R. Projection of the Population of Cape Town, 1985-2021.
Unpublished interim report, 2005.
12 School of Public Health. Equity in Health: Cape Town 2002. Cape Town:
School of Public Health, University of the Western Cape, 2004.
13 Department of Health Western Cape. Metropole District Health Services
Annual report (2003 –2004). Cape Town: Department of Health, 2004.
14 World Health Organisation. International Classification of Diseases and related
health conditions. Tenth Edition. Geneva: World Health Organisation, 1992.
15 Shaikh N, Abdullah F, Lombard CJ, Smit L, Bradshaw D and Makubalo L.
Masking through averages – intra-provincial heterogeneity in HIV prevalence
within the Western Cape. S Afr Med J 2006;96:538-543.
16 Norman R, Matzopoulos R, Groenewald P and Bradshaw D. The High Burden of
Injuries in South Africa. Bull World Health Org 2007;85(9):695-702.
17 Matzopoulos R. Violent deaths in South Africa: the 2003 National Injury
Mortality Surveillance System. SA Crime Quarterly 2005;13:29-36.
18 Matzopoulos R. Alcohol and injuries – a clear link. Southern African Journal of
Epidemiology and Infection 2005;20:114-115.
19 Department of Health, Medical Research Council and Macro International.
South African Demographic and Health Survey 1998. Full report. Pretoria:
Department of Health, 2002.
20 Bradshaw D, Nannan N, Laubscher L, Groenewald P, Joubert J, Nojilana B,
Norman R, Pieterse D and Schneider M. South African National Burden of
Disease Study 2000: Estimates of Provincial Mortality. Cape Town: Medical
Research Council, 2004.
21 Bradshaw D, Schneider M, Norman R and Bourne D. Mortality Patterns of
Chronic Diseases of Lifestyle in South Africa. In: Steyn K, Fourie J, Temple N
(Eds). Chronic Diseases of Lifestyle in South Africa 1995 -2005. Technical
Report. Cape Town: Medical Research Council, 2006.
22 Yusuf S, Reddy S, Ounpuu S and Anand S. Global Burden of Cardiovascular
Diseases. Part I: General Considerations, the Epidemiologic Transition, Risk
Factors, and Impact of Urbanization. Circulation. 2001;104(22) :2746-53.
23 Fawcus SR, van Coeverden de Groot HA and Isaacs S. A 50-year audit of
maternal mortality in the Peninsula Maternal and Neonatal service, Cape Town
(1953-2002). BJOG 2005; 112(9):1257-63.
69
Appendix 1: Completeness of vital registration in Cape Town
Assessing the completeness of death registration is difficult. Although
there are techniques available, they either require that migration be
negligible in comparison with the deaths (which is unlikely for small
populations), or - if adapted to allow for migration - that one has a
reasonably accurate measure of net migration. Since we do not have such
an accurate measure of migration for Cape Town, an alternative approach
was necessary: the numbers of deaths registered by the City of Cape
Town were compared to those reported by households in the 2001 census.
However, before this could be done, it was necessary to adjust the
numbers of deaths reported by households in the census for any
incompleteness of reporting. This was done at a national level by
Dorrington, Moultrie and Timaeus (2004), and we used their correction
factors by population group on the assumption that the quality of
reporting by households was independent of geographical area.1
Unfortunately, since this method relies on the assumption that
completeness of reporting of deaths by households is constant with
respect to age, it is only reliable for estimating the completeness of
reporting of adult deaths (e.g. those 15 and older). For children, in the
absence of any recent independent estimates of child mortality, we were
forced to assess completeness by comparing the number of recorded
deaths against those estimated by the ASSA2003 model for the City
(Dorrington, 2005).2
1 Dorrington, R. E., Moultrie, T.A., Timaeus I.A. (2004). Estimation of mortality
using the South African 2001 census data. Monograph 11. Cape Town, Centre for
Actuarial Research, University of Cape Town.
2 Dorrington, R. (2005). Projection of the Population of Cape Town, 1985- 2021.
Unpublished interim report.
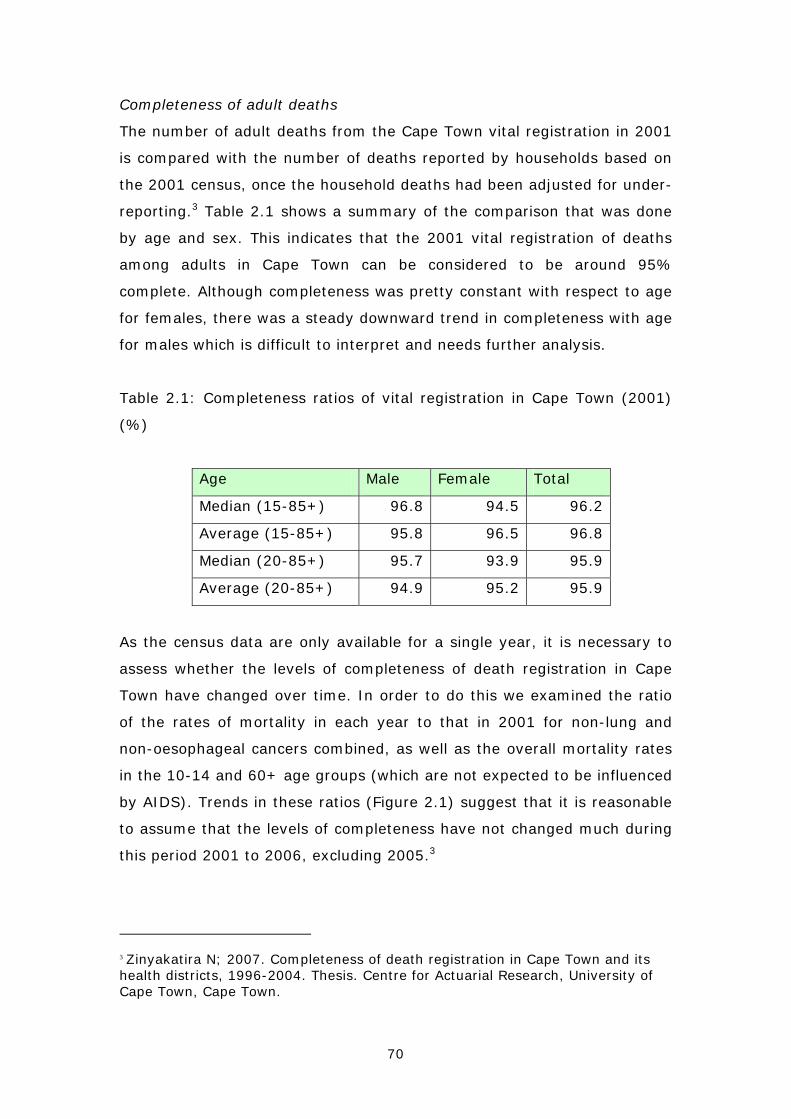
70
Completeness of adult deaths
The number of adult deaths from the Cape Town vital registration in 2001
is compared with the number of deaths reported by households based on
the 2001 census, once the household deaths had been adjusted for under-
reporting.3 Table 2.1 shows a summary of the comparison that was done
by age and sex. This indicates that the 2001 vital registration of deaths
among adults in Cape Town can be considered to be around 95%
complete. Although completeness was pretty constant with respect to age
for females, there was a steady downward trend in completeness with age
for males which is difficult to interpret and needs further analysis.
Table 2.1: Completeness ratios of vital registration in Cape Town (2001)
(%)
Age Male Female Total
Median (15-85+) 96.8 94.5 96.2
Average (15-85+) 95.8 96.5 96.8
Median (20-85+) 95.7 93.9 95.9
Average (20-85+) 94.9 95.2 95.9
As the census data are only available for a single year, it is necessary to
assess whether the levels of completeness of death registration in Cape
Town have changed over time. In order to do this we examined the ratio
of the rates of mortality in each year to that in 2001 for non-lung and
non-oesophageal cancers combined, as well as the overall mortality rates
in the 10-14 and 60+ age groups (which are not expected to be influenced
by AIDS). Trends in these ratios (Figure 2.1) suggest that it is reasonable
to assume that the levels of completeness have not changed much during
this period 2001 to 2006, excluding 2005.3
3 Zinyakatira N; 2007. Completeness of death registration in Cape Town and its health districts, 1996-2004. Thesis. Centre for Actuarial Research, University of Cape Town, Cape Town.
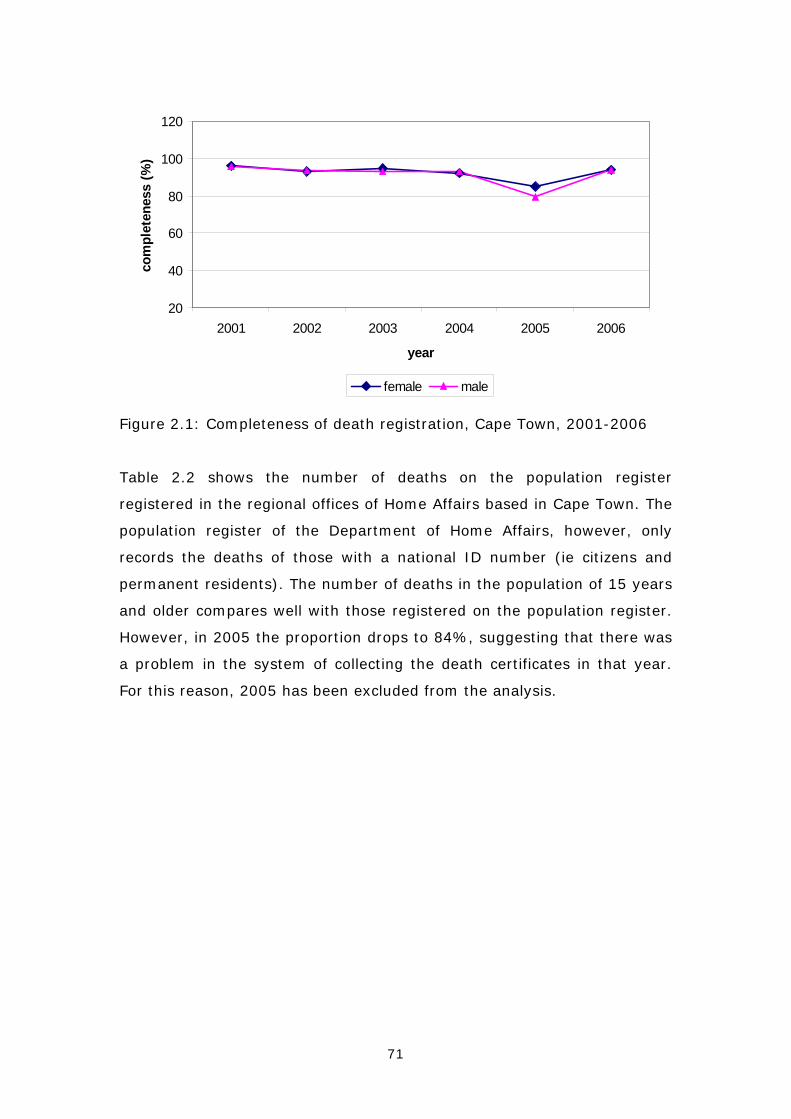
71
20
40
60
80
100
120
2001 2002 2003 2004 2005 2006
year
com
plet
enes
s (%
)
female male
Figure 2.1: Completeness of death registration, Cape Town, 2001-2006
Table 2.2 shows the number of deaths on the population register
registered in the regional offices of Home Affairs based in Cape Town. The
population register of the Department of Home Affairs, however, only
records the deaths of those with a national ID number (ie citizens and
permanent residents). The number of deaths in the population of 15 years
and older compares well with those registered on the population register.
However, in 2005 the proportion drops to 84%, suggesting that there was
a problem in the system of collecting the death certificates in that year.
For this reason, 2005 has been excluded from the analysis.
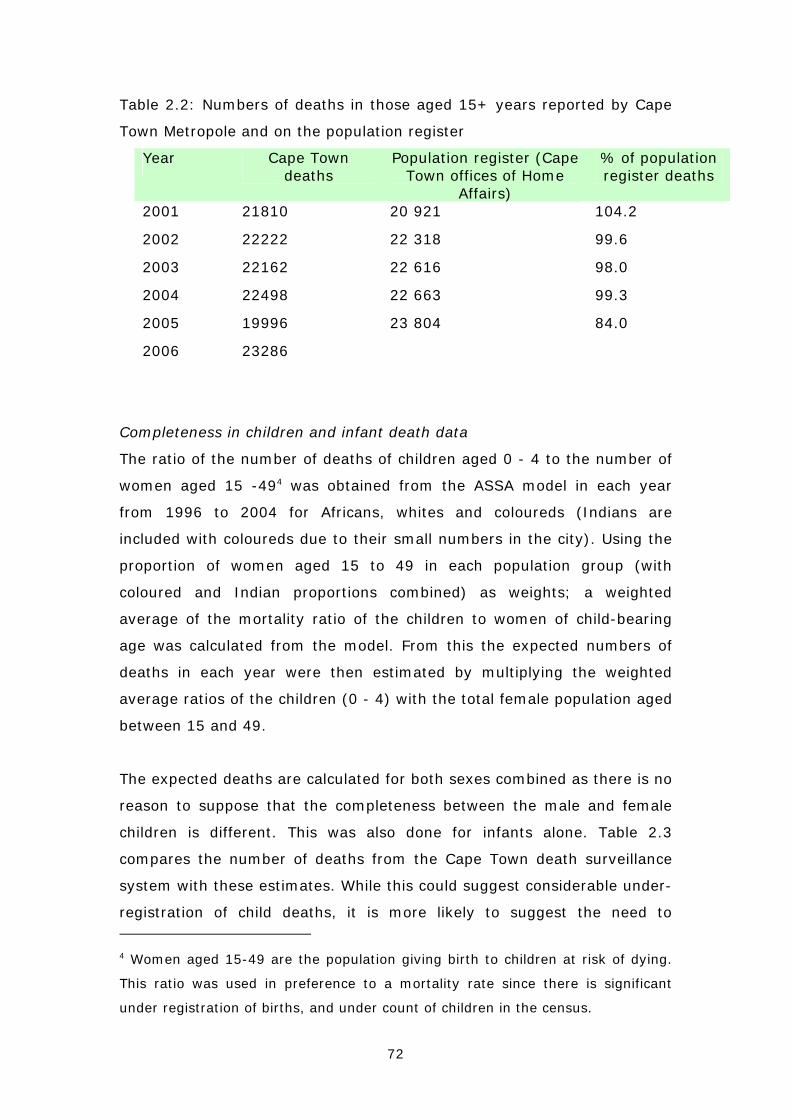
72
Table 2.2: Numbers of deaths in those aged 15+ years reported by Cape
Town Metropole and on the population register
Year Cape Town deaths
Population register (Cape Town offices of Home
Affairs)
% of population register deaths
2001 21810 20 921 104.2
2002 22222 22 318 99.6
2003 22162 22 616 98.0
2004 22498 22 663 99.3
2005 19996 23 804 84.0
2006 23286
Completeness in children and infant death data
The ratio of the number of deaths of children aged 0 - 4 to the number of
women aged 15 -494 was obtained from the ASSA model in each year
from 1996 to 2004 for Africans, whites and coloureds (Indians are
included with coloureds due to their small numbers in the city). Using the
proportion of women aged 15 to 49 in each population group (with
coloured and Indian proportions combined) as weights; a weighted
average of the mortality ratio of the children to women of child-bearing
age was calculated from the model. From this the expected numbers of
deaths in each year were then estimated by multiplying the weighted
average ratios of the children (0 - 4) with the total female population aged
between 15 and 49.
The expected deaths are calculated for both sexes combined as there is no
reason to suppose that the completeness between the male and female
children is different. This was also done for infants alone. Table 2.3
compares the number of deaths from the Cape Town death surveillance
system with these estimates. While this could suggest considerable under-
registration of child deaths, it is more likely to suggest the need to 4 Women aged 15-49 are the population giving birth to children at risk of dying.
This ratio was used in preference to a mortality rate since there is significant
under registration of births, and under count of children in the census.
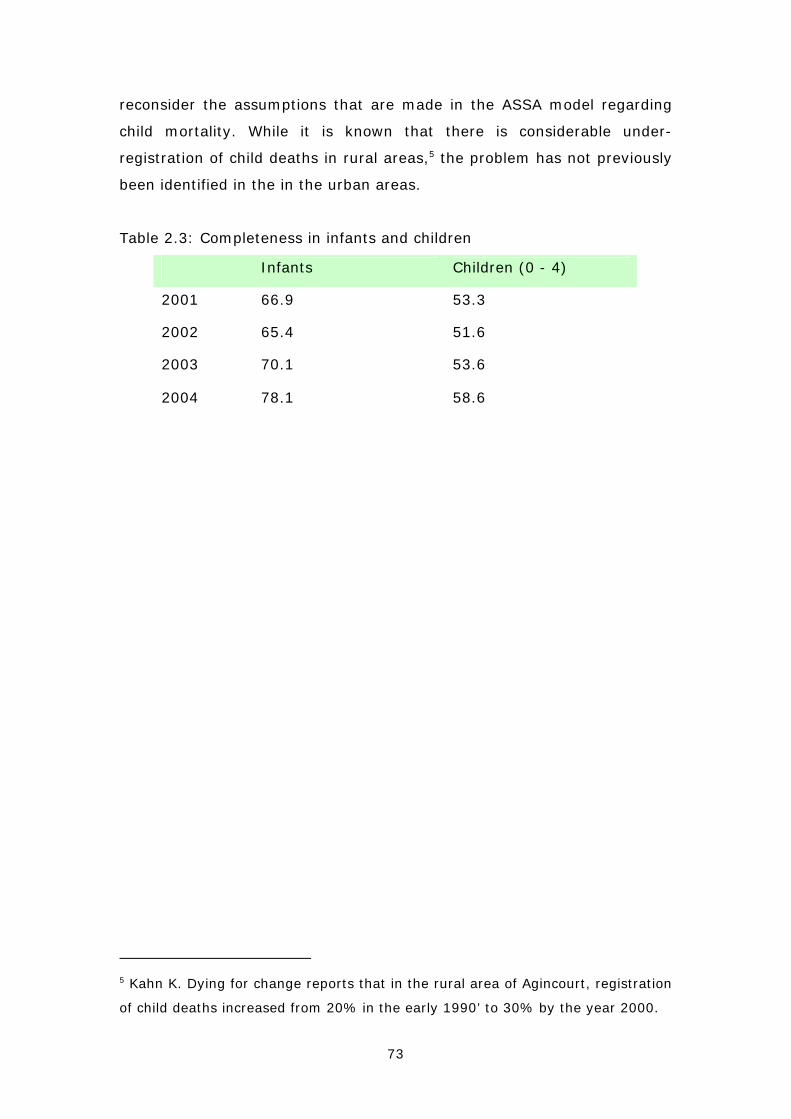
73
reconsider the assumptions that are made in the ASSA model regarding
child mortality. While it is known that there is considerable under-
registration of child deaths in rural areas,5 the problem has not previously
been identified in the in the urban areas.
Table 2.3: Completeness in infants and children
Infants Children (0 - 4)
2001 66.9 53.3
2002 65.4 51.6
2003 70.1 53.6
2004 78.1 58.6
5 Kahn K. Dying for change reports that in the rural area of Agincourt, registration
of child deaths increased from 20% in the early 1990’ to 30% by the year 2000.
74
Appendix 2: Completeness of injury deaths
Table 2.4 shows a comparison of the total number of injury deaths in the
Cape Town mortality surveillance with data from the National Injury
Mortality Surveillance System (NIMSS), which has maintained coverage of
the two Cape Town mortuaries at Salt River and Tygerberg over the four–
year period from 2001 to 2004.6 Deaths that occur in Helderberg present
to Stellenbosch mortuary, so these data are removed from the Cape Town
mortality surveillance data for the comparison. It was not possible to
compare the data for 2005 and 2006 as the Cape Town surveillance data
was incomplete in 2005 and the 2006 NIMSS data was not yet available
for comparison at the time this analysis was done. However, the NIMSS
data for 2005 confirms the increasing trend in injuries seen in the
surveillance data in 2006 and the death rates are comparable.
As may be expected, there are more deaths recorded in the NIMSS for all
years, since the Cape Town mortality surveillance system includes deaths
based on place of residence while the NIMSS records the place of death
for the deceased. Thus deaths among recent migrants into the city, many
of whom are young adults most at risk of injuries, will not be reflected in
the Cape Town mortality surveillance system but will be reflected in
NIMMS. The comparison suggests that suicides might be under-reported
in the Cape Town mortality surveillance. However, more detailed
investigation is needed to understand the differences between the two
data sets.
6 Matzopoulos R (editor). A profile of fatal injuries in South Africa: 6th annual
report of the National Injury Mortality Surveillance System, 2004. Cape Town:
Crime, Violence and Injury Lead Programme, Medical Research Council/University
of South Africa, 2005.

75
Table 2.4: City of Cape Town* injury deaths as % of NIMSS deaths
2001 2002 2003 2004
Homicide 93.3 95.1 86.3 88.2
with firearm 102.9 98.8 91.8 95.4
Suicide 77.2 73.7 61.4 82.8
Road traffic 79.4 77.9 77.8 86.2
Unintentional 122.8 136.8 116.9 150.0
Undetermined 71.0 130.7 50.4 83.8
Total 91.6 97.7 84.3 95.4
* Deaths in the sub-district of Helderberg have been
removed
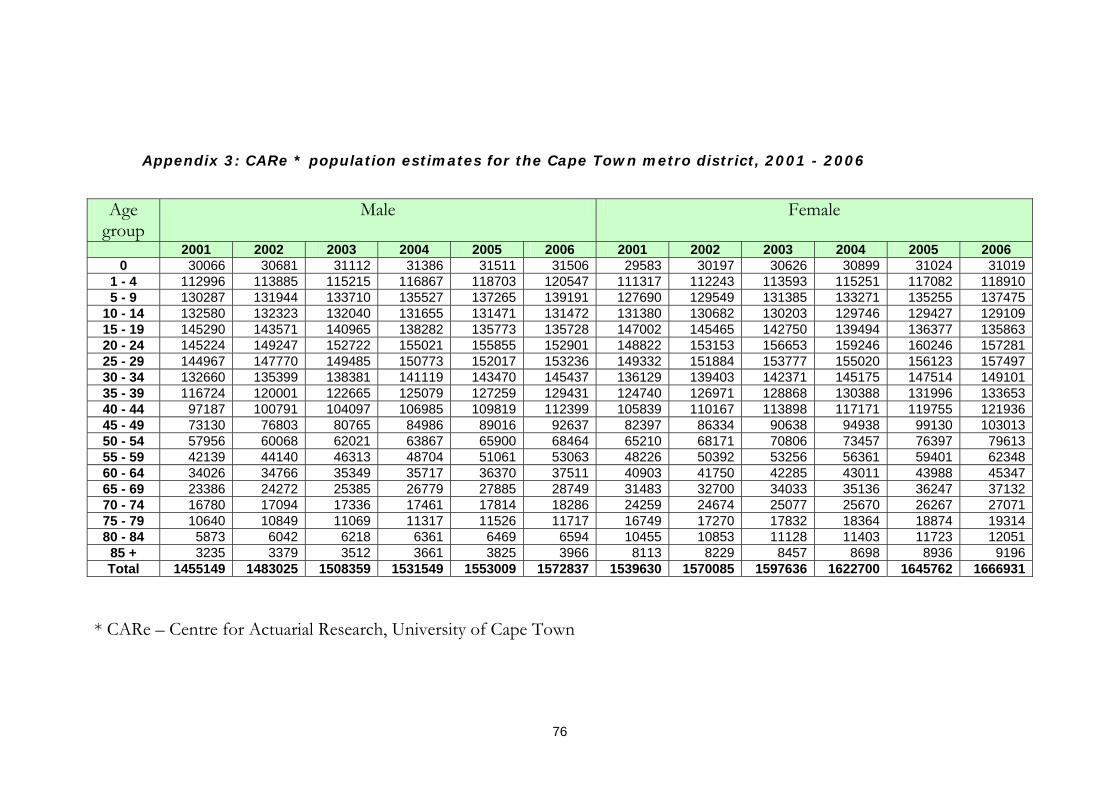
76
Appendix 3: CARe * population estimates for the Cape Town metro district, 2001 - 2006
Age
group Male Female
2001 2002 2003 2004 2005 2006 2001 2002 2003 2004 2005 2006 0 30066 30681 31112 31386 31511 31506 29583 30197 30626 30899 31024 31019
1 - 4 112996 113885 115215 116867 118703 120547 111317 112243 113593 115251 117082 118910 5 - 9 130287 131944 133710 135527 137265 139191 127690 129549 131385 133271 135255 137475
10 - 14 132580 132323 132040 131655 131471 131472 131380 130682 130203 129746 129427 129109 15 - 19 145290 143571 140965 138282 135773 135728 147002 145465 142750 139494 136377 135863 20 - 24 145224 149247 152722 155021 155855 152901 148822 153153 156653 159246 160246 157281 25 - 29 144967 147770 149485 150773 152017 153236 149332 151884 153777 155020 156123 157497 30 - 34 132660 135399 138381 141119 143470 145437 136129 139403 142371 145175 147514 149101 35 - 39 116724 120001 122665 125079 127259 129431 124740 126971 128868 130388 131996 133653 40 - 44 97187 100791 104097 106985 109819 112399 105839 110167 113898 117171 119755 121936 45 - 49 73130 76803 80765 84986 89016 92637 82397 86334 90638 94938 99130 103013 50 - 54 57956 60068 62021 63867 65900 68464 65210 68171 70806 73457 76397 79613 55 - 59 42139 44140 46313 48704 51061 53063 48226 50392 53256 56361 59401 62348 60 - 64 34026 34766 35349 35717 36370 37511 40903 41750 42285 43011 43988 45347 65 - 69 23386 24272 25385 26779 27885 28749 31483 32700 34033 35136 36247 37132 70 - 74 16780 17094 17336 17461 17814 18286 24259 24674 25077 25670 26267 27071 75 - 79 10640 10849 11069 11317 11526 11717 16749 17270 17832 18364 18874 19314 80 - 84 5873 6042 6218 6361 6469 6594 10455 10853 11128 11403 11723 12051
85 + 3235 3379 3512 3661 3825 3966 8113 8229 8457 8698 8936 9196 Total 1455149 1483025 1508359 1531549 1553009 1572837 1539630 1570085 1597636 1622700 1645762 1666931
* CARe – Centre for Actuarial Research, University of Cape Town
77
Appendix 4: Population estimates for males for sub-districts of Cape Town Metropole, 2001 – 2004
2001 males Eastern Khayelitsha Klipfontein Mitchells Plain
Northern Panorama Southern Tygerberg Western
0 3506 3945 3581 4741 2492 3831 4709 3261 1 - 4 13076 13660 13733 17156 10054 15127 18389 11801 5 - 9 15290 14848 16211 19167 11328 17905 22609 12931
10 - 14 15140 14517 16759 19601 11274 18714 23489 13086 15 - 19 15043 16114 17999 21545 12348 22069 25258 14914 20 - 24 13975 18285 16942 21172 12557 22111 22030 18153 25 - 29 14419 19086 16786 20852 13617 20517 20459 19232 30 - 34 14619 15217 14876 16780 14158 20165 19825 17019 35 - 39 13568 12570 12870 14438 12329 17944 18956 14049 40 - 44 11134 9253 10369 11999 11201 15437 16141 11653 45 - 49 7841 6437 8119 9661 8651 11794 11863 8764 50 - 54 5685 4156 6673 7137 6822 10517 9493 7475 55 - 59 4117 2317 5238 4416 5089 8198 7022 5743 60 - 64 3462 1622 4350 2952 3952 6969 5896 4824 65 - 69 2433 714 3140 1572 2754 5087 4317 3370 70 - 74 1702 442 2112 922 1851 3957 2893 2901 75 - 79 1207 230 1405 345 1241 2691 1679 1842 80 - 84 693 148 592 152 531 1464 810 1483
85 + 409 52 297 80 291 944 435 727 Total 157318 153614 172050 194687 142537 225441 236273 173228
78
2002 males Eastern Khayelitsha Klipfontein Mitchells Plain
Northern Panorama Southern Tygerberg Western
0 3622 3962 3643 4878 2570 3870 4793 3344 1 - 4 13217 13561 13772 17290 10303 15281 18380 12080 5 - 9 15526 15032 16381 19223 11583 18123 22879 13196
10 - 14 15155 14716 16769 19329 11267 18709 23302 13077 15 - 19 15045 16165 17721 21106 12291 21643 24965 14636 20 - 24 14599 18778 17125 21867 13195 22487 22473 18723 25 - 29 14673 19489 16862 21707 14180 20614 20536 19709 30 - 34 14744 15258 15139 17141 14822 20437 20235 17623 35 - 39 13963 12849 13273 14728 12765 18397 19642 14384 40 - 44 11725 9449 10714 12187 11720 15975 16983 12037 45 - 49 8369 6783 8535 10150 9150 12189 12582 9045 50 - 54 5848 4359 6881 7517 7106 10765 9899 7694 55 - 59 4289 2381 5452 4660 5402 8554 7392 6012 60 - 64 3513 1695 4376 3055 4117 7126 5980 4905 65 - 69 2505 711 3242 1648 2921 5247 4532 3465 70 - 74 1681 444 2119 960 1937 4027 2967 2959 75 - 79 1190 226 1444 326 1321 2731 1737 1875 80 - 84 680 162 619 151 554 1497 837 1542
85 + 420 52 311 78 317 980 454 767 Total 160762 156072 174376 198003 147519 228653 240568 177072
79
2003 males Eastern Khayelitsha Klipfontein Mitchells Plain
Northern Panorama Southern Tygerberg Western
0 3716 3957 3683 4987 2631 3886 4846 3406 1 - 4 13407 13524 13865 17491 10589 15495 18439 12405 5 - 9 15774 15237 16567 19295 11842 18359 23164 13472
10 - 14 15163 14918 16777 19061 11249 18701 23109 13062 15 - 19 14944 16115 17337 20545 12147 21095 24510 14272 20 - 24 15176 19208 17240 22484 13789 22775 22824 19227 25 - 29 14813 19756 16813 22414 14636 20559 20454 20040 30 - 34 14890 15330 15428 17530 15518 20743 20675 18265 35 - 39 14285 13067 13610 14939 13132 18759 20229 14643 40 - 44 12289 9616 11026 12331 12200 16466 17785 12383 45 - 49 8939 7159 8983 10676 9681 12620 13356 9351 50 - 54 5993 4557 7070 7885 7368 10981 10278 7890 55 - 59 4475 2451 5685 4926 5739 8942 7792 6304 60 - 64 3546 1762 4381 3146 4263 7253 6034 4964 65 - 69 2598 713 3373 1741 3119 5456 4792 3592 70 - 74 1653 445 2116 995 2015 4080 3028 3005 75 - 79 1174 223 1484 308 1404 2772 1795 1909 80 - 84 668 176 647 151 578 1531 865 1602
85 + 428 51 324 76 343 1013 472 804 Total 163930 158265 176410 200982 152242 231486 244448 180597
80
2004 males Eastern Khayelitsha Klipfontein Mitchells Plain
Northern Panorama Southern Tygerberg Western
0 3791 3934 3704 5071 2678 3883 4874 3450 1 - 4 13632 13532 13997 17740 10901 15754 18544 12767 5 - 9 16027 15455 16760 19375 12101 18604 23452 13753
10 - 14 15156 15114 16772 18785 11216 18681 22897 13035 15 - 19 14824 16054 16948 19983 11984 20547 24035 13907 20 - 24 15640 19498 17219 22926 14278 22885 22990 19585 25 - 29 14907 19972 16716 23062 15045 20448 20310 20314 30 - 34 15003 15379 15688 17887 16195 21012 21072 18882 35 - 39 14577 13264 13922 15119 13466 19084 20776 14871 40 - 44 12812 9744 11292 12418 12628 16892 18524 12676 45 - 49 9549 7564 9460 11235 10241 13080 14178 9679 50 - 54 6125 4751 7246 8246 7614 11175 10640 8070 55 - 59 4680 2532 5943 5218 6106 9371 8230 6626 60 - 64 3557 1821 4359 3218 4383 7336 6048 4994 65 - 69 2718 723 3540 1854 3355 5724 5108 3758 70 - 74 1614 442 2099 1024 2080 4105 3067 3031 75 - 79 1160 220 1527 292 1493 2820 1857 1948 80 - 84 652 190 672 150 598 1558 888 1654
85 + 438 50 339 75 372 1049 491 847 Total 166861 160237 178202 203678 156735 234008 247981 183846

81
2005 males Eastern Khayelitsha Klipfontein Mitchells Plain
Northern Panorama Southern Tygerberg Western
0 3849 3895 3708 5131 2711 3863 4878 34781 - 4 13877 13566 14150 18016 11228 16039 18675 131525 - 9 16270 15671 16944 19444 12349 18839 23722 14025
10 - 14 15170 15338 16791 18546 11194 18689 22718 1302615 - 19 14714 16009 16583 19456 11827 20035 23586 1356420 - 24 15957 19609 17038 23150 14631 22779 22933 1975925 - 29 14992 20186 16615 23707 15445 20333 20159 2058030 - 34 15072 15390 15903 18193 16833 21221 21404 1945435 - 39 14840 13441 14210 15269 13771 19375 21283 1507140 - 44 13335 9867 11551 12495 13046 17308 19259 1296045 - 49 10149 7956 9915 11768 10777 13500 14974 997850 - 54 6272 4965 7442 8639 7880 11398 11033 827255 - 59 4879 2609 6194 5509 6472 9792 8662 694460 - 64 3595 1895 4372 3316 4537 7480 6109 506565 - 69 2806 723 3667 1948 3558 5930 5370 388270 - 74 1597 446 2109 1066 2172 4183 3144 309775 - 79 1141 216 1564 276 1579 2856 1912 198180 - 84 633 203 694 148 615 1575 906 1696
85 + 449 50 354 74 404 1089 512 893Total 169595 162034 179803 206149 161029 236284 251240 186874
82
2006 males Eastern Khayelitsha Klipfontein Mitchells Plain
Northern Panorama Southern Tygerberg Western
0 3889 3842 3696 5169 2731 3827 4860 3491 1 - 4 14120 13606 14301 18294 11557 16326 18799 13545 5 - 9 16532 15916 17149 19543 12613 19101 24016 14322
10 - 14 15201 15588 16831 18340 11185 18722 22568 13037 15 - 19 14863 16255 16517 19290 11879 19893 23555 13476 20 - 24 15877 19248 16450 22807 14618 22128 22316 19457 25 - 29 15069 20402 16509 24355 15840 20216 19999 20848 30 - 34 15095 15364 16071 18450 17432 21371 21669 19984 35 - 39 15100 13622 14495 15419 14073 19665 21785 15273 40 - 44 13831 9968 11778 12539 13432 17683 19951 13215 45 - 49 10711 8316 10323 12246 11262 13849 15703 10227 50 - 54 6466 5224 7694 9110 8208 11709 11513 8540 55 - 59 5041 2667 6398 5766 6796 10144 9034 7216 60 - 64 3680 1998 4442 3460 4754 7725 6247 5205 65 - 69 2868 718 3760 2026 3734 6083 5587 3973 70 - 74 1590 452 2132 1116 2280 4290 3242 3185 75 - 79 1121 212 1597 261 1664 2887 1963 2012 80 - 84 615 218 717 146 633 1596 925 1744
85 + 457 49 367 72 434 1123 530 934 Total 172127 163666 181227 208408 165125 238338 254261 189684
83
Appendix 5: Population Estimates for females for sub-districts of Cape Town Metropole, 2001–2006
2001 females Eastern Khayelitsha Klipfontein Mitchells Plain
Northern Panorama Southern Tygerberg Western
0 3314 3958 3424 4682 2520 3821 4628 32371 - 4 12925 13480 13632 17215 9473 14509 18423 116615 - 9 14841 15034 15754 19372 10938 17260 21717 12774
10 - 14 14408 15367 16794 19798 10948 17939 23115 1301115 - 19 14851 18476 18557 22740 12281 19808 25001 1528920 - 24 14014 20107 18325 22357 11925 20208 23619 1826625 - 29 14960 20747 17877 20839 13860 20094 21541 1941330 - 34 14833 15673 15635 16599 14410 20139 21941 1689935 - 39 14075 13060 14481 15139 12681 19292 21408 1460540 - 44 11241 9782 11960 13798 11551 17144 17868 1249645 - 49 8178 6567 10004 10850 8887 13754 13995 1016250 - 54 5966 3836 8256 7700 7120 12153 11625 855455 - 59 4437 2332 6305 4780 5404 9719 8569 668160 - 64 3777 1787 5845 3523 4342 8278 7753 559865 - 69 2786 929 4841 2116 3134 6832 6315 453070 - 74 2521 505 3474 1228 2368 5846 4562 375575 - 79 1879 260 2140 667 1682 4229 2906 298680 - 84 1254 158 1213 357 960 2872 1725 1916
85 + 887 101 749 232 660 2420 1348 1715Total 161146 162160 189263 203991 145145 236318 258061 183547
84
2002 females Eastern Khayelitsha Klipfontein Mitchells Plain
Northern Panorama Southern Tygerberg Western
0 3442 3975 3472 4785 2589 3898 4713 33231 - 4 13109 13339 13721 17347 9660 14634 18519 119145 - 9 15085 15255 15916 19580 11208 17464 21978 13062
10 - 14 14386 15479 16729 19418 10934 17920 22865 1295015 - 19 14793 18508 18234 22347 12274 19497 24634 1517820 - 24 14657 20530 18620 23272 12426 20674 24118 1885725 - 29 15129 21344 17983 21632 14237 20234 21449 1987530 - 34 15009 15962 15901 16930 15044 20549 22494 1751535 - 39 14412 13367 14755 15085 12957 19591 22014 1478940 - 44 11851 10264 12348 14165 12142 17817 18658 1292245 - 49 8637 7089 10461 11459 9363 14200 14602 1052250 - 54 6174 4028 8599 8217 7502 12561 12202 888755 - 59 4574 2394 6484 5049 5779 10157 8907 704760 - 64 3801 1855 5861 3671 4575 8393 7851 574365 - 69 2796 955 5053 2213 3308 7065 6640 467170 - 74 2491 509 3587 1241 2442 5933 4692 377975 - 79 1863 251 2250 669 1775 4332 3057 307380 - 84 1286 170 1285 374 1013 2950 1812 1962
85 + 860 104 755 233 694 2448 1393 1742Total 164355 165378 192015 207687 149922 240317 262601 187811
85
2003 females Eastern Khayelitsha Klipfontein Mitchells Plain
Northern Panorama Southern Tygerberg Western
0 3550 3968 3500 4860 2641 3951 4767 3388 1 - 4 13342 13258 13863 17544 9880 14814 18681 12211 5 - 9 15326 15482 16078 19784 11472 17664 22233 13347
10 - 14 14386 15621 16694 19080 10931 17929 22653 12908 15 - 19 14610 18390 17771 21780 12157 19032 24070 14940 20 - 24 15230 20845 18809 24069 12857 21022 24476 19344 25 - 29 15228 21861 18011 22340 14546 20282 21262 20246 30 - 34 15148 16220 16131 17220 15650 20910 22995 18096 35 - 39 14713 13648 14991 14992 13193 19837 22564 14931 40 - 44 12406 10699 12665 14446 12667 18393 19347 13275 45 - 49 9139 7667 10961 12123 9876 14691 15263 10918 50 - 54 6349 4204 8900 8710 7848 12900 12721 9173 55 - 59 4770 2488 6746 5393 6244 10735 9363 7516 60 - 64 3795 1911 5832 3794 4778 8442 7888 5846 65 - 69 2812 983 5283 2318 3496 7321 6992 4828 70 - 74 2460 512 3700 1253 2515 6017 4821 3800 75 - 79 1850 244 2367 672 1873 4442 3218 3166 80 - 84 1302 180 1345 386 1055 2994 1880 1985
85 + 846 109 770 237 737 2509 1457 1792 Total 167264 168291 194418 211002 154414 243885 266653 191709
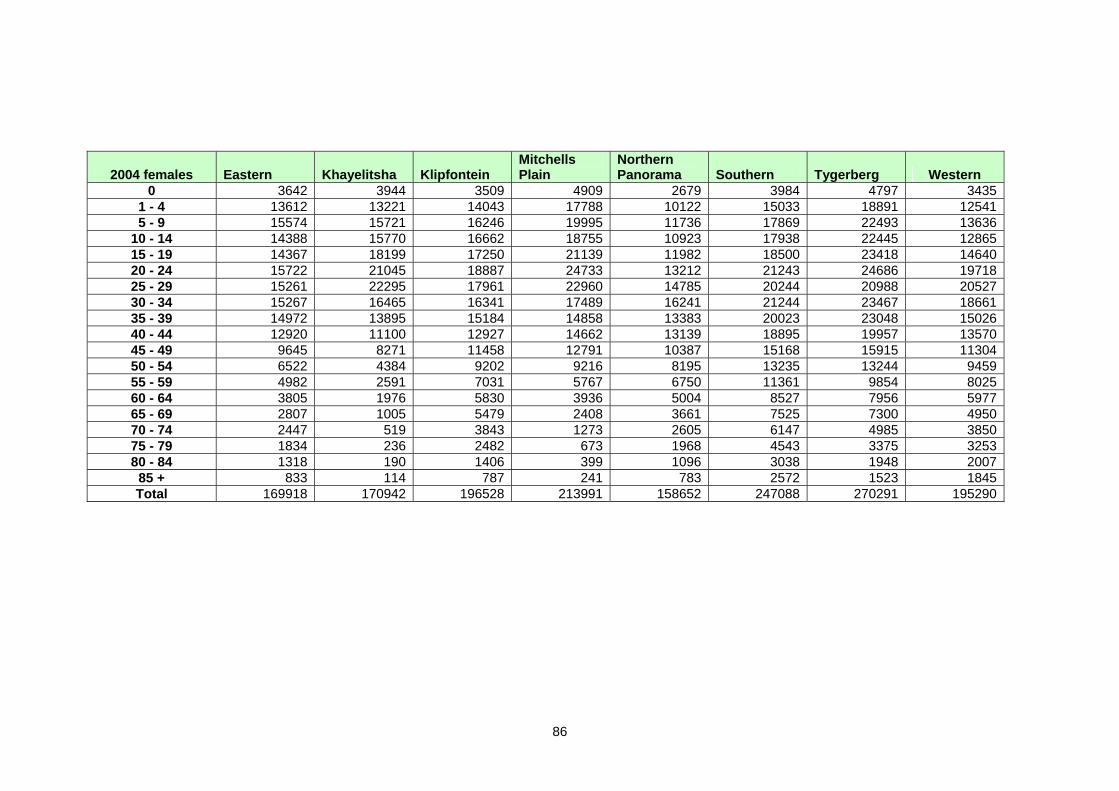
86
2004 females Eastern Khayelitsha Klipfontein Mitchells Plain
Northern Panorama Southern Tygerberg Western
0 3642 3944 3509 4909 2679 3984 4797 3435 1 - 4 13612 13221 14043 17788 10122 15033 18891 12541 5 - 9 15574 15721 16246 19995 11736 17869 22493 13636
10 - 14 14388 15770 16662 18755 10923 17938 22445 12865 15 - 19 14367 18199 17250 21139 11982 18500 23418 14640 20 - 24 15722 21045 18887 24733 13212 21243 24686 19718 25 - 29 15261 22295 17961 22960 14785 20244 20988 20527 30 - 34 15267 16465 16341 17489 16241 21244 23467 18661 35 - 39 14972 13895 15184 14858 13383 20023 23048 15026 40 - 44 12920 11100 12927 14662 13139 18895 19957 13570 45 - 49 9645 8271 11458 12791 10387 15168 15915 11304 50 - 54 6522 4384 9202 9216 8195 13235 13244 9459 55 - 59 4982 2591 7031 5767 6750 11361 9854 8025 60 - 64 3805 1976 5830 3936 5004 8527 7956 5977 65 - 69 2807 1005 5479 2408 3661 7525 7300 4950 70 - 74 2447 519 3843 1273 2605 6147 4985 3850 75 - 79 1834 236 2482 673 1968 4543 3375 3253 80 - 84 1318 190 1406 399 1096 3038 1948 2007
85 + 833 114 787 241 783 2572 1523 1845 Total 169918 170942 196528 213991 158652 247088 270291 195290
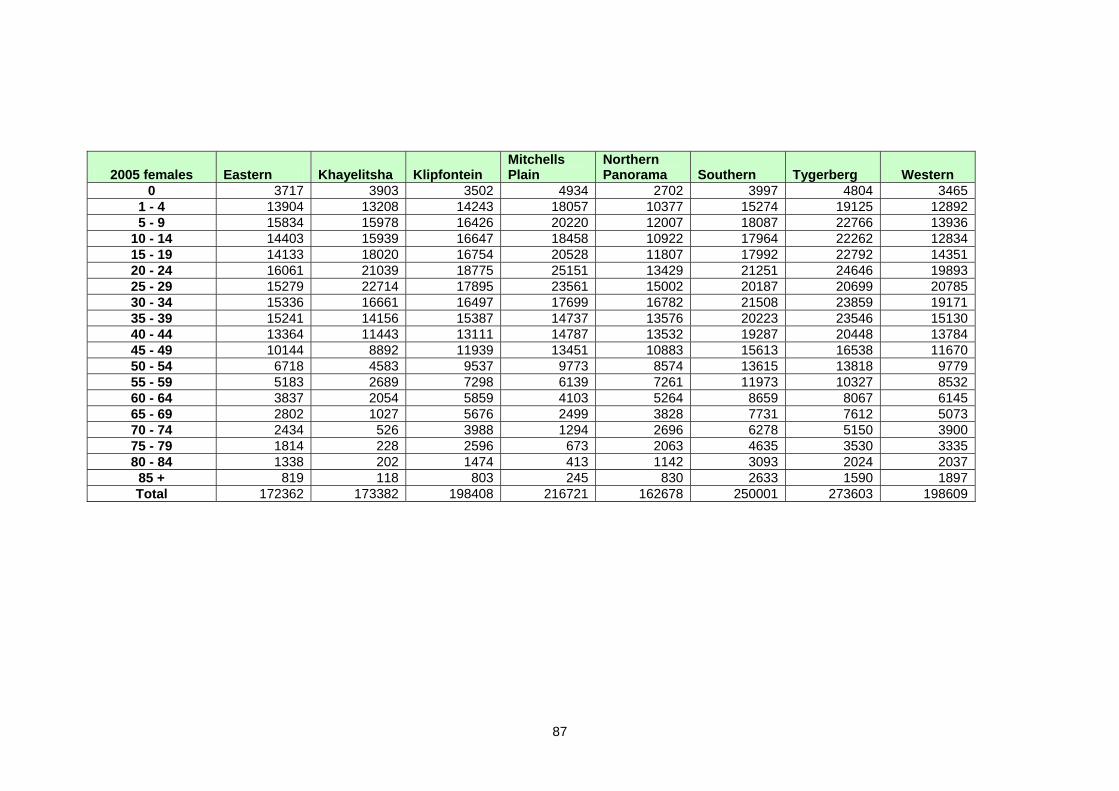
87
2005 females Eastern Khayelitsha Klipfontein Mitchells Plain
Northern Panorama Southern Tygerberg Western
0 3717 3903 3502 4934 2702 3997 4804 34651 - 4 13904 13208 14243 18057 10377 15274 19125 128925 - 9 15834 15978 16426 20220 12007 18087 22766 13936
10 - 14 14403 15939 16647 18458 10922 17964 22262 1283415 - 19 14133 18020 16754 20528 11807 17992 22792 1435120 - 24 16061 21039 18775 25151 13429 21251 24646 1989325 - 29 15279 22714 17895 23561 15002 20187 20699 2078530 - 34 15336 16661 16497 17699 16782 21508 23859 1917135 - 39 15241 14156 15387 14737 13576 20223 23546 1513040 - 44 13364 11443 13111 14787 13532 19287 20448 1378445 - 49 10144 8892 11939 13451 10883 15613 16538 1167050 - 54 6718 4583 9537 9773 8574 13615 13818 977955 - 59 5183 2689 7298 6139 7261 11973 10327 853260 - 64 3837 2054 5859 4103 5264 8659 8067 614565 - 69 2802 1027 5676 2499 3828 7731 7612 507370 - 74 2434 526 3988 1294 2696 6278 5150 390075 - 79 1814 228 2596 673 2063 4635 3530 333580 - 84 1338 202 1474 413 1142 3093 2024 2037
85 + 819 118 803 245 830 2633 1590 1897Total 172362 173382 198408 216721 162678 250001 273603 198609
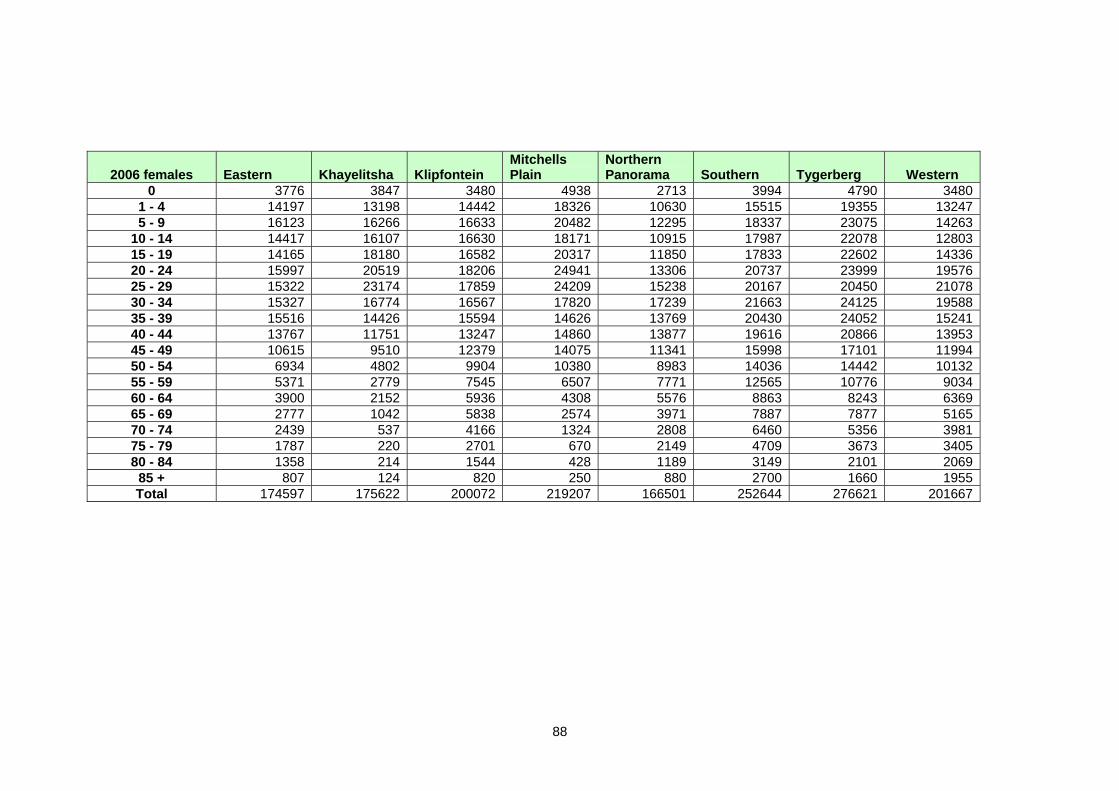
88
2006 females Eastern Khayelitsha Klipfontein Mitchells Plain
Northern Panorama Southern Tygerberg Western
0 3776 3847 3480 4938 2713 3994 4790 34801 - 4 14197 13198 14442 18326 10630 15515 19355 132475 - 9 16123 16266 16633 20482 12295 18337 23075 14263
10 - 14 14417 16107 16630 18171 10915 17987 22078 1280315 - 19 14165 18180 16582 20317 11850 17833 22602 1433620 - 24 15997 20519 18206 24941 13306 20737 23999 1957625 - 29 15322 23174 17859 24209 15238 20167 20450 2107830 - 34 15327 16774 16567 17820 17239 21663 24125 1958835 - 39 15516 14426 15594 14626 13769 20430 24052 1524140 - 44 13767 11751 13247 14860 13877 19616 20866 1395345 - 49 10615 9510 12379 14075 11341 15998 17101 1199450 - 54 6934 4802 9904 10380 8983 14036 14442 1013255 - 59 5371 2779 7545 6507 7771 12565 10776 903460 - 64 3900 2152 5936 4308 5576 8863 8243 636965 - 69 2777 1042 5838 2574 3971 7887 7877 516570 - 74 2439 537 4166 1324 2808 6460 5356 398175 - 79 1787 220 2701 670 2149 4709 3673 340580 - 84 1358 214 1544 428 1189 3149 2101 2069
85 + 807 124 820 250 880 2700 1660 1955Total 174597 175622 200072 219207 166501 252644 276621 201667


![Reducing Premature Cardiovascular Morbidity and Mortality ... › cvd...prevalent cardiovascular disease (CVD) worldwide is likely to be around 100 million[1e3].Thefive-year rate](https://static.fdocuments.us/doc/165x107/5f0e23587e708231d43dcb54/reducing-premature-cardiovascular-morbidity-and-mortality-a-cvd-prevalent.jpg)
