Categorytfeip-secretariat.org/assets/Guidebook-updates/May2016... · Web viewThey comprise both...
128
Draft Not To Be Quoted 1.A.2.g vii Mobile Combustion in manufacturing industries and construction Category Title NFR: 1.A.2.g vii 1.A.4.a. ii 1.A.4.b ii 1.A.4.c ii 1.A.4.c iii 1.A.5.b Mobile Combustion in manufacturing industries and construction Commercial/institutional: Mobile Residential: Household and gardening (mobile) Agriculture/Forestry/Fishing: Off-road vehicles & other machinery Agriculture/Forestry/Fishing: National fishing Other, Mobile (inc. military, land based and recreational boats) SNAP: 0808 0809 0806 0807 0801 Other mobile sources and machinery — Industry Other mobile sources and machinery — Household and gardening Other mobile sources and machinery — Agriculture Other mobile sources and machinery — Forestry Other mobile sources and machinery — Military ISIC: Versi on Guideboo k 2016 Draft Not To Be Quoted 1 2 3 4 5 6 7 8 9 10 11 12 13 14 15 16 17 18
Transcript of Categorytfeip-secretariat.org/assets/Guidebook-updates/May2016... · Web viewThey comprise both...

Draft Not To Be Quoted
1.A.2.g viiMobile Combustion in manufacturing industries and construction
Category Title
NFR: 1.A.2.g vii1.A.4.a.ii1.A.4.b ii1.A.4.c ii1.A.4.c iii1.A.5.b
Mobile Combustion in manufacturing industries and constructionCommercial/institutional: MobileResidential: Household and gardening (mobile)Agriculture/Forestry/Fishing: Off-road vehicles & other machineryAgriculture/Forestry/Fishing: National fishingOther, Mobile (inc. military, land based and recreational boats)
SNAP: 08080809
080608070801
Other mobile sources and machinery — IndustryOther mobile sources and machinery — Household and gardeningOther mobile sources and machinery — AgricultureOther mobile sources and machinery — ForestryOther mobile sources and machinery — Military
ISIC:
Version
Guidebook 2016
Lead authorsMorten Winther, Chris Dore
Contributing authors (including to earlier versions of this chapter)John Norris, Karl-Heinz Zierock, Udo Lambrecht
Draft Not To Be Quoted
123
456789
1011121314151617181920212223242526

Draft Not To Be Quoted
1.A.2.g viiMobile Combustion in manufacturing industries and construction
Contents1 Overview...................................................................................................................................32 Description of sources...............................................................................................................4
2.1 Process description...........................................................................................................42.2 Types of equipment used..................................................................................................52.3 Industry............................................................................................................................62.4 Agriculture and forestry...................................................................................................92.5 Military, land based........................................................................................................102.6 Household and gardening...............................................................................................102.7 Emissions.......................................................................................................................112.8 Contribution to total emissions.......................................................................................112.9 Controls..........................................................................................................................13
3 Methods..................................................................................................................................153.1 Choice of method...........................................................................................................153.2 Tier 1 default approach..................................................................................................183.3 Tier 2 technology-dependent approach..........................................................................243.4 Tier 3 equipment-specific and technology-stratified approach......................................473.5 Speciation.......................................................................................................................63
4 Data quality.............................................................................................................................674.1 Inventory quality assurance/quality control QA/QC......................................................674.2 Completeness.................................................................................................................674.3 Avoiding double counting with other sectors.................................................................674.4 Verification....................................................................................................................674.5 Developing a consistent time series and recalculation...................................................684.6 Uncertainty assessment..................................................................................................684.7 Gridding.........................................................................................................................694.8 Reporting and documentation........................................................................................704.9 Weakest aspects and priority areas for improvement in the current methodology.........70
5 Temporal disaggregation criteria............................................................................................716 Glossary..................................................................................................................................727 References...............................................................................................................................728 Point of enquiry......................................................................................................................76Appendix A Reference list of off-road machinery.....................................................................77Appendix B Engine-types of off-road machinery......................................................................79Appendix C Background to Tier 1 and 2 emission factors for non-road machinery..................81Appendix D Generating Estimates of Fuel used by NRMM......................................................89Appendix E BC fractions of PM for non-road engines..............................................................93
Draft Not To Be Quoted
1
2
3456789
101112131415161718192021222324252627282930313233343536373839

Draft Not To Be Quoted
1.A.2.g viiMobile Combustion in manufacturing industries and construction
1 Overview This chapter provides a common tool for the estimation of combustion emissions from selected mobile sources. Categories excluded from this guidance are:
aviation
road transport
railways
and navigation (including small boats).
This chapter covers a mixture of ‘other’ equipment which is distributed across a wide range of industry sectors, typically land based, and is commonly referred to collectively as “Non-Road Mobile Machinery” (NRMM). However, despite this diversity there is the common theme that all the equipment covered uses reciprocating engines, fuelled with liquid hydrocarbon-based fuels. They comprise both diesel- (compression ignition), petrol- and LPG- (spark ignition) engined machinery.
More specifically, the types of equipment covered in this chapter are:
1.A.2.g vii mobile combustion in manufacturing industries and construction;
1.A.4.a.ii commercial and institutional mobile machinery;
1.A.4.b ii mobile combustion used in residential areas: household and gardening mobile machinery;
1.A.4.c ii off-road vehicles and other machinery used in agriculture/forestry mobile machinery (excluding fishing);
1.A.5.b other mobile including military mobile machinery.
For all these types of equipment, the emissions originate from the combustion of fuel to power the equipment.
In terms of relative size, the importance of these sectors varies from sector to sector and from nation to nation. For many countries, the contribution to the national total emission will be small i.e. the individual sources are not key sources. However, the contributions from some sectors to some nations’ inventories may be moderately important.
This chapter also includes information on machinery complying with the European Commission’s proposed “Stage V” emission limits. Whilst this legislation is not yet in place, it is expected that machinery complying with Stage V emission limits will be in use from 2019 onwards.
The more important species include: SO2, NOx, CO2 PM, CO and NMVOCs, with the relative importance of the species depending on the type of engine diesel compression ignition or petrol spark ignition , and the type of equipment. The methodology used for estimating
Draft Not To Be Quoted
1
23
4
5
6
7
89
10111213
14
1516
17181920
21222324
252627

Draft Not To Be Quoted
1.A.2.g viiMobile Combustion in manufacturing industries and construction
emissions of CO2 and SO2 are predominantly fuel-based, and therefore independent of engine technology/type of equipment.
As part of the 2015 Guidebook review, selected Tier 1 and/or Tier 2 PM emission factors have been reviewed to identify if the data represent filterable or total (filterable and condensable) PM. Note that PM emission factors in the Guidebook represent primary emissions from the activities and not formation of secondary aerosol from chemical reaction in the atmosphere after release.
A number of factors influence the measurement and determination of primary PM emissions from activities and, the quantity of PM determined in an emission measurement depends to a large extent on the measurement conditions. This is particularly true of activities involving high temperature and semi-volatile emission components – in such instances the PM emission may be partitioned between a solid/aerosol phase and material which is gaseous at the sampling point but which can condense in the atmosphere. The proportion of filterable and condensable material will vary depending on the temperature of the flue gases and in sampling equipment.
The measurement approach for determining PM emission from NRMM includes dilution where sampled flue or exhaust gases are mixed with ambient air (either using a dilution tunnel or dilution sampling systems) which collect the filterable and condensable components on a filter at lower temperature (52°C).
The review identifies whether the PM emission factors (for TSP, PM10 and PM2.5) represent total PM, filterable PM or whether the basis of the emission factor cannot be determined (see individual emission factor tables).
One of the more significant challenges for estimating emissions from these sources relates to obtaining activity data. Calculations can be made on the basis of fuel consumption or hours of operation of machinery. It is rare for fuel consumption data (whether obtained from national energy balance tables or sales data) to resolve the petrol and diesel used in NRMM from that consumed by road transport. It is good practise to ensure that the fuel assigned to road transport does not include that used by NRMM, and care must be taken to avoid double counting of emissions. This is relevant whether estimating emissions of NRMM is based on a fuel used or hours of operation approach.
2 Description of sources
2.1 Process descriptionExhaust emissions from NRMM arise from the combustion of diesel, gasoline and LPG. The NRMM sources which account for the majority of emissions are shown in the flow diagram in Figure 2.1.
Draft Not To Be Quoted
12
3456789
1011121314151617181920
212223
2425262728293031
32
33
343536
Construction machineryAgricultural mobile machinery
Residential & Commercial mobile machineryOther mobile (including Military)
Fuel FuelUsefulwork
Fugitive emissions of NMVOC,
See Chapter 1.B
Draft Not To Be Quoted
1.A.2.g viiMobile Combustion in manufacturing industries and construction
Figure 2-1 Flow diagram for the contribution of NRMM categories to combustion emissions
2.2 Types of equipment usedThe types of equipment used under the collective NRMM label represents a very broad list. Several inventorying systems have developed detailed lists of these. Chapter 2.3 – 2.6 provide an example of these, based on the SNAP nomenclature.
In some cases, there is a risk of misallocation, overlap or double counting, because it is not always clear whether e.g. specialised utility vehicles such as fire trucks, refuse collectors, sewage trucks, road tankers, etc. are included in the on-road vehicle reporting categories. In addition, some of the vehicles may have a second combustion engine in order to operate specialist equipment or machinery. Where possible, the machinery should be reported under the appropriate NRMM reporting category and not road transport. If it is not possible to resolve the fuel used by the main vehicle and the on-board mobile machinery, then then emissions from the mobile machinery can be reported under the same source category as the main vehicle.
In some other cases, machinery is mobile in principle, but actually stays at the same site for long periods, or is only mobile within a small radius, e.g., some excavators and cranes. In many cases it will be appropriate to report these as ‘Other mobile sources and machinery’, but allocation to other NRMM categories is also possible. Similarly there are large mobile generator sets, e.g. above 1 MW, which are mobile but in reality are not often moved. Care is needed to ensure that equipment such as mobile generators are not included in stationary combustion reporting categories (such as SNAP sectors 1, 2 or 3). A similar example arises at
Draft Not To Be Quoted
1
2
3
4
567
89
10111213141516
17181920212223

Draft Not To Be Quoted
1.A.2.g viiMobile Combustion in manufacturing industries and construction
airports, where resolving fuel used by NRMM from other stationary combustion sources can be challenging, and care must be taken to avoid double counting the mobile machinery component.
At a detailed level, the information available may be very country specific, and approaches will need to be adjusted accordingly. It is good practice to resolve the emissions from NRMM from other sources such as road vehicles and stationary combustion wherever possible. Detailed documentation is needed to explain provide the allocation of different vehicle and machinery types to emissions reporting categories.
The reciprocating engines used in this mixture of other mobile sources comprise diesel engines, four-stroke and two-stroke petrol or LPG engines:
The diesel engines range from large diesel engines > 200 kW (installed in cranes, graders/scrapers, bulldozers, etc.) to small diesel engines, around 5 kW, fitted to household and gardening equipment (e.g. lawn and garden tractors, leaf blowers, etc).
Petrol-fuelled engines are virtually all of smaller power, typically less than 10 kW, and are principally used in household and gardening equipment, with a small number being used in industry (e.g. to power fork-lift trucks or small electrical generator sets). Two-stroke petrol engines are generally smaller than four-stroke engines. The equipment used in each application is described in more detail.
LPG is used in two and four stroke petrol engines as an alternative fuel i.e. there are no significant differences in engine technology or design. The most common reason for using LPG rather than petrol is one of cost, but air quality issues can also be an important consideration.
2.3 IndustryIn order to identify the vehicles and machinery dealt with, it is helpful to provide a brief description of the types of vehicles and machinery used in industry. A summary of the engine types used by the machinery is also included below.
Asphalt pavers/concrete pavers (SNAP 080801)These wheeler crawler-type machines (road pavers, slurry seal pavers, chip spreaders, large pavement profilers, and pavement recyclers) are street finishers which use asphalt or concrete as paving material. They are equipped with three- to six-cylinder diesel engines with a power output between 15 and 160 kW. Larger engines are turbo charged.
Plate compactor/tampers/rammers (SNAP 080802)Small compaction equipment is powered by two-stroke gasoline engines having about 1 to 3 kW output; medium-size and large-size compaction equipment is equipped either with four-stroke gasoline engines or with diesel engines of 2 to 21 kW. Tampers and rammers are tools for surface treatment operated by two-stroke petrol engines of about 1–3 kW power output. Large rammers fall under ‘Other construction equipment’.
Draft Not To Be Quoted
123
45678
910
111213
1415161718
19202122
23
242526
27
28293031
32
3334353637

Draft Not To Be Quoted
1.A.2.g viiMobile Combustion in manufacturing industries and construction
Rollers (SNAP 080803)These machines (e.g. smooth drum rollers, single drum rollers, tandem rollers, padfoot rollers), used for earth compaction, are all diesel engine equipped having a power output in the range of 2 to 390 kW.
Trenchers/mini excavators (SNAP 080804)These crawler or wheel-type machines can be considered as a special type of a mini-excavator used for digging trenches. Some are equipped with special tools, e.g. cable plows. They are diesel engines equipped with a power output of 10 to 40 kW.
Excavators (wheel / crawler type) (SNAP 080805)Excavators are mainly used for earth movement and loading work. Hydraulic and cable models are covered by this category. Some have special tools like fork arms, telescopic booms, rammers, etc. Excavators can be divided into three classes. Small ones used for digging work to put pipes or cables into the earth have a power output of about 10 to 40 kW. They are equipped with two- to four-cylinder diesel engines and fall under the sub-category ‘Trenchers’. Medium-size hydraulic and dragline excavators used for general earthmoving work have a power output of about 50 to 500 kW. The engines have 4 to 12 cylinders. Many of the engines are turbo charged. Large excavators and crawler tractors used for heavy earthwork and raw material extraction start at above 500 kW. The power output can be as high as several thousand kW, having 8 to 16 cylinders. All engines are turbo charged.
Cement and mortar mixers (SNAP 080806)Small concrete mixers run on electric power or four-stroke petrol engines of about 1 to 7.5 kW power output. Larger mixers run on diesel engines having a power output of 5 to 40 kW.
Cranes (SNAP 080807)Cranes (e.g. crawler mobile cranes, carry cranes, tower cranes) are all either electricity (if they operate quasi-stationary) or diesel-engine powered, having an output of about 100 to 250 kW. Models with a special design can have a significantly higher power output. Note that tower cranes are usually driven by electrical engines and are therefore not relevant; although it may be that generators are used to provide the on-site electricity (see below).
Graders/scrapers (SNAP 080808)Graders (e.g. articulated steered or wheel-steered) are used to level surfaces. They have a power output of about 50 to 190 kW. Scrapers (e.g. wheel-steered tractor scrapers, articulated steered tractor scrapers) are used for earthwork. They have a power output of about 130–700 kW and are all diesel-engine powered.
Off-highway trucks (SNAP 080809)These are large trucks (e.g. rigid frame dumpers, wheel-steered mine dumpers, articulated-steered mine dumpers, etc.) used for heavy goods transport on construction sites and quarries (but not on public roads), e.g., to transport sand, rocks, etc. They run on diesel engines of 300 to 500 kW power output, nearly all turbo charged.
Draft Not To Be Quoted
1
234
5
678
9
10111213141516171819
20
212223
24
2526272829
30
31323334
35
36373839

Draft Not To Be Quoted
1.A.2.g viiMobile Combustion in manufacturing industries and construction
Bulldozers (SNAP 080810)This category includes wheel dozers, articulated-steered dozers, crawler dozers, crawler loaders, etc. They are mainly used for demolishing and earthmoving work and are all diesel engine equipped with a power output of about 30 to 250 kW. Large engines are turbo charged (some might have a significantly larger power output).
Tractors / loaders/backhoes (SNAP 080811)Tractors are used for general transport work. They are all diesel engine equipped with a power output of 25 to 150 kW. Loaders (e.g. wheel loaders, articulated steered wheel loaders, landfill compactors) are used for earth work or can be equipped with special tools (e.g. with brush cutters, forearms, handling operation devices, snowthawers, etc.). Crawler loaders should be treated under ‘Bulldozers’. They are all diesel engine equipped. As is the case for excavators, loaders fall into three classes: ‘Minis’ have about 15 to 40 kW and are equipped with three- or four-cylinder diesel engines, with normal aspiration; medium-size loaders have a power output between 40 to 120 kW; large loaders go up to about 250 kW. The medium and large size engines are, in general, turbo charged. Backhoes are combinations of a wheel loader and a hydraulic excavator. They run on diesel engines with a power output of about 10 to 130 kW.
Skid steer loaders (SNAP 080812)These are small wheel loaders, some with independent steering. They run on diesel engines having a power output between 15 to 60 kW.
Dumpers/tenders (SNAP 080813)Small dumpers and tenders (e.g. wheel steered site dumpers, articulated steered site dumpers, crawler dumpers, etc.) are used for transport of goods at construction sites. Most of them run with diesel engines with a power output of about 5 to 50 kW, some smaller units have four-stroke petrol engines with a power output between 5 to 10 kW.
Aerial lifts (SNAP 080814)Small aerial lifts (< 2 kW) run mainly on electrical engines, while only some on small (mainly two-stroke) petrol engines with a power output of 3 to 10 kW. Large aerial lifts and work platforms are mounted on a truck chassis and are operated by separate engines with a power output of 5 to 25 kW or by a vehicle engine utilizing a pneumatic system. As these units are often mounted on a specialist road vehicle, attention must be paid to avoid double counting with the category ‘On-road vehicles’.
Fork lifts (SNAP 080815)Forklift trucks, from small ones like pallet stacking trucks to large ones like stacking straddle carriers, are equipped with electrical or internal combustion engines. Electrical engines are mostly used for indoor material handling. The internal combustion engines run with petrol or LPG and/or diesel fuel. In general, they have a power output between 20 and 100 kW. The engine capacity is between 1.5 to 4 litres for four-stroke petrol/LPG engines and 2.5 to 6 litres for diesel engines.
Draft Not To Be Quoted
1
2345
6
789
1011121314151617
18
1920
21
22232425
26
272829303132
33
343536373839

Draft Not To Be Quoted
1.A.2.g viiMobile Combustion in manufacturing industries and construction
Generator sets (SNAP 080816)There are three main groups of generator sets used. Small ones which can be carried by one or two persons. They have an output of 0.5 to 5 kW and are powered by four-stroke engines. Some of the very small sets still run with two-stroke engines. Medium ones which can be put on small one axle/two- or four-wheel trailer. They are three- or four-cylinder diesel-engine powered and have an output of about 5 to 100 kW. Larger engines are turbo charged. Larger generator sets are actually small mobile power plants, put into a container and having a power output of 100 to about 1 000 kW. Nearly all engines are turbo charged. Generator sets above 1 000 kW are not classed as mobile machinery.
Pumps (SNAP 080817)Mobile pumps are offered with a power range between 0.5 to 70 kW. Many of the pumps in use are operated with electric engines, but those using internal combustion engines use all types of fuels except LPG. However, above about 10 kW and 20 kW power output for two and four-stroke respectively, diesel engines predominate.
Air/gas compressors (SNAP 080818)Nearly all of the small compressors used for handicraft purposes run with electric engines. Large compressors used for construction works are equipped with diesel engines with a power output between 10 and 120 kW.
Welders (SNAP 080191)Small mobile welders (< 10 kW) are typically equipped with four-stroke petrol engines, and larger units are diesel-engined going up to about 40 kW.
Refrigerating units (SNAP 080820)Diesel engines are used to operate refrigerators which are mounted on trucks and train wagons for cooling purposes. The power output of such units is in the range of 10 to 20 kW.
Other general industrial equipment (SNAP 080821)These are sweepers, scrubbers, broomers, pressure washers, slope and brush cutters, swappers, piste machines, ice rink machines, blowers, vacuums, etc. not belonging to on-road vehicles. Petrol and diesel engines are used, and engine sizes vary considerably.
Other material handling equipment (SNAP 080822)These are, for example, conveyors, tunnel locomotives, snow clearing machines, industrial tractors, pushing tractors. Diesel engines are primarily used.
Other construction equipment (SNAP 080823)Examples of mobile machinery in this category include paving and surfacing equipment, bore/drill rigs, crushing equipment, peat cutting and processing machines, concrete breakers/saws, pipe layers, etc. Mainly diesel and two-stroke gasoline engines are used.
Draft Not To Be Quoted
1
23456789
10
11121314
15
161718
19
2021
22
2324
25
262728
29
3031
32
333435

Draft Not To Be Quoted
1.A.2.g viiMobile Combustion in manufacturing industries and construction
2.4 Agriculture and forestryTwo-Wheel Tractors (SNAP 080601)
Tractors are used in agriculture (and forestry) as universal working machines. Very small single axle/two wheel tractors only have a few kW power output (about 5 to 15 kW) and are equipped with two-stroke or four-stroke petrol or with diesel engines.
Agricultural tractors (SNAP 080602)Two axle/four wheel tractors (there are also some articulated-wheel and crawler-type tractors which fall under this category) are nearly all exclusively diesel-engine powered and have a wide range of power output, between 20 and about 250 kW. The main power range used for agricultural purposes is 100 to 130 kW, and where a second tractor is used to accompany this, it is typically smaller, having a power output of 20 to 60 kW. In forestry, the same tractors are used as in agriculture, having a power range of about 60 to 120 kW. In general, over the last 30 years there has been a clear trend towards the use of higher power outputs and towards four-wheel drive tractors. Larger four- and six-cylinder diesel engines are equipped with turbo charger. However, for selected agricultural activities, small tractors are still used e.g. for vineyards, typical power outputs are 30 to 50 kW.
Harvesters/combiners (SNAP 080603)These machines are used mainly for harvesting grain (chaff, beet, etc.). They have a power output between 50 and 150 kW and all are diesel engine equipped.
Others (SNAP 080604)Agricultural equipment included in this category include: sprayers, manure distributors, mowers, balers and tillers. They are mainly diesel engines, but two- and four-stroke gasoline engines are also used in these machines. The power output is in the range of 5 to 50 kW.
Professional chain saws/clearing saws (SNAP 080701)These are chain saws for professional use; all are two-stroke petrol-engine driven with a power output of about 2 to 6 kW.
Forest tractors/harvesters/skidders (SNAP 080702)These are vehicles (e.g. wheel forwarder, crawler forwarder, grapple skidder, cable skidder, etc.) used for general transport and harvesting work in forests. They are all diesel engine equipment with a power output of about 25 to 75 kW.
Others (SNAP 080703)This heading covers machines such as tree processors, haulers, fellers, forestry cultivators, shredders and log cultivators. They are mainly diesel engine equipment; some use two-stroke engines.
2.5 Military, land basedIn Military (SNAP 080100), no detailed information is provided on the specific machinery types used. It is assumed that all equipment is diesel-engine powered.
Draft Not To Be Quoted10
1
2
345
6
789
10111213141516
17
1819
20
212223
24
2526
27
282930
31
323334
35
3637

Draft Not To Be Quoted
1.A.2.g viiMobile Combustion in manufacturing industries and construction
2.6 Household and gardeningTrimmers/strimmers/edgers/brush cutters (SNAP 080901)
This equipment is mainly two-stroke petrol engine equipped and has about 0.25 to 1.4 kW power output.
Lawn mowers (SNAP 080902)Domestic mowers are either two-stroke or four-stroke petrol-engine powered, having a power output between 0.5 and 5 kW. Ride-on mowers in the domestic sector are mainly one- or two-cylinder diesel engines and four-stroke petrol engines,. Mowers for professional use, are typically diesel or four-stroke petrol-engine powered. Ride-on mowers have a power output of about 5 to 15 kW, with, displacements between 100 and 250 ccm.
Hobby chain saws (SNAP 080903)Do-it-yourself motor saws are mainly equipped with two-stroke petrol engines (care must be taken not to include those with electric motors). Small (hobby) motor saws have a power output of about 1 to 2 kW (professionally-used motor saws of about 2 to 6 kW, cf. sector ‘Forestry’).
Snow mobiles/skidoos (SNAP 080904)Snow vehicles are generally equipped with two- and four-stroke gasoline engines with a power output of 10 to 50 kW. There has been a trend towards more powerful machines across the last two decades.
Other household and gardening equipment (SNAP 080905)Lawn and garden tractors, wood splitters, snow blowers, tillers, and similar gardening machinery is included under this category.
Other household and gardening vehicles (SNAP 080906)This category includes non-road vehicles like all-terrain vehicles such as quads, off-road motor cycles, golf carts, etc.
2.7 EmissionsThe emissions originate from the combustion of fuel in diesel compression ignition or petrol spark ignition engines to power the machinery considered. NOx, PM, CO, NMVOCs, SO2 and CO2 are all important species emitted from the fuel combustion, the latter two being estimated directly from the fuel use. The emission characteristics of diesel and petrol engines are different. When compared to petrol engines (fuel rich), diesel engines (fuel lean) produce more PM and NOx, and less CO and NMVOCs. The emissions also differ between two-stroke and four-stroke gasoline engines, and the age of the equipment (see subsection 2.4, Controls, of the present chapter).
Draft Not To Be Quoted11
1
2
34
5
6789
10
11
12131415
16
171819
20
2122
23
2425
26
27
2829303132333435

Draft Not To Be Quoted
1.A.2.g viiMobile Combustion in manufacturing industries and construction
2.8 Contribution to total emissionsAll source sectors considered in this chapter can make significant contributions to emission total of either NOx, PM10 or NMVOC. Contributions from a single source sector range from 0.1 to 11% of the total emission, but are typically less than 5% of the total emission.
Table 2-1 Contribution to total particulate matter emissions from the 2015 EMEP database (WebDab)
NFR14 Sector Data NOx PM10 NMVOC1A2gvii Mobile Combustion in manufacturing industries and construction
No. of countries reporting 17 16 17Lowest value 0% 0.0% 0.0%Typical Contribution 3% 0.4% 0.5%Highest value 7% 2.7% 0.9%
1A4aii Commercial/institutional: Mobile No. of countries reporting 6 6 6Lowest value 0% 0.0% 0.1%Typical Contribution 1% 0.0% 0.8%Highest value 2% 0.1% 2.9%
1A4bii Residential: Household and gardening (mobile)
No. of countries reporting 10 10 10Lowest value 0% 0.0% 0.1%Typical Contribution 0% 0.0% 2.0%Highest value 1% 0.2% 7.4%
1A4cii Agriculture/Forestry/Fishing: Off-road vehicles and other machinery
No. of countries reporting 19 19 19Lowest value 0% 0.0% 0.2%Typical Contribution 5% 0.5% 1.3%Highest value 11% 3.4% 3.6%
1A5b Other, Mobile (including military, land based and recreational boats)
No. of countries reporting 12 11 12Lowest value 0% 0.0% 0.0%Typical Contribution 1% 0.1% 0.5%Highest value 1% 0.3% 5.0%
The “No. of countries reporting” is defined here as those reporting both the sector emission and a total emission.
In total, and looking at the pollutants covered by the United Nations Economic Commission for Europe (UNECE) protocols only, it can be assumed that the sectors covered by this chapter contribute significantly to total NOx, PM10 and VOC emissions in most countries.
An indication of groups of major sub-sources, at least for Western European countries, can currently be obtained by analyzing the Environmental Protection Agency (EPA) data. Table 2-2 shows a first broad evaluation.
Draft Not To Be Quoted12
1
234
56
78
91011
121314

Draft Not To Be Quoted
1.A.2.g viiMobile Combustion in manufacturing industries and construction
Table 2-2 Contribution of ‘off-road’ machinery to total emission [in percent], as estimated by US-EPA for different non-attainment areas
Pollutant VOC NOx CO PM
Total over all areas1) 10.9 15.9 7.3 1.4
Total by areas 4–19 8–29 3–14 0.3–5.2
by category
Agriculture 0.1–1.2 0.5–11 0.02–0.6 0.02–0.8
Airport service 0–0.25 0–3.5 0–0.8 0–0.2
Recreational marine 0–6.5 0–1.5 0–0.8 0–0.3
Construction 0.5–1.8 3–23 0.2–1.8 0.1–2.1
Industry 0.1–0.8 0.3–3.0 0.3–2.9 0.02–0.4
Lawn and garden 1.9–10.5 0.1–0.5 0.02–4.5 0.02–0.2
Light commercial 0.3–2.3 0.1–0.5 1.0–7.5 0.01–0.15
Forestry 0.02–0.16 0–0.1 0.02–0.35 0–0.3
Recreation 0.2–2.1 0–0.1 0.2–3.9 0–0.1
Note1) Average of two different industries.
In the light of these results, the following sectors/sub-sectors seem of greatest importance for the different pollutants:
for VOC: recreational marine (part of ‘inland waterways’)
lawn and garden (part of ‘household and gardening’)
for NOx: agriculture
construction (part of ‘industry’)
for CO: light commercial (part of ‘industry’)
lawn and garden (part of ‘household and gardening’)
for PM: construction (part of ‘industry’)
This means that data collection for forestry and recreation (SNAP activity 080105 ‘Household and gardening’) are of lower relevance for these pollutants. However, these sectors are of some relevance for emissions of heavy metals, in particular lead, due to the consumption of gasoline (see Table 2-4). In any case, this assessment does not need to be true for all European countries.
When comparing emissions of PM10 to those of the more physiologically toxic PM2.5, whilst the general patterns of importance remain, the significance of PM2.5 from off-road machinery to the total emissions is higher than for total PM10. This is because internal combustion
Draft Not To Be Quoted13
12
34
56
7
8
9
10
11
12
13
14
1516171819
202122

Draft Not To Be Quoted
1.A.2.g viiMobile Combustion in manufacturing industries and construction
engines produce PM with a much smaller mean size than, for example, many industrial processes.
2.9 ControlsGaseous emissions can be controlled by two mechanisms: control of the combustion technology which can be combined with exhaust gas treatment and control of the fuel quality. Both these measures are used for non-road mobile machinery (NRMM).
A number of technical control technologies are available, including exhaust gas recirculation (EGR) and selective catalytic reduction (SCR) to control NOx emissions, and diesel particulate filters (DPF) to control PM emissions. These technologies are better developed for the diesel engines used in road transport (particularly powering heavy-duty vehicles) and are currently only rarely used in conjunction with NRMM.
Within Europe emissions from NRMM are regulated by the non-road mobile machinery directives. The emission directives list specific emission limit values (g/kWh) for CO, VOC, NOx (or VOC + NOx) and TSP, depending on engine size (kW for diesel, ccm and kW for gasoline) and date of implementation (referring to engine market date). Stage V legislation, currently being finalised, includes further reductions of emission limits, and also introduces emission limits for particle numbers, to control emissions of ultrafine particulates.
For diesel, Directives 97/68/EC and 2004/26/EC relate to non-road machinery other than agricultural and forestry tractors and the directives have different implementation dates for machinery operating under transient and constant loads. The latter directive also comprises emission limits for railway machinery. For tractors the relevant directives are 2000/25 and 2005/13. For gasoline, Directive 2002/88/EC distinguishes between hand-held (SH) and non hand-held (NS) types of machinery. Proposed Stage V emission limits include a wider range of machinery types, and in particular machinery at the low and high ends of the power rating range.
In recent years there has been a recognition that testing emission performance by using portable emission measurement systems provides an improved assessment of real-world emissions. The Stage V documentation, refers to the future adoption of such a testing methodology.
Draft Not To Be Quoted14
12
3
4
567
89
101112
131415161718
1920212223242526
27282930

Draft Not To Be Quoted
1.A.2.g viiMobile Combustion in manufacturing industries and construction
Table 2-3 Overview of EU emission directives relevant for diesel-fuelled non-road machinery
Stage/engine NOx VOC+NOx VOC CO PM Diesel machinery Tractors
size [kW] Implement. date EU Implement.
[g/kWh] EU Directive Transient Constant Directive date
Stage I
130<=P< 560 9.2 - 1.3 5.0 0.54 97/68 1/1 1999 - 2000/25 1/7 2001
75<=P< 130 9.2 - 1.3 5.0 0.7 1/1 1999 - 1/7 2001
37<=P< 75 9.2 - 1.3 5.06.5 0.540.85
1/4 1999 - 1/7 2001
Stage II
130<=P< 560 6 - 1 3.5 0.2 97/68 1/1 2002 1/1 2007 2000/25 1/7 2002
75<=P< 130 6 - 1 5 0.3 1/1 2003 1/1 2007 1/7 2003
37<=P< 75 7 - 1.3 5 0.4 1/1 2004 1/1 2007 1/1 2004
18<=P< 37 8 - 1.5 5.5 0.8 1/1 2001 1/1 2007 1/1 2002
Stage IIIA
130<=P< 560 - 4 - 3.5 0.2 2004/26 1/1 2006 1/1 2011 2005/13 1/1 2006
75<=P< 130 - 4 - 5 0.3 1/1 2007 1/1 2011 1/1 2007
37<=P< 75 - 4.7 - 5 0.4 1/1 2008 1/1 2012 1/1 2008
19<=P< 37 - 7.5 - 5.5 0.6 1/1 2007 1/1 2011 1/1 2007
Stage IIIB
130<=P< 560 2 - 0.19 3.5 0.025 2004/26 1/1 2011 - 2005/13 1/1 2011
75<=P< 130 3.3 - 0.19 5 0.025 1/1 2012 - 1/1 2012
56<=P< 75 3.3 - 0.19 5 0.025 1/1 2012 - 1/1 2012
37<=P< 56 - 4.7 - 5 0.025 1/1 2013 - 1/1 2013
Stage IV
130<=P< 560 0.4 - 0.19 3.5 0.025 2004/26 1/1 2014 2005/13 1/1 2014
56<=P< 130 0.4 - 0.19 5 0.025 1/10 2014 1/10 2014
Stage V A
P< 560 Generators
0.67 0.19 3.5 0.035 B 2019B
P< 560 3.5 0.19 3.5 0.045 B 2019B
130<=P< 560 0.4 0.19 3.5 0.015 2019B
56<=P< 130 0.4 0.19 5 0.015 2020B
37<=P< 56 - 4.7 5 0.015 2019B
19<=P< 37 - 4.7 5 0.015 2019B
8<=P< 19 - 7.5 6.6 0.4 2019B
0<=P< 8 - 7.5 8 0.4 2019B
A = For selected machinery types, Stage V includes emission limit values for particle number.B = Stage V legislation has not yet been finalised, therefore whilst implementation dates have been proposed, they have not been finalised.
Draft Not To Be Quoted15
1

Draft Not To Be Quoted
1.A.2.g viiMobile Combustion in manufacturing industries and construction
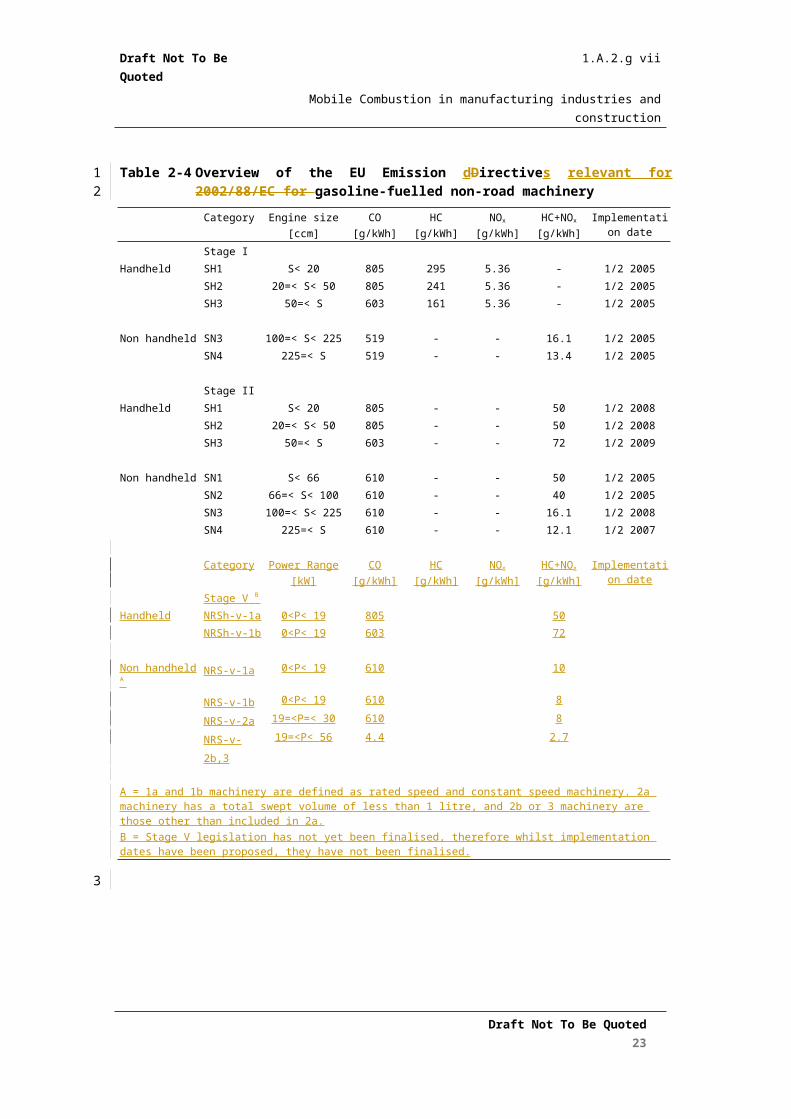
Table 2-4 Overview of the EU Emission dDirectives relevant for 2002/88/EC for gasoline-fuelled non-road machinery
Category Engine size[ccm]
CO[g/kWh]
HC[g/kWh]
NOx
[g/kWh]HC+NOx
[g/kWh]Implementation
date
Stage I
Handheld SH1 S< 20 805 295 5.36 - 1/2 2005
SH2 20=< S< 50 805 241 5.36 - 1/2 2005
SH3 50=< S 603 161 5.36 - 1/2 2005
Non handheld SN3 100=< S< 225 519 - - 16.1 1/2 2005
SN4 225=< S 519 - - 13.4 1/2 2005
Stage II
Handheld SH1 S< 20 805 - - 50 1/2 2008
SH2 20=< S< 50 805 - - 50 1/2 2008
SH3 50=< S 603 - - 72 1/2 2009
Non handheld SN1 S< 66 610 - - 50 1/2 2005
SN2 66=< S< 100 610 - - 40 1/2 2005
SN3 100=< S< 225 610 - - 16.1 1/2 2008
SN4 225=< S 610 - - 12.1 1/2 2007
Category Power Range[kW]
CO[g/kWh]
HC[g/kWh]
NOx
[g/kWh]HC+NOx
[g/kWh]Implementation
date
Stage V B
Handheld NRSh-v-1a 0<P< 19 805 50
NRSh-v-1b 0<P< 19 603 72
Non handheld A NRS-v-1a 0<P< 19 610 10
NRS-v-1b 0<P< 19 610 8
NRS-v-2a 19=<P=< 30 610 8
NRS-v-2b,3 19=<P< 56 4.4 2.7
A = 1a and 1b machinery are defined as rated speed and constant speed machinery. 2a machinery has a total swept volume of less than 1 litre, and 2b or 3 machinery are those other than included in 2a.B = Stage V legislation has not yet been finalised, therefore whilst implementation dates have been proposed, they have not been finalised.
2.10 Portable Emissions Measurement Systems (PEMS)Portable Emissions Measurement Systems (PEMS), measure emissions from combustion engines as the vehicle or the equipment is being used, which allows real-world in-use testing.
PEMS technologies have developed to provide a complete and very accurate real-time monitoring of a range of pollutants emitted by combustion engines (e.g. HC, CO, CO2, NOx
Draft Not To Be Quoted16
12
3
4
56789

Draft Not To Be Quoted
1.A.2.g viiMobile Combustion in manufacturing industries and construction
and a range of particle metrics), and systems can also record a range of associated engine, vehicle and ambient parameters. To achieve this, PEMS used for emissions regulatory purposes integrate advanced gas analysers, exhaust mass flow meters, weather station, Global Positioning System (GPS) and connection to the vehicle networks.1
Since this technique is able to measure emissions directly whilst machinery is operating under real-world conditions, it is considered that it leads to the more accurate determination of EFs. PEMS therefore offer an important alternative approach to the laboratory-based emissions measurement techniques in assessing emissions from different types of combustion engines. This is an important consideration, because it has become evident that some engine types and emission control technologies used for road vehicles perform very differently in the real-world compared to laboratory conditions. There is concern that similar issues may arise with the engines used for NRMM, and in particular that future emission limits might be found to be overly optimistic.
To address this concern, in-use emissions testing with PEMS has become one of the key elements of the European emissions legislation. The first ‘official’ step was the publication of the procedures to verify the conformity of gaseous emissions from heavy-duty engines, under the Commission Regulations (EU) 582/20112 and (EU) 64/20123. To adapt these procedures to Non-Road Mobile Machinery (NRMM), a pilot program was launched and will address the specificities for testing and data evaluation. It will also stimulate the dissemination of know-how and the development of good practices4. PEMs are already included in the Proposal for a Regulation of the European Parliament and of the Council on requirements relating to emission limits and type-approval for internal combustion engines for non-road mobile machinery (/* COM/2014/0581 final - 2014/0268 (COD) */)5.
However, there is not yet an extensive emissions measurement-base from a wide range of mobile machinery using PEMS. Measurements are needed to gain a better understanding of both current mobile machinery, and the emissions performance of machinery that will be put into the market in future years.
1 http://iet.jrc.ec.europa.eu/pems/portable-emissions-measurement-systems-pems
2 Commission Regulation (EU) No. 64/2012 amending Regulation (EU) No 582/2011 implementing and amending Regulation (EC) No 595/2009 of the European Parliament and of the Council with respect to emissions from heavy duty vehicles (Euro VI) http://eur-lex.europa.eu/LexUriServ/LexUriServ.do?uri=OJ:L:2012:028:0001:0023:EN:PDF 3 Commission Regulation (EU) No. 582/2011 of 25 May 2011 implementing and amending Regulation (EC) No 595/2009 of the European Parliament and of the Council with respect to emissions from heavy duty vehicles (Euro VI) and amending Annexes I and III to Directive 2007/46/EC of the European Parliament and of the Council. EC – European Commission. Official Journal of the European Union L 167, pp. 1-168. http://eur-lex.europa.eu/LexUriServ/LexUriServ.do?uri=OJ:L:2011:167:0001:0168:en:PDF 4 http://iet.jrc.ec.europa.eu/pems/pems-non-road-mobile-machinery-nrmm-engines
5 http://eur-lex.europa.eu/resource.html?uri=cellar:60e6a946-44c6-11e4-a0cb-01aa75ed71a1.0023.01/DOC_1&format=PDF
Draft Not To Be Quoted17
123456789
1011121314
15161718192021222324
25262728
29
123456789
101112131415
Draft Not To Be Quoted
1.A.2.g viiMobile Combustion in manufacturing industries and construction
3 Methods
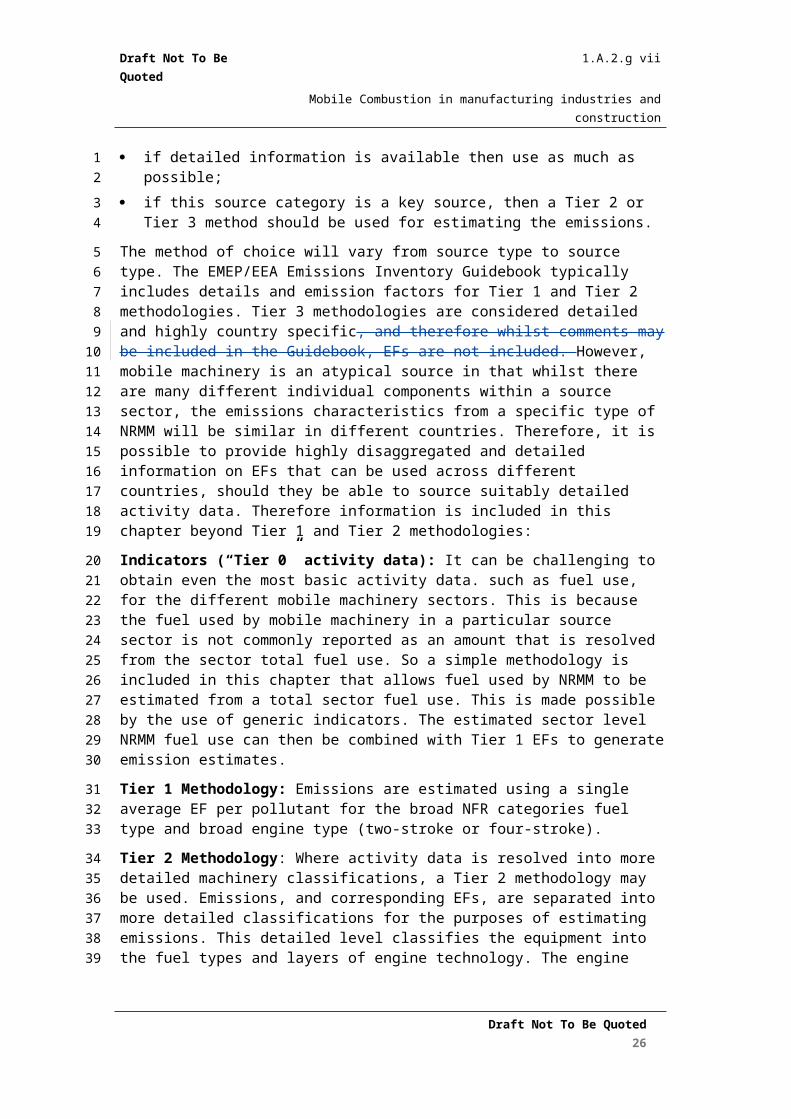
3.1 Choice of method presents the procedure for selecting the appropriate methods for estimating the emissions from NRMM. This decision tree is applicable to all nations. The basic concepts are:
if detailed information is available then use as much as possible;
if this source category is a key source, then a Tier 2 or Tier 3 method should be used for estimating the emissions.
The method of choice will vary from source type to source type. The EMEP/EEA Emissions Inventory Guidebook typically includes details and emission factors for Tier 1 and Tier 2 methodologies. Tier 3 methodologies are considered detailed and highly country specific, and therefore whilst comments may be included in the Guidebook, EFs are not included. However, mobile machinery is an atypical source in that whilst there are many different individual components within a source sector, the emissions characteristics from a specific type of NRMM will be similar in different countries. Therefore, it is possible to provide highly disaggregated and detailed information on EFs that can be used across different countries, should they be able to source suitably detailed activity data. Therefore information is included in this chapter beyond Tier 1 and Tier 2 methodologies:
Indicators (“Tier 0” activity data): It can be challenging to obtain even the most basic activity data. such as fuel use, for the different mobile machinery sectors. This is because the fuel used by mobile machinery in a particular source sector is not commonly reported as an amount that is resolved from the sector total fuel use. So a simple methodology is included in this chapter that allows fuel used by NRMM to be estimated from a total sector fuel use. This is made possible by the use of generic indicators. The estimated sector level NRMM fuel use can then be combined with Tier 1 EFs to generate emission estimates.
Tier 1 Methodology: Emissions are estimated using a single average EF per pollutant for the broad NFR categories fuel type and broad engine type (two-stroke or four-stroke).
Tier 2 Methodology: Where activity data is resolved into more detailed machinery classifications, a Tier 2 methodology may be used. Emissions, and corresponding EFs, are separated into more detailed classifications for the purposes of estimating emissions. This detailed level classifies the equipment into the fuel types and layers of engine technology. The engine technology layers are stratified according to the EU emission legislation stages, and three additional layers are added to cover the emissions from engines prior to the first EU legislation stages.
Tier 3 Methodology: The NRMM is disaggregated to the equipment level, including specific operational data and size of engine. Rather than providing EFs in terms of emissions per unit of fuel consumed, the hours of operation are required and the EFs are presented as emission emissions per kW hour. Legislation relating to Stage V emission limits have not yet been finalised, but expect EFs and the years of introduction have been included.
Draft Not To Be Quoted18
1
2
34
5
67
89
1011121314151617
18192021222324
2526
27282930313233
3435363738

Draft Not To Be Quoted
1.A.2.g viiMobile Combustion in manufacturing industries and construction
Several methods to calculate emissions can be foreseen. In all cases, emission estimates will need to be based on a mixture of some factual data and a large number of assumptions. It is therefore important to define a method to be used for the estimation which builds upon as much data as can be obtained, hence reducing the number and impact of assumptions. It is likely that the methodology will vary from NRMM category to category.
It is acknowledged that for these NFR codes there may be difficulties with activity data because of the number and diversity of the equipment types, locations and usage patterns associated with the different types of machinery. Furthermore, statistical data on fuel consumption by off-road vehicles are often not collected and published. For this reason methodologies have been included that allow a basic estimate of fuel used to be estimated. However, where information is available, it is particularly important to use higher Tier methods, because emissions from NRMM are more dependent on technology and operating conditions than the emissions from e.g. road transport (the other principal consumer of the diesel and gasoline fuels).
Draft Not To Be Quoted19
12345
6789
1011121314
15

Draft Not To Be Quoted
1.A.2.g viiMobile Combustion in manufacturing industries and construction
Figure 3-2 Decision tree for other off-road mobile machinery
Draft Not To Be Quoted20
Use Tier2 EFs for different equipment types for each fuel
type, and equipment category
Start
Are data available on fuel use for different
equipment types?
Are data available at an
equipment level?
Is this akey source?
Is fueluse data available
at the category level?
Yes
No
No
No
No
Use Tier3 EFs for detailed equipment and AD (e.g. using
vehicle models)
Yes
Yes
Yes
Collect data on fuel usage for different
equipment types for each fuel type, and equipment category
Apply Tier 1 default EFs
Use indicators to generate estimates
of category level fuel use data
1
2

Draft Not To Be Quoted
1.A.2.g viiMobile Combustion in manufacturing industries and construction
3.2 Tier 1 default approach
3.2.1 Algorithm
For the Tier 1 approach emissions are estimated using the total fuel consumed in each of the source categories covered in this chapter. For each source category the algorithm is:
Epollutant= ∑fuel typeFC fuel type×EFpollutant , fuel type (1)
Where:
Epollutant = the emission of the specified pollutant,
FCfuel type = the fuel consumption for each fuel (diesel, LPG, four-stroke gasoline and two-stroke gasoline) for the source category,
EFpollutant = the emission factor for this pollutant for each fuel type.
This equation is applied at the national level, using annual national fuel consumption for the off-road source categories included in this chapter.
Emission factors are provided for each type of fuel for each off-road source category.
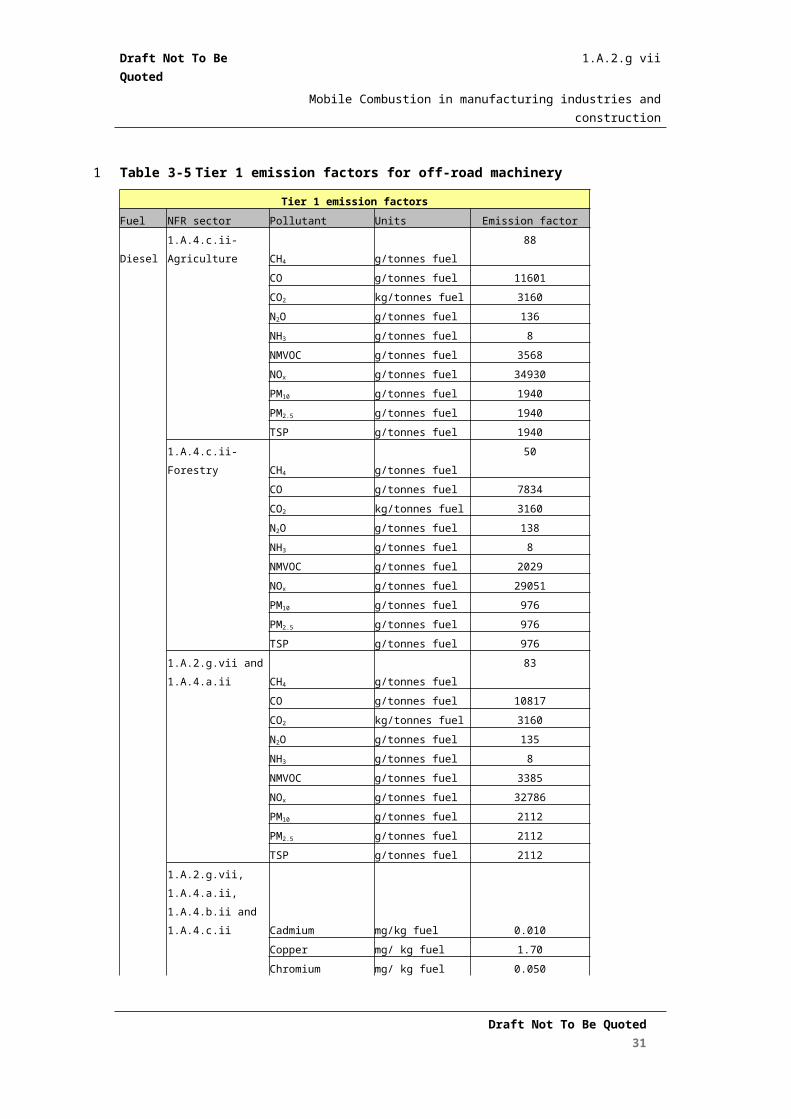
3.2.2 Default emission factorsTable 3-5 presents the emission factors for Tier 1. The Tier 1 emission factors are based on data from the Danish Inventory; Winther (2015a) with heavy metals and POPs taken from EMEP/EEA Emissions Inventory Guidebook (2006). The approach for deriving the Tier 1 and 2 emission factors for this Guidebook is outlined in Appendix C, and draws on detailed information on EFs for NRMM from the TREMOD model, combined with fleet data from the Danish emissions inventory (Winther 2015b). Updates from the previous version of the Guidebook relate to the inclusion of new Stage IIIB and IV diesel engine emission technology stages which have entered into the fleet between 2011-2013 and 2014-2015, respectively. Updated data (EFs and load factors) are also included for the technologies up to Stage IIIA.
For some pollutants (heavy metals, SO2 and CO2,) the emission factors are independent of the equipment technology, i.e. are simply fuel derived. For the various size fractions of particulate matter and emissions of POPs, whilst these emission factors do vary with equipment technology, they can be taken as a constant proportion of the PM10 or NMVOC emissions. Hence the key species, which do vary with differing equipment technologies, are PM10, NOx, NMVOC and CO.
Draft Not To Be Quoted21
1
2
34
5
6
7
89
10
1112
13
14
151617181920212223
24
252627282930

Draft Not To Be Quoted
1.A.2.g viiMobile Combustion in manufacturing industries and construction
Table 3-5 Tier 1 emission factors for off-road machinery
Tier 1 emission factors
Fuel NFR sector Pollutant Units Emission factor
Diesel 1.A.4.c.ii-Agriculture CH4 g/tonnes fuel 88
CO g/tonnes fuel 11601
CO2 kg/tonnes fuel 3160
N2O g/tonnes fuel 136
NH3 g/tonnes fuel 8
NMVOC g/tonnes fuel 3568
NOx g/tonnes fuel 34930
PM10 g/tonnes fuel 1940
PM2.5 g/tonnes fuel 1940
TSP g/tonnes fuel 1940
1.A.4.c.ii-Forestry CH4 g/tonnes fuel 50
CO g/tonnes fuel 7834
CO2 kg/tonnes fuel 3160
N2O g/tonnes fuel 138
NH3 g/tonnes fuel 8
NMVOC g/tonnes fuel 2029
NOx g/tonnes fuel 29051
PM10 g/tonnes fuel 976
PM2.5 g/tonnes fuel 976
TSP g/tonnes fuel 976
1.A.2.g.vii and 1.A.4.a.iiCH4 g/tonnes fuel 83
CO g/tonnes fuel 10817
CO2 kg/tonnes fuel 3160
N2O g/tonnes fuel 135
NH3 g/tonnes fuel 8
NMVOC g/tonnes fuel 3385
NOx g/tonnes fuel 32786
PM10 g/tonnes fuel 2112
PM2.5 g/tonnes fuel 2112
TSP g/tonnes fuel 2112
1.A.2.g.vii, 1.A.4.a.ii,
1.A.4.b.ii and 1.A.4.c.ii Cadmium mg/kg fuel 0.010
Copper mg/ kg fuel 1.70
Chromium mg/ kg fuel 0.050
Nickel mg/ kg fuel 0.07
Selenium mg/ kg fuel 0.01
Zinc mg/ kg fuel 1.00
Benz(a)anthracene µg/kg fuel 80
Benzo(b)fluoranthene µg/kg fuel 50
Draft Not To Be Quoted22
1
Draft Not To Be Quoted
1.A.2.g viiMobile Combustion in manufacturing industries and construction
Tier 1 emission factors
Fuel NFR sector Pollutant Units Emission factor
Dibenzo(a,h)anthraceneµg/kg fuel 10
Benzo(a)pyrene µg/kg fuel 30
Chrysene µg/kg fuel 200
Fluoranthene µg/kg fuel 450
Phenanthene µg/kg fuel 2500
LPG
1.A.2.g.vii, 1.A.4.a.ii,
1.A.4.b.ii and 1.A.4.c.ii CH4 g/tonnes fuel 354
CO g/tonnes fuel 4823
CO2 kg/tonnes fuel 2990
N2O g/tonnes fuel 161
NH3 g/tonnes fuel 10
NMVOC g/tonnes fuel 6720
NOx g/tonnes fuel 61093
PM10 g/tonnes fuel 225
PM2.5 g/tonnes fuel 225
TSP g/tonnes fuel 225
Gasoline:
four-
stroke
1.A.2.g.vii, 1.A.4.a.ii,
1.A.4.b.ii and 1.A.4.c.ii CH4 g/tonnes fuel
1956
CO g/tonnes fuel 770368
CO2 kg/tonnes fuel 3197
N2O g/tonnes fuel 59
NH3 g/tonnes fuel 4
NMVOC g/tonnes fuel 17602
NOx g/tonnes fuel 7117
PM10 g/tonnes fuel 157
PM2.5 g/tonnes fuel 157
TSP g/tonnes fuel 157
Gasoline:
two-
stroke
1.A.2.g.vii, 1.A.4.a.ii,
1.A.4.b.ii and 1.A.4.c.ii CH4 g/tonnes fuel
2200
CO g/tonnes fuel 620793
CO2 kg/tonnes fuel 3197
N2O g/tonnes fuel 17
NH3 g/tonnes fuel 3
NMVOC g/tonnes fuel 242197
NOx g/tonnes fuel 2765
PM10 g/tonnes fuel 3762
PM2.5 g/tonnes fuel 3762
TSP g/tonnes fuel 3762
Draft Not To Be Quoted23

Draft Not To Be Quoted
1.A.2.g viiMobile Combustion in manufacturing industries and construction
Gasoline
1.A.2.g.vii, 1.A.4.a.ii,
1.A.4.b.ii and 1.A.4.c.ii Cadmium mg/kg fuel 0.01
Copper mg/kg fuel 1.70
Chromium mg/kg fuel 0.05
Nickel mg/kg fuel 0.07
Selenium mg/kg fuel 0.01
Zinc mg/kg fuel 1.00
Benz(a)anthracene µg/kg fuel 75
Benzo(b)fluoranthene µg/kg fuel 40
Dibenzo(a,h)anthraceneµg/kg fuel 10
Benzo(a)pyrene µg/kg fuel 40
Chrysene µg/kg fuel 150
Fluoranthene µg/kg fuel 450
Phenanthene µg/kg fuel 1200
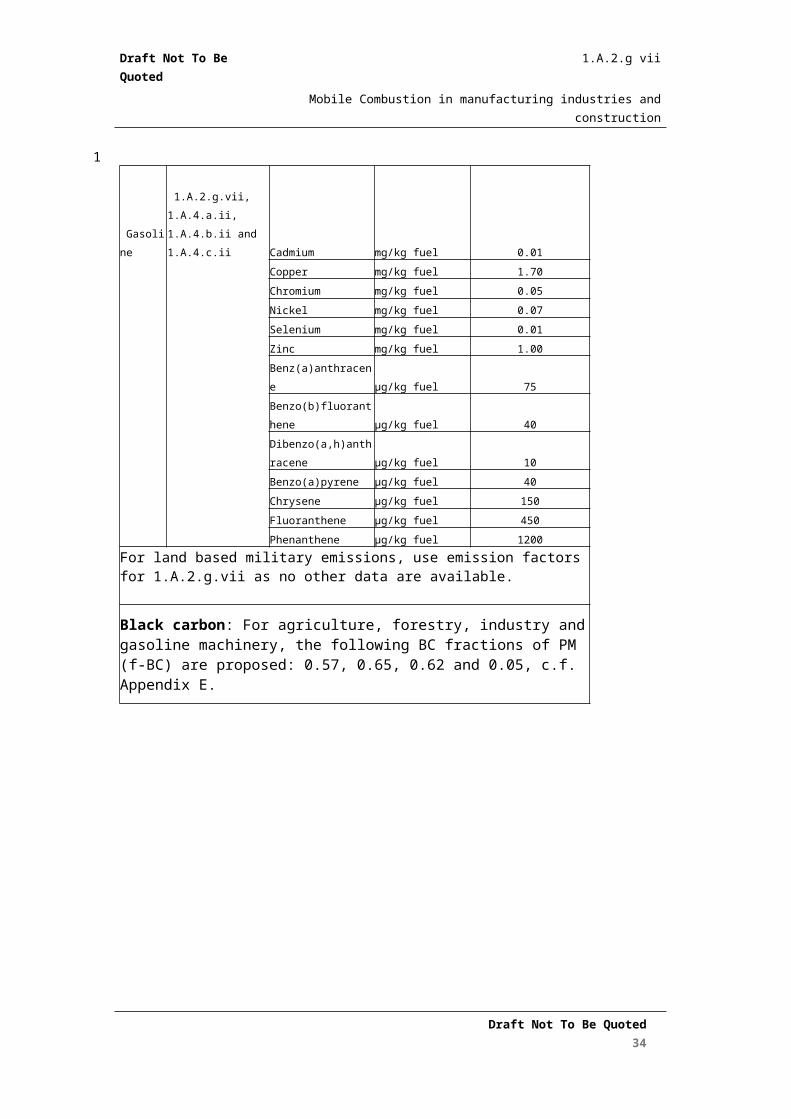
For land based military emissions, use emission factors for 1.A.2.g.vii as no other data are available.
Black carbon: For agriculture, forestry, industry and gasoline machinery, the following BC fractions of PM (f-BC) are proposed: 0.57, 0.65, 0.62 and 0.05, c.f. Appendix E.
SO2: The emissions of SO2 are estimated by assuming that all sulphur in the fuel is transformed completely into SO2 using the formula:
ESO2 = 2 kS,l bj,l j l
where
kS,l = weight related sulphur content of fuel of type l [kg/kg],bj,l = total annual consumption of fuel of type l in [kg] by source
category j.
For the actual figure of bj,l the statistical fuel consumption should be taken, if available.
PM: These PM factors represent total PM emissions (filterable and condensable fractions)
Draft Not To Be Quoted24
1

Draft Not To Be Quoted
1.A.2.g viiMobile Combustion in manufacturing industries and construction
Lead: Emissions of lead are estimated by assuming that 75 % of lead contained in the fuel is emitted into air. The formula used is:
EPb = 0.75 kPb,l bj,l j l
where
kPb,l = weight-related lead content of fuel of type l in [kg/kg].
Since the simple methodology outlined above averages over different types of engines, using different types of fuels, it can provide only broad estimates at best.
3.2.3 Activity data
Activity data should be collected from national statistics. Where there is no explicit off-road machinery consumption statistics, it is good practice to use sample, survey or industry data to define an appropriate split for mobile and stationary combustion. Where no other data are available, it should be assumed that all gasoline and diesel-fuel consumption for the NFR categories in this chapter is for off-road machinery.
Generating Estimates of Fuel Used by NRMM
There may be occasions where no fuel data are available for NRMM categories, typically because the national fuel consumption data are not split into detailed enough categories to identify the fuel used by NRMM in different sectors of the inventory. Under these circumstances it is possible to report the emissions as “included elsewhere” (i.e. included in the corresponding stationary source categories e.g. 1A2a-f Stationary combustion in manufacturing industries and construction). However, estimates of fuel used by NRMM in the different categories can be made by using the methods outlined below.
Dore et al (2015) undertook an assessment of the NRMM fuel use data reported by Parties under the CLRTAP (1990 – 2013 emission inventory submissions). The purpose of the assessment was to determine whether it was possible to generate relationships between the NRMM fuel use and other readily available data, to create “indicators”.
Fuel use data was compiled from Parties including this in their national submissions for NRMM categories, and also IIRs which provided an adequate explanation of the approaches taken. Two metrics ere compared with commonly available datasets – the amount of liquid fuels consumed and the liquid fuels consumed as a fraction of the total (mobile and stationary components). The latter metric proved to be more challenging because changes to the stationary component that were independent of the fuel used by mobile machinery complicated the results.
In some cases it was possible to determine a strong relationship between fuel used in NRMM and a commonly available dataset (such as GVA). In other cases it was possible to derive an estimate for the fraction of total sector level fuel used in mobile machinery.
Draft Not To Be Quoted25
12
3
45678
9
10111213141516
17181920
21222324252627
282930
31
Draft Not To Be Quoted
1.A.2.g viiMobile Combustion in manufacturing industries and construction
1.A.2.g vii Mobile Combustion in manufacturing industries and constructionFrom the national datasets assessed, is has been possible to generate a relationship between the liquid fuel used in NRMM and GVA for manufacturing and construction. The follow linear relationship was determined:
F liquid= 0 .49×GVA
Where:Fliquid is the amount of liquid fuel used for NRMM in manufacturing and construction (TJ)GVA is the gross value added for manufacturing and construction (million Euros current value)
However, it should be noted that this represents an upper limit for the liquid fuel use (i.e. it is conservative with regards to determining emissions), and there is significant uncertainty associated with this relationship. Data from some national inventories suggest significantly less fuel used per unit of GVA (see Appendix D). The differences between national datasets are thought to be an artefact caused by different methodologies used to estimate the fuel used for NRMM. However, after reviewing the methodologies reported in IIRs, it has not been possible to explain the differences that arise.
So, whilst the relationship above does allow fuel use, and hence emissions, to be better resolved into the mobile and stationary components of manufacturing and construction, it should be used with caution.Details of this analysis are included in Appendix D.
1.A.4.b ii Residential: Household and gardening (mobile)It was not possible to determine a strong and consistent relationship between the fuel used for NRMM in the residential sector with commonly available datasets. However, as a first approximation, it can be assumed that 1-2% of the total liquid fuel used in the domestic sector is used for NRMM.It should be noted that Sweden and Norway are clear outliers from this relationship, with higher and very variable fractions of the fuel used for NRMM (~ 5-10%). However this is strongly influenced by significant changes to the liquid fuel consumption in the residential sector as a whole (i.e. for stationary combustion), rather than the fuel consumed by NRMM
Details of this analysis are included in Appendix D.
1.A.4.c ii Agriculture/Forestry/Fishing: Off-road vehicles & other machineryFrom the data assessed, there is a strong relationship between the liquid fuel used in NRMM and GVA for agriculture/forestry/fishing (obtained from Eurostat). The follow linear relationship was determined (R2 of 0.95):
F liquid= 3 . 4×GVA
Where:Fliquid is the amount of liquid fuel used for NRMM in agriculture forestry and fishing (TJ)GVA is the gross value added for agriculture forestry and fishing (million Euros current value)
Draft Not To Be Quoted26
12345
6789
101112131415161718192021222324252627282930313233343536373839404142
434445464748

Draft Not To Be Quoted
1.A.2.g viiMobile Combustion in manufacturing industries and construction
It can be assumed that the fuel used is entirely diesel oil.
A strong relationship was also found between the fuel used for mobile machinery and agricultural land cover, but this was not used because GVA data is more readily available.The relationships between fuel used and agricultural products showed a bimodal distribution, which was assumed to be due to the variable extent to which forestry is important compared to arable or livestock farming in different countries.Details of this analysis are included in Appendix D.
Other NRMM CategoriesEfforts were made to investigate relationships for other NRMM categories. But it was not possible to determine any useable relationships or indicators for:
1.A.4.a.ii Commercial/institutional: Mobile 1.A.4.c iii National fishing 1.A.5.b Other, Mobile (inc. military, land based and recreational boats)
This was primarily because there was a lack of data detailed sector level data reported on fuel used in these categories by Parties to the CLRTAP. But, in addition, but also relationships with e.g. GVA were found to be not as strong as for other NRMM source categories.
3.3 Tier 2 technology-dependent approach
3.3.1 Algorithm
The generic algorithm for calculating emissions for each category (industry, agriculture and forestry, military land-based and household and gardening) using the Tier 2 methodology is:
Ei = ∑j∑
tFCj,t× EFi,j,t
where:
Ei = mass of emissions of pollutant i during the inventory period,
FCj,t = fuel consumption of fuel type j by equipment category c and of technology type t,
EFi,j = average emission factor for pollutant i for fuel type j for equipment category c and of technology type t,
i = pollutant type,
j = fuel type (diesel, four-stroke gasoline, LPG and two-stroke gasoline),
t = off-road equipment technology: < 1981, 1981–1990, 1991–Stage I, Stage I, Stage II, Stage IIIA).
Draft Not To Be Quoted27
123456789
10111213141516
171819
20
21
2223
24
25
26
2728
2930
31
32
3334
35

Draft Not To Be Quoted
1.A.2.g viiMobile Combustion in manufacturing industries and construction
In essence this involves sub-dividing the fuel consumption of fuel type j used by the NFR sectors into the different technology types such that the summation in the Tier 2 algorithm is equal to the single term in the Tier 1 algorithm, i.e.
∑t
FC j,t = FC j
3.3.2 Emission factors
Table 3-6 presents the emission factors for Tier 2. These are based on detailed information on EFs for NRMM from the TREMOD model, combined with fleet data from the Danish emissions inventory (Winther 2015b). Updates from the previous version of the Guidebook relate to the inclusion of new Stage IIIB and IV diesel engine emission technology stages which have entered into the fleet between 2011-2013 and 2014-2015, respectively. Updated data (EFs and load factors) are also included for the technologies up to Stage IIIA. The approach for deriving the Tier 2 EFs is outlined in Appendix C.
For heavy metals and POPs, the emission factors for Tier 1 must be used (Table 3–1). The emission factors are grouped according to the EU emission legislation stages, and three additional layers are added to cover the emissions from engines prior to the first EU legislation stages.
For some pollutants (heavy metals, SO2 and CO2,) the emission factors are independent of the equipment technology, i.e. are simply fuel derived. The key species, which do vary with differing equipment technologies, are particulate matter, NOx, NMVOC and CO.
Table 3-6 Tier 2 emission factors for off-road machinery
Tier 2 emission factors
Technology
Fuel NFR Sector Pollutant Units < 1981 1981-1990 1991-Stage I Stage I Stage II Stage IIIA Stage IIIB Stage IV
Diesel 1.A.4.c.ii: CH4 g/tonnes fuel 191 158 105 43 29 29 13 13
Agriculture CO g/tonnes fuel 19804 17566 13797 6694 6104 6035 6000 6000
CO2 kg/tonnes fuel 3160 3160 3160 3160 3160 3160 3160 3160
N2O g/tonnes fuel 122 129 137 137 138 139 140 140
NH3 g/tonnes fuel 7 7 8 8 8 8 8 8
NMVOC g/tonnes fuel 7760 6439 4278 1730 1181 1173 519 519
NOx g/tonnes fuel 29901 37383 48648 30999 20612 12921 7200 1600
PM10 g/tonnes fuel 5861 4047 1942 1020 624 550 100 100
PM2.5 g/tonnes fuel 5861 4047 1942 1020 624 550 100 100
TSP g/tonnes fuel 5861 4047 1942 1020 624 550 100 100
1.A.4.c.ii: Forestry CH4 g/tonnes fuel 183 143 109 36 29 29 13 13
CO g/tonnes fuel 19014 16045 13553 5899 5940 5947 6000 6000
CO2 kg/tonnes fuel 3160 3160 3160 3160 3160 3160 3160 3160
N2O g/tonnes fuel 123 131 137 138 139 139 140 140
NH3 g/tonnes fuel 7 7 8 8 8 8 8 8
NMVOC g/tonnes fuel 7423 5827 4429 1480 1160 1161 519 519
Draft Not To Be Quoted28
123
4
5
6789
101112
13141516
171819
20

Draft Not To Be Quoted
1.A.2.g viiMobile Combustion in manufacturing industries and construction
Tier 2 emission factors
Technology
Fuel NFR Sector Pollutant Units < 1981 1981-1990 1991-Stage I Stage I Stage II Stage IIIA Stage IIIB Stage IV
NOx g/tonnes fuel 33028 44030 49127 31571 20593 12845 7200 1600
PM10 g/tonnes fuel 5493 3731 2044 787 595 573 100 100
PM2.5 g/tonnes fuel 5493 3731 2044 787 595 573 100 100
TSP g/tonnes fuel 5493 3731 2044 787 595 573 100 100
1.A.2.g.vii and CH4 g/tonnes fuel 199 171 141 43 39 36 13 13
1.A.4.a.ii CO g/tonnes fuel 20690 18890 16083 6669 7135 6826 6000 6000
CO2 kg/tonnes fuel 3160 3160 3160 3160 3160 3160 3160 3160
N2O g/tonnes fuel 121 128 135 136 136 136 140 140
NH3 g/tonnes fuel 7 7 8 8 8 8 8 8
NMVOC g/tonnes fuel 8077 6962 5742 1751 1587 1470 519 519
NOx g/tonnes fuel 26552 33942 43587 31109 22101 15653 7200 1600
PM10 g/tonnes fuel 6207 4308 3585 1014 1034 950 100 100
PM2.5 g/tonnes fuel 6207 4308 3585 1014 1034 950 100 100
TSP g/tonnes fuel 6207 4308 3585 1014 1034 950 100 100
Gasoline:
1.A.2.g.vii,
1.A.4.a.ii, CH4 g/tonnes fuel
22483 24150 17284 16979 8517
two-
stroke 1.A.4.b.ii and CO g/tonnes fuel
754523 701219 621083 620519 695237
1.A.4.c.ii CO2 kg/tonnes fuel 3197 3197 3197 3197 3197
N2O g/tonnes fuel 12 13 16 18 20
NH3 g/tonnes fuel 2 3 3 4 4
NMVOC g/tonnes fuel 298703 320843 229630 225579 113157
NOx g/tonnes fuel 1050 1145 1852 3445 2495
PM10 g/tonnes fuel 7037 6054 3869 3683 4299
PM2.5 g/tonnes fuel 7037 6054 3869 3683 4299
TSP g/tonnes fuel 7037 6054 3869 3683 4299
Gasoline:
1.A.2.g.vii,
1.A.4.a.ii, CH4 g/tonnes fuel
700 1269 672 650 568
four-
stroke 1.A.4.b.ii and CO g/tonnes fuel
121892
4
1135987 768445 774457 799828
1.A.4.c.ii CO2 kg/tonnes fuel 3197 3197 3197 3197 3197
N2O g/tonnes fuel 56 50 59 59 60
NH3 g/tonnes fuel 4 3 4 4 4
NMVOC g/tonnes fuel 19894 36045 19082 18469 16126
NOx g/tonnes fuel 2412 2985 7129 7088 6742
PM10 g/tonnes fuel 148 133 157 159 159
PM2.5 g/tonnes fuel 148 133 157 159 159
TSP g/tonnes fuel 148 133 157 159 159
Draft Not To Be Quoted29

Draft Not To Be Quoted
1.A.2.g viiMobile Combustion in manufacturing industries and construction
Tier 2 emission factors
Technology
Fuel NFR Sector Pollutant Units < 1981 1981-1990 1991-Stage I Stage I Stage II Stage IIIA Stage IIIB Stage IVReference: Winther (2015b) with Heavy Metals and POPs taken from EMEP/EEA Emissions Inventory Guidebook, 2006.
Forestry and Agriculture emission factors have been separated as there are significant differences in emission factors. Where national statistics are combined an average of the two can be used.
For land-based military emissions use emission factors for 1.A.2.g.vii as no other data are available. However, be aware that these may underestimate emissions from military sources.
For estimation of emissions of SO2, heavy metals and POPs, use Tier 1 emission factors in Table 3-5.
Black carbon: For information on BC fractions of PM (f-BC), please refer to Appendix EPM: These PM factors represent total PM emissions (filterable and condensable fractions)
3.3.3 Activity data
Basic national statistics will provide the fuel consumption data for the different NFR categories as used for Tier 1. To apply Tier 2 emission factors these fuel consumption statistics will need to be split by the relative proportion of engine technology (e.g. < 1981, 1981–1990, 1991–Stage I, Stage I, Stage II, Stage IIIA) in use in any particular inventory year. This can be done through country-specific studies (the preferable option) or by using expert judgement from experts in the field of the different off-road machinery categories from trade associations for manufacturers, engineers and distributors by either selecting a particular technology to represent a particular year or by building up year-specific age profiles. Basic data on the estimated life time of different machines is included in Appendix C. This data — combined with industry knowledge to aggregate and weight the contribution of the detailed types to fuel consumption and data on the year of implementation of the different standards — can be used to build a picture of the age profiles for the different categories and technologies.
Alternatively, data derived from Winther (2015b) and Winther & Nielsen (2006) given in the following Tables 3–3 to 3–9 can be used to split the total fuel consumption into engine technology layers for each inventory year.
In the Tables 3–3 and 3–4, the percentage split of total fuel consumption as a function of engine age are given for diesel machinery in 1.A.2.g.vii, 1.A.4.c.ii (Agriculture) and 1.A.4.c.ii (Forestry), and for gasoline two-stroke and four-stroke machinery.
The Tables 3–5 to 3–9 display the layer share of fuel consumption per engine age and inventory year for diesel-fuelled non-road machinery (Tables 3–5 to 3–7) and gasoline-fuelled non-road machinery (Tables 3–8 to 3–9). Only those inventory year/engine age combinations are listed for which fuel is consumed by more than one engine technology layer. For the
Draft Not To Be Quoted30
1
23456789
1011121314
151617
181920
21222324
Draft Not To Be Quoted
1.A.2.g viiMobile Combustion in manufacturing industries and construction
remaining inventory year/engine age combinations, the engine technology layer which uses the fuel becomes self-explanatory.
See Appendix C for more description of the assumptions behind the aggregated fuel split data given in the Tables 3–3 to 3–9.
The following example explains how to combine the fuel shares per engine age from Table 3–3, with the inventory year specific fuel consumption shares disaggregated into engine ages and emission levels given in Table 3–5. For agricultural machinery, zero-year old engines use 8 % of the total fuel used in this sector. For the inventory year 2002, this 8 % share is further subdivided into fuel consumption shares for Stage 1 (8 %*64 % = 5.12 %) and Stage II (8 %*36 % = 2.88 %). For the inventory year 2001, fuel consumption shares of 8 %*80 % = 6.40 % and 8 %*20 % = 1.60 %) are calculated for the 1991–Stage I and Stage I emission levels, respectively. For the inventory year intervals 1981–1990 and 1991–1998, the fuel used by zero-year old engines refer to the emission levels 1981–1990 and 1991–Stage I, respectively.
Draft Not To Be Quoted31
12
34
56789
1011121314
15

Draft Not To Be Quoted
1.A.2.g viiMobile Combustion in manufacturing industries and construction
Table 3-7 Split (%) of total fuel consumption per engine age (irrespective of inventory year) for diesel-fuelled non-road machinery (1.A.2.g.vii (Industry), 1.A.4.c.ii (Agriculture), 1.A.4.c.ii (Forestry))
1.A.4.c.ii 1.A.4.c.ii 1.A.2.g.viiEngine age Agriculture Forestry Industry
0 8.00 12.00 8.801 7.60 12.00 8.80
2 7.20 12.00 8.803 6.79 12.00 8.80
4 6.39 12.00 8.805 5.99 12.00 8.80
6 5.59 8.67 8.807 5.18 5.33 8.80
8 4.78 2.00 8.809 4.38 2.00 6.53
10 3.98 2.00 4.2711 3.57 2.00 2.00
12 3.17 2.00 1.7813 2.77 2.00 1.56
14 2.37 2.00 1.3315 1.97 1.11
16 1.90 0.8917 1.83 0.67
18 1.76 0.4419 1.69 0.22
20 1.6221 1.55
22 1.4823 1.41
24 1.3425 1.28
26 1.2127 1.14
28 1.0729 1.00
100.0 100.0 100.0
Draft Not To Be Quoted32
123
4

Draft Not To Be Quoted
1.A.2.g viiMobile Combustion in manufacturing industries and construction
Table 3-8 Share of total fuel consumption per engine age (irrespective of inventory year) for gasoline-fuelled two-stroke and four-stroke non-road machinery (1.A.2.g.vii (Industry), 1.A.4.c.ii (Agriculture), 1.A.4.c.ii (Forestry), 1.A.4.b.ii (Residential)
Engine age two-stroke four-stroke0 29.00 14.70
1 29.00 14.702 29.00 14.70
3 5.80 14.704 1.20 12.00
5 1.20 8.006 1.20 8.00
7 1.20 8.008 1.20 1.30
9 1.20 1.3010 1.30
11 1.30Total 100 100
Draft Not To Be Quoted33
123
Draft Not To Be Quoted
1.A.2.g viiMobile Combustion in manufacturing industries and construction
Table 3-9 Year specific fuel consumption percentages per engine age and inventory year for diesel-fuelled agricultural non-road machinery (1.A.4.c.ii)
Age Technology level
2000 2001 2002 2003 2004 2005 2006 2007 2008 2009 2010 2011 2012 2013 2014 2015 2016
0 1981-1990 0 0 0 0 0 0 0 0 0 0 0 0 0 0 0 0 00 1991-Stage I 99 80 0 0 0 0 0 0 0 0 0 0 0 0 0 0 0
0 Stage I 1 20 65 8 0 0 0 0 0 0 0 0 0 0 0 0 00 Stage II 0 0 35 92 100 100 47 6 0 0 0 0 0 0 0 0 0
0 Stage IIIA 0 0 0 0 0 0 53 94 100 100 100 50 2 0 0 0 00 Stage IIIB 0 0 0 0 0 0 0 0 0 0 0 50 98 100 45 2 2
0 Stage IV 0 0 0 0 0 0 0 0 0 0 0 0 0 0 55 98 98
1 <1981 0 0 0 0 0 0 0 0 0 0 0 0 0 0 0 0 01 1981-1990 0 0 0 0 0 0 0 0 0 0 0 0 0 0 0 0 01 1991-Stage I 99 99 80 0 0 0 0 0 0 0 0 0 0 0 0 0 0
1 Stage I 1 1 20 64 8 0 0 0 0 0 0 0 0 0 0 0 01 Stage II 0 0 0 36 92 100 100 48 6 0 0 0 0 0 0 0 0
1 Stage IIIA 0 0 0 0 0 0 0 52 94 100 100 100 50 2 0 0 01 Stage IIIB 0 0 0 0 0 0 0 0 0 0 0 0 50 98 100 45 2
1 Stage IV 0 0 0 0 0 0 0 0 0 0 0 0 0 0 0 55 98
2 <1981 0 0 0 0 0 0 0 0 0 0 0 0 0 0 0 0 02 1981-1990 0 0 0 0 0 0 0 0 0 0 0 0 0 0 0 0 02 1991-Stage I 100 99 99 80 0 0 0 0 0 0 0 0 0 0 0 0 0
2 Stage I 0 1 1 20 64 8 0 0 0 0 0 0 0 0 0 0 02 Stage II 0 0 0 0 36 92 100 100 49 6 0 0 0 0 0 0 0
2 Stage IIIA 0 0 0 0 0 0 0 0 51 94 100 100 100 50 2 0 02 Stage IIIB 0 0 0 0 0 0 0 0 0 0 0 0 0 50 98 100 45
2 Stage IV 0 0 0 0 0 0 0 0 0 0 0 0 0 0 0 0 55
3 <1981 0 0 0 0 0 0 0 0 0 0 0 0 0 0 0 0 03 1981-1990 0 0 0 0 0 0 0 0 0 0 0 0 0 0 0 0 03 1991-Stage I 100 100 99 99 80 0 0 0 0 0 0 0 0 0 0 0 0
Draft Not To Be Quoted 34
1

Draft Not To Be Quoted
1.A.2.g viiMobile Combustion in manufacturing industries and construction
Age Technology level
2000 2001 2002 2003 2004 2005 2006 2007 2008 2009 2010 2011 2012 2013 2014 2015 2016
3 Stage I 0 0 1 1 20 64 8 0 0 0 0 0 0 0 0 0 03 Stage II 0 0 0 0 0 36 92 100 100 49 6 0 0 0 0 0 0
3 Stage IIIA 0 0 0 0 0 0 0 0 0 51 94 100 100 100 50 2 0
3 Stage IIIB 0 0 0 0 0 0 0 0 0 0 0 0 0 0 50 98 1003 Stage IV 0 0 0 0 0 0 0 0 0 0 0 0 0 0 0 0 04 <1981 0 0 0 0 0 0 0 0 0 0 0 0 0 0 0 0 0
4 1981-1990 0 0 0 0 0 0 0 0 0 0 0 0 0 0 0 0 04 1991-Stage I 100 100 100 99 99 80 0 0 0 0 0 0 0 0 0 0 0
4 Stage I 0 0 0 1 1 20 66 8 0 0 0 0 0 0 0 0 04 Stage II 0 0 0 0 0 0 34 92 100 100 52 7 0 0 0 0 0
4 Stage IIIA 0 0 0 0 0 0 0 0 0 0 48 93 100 100 100 53 24 Stage IIIB 0 0 0 0 0 0 0 0 0 0 0 0 0 0 0 47 98
4 Stage IV 0 0 0 0 0 0 0 0 0 0 0 0 0 0 0 0 0
5 <1981 0 0 0 0 0 0 0 0 0 0 0 0 0 0 0 0 05 1981-1990 0 0 0 0 0 0 0 0 0 0 0 0 0 0 0 0 05 1991-Stage I 100 100 100 100 99 99 80 0 0 0 0 0 0 0 0 0 0
5 Stage I 0 0 0 0 1 1 20 67 8 0 0 0 0 0 0 0 05 Stage II 0 0 0 0 0 0 0 33 92 100 100 52 7 0 0 0 0
5 Stage IIIA 0 0 0 0 0 0 0 0 0 0 0 48 93 100 100 100 535 Stage IIIB 0 0 0 0 0 0 0 0 0 0 0 0 0 0 0 0 47
5 Stage IV 0 0 0 0 0 0 0 0 0 0 0 0 0 0 0 0 0
6 <1981 0 0 0 0 0 0 0 0 0 0 0 0 0 0 0 0 06 1981-1990 0 0 0 0 0 0 0 0 0 0 0 0 0 0 0 0 06 1991-Stage I 100 100 100 100 100 99 99 79 0 0 0 0 0 0 0 0 0
6 Stage I 0 0 0 0 0 1 1 21 72 9 0 0 0 0 0 0 06 Stage II 0 0 0 0 0 0 0 0 28 91 100 100 54 7 0 0 0
6 Stage IIIA 0 0 0 0 0 0 0 0 0 0 0 0 46 93 100 100 1006 Stage IIIB 0 0 0 0 0 0 0 0 0 0 0 0 0 0 0 0 0
Draft Not To Be Quoted 35

Draft Not To Be Quoted
1.A.2.g viiMobile Combustion in manufacturing industries and construction
Age Technology level
2000 2001 2002 2003 2004 2005 2006 2007 2008 2009 2010 2011 2012 2013 2014 2015 2016
6 Stage IV 0 0 0 0 0 0 0 0 0 0 0 0 0 0 0 0 0
7 <1981 0 0 0 0 0 0 0 0 0 0 0 0 0 0 0 0 07 1981-1990 0 0 0 0 0 0 0 0 0 0 0 0 0 0 0 0 07 1991-Stage I 100 100 100 100 100 100 98 99 73 0 0 0 0 0 0 0 0
7 Stage I 0 0 0 0 0 0 2 1 27 64 12 0 0 0 0 0 07 Stage II 0 0 0 0 0 0 0 0 0 36 88 100 100 44 8 0 0
7 Stage IIIA 0 0 0 0 0 0 0 0 0 0 0 0 0 56 92 100 1007 Stage IIIB 0 0 0 0 0 0 0 0 0 0 0 0 0 0 0 0 0
7 Stage IV 0 0 0 0 0 0 0 0 0 0 0 0 0 0 0 0 0
8 <1981 0 0 0 0 0 0 0 0 0 0 0 0 0 0 0 0 08 1981-1990 0 0 0 0 0 0 0 0 0 0 0 0 0 0 0 0 08 1991-Stage I 100 100 100 100 100 100 100 98 99 74 0 0 0 0 0 0 0
8 Stage I 0 0 0 0 0 0 0 2 1 26 63 12 0 0 0 0 08 Stage II 0 0 0 0 0 0 0 0 0 0 37 88 100 100 44 8 0
8 Stage IIIA 0 0 0 0 0 0 0 0 0 0 0 0 0 0 56 92 1008 Stage IIIB 0 0 0 0 0 0 0 0 0 0 0 0 0 0 0 0 0
8 Stage IV 0 0 0 0 0 0 0 0 0 0 0 0 0 0 0 0 0
9 <1981 0 0 0 0 0 0 0 0 0 0 0 0 0 0 0 0 09 1981-1990 0 0 0 0 0 0 0 0 0 0 0 0 0 0 0 0 09 1991-Stage I 100 100 100 100 100 100 100 100 98 99 74 0 0 0 0 0 0
9 Stage I 0 0 0 0 0 0 0 0 2 1 26 60 12 0 0 0 09 Stage II 0 0 0 0 0 0 0 0 0 0 0 40 88 100 100 43 8
9 Stage IIIA 0 0 0 0 0 0 0 0 0 0 0 0 0 0 0 57 929 Stage IIIB 0 0 0 0 0 0 0 0 0 0 0 0 0 0 0 0 0
9 Stage IV 0 0 0 0 0 0 0 0 0 0 0 0 0 0 0 0 0
10 <1981 0 0 0 0 0 0 0 0 0 0 0 0 0 0 0 0 010 1981-1990 100 0 0 0 0 0 0 0 0 0 0 0 0 0 0 0 010 1991-Stage I 0 100 100 100 100 100 100 100 100 98 99 75 0 0 0 0 0
Draft Not To Be Quoted 36

Draft Not To Be Quoted
1.A.2.g viiMobile Combustion in manufacturing industries and construction
Age Technology level
2000 2001 2002 2003 2004 2005 2006 2007 2008 2009 2010 2011 2012 2013 2014 2015 2016
10 Stage I 0 0 0 0 0 0 0 0 0 2 1 25 59 11 0 0 010 Stage II 0 0 0 0 0 0 0 0 0 0 0 0 41 89 100 100 42
10 Stage IIIA 0 0 0 0 0 0 0 0 0 0 0 0 0 0 0 0 5810 Stage IIIB 0 0 0 0 0 0 0 0 0 0 0 0 0 0 0 0 0
10 Stage IV 0 0 0 0 0 0 0 0 0 0 0 0 0 0 0 0 0
11 <1981 0 0 0 0 0 0 0 0 0 0 0 0 0 0 0 0 011 1981-1990 100 100 0 0 0 0 0 0 0 0 0 0 0 0 0 0 011 1991-Stage I 0 0 100 100 100 100 100 100 100 100 98 99 75 0 0 0 0
11 Stage I 0 0 0 0 0 0 0 0 0 0 2 1 25 58 12 0 011 Stage II 0 0 0 0 0 0 0 0 0 0 0 0 0 42 88 100 100
11 Stage IIIA 0 0 0 0 0 0 0 0 0 0 0 0 0 0 0 0 011 Stage IIIB 0 0 0 0 0 0 0 0 0 0 0 0 0 0 0 0 0
11 Stage IV 0 0 0 0 0 0 0 0 0 0 0 0 0 0 0 0 0
12 <1981 0 0 0 0 0 0 0 0 0 0 0 0 0 0 0 0 012 1981-1990 100 100 100 0 0 0 0 0 0 0 0 0 0 0 0 0 012 1991-Stage I 0 0 0 100 100 100 100 100 100 100 100 97 98 76 0 0 0
12 Stage I 0 0 0 0 0 0 0 0 0 0 0 3 2 24 56 11 012 Stage II 0 0 0 0 0 0 0 0 0 0 0 0 0 0 44 89 100
12 Stage IIIA 0 0 0 0 0 0 0 0 0 0 0 0 0 0 0 0 012 Stage IIIB 0 0 0 0 0 0 0 0 0 0 0 0 0 0 0 0 0
12 Stage IV 0 0 0 0 0 0 0 0 0 0 0 0 0 0 0 0 0
13 <1981 0 0 0 0 0 0 0 0 0 0 0 0 0 0 0 0 013 1981-1990 100 100 100 100 0 0 0 0 0 0 0 0 0 0 0 0 013 1991-Stage I 0 0 0 0 100 100 100 100 100 100 100 100 97 98 77 0 0
13 Stage I 0 0 0 0 0 0 0 0 0 0 0 0 3 2 23 53 1113 Stage II 0 0 0 0 0 0 0 0 0 0 0 0 0 0 0 47 89
13 Stage IIIA 0 0 0 0 0 0 0 0 0 0 0 0 0 0 0 0 013 Stage IIIB 0 0 0 0 0 0 0 0 0 0 0 0 0 0 0 0 0
Draft Not To Be Quoted 37

Draft Not To Be Quoted
1.A.2.g viiMobile Combustion in manufacturing industries and construction
Age Technology level
2000 2001 2002 2003 2004 2005 2006 2007 2008 2009 2010 2011 2012 2013 2014 2015 2016
13 Stage IV 0 0 0 0 0 0 0 0 0 0 0 0 0 0 0 0 0
14 <1981 0 0 0 0 0 0 0 0 0 0 0 0 0 0 0 0 014 1981-1990 100 100 100 100 100 0 0 0 0 0 0 0 0 0 0 0 014 1991-Stage I 0 0 0 0 0 100 100 100 100 100 100 100 100 96 98 78 0
14 Stage I 0 0 0 0 0 0 0 0 0 0 0 0 0 4 2 22 4914 Stage II 0 0 0 0 0 0 0 0 0 0 0 0 0 0 0 0 51
14 Stage IIIA 0 0 0 0 0 0 0 0 0 0 0 0 0 0 0 0 014 Stage IIIB 0 0 0 0 0 0 0 0 0 0 0 0 0 0 0 0 0
14 Stage IV 0 0 0 0 0 0 0 0 0 0 0 0 0 0 0 0 0
15 <1981 0 0 0 0 0 0 0 0 0 0 0 0 0 0 0 0 015 1981-1990 100 100 100 100 100 100 0 0 0 0 0 0 0 0 0 0 015 1991-Stage I 0 0 0 0 0 0 100 100 100 100 100 100 100 100 98 100 83
15 Stage I 0 0 0 0 0 0 0 0 0 0 0 0 0 0 2 0 1715 Stage II 0 0 0 0 0 0 0 0 0 0 0 0 0 0 0 0 0
15 Stage IIIA 0 0 0 0 0 0 0 0 0 0 0 0 0 0 0 0 015 Stage IIIB 0 0 0 0 0 0 0 0 0 0 0 0 0 0 0 0 0
15 Stage IV 0 0 0 0 0 0 0 0 0 0 0 0 0 0 0 0 0
16 <1981 0 0 0 0 0 0 0 0 0 0 0 0 0 0 0 0 016 1981-1990 100 100 100 100 100 100 100 0 0 0 0 0 0 0 0 0 016 1991-Stage I 0 0 0 0 0 0 0 100 100 100 100 100 100 100 100 98 100
16 Stage I 0 0 0 0 0 0 0 0 0 0 0 0 0 0 0 2 016 Stage II 0 0 0 0 0 0 0 0 0 0 0 0 0 0 0 0 0
16 Stage IIIA 0 0 0 0 0 0 0 0 0 0 0 0 0 0 0 0 016 Stage IIIB 0 0 0 0 0 0 0 0 0 0 0 0 0 0 0 0 0
16 Stage IV 0 0 0 0 0 0 0 0 0 0 0 0 0 0 0 0 0
17 <1981 0 0 0 0 0 0 0 0 0 0 0 0 0 0 0 0 017 1981-1990 100 100 100 100 100 100 100 100 0 0 0 0 0 0 0 0 017 1991-Stage I 0 0 0 0 0 0 0 0 100 100 100 100 100 100 100 100 98
Draft Not To Be Quoted 38

Draft Not To Be Quoted
1.A.2.g viiMobile Combustion in manufacturing industries and construction
Age Technology level
2000 2001 2002 2003 2004 2005 2006 2007 2008 2009 2010 2011 2012 2013 2014 2015 2016
17 Stage I 0 0 0 0 0 0 0 0 0 0 0 0 0 0 0 0 217 Stage II 0 0 0 0 0 0 0 0 0 0 0 0 0 0 0 0 0
17 Stage IIIA 0 0 0 0 0 0 0 0 0 0 0 0 0 0 0 0 017 Stage IIIB 0 0 0 0 0 0 0 0 0 0 0 0 0 0 0 0 0
17 Stage IV 0 0 0 0 0 0 0 0 0 0 0 0 0 0 0 0 0
Table 3-10 Year specific fuel consumption percentages per engine age and inventory year for diesel-fuelled forestry non-road machinery (1.A.4.c.ii)
Age Technology Level
2000 2001 2002 2003 2004 2005 2006 2007 2008 2009 2010 2011 2012 2013 2014 2015 2016
0 1981-1990 0 0 0 0 0 0 0 0 0 0 0 0 0 0 0 0 00 1991-Stage I 77 59 2 2 2 2 2 0 0 0 0 0 0 0 0 0 00 Stage I 23 41 54 2 0 0 0 0 0 0 0 0 0 0 0 0 00 Stage II 0 0 43 96 98 98 50 2 2 2 2 0 0 0 0 0 00 Stage IIIA 0 0 0 0 0 0 48 98 98 98 98 52 2 2 2 2 20 Stage IIIB 0 0 0 0 0 0 0 0 0 0 0 48 98 98 50 0 00 Stage IV 0 0 0 0 0 0 0 0 0 0 0 0 0 0 48 98 981 <1981 0 0 0 0 0 0 0 0 0 0 0 0 0 0 0 0 01 1981-1990 0 0 0 0 0 0 0 0 0 0 0 0 0 0 0 0 01 1991-Stage I 77 78 60 2 2 2 2 2 0 0 0 0 0 0 0 0 01 Stage I 23 22 40 52 0 0 0 0 0 0 0 0 0 0 0 0 01 Stage II 0 0 0 46 98 98 98 50 2 2 2 2 0 0 0 0 01 Stage IIIA 0 0 0 0 0 0 0 48 98 98 98 98 52 2 2 2 21 Stage IIIB 0 0 0 0 0 0 0 0 0 0 0 0 48 98 98 50 01 Stage IV 0 0 0 0 0 0 0 0 0 0 0 0 0 0 0 48 982 <1981 0 0 0 0 0 0 0 0 0 0 0 0 0 0 0 0 02 1981-1990 0 0 0 0 0 0 0 0 0 0 0 0 0 0 0 0 02 1991-Stage I 100 78 79 61 2 2 2 2 2 0 0 0 0 0 0 0 02 Stage I 0 22 21 39 50 0 0 0 0 0 0 0 0 0 0 0 02 Stage II 0 0 0 0 48 98 98 98 50 2 2 2 2 0 0 0 02 Stage IIIA 0 0 0 0 0 0 0 0 48 98 98 98 98 52 2 2 22 Stage IIIB 0 0 0 0 0 0 0 0 0 0 0 0 0 48 98 98 50
Draft Not To Be Quoted 39
1

Draft Not To Be Quoted
1.A.2.g viiMobile Combustion in manufacturing industries and construction
Age Technology Level
2000 2001 2002 2003 2004 2005 2006 2007 2008 2009 2010 2011 2012 2013 2014 2015 2016
2 Stage IV 0 0 0 0 0 0 0 0 0 0 0 0 0 0 0 0 483 <1981 0 0 0 0 0 0 0 0 0 0 0 0 0 0 0 0 03 1981-1990 0 0 0 0 0 0 0 0 0 0 0 0 0 0 0 0 03 1991-Stage I 100 100 79 80 63 2 2 2 2 2 0 0 0 0 0 0 03 Stage I 0 0 21 20 37 50 0 0 0 0 0 0 0 0 0 0 03 Stage II 0 0 0 0 0 48 98 98 98 50 2 2 2 2 0 0 03 Stage IIIA 0 0 0 0 0 0 0 0 0 48 98 98 98 98 52 2 23 Stage IIIB 0 0 0 0 0 0 0 0 0 0 0 0 0 0 48 98 983 Stage IV 0 0 0 0 0 0 0 0 0 0 0 0 0 0 0 0 04 <1981 0 0 0 0 0 0 0 0 0 0 0 0 0 0 0 0 04 1981-1990 0 0 0 0 0 0 0 0 0 0 0 0 0 0 0 0 04 1991-Stage I 100 100 100 80 81 63 2 2 2 2 2 0 0 0 0 0 04 Stage I 0 0 0 20 19 37 50 0 0 0 0 0 0 0 0 0 04 Stage II 0 0 0 0 0 0 48 98 98 98 50 2 2 2 2 0 04 Stage IIIA 0 0 0 0 0 0 0 0 0 0 48 98 98 98 98 52 24 Stage IIIB 0 0 0 0 0 0 0 0 0 0 0 0 0 0 0 48 984 Stage IV 0 0 0 0 0 0 0 0 0 0 0 0 0 0 0 0 05 <1981 0 0 0 0 0 0 0 0 0 0 0 0 0 0 0 0 05 1981-1990 0 0 0 0 0 0 0 0 0 0 0 0 0 0 0 0 05 1991-Stage I 100 100 100 100 81 81 63 2 2 2 2 2 0 0 0 0 05 Stage I 0 0 0 0 19 19 37 50 0 0 0 0 0 0 0 0 05 Stage II 0 0 0 0 0 0 0 48 98 98 98 50 2 2 2 2 05 Stage IIIA 0 0 0 0 0 0 0 0 0 0 0 48 98 98 98 98 525 Stage IIIB 0 0 0 0 0 0 0 0 0 0 0 0 0 0 0 0 485 Stage IV 0 0 0 0 0 0 0 0 0 0 0 0 0 0 0 0 06 <1981 0 0 0 0 0 0 0 0 0 0 0 0 0 0 0 0 06 1981-1990 0 0 0 0 0 0 0 0 0 0 0 0 0 0 0 0 06 1991-Stage I 100 100 100 100 100 62 62 62 5 5 5 5 5 0 0 0 06 Stage I 0 0 0 0 0 38 38 38 95 0 0 0 0 0 0 0 06 Stage II 0 0 0 0 0 0 0 0 0 95 95 95 95 5 5 5 56 Stage IIIA 0 0 0 0 0 0 0 0 0 0 0 0 0 95 95 95 956 Stage IIIB 0 0 0 0 0 0 0 0 0 0 0 0 0 0 0 0 06 Stage IV 0 0 0 0 0 0 0 0 0 0 0 0 0 0 0 0 0
Draft Not To Be Quoted 40

Draft Not To Be Quoted
1.A.2.g viiMobile Combustion in manufacturing industries and construction
Age Technology Level
2000 2001 2002 2003 2004 2005 2006 2007 2008 2009 2010 2011 2012 2013 2014 2015 2016
7 <1981 0 0 0 0 0 0 0 0 0 0 0 0 0 0 0 0 07 1981-1990 0 0 0 0 0 0 0 0 0 0 0 0 0 0 0 0 07 1991-Stage I 100 100 100 100 100 100 62 62 62 5 5 5 5 5 0 0 07 Stage I 0 0 0 0 0 0 38 38 38 95 0 0 0 0 0 0 07 Stage II 0 0 0 0 0 0 0 0 0 0 95 95 95 95 5 5 57 Stage IIIA 0 0 0 0 0 0 0 0 0 0 0 0 0 0 95 95 957 Stage IIIB 0 0 0 0 0 0 0 0 0 0 0 0 0 0 0 0 07 Stage IV 0 0 0 0 0 0 0 0 0 0 0 0 0 0 0 0 08 <1981 0 0 0 0 0 0 0 0 0 0 0 0 0 0 0 0 08 1981-1990 0 0 0 0 0 0 0 0 0 0 0 0 0 0 0 0 08 1991-Stage I 100 100 100 100 100 100 100 100 100 100 27 27 27 27 27 0 08 Stage I 0 0 0 0 0 0 0 0 0 0 73 0 0 0 0 0 08 Stage II 0 0 0 0 0 0 0 0 0 0 0 73 73 73 73 27 278 Stage IIIA 0 0 0 0 0 0 0 0 0 0 0 0 0 0 0 73 738 Stage IIIB 0 0 0 0 0 0 0 0 0 0 0 0 0 0 0 0 08 Stage IV 0 0 0 0 0 0 0 0 0 0 0 0 0 0 0 0 09 <1981 0 0 0 0 0 0 0 0 0 0 0 0 0 0 0 0 09 1981-1990 0 0 0 0 0 0 0 0 0 0 0 0 0 0 0 0 09 1991-Stage I 100 100 100 100 100 100 100 100 100 100 100 27 27 27 27 27 09 Stage I 0 0 0 0 0 0 0 0 0 0 0 73 0 0 0 0 09 Stage II 0 0 0 0 0 0 0 0 0 0 0 0 73 73 73 73 279 Stage IIIA 0 0 0 0 0 0 0 0 0 0 0 0 0 0 0 0 739 Stage IIIB 0 0 0 0 0 0 0 0 0 0 0 0 0 0 0 0 09 Stage IV 0 0 0 0 0 0 0 0 0 0 0 0 0 0 0 0 0
Draft Not To Be Quoted 41
1

Draft Not To Be Quoted
1.A.2.g viiMobile Combustion in manufacturing industries and construction
Table 3-11 Year specific fuel consumption percentages per engine age and inventory year for diesel-fuelled industry non-road machinery (1.A.2.g.vii)
Age Technology Level 2000 2001 2002 2003 2004 2005 2006 2007 2008 2009 2010 2011 2012 2013 2014 2015 20160 1981-1990 0 0 0 0 0 0 0 0 0 0 0 0 0 0 0 0 00 1991-Stage I 36 18 14 14 14 13 12 3 3 4 4 4 8 4 4 4 40 Stage I 64 63 62 18 0 0 0 0 0 0 0 0 0 0 0 0 00 Stage II 0 18 24 68 86 87 85 24 8 8 8 6 0 0 0 0 00 Stage IIIA 0 0 0 0 0 0 4 73 89 88 88 87 56 29 29 29 290 Stage IIIB 0 0 0 0 0 0 0 0 0 0 0 3 36 68 64 10 100 Stage IV 0 0 0 0 0 0 0 0 0 0 0 0 0 0 4 58 581 <1981 0 0 0 0 0 0 0 0 0 0 0 0 0 0 0 0 01 1981-1990 0 0 0 0 0 0 0 0 0 0 0 0 0 0 0 0 01 1991-Stage I 36 37 18 14 14 13 12 11 3 3 4 4 8 4 4 4 41 Stage I 64 63 62 61 18 0 0 0 0 0 0 0 0 0 0 0 01 Stage II 0 0 20 25 68 87 88 85 23 8 9 9 13 0 0 0 01 Stage IIIA 0 0 0 0 0 0 0 4 74 89 88 87 71 38 29 29 291 Stage IIIB 0 0 0 0 0 0 0 0 0 0 0 0 7 58 68 64 101 Stage IV 0 0 0 0 0 0 0 0 0 0 0 0 0 0 0 4 582 <1981 0 0 0 0 0 0 0 0 0 0 0 0 0 0 0 0 02 1981-1990 0 0 0 0 0 0 0 0 0 0 0 0 0 0 0 0 02 1991-Stage I 100 37 38 18 14 13 12 11 10 3 4 4 9 4 4 4 42 Stage I 0 63 62 61 60 17 0 0 0 0 0 0 0 0 0 0 02 Stage II 0 0 0 21 26 70 88 89 85 23 8 9 21 6 0 0 02 Stage IIIA 0 0 0 0 0 0 0 0 4 73 88 87 70 87 38 29 292 Stage IIIB 0 0 0 0 0 0 0 0 0 0 0 0 0 4 58 68 642 Stage IV 0 0 0 0 0 0 0 0 0 0 0 0 0 0 0 0 43 <1981 0 0 0 0 0 0 0 0 0 0 0 0 0 0 0 0 03 1981-1990 0 0 0 0 0 0 0 0 0 0 0 0 0 0 0 0 03 1991-Stage I 100 100 39 40 18 13 12 11 11 11 3 4 9 4 4 4 43 Stage I 0 0 61 60 60 60 16 0 0 0 0 0 0 0 0 0 03 Stage II 0 0 0 0 23 26 71 89 89 85 23 9 22 9 6 0 03 Stage IIIA 0 0 0 0 0 0 0 0 0 4 73 88 69 88 87 38 293 Stage IIIB 0 0 0 0 0 0 0 0 0 0 0 0 0 0 4 58 683 Stage IV 0 0 0 0 0 0 0 0 0 0 0 0 0 0 0 0 04 <1981 0 0 0 0 0 0 0 0 0 0 0 0 0 0 0 0 0
Draft Not To Be Quoted 42
1

Draft Not To Be Quoted
1.A.2.g viiMobile Combustion in manufacturing industries and construction
Age Technology Level 2000 2001 2002 2003 2004 2005 2006 2007 2008 2009 2010 2011 2012 2013 2014 2015 20164 1981-1990 0 0 0 0 0 0 0 0 0 0 0 0 0 0 0 0 04 1991-Stage I 100 100 100 40 41 17 12 11 11 11 11 4 9 4 4 4 44 Stage I 0 0 0 60 59 60 61 16 0 0 0 0 0 0 0 0 04 Stage II 0 0 0 0 0 23 27 73 89 89 85 24 20 9 9 6 04 Stage IIIA 0 0 0 0 0 0 0 0 0 0 4 73 71 87 88 87 384 Stage IIIB 0 0 0 0 0 0 0 0 0 0 0 0 0 0 0 4 584 Stage IV 0 0 0 0 0 0 0 0 0 0 0 0 0 0 0 0 05 <1981 0 0 0 0 0 0 0 0 0 0 0 0 0 0 0 0 05 1981-1990 0 0 0 0 0 0 0 0 0 0 0 0 0 0 0 0 05 1991-Stage I 100 100 100 100 41 40 16 11 11 11 12 12 8 4 4 4 45 Stage I 0 0 0 0 59 60 60 61 15 0 0 0 0 0 0 0 05 Stage II 0 0 0 0 0 0 23 27 74 89 88 85 50 9 9 9 65 Stage IIIA 0 0 0 0 0 0 0 0 0 0 0 3 42 88 87 88 875 Stage IIIB 0 0 0 0 0 0 0 0 0 0 0 0 0 0 0 0 45 Stage IV 0 0 0 0 0 0 0 0 0 0 0 0 0 0 0 0 06 <1981 0 0 0 0 0 0 0 0 0 0 0 0 0 0 0 0 06 1981-1990 0 0 0 0 0 0 0 0 0 0 0 0 0 0 0 0 06 1991-Stage I 100 100 100 100 100 39 38 13 9 9 10 10 21 1 1 1 16 Stage I 0 0 0 0 0 61 62 63 63 16 0 0 0 0 0 0 06 Stage II 0 0 0 0 0 0 0 24 28 75 90 90 72 23 9 9 96 Stage IIIA 0 0 0 0 0 0 0 0 0 0 0 0 7 76 90 90 906 Stage IIIB 0 0 0 0 0 0 0 0 0 0 0 0 0 0 0 0 06 Stage IV 0 0 0 0 0 0 0 0 0 0 0 0 0 0 0 0 07 <1981 0 0 0 0 0 0 0 0 0 0 0 0 0 0 0 0 07 1981-1990 0 0 0 0 0 0 0 0 0 0 0 0 0 0 0 0 07 1991-Stage I 100 100 100 100 100 100 38 37 13 8 9 9 22 9 0 0 07 Stage I 0 0 0 0 0 0 62 63 64 64 15 0 0 0 0 0 07 Stage II 0 0 0 0 0 0 0 0 24 28 76 91 78 87 23 9 97 Stage IIIA 0 0 0 0 0 0 0 0 0 0 0 0 0 4 77 91 907 Stage IIIB 0 0 0 0 0 0 0 0 0 0 0 0 0 0 0 0 07 Stage IV 0 0 0 0 0 0 0 0 0 0 0 0 0 0 0 0 08 <1981 0 0 0 0 0 0 0 0 0 0 0 0 0 0 0 0 08 1981-1990 0 0 0 0 0 0 0 0 0 0 0 0 0 0 0 0 08 1991-Stage I 100 100 100 100 100 100 100 37 37 13 9 9 23 9 9 0 08 Stage I 0 0 0 0 0 0 0 63 63 64 64 15 0 0 0 0 0
Draft Not To Be Quoted 43

Draft Not To Be Quoted
1.A.2.g viiMobile Combustion in manufacturing industries and construction
Age Technology Level 2000 2001 2002 2003 2004 2005 2006 2007 2008 2009 2010 2011 2012 2013 2014 2015 20168 Stage II 0 0 0 0 0 0 0 0 0 23 27 75 77 91 87 23 98 Stage IIIA 0 0 0 0 0 0 0 0 0 0 0 0 0 0 4 77 918 Stage IIIB 0 0 0 0 0 0 0 0 0 0 0 0 0 0 0 0 08 Stage IV 0 0 0 0 0 0 0 0 0 0 0 0 0 0 0 0 09 <1981 0 0 0 0 0 0 0 0 0 0 0 0 0 0 0 0 09 1981-1990 0 0 0 0 0 0 0 0 0 0 0 0 0 0 0 0 09 1991-Stage I 100 100 100 100 100 100 100 100 37 36 13 9 23 9 9 9 09 Stage I 0 0 0 0 0 0 0 0 63 64 64 65 35 0 0 0 09 Stage II 0 0 0 0 0 0 0 0 0 0 23 26 42 91 91 87 239 Stage IIIA 0 0 0 0 0 0 0 0 0 0 0 0 0 0 0 4 779 Stage IIIB 0 0 0 0 0 0 0 0 0 0 0 0 0 0 0 0 09 Stage IV 0 0 0 0 0 0 0 0 0 0 0 0 0 0 0 0 0
10 <1981 0 0 0 0 0 0 0 0 0 0 0 0 0 0 0 0 010 1981-1990 100 0 0 0 0 0 0 0 0 0 0 0 0 0 0 0 010 1991-Stage I 0 100 100 100 100 100 100 100 100 75 75 40 41 41 42 40 3510 Stage I 0 0 0 0 0 0 0 0 0 25 25 27 29 23 0 0 010 Stage II 0 0 0 0 0 0 0 0 0 0 0 33 31 36 58 60 6510 Stage IIIA 0 0 0 0 0 0 0 0 0 0 0 0 0 0 0 0 010 Stage IIIB 0 0 0 0 0 0 0 0 0 0 0 0 0 0 0 0 010 Stage IV 0 0 0 0 0 0 0 0 0 0 0 0 0 0 0 0 011 <1981 0 0 0 0 0 0 0 0 0 0 0 0 0 0 0 0 011 1981-1990 100 100 0 0 0 0 0 0 0 0 0 0 0 0 0 0 011 1991-Stage I 0 0 100 100 100 100 100 100 100 100 76 74 41 41 41 42 4011 Stage I 0 0 0 0 0 0 0 0 0 0 24 26 28 29 23 0 011 Stage II 0 0 0 0 0 0 0 0 0 0 0 0 31 30 36 58 6011 Stage IIIA 0 0 0 0 0 0 0 0 0 0 0 0 0 0 0 0 011 Stage IIIB 0 0 0 0 0 0 0 0 0 0 0 0 0 0 0 0 011 Stage IV 0 0 0 0 0 0 0 0 0 0 0 0 0 0 0 0 012 <1981 0 0 0 0 0 0 0 0 0 0 0 0 0 0 0 0 012 1981-1990 100 100 100 0 0 0 0 0 0 0 0 0 0 0 0 0 012 1991-Stage I 0 0 0 100 100 100 100 100 100 100 100 75 73 41 41 41 4212 Stage I 0 0 0 0 0 0 0 0 0 0 0 25 27 29 29 23 012 Stage II 0 0 0 0 0 0 0 0 0 0 0 0 0 30 30 36 5812 Stage IIIA 0 0 0 0 0 0 0 0 0 0 0 0 0 0 0 0 012 Stage IIIB 0 0 0 0 0 0 0 0 0 0 0 0 0 0 0 0 0
Draft Not To Be Quoted 44

Draft Not To Be Quoted
1.A.2.g viiMobile Combustion in manufacturing industries and construction
Age Technology Level 2000 2001 2002 2003 2004 2005 2006 2007 2008 2009 2010 2011 2012 2013 2014 2015 201612 Stage IV 0 0 0 0 0 0 0 0 0 0 0 0 0 0 0 0 013 <1981 0 0 0 0 0 0 0 0 0 0 0 0 0 0 0 0 013 1981-1990 100 100 100 100 0 0 0 0 0 0 0 0 0 0 0 0 013 1991-Stage I 0 0 0 0 100 100 100 100 100 100 100 100 67 65 23 23 2313 Stage I 0 0 0 0 0 0 0 0 0 0 0 0 33 35 38 38 3013 Stage II 0 0 0 0 0 0 0 0 0 0 0 0 0 0 39 39 4713 Stage IIIA 0 0 0 0 0 0 0 0 0 0 0 0 0 0 0 0 013 Stage IIIB 0 0 0 0 0 0 0 0 0 0 0 0 0 0 0 0 013 Stage IV 0 0 0 0 0 0 0 0 0 0 0 0 0 0 0 0 014 <1981 0 0 0 0 0 0 0 0 0 0 0 0 0 0 0 0 014 1981-1990 100 100 100 100 100 0 0 0 0 0 0 0 0 0 0 0 014 1991-Stage I 0 0 0 0 0 100 100 100 100 100 100 100 100 36 34 22 2214 Stage I 0 0 0 0 0 0 0 0 0 0 0 0 0 64 66 76 7614 Stage II 0 0 0 0 0 0 0 0 0 0 0 0 0 0 0 2 314 Stage IIIA 0 0 0 0 0 0 0 0 0 0 0 0 0 0 0 0 014 Stage IIIB 0 0 0 0 0 0 0 0 0 0 0 0 0 0 0 0 014 Stage IV 0 0 0 0 0 0 0 0 0 0 0 0 0 0 0 0 015 <1981 0 0 0 0 0 0 0 0 0 0 0 0 0 0 0 0 015 1981-1990 100 100 100 100 100 100 0 0 0 0 0 0 0 0 0 0 015 1991-Stage I 0 0 0 0 0 0 100 100 100 100 100 100 100 100 19 19 015 Stage I 0 0 0 0 0 0 0 0 0 0 0 0 0 0 81 81 9715 Stage II 0 0 0 0 0 0 0 0 0 0 0 0 0 0 0 0 315 Stage IIIA 0 0 0 0 0 0 0 0 0 0 0 0 0 0 0 0 015 Stage IIIB 0 0 0 0 0 0 0 0 0 0 0 0 0 0 0 0 015 Stage IV 0 0 0 0 0 0 0 0 0 0 0 0 0 0 0 0 016 <1981 0 0 0 0 0 0 0 0 0 0 0 0 0 0 0 0 016 1981-1990 100 100 100 100 100 100 100 0 0 0 0 0 0 0 0 0 016 1991-Stage I 0 0 0 0 0 0 0 100 100 100 100 100 100 100 100 19 1916 Stage I 0 0 0 0 0 0 0 0 0 0 0 0 0 0 0 81 8116 Stage II 0 0 0 0 0 0 0 0 0 0 0 0 0 0 0 0 016 Stage IIIA 0 0 0 0 0 0 0 0 0 0 0 0 0 0 0 0 016 Stage IIIB 0 0 0 0 0 0 0 0 0 0 0 0 0 0 0 0 017 <1981 0 0 0 0 0 0 0 0 0 0 0 0 0 0 0 0 017 1981-1990 100 100 100 100 100 100 100 100 0 0 0 0 0 0 0 0 017 1991-Stage I 0 0 0 0 0 0 0 0 100 100 100 100 100 100 100 100 19
Draft Not To Be Quoted 45

Draft Not To Be Quoted
1.A.2.g viiMobile Combustion in manufacturing industries and construction
Age Technology Level 2000 2001 2002 2003 2004 2005 2006 2007 2008 2009 2010 2011 2012 2013 2014 2015 201617 Stage I 0 0 0 0 0 0 0 0 0 0 0 0 0 0 0 0 8117 Stage II 0 0 0 0 0 0 0 0 0 0 0 0 0 0 0 0 017 Stage IIIA 0 0 0 0 0 0 0 0 0 0 0 0 0 0 0 0 017 Stage IIIB 0 0 0 0 0 0 0 0 0 0 0 0 0 0 0 0 0
Table 3-12 Year specific fuel consumption percentages per engine age and inventory year for gasoline-fuelled two-stroke non-road machinery (1.A.2.g.vii, 1.A.4.a.ii, 1.A.4.b.ii, 1.A.4.c.ii)
Age Technology Level 2007 2008 2009 2010 2011 2012 2013 2014 2015 20160 1981-1990 0 0 0 0 0 0 0 0 0 00 1991-Stage I 0 0 0 0 0 0 0 0 0 00 Stage I 99 85 0 0 0 0 0 0 0 00 Stage II 1 15 100 100 100 100 100 100 100 1001 <1981 0 0 0 0 0 0 0 0 0 01 1981-1990 0 0 0 0 0 0 0 0 0 01 1991-Stage I 0 0 0 0 0 0 0 0 0 01 Stage I 100 99 85 0 0 0 0 0 0 01 Stage II 0 1 15 100 100 100 100 100 100 1002 <1981 0 0 0 0 0 0 0 0 0 02 1981-1990 0 0 0 0 0 0 0 0 0 02 1991-Stage I 0 0 0 0 0 0 0 0 0 02 Stage I 100 100 100 85 0 0 0 0 0 02 Stage II 0 0 0 15 100 100 100 100 100 1003 <1981 0 0 0 0 0 0 0 0 0 03 1981-1990 0 0 0 0 0 0 0 0 0 03 1991-Stage I 100 0 0 0 0 0 0 0 0 03 Stage I 0 99 99 97 0 0 0 0 0 03 Stage II 0 1 1 3 100 100 100 100 100 1004 <1981 0 0 0 0 0 0 0 0 0 04 1981-1990 0 0 0 0 0 0 0 0 0 04 1991-Stage I 100 100 0 0 0 0 0 0 0 04 Stage I 0 0 94 92 84 0 0 0 0 04 Stage II 0 0 6 8 16 100 100 100 100 1005 <1981 0 0 0 0 0 0 0 0 0 0
Draft Not To Be Quoted 46
12
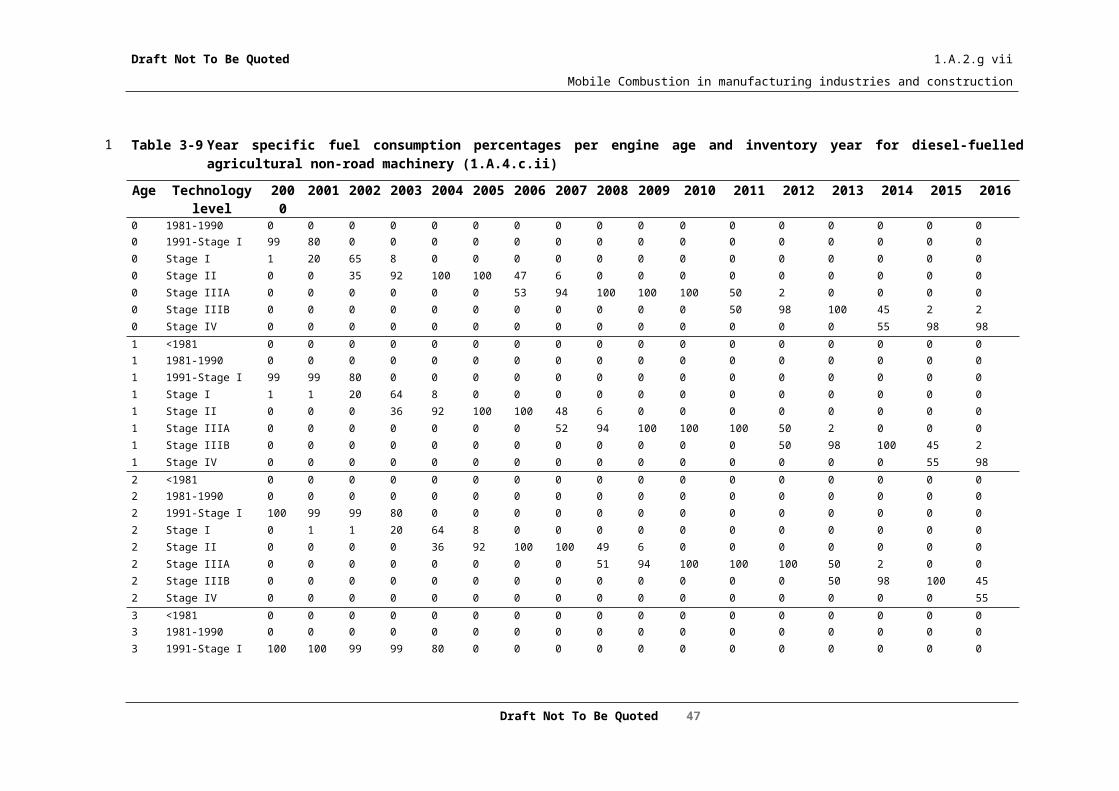
Draft Not To Be Quoted
1.A.2.g viiMobile Combustion in manufacturing industries and construction
Age Technology Level 2007 2008 2009 2010 2011 2012 2013 2014 2015 20165 1981-1990 0 0 0 0 0 0 0 0 0 05 1991-Stage I 100 100 100 0 0 0 0 0 0 05 Stage I 0 0 0 92 92 84 0 0 0 05 Stage II 0 0 0 8 8 16 100 100 100 1006 <1981 0 0 0 0 0 0 0 0 0 06 1981-1990 0 0 0 0 0 0 0 0 0 06 1991-Stage I 100 100 100 100 0 0 0 0 0 06 Stage I 0 0 0 0 92 92 84 0 0 06 Stage II 0 0 0 0 8 8 16 100 100 1007 <1981 0 0 0 0 0 0 0 0 0 07 1981-1990 0 0 0 0 0 0 0 0 0 07 1991-Stage I 100 100 100 100 100 0 0 0 0 07 Stage I 0 0 0 0 0 92 92 84 0 07 Stage II 0 0 0 0 0 8 8 16 100 1008 <1981 0 0 0 0 0 0 0 0 0 08 1981-1990 0 0 0 0 0 0 0 0 0 08 1991-Stage I 100 100 100 100 100 100 0 0 0 08 Stage I 0 0 0 0 0 0 92 92 84 08 Stage II 0 0 0 0 0 0 8 8 16 1009 <1981 0 0 0 0 0 0 0 0 0 09 1981-1990 0 0 0 0 0 0 0 0 0 09 1991-Stage I 100 100 100 100 100 100 100 0 0 09 Stage I 0 0 0 0 0 0 0 92 92 849 Stage II 0 0 0 0 0 0 0 8 8 16
Draft Not To Be Quoted 47
1

Draft Not To Be Quoted
1.A.2.g viiMobile Combustion in manufacturing industries and construction
Table 3-13 Year specific fuel consumption percentages per engine age and inventory year for gasoline-fuelled four-stroke non-road machinery (1.A.2.g.vii, 1.A.4.a.ii, 1.A.4.b.ii, 1.A.4.c.ii)
Age Technology Level 2007 2008 2009 2010 2011 2012 2013 2014 2015 20160 1981-1990 0 0 0 0 0 0 0 0 0 00 1991-Stage I 0 0 0 0 0 0 0 0 0 00 Stage I 40 4 0 0 0 0 0 0 0 00 Stage II 60 96 100 100 100 100 100 100 100 1001 <1981 0 0 0 0 0 0 0 0 0 01 1981-1990 0 0 0 0 0 0 0 0 0 01 1991-Stage I 0 0 0 0 0 0 0 0 0 01 Stage I 100 40 3 0 0 0 0 0 0 01 Stage II 0 60 97 100 100 100 100 100 100 1002 <1981 0 0 0 0 0 0 0 0 0 02 1981-1990 0 0 0 0 0 0 0 0 0 02 1991-Stage I 0 0 0 0 0 0 0 0 0 02 Stage I 100 100 39 4 0 0 0 0 0 02 Stage II 0 0 61 96 100 100 100 100 100 1003 <1981 0 0 0 0 0 0 0 0 0 03 1981-1990 0 0 0 0 0 0 0 0 0 03 1991-Stage I 100 0 0 0 0 0 0 0 0 03 Stage I 0 100 100 40 4 0 0 0 0 03 Stage II 0 0 0 60 96 100 100 100 100 1004 <1981 0 0 0 0 0 0 0 0 0 04 1981-1990 0 0 0 0 0 0 0 0 0 04 1991-Stage I 100 100 0 0 0 0 0 0 0 04 Stage I 0 0 100 100 32 5 0 0 0 04 Stage II 0 0 0 0 68 95 100 100 100 1005 <1981 0 0 0 0 0 0 0 0 0 05 1981-1990 0 0 0 0 0 0 0 0 0 05 1991-Stage I 100 100 100 0 0 0 0 0 0 05 Stage I 0 0 0 100 100 70 1 0 0 05 Stage II 0 0 0 0 0 30 99 100 100 1006 <1981 0 0 0 0 0 0 0 0 0 06 1981-1990 0 0 0 0 0 0 0 0 0 06 1991-Stage I 100 100 100 100 0 0 0 0 0 06 Stage I 0 0 0 0 100 100 70 1 0 06 Stage II 0 0 0 0 0 0 30 99 100 1007 <1981 0 0 0 0 0 0 0 0 0 07 1981-1990 0 0 0 0 0 0 0 0 0 07 1991-Stage I 100 100 100 100 100 0 0 0 0 07 Stage I 0 0 0 0 0 100 100 70 1 07 Stage II 0 0 0 0 0 0 0 30 99 1008 <1981 0 0 0 0 0 0 0 0 0 08 1981-1990 0 0 0 0 0 0 0 0 0 08 1991-Stage I 100 100 100 100 100 100 0 0 0 08 Stage I 0 0 0 0 0 0 99 99 11 38 Stage II 0 0 0 0 0 0 1 1 89 979 <1981 0 0 0 0 0 0 0 0 0 09 1981-1990 0 0 0 0 0 0 0 0 0 09 1991-Stage I 100 100 100 100 100 100 100 0 0 09 Stage I 0 0 0 0 0 0 0 99 99 119 Stage II 0 0 0 0 0 0 0 1 1 89
10 <1981 0 0 0 0 0 0 0 0 0 010 1981-1990 0 0 0 0 0 0 0 0 0 0
Draft Not To Be Quoted48
1

Draft Not To Be Quoted
1.A.2.g viiMobile Combustion in manufacturing industries and construction
10 1991-Stage I 100 100 100 100 100 100 100 100 0 010 Stage I 0 0 0 0 0 0 0 0 99 9910 Stage II 0 0 0 0 0 0 0 0 1 111 <1981 0 0 0 0 0 0 0 0 0 011 1981-1990 0 0 0 0 0 0 0 0 0 011 1991-Stage I 100 100 100 100 100 100 100 100 100 011 Stage I 0 0 0 0 0 0 0 0 0 9911 Stage II 0 0 0 0 0 0 0 0 0 1
Draft Not To Be Quoted49
12
3

Draft Not To Be Quoted
1.A.2.g viiMobile Combustion in manufacturing industries and construction
3.4 Tier 3 equipment-specific and technology-stratified approach
The Tier 2 methods make use of fuel statistics, to be multiplied with bulk emission factors. Unfortunately, this method can be difficult to undertake because the statistical fuel consumption data are not available in the required detail.
Therefore, in the following, a more detailed Tier 3 methodology is described, which is mainly based on the US-EPA method for estimating off-road emissions (US-EPA 1991). The Tier 3 method presented here has not been updated and includes detailed fuel consumption and emission information taken, to a large extent, from the German TREMOD NRMM model.with new data as has been the case for Tier 1 and 2, and hence a lack of consistency is expected between the Tier 1/Tier 2 results and the results obtained from Tier 3 calculations. An updated Tier 3 methodology is envisaged in the near future based on extensive measurements performed by the EU JRC (Joint Research Centre).
3.4.1 Algorithm
The basic algorithm used for the Tier 3 methodology is:
E = N x HRS x P x (1 + DFA) x LFA x EFBase (5)
where:
E = mass of emissions of pollutant i during inventory period,
N = number of engines (units),
HRS = annual hours of use,
P = engine size (kW),
DFA = deterioration factor adjustment,
LFA = load factor adjustment,
EFBase = Base emission factor (g/kWh).
In this methodology, the parameters N, HRS, P, DFA, LFA, EFBase of the basic formula (5) mentioned above are split further by classification systems as follows:
N: the machinery/vehicle population is split into different technology levels and power ranges,
HRS: the annual working hour is a function of the age of the equipment/vehicles; therefore, for each sub category, individual age dependent usage patterns can be defined,
P: the power is a function of the power distribution of the vehicles/machinery; therefore, for each sub category an individual power distribution can be defined within given power ranges,
Draft Not To Be Quoted50
1
2
345
6789
10111213
14
15
16
17
18
19
20
21
22
23
24
25
26
2728
293031
323334

Draft Not To Be Quoted
1.A.2.g viiMobile Combustion in manufacturing industries and construction
EFBase: the emission factor is, for each pollutant, a function of technology levels and power output,.
DFA: The deterioration factor adjustment is a function of the power range of the vehicles/machinery and the technology level.
LFA: The load factor adjustment is a function of technology level.
To use the approach above, it is therefore necessary to stratify the machinery fleet numbers in terms of: technology level, power range, load, age, as well as the annual hours of operation for each of these classes.
In this advanced approach, in addition to exhaust emissions, evaporative emissions of gasoline engines are taken into account. In reality, evaporative emissions occur under all conditions, e.g. while the machine/vehicle is in operation or not in operation. However, the emissions of off-road machines and vehicles are not very well known. Therefore, only diurnal losses, based on US-EPA's methodology, are taken into account. That means that hot-soak, resting and running losses are not included.
The emissions are estimated using the formula:
E = N x HRS x EFeva (6)
The parameters N and HRS are identical to those used for the estimation of exhaust emissions. The emission factor EFeva needs to be tabled.
In principle, elements of the above described approach are used in many national studies and by industry (Utredning 1989, Achten 1990, Barry 1993, Puranen et al. 1992, Danish Environmental Protection Agency 1992, Caterpillar 1992, ICOMIA 1993).
3.4.2 Tier 3 emission factors
In the Tier 3 approach the machinery/vehicle population is split into different types, ages and power ranges. The detailed fuel consumption and emission information is to a large extent taken from the German TREMOD NRMM model (IFEU, 2004) and later updated in 2009 and 2014 (IFEU 2009, 2014).
Diesel Machinery Base EFs
For diesel engines, EFs are presented here for each of the following technology levels: < 1981, 1981–1990, 1991–Stage I, Stage I, II, IIIA, IIIB and IV. The EFs for each of these technology levels are divided into engine size classes which correspond to the engine size classifications made in the EU emission directives for NRMM.
Up to Stage II: The EFs for fuel consumption and NOx, VOC, CO and TSP emissions for technology levels up to and including Stage II are reported in the TREMOD NRMM model (IFEU 2004). These are based on measured data from a range of different studies and data suggested from literature reviews (Euromot 1995; BUWAL 1996; FAT 2002; KBA 2002).
Draft Not To Be Quoted51
1
2
34
5
678
9
101112131415
16
17
1819
202122
23
24252627
28
29303132
3334353637

Draft Not To Be Quoted
1.A.2.g viiMobile Combustion in manufacturing industries and construction
Stage IIIA Onwards: Currently no measurement data have been sourced that allow the determination of EFs for the technology levels Stages IIIA, IIIB, and IV and V. Consequently, EFs for these technology levels are estimated from the EU directive emission limits relevant for diesel NRMM and agricultural tractors. Table 3-14 below shows how the EFs have been derived from the corresponding emission limit values (IFEU, 2009).
Table 3-14 Derivation of EFs from Emission Limit Values for Technology Levels for Stages IIIA, IIIB, and IV and V Technology Levels.
Stage NOx VOC PM CO
Stage IIIA Limit value – 10 % Limit value – 40 %(90 % of the NOx+HC) Limit value – 10%
(10 % of the NOx+HC) Limit value – 10%
Stage IIIB Limit value – 10 % Limit value – 30 % Limit value Limit value – 40 %Stage IV Limit value Limit value – 30 % Limit value Limit value – 40 %
Stage V Limit value Limit value – 30 % Limit value Limit value – 40 %
Stage II EFs are used for CO, VOC and PM in the cases where the generic EFs exceed the Stage II EFs. For more explanation see IFEU (2009).
PM2.5 is assumed to be 94% of PM. N2O and NH3 EFs are unchanged from the EMEP/EEA Emissions Inventory Guidebook, 2013 Edition. CH4 is be assumed to be 2.4% of total VOC (IFEU, 2009).
In the TREMOD NRMM model, the 37-56 kW and 56-75 kW size classes are represented by one 37-75 kW size group. NOx emission factors for Stage IIIA, IIIB and IV are reported as 3.8, 3.4 and 2.1 g/kWh, respectively. Stage V emission factors have been determined using the same approach as those for Stage IV.
Draft Not To Be Quoted52
123456
78
910
111213
14151617
18

Draft Not To Be Quoted
1.A.2.g viiMobile Combustion in manufacturing industries and construction
Table 3-15 Baseline emission factors and fuel consumption (FC) for NRMM [g/kWh] A
Engine Power (kW)
Technology Level NOx VOC CH4 CO N2O NH3 PM PM2.5 FC
P<19 <1981 12 5 0.12 7 0.035 0.002 2.8 2.6 300P<19 1981-1990 11.5 3.8 0.09 6 0.035 0.002 2.3 2.2 285P<19 1991-Stage I 11.2 2.5 0.06 5 0.035 0.002 1.6 1.5 270P<19 Stage I 11.2 2.5 0.06 5 0.035 0.002 1.6 1.5 270P<19 Stage II 11.2 2.5 0.06 5 0.035 0.002 1.6 1.5 270P<19 Stage IIIA 11.2 2.5 0.06 5 0.035 0.002 1.6 1.5 270P<19 Stage IIIB 11.2 2.5 0.06 5 0.035 0.002 1.6 1.5 270P<19 Stage IV 11.2 2.5 0.06 5 0.035 0.002 1.6 1.5 270
P<19 Stage V 11.2 2.5 4.8 0.4 0.4 270
19<=P<37 <1981 18 2.5 0.06 6.5 0.035 0.002 2 1.9 30019<=P<37 1981-1990 18 2.2 0.05 5.5 0.035 0.002 1.4 1.3 28119<=P<37 1991-Stage I 9.8 1.8 0.04 4.5 0.035 0.002 1.4 1.3 26219<=P<37 Stage I 9.8 1.8 0.04 4.5 0.035 0.002 1.4 1.3 26219<=P<37 Stage II 6.5 0.6 0.01 2.2 0.035 0.002 0.4 0.4 26219<=P<37 Stage IIIA 6.08 0.6 0.01 2.2 0.035 0.002 0.4 0.4 26219<=P<37 Stage IIIB 6.08 0.6 0.01 2.2 0.035 0.002 0.4 0.4 26219<=P<37 Stage IV 6.08 0.6 0.01 2.2 0.035 0.002 0.4 0.4 262
19<=P<37 Stage V 6.08 0.6 2.2 0.015 0.014 262
37<=P<56 <1981 7.7 2.4 0.06 6 0.035 0.002 1.8 1.7 29037<=P<56 1981-1990 8.6 2 0.05 5.3 0.035 0.002 1.2 1.1 27537<=P<56 1991-Stage I 11.5 1.5 0.04 4.5 0.035 0.002 0.8 0.8 26037<=P<56 Stage I 7.7 0.6 0.01 2.2 0.035 0.002 0.4 0.4 26037<=P<56 Stage II 5.5 0.4 0.01 2.2 0.035 0.002 0.2 0.2 26037<=P<56 Stage IIIA 3.81 0.4 0.01 2.2 0.035 0.002 0.2 0.2 26037<=P<56 Stage IIIB 3.4 0.28 0.01 2.2 0.035 0.002 0.03 0.03 26037<=P<56 Stage IV 2.1 0.28 0.01 2.2 0.035 0.002 0.03 0.03 260
37<=P<56 Stage V 2.1 0.28 2.2 0.015 0.014 260
56<=P<75 <1981 7.7 2.4 0.06 6 0.035 0.002 1.8 1.7 29056<=P<75 1981-1990 8.6 2 0.05 5.3 0.035 0.002 1.2 1.1 27556<=P<75 1991-Stage I 11.5 1.5 0.04 4.5 0.035 0.002 0.8 0.8 26056<=P<75 Stage I 7.7 0.6 0.01 2.2 0.035 0.002 0.4 0.4 26056<=P<75 Stage II 5.5 0.4 0.01 2.2 0.035 0.002 0.2 0.2 26056<=P<75 Stage IIIA 3.81 0.4 0.01 2.2 0.035 0.002 0.2 0.2 26056<=P<75 Stage IIIB 3.4 0.28 0.01 2.2 0.035 0.002 0.03 0.03 26056<=P<75 Stage IV 2.1 0.28 0.01 2.2 0.035 0.002 0.03 0.03 260
56<=P<75 Stage V 2.1 0.28 2.2 0.015 0.014 260
75<=P<130 <1981 10.5 2 0.05 5 0.035 0.002 1.4 1.3 28075<=P<130 1981-1990 11.8 1.6 0.04 4.3 0.035 0.002 1 0.9 26875<=P<130 1991-Stage I 13.3 1.2 0.03 3.5 0.035 0.002 0.4 0.4 25575<=P<130 Stage I 8.1 0.4 0.01 1.5 0.035 0.002 0.2 0.2 25575<=P<130 Stage II 5.2 0.3 0.01 1.5 0.035 0.002 0.2 0.2 25575<=P<130 Stage IIIA 3.24 0.3 0.01 1.5 0.035 0.002 0.2 0.2 25575<=P<130 Stage IIIB 2.97 0.13 0.003 1.5 0.035 0.002 0.03 0.03 25575<=P<130 Stage IV 0.4 0.13 0.003 1.5 0.035 0.002 0.03 0.03 255
Draft Not To Be Quoted53
1
2

Draft Not To Be Quoted
1.A.2.g viiMobile Combustion in manufacturing industries and construction
Engine Power (kW)
Technology Level NOx VOC CH4 CO N2O NH3 PM PM2.5 FC
75<=P<130 Stage V 0.4 0.13 1.5 0.015 0.014 260
130<=P<560 <1981 17.8 1.5 0.04 2.5 0.035 0.002 0.9 0.8 270130<=P<560 1981-1990 12.4 1 0.02 2.5 0.035 0.002 0.8 0.8 260130<=P<560 1991-Stage I 11.2 0.5 0.01 2.5 0.035 0.002 0.4 0.4 250130<=P<560 Stage I 7.6 0.3 0.01 1.5 0.035 0.002 0.2 0.2 250130<=P<560 Stage II 5.2 0.3 0.01 1.5 0.035 0.002 0.1 0.1 250130<=P<560 Stage IIIA 3.24 0.3 0.01 1.5 0.035 0.002 0.1 0.1 250130<=P<560 Stage IIIB 1.8 0.13 0.003 1.5 0.035 0.002 0.03 0.03 250130<=P<560 Stage IV 0.4 0.13 0.003 1.5 0.035 0.002 0.03 0.03 250
130<=P<560 Stage V 0.4 0.13 1.5 0.015 0.014 250
P<560 Stage V 3.5 0.13 1.5 0.045 0.042 250
A Legislation relating to Stage V emission limit values has not yet been finalised. However proposed values have been included in this table for information.
Gasoline Machinery Base EFs
EFs for gasoline engines are resolved into 2-stroke and 4-stroke engines, for both hand held (SH) and not hand held (SN) equipment. The EFs are further grouped into the engine size classes (ccm) corresponding to the engine size classifications made in the EU emission directive 2002/88 for gasoline fuelled non-road machinery.
EFs and fuel consumption are available for each of the following technology levels: < 1981, 1981–1990, 1991–Stage I, Stage I and Stage II. The EFs for fuel consumption and NOx, VOC, CO and TSP (2-stroke only) emissions are provided by IFEU (2004). They are based on expert judgement, taking into account specific measurement data, type approval values, and estimated emission increases for the engines originating from 1990 and earlier (see IFEU, 2004).
4-stroke TSP emission factors in TREMOD NRMM come from the USEPA (USEPA, 1999). N2O and NH3 EFs are unchanged from the 2013 version of the EMEP/EEA Emissions Inventory Guidebook. CH4 is assumed to be 7.0 % and 3.4 % of VOC for 2-stroke and 4-stroke engines respectively (IFEU, 2009).
Table 3-16 Emission factors and fuel consumption (FC) for gasoline 2 stroke non road engines (g/kWh)
Engine Size code Size class Technology Level NOx VOC CO N2O NH3 TSP FC2-stroke SH2 20<=S<50 <1981 1 305 695 0.002 0.010 7 8822-stroke SH2 20<=S<50 1981-1990 1 300 579 0.002 0.010 5.3 8092-stroke SH2 20<=S<50 1991-Stage I 1.1 203 463 0.002 0.010 3.5 7352-stroke SH2 20<=S<50 Stage I 1.5 188 379 0.002 0.010 3.5 7202-stroke SH2 20<=S<50 Stage II 1.5 44 379 0.002 0.010 3.5 5002-stroke SH3 S>=50 <1981 1.1 189 510 0.002 0.010 3.6 6652-stroke SH3 S>=50 1981-1990 1.1 158 425 0.002 0.010 2.7 6092-stroke SH3 S>=50 1991-Stage I 1.2 126 340 0.002 0.010 1.8 5542-stroke SH3 S>=50 Stage I 2 126 340 0.002 0.010 1.8 529
Draft Not To Be Quoted54
12
3
4
5678
91011121314
15161718
1920
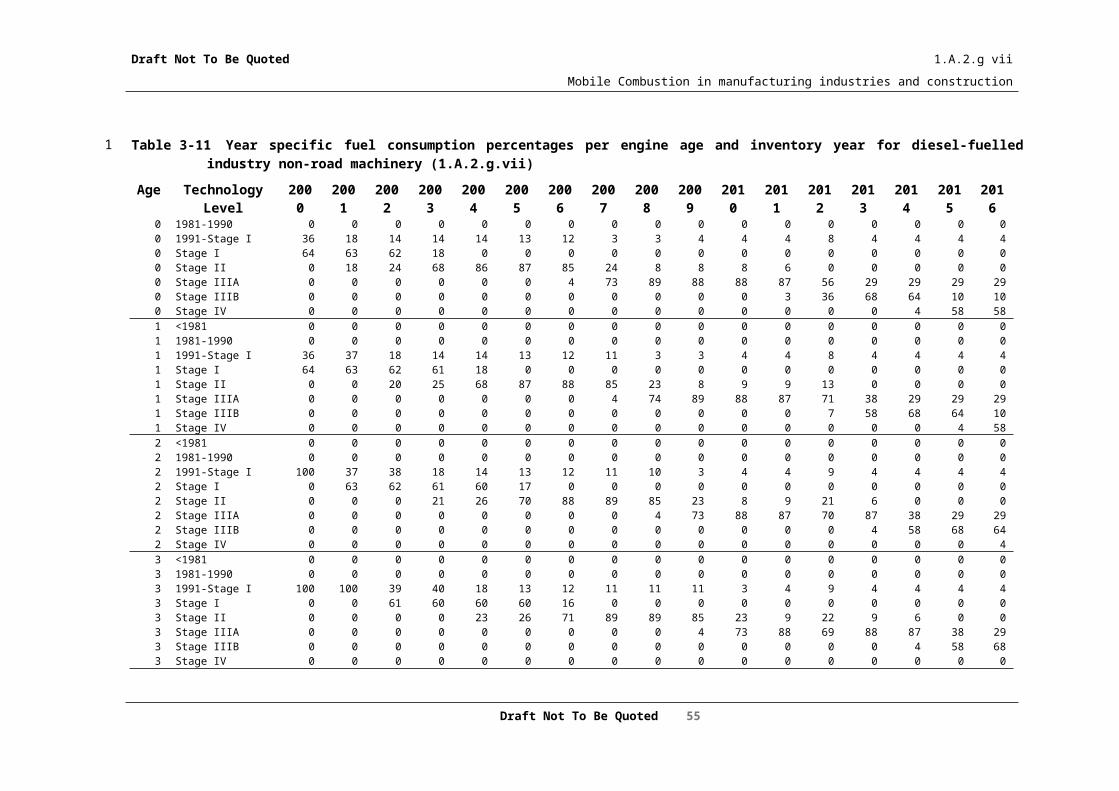
Draft Not To Be Quoted
1.A.2.g viiMobile Combustion in manufacturing industries and construction
Engine Size code Size class Technology Level NOx VOC CO N2O NH3 TSP FC2-stroke SH3 S>=50 Stage II 1.2 64 340 0.002 0.010 1.8 5002-stroke SN1 S<66 <1981 0.5 155 418 0.002 0.010 2.6 6522-stroke SN1 S<66 1981-1990 0.5 155 418 0.002 0.010 2.6 6522-stroke SN1 S<66 1991-Stage I 0.5 155 418 0.002 0.010 2.6 6522-stroke SN1 S<66 Stage I 0.5 155 418 0.002 0.010 2.6 6522-stroke SN1 S<66 Stage II 0.5 155 418 0.002 0.010 2.6 6522-stroke SN2 66<=S<100 <1981 0.5 155 418 0.002 0.010 2.6 6522-stroke SN2 66<=S<100 1981-1990 0.5 155 418 0.002 0.010 2.6 6522-stroke SN2 66<=S<100 1991-Stage I 0.5 155 418 0.002 0.010 2.6 6522-stroke SN2 66<=S<100 Stage I 0.5 155 418 0.002 0.010 2.6 6522-stroke SN2 66<=S<100 Stage II 0.5 155 418 0.002 0.010 2.6 6522-stroke SN3 100<=S<225 <1981 0.5 155 418 0.002 0.010 2.6 6522-stroke SN3 100<=S<225 1981-1990 0.5 155 418 0.002 0.010 2.6 6522-stroke SN3 100<=S<225 1991-Stage I 0.5 155 418 0.002 0.010 2.6 6522-stroke SN3 100<=S<225 Stage I 0.5 155 418 0.002 0.010 2.6 6522-stroke SN3 100<=S<225 Stage II 0.5 155 418 0.002 0.010 2.6 6522-stroke SN4 S>=225 <1981 0.5 155 418 0.002 0.010 2.6 6522-stroke SN4 S>=225 1981-1990 0.5 155 418 0.002 0.010 2.6 6522-stroke SN4 S>=225 1991-Stage I 0.5 155 418 0.002 0.010 2.6 6522-stroke SN4 S>=225 Stage I 0.5 155 418 0.002 0.010 2.6 6522-stroke SN4 S>=225 Stage II 0.5 155 418 0.002 0.010 2.6 652
Table 3-17 Emission factors and fuel consumption (FC) for gasoline 4 stroke non road engines (g/kWh)
Engine Size code Size classe Technology Level NOx VOC CO N2O NH3 TSP FC4-stroke SH2 20<=S<50 <1981 2.4 33 198 0.002 0.03 0.09 4964-stroke SH2 20<=S<50 1981-1990 3.5 27.5 165 0.002 0.03 0.08 4744-stroke SH2 20<=S<50 1991-Stage I 4.7 22 132 0.002 0.03 0.06 4514-stroke SH2 20<=S<50 Stage I 4.7 22 132 0.002 0.03 0.06 4064-stroke SH2 20<=S<50 Stage II 4.7 22 132 0.002 0.03 0.06 4064-stroke SH3 S>=50 <1981 2.4 33 198 0.002 0.03 0.09 4964-stroke SH3 S>=50 1981-1990 3.5 27.5 165 0.002 0.03 0.08 4744-stroke SH3 S>=50 1991-Stage I 4.7 22 132 0.002 0.03 0.06 4514-stroke SH3 S>=50 Stage I 4.7 22 132 0.002 0.03 0.06 4064-stroke SH3 S>=50 Stage II 4.7 22 132 0.002 0.03 0.06 4064-stroke SN1 S<66 <1981 1.2 26.9 822 0.002 0.03 0.09 6034-stroke SN1 S<66 1981-1990 1.8 22.5 685 0.002 0.03 0.08 6034-stroke SN1 S<66 1991-Stage I 2.4 18 548 0.002 0.03 0.06 6034-stroke SN1 S<66 Stage I 4.3 16.1 411 0.002 0.03 0.06 4754-stroke SN1 S<66 Stage II 4.3 16.1 411 0.002 0.03 0.06 4754-stroke SN2 66<=S<100 <1981 2.3 10.5 822 0.002 0.03 0.09 6274-stroke SN2 66<=S<100 1981-1990 3.5 8.7 685 0.002 0.03 0.08 5994-stroke SN2 66<=S<100 1991-Stage I 4.7 7 548 0.002 0.03 0.06 5704-stroke SN2 66<=S<100 Stage I 4.7 7 467 0.002 0.03 0.06 4504-stroke SN2 66<=S<100 Stage II 4.7 7 467 0.002 0.03 0.06 4504-stroke SN3 100<=S<225 <1981 2.6 19.1 525 0.002 0.03 0.09 6014-stroke SN3 100<=S<225 1981-1990 3.8 15.9 438 0.002 0.03 0.08 573
Draft Not To Be Quoted55
12

Draft Not To Be Quoted
1.A.2.g viiMobile Combustion in manufacturing industries and construction
4-stroke SN3 100<=S<225 1991-Stage I 5.1 12.7 350 0.002 0.03 0.06 5464-stroke SN3 100<=S<225 Stage I 5.1 11.6 350 0.002 0.03 0.06 5464-stroke SN3 100<=S<225 Stage II 5.1 9.4 350 0.002 0.03 0.06 5464-stroke SN4 S>=225 <1981 1.3 11.1 657 0.002 0.03 0.09 5394-stroke SN4 S>=225 1981-1990 2 9.3 548 0.002 0.03 0.08 5144-stroke SN4 S>=225 1991-Stage I 2.6 7.4 438 0.002 0.03 0.06 4904-stroke SN4 S>=225 Stage I 2.6 7.4 438 0.002 0.03 0.06 4904-stroke SN4 S>=225 Stage II 2.6 7.4 438 0.002 0.03 0.06 490
LPG Machinery Base EFsFuel use and EFs for CO, VOC and NOx are taken from IFEU (2004), based on measurements from Miersch (1999). The TSP EF is from work undertaken by TNO (CEPMEIP, 2001). The CH4 percentage share of total VOC is 5 % (USEPA, 2004). Due to lack of data, no distinction is made between technology levels.
Table 3-18 Emission factors and fuel consumption (FC) for LPG non road engines (g/kWh)
NOx VOC CO NH3 N2O TSP FC19 2.2 1.5 0.003 0.05 0.07 311
Recreational Craft Base EFsRecreational craft are treated separately to other machinery types.
For newer engines complying with the EU Directive 2003/44 emission limits, the emission factors for CO, VOC, NOx and TSP are estimated as 80 % of the relevant emission legislation value (IFEU, 2004). However, if the EF calculated using this approach exceeds the EF for “conventional craft” (i.e. the EF prior to the introduction of controls) then the latter value is used.
The EU Directive 2003/44 comprises the emission legislation limits for diesel engines, 2-stroke gasoline engines, and 4-stroke gasoline engines. For NOx, a constant limit value is given for each of the three engine types. For TSP, the constant emission limit regards diesel engines only. The emission limits for CO and VOC are more complex, depending on engine size (kW) and parameters presented in the Directive 2003/44.
Table 3-19 below shows the technology specific fuel consumption and base emission factors for recreational craft for appropriate engine size categories used in the TREMOD NRMM model.
Table 3-19 Emission factors (g/kW hr) and fuel consumption (FC) for conventional and 2003/44 directive engines used by pleasure craft
VOC CO NOx TSP FC2-Stroke outboard engines (conventional)0 - 3 kW 341 532 4 10 7913 - 12 kW 257 427 2 10 791> 12 kW 172 374 3 10 791
Draft Not To Be Quoted56
1
2345
6
7
8
9
1011121314
1516171819
202122
2324

Draft Not To Be Quoted
1.A.2.g viiMobile Combustion in manufacturing industries and construction
VOC CO NOx TSP FC2-Stroke outboard engines (Directive 2003/44)0 - 3 kW 83 440 4 10 7913 - 12 kW 42 184 2 10 791> 12 kW 30 134 3 10 7914-Stroke outboard engines (conventional)0 - 3 kW 121 585 5 0.08 4263 - 12 kW 24 520 7 0.08 426> 12 kW 14 390 10 0.08 4264-Stroke outboard engines (Directive 2003/44)0 - 3 kW 34 440 5 0.08 4263 - 12 kW 14 184 7 0.08 426> 12 kW 8 134 10 0.08 4264-Stroke inboard engines (conventional)75 - 130 kW 10 346 12 0.08 4264-Stroke inboard engines (Directive 2003/44)75 - 130 kW 6 125 12 0.08 426Diesel inboard engines (conventional)< 15 kW 3.8 6 11.5 2.3 28515 - 50 kW 2.2 5.5 18 1.4 281> 50 kW 2 5.3 8.6 1.2 275Diesel inboard engines (Directive 2003/44)< 15 kW 1.7 4 7.8 0.8 28515 - 50 kW 1.5 4 7.8 0.8 281> 50 kW 1.3 4 7.8 0.8 275
Deterioration Factor AdjustmentsEngines wear with use. As a result, EFs for NRMM increase with time i.e. as the age of the machinery increases. It is therefore necessary to incorporate a deterioration adjustment into the emissions calculations.
The deterioration factor adjustment for a given machinery type at a given time depends on the engine-size class (only for gasoline), the emission level and the average engine life time. For diesel and gasoline 2-stroke engines the deterioration factor adjustment is generally expressed as
DF= KLT
⋅DF y , z (18)
where DF is the deterioration factor adjustment,
K is the engine age (between 0 and average life time)
LT is the average lifetime
Draft Not To Be Quoted57
1
23456789
10
11
12
13

Draft Not To Be Quoted
1.A.2.g viiMobile Combustion in manufacturing industries and construction
y is the engine-size class, and
z is the technology level.
For gasoline 4-stroke engines the deterioration factor is calculated as:
DF=√ KLT
⋅DF y , z (19)
No deterioration is assumed for fuel consumption (all fuel types) or for LPG engine emissions and, hence, DF = 1 in these situations.
As an example from Table 3-16, the TSP emissions from a diesel engine becomes 47.3 % higher as the engine age reach average life time compared to the emissions from the engine as new. Reversely the NOx emissions from 2-stroke SN1 engines decrease by 60 % compared to new engines when average engine life time is reached (Table 3-17).
Deterioration factors are shown in Table 3-20 to Table 3-22 below (IFEFU, 2004) for: diesel engines, gasoline 2-stroke and gasoline 4-stroke engines, respectively. The values express DFy,z i.e. the ratio representing the maximum emission increase for any specific type of equipment and technology level.
As an example from Table 3-16, the TSP emissions from a diesel engine becomes 47.3 % higher as the engine age reach average life time compared to the emissions from the engine as new. Reversely the NOx emissions from 2-stroke SN1 engines up to Stage I decrease by 60 % compared to new engines when average engine life time is reached (Table 3-17). For newer engines, the NOx emissions decrease by 33% when the average engine life time is reached.
As explained in Equation 18, for diesel and gasoline 2-stroke engines younger than average engine life time a linear interpolation is made between zero and the maximum deterioration factor. For engines older than average engine life time the maximum deterioration factor is used.
Table 3-20 Deterioration factors for diesel machinery relative to average engine life time
Emission Level NOx VOC CO TSPBefore Stage I 0.024 0.047 0.185 0.473Stage I 0.024 0.036 0.101 0.473Stage II 0.009 0.034 0.101 0.473Stage IIIA, IIIB, IV 0.008 0.027 0.151 0.473
Table 3-21 Deterioration adjustment factors for gasoline 2-stroke engines relative to average engine life time
Engine Size code Size classe Technology Level NOx VOC CO TSP2-stroke SH1 S<20 <1981 0 0.2 0.2 0
Draft Not To Be Quoted58
1
2
3
4
56
789
10
11121314
1516171819
20
21222324
25
26
2728

Draft Not To Be Quoted
1.A.2.g viiMobile Combustion in manufacturing industries and construction
Engine Size code Size classe Technology Level NOx VOC CO TSP2-stroke SH1 S<20 1981-1990 0 0.2 0.2 02-stroke SH1 S<20 1991-Stage I 0 0.2 0.2 02-stroke SH1 S<20 Stage I 0 0.24 0.24 02-stroke SH1 S<20 Stage II 0 0.24 0.24 02-stroke SH2 20<=S<50 <1981 0 0.2 0.2 02-stroke SH2 20<=S<50 1981-1990 0 0.2 0.2 02-stroke SH2 20<=S<50 1991-Stage I 0 0.2 0.2 02-stroke SH2 20<=S<50 Stage I 0 0.29 0.24 02-stroke SH2 20<=S<50 Stage II 0 0.29 0.24 02-stroke SH3 S>=50 <1981 -0.031 0.2 0.2 02-stroke SH3 S>=50 1981-1990 -0.031 0.2 0.2 02-stroke SH3 S>=50 1991-Stage I -0.031 0.2 0.2 02-stroke SH3 S>=50 Stage I 0 0.266 0.231 02-stroke SH3 S>=50 Stage II 0 0.266 0.231 02-stroke SN1 S<66 <1981 -0.6 0.201 0.9 1.12-stroke SN1 S<66 1981-1990 -0.6 0.201 0.9 1.12-stroke SN1 S<66 1991-Stage I -0.6 0.201 0.9 1.12-stroke SN1 S<66 Stage I -0.33 0.266 1.109 5.1032-stroke SN1 S<66 Stage II -0.33 0 1.109 5.1032-stroke SN2 66<=S<100 <1981 -0.6 0.201 0.9 1.12-stroke SN2 66<=S<100 1981-1990 -0.6 0.201 0.9 1.12-stroke SN2 66<=S<100 1991-Stage I -0.6 0.201 0.9 1.12-stroke SN2 66<=S<100 Stage I -0.33 0.266 1.109 5.1032-stroke SN2 66<=S<100 Stage II -0.33 0 1.109 5.1032-stroke SN3 100<=S<225 <1981 -0.6 0.201 0.9 1.12-stroke SN3 100<=S<225 1981-1990 -0.6 0.201 0.9 1.12-stroke SN3 100<=S<225 1991-Stage I -0.6 0.201 0.9 1.12-stroke SN3 100<=S<225 Stage I -0.33 0.266 1.109 5.1032-stroke SN3 100<=S<225 Stage II -0.33 0 1.109 5.1032-stroke SN4 S>=225 <1981 -0.6 0.201 0.9 1.12-stroke SN4 S>=225 1981-1990 -0.6 0.201 0.9 1.12-stroke SN4 S>=225 1991-Stage I -0.6 0.201 0.9 1.12-stroke SN4 S>=225 Stage I -0.274 0 0.887 1.9352-stroke SN4 S>=225 Stage II -0.274 0 0.887 1.935
As explained in Equation 19, for gasoline 4-stroke engines younger than average engine life time the square root of a linear interpolation is made between zero and the maximum deterioration factor. For engines older than average engine life time the maximum deterioration factor is used.
Table 3-22 Deterioration adjustment factors for gasoline 4-stroke engines relative to average engine life time
Engine Size code Size classe Emission Level NOx VOC CO TSP4-stroke SN1 S<66 <1981 -0.6 1.1 0.9 1.1
Draft Not To Be Quoted59
1
2345
6
78

Draft Not To Be Quoted
1.A.2.g viiMobile Combustion in manufacturing industries and construction
Engine Size code Size classe Emission Level NOx VOC CO TSP4-stroke SN1 S<66 1981-1990 -0.6 1.1 0.9 1.14-stroke SN1 S<66 1991-Stage I -0.6 1.1 0.9 1.14-stroke SN1 S<66 Stage I -0.3 1.753 1.051 1.7534-stroke SN1 S<66 Stage II -0.3 1.753 1.051 1.7534-stroke SN2 66<=S<100 <1981 -0.6 1.1 0.9 1.14-stroke SN2 66<=S<100 1981-1990 -0.6 1.1 0.9 1.14-stroke SN2 66<=S<100 1991-Stage I -0.6 1.1 0.9 1.14-stroke SN2 66<=S<100 Stage I -0.3 1.753 1.051 1.7534-stroke SN2 66<=S<100 Stage II -0.3 1.753 1.051 1.7534-stroke SN3 100<=S<225 <1981 -0.6 1.1 0.9 1.14-stroke SN3 100<=S<225 1981-1990 -0.6 1.1 0.9 1.14-stroke SN3 100<=S<225 1991-Stage I -0.6 1.1 0.9 1.14-stroke SN3 100<=S<225 Stage I -0.3 1.753 1.051 1.7534-stroke SN3 100<=S<225 Stage II -0.3 1.753 1.051 1.7534-stroke SN4 S>=225 <1981 -0.6 1.1 0.9 1.14-stroke SN4 S>=225 1981-1990 -0.6 1.1 0.9 1.14-stroke SN4 S>=225 1991-Stage I -0.6 1.1 0.9 1.14-stroke SN4 S>=225 Stage I -0.599 1.095 1.307 1.0954-stroke SN4 S>=225 Stage II -0.599 1.095 1.307 1.0954-stroke SH1 S<20 <1981 0 0 0 04-stroke SH1 S<20 1981-1990 0 0 0 04-stroke SH1 S<20 1991-Stage I 0 0 0 04-stroke SH1 S<20 Stage I 0 0 0 04-stroke SH1 S<20 Stage II 0 0 0 04-stroke SH2 20<=S<50 <1981 0 0 0 04-stroke SH2 20<=S<50 1981-1990 0 0 0 04-stroke SH2 20<=S<50 1991-Stage I 0 0 0 04-stroke SH2 20<=S<50 Stage I 0 0 0 04-stroke SH2 20<=S<50 Stage II 0 0 0 04-stroke SH3 S>=50 <1981 0 0 0 04-stroke SH3 S>=50 1981-1990 0 0 0 04-stroke SH3 S>=50 1991-Stage I 0 0 0 04-stroke SH3 S>=50 Stage I 0 0 0 04-stroke SH3 S>=50 Stage II 0 0 0 0
Draft Not To Be Quoted60
1

Draft Not To Be Quoted
1.A.2.g viiMobile Combustion in manufacturing industries and construction
Load Adjustment FactorsThe adjustment factors due to engines operating under different load factors are included below in Table 3-23 (IEFEU, 2014).6
Table 3-23 Transient operation adjustment factors for diesel engines
Technology Level Load Load factor NOx VOC CO TSP FCStage II and prior High >0.45 0.95 1.05 1.53 1.23 1.01Stage IIIA High >0.45 1.04 1.05 1.53 1.47 1.01Stage IIIB-IV High >0.45 1 1 1 1 1Stage II and prior Middle 0.25≤LF≤0.45 1.025 1.67 2.05 1.6 1.095Stage IIIA Middle 0.25≤ LF≤0.45 1.125 1.67 2.05 1.92 1.095Stage IIIB-IV Middle 0.25≤ LF≤0.45 1 1 1 1 1Stage II and prior Low <0.25 1.1 2.29 2.57 1.97 1.18Stage IIIA Low <0.25 1.21 2.29 2.57 2.37 1.18Stage IIIB-IV Low <0.25 1 1 1 1 1
Evaporative Emissions
Gasoline engines emit NMVOC via evaporative losses. Emissions are dependent on the machinery type, and whether the engine is 2-stroke and 4-stroke. 2-stroke gasoline engines use motor gasoline, whereas 4-stroke engines use a mixture of motor gasoline and lubrication oil.Table 3-24 below presents EFs for evaporative emissions of NMVOC by machinery and engine type.
Table 3-24 NMVOC emission factors for evaporative losses in g/h
SNAP Code Vehicle/machinery type 2-STROKE GASOLINE
4-STROKE GASOLINE
0802 01 Shunting locomotives
02 Rail-cars
03 Locomotives
0803 01 Sailing boats with auxiliary engines 0.75
02 Motorboats/workboats 11.0 11.0
03 Personal watercraft 0.75
04 Inland goods carrying vessels
0806 01 Two-wheel tractors 0.30 0.30
02 Agricultural tractors
03 Harvesters/combiners
04 Others (sprayers, manure distributors, etc.) 0.3 0.30
0807 01 Professional chain saws/clearing saws 0.03
02 Forest tractors/harvesters/skidders
6 Information presented in IFEFEU 2014 is based on measurements for high and low engine loads from USEPA (2010) and supplementary emission information from TU Graz.
Draft Not To Be Quoted61
1
23
4
5
6
789
1011
12
12

Draft Not To Be Quoted
1.A.2.g viiMobile Combustion in manufacturing industries and construction
SNAP Code Vehicle/machinery type 2-STROKE GASOLINE
4-STROKE GASOLINE
03 Others (tree processors, haulers, forestry cultivators, etc.) 0.07
0808 01 Asphalt/concrete pavers
02 Plate compactors/tampers /rammers 0.11 0.12
03 Rollers
04 Trenchers/mini excavators
05 Excavators (wheel/crawler type)
06 Cement and mortar mixers 1.20
07 Cranes
08 Graders/scrapers
09 Off-highway trucks
10 Bulldozers (wheel/crawler type)
11 Tractors/loaders/backhoes
12 Skid steer tractors
13 Dumper/tenders 0.40
14 Aerial lifts 2.30
15 Forklifts 2.25
16 Generator sets 0.13 0.12
17 Pumps 0.10 0.09
18 Air/gas compressors
19 Welders
20 Refrigerating units
21 Other general industrial equipment (broomers, sweepers, etc.) 1.20 1.20
22 Other material handling equipment (conveyors, etc.)
23 Other construction work equipment (paving/surfacing, etc.) 1.20
0809 01 Trimmers/edgers/bush cutters 0.02
02 Lawn mowers 0.05 0.05
03 Hobby chain saws 0.01
04 Snowmobiles/skidoos 1.00 1.00
05 Other household and gardening equipment 0.05 0.05
06 Other household and gardening vehicles 0.10 0.10
Draft Not To Be Quoted62
1

Draft Not To Be Quoted
1.A.2.g viiMobile Combustion in manufacturing industries and construction
3.4.3 Tier 3 activity data
Many of the input data required for the application of this approach (e.g. the usage and the population data) are not part of general statistical yearbooks. Therefore, special investigations have to be carried out and reasonable estimates can be made, based on general technical experiences.
Data on the numbers of different machines and their age (technologies) can sometimes be obtained from sales statistics either from national statistical organisations or trade associations for suppliers or users of equipment.
Trade associations for suppliers or users of equipment can also provide data on the power ratings, usage (time in use) and load factors for these off-road machines.
In the absence of national data, data from the Danish inventory can be used to provide assumptions on annual hours of use and fractions of different, engine size, ages and types of machines in use for different NFR codes as well as assumptions on load factors (Winther & Nielsen, 2006).
In the absence of country- specific load factors for the different categories any number of different typical load factors (LF) can be applied. Weightings for time in mode for Diesel and gasoline (> 20 kW) powered off-road industrial equipment (Cycle C), Generators and mobile power plant (Cycle D) and Utility, lawn and garden, typically < 20 kW (Cycle G), laid down in ISO DP 8178, and presented in Table 3-25 can be used. Weightings for time in mode for automotive, vehicle applications such as forestry and agricultural tractors can be taken from Table 3-26. However, it needs to be appreciated that the ISO DP 8178 standard, and the cycles for road vehicles, do change with time. For example, heavy-duty on-road vehicles are now tested to a different 13-mode cycle, and using a 30-minute duration transient cycle (the European Transient Cycle, ETC). It is proposed to add a new transient cycle (ISO 8178-11) to the suite of cycles for non-road mobile machinery. A full description of the Cycle classes A–G is provided in Table 3-27.
Draft Not To Be Quoted63
1
2345
678
910
11121314
151617181920212223242526

Draft Not To Be Quoted
1.A.2.g viiMobile Combustion in manufacturing industries and construction
Table 3-25 Test points and weighting factors of ISO DP 8178 test cycles (7)
B-type mode number 1 2 3 4 5 6 7 8 9 10 11
Torque 100 75 50 25 10 100 75 50 25 10 0
Speed rated speed intermediate speed low idle
Off-road vehicles
Type C1 0.15 0.15 0.15 0.1 0.1 0.1 0.1 0.15
Type C2 0.06 0.02 0.05 0.32 0.30 0.10 0.15
Constant speed
Type D1 0.3 0.5 0.2
Type D2 0.05 0.25 0.3 0.3 0.1
Locomotives (8)
Type F 0.25 0.15 0.6
Utility, lawn and garden
Type G1 0.09 0.2 0.29 0.3 0.07 0.05
Type G2 0.09 0.2 0.29 0.3 0.07 0.05
Type G3 0.9 0.1
Marine application
Type E1 0.060.08
0.11 0.19 0.32 0.3
Type E2 0.2 0.5 0.15 0.15
Marine application propeller law
Mode number E3 1 2 3 4
Power % of rated power 100 75 50 25
Speed % of rated speed 100 91 80 63
Weighting factor 0.2 0.5 0.15 0.15
Mode number E4 1 2 3 4 5
Speed % of rated speed 100 80 60 40 idle
Torque % of rated torque 100 71.6 46.5 25.3 0
Weighting factor 0.06 0.14 0.15 0.25 0.4
Mode number E5 1 2 3 4 5
Power % of rated p. 100 75 50 25 0
Speed % of rated speed 100 91 80 63 idle
Weighting factor 0.08 0.13 0.17 0.32 0.3
7() Values in table checked against currently used version of ISO DP 8178, as given by table at web address http://www.dieselnet.com/standards/cycles/iso8178.html The changes made in first table are corrections to errors rather than the adoption of a new test matrix.8() These conditions are up to date — see for example definition given in 1a(v). of Annex 1 (page 8 of PDF file) using test cycle defined in Specification B, para 3.7.1.2 of Annex 2, p. 19 of PDF file.
Draft Not To Be Quoted64
1
12345

Draft Not To Be Quoted
1.A.2.g viiMobile Combustion in manufacturing industries and construction
Table 3-26 Test cycle A (13 — mode cycle) used after July 2000 (9)
Mode number cycle A 1 2 3 4 5 6 7 8 9 10 11 12 13
Speed Low idle speed
A B B A A A B B C C C C
% Torque 0 100 50 75 50 75 25 100 25 100 25 75 50
Weighting factor 0.15 0.08 0.10 0.10 0.05 0.05 0.05 0.09 0.10 0.08 0.05 0.05 0.05
Table 3-27 Test cycles of ISO DP 8178 for industrial engine applications with typical examples
Cycle A Automotive, vehicle applicationsExamples: forestry and agricultural tractors, diesel and gas engines for on-road
applications
Cycle B Universal
Cycle C Off-road vehicles and industrial equipmentC1: diesel-powered off-road industrial equipmentExamples: industrial drilling rigs, compressors, etc.; construction equipment
including wheel loaders, bulldozers, crawler tractors, crawler loaders, truck-type loaders, off-highway trucks, etc.; agricultural equipment, rotary tillers; forestry equipment; self propelled agricultural vehicles; material handling equipment; fork lift trucks; hydraulic excavators; road maintenance equipment (motor graders, road rollers, asphalt finishers); snow plough equipment; airport supporting equipment; aerial lifts
C2: off-road vehicles with spark-ignited industrial engines > 20 kWExamples: fork lift trucks; airport supporting equipment; material handling
equipment; road maintenance equipment; agricultural equipment
Cycle D Constant speedD1: power plantsD2: generating sets with intermittent loadExamples: gas compressors, refrigerating units, welding sets, generating sets
on board of ships and trains, chippers, sweepersD3: generating sets onboard ships (not for propulsion)
Cycle E Marine applicationsE1: diesel engines for craft less than 24-m length (derived from test
cycle B)E2: heavy-duty constant speed engines for ship propulsionE3: heavy-duty marine enginesE4: pleasure craft spark-ignited engines for craft less than 24-m lengthE5: diesel engines for craft less than 24 m length (propeller law)
Cycle F Rail traction
Examples: locomotive, rail cars
9() Engine speed A < B < C. For their definitions see EC Directive 1999/96/EC Appendix 1 of Annex III.
Draft Not To Be Quoted65
1
2
345
6
789
10111213141516171819
202122232425
26272829303132
33
3435
1

Draft Not To Be Quoted
1.A.2.g viiMobile Combustion in manufacturing industries and construction
Cycle G Utility, lawn and garden, typically < 20 kWG1: non-handheld intermediate speed applicationExamples: walk behind rotary or cylinder lawn mowers, front or rear engine
riding lawn mowers, rotary tillers, edge trimmers, lawn sweepers, waste disposers, sprayers, snow removal equipment, golf carts
G2: non-handheld rated speed applicationExamples: portable generators, pumps, welders, air compressors; rated speed
application may also include lawn and garden equipment which operates at engine rated speed
G3: handheld rated speed applicationsExamples: edge trimmers, string trimmers, blowers, vacuums, chain saws,
portable saw mills
3.5 SpeciationTable 3-28, Table 3-29 and Table 3-30 provide information as used by Veldt et al. (1993), Derwent, and Loibl et al. (1993) in their work on emission estimates for the road transport sector.
Table 3-28 Composition of VOC emission of motor vehicles (data as provided by Veldt et al.)A) Non-methane VOCs (composition in weight % of exhaust)
Species or group of species Exhaust four stroke (conventional)
Gasoline engine 3-way catalyst
equipped
Evaporation Diesel LPG
Ethane 1.4 1.8 1 3Propane 0.1 1 1 1 44n-Butane 3.1 5.5 20 2i-Butane 1.2 1.5 10n-Pentane 2.1 3.2 15 2i-Pentane 4.3 7 25Hexane 7.1 6 15Heptane 4.6 5 2Octane 7.9 7Nonane 2.3 2Alkanes C> 10 0.9 3 30 (1)
Ethylene 7.2 7 12 15Acetylene 4.5 4.5 4 22Propylene 3.8 2.5 3 10Propadiene 0.2Methylacetylene 0.3 0.21-Butene 1.7 1.5 1 )1,3 Butadiene 0.8 0.5 ) 22-Butene 0.6 0.5 2 )1-Pentene 0.7 0.5 22-Pentene 1.1 1 3 11-Hexene 0.6 0.4 )1,3 Hexene 0.6 0.4 ) 1.5Alkanes C> 7 0.3 0.2 ) 2 (1)
Benzene 4.5 3.5 1 2Toluene 12.0 7 1 1.5
Draft Not To Be Quoted66
123456789
101112
13
141516
1718

Draft Not To Be Quoted
1.A.2.g viiMobile Combustion in manufacturing industries and construction
Species or group of species Exhaust four stroke (conventional)
Gasoline engine 3-way catalyst
equipped
Evaporation Diesel LPG
o-Xylene 2.5 2 0.5M,p-Xylene 5.6 4 0.5 1.5Ethylbenzene 2.1 1.5 0.5Styrene 0.7 0.5 0.11,2,3-Trimethylbenzene 0.5 11,2,4-Trimethylbenzene 2.6 41,3,5-Trimethylbenzene 0.8 2Other aromatic compounds C9 3.8 3Aromatic compounds C> 10 4.5 6 20 (1)
Formaldehyde 1.7 1.1 6 4Acetaldehyde 0.3 0.5 2 2Other Aldehydes C4 0.3 0.2 1.5Acrolein 0.2 0.2 1.52-Butenal 1.0Benzaldehyde 0.4 0.3 0.5Acetone 0.1 1 1.5
100 100 100 100 100
(1) C13.
B) Methane (composition in weight % of exhaust)
Gasoline
— 2-strokeconventional 57% IFEU (2009)
— 4-stroke3-way catalyst equipped 3.412% IFEU (2009)
Diesel 2.44% IFEU (2009)
LPG 53% USEPA(2004)
.
Table 3-29 Composition of VOC-emissions (data as used by Derwent)
Percentage by mass speciation by source category, w/w %No Species petrol engine exhaust diesel exhaust petrol evaporation vehicles0 Methane 8.00 3.71 Ethane 1.30 0.5
2 Propane 1.20
3 n-butane 1.95 2.5 19.990
4 i-butane 0.93 2.5 10.480
5 n-pentane 2.78 2.5 7.220
6 i-pentane 4.45 2.5 10.150
7 n-hexane 1.76 2.5 2.020
8 2-methylpentane 2.14 2.5 3.020
9 3-methylpentane 1.49 2.5 2.010
Draft Not To Be Quoted67
1
2
3
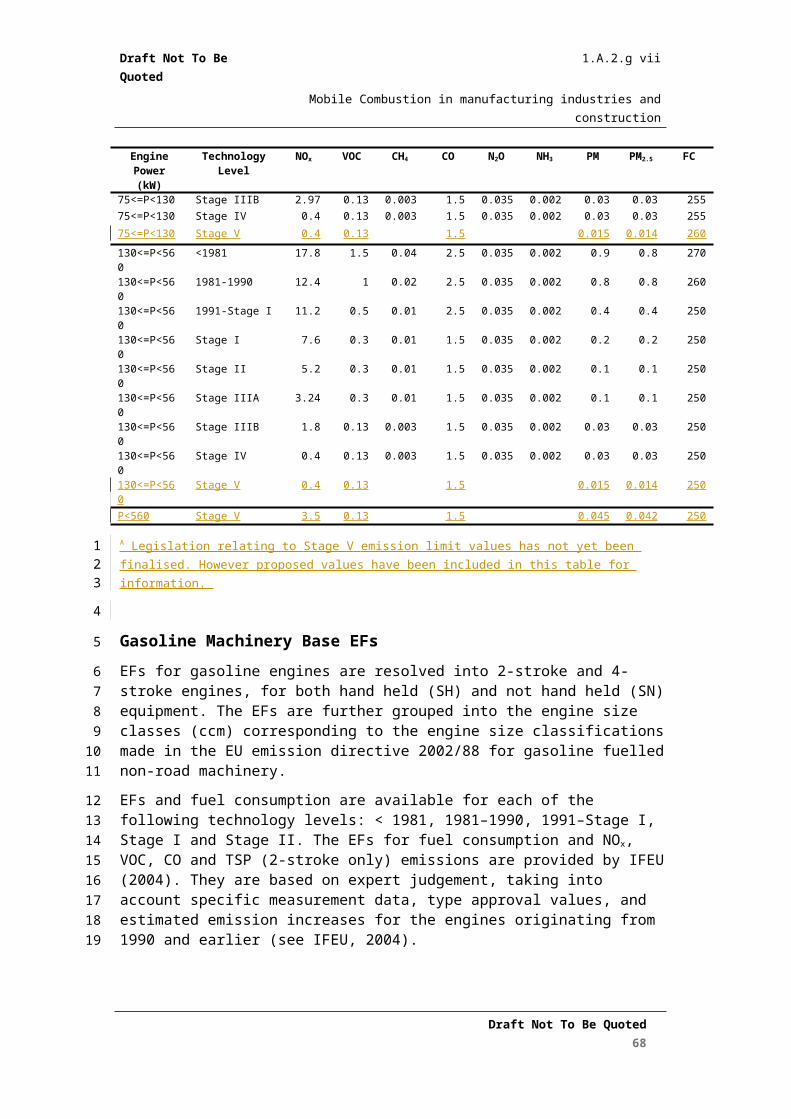
Draft Not To Be Quoted
1.A.2.g viiMobile Combustion in manufacturing industries and construction
Percentage by mass speciation by source category, w/w %No Species petrol engine exhaust diesel exhaust petrol evaporation vehicles10 2,2-dimethylbutane 0.28 2.5 0.600
11 2,3-dimethylbutane 0.54 2.5 0.740
12 n-heptane 0.74 2.5 0.703
13 2-methylhexane 1.39 2.5 0.924
14 3-methylhexane 1.11 2.5 0.932
15 n-octane 0.37 2.5 0.270
16 Methylheptanes 3.90 2.5 0.674
17 n-nonane 0.18 2.5
18 Methyloctanes 1.58 2.5
19 n-decane 0.37 2.5
20 Methylnonanes 0.84 2.5
21 n-undecane 2.75 2.5
22 n-duodecane 2.75 2.5
23 Ethylene 7.90 11.0
24 Propylene 3.60 3.4
25 1-butene 1.40 0.5 1.490
26 2-butene 0.50 2.550
27 2-pentene 0.90 2.350
28 1-pentene 0.70 0.7 0.490
29 2-methyl-1-butene 0.70 0.670
30 3-methyl-1-butene 0.70 0.5 0.67031 2-methyl-2-butene 1.40 0.5 1.310
32 Butylene 0.50
33 Acetylene 6.30 3.2
34 Benzene 3.20 2.6 2.340
35 Toluene 7.20 0.8 5.660
36 o-xylene 1.58 0.8 1.590
37 a-xylene 2.06 0.8 1.880
38 p-xylene 2.06 0.8 1.880
39 Ethylbenzene 1.20 0.8 1.320
40 n-propylbenzene 0.16 0.5 0.410
41 i-propylbenzene 0.13 0.5 0.120
42 1,2,3-trimethylbenzene 0.40 0.5 0.310
43 1,2,4-trimethylbenzene 1.60 0.5 1.600
44 1,3,5-trimethylbenzene 0.50 0.5 0.390
45 o-ethyltoluene 0.38 0.5 0.370
46 a-ethyltoluene 0.63 0.5 0.640
47 p-ethyltoluene 0.63 0.5 0.640
48 Formaldehyde 1.60 5.9
49 Acetaldehyde 0.35 1.0
50 Proprionaldehyde 0.57 1.0
51 Butyraldehyde 0.07 1.0
Draft Not To Be Quoted68

Draft Not To Be Quoted
1.A.2.g viiMobile Combustion in manufacturing industries and construction
Percentage by mass speciation by source category, w/w %No Species petrol engine exhaust diesel exhaust petrol evaporation vehicles52 i-butyraldehyde 1.0
53 Valeraldehyde 0.03
54 Benzaldehyde 0.39
55 Acetone 0.14 2.0
Table 3-30 Composition of VOC emissions from traffic and mobile sources (Loibl et al. 1993)
Exhaust — Exhaust Exhaust 2 stroke Diesel Evaporation
conventional —catalyst cold start engines engines
losses
cars cars (all cars)
Non-reactive
Ethane 2 3 1 1 - -
Acetylene 8 3 4 2 - -
Paraffins
Propane - - - 1 - 2
Higher paraffins 32 48 45 72 52 85
Olefins
Ethene 11 7 6 3 6 -
Propene 5 4 2 1 3 -
Higher olefins (C4+) 6 9 7 9 3 10
Aromatics
Benzene 5 1 4 2 - 1
Toluene 10 11 140 3 - 1
Higher aromatics (C8+) 21 6 21 6 12 1
Carbonyls
Formaldehyde - 8 - - 13 -
Acetaldehyde - - - - 3 -
Higher aldehydes (C3+) 4
Cetones 1
Other NMVOC
Draft Not To Be Quoted69
1
2
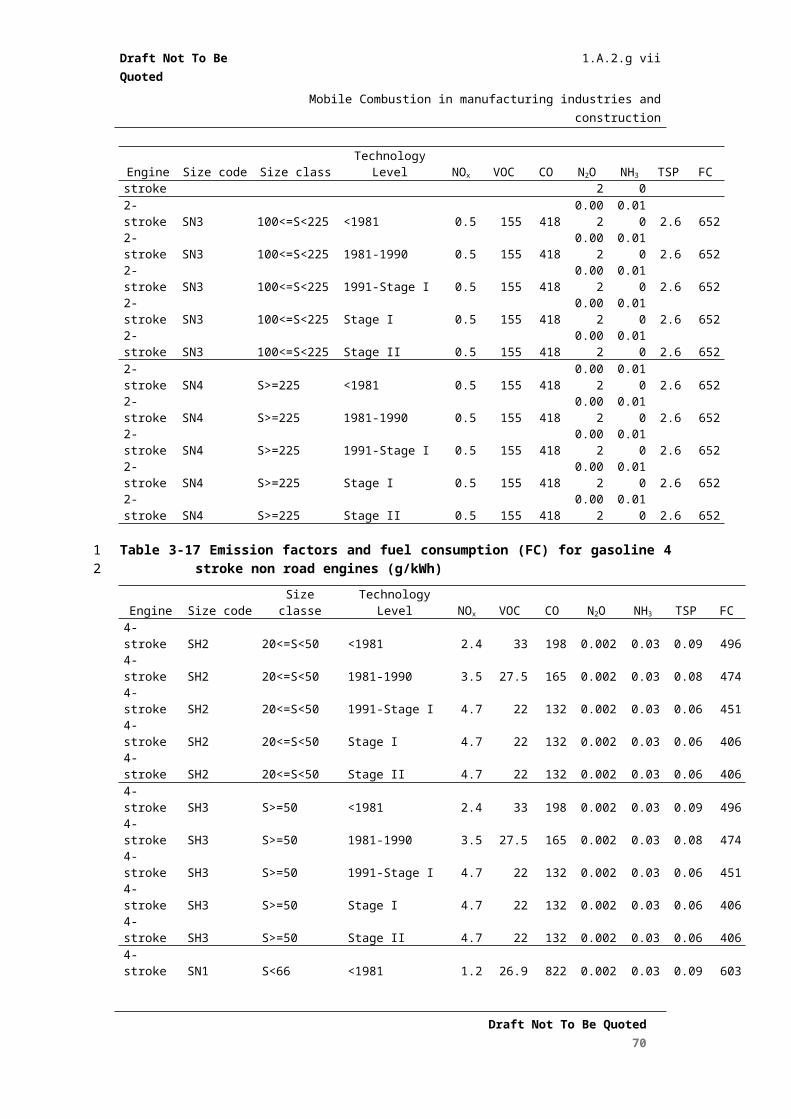
Draft Not To Be Quoted
1.A.2.g viiMobile Combustion in manufacturing industries and construction
Exhaust — Exhaust Exhaust 2 stroke Diesel Evaporation
conventional —catalyst cold start engines engines
losses
cars cars (all cars)
Alcohols, esters, ethers
Acids
Halogenated Compounds
Other/undefined 3
Draft Not To Be Quoted70

Draft Not To Be Quoted
1.A.2.g viiMobile Combustion in manufacturing industries and construction
4 Data quality
4.1 Inventory quality assurance/quality control QA/QCEstimation of the split of fuel consumption into the different technologies will require some assumptions about hours of use and age of vehicles. These assumptions still need to be transparent and should be cross- checked with industry experts (e.g. trade associations).
4.2 CompletenessFor the Tier 3 method the estimates should be cross checked with total fuel consumption data to ensure that the bottom up theoretical calculations based on power rating and hours of use are valid, and can account for the fuel consumption data in national statistics. In addition, Tier 3 requires suitable application of degradation factors to ensure that emissions are not underestimated for machinery in use (the emission factors given are for type approval and not for in-use vehicles).
4.3 Avoiding double counting with other sectorsThere is the possibility that some double accounting could occur if the total amounts of petrol and diesel used by a nation are assumed to be combusted in road transport. Much of the equipment considered in this chapter is likely to be fuelled from the same sources and therefore calculating and adding these emissions to the road transport emissions would double count the emissions from this fuel because of this non-road mobile machinery.
4.4 VerificationNational experts should check the overall fuel balance, e.g. whether the calculated fuel consumption corresponds to the statistical fuel consumption if such statistical information is available. Moreover, they should carefully evaluate whether there are good reasons to deviate from the default values given in this note and the computer programme.
A central team should compare the main input parameters used by countries in order to identify major deviations. In cases where the following boundaries are exceeded, national experts should be contacted to check the correctness of the values and to learn about the reasons for their choice.
A) Tier 1 and Tier 2 methodologies
The applied bulk emission factors for diesel, two-stroke gasoline, four-stroke gasoline, and LPG engines should not differ by more than 30 % for NOx and fuel consumption, more than 50 % for CO and NMVOC, and more than a factor of 2 for N2O, NH3, CH4 and diesel particulates from the all-country mean.
B) Tier 3 methodology
The applied emission factors for the individual sub-categories should not differ by more than 30 % for NOx and fuel consumption, more than 50 % for CO and NMVOC, and
Draft Not To Be Quoted71
1
2
345
6
789
101112
13
1415161718
19
20212223
24252627
28
29303132
33
3435

Draft Not To Be Quoted
1.A.2.g viiMobile Combustion in manufacturing industries and construction
more than a factor of 2 for N2O, NH3, CH4 and diesel particulates from the all-country mean.
The applied average annual working hours should not differ by more than 50 % from the all-country mean.
The applied average load factors should not differ by more than 25 % from the all-country mean.
The applied average power output should not differ by more than 25 % from the all-country mean.
National statistical offices should check calculated energy consumption data in the greatest possible detail, or make available appropriate data for cross-checking. The (calculated) fuel consumed by categories should be incorporated in or cross-checked with the total national fuel balance.
4.5 Developing a consistent time series and recalculationFor Tier 2 it is important to establish an understanding of the different age and technology types of machines so that the appropriate emission factors can be applied.
4.6 Uncertainty assessmentFor many subsectors, the estimation of emissions is still associated with quite large uncertainties due to the lack of information on vehicle and machinery population, emission factors, and conditions of use. Table 4-31 provides broad qualitative uncertainty estimates.
Table 4-31 Uncertainty estimates for input data required to apply the proposed methodologies
Sector Subsector Total fuel
consump-tion
Parameterunit fuel
consumption
Population
Loadfactor
Annual
hoursof use
Power
range
Emission factor for the pollutants 1) Agedistri-butio
n
Enginedesigndistribution
CO2 CO NMVOC
CH4 NOx N2ONH3 SO2 PM
Agriculture 02 Tractors D B A C D C B B B C B E E B B D D
03 Harvesters D B C D C B B B B C B E E B B D D
01/04 All others
D C E D D D E E E E E E E E E E E
Forestry 02 Tractors D B A C D C B B B C B E E B B D D
01/03 All others
D C E D D D E E E E E E E E E E E
Industry 01, 04, 05, 07 to 13, 15 (All types of construction equipment)
D B A C D C B B B C B E E B B D D
02, 03, 06, 14, 16 to 22
D C E D D D E E E E E E E E E E E
Military All E E E E E E E E E E E E E E E E E
Draft Not To Be Quoted72
12
34
56
78
9101112
13
1415
16
171819
20

Draft Not To Be Quoted
1.A.2.g viiMobile Combustion in manufacturing industries and construction
Sector Subsector Total fuel
consump-tion
Parameterunit fuel
consumption
Population
Loadfactor
Annual
hoursof use
Power
range
Emission factor for the pollutants 1) Agedistri-butio
n
Enginedesigndistribution
CO2 CO NMVOC
CH4 NOx N2ONH3 SO2 PM
Household and gardening
All subsectors D C E D D D E E E E E E E E E E E
Note:1) As a rule, the emission factors to be used in the ‘simple methodology’ are one quality class worse.
Legend for Table 4-31
Emitting activity rates
Data quality A: very precise value, specifically known.
Data quality B: precise specific value.
Data quality C: approximate value, but sufficiently well estimated to be considered correctly representative.
Data quality D: approximate value, indicating good order of magnitude.
Data quality E: very approximate value, estimation of a possible order of magnitude.
Emission factors
Data quality A: data set based on a composite of several tests using analytical techniques and can be considered representative of the total population.
Data quality B: data set based on a composite of several tests using analytical techniques and can be considered representative of a large percentage of the total population.
Data quality C: data set based on a small number of tests using analytical techniques and can be considered reasonably representative of the total population.
Data quality D: data set based on a single source using analytical techniques or data set from a number of sources where data are based on engineering.
Data quality E: data set based on engineering calculations from one source; data set(s) based on engineering judgment; data set(s) with no documentation provided; may not be considered representative of the total population.
4.7 GriddingThe source categories covered by this chapter require to make use of somewhat different spatial allocation procedures:
agricultural, forestry and military emissions should be disaggregated using land use data;
industrial and household and gardening emissions should be disaggregated using general population density data;
inland waterways should be allocated to the appropriate inland water surfaces.
Draft Not To Be Quoted73
12
3
4
5
6
78
9
10
11
1213
1415
1617
1819
202122
23
2425
26
2728
29

Draft Not To Be Quoted
1.A.2.g viiMobile Combustion in manufacturing industries and construction
Within each of the sectors further refinement is possible. However, since total emissions decrease with every further split, it is questionable whether the additional efforts are justified.
4.8 Reporting and documentationEmissions for the categories in this chapter will need to be reported under a number of different NFR codes. Although agriculture and forestry have been split to help with the accuracy of calculations, these estimates will need to be combined for reporting.
4.9 Weakest aspects and priority areas for improvement in the current methodology
The Tier 3 methodologies proposed in this chapter generally require more input than is statistically available. Therefore, efforts should concentrate on data collection (actual fuel use in sectors and subsectors, machinery population, conditions of use). It would be very valuable to obtain in-use emission factors for this new equipment. (For road transport it was found that there were differences between on-road emissions and those predicted from new (Euro 3 and Euro III) regulations.)
Further typical information could be included to help derive appropriate Tier 2 and 3 activity data. Average data on % fuel consumption for different years and technologies could be provided.
Also, much equipment does use transient, rather than steady state cycles. The current methodology takes virtually no account of this, and consideration should be given to appropriately revising the methodology and including detailed in-use emission factors for machinery.
Draft Not To Be Quoted74
12
3
456
7
8
91011121314
151617
18192021

Draft Not To Be Quoted
1.A.2.g viiMobile Combustion in manufacturing industries and construction
5 Temporal disaggregation criteriaThere are no relevant reports available about the temporal disaggregation of emissions from the source categories covered. Therefore, only ‘common sense criteria’ can be applied. Table 5-32 provides a proposal for the ‘average’ European disaggregation of emissions. In practice, the temporal disaggregation might differ considerably among countries.
Table 5-32 Proposal of the average European temporal disaggregation of emissions. The figures indicate percentages of the disaggregation of total seasonal, weekly, and hourly emissions to seasons, days, and hours
Seasonal disaggregation (in %)
Sector Subsector Winter Spring Summer Fall
Agriculture All 10 20 50 20
Forestry All 10 20 50 20
Industry All 20 30 30 20
Military 20 30 30 20
Household and gardening all but 0404, snowmobiles
1090
405
300
205
Seasonal disaggregation (in %) Hourly disaggregation (%)
Sector Subsector M T W T F S S 6-12 12-18 18-24 24-6
Agriculture All 18 18 18 18 18 5 5 45 45 8 2
Forestry All 18 18 18 18 18 5 5 45 45 8 2
Industry All 19 19 19 19 19 2.5 2.5 50 45 4 1
Military 19 19 19 19 19 2.5 2.5 35 35 15 15
Household & Gardening
all but 0404, Snowmobiles
510
510
510
510
1010
3525
3525
3535
3535
44
11
Draft Not To Be Quoted75
1
2345
678
9
10
11

Draft Not To Be Quoted
1.A.2.g viiMobile Combustion in manufacturing industries and construction
6 GlossaryCC Cylinder Capacity of the engine
COPERT COmputer Programme to calculate Emissions from Road Transport
Corinair Corinair emission inventory
CORINE COoRdination INformation Environmentale
EIG Emission Inventory Guidebook
IPCC Intergovernmental Panel on Climate Change
NAPFUE Nomenclature of Fuels
NUTS Nomenclature of Territorial Units for Statistics (0 to III). According to the EC definition, NUTS level 0 is the complete territory of the individual Member States
SNAP Selected Nomenclature for Air Pollution
TU Territorial Unit
7 ReferencesAchten P.A.J. (1990). ‘The forgotten category — Energy consumption and air pollution by mobile machinery’, Innas BV, The Netherlands, 10.5.1990.
Bang J. (1991). ‘Reduksjon av VOC-utslipp fra totaksmotorer’, Tiltak 11.
Bang J. (1993). ‘Utslipp fra dieseldrevne anleggsmaskiner arbeidsredskaper, traktoreer og lokomotiver’, Utford pa oppdrag av Statens forurensningstilsyn, August 1993.
BUWAL 1996: Bundesamt für Umwelt, Wald und Landschaft: Schadstoffemissionen und Treibstoffverbrauch des Offroad-Sektors, Bern
Caterpillar (1992). ‘Determination of emissions from construction machinery in the EC’, letter to DG XI.
Commission of the European Communities (1977). Council Directive on the approximation of the Laws of the Member States relating to the measures to be taken against the emission of pollutants from diesel engines for use in wheeled agricultural or forestry tractors. Council Directive of June 1977.
Commission of the European Communities (1992). ‘Additional notes on completing Corinair ’90’. Draft of November 1992.
Corporate Intelligence Group (1992). ‘Construction, earthmoving, mining and industrial equipment in Europe – Equipment analysis: Agricultural tractors – UK’ Off-Highway Research Division, July 1992.
Danish Environmental Protection Agency (1992). ‘Emission inventory for off-road machinery’.
Draft Not To Be Quoted76
1
2
3

Draft Not To Be Quoted
1.A.2.g viiMobile Combustion in manufacturing industries and construction
Report EI/17, 26 November 1992.
Day D.A. (1973). ‘Construction equipment guide’, London: John Wiley & Sons, 1973.
Deutsche Landwirtschafts-Gesellschaft (DLG) (1990). Sammelbände mit Prüfberichten, Frankfurt am Main, Stand: September 1990.
Dore C. and Smith, H. (2015) Generating Indicators for Estimating NRMM Fuel Consumption. Continued Improvements of Inventory Methodologies, Chapter 2.2, EU Project Report 070201/2014/693666/FRA/ENV.C.3
Eggleston S., D. Gaudioso, N. Gorißen, R. Joumard, R.C. Rijkeboer, Z. Samaras and K.-H. Zierock (1993). ‘Corinair working group on emission factors for calculating 1990 emission from road traffic – Volume 1: methodology and emission factors’. Final report. Document of the European Commission ISBN 92-826-5571-X.
EUROMOT (1992). ‘The environmental burden arising from diesel engines used in mobile and transportable equipment excluding on-highway vehicles’. Euromot working group, Exhaust emissions, publication 92/03, December 1992.
EUROMOT (1993). ‘Exhaust emission standards for RIC engines used in mobile and transportable application, Part 2 – Emissions correlation factors for the ISO 8178-4 duty cycles, Euromot working group, Exhaust emissions proposal 92/01, March 1993.
Euromot 1995: European Association of Internal Combustion engine Manufacturers, unpublished data material.
European Commission (1997). Directive 97/68/EC on the approximation of the laws of the Member States relating to the measures to be taken against the emission of gaseous and particulate pollutants from international combustion engines to be installed in non-road mobile machinery.
FAT 2002: Eidgenössische Forschungsanstalt für Agrarwirtschaft und Landtechnik: Leistungssteigerung am Traktormotor. 5/2002, Tänikon, Schweiz
Fontelle J.P.and J.P. Chang (1992). Corinair software instructions for use (Version 5.1), Citepa, September 1992.
Hauptverband der Deutschen Bauindustrie E.V. (1991). Baugeräteliste 1991 — Technisch-wirtschaftliche Baumaschinendaten (BGL), Wiesbaden und Berlin: Bauverlag GmbH.
ICOMIA (1993). ‘The environment impact arising from marine engines with power less than 500 kW used in craft less than 24 metres length of hull within EC’. IMEC Marine Protection, October 1993.
IFEU 2004. ‘Entwicklung eines Modells zur Berechnung der Luftschadstoffemissionen und des
IFEU 2009: Aktualisierung des Modells TREMOD - Mobile Machinery (TREMOD-MM), Endbericht; Institut für Energie- und Umweltforschung, pp. 48, Heidelberg.
IFEU 2014: Erarbeitung eines Konzepts zur Minderung der Umweltbelastung aus NRMM (non road mobile machinery) unter Berücksichtigung aktueller Emissionsfaktoren und
Draft Not To Be Quoted77

Draft Not To Be Quoted
1.A.2.g viiMobile Combustion in manufacturing industries and construction
Emissionsverminderungsoptionen für den Bestand, ISSN 1862-4804, Texte 24/2014, pp. 99, Heidelberg.
INFRAS AG (1993). ‘Baumaschinen-Emissionen — Hochrechnung der Luftschadstoffemissionen und des Dieselverbrauchs der Baumschinen in der Schweiz’, 27.9.1993, /747-B2/HK/MK/BD.
KBA 2002: Kraftfahrt-Bundesamt, unpublished data material.
Kraftstoffverbrauchs von Verbrennungsmotoren in mobilen Geräten und Maschinen’. Endbericht, Ufoplan No 299 45 113, pp. 122, Heidelberg.
Lilly L.C.R. (1984). Diesel engine reference book, Mid-Country Press, London.
Loibl W., R. Orthofer and W. Winiwarter (1993). ‘Spatially disaggregated emission inventory for anthropogenic NMVOC in Austria’, Atmospheric Environment, Vol. 27A, No 16, pp. 2575-2590, 1993.
Nordic Council (1993). ‘Motordrivna transport- och arbetsmaskiner; Indelning och terminologi’, draft 1990.
OECD/OCDE (1991). ‘Estimation of greenhouse gas emissions and sinks’. Final report from the OECD Experts Meeting, 18–21.2.1991. Prepared for Intergovernmental Panel on Climate Change. Revised August 1991.
OECD/OCDE (1993). Preliminary IPCC National GHG Inventories: In-depth review (Part III). Paper presented in IPCC/OECD workshop on National GHG Inventories, 1 October, The Hadley Centre Brackwell, April 1993.
OECD/OCDE Workshop on methane and nitrous oxide (1993). ‘Nitrous oxide emission from fuel combustion and industrial processes’, Amersfoort, Netherlands, 3–5. 2.1993.
Power Systems Research (19 ). U.S. Partslink — Reference Guide, edition 5.2, Rue Montoyer 39, B-1040 Brussels.
Puranen A. and M. Mattila (1992). ‘Exhaust emissions from work machinery in Finland’, Environment International, Vol. 18, pp. 467–476, 1992.
Rijkeboer R.C. et al. (1991). ‘Study on exhaust gas regulations for pleasure boat propulsion engines’ (executive summary). TNO report 733160022/ES to EC study contract No ETD/90/7750/RN/27. December 1991.
Samaras Z. and K.-H. Zierock (1993). ‘Notes on the assessment of the emissions of ‘off-road’ mobile machinery in the European Community’, XI/I93/93-EN. EEC report, February 1993.
SRI (Southwest Research Institute) (1991). ‘Emission tests of in-use small utility engines, Task III Report — Non-road source emission factor improvement’. Prepared for EPA, Michigan, September 1991, SwRI 3426-006.TNO (2001). TNO CEPMEIP database (www.air.sk/tno/cepmeip).
Treiber P.J.H. and Sauerteig J.E. (1991). ‘Present and future European exhaust emission regulations for off-road diesel engines’, SAE technical paper No 911808.
Draft Not To Be Quoted78

Draft Not To Be Quoted
1.A.2.g viiMobile Combustion in manufacturing industries and construction
TTM (1993). ‘Emissions- und Verbrauchsfaktoren von Baumaschinen in der Schweiz’. TTM-Bericht V01/05/93 (A. Mayer).
UNECE (1994a). ‘Task force on heavy metals emissions’. State-of-the-art report. Economic Commission for Europe, Working Group on Technology, Prague, June 1994.
UNECE (1994b). ‘Persistent organic pollutants’. Substantiation report of the task force on persistent organic pollutants, fourth meeting, Den Haag (the Netherlands), February 1994.
US EPA (1993a). ‘Evaluation of methodologies to estimate non-road mobile source usage’. Report No SR93-03-02 by Sierra Research Inc., March 19, 1993.
US EPA (1993b). ‘Non-road mobile source sales and attrition study: Identification and evaluation of available data sources. Final report of February 1993. Prepared by Jack Faucett Associates, JACKFAU-92-444-1.
US-EPA (1991). ‘Non-road engine and vehicle emission study’. report. Office of Air and Radiation (ANR-443). Report No 21A-2001, Washington, DC, November 1991.USEPA 2004. ‘Conversion factors for hydrocarbon emission components’. EPA420-P-04-001, US Environmental Protection Agency, 5 pp.
USEPA 2004: Conversion Factors for Hydrocarbon Emission Components. EPA420-P-04-001, US Environmental Protection Agency, 5 pp.
USEPA (2010): Exhaust Emission Factors for Nonroad Engine Modeling--Spark Ignition, Report No. NR-010b, EPA420-R-99-009
Utredning Utförd för Statens Naturvårdsverk (1989). ’Kartläggning av Förorenande Utsläpp Från Traktorer’. Arbetsmaskiner MM, Projekt Nr. 124-560-89, 3K Engineering AB, October 1989.
Veldt C. and P.F.J. Van Der Most (1993). ‘Emissiefactoren Vluchtige organische stoffen uit verbrandingsmotoren, Ministerie van Volkshuisvesting’, Ruimtelijke Ordening en Milieubeheer, Nr. 10.4.1993.
White J. et al. (1991). ‘Emission factors for small utility engines’, SAE technical paper No 910560.
Winther, M., Nielsen O. 2006. ‘Fuel use and emissions from non-road machinery in Denmark from 1985–2004 — and projections from 2005–2030’. Environmental project 1092. The Danish Environmental Protection Agency. pp. 238. Available at: http://www2.mst.dk/Udgiv/publications/2006/87-7052-085-2/pdf/87-7052-086-0.pdf
Winther, M. 2015a: Danish emission inventories for road transport and other mobile sources. Inventories until the year 2013. Aarhus University, DCE – Danish Centre for Environment and Energy, 120 pp. Scientific Report from DCE – Danish Centre for Environment and Energy No. 148 http://dce2.au.dk/pub/SR148.pdf
Winther, M. 2015b: Note on Updated NRMM EF Tables for the EMEP/EEA Guidebook. Pers Comm. 2015.
Draft Not To Be Quoted79

Draft Not To Be Quoted
1.A.2.g viiMobile Combustion in manufacturing industries and construction
8 Point of enquiry Enquiries concerning this chapter should be directed to the relevant leader(s) of the Task Force on Emission Inventories and Projection’s expert panel on Transport. Please refer to the TFEIP website (www.tfeip-secretariat.org/) for the contact details of the current expert panel leaders.
Draft Not To Be Quoted80
1
2345

Draft Not To Be Quoted
1.A.2.g viiMobile Combustion in manufacturing industries and construction
Appendix A Reference list of off-road machinerySeveral source category sub-splits have been proposed and used elsewhere and provided the starting point for the category split (e.g. Achten 1990, US-EPA 1991). The sub-split needs to be well balanced since, due to the large number of other mobile sources and machinery, there is a risk of going into too great a detail. On the other hand, all main activities and consequently all major sources need to be well covered. Therefore, a compromise has to be found.
A similar sub-split could be used with NFR codes, for example forming equipment based codes, e.g. of the form 1.A.2.g.vii (812) where the first digit of the three-digit code is the fourth digit of the SNAP code (e.g. 8 for ‘Other mobile sources and machinery — Industry) and the second and third digits are the two-digit code given in Table 2–1. Hence 812 would be the code for ‘Skid-steer tractors’.
Proposal for a reference list of off-road machinery, which should be covered under SNAP codes 0801 to 0803 and 0806 to 0809
SNAP Name Machinery included
080100
Military
080300
Inland waterways:
01
Sailing boats with auxiliary engines
02
Motorboats/workboats
03
Personal watercraft
04
Inland goods carrying vessels
080600
Agriculture: 01
Two-wheel tractors
02
Agricultural tractors
03
Harvesters/combines
04
Others (sprayers, manure distributors, agriculture mowers, balers, tillers, swatchers)
080700
Forestry: 01
Professional chain saws/clearing saws
02
Forest tractors/harvesters/skidders
03
Others (tree processors, haulers, forestry cultivators, fellers/bunchers, shredders, log loaders, pilling machines)
Draft Not To Be Quoted81
1
234567
89
101112
1314

Draft Not To Be Quoted
1.A.2.g viiMobile Combustion in manufacturing industries and construction
SNAP Name Machinery included
080800
Industry: 01
Asphalt/concrete pavers
02
Plate compactors/tampers/rammers
03
Rollers
04
Trenchers/mini excavators
05
Excavators (wheel/crawler type)
06
Cement and mortar mixers
07
Cranes
08
Graders/scrapers
09
Off-highway trucks
10
Bull dozers (wheel/crawler type)
11
Tractors/loaders/backhoes
12
Skid-steer tractors
13
Dumper/tenders
14
Aerial lifts
15
Forklifts
16
Generator sets
17
Pumps
18
Air/gas compressors
19
Welders
20
Refrigerating units
Draft Not To Be Quoted82

Draft Not To Be Quoted
1.A.2.g viiMobile Combustion in manufacturing industries and construction
SNAP Name Machinery included
21
Other general industrial equipment (broomers, sweepers/ scrubbers, slope and brush cutters, pressure washers, pist machines, ice rink machines, scrapers, blowers, vacuums)
22
Other material-handling equipment (conveyors, tunnel locs, snow-clearing machines, industrial tractors, pushing tractors)
23
Other construction work equipment (paving/surfacing equipment, bore/drill rigs, crushing equipment, concrete breakers/saws, peat breaking machines, pipe layers, rod benchers/cutters)
080900
Household and gardening
01
Trimmers/edgers/bush cutters
02
Lawn mowers
03
Hobby chain saws
04
Snowmobiles/skidoos
05
Other household and gardening equipment (wood splitters, snow blowers, chippers/stump grinders, gardening tillers, leaf blowers/vacuums)
06
Other household and gardening vehicles (lawn and garden tractors, all terrain vehicles, minibikes, off-road motorcycles, golf carts)
Appendix B Engine-types of off-road machinery
Engine-types of off-road machinery which should be covered under the Corinair 1990 SNAP codes 0801 to 0803
Engine type
SNAP
Code
Vehicle/machinery type D 2SG
4SG
LPG
08 03 01 Sailing boats with auxiliary engines X X
02 Motorboats.workboats X X X
03 Personal watercraft X
04 Inland goods carrying vessels X
08 06 01 Two-wheel tractors X X X
02 Agricultural tractors X
03 Harvesters/combiners X
Draft Not To Be Quoted83
123
4
56

Draft Not To Be Quoted
1.A.2.g viiMobile Combustion in manufacturing industries and construction
Engine type
SNAP
Code
Vehicle/machinery type D 2SG
4SG
LPG
04 Others (sprayers, manure distributors, etc.) X X X
08 07 01 Professional chain saws/clearing saws X
02 Forest tractors/harvesters/skidders X
03 Others (tree processors, haulers, forestry cultivators, etc.) X X
08 08 01 Asphalt/concrete pavers X
02 Plate compactors/tampers/rammers X X X
03 Rollers X
04 Trenchers/mini excavators X
05 Excavators (wheel/crawler type) X
06 Cement and mortar mixers X X
07 Cranes X
08 Graders/scrapers X
09 Off-highway trucks X
10 Bull dozers (wheel/crawler type) X
11 Tractors/loaders/backhoes X
12 Skid-steer tractors X
13 Dumper/tenders X X
14 Aerial lifts X X
15 Forklifts X X X
16 Generator sets X X X
17 Pumps X X X
18 Air/gas compressors X
19 Welders X
20 Refrigerating units X
21 Other general industrial equipment (broomers, sweepers, etc.)
X X X
22 Other material handling equipment (conveyors, etc.) X
23 Other construction work equipment (paving/surfacing, etc.) X X
08 09 01 Trimmers/edgers/bush cutters X
Draft Not To Be Quoted84

Draft Not To Be Quoted
1.A.2.g viiMobile Combustion in manufacturing industries and construction
Engine type
SNAP
Code
Vehicle/machinery type D 2SG
4SG
LPG
02 Lawn mowers X X X
03 Hobby chain saws X
04 Snowmobiles/skidoos X X
05 Other household and gardening equipment X X X
06 Other household and gardening vehicles X X X
Legend: D: diesel (fuel used: diesel oil for road transport)2SG: two-stroke gasoline (fuel used: motor gasoline)4SG: four-stroke gasoline (fuel used: mixture of motor gasoline and
lubrication oil)LPG: LPG (fuel used: liquefied petroleum gases)
Draft Not To Be Quoted85
123456

Draft Not To Be Quoted
1.A.2.g viiMobile Combustion in manufacturing industries and construction
Appendix C Background to Tier 1 and 2 emission factors for non-road machinery
1. IntroductionChapter 3.412 explains the origin of the Tier 3 NRMM EFs, with information being primarily drawn from the TREMOD NRMM emissions model (IEFEU 2014). The following sections explain the method used to calculate Tier 1 and Tier 2 EFs from the Tier 3 EFs.
The calculation of the Tier 1 and 2 factors, rely on the Danish inventory explained by Winther (20015b). The basis for fuel consumption and emission information is to a large extent taken from the German TREMOD NRMM emissions model, which takes data from extensive surveys made by Institut für Entsorgung und Umwelttechnik GmbH (IFEU,2004, 2009, 2014).
The baseline emission factors used in the Danish inventory — and the IFEU studies — are grouped into EU emission legislation categories. However, for engines older than directive first-level implementation dates, three additional emission level classes are added so that a complete matrix of fuel use and emission factors underpins the inventory.
In the following, a brief description is given of the baseline emission factors, and the approach to deriving aggregated EFs based on the Danish fuel consumption and emission results.
2. Aggregated emission factors
Chapter 3.412 explains the origin of the Tier 3 NRMM EFs, with information being primarily drawn from the TREMOD NRMM emissions model (IEFEU 2014). EFs for the Tier 1 and Tier2 methodologies are generated by aggregating the Tier EFs in a way determined by information on the Danish NRMM fleet and usage.
Danish inventory uses the Tier 3 approach, and fuel consumption and emissions are found as the product of the number of engines, annual working hours, average rated engine size, load factor, and fuel use/emission factors. The emission effects of engine deterioration and engine loads, and gasoline fuel evaporation is not included in the aggregated emission factors. For further details, please refer to Winther (2015a and 2015b).
For Tier 1, the results from the latest historical year, 2013, are behind the aggregated emission factors. For Tier 2, the overall principle has been to assess the technology relevant emission factors from the 2013 inventory year point of view. In many cases the aggregated emission factors for the same technology level are more or less the same regardless of the inventory year. However, in some cases, the same technology level can have some variation in the emission factors as a function of inventory year, due to the specific Danish rates of penetration of new technology. However the differences that arise are within an acceptable range.
Draft Not To Be Quoted86
1
2
34567
89
101112
13141516
171819
20
21222324
2526272829
3031323334353637
38

Draft Not To Be Quoted
1.A.2.g viiMobile Combustion in manufacturing industries and construction
2.1 Diesel
The Danish inventory basis for stock is regarded as detailed enough to distinguish between agriculture, forestry and industry machinery types. Table 1 show the machinery types which are behind the aggregated factors. The EFs are listed for Tier 1 and Tier 2 in the main body of the Chapter.
Table C1
Draft Not To Be Quoted87
1
2345
6

Draft Not To Be Quoted
1.A.2.g viiMobile Combustion in manufacturing industries and construction
Machinery type Lifetime (yrs)Agriculture Self-propelled vehicles 15Agriculture Tractors 30Agriculture Harvesters 25Agriculture Tractors (machine pools) 7Agriculture Self-propelled vehicles (machine pools) 6Agriculture Harvesters (machine pools) 11Forestry Harvesters (forestry) 8Forestry Chippers 10Forestry Harvesters (forestry) 8Forestry Chippers 6Forestry Chippers 6Forestry Forwarders 8Forestry Forwarders 8Forestry Tractors (silvicultural) 6Forestry Tractors (silvicultural) 6Forestry Tractors (other) 15Forestry Tractors (other) 15Industry High pressure cleaners (diesel) 10Industry Motor graders 10Industry Airport GSE and other (light duty) 10Industry Asphalt pavers 10Industry Pumps (diesel) 15Industry Tractors (transport, industry) 30Industry Airport GSE and other (medium duty) 10Industry Generators (diesel) 15Industry Forklifts 2–3 tons (diesel) 20Industry Sweepers (diesel) 10Industry Aerial lifts (diesel) 10Industry Tampers/land rollers 14Industry Refrigerating units (long distance) 7Industry Refrigerating units (distribution) 6Industry Vibratory plates 10Industry Compressors (diesel) 13Industry Excavators/loaders 10Industry Track-type dozers 10Industry Track-type loaders 10Industry Wheel loaders (0–5 tons) 10Industry Wheel loaders (> 5,1 tons) 10Industry Wheel type excavators 10Industry Track type excavators (0–5 tons) 10Industry Refuse compressors 10Industry Telescopic loaders 14Industry Airport GSE and other (heavy duty) 10Industry Dump trucks 10
Draft Not To Be Quoted88

Draft Not To Be Quoted
1.A.2.g viiMobile Combustion in manufacturing industries and construction
Machinery type Lifetime (yrs)Industry Mini loaders 14Industry Forklifts > 10 tons (diesel) 20Industry Forklifts 5–10 tons (diesel) 20Industry Forklifts 3–5 tons (diesel) 20Industry Forklifts 0–2 tons (diesel) 20Industry Track-type excavators (> 5,1 tons) 10
2.2 Gasoline
For gasoline engines the Danish stock and operational data available is for agriculture and forestry considered to be too scarce to underpin the calculation of sector specific emission factors, for two-stroke and four-stroke engines, respectively. Therefore, the decision has been to distinguish only between two-stroke and four-stroke engine-related factors. These factors are then repeated for all four land-based non-road sectors.
Tables 2 and 3 list the machinery types which are behind the aggregated factors. Emission factors are listed for Tier 1 and Tier 2 in the main chapter.
Table C2Sector Fuel type Engine Machinery types Lifetime (yrs)Forestry Gasoline 2-stroke Chain saws (forestry) 3Industry Gasoline 2-stroke Drills 10Industry Gasoline 2-stroke Slicers 10Industry Gasoline 2-stroke Rammers 10Residential Gasoline 2-stroke Trimmers (professional) 4Residential Gasoline 2-stroke Shrub clearers (private) 10Residential Gasoline 2-stroke Shrub clearers (professional) 4Residential Gasoline 2-stroke Hedge cutters (private) 10Residential Gasoline 2-stroke Trimmers (private) 10Residential Gasoline 2-stroke Other (gasoline) 10Residential Gasoline 2-stroke Garden shredders 10Residential Gasoline 2-stroke Suction machines 10Residential Gasoline 2-stroke Chippers 10Residential Gasoline 2-stroke Chain saws (private) 10Residential Gasoline 2-stroke Chain saws (professional) 3Residential Gasoline 2-stroke Hedge cutters (professional) 4
Draft Not To Be Quoted89
12
34567
89
10
11
Draft Not To Be Quoted
1.A.2.g viiMobile Combustion in manufacturing industries and construction
Table C3Sector Fuel Type Engine Machinery types Lifetime (yrs)Agriculture Gasoline 4-stroke Tractors (gasoline-certified) 31Agriculture Gasoline 4-stroke Tractors (gasoline non-certified) 31Agriculture Gasoline 4-stroke Fodder trucks 10Agriculture Gasoline 4-stroke Scrapers 10Agriculture Gasoline 4-stroke Other (gasoline) 10Agriculture Gasoline 4-stroke Sweepers 10Agriculture Gasoline 4-stroke Bedding machines 10Industry Gasoline 4-stroke Pumps (gasoline) 5Industry Gasoline 4-stroke Compressors (gasoline) 8Industry Gasoline 4-stroke Aerial lifts (gasoline) 10Industry Gasoline 4-stroke Vibratory plates (gasoline) 10Industry Gasoline 4-stroke High pressure cleaners (gasoline) 10Industry Gasoline 4-stroke Generators (gasoline) 10Industry Gasoline 4-stroke Other (gasoline) 10Industry Gasoline 4-stroke Sweepers (gasoline) 10Industry Gasoline 4-stroke Cutters 10Residential Gasoline 4-stroke Riders (professional) 5Residential Gasoline 4-stroke Wood cutters 10Residential Gasoline 4-stroke Lawn movers (private) 8Residential Gasoline 4-stroke Lawn movers (professional) 4Residential Gasoline 4-stroke Cultivators (private-large) 15Residential Gasoline 4-stroke Cultivators (private-small) 5Residential Gasoline 4-stroke Cultivators (professional) 8Residential Gasoline 4-stroke Riders (private) 12
2.3 LPG
For LPG, the fuel use factor and the emission factors of CO, VOC, NOx and TSP are taken from IFEU (2014). The only LPG machinery type using LPG in the Danish inventory is forklifts, and due to lack of data, there is no distinction between technology levels. The emission factors are listed for LPG machinery in the main body of the chapter.
2.4 Recreational craft
For recreational craft, the distinction is given between diesel-fuelled engines, and two-stroke and four-stroke gasoline engines. For Tier 2, conventional technologies and engines complying with Directive 2003/44/EC are considered.
Table 4 lists the machinery types which are behind the aggregated factors. The emission factors for Tier 1 and Tier 2 are listed in the main body of the chapter.
Draft Not To Be Quoted90
1
2
3
4567
8
91011
1213

Draft Not To Be Quoted
1.A.2.g viiMobile Combustion in manufacturing industries and construction
Table C4Fuel type Boat type Engine Engine type LifetimeGasoline Other boats (< 20 ft) Out-board engine 2-stroke 10Gasoline Yawls and cabin boats Out-board engine 2-stroke 10Gasoline Sailing boats (< 26 ft) Out-board engine 2-stroke 10Gasoline Speed boats Out-board engine 2-stroke 10Gasoline Water scooters Built in 2-stroke 10Gasoline Other boats (< 20 ft) Out-board engine 4-stroke 10Gasoline Yawls and cabin boats Out-board engine 4-stroke 10Gasoline Sailing boats (< 26 ft) Out-board engine 4-stroke 10Gasoline Speed boats In-board engine 4-stroke 10Gasoline Speed boats Out-board engine 4-stroke 10Gasoline Water scooters Built-in 4-stroke 10Diesel Motor boats (27–34 ft) In-board engine 15Diesel Motor boats (> 34 ft) In-board engine 15Diesel Motor boats (< 27 ft) In-board engine 15Diesel Motor sailors In-board engine 15Diesel Sailing boats (< 26 ft) In-board engine 15
3. Fuel consumption split by engine age and engine technology level for diesel machinery (agriculture, forestry, industry) and gasoline two-stroke/four-stroke machinery
In Tables 3–3 and 3–4, the percentage split of total fuel consumption as a function of engine age is given for diesel machinery in 1.A.2.g.vii, 1.A.4.c.ii (agriculture) and 1.A.4.c.ii (forestry), and for gasoline two-stroke and four-stroke machinery.
Tables 3–5 to 3–9 display the year specific fuel consumption percentages per engine age and inventory year for diesel-fuelled non-road machinery (Tables 3–5 to 3–7) and gasoline-fuelled non-road machinery (Tables 3–8 to 3–9). Only those inventory year/engine age combinations are listed for which fuel consumption for more than one engine technology is actually estimated. For the remaining inventory year/engine age combinations, the engine technology which uses the fuel becomes self-explanatory.
Gasoline agricultural tractors are excluded from the aggregated figures presented in the Tables 3–4, 3–8 and 3–9. Even though these machinery types may be an important part of a country's VOC and CO emission inventory for gasoline machinery in the 1980's (and to a smaller extent also in the 1990's), the data which are examined for the Danish situation in this case may become too uncertain to apply for other countries.
One major reason for leaving out gasoline tractors from the aggregated figures is that the life time for these machinery types is regarded as very long and hence the relative amount of the fuel consumption for Denmark may be very different from the situation in other countries. If gasoline agricultural tractors are regarded as a major source of fuel consumption and emissions, countries are encouraged to make a separate Tier 3 calculation of the fuel
Draft Not To Be Quoted91
1
2
345
678
91011121314
1516171819
2021222324
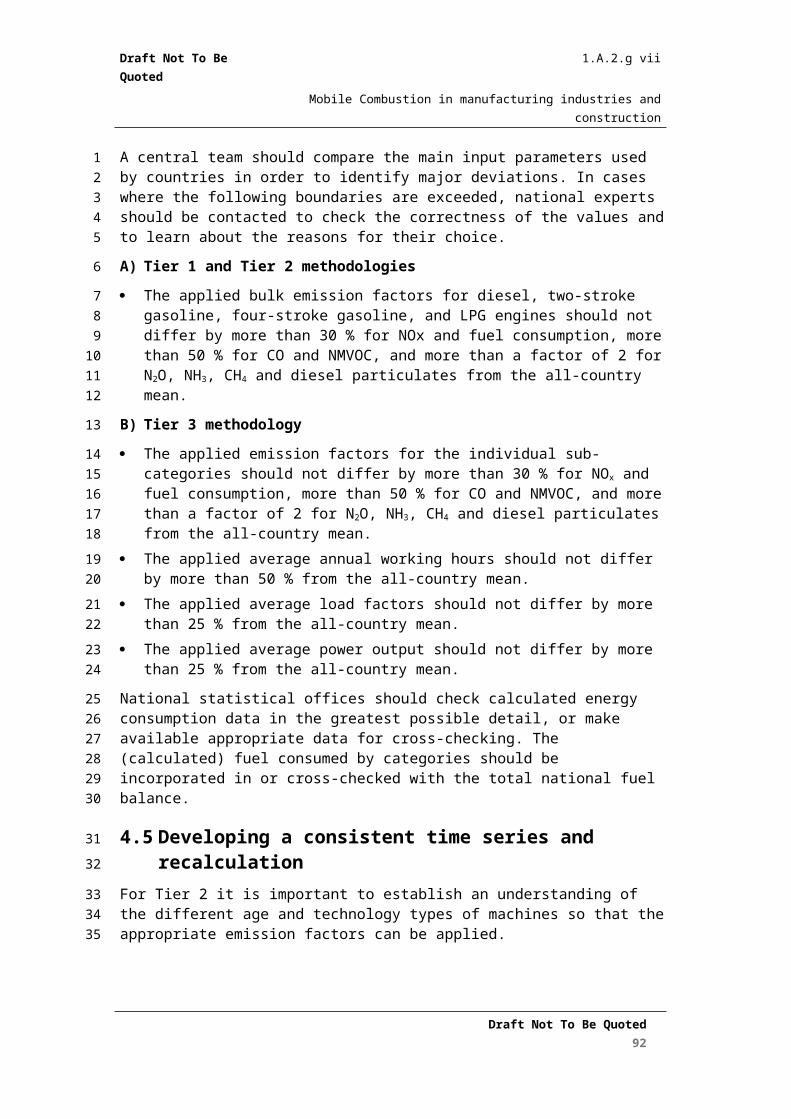
Draft Not To Be Quoted
1.A.2.g viiMobile Combustion in manufacturing industries and construction
consumption for gasoline agricultural tractors. This latter fuel consumption estimate can then be subtracted from the total fuel consumption given in the statistics, in order to obtain a new total fuel consumption base which underpins the emission inventory for gasoline non-road machinery in general.
Furthermore, no attempt has been made to derive a fuel consumption split for gasoline two-stroke and four-stroke machinery based on the Danish inventory. It is regarded as very uncertain, if such a fuel consumption split found for Denmark can be used for other countries in general. Just as an indication, the Danish fuel consumption percentage split between two-stroke and four-stroke gasoline machinery is found to be roughly 25/75 (in all inventory years).
4. Specific issues
4.1 SO2
The emission factors for SO2 are constant and rely on the sulphur content used in the Danish inventory. If the sulphur content for a specific country deviates from this, the emission factors must be scaled accordingly.
4.2 CO2
The emission factors for CO2 are constant and rely on the figures proposed by the Danish Energy Authority (DEA). If the emission factors for a specific country deviate from this, the country is encouraged to use country-specific data.
4.3 N2O and NH3
The emission factors are constant in terms of g/kg fuel. As engine technology gradually becomes more and more modern, the specific fuel consumption goes down, and hence the g/GJ derived emission factors increase.
5. References
IFEU 2004: Entwicklung eines Modells zur Berechnung der Luftschadstoffemissionen und des Kraftstoffverbrauchs von Verbrennungsmotoren in mobilen Geräten und Maschinen - Endbericht, UFOPLAN Nr. 299 45 113, pp. 122, Heidelberg.
IFEU 2009: Aktualisierung des Modells TREMOD - Mobile Machinery (TREMOD-MM), Endbericht; Institut für Energie- und Umweltforschung, pp. 48, Heidelberg.
IFEU 2014: Erarbeitung eines Konzepts zur Minderung der Umweltbelastung aus NRMM (non road mobile machinery) unter Berücksichtigung aktueller Emissionsfaktoren und Emissionsverminderungsoptionen für den Bestand, ISSN 1862-4804, Texte 24/2014, pp. 99, Heidelberg.
TNO (2001): TNO CEPMEIP database (www.air.sk/tno/cepmeip).
USEPA 2004: Conversion Factors for Hydrocarbon Emission Components. EPA420-P-04-001, US Environmental Protection Agency, 5 pp.
Draft Not To Be Quoted92
1234
56789
10
111213
141516
17
181920
21
222324
25
262728
2930
31323334
35
3637

Draft Not To Be Quoted
1.A.2.g viiMobile Combustion in manufacturing industries and construction
Winther, M., Nielsen O. 2006: Fuel use and emissions from non-road machinery in Denmark from 1985-2004 - and projections from 2005-2030. Environmental Project 1092. The Danish Environmental Protection Agency. 238 pp. Available at: www.mst.dk/udgiv/Publications/2006/87-7052-085-2/pdf/87-7052-086-0.pdf.
Winther, M. 2015a: Danish emission inventories for road transport and other mobile sources. Inventories until the year 2013. Aarhus University, DCE – Danish Centre for Environment and Energy. Scientific Report from DCE – Danish Centre for Environment and Energy No. 148 http://dce2.au.dk/pub/SR148.pdf
Winther, M. 2015b: Note on Updated NRMM EF Tables for the EMEP/EEA Guidebook. Pers Comm. 2015.
Draft Not To Be Quoted93
1234
5678
910
11

Draft Not To Be Quoted
1.A.2.g viiMobile Combustion in manufacturing industries and construction
Appendix D Generating Estimates of Fuel used by NRMM
The analysis by Dore et al (2015) investigates whether it is possible to establish relationships between NRMM fuel use data reported by Parties to the CLRTAP with other commonly available datasets. The intention of the analysis was to determine whether it is possible to generate “indicators” that would allow Parties to better estimate the amount of fuel being used by NRMM in different source categories.
Input DataEmissions and fuel data were retrieved from the Centre on Emission Inventories and Projections (CEIP) WebDab database. The data sourced included the years 1990-2013. Choosing countries with accurate data towards emissions and fuel was essential and hence countries were selected according to the NRMM methodology shown in their respective IIRs (informative inventory reports). The majority of the countries selected corresponded to a tier 3 methodology. The countries selected for inclusion in the assessment were:
Belgium Denmark France Italy Germany Netherlands Sweden The United Kingdom
In some cases fuel or mieeions data were not reported by all of these countries for the entire time series. Hence the size of dataets varies across the different NRMM source categories.
A number of other datasets were retrieved from various different sources and are listed below:
Table D1: Data used in the investigation of generating NRMM indicatorsIndicator Dataset: Source: Units:Population EU 1990-2013 European Commission
Eurostat databaseNumber
Gross Value Added (GVA) A/F/F (agriculture/forestry/fishing) 1990-2013
European Commission Eurostat Database
Current prices, million euro (€)
Gross Value Added (GVA) manufacturing and construction 1990-2013
European Commission Eurostat Database
Current prices, million euro (€)
Agricultural Land as a % of total land area 1990-2013
The World Bank Databank Percentage (%)
Agricultural Land 1990-2013 The World Bank Databank Square Kilometres (
)
Draft Not To Be Quoted94
1
2
3456789
101112131415161718192021222324
252627282930

Draft Not To Be Quoted
1.A.2.g viiMobile Combustion in manufacturing industries and construction
Total Forest products FAOstat (Food and Agriculture Organization of the United Nations) (aggregated from dataset containing forest products in tons split by category)
Tonnes
These datasets were combined with either NRMM fuel use data or NRMM emissions data to test for the strength of the relationship. Those combinations considered to give a strong enough relationship to justify use as an indicator are presented below.
1.A.2.g vii Mobile Combustion in manufacturing industries and constructionLiquid fuel used in NRMM in the manufacturing and construction industries was plotted against the GVA for the countries where fuel data were available from the CLRTAP submissions.
Figure D1: The relationship between fuel use and GVA in the manufacturing and construction industries
The resulting data do indicate a relationship between liqud fuel use and GVA, but this is difficult to interpret with any certainty. A linear relationship is evident for Denmark, Finland, Hungary, Norway and the UK, but Belgium Itlay and France show significantly different results.
Differences might be explained by genuine differences between countries, including the use of gas for NRMM, or the different make-up of NRMM activities within the manufacturing and construction sectors in different countries. However it is more likely that the differences are an artefect of the different methods that have been used to determine fuel consumption for each of the countries. Time has been spent reviewing the methodologies given in the
Draft Not To Be Quoted95
y = 494125xR² = 0.9806
y = 114105xR² = 0.7802
0
2E+10
4E+10
6E+10
8E+10
1E+11
1.2E+11
1.4E+11
0 50,000 100,000 150,000 200,000 250,000 300,000
Liqu
id fu
el (M
J)
GVA (Million Euros current prices)
Denmark, Finland, Hungary, Norway, UK Belgium, Italy France
123456789
101112
131415161718192021222324

Draft Not To Be Quoted
1.A.2.g viiMobile Combustion in manufacturing industries and construction
Informative Inventory Reports from the different countrires, but no clear explanations have beeen found that allow interpretation of the results with any certainty.
The linear relationship between liquid fuel used and GVA for Denmark, Finland, Hungary, Norway and the UK is proposed for use because it provides an upper limit for the fuel used in NRMM, and thefore a conservative approach to estimating emisisons from the manufacturing and construction sector as a whole. However, it is clear that there is significant uncertainty associated with this relationship and more work is needed to better understand differences between countries.
1.A.4.b ii Residential: Household and gardening (mobile)The fuel used for residential NRMM as a fraction of the total liquid fuel use was determined. The following table shows maximum and minimum values for each country.
Table D2: Fuel used for residential NRMM, expressed as a fraction of the total residential liquid fuel total country liquid fuel use use
Belgium Denmark Finland France Hungary Italy Norway Sweden UKMinimum (%) 0.2 0.6 1.3 0.3 0.04 0.01 7.1 2.7 1.2Maximum (%) 0.4 1.2 1.7 0.3 0.3 0.1 10.5 14.1 1.2
The high values in Norway and Sweden can be attributed to significant changes in the liquid fuel used for stationary combustion (both counties undergoing significant change in the energy mix used in the residential sector). However it is possible that this may mask a generally higher use of fuel for NRMM in the residential sector in two countries which anecdotally have higher levels of outdoor machinery use (e.g. snowmobiles, residential level forestry activities etc.).
As a guide, a figure of 1-2% is proposed for the NRMM fuel use percentage of the total liquid fuel used in the residential sector.1.A.4.c ii Agriculture/Forestry/Fishing: Off-road vehicles & other machineryThe following relationship was determined between NRMM fuel use Agriculture, Forestry and Fishing and GVA.
Draft Not To Be Quoted96
123456789
1011121314151617
1819202122232425262728293031

Draft Not To Be Quoted
1.A.2.g viiMobile Combustion in manufacturing industries and construction
Figure D2: The relationship between fuel use and GVA in Agriculture, Forestry and Fishing NRMM
The high R2 value suggests that it is appropriate for this to be used as an indicator.
Other NRMM Source CategoriesEfforts were made to investigate relationships for other NRMM categories. But it was not possible to determine any useable relationships or indicators for:
1.A.4.a.ii Commercial/institutional: Mobile 1.A.4.c iii National fishing 1.A.5.b Other, Mobile (including military, land based and recreational boats)
This was primarily because there was a lack of data detailed sector level data reported on fuel used in these categories by Parties to the CLRTAP. But, in addition, but also relationships with e.g. GVA were found to be not as strong as for other NRMM source categories.
ReferencesDore C. and Smith, H. (2015) Generating Indicators for Estimating NRMM Fuel Consumption. Continued Improvements of Inventory Methodologies, Chapter 2.2, EU Project Report 070201/2014/693666/FRA/ENV.C.3
Draft Not To Be Quoted97
y = 3,383,721.56xR² = 0.95
0
2E+10
4E+10
6E+10
8E+10
1E+11
1.2E+11
1.4E+11
0 5,000 10,000 15,000 20,000 25,000 30,000 35,000 40,000
Liqu
id fu
el (M
J)
GVA (Million Euros current prices)
12
3456789
1011
121314
15161718

Draft Not To Be Quoted
1.A.2.g viiMobile Combustion in manufacturing industries and construction
Appendix E BC fractions of PM for non-road enginesIn general the same diesel engine technologies are used by non-road working machinery and road transport vehicles, however, measurement data for BC and PM are scarce for non-road engines as such. Hence, for non-road diesel engines the decision is to use the f-BC fractions and +/- uncertainty ranges proposed for road transport engines, as the f-BC figures for these engines are derived from a comprehensive literature survey of EC and OC fractions of total exhaust PM made by Ntziachristos et al. (2007). This is also explained in Annex 3 in the guidebook chapter for road transport. The examined OC data from Ntziachristos et al. (2007) can be input for the further assessment of OC fractions of PM (f-OC).
For diesel engines < 130 kW f-BC fractions for diesel cars are used, and for diesel engines >= 130 kW f-BC fractions for heavy duty trucks are used (c.f. road transport Annex 3). In the case of gasoline 2-stroke and 4-stroke engines data from Kupiainen and Klimont (2004) is used. The same source is behind the average factor of 0.15 for LPG (+/- range = 50 %).
Table E.1 Proposed f-BC fractions as an input for aggregated Tier 1 and 2 f-BC fractions for non-road engines
Technology Diesel < 130 kW Diesel >= 130 kW Gasoline (2/4 stroke)f-BC +/- (%) f-BC +/- (%) f-BC +/- (%)
<1981 0.55 10 0.5 20 0.05 50
1981-1990 0.55 10 0.5 20 0.05 50
1991-Stage I 0.55 10 0.5 20 0.05 50
Stage I 0.8 10 0.7 20 0.05 50
Stage II 0.8 10 0.7 20 0.05 50
Stage IIIA 0.8 10 0.7 20
Stage IIIB, no DPF 0.8 50 0.7 20
Stage IIIB, DPF 0.15 50 0.15 20
Stage IV, no DPF 0.8 50 0.7 30
Stage IV, DPF 0.15 50 0.15 30
Tier 1Using the proposed f-BC fractions from Table D.1, the Tier 1 f-BC fractions shown in Table D.2 are derived from the PM and BC Tier 3 non road emission calculations made for Denmark in 2006 (Winther, 2012).
Draft Not To Be Quoted98
1
2
3456789
10
11121314
1516
1718192021
Draft Not To Be Quoted
1.A.2.g viiMobile Combustion in manufacturing industries and construction
Table E.2 Tier 1 BC fractions of PM for non-road engines
Category Fuel type/Engine type f-BCAgriculture Diesel 0.57
Forestry Diesel 0.65
Industry Diesel 0.62
All Gasoline 2-stroke 0.05
All Gasoline 4-stroke 0.05
Tier 2Using the proposed f-BC fractions from Table D.1 technology specific f-BC fractions for Tier 2 are derived from the PM and BC Tier 3 non road emission calculations made for Denmark in 2006 (Winther, 2012).
Table E.3 Tier 2 BC fractions of PM for non-road engines
Category → Agriculture Forestry Industry All AllTechnology Diesel Diesel Diesel Gas. 2-stroke Gas. 4-stroke
<1981 0.55 0.55 0.55 0.05 0.05
1981-1990 0.55 0.55 0.55 0.05 0.05
1991-Stage I 0.54 0.54 0.55 0.05 0.05
Stage I 0.79 0.78 0.80 0.05 0.05
Stage II 0.77 0.76 0.80 0.05 0.05
Stage IIIA 0.70 0.70 0.70
Tier 3The following Table D.4 contains the proposed f-BC fractions and +/- uncertainty ranges for the Tier 3 methodology described in the guidebook for non-road machinery. For diesel engines < 130 kW f-BC fractions for diesel cars are used, and for diesel engines >= 130 kW f-BC fractions for heavy duty trucks are used (c.f. road transport discussion note). In the case of gasoline 2-stroke and 4-stroke engines f-BC data from Kupiainen and Klimont (2004) are used. For gasoline, however, the use of f-BC data only becomes relevant, if country specific PM emission factors are available.
Draft Not To Be Quoted99
1
23456
7
89
10111213141516

Draft Not To Be Quoted
1.A.2.g viiMobile Combustion in manufacturing industries and construction
Table E.4 Proposed Tier 3 f-BC fractions for non-road engines
Table no. Technology Engine size f-BC +/- (%)
3-10 Uncontrolled diesel < 130 kW 0.55 10
>= 130 kW 0.5 20
3-11 Stage I diesel < 130 kW 0.8 10
>= 130 kW 0.7 20
3-12 Stage II diesel < 130 kW 0.8 10
>= 130 kW 0.7 20
3-13 Stage III diesel < 130 kW 0.8 10
>= 130 kW 0.7 20
3-14 Stage I-II diesel, agriculture < 130 kW 0.8 10
>= 130 kW 0.7 20
3-15 Stage III diesel, agriculture < 130 kW 0.8 10
>= 130 kW 0.7 20
3-18 2-stroke uncontrolled gasoline - 0.05 50
3-19 4-stroke uncontrolled gasoline - 0.05 50
ReferencesKupiainen, K. & Klimont, Z., 2004: Primary emissions of submicron and carbonaceous particles in Europe and the potential for their control. Interim Report IR-04-079. IIASA, Austria, 115pp.
Ntziachristos, L., Mellios, G., Fontaras, G., Gkeivanidis, S., Kousoulidou, M., Gkatzoflias, D, Papageorgiou, Th., and Kouridis, C. (2007), Updates of the Guidebook Chapter on Road Transport. LAT Report No 0706, p. 63.
Winther, M. 2012: Danish emission inventories for road transport and other mobile sources. Inventories until the year 2010. National Environmental Research Institute, University of Aarhus. 283 pp. – DCE Scientific Report No. 24. http://www.dmu.dk/Pub/SR24.pdf.
Draft Not To Be Quoted100
1
2
3
456
789
101112