Category Intelligence on Corn
7
© Copyright 2017 Beroe Inc. All rights reserved. Corn starch market drives up corn sourcing
-
Upload
beroe-inc-advantage-procurement -
Category
Business
-
view
8 -
download
0
Transcript of Category Intelligence on Corn

© Copyright 2017 Beroe Inc. All rights reserved.
Corn starch market drives up corn sourcing
2
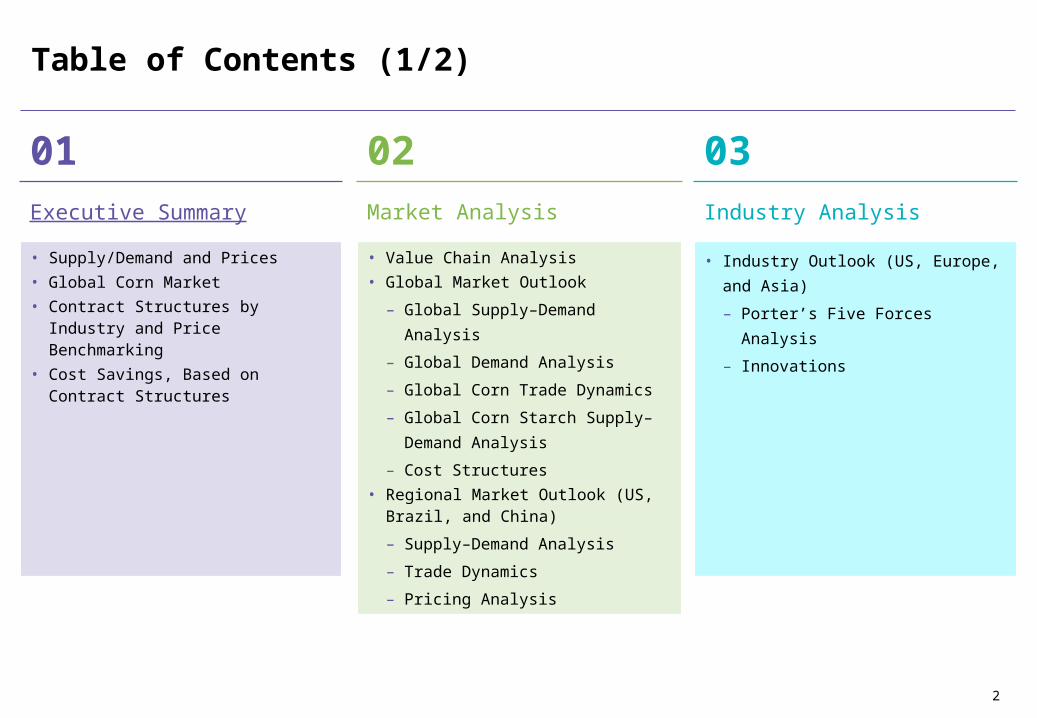
Table of Contents (1/2)
01Executive Summary
• Supply/Demand and Prices• Global Corn Market• Contract Structures by Industry and Price
Benchmarking• Cost Savings, Based on Contract Structures
02Market Analysis
• Value Chain Analysis• Global Market Outlook– Global Supply–Demand Analysis– Global Demand Analysis– Global Corn Trade Dynamics – Global Corn Starch Supply–Demand
Analysis– Cost Structures
• Regional Market Outlook (US, Brazil, and China)– Supply–Demand Analysis– Trade Dynamics– Pricing Analysis
03Industry Analysis
• Industry Outlook (US, Europe, and Asia)– Porter’s Five Forces Analysis – Innovations

3
Table of Contents (2/2)
04Corn Processing Industry Analysis
• Global Corn Starch and Derivatives Supplier Market Share
• Profiling of Major Suppliers– ADM– Cargill Inc.– Ingredion Inc.– Tate & Lyle– Roquette Freres– Tereos Syral
Previous Slide

44
Preview

5
Executive Summary
GLOBAL SUPPLY (2016/2017) 1365.77 MMTGLOBAL CONSUMPTION (2016/2017) 1007.71 MMTGLOBAL ENDING STOCKS (2016/2017) 220.81 MMT
KEY PRODUCINGCOUNTRIESUS (37.4%)China (21.2%)Brazil (7.8%)
KEY EXPORTINGCOUNTRIESUS (39.6%)Argentina (17.5%)Brazil (15.6%)Ukraine (12.9%)Russia (3.4%)
KEY MARKET DRIVERS20.2 percent rise in global feed demand2–5 percent rise in demand from the corn processing sectorBio-fuel demand
KEY CONSUMINGCOUNTRIESUS (31.1%)China (22.4%)Brazil (5.8%)Mexico (3.7%)
KEY IMPORTINGCOUNTRIESJapan (11.7%)Mexico (10.1%)EU (8.6%)South Korea (7.8%)Egypt (6.8%)
Surplus Stocks (2016/2017 vs. past five years average)• Global: 29.2% • US: 85.9% • China: 23.6% • Brazil: (-26.7%)
EMERGING SUPPLY COUNTRIES (2010 vs. 2015 Export Shares)Ukraine – 7 percent increase
TRADE TARIFFSUS – Japan (0 percent export duty/16 percent import duty)Brazil – Vietnam (0 percent export duty/13 percent import duty)Brazil – Iran (0 percent export duty/20.6 percent import duty)
Weather Impact (2016/2017)US: Favorable | China: Favorable | Brazil: Unfavorable (dry)
Sources: UN Comtrade, USDA, Beroe Analysis, Government Websites
BENCHMARK PRICE INDICESCBOT | MATIF Euronext
COST DRIVERSCost of Crop Protectors in Brazil: 35 percent Cost of Labor and Land in the US: 4–5 percent
ENGAGEMENT MODELSContract Length: 1–3 Months Contract Type: CBOT Based + Basis Best Price-lock Months: May–July
PRICES IN KEY REGIONS and OUTLOOK for 2016/2017US: 3.28 $/Bu China: 1680 ¥/MT Brazil: 226.7 $/MT

6
Executive Summary
01 US (2015/2016 vs. 2016/2017)
02 Brazil (2015/2016 vs. 2016/2017)
01
KeyTakeaway
02
03 China (2015/2016 vs. 2016/2017)
Production – (-2.7%) Consumption – 3.9% Price – (-8.3%)
03
Sources: Government website, USDA, Beroe Analysis
Production – 11.4% Consumption – 4.8% Price – (-16.4%)
Production – 16.8% Consumption – 3.6% Price – 14%
• The global supply of corn has been rising at a CAGR of 4.28 percent over five years. Production in 2016–2017 is expected to reach 1028.4 MMT
• The key factors driving the growth include consecutive record production in the US and China and demand from end-use segments, such as feed and corn starch processing industries
• With respect to corn processing end uses, the global sorbitol market is set to rise by a CAGR of 3.6 percent, while the corn starch market could rise by a CAGR of 4.8 percent in the coming years. This is driving the increase in corn demand for the US and China

7
Sign up to view the full report for FREE Sign up to view the full report for FREE Sign up to view the full report for FREE Sign up to view the full report for FREE