Category Fund Name Page No.
85
Transcript of Category Fund Name Page No.

Category Fund Name Page No.
EQUITYLarge Cap Fund Nippon India Large Cap Fund 5Large & Mid Cap Fund Nippon India Vision Fund 6Thematic(following a factor-based model) Nippon India Quant Fund 7Balanced Advantage Fund Nippon India Balanced Advantage Fund 8
IndexNippon India Index Fund - Nifty Plan 9Nippon India Index Fund - Sensex Plan 10
Mid Cap Fund Nippon India Growth Fund 11Focused Fund Nippon India Focused Equity Fund 12Small Cap Fund Nippon India Small Cap Fund 13Value Fund Nippon India Value Fund 14Multi Cap Fund Nippon India Multi Cap Fund 15Aggressive Hybrid Fund Nippon India Equity Hybrid Fund (Number of Segregated Portfolios - 2) 16Equity Savings Nippon India Equity Savings Fund (Number of Segregated Portfolios - 2) 17Sectoral Nippon India Banking Fund 18Thematic Nippon India Power & Infra Fund 18Thematic Nippon India Consumption Fund 19Sectoral Nippon India Pharma Fund 19ELSS Nippon India Tax Saver (ELSS) Fund 20Arbitrage Fund Nippon India Arbitrage Fund 21Thematic (International) Nippon India Japan Equity Fund 22
Nippon India US Equity Opportunities Fund 23FIXED INCOMEOvernight Fund Nippon India Overnight Fund 24Liquid Fund Nippon India Liquid Fund 25Money Market Fund Nippon India Money Market Fund 26Ultra Short Duration Fund Nippon India Ultra Short Duration Fund / Segregated Portfolio 1 27Low Duration Fund Nippon India Low Duration Fund 28Corporate Bond Fund Nippon India Prime Debt Fund 29Banking & PSU Fund Nippon India Banking & PSU Debt Fund 30Floater Fund Nippon India Floating Rate Fund 31Short Duration Fund Nippon India Short Term Fund 32Long Duration Fund Nippon India Nivesh Lakshya Fund 33Credit Risk Fund Nippon India Credit Risk Fund (Number of Segregated Portfolios- 2) 34Medium Duration Fund Nippon India Strategic Debt Fund (Number of Segregated Portfolios - 2) 35Medium to Long Duration Fund Nippon India Income Fund 36Dynamic Bond Fund Nippon India Dynamic Bond Fund 37Gilt Nippon India Gilt Securities Fund 38Conservative Hybrid Fund Nippon India Hybrid Bond Fund (Number of Segregated Portfolios - 2) 39ETF
ETF - Equity
Nippon India ETF Nifty BeES 40Nippon India ETF Sensex 41Nippon India ETF NV20 42Nippon India ETF Junior BeES 43Nippon India ETF Nifty 100 44Nippon India ETF Consumption 45Nippon India ETF Dividend Opportunities 46Nippon India ETF Infra BeES 47Nippon India ETF Bank BeES 48Nippon India ETF PSU Bank BeES 49Nippon India ETF Shariah BeES 50Nippon India ETF Nifty Midcap 150 51Nippon India ETF Hang Seng BeES 52
Nippon India ETF Sensex Next 50 53
CPSE ETF 54
ETF - Fixed IncomeNippon India ETF Liquid BeES 55Nippon India ETF Long Term Gilt 55
ETF - Gold Nippon India ETF Gold BeES 56Fund of Fund (FOF)FOF - Domestic Nippon India Gold Savings Fund 56
Nippon India Junior BeES FOF 57RETIREMENTRetirement - Equity Nippon India Retirement Fund - Wealth Creation Scheme 58Retirement - Fixed Income Nippon India Retirement Fund - Income Generation Scheme 59
Abridged Debt Analysis 60SIP Returns of Select Schemes 61Fund Management Team 62Scheme Performance 63Scheme Performance - Fund Manager Wise 71Funds at a Glance 75Disclaimers, Statutory Details & Risk Factors 82How to Read Factsheet 84

June 2020Fundamentals 3
MARKET UPDATE
May 2020: Fiscal bonanza followed by a patently dovish monetary policy amidst continued uncertainty & risk aversion
Debt markets witnessed a slew of events over the month of May starting with new 10 Yr auction, mid-month announcement of additional gross market borrowing by central government, fiscal stimulus package and finally the bimonthly monetary policy. Although dimensioning the economic loss from current pandemic is tantamount to boiling the ocean, governments & central banks across the globe are unleashing their arsenal to mitigate the economic fallout stemming from the ongoing health crisis.
Additional Gross Borrowing & Revision in H1 FY21 borrowing calendar
In the second week of May’2020, Government announced an increase in gross borrowing (~ 2% of GDP) to INR 12 trn in FY21, up from INR 7.8 trn in the budget. The H1 FY21 borrowing calendar was also revised with issuances hiked from INR 4.88 trn in the original calendar to INR 7.06 trn in the revised calendar. Thus, starting from May, the revised calendar implies an additional weekly supply of ~ INR 10,000 crores.
Fiscal Stimulus Package
In the following week, central government announced an INR 20.9 lakh crore fiscal stimulus package. With the package largely pencilled around contingent liabilities, the net fiscal impact is miniscule (~1% of GDP). Key highlights of the package from debt market perspective –
Rs. 30,000 crore special liquidity scheme to help NBFCs/ HFCs/ Microfinance Institutions (MFIs) raise money in debt markets. Under this scheme investment made via primary and secondary market transactions in investment grade debt papers of NBFCs/HFCs/MFIs will stand fully guaranteed by GoI.
Partial credit guarantee scheme of INR 45,000 crores to cover issuances of AA rated and below or unrated papers with first 20% of the loss to be borne by the government.
Rise in the borrowing limits for state governments, but with several conditionalities attached to it. States can now borrow 5% of GSDP (versus 3% earlier), but only the first 0.5% of the increase will be unconditional.
Monetary Policy
The monetary policy announced a policy repo rate cut by 40 bps to 4% with continuation on the accommodative stance as long as it is necessary to revive growth. RBI expressed serious concerns around growth with FY21 economic growth expected in negative territory.
External Sector
Amidst ongoing pandemic, extreme uncertainty looms over FPI flows in emerging market economies. In May’20, debt markets witnessed a net FPI outflow of US$ 2.73bn.
Over the month rupee depreciated by 85ps.
Brent Crude Oil prices closed the month at ~US$ 35/barrel vs ~US$20/ barrel (April End).
The US 10 Year Treasury Bond yield remained range bound between 0.61%-0.72%. It closed the month at ~0.65% vs 0.64% (April End).
Inflation
On account of constraints to data collection (especially survey-based data) amidst the lockdown, government did not release the headline CPI inflation for Apr’20. However, few inflation sub-indices that were disclosed show food inflation to have inched up in April.
Yield levels and Spreads
The G-Sec term premium (10 yr – 364D T Bill) that had heightened towards the end of April continued to levitate at ~ 240-250 bps over the month of May. The steep G-Sec curve is essentially a fallout of excess liquidity overhang in the system and longer tenor yields bogged down in the pressure of fiscal slippage.
The benchmark 10 Yr G-Sec (6.45% GS 2029) yield gradually fell over the first week to 5.97%. However, in the next week additional gross borrowing announcement pulled it back to 6.10-6.15% terrain. From there it has steadily fallen to close the month at 6% vs 6.11% (April End). 5 yr G-Sec closed the month at 4.97% vs 5.15% (April End). The new 10 year G-Sec was issued on 8th May at a yield level of 5.79%. Market participants are expecting some strong supportive measures from the central bank in coming weeks.
The 10 Yr AAA PSU yield plunged 40-45 bps over the month to close at ~6.77-6.8%. Towards the end of the month, 3 Yr AAA PSU segment saw yields trading 80-90 bps lower vis-à-vis April end levels while the 1Yr AAA PSU bonds witnessed yields trading 120-140 bps below the April end levels.
The 10 Yr AAA Private corporate yields fell ~ 50-60 bps over the month with spread over G-Sec compressing to ~130 bps vs 175 bps (April end). On the other hand, spread of 1 Yr AAA Private Corporate over 364D T-Bill exhibited a compression of ~150 bps.
The 5-10s AAA PSU curve bull steepened to ~120 bps vs ~74bps (April End). Contrastingly 5-10s AAA Private corporate spread hovered around April end levels to close the month at ~30-35 bps.
Fixed Income Update and Outlook
MARKET VIEW
The last RBI policy was another dovish policy as the Monetary Policy Committee (MPC) members clearly highlighted that it intends to continue with the Accommodative stance till the time growth revives. Further, the MPC clearly highlighted that there is space available for future monetary policy actions and they will continue to support the broader economy in the wake of the pandemic.
We expect RBI to ease further in 2Q FY21 and assign low probability of further rate actions in H2 FY21 - based on the evolving growth-inflation trajectory and uncertainty around it. At the same time, we believe till the time the monetary policy stance remains accommodative, RBI will continue to provide more than adequate liquidity and continue its focus on transmission of rates. The major focus for RBI now is transmission of rates and hence it could continue to use all tools possible to keep yields lower.
While we remain constructive on rates, this view emanates from the fact that RBI may continue to support bond market through various conventional and non-conventional policy tools. Also, the shorter end of the yield curve are Liquidity trades and hence the accommodative Liquidity stance of RBI may continue to drive shorter maturity yield curve. Longer end of the yield curve will depend on the risk appetite of the market in terms of duration and the demand – supply mismatches as far as the total borrowing is concerned. We clearly expect that RBI is cognizant of the large borrowing programme of the government and that it will remain supportive of bond market and the additional borrowing will sail through smoothly.
Recommendations
While we expect duration yields to outperform in the short run, we would still recommend to consider staying invested in shorter maturity G-Secs and AAA PSUs/ Privates, while remaining cautiously optimistic on longer maturity corporate bonds and G-Secs. We will focus on Liquidity plays: Short duration + Spread play in terms of Core portfolio construct. We endeavor to run 3 - 6 yr G-sec rates & 2 - 3 yr AAA corporate bond segment as our Core portfolio, while longer duration would be tactically added to the portfolio only through G-Secs.
We also expect new 10yr bond yield to remain range bound from near term (3 months) perspective as market starts pricing in one more rate cut & Durable Liquidity Support in form of Open Market Operations/ FX Swap/ Long Term Repo Operations only to take care of any major demand – supply mismatches.
Common Source: Bloomberg, RBI, Centre for Monitoring Indian Economy Pvt Ltd, Finance Ministry of India, NIMF Internal Research
The views expressed herein constitute only the opinions and do not constitute any guidelines or recommendation on any course of action to be followed by the reader. This information is meant for general reading purposes only and is not meant to serve as a professional guide for the readers.
June 20204 Fundamentals
2000
2500
3000
3500
4000
4500
(Gw
H)
Daily Power Consumption Demand
2020 2019
Phase 1 Phase 2 Phase 3 Phase 4
Macro and Equity Market Updates
GLOBAL MACRO & MARKETS
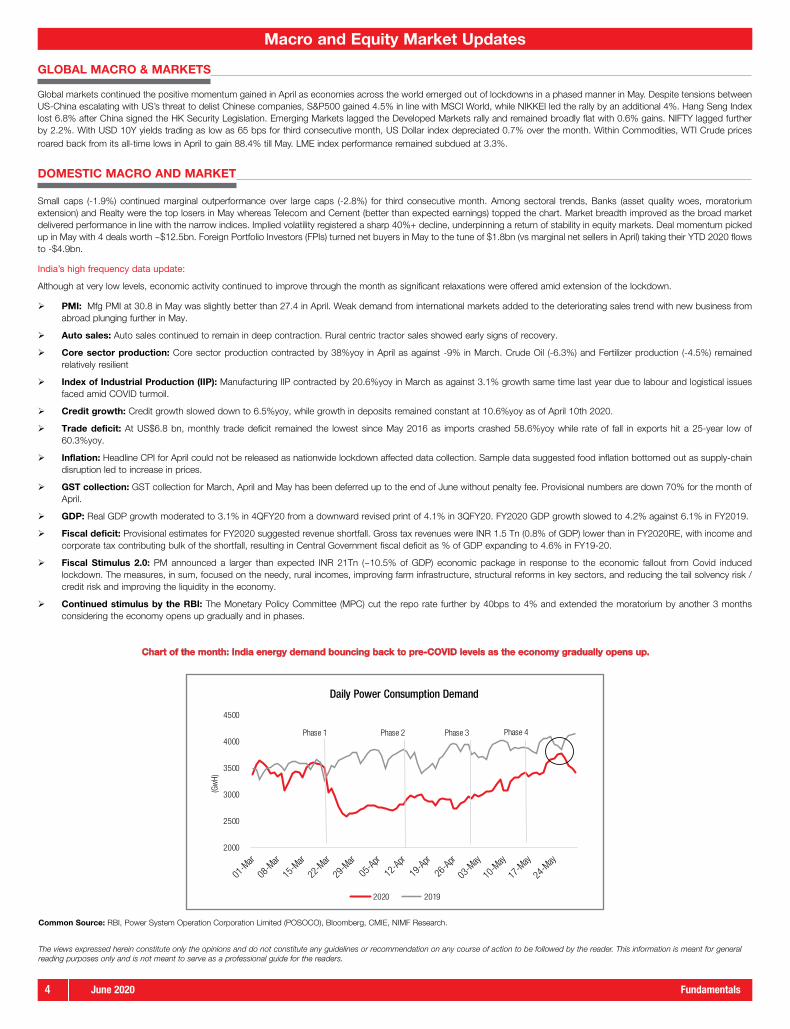
Global markets continued the positive momentum gained in April as economies across the world emerged out of lockdowns in a phased manner in May. Despite tensions between US-China escalating with US’s threat to delist Chinese companies, S&P500 gained 4.5% in line with MSCI World, while NIKKEI led the rally by an additional 4%. Hang Seng Index lost 6.8% after China signed the HK Security Legislation. Emerging Markets lagged the Developed Markets rally and remained broadly flat with 0.6% gains. NIFTY lagged further by 2.2%. With USD 10Y yields trading as low as 65 bps for third consecutive month, US Dollar index depreciated 0.7% over the month. Within Commodities, WTI Crude prices roared back from its all-time lows in April to gain 88.4% till May. LME index performance remained subdued at 3.3%.
DOMESTIC MACRO AND MARKET
Small caps (-1.9%) continued marginal outperformance over large caps (-2.8%) for third consecutive month. Among sectoral trends, Banks (asset quality woes, moratorium extension) and Realty were the top losers in May whereas Telecom and Cement (better than expected earnings) topped the chart. Market breadth improved as the broad market delivered performance in line with the narrow indices. Implied volatility registered a sharp 40%+ decline, underpinning a return of stability in equity markets. Deal momentum picked up in May with 4 deals worth ~$12.5bn. Foreign Portfolio Investors (FPIs) turned net buyers in May to the tune of $1.8bn (vs marginal net sellers in April) taking their YTD 2020 flows to -$4.9bn.
India’s high frequency data update:
Although at very low levels, economic activity continued to improve through the month as significant relaxations were offered amid extension of the lockdown.
PMI: Mfg PMI at 30.8 in May was slightly better than 27.4 in April. Weak demand from international markets added to the deteriorating sales trend with new business from abroad plunging further in May.
Auto sales: Auto sales continued to remain in deep contraction. Rural centric tractor sales showed early signs of recovery.
Core sector production: Core sector production contracted by 38%yoy in April as against -9% in March. Crude Oil (-6.3%) and Fertilizer production (-4.5%) remained relatively resilient
Index of Industrial Production (IIP): Manufacturing IIP contracted by 20.6%yoy in March as against 3.1% growth same time last year due to labour and logistical issues faced amid COVID turmoil.
Credit growth: Credit growth slowed down to 6.5%yoy, while growth in deposits remained constant at 10.6%yoy as of April 10th 2020.
Trade deficit: At US$6.8 bn, monthly trade deficit remained the lowest since May 2016 as imports crashed 58.6%yoy while rate of fall in exports hit a 25-year low of 60.3%yoy.
Inflation: Headline CPI for April could not be released as nationwide lockdown affected data collection. Sample data suggested food inflation bottomed out as supply-chain disruption led to increase in prices.
GST collection: GST collection for March, April and May has been deferred up to the end of June without penalty fee. Provisional numbers are down 70% for the month of April.
GDP: Real GDP growth moderated to 3.1% in 4QFY20 from a downward revised print of 4.1% in 3QFY20. FY2020 GDP growth slowed to 4.2% against 6.1% in FY2019.
Fiscal deficit: Provisional estimates for FY2020 suggested revenue shortfall. Gross tax revenues were INR 1.5 Tn (0.8% of GDP) lower than in FY2020RE, with income and corporate tax contributing bulk of the shortfall, resulting in Central Government fiscal deficit as % of GDP expanding to 4.6% in FY19-20.
Fiscal Stimulus 2.0: PM announced a larger than expected INR 21Tn (~10.5% of GDP) economic package in response to the economic fallout from Covid induced lockdown. The measures, in sum, focused on the needy, rural incomes, improving farm infrastructure, structural reforms in key sectors, and reducing the tail solvency risk / credit risk and improving the liquidity in the economy.
Continued stimulus by the RBI: The Monetary Policy Committee (MPC) cut the repo rate further by 40bps to 4% and extended the moratorium by another 3 months considering the economy opens up gradually and in phases.
Chart of the month: India energy demand bouncing back to pre-COVID levels as the economy gradually opens up.Chart of the month: India energy demand bouncing back to pre-COVID levels as the economy gradually opens up.
Common Source: RBI, Power System Operation Corporation Limited (POSOCO), Bloomberg, CMIE, NIMF Research.
The views expressed herein constitute only the opinions and do not constitute any guidelines or recommendation on any course of action to be followed by the reader. This information is meant for generalreading purposes only and is not meant to serve as a professional guide for the readers.

June 2020Fundamentals 5
Large Cap Fund
Details as on May 31, 2020
Type of Scheme
An open ended equity scheme predominantly investing in large cap stocks
Current Investment Philosophy
Nippon India Large Cap Fund is a large cap fund predominantly investing in stocks of top 100 companies by full market capitalization. Large cap stocks endeavor to provide stability & liquidity to the portfolio. It endeavors to generate alpha while owning best of the index companies. It endeavors to invest in leaders or potential leaders with established business models & sustainable free cash flows. It endeavors to invest in growth companies at a reasonable valuation & with high return on equity. It invests in emerging large cap companies which have an established business model with a proven management track record and a potential to generate high cash flows.
Date of Allotment
August 8, 2007
Fund Manager
Sailesh Raj Bhan
Benchmark
S&P BSE 100 TRI
Fund Size
Monthly Average: ` 9,170.74 Cr
Month End: ` 9,450.35 Cr
NAV as on May 29, 2020Growth Plan ` 26.0371Dividend Plan ` 11.0436Bonus Option ` 26.0371Direct - Growth Plan ` 27.8111Direct - Dividend Plan ` 14.8288Direct - Bonus Option ` 27.8111
Volatility MeasuresStandard Deviation 6.47Beta 1.03Sharpe Ratio -0.06Note: The above measures have been calculated using monthly rolling returns for 36 months period with 4.04% risk free return (FBIL Overnight MIBOR as on 29/05/2020).
Portfolio Turnover (Times) 0.81
Total Expense Ratio^Regular/Other than Direct 1.91
Direct 1.03
Load structureEntry Load: Nil
Exit Load: 1% if redeemed or switched out on or before completion of 7 days from the date of allotment of units. Nil, thereafter.W.e.f May 22, 2020
Industry Allocation
AMFI Classification
21.91%
10.94%
10.47%
8.30%
7.04%
5.55%
5.03%
4.68%
4.35%
3.46%
Banks
Consumer Non Durables
Petroleum Products
Software
Pharmaceuticals
Industrial Capital Goods
Auto
Telecom - Services
Construction Project
Ferrous Metals
Product Label
This product is suitable for investors who are seeking*:
Investors understand that their principalwill be at Moderately High risk
� Long term capital growth
� Investment predominantly into equity and equity related instruments of large cap companies
*Investors should consult their financial advisors if in doubt about whether the product is suitable for them.
Portfolio as on May 31, 2020
Dividend HistoryRecord Date Rate (`/ Unit) Cum Dividend
NAVEx-Dividend NAV
Dividend Plan
13-Feb-20 0.09 15.1610 15.0610
02-Jan-20 0.09 15.5291 15.4291
02-Dec-19 0.09 15.1372 15.0372
Direct - Dividend Plan
13-Feb-20 0.09 20.2638 20.1638
02-Jan-20 0.09 20.7020 20.6020
02-Dec-19 0.09 20.1336 20.0336
Past performance may or may not be sustained in future. Pursuant to dividend payment, NAV falls to the extent of payout & statutory levy (if applicable). Face Value-`10.
Special Feature: Nippon India Any Time Money Card
Nippon India Large Cap Fund
SIP - If you invested ` 10000 every monthSince Inception 10 Years 5 Years 3 Years 1 Year
Total Amount Invested (`) 1,540,000 1,200,000 600,000 360,000 120,000
Market Value (`) 2,577,353 1,646,822 551,451 291,848 98,030Scheme Return (%) 7.71 6.20 -3.35 -13.43 -33.78B: S&P BSE 100 TRI Return (%) 7.77 6.68 1.09 -6.76 -23.05AB: S&P BSE Sensex TRI Return (%) 8.02 7.08 2.53 -4.76 -23.87Inception Date: August 8, 2007
Past performance may or may not be sustained in future. It is assumed that a SIP of `10,000 each executed on 10th of every month including the first installment in the Growth option of the Fund. Returns on SIP and Benchmark are annualized and cumulative investment return for cash flows resulting out of uniform and regular monthly subscriptions have been worked out on excel spreadsheet function known as XIRR. Load has not been taken into consideration.B: Benchmark, AB: Additional Benchmark, TRI: Total Return IndexTRI - Total Returns Index reflects the returns on the index arising from (a) constituent stock price movements and (b) dividend receipts from constituent index stocks, thereby showing a true picture of returns.
For scheme performance refer page 63-70. For Fund manager wise scheme performance refer page 71-74.
Company/Issuer % of AssetsAutoTata Motors Limited 1.84Ashok Leyland Limited 1.48Hero MotoCorp Limited 1.25BanksICICI Bank Limited* 5.97HDFC Bank Limited* 5.64State Bank of India* 4.78Axis Bank Limited* 3.46Bank of Baroda 2.06Construction ProjectLarsen & Toubro Limited* 3.95Consumer Non DurablesITC Limited* 6.06United Spirits Limited 1.92Colgate Palmolive (India) Limited 1.10Ferrous MetalsTata Steel Limited 2.34Steel Authority of India Limited 1.12FinanceHousing Development Finance Corporation Limited 2.11GasGAIL (India) Limited 1.66Hotels, Resorts And Other Recreational ActivitiesThe Indian Hotels Company Limited 1.82
Industrial Capital Goods
Honeywell Automation India Limited 2.48
ABB India Limited 1.34
Company/Issuer % of Assets
Industrial Products
Bharat Forge Limited 1.67
Minerals/Mining
Coal India Limited 2.02
Petroleum Products
Reliance Industries Limited* 3.80
Hindustan Petroleum Corporation Limited 2.88
Bharat Petroleum Corporation Limited 2.02
Indian Oil Corporation Limited 1.76
Pharmaceuticals
Sun Pharmaceutical Industries Limited 3.01
Divi's Laboratories Limited 2.66
Aurobindo Pharma Limited 1.10
Power
NTPC Limited* 3.11
Software
Infosys Limited* 5.56
HCL Technologies Limited 2.41
Telecom - Services
Bharti Airtel Limited* 4.68
Equity Less Than 1% of Corpus 9.21
Cash and Other Receivables 1.73
Grand Total 100.00
*Top 10 Holdings
Please refer page no. 82 for explanation on symbol: ^ and @ wherever available
Nippon India Large Cap Fund

June 20206 Fundamentals
Large and Mid Cap Fund
Details as on May 31, 2020
Type of Scheme
An open ended equity scheme investing in both large cap and mid cap stock
Current Investment Philosophy
Nippon India Vision Fund is an open ended equity scheme investing in both large cap and mid cap stocks. The fund attempts to invest in high quality businesses who are market leaders in their respective sectors, with a proven track record across market conditions.
Large cap stocks endeavor to provide stability & liquidity to the portfolio and mid caps allocation can potentially generate relatively better returns. Backed by Fund Management expertise & growth oriented strategy, the fund endeavors to generate relatively better risk adjusted returns over the long term.
Date of Allotment
October 8, 1995
Fund Manager
Meenakshi Dawar, Sanjay Doshi (Co-Fund Manager)
Benchmark
Nifty Large Midcap 250 TRI
Fund Size
Monthly Average: ` 1,978.85 Cr
Month End: ` 2,023.90 Cr
NAV as on May 29, 2020Growth Plan ` 410.5098Dividend Plan ` 26.0253Bonus Option ` 69.1397Direct - Growth Plan ` 429.9505Direct - Dividend Plan ` 27.9391Direct - Bonus Option ` 72.8993
Volatility Measures
Standard Deviation 6.52Beta 0.96Sharpe Ratio -0.12Note: The above measures have been calculated using monthly rolling returns for 36 months period with 4.04% risk free return (FBIL Overnight MIBOR as on 29/05/2020).
Portfolio Turnover (Times) 0.76
Total Expense Ratio^
Regular/Other than Direct 2.24
Direct 1.78
Load structure
Entry Load: Nil
Exit Load: 10% of the units allotted shall be redeemed without any exit load, on or before completion of 12 months from the date of allotment of units.Any redemption in excess of such limit in the first 12 months from the date of allotment shall be subject to the following exit load, Redemption of units would be done on First in First out Basis (FIFO):• 1% if redeemed or switched out on or before
completion of 12 months from the date of allotment of units.
• Nil, thereafter.
Industry Allocation
AMFI Classification
18.32%
11.66%
9.59%
8.04%
6.47%
6.19%
5.60%
4.69%
3.29%
3.15%
Banks
Consumer Non Durables
Software
Finance
Industrial Capital Goods
Petroleum Products
Pharmaceuticals
Power
Telecom - Services
Retailing
Product Label
This product is suitable for investors who are seeking*:
Investors understand that their principalwill be at Moderately High risk
� Long term capital growth
� Investment in equity and equity related instruments of large cap & mid cap companies through a research based approach
*Investors should consult their financial advisors if in doubt about whether the product is suitable for them.
Portfolio as on May 31, 2020
Dividend HistoryRecord Date Rate (`/ Unit) Cum Dividend NAV Ex-Dividend NAV
Dividend Plan
24-Jan-20 3.10 38.5050 35.0050
18-Jan-19 3.32 38.6929 34.9429
12-Jan-18 5.25 53.6003 48.3503
Direct - Dividend Plan
24-Jan-20 3.10 41.0141 37.5141
18-Jan-19 3.32 40.7614 37.0114
12-Jan-18 5.25 55.8667 50.6167
Past performance may or may not be sustained in future. Pursuant to dividend payment, NAV falls to the extent of payout & statutory levy (if applicable). Face Value-`10.
Special Feature: Nippon India Any Time Money Card
Nippon India Vision Fund
SIP - If you invested ` 10000 every monthSince Inception 20 Years 15 Years 10 Years 5 Years 3 Years 1 Year
Total Amount Invested (`) 2,950,000 2,400,000 1,800,000 1,200,000 600,000 360,000 120,000
Market Value (`) 30,797,097 12,355,307 2,869,489 1,396,045 508,970 283,901 100,256Scheme Return (%) 16.09 14.45 5.96 2.99 -6.52 -15.13 -30.58B: NIFTY Large Midcap 250 TRI Return (%) N.A N.A 9.45 7.74 -0.34 -9.39 -23.35AB: S&P BSE Sensex TRI Return (%) N.A 12.64 8.73 7.08 2.53 -4.76 -23.87Inception Date: October 8, 1995
N.A : Since TRI data is not available prior to 01/04/2005 & 19/08/1996 for Nifty Large Midcap 250 & S&P BSE Sensex respectively, performance for such period is not provided.
Past performance may or may not be sustained in future. It is assumed that a SIP of `10,000 each executed on 10th of every month including the first installment in the Growth option of the Fund. Returns on SIP and Benchmark are annualized and cumulative investment return for cash flows resulting out of uniform and regular monthly subscriptions have been worked out on excel spreadsheet function known as XIRR. Load has not been taken into consideration.B: Benchmark, AB: Additional Benchmark, TRI: Total Return Index
TRI - Total Returns Index reflects the returns on the index arising from (a) constituent stock price movements and (b) dividend receipts from constituent index stocks, thereby showing a true picture of returns.
For scheme performance refer page 63-70. For Fund manager wise scheme performance refer page 71-74.
Please refer page no. 82 for explanation on symbol: ^ and @ wherever available
Company/Issuer % of AssetsAuto AncillariesMRF Limited 1.38BanksHDFC Bank Limited* 6.55ICICI Bank Limited* 4.52Axis Bank Limited* 2.33State Bank of India 1.90Kotak Mahindra Bank Limited 1.21Construction ProjectLarsen & Toubro Limited* 2.98Consumer DurablesVoltas Limited 2.12Consumer Non DurablesTata Consumer Products Limited* 3.45Hindustan Unilever Limited 2.11ITC Limited 1.81Asian Paints Limited 1.32Marico Limited 1.04Ferrous MetalsTata Steel Limited 1.23FinanceHousing Development Finance Corporation Limited 2.14ICICI Lombard General Insurance Company Limited 1.56Bajaj Finance Limited 1.49HDFC Life Insurance Company Limited 1.29Healthcare ServicesFortis Healthcare Limited 1.20
Company/Issuer % of AssetsIndustrial Capital GoodsHoneywell Automation India Limited* 3.33Bharat Electronics Limited 1.58Industrial ProductsSRF Limited 2.13PesticidesPI Industries Limited 1.61Petroleum ProductsReliance Industries Limited* 4.56PharmaceuticalsTorrent Pharmaceuticals Limited 2.26Sun Pharmaceutical Industries Limited 1.58Alkem Laboratories Limited 1.29PowerNTPC Limited* 2.55Tata Power Company Limited 1.44RetailingTrent Limited 2.08Aditya Birla Fashion and Retail Limited 1.07SoftwareInfosys Limited* 6.17Tata Consultancy Services Limited 1.75Telecom - ServicesBharti Airtel Limited* 3.29Equity Less Than 1% of Corpus 17.84Derivatives, Cash and Other Receivables 3.81Grand Total 100.00
*Top 10 Holdings
w.e.f. March 17, 2020
June 2020Fundamentals 7
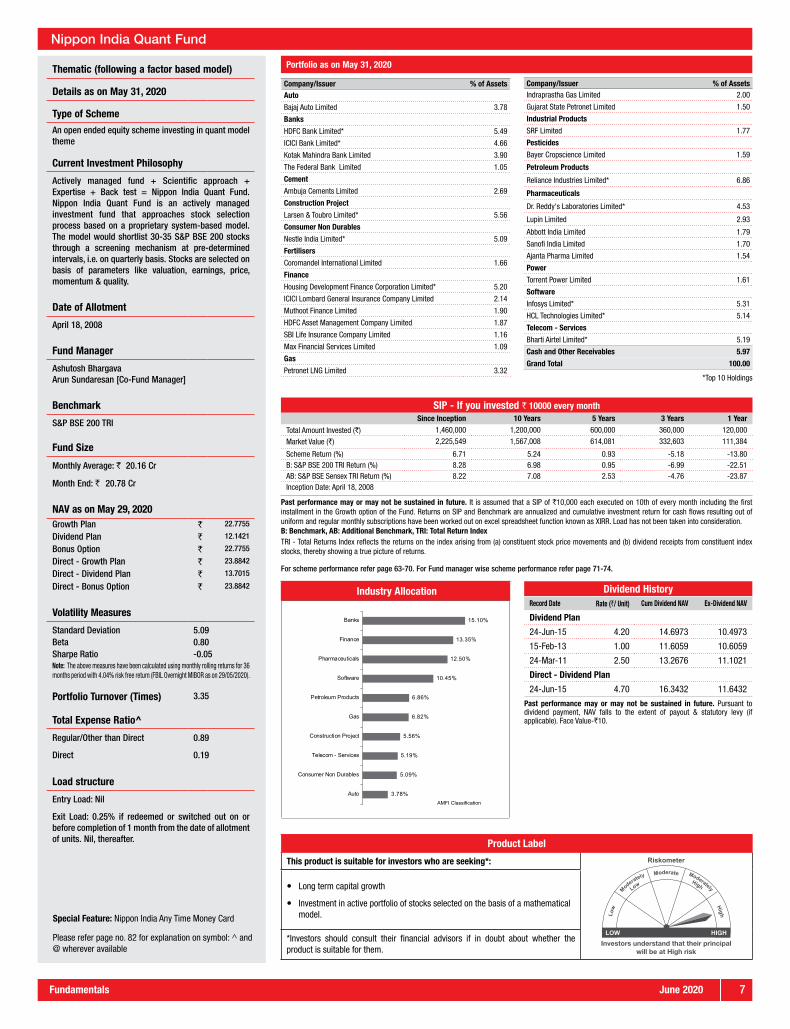
Thematic (following a factor based model)
Details as on May 31, 2020
Type of Scheme
An open ended equity scheme investing in quant model theme
Current Investment Philosophy
Actively managed fund + Scientific approach + Expertise + Back test = Nippon India Quant Fund. Nippon India Quant Fund is an actively managed investment fund that approaches stock selection process based on a proprietary system-based model. The model would shortlist 30-35 S&P BSE 200 stocks through a screening mechanism at pre-determined intervals, i.e. on quarterly basis. Stocks are selected on basis of parameters like valuation, earnings, price, momentum & quality.
Date of Allotment
April 18, 2008
Fund Manager
Ashutosh Bhargava Arun Sundaresan [Co-Fund Manager]
Benchmark
S&P BSE 200 TRI
Fund Size
Monthly Average: ` 20.16 Cr
Month End: ` 20.78 Cr
NAV as on May 29, 2020Growth Plan ` 22.7755
Dividend Plan ` 12.1421
Bonus Option ` 22.7755
Direct - Growth Plan ` 23.8842
Direct - Dividend Plan ` 13.7015
Direct - Bonus Option ` 23.8842
Volatility Measures
Standard Deviation 5.09Beta 0.80Sharpe Ratio -0.05Note: The above measures have been calculated using monthly rolling returns for 36 months period with 4.04% risk free return (FBIL Overnight MIBOR as on 29/05/2020).
Portfolio Turnover (Times) 3.35
Total Expense Ratio^
Regular/Other than Direct 0.89
Direct 0.19
Load structure
Entry Load: Nil
Exit Load: 0.25% if redeemed or switched out on or before completion of 1 month from the date of allotment of units. Nil, thereafter.
Industry Allocation
AMFI Classification
15.10%
13.35%
12.50%
10.45%
6.86%
6.82%
5.56%
5.19%
5.09%
3.78%
Banks
Finance
Pharmaceuticals
Software
Petroleum Products
Gas
Construction Project
Telecom - Services
Consumer Non Durables
Auto
Product Label
This product is suitable for investors who are seeking*:
Investors understand that their principalwill be at High risk
� Long term capital growth
� Investment in active portfolio of stocks selected on the basis of a mathematical model.
*Investors should consult their financial advisors if in doubt about whether the product is suitable for them.
Portfolio as on May 31, 2020
Dividend HistoryRecord Date Rate (`/ Unit) Cum Dividend NAV Ex-Dividend NAV
Dividend Plan
24-Jun-15 4.20 14.6973 10.4973
15-Feb-13 1.00 11.6059 10.6059
24-Mar-11 2.50 13.2676 11.1021
Direct - Dividend Plan
24-Jun-15 4.70 16.3432 11.6432
Past performance may or may not be sustained in future. Pursuant to dividend payment, NAV falls to the extent of payout & statutory levy (if applicable). Face Value-`10.
Nippon India Quant Fund
SIP - If you invested ` 10000 every monthSince Inception 10 Years 5 Years 3 Years 1 Year
Total Amount Invested (`) 1,460,000 1,200,000 600,000 360,000 120,000
Market Value (`) 2,225,549 1,567,008 614,081 332,603 111,384
Scheme Return (%) 6.71 5.24 0.93 -5.18 -13.80B: S&P BSE 200 TRI Return (%) 8.28 6.98 0.95 -6.99 -22.51AB: S&P BSE Sensex TRI Return (%) 8.22 7.08 2.53 -4.76 -23.87Inception Date: April 18, 2008
Past performance may or may not be sustained in future. It is assumed that a SIP of `10,000 each executed on 10th of every month including the first installment in the Growth option of the Fund. Returns on SIP and Benchmark are annualized and cumulative investment return for cash flows resulting out of uniform and regular monthly subscriptions have been worked out on excel spreadsheet function known as XIRR. Load has not been taken into consideration.B: Benchmark, AB: Additional Benchmark, TRI: Total Return IndexTRI - Total Returns Index reflects the returns on the index arising from (a) constituent stock price movements and (b) dividend receipts from constituent index stocks, thereby showing a true picture of returns.
For scheme performance refer page 63-70. For Fund manager wise scheme performance refer page 71-74.
Special Feature: Nippon India Any Time Money Card
Please refer page no. 82 for explanation on symbol: ^ and @ wherever available
Company/Issuer % of AssetsAuto
Bajaj Auto Limited 3.78
Banks
HDFC Bank Limited* 5.49
ICICI Bank Limited* 4.66
Kotak Mahindra Bank Limited 3.90
The Federal Bank Limited 1.05
Cement
Ambuja Cements Limited 2.69
Construction Project
Larsen & Toubro Limited* 5.56
Consumer Non Durables
Nestle India Limited* 5.09
Fertilisers
Coromandel International Limited 1.66
Finance
Housing Development Finance Corporation Limited* 5.20
ICICI Lombard General Insurance Company Limited 2.14
Muthoot Finance Limited 1.90
HDFC Asset Management Company Limited 1.87
SBI Life Insurance Company Limited 1.16
Max Financial Services Limited 1.09
Gas
Petronet LNG Limited 3.32
Company/Issuer % of AssetsIndraprastha Gas Limited 2.00
Gujarat State Petronet Limited 1.50
Industrial Products
SRF Limited 1.77
Pesticides
Bayer Cropscience Limited 1.59
Petroleum Products
Reliance Industries Limited* 6.86
Pharmaceuticals
Dr. Reddy's Laboratories Limited* 4.53
Lupin Limited 2.93
Abbott India Limited 1.79
Sanofi India Limited 1.70
Ajanta Pharma Limited 1.54
Power
Torrent Power Limited 1.61
Software
Infosys Limited* 5.31
HCL Technologies Limited* 5.14
Telecom - Services
Bharti Airtel Limited* 5.19
Cash and Other Receivables 5.97
Grand Total 100.00
*Top 10 Holdings

June 20208 Fundamentals
Balanced Advantage Fund
Details as on May 31, 2020
Type of Scheme
An Open Ended Dynamic Asset Allocation Fund
Current Investment Philosophy
Nippon India Balanced Advantage Fund attempts to capitalize on the potential upside in equity markets while attempting to limit the downside by dynamically managing the portfolio through investment in equity and active use of debt, money market instruments and derivatives. A model based Dynamic Asset Allocation Fund that aims to offer Triple Benefits of 1. Emotion Free Asset Allocation through Model Based Asset Allocation, 2. Lowers downside risk through hedging and 3. Long Term Alpha – through Active Stock selection and Sector. The fund follows an in-house proprietary Model (which follows Valuations & Trend Following) to determine unhedged equity allocation.The fund maintains a large cap oriented portfolio diversified across sectors. Debt portfolio is managed conservatively, focused at the shorter end through investment in a combination of liquid and short term fixed income securities.
Date of Allotment
November 15, 2004
Fund ManagerManish Gunwani, Ashutosh Bhargava (Co-Fund Manager) Prashant Pimple
BenchmarkCRISIL Hybrid 35+65 - Aggressive Index
Fund SizeMonthly Average: ` 2,618.36 CrMonth End: ` 2,663.52 Cr
NAV as on May 29, 2020Growth Plan ` 83.1198Dividend Plan ` 22.2558Bonus Option ` 83.1198Direct - Growth Plan ` 88.0885Direct - Dividend Plan ` 26.8753
Volatility MeasuresStandard Deviation 3.77Beta 0.89Sharpe Ratio -0.05Note: The above measures have been calculated using monthly rolling returns for 36 months period with 4.04% risk free return (FBIL Overnight MIBOR as on 29/05/2020)..
Portfolio Turnover (Times) 3.77
Average Maturity 2.06 Years
Modified Duration 1.44 Years
Yield to Maturity 10.35%
Total Expense Ratio^Regular/Other than Direct 2.04
Direct 0.80
Load structureEntry Load: NilExit Load: 10% of the units allotted shall be redeemed without any exit load, on or before completion of 12 months from the date of allotment of units. Any redemption in excess of such limit in the first 12 months from the date of allotment shall be subject to the following exit load.Redemption of units would be done on First in First out Basis (FIFO):• 1% if redeemed or switched out on or before completion of 12 months from the date of allotment of units.• Nil, thereafter.
Average Maturity, Modified Duration & YTM details provided for Debt portion of Portfolio only.
Industry Allocation
AMFI Classification
12.38%
8.92%
8.63%
7.56%
6.51%
5.23%
2.44%
2.32%
1.81%
1.40%
Banks
Software
Consumer Non Durables
Finance
Petroleum Products
Pharmaceuticals
Auto
Power
Telecom - Services
Auto Ancillaries
Product LabelThis product is suitable for investors who are seeking*:
Investors understand that their principalwill be at Moderately High risk
� Long term capital growth
� Investment in equity & equity related instruments, debt, money market instruments and derivatives
*Investors should consult their financial advisors if in doubt about whether the product is suitable for them.
Portfolio as on May 31, 2020
Dividend HistoryRecord Date Rate (`/ Unit) Cum Dividend NAV Ex-Dividend NAV
Dividend Plan
12-May-20 0.1500 22.2150 22.0650
23-Mar-20 0.1594 20.5704 20.3904
24-Feb-20 0.1594 26.0782 25.8982
Direct - Dividend Plan
12-May-20 0.1500 26.7798 26.6298
23-Mar-20 0.1594 24.7142 24.5342
24-Feb-20 0.1594 31.2522 31.0722
Past performance may or may not be sustained in future. Pursuant to dividend payment, NAV falls to the extent of payout & statutory levy (if applicable). Face Value-`10.
Nippon India Balanced Advantage Fund
Please refer page no. 82 for explanation on symbol: ^ and @ wherever available
Company/Issuer Instrument/Rating % of AssetsEquityNon HedgeBajaj Auto Limited Auto 0.53Hero MotoCorp Limited Auto 0.53TVS Motor Company Limited Auto 0.48Ashok Leyland Limited Auto 0.41MRF Limited Auto Ancillaries 0.49Motherson Sumi Systems Limited Auto Ancillaries 0.46Apollo Tyres Limited Auto Ancillaries 0.27HDFC Bank Limited* Banks 3.97ICICI Bank Limited* Banks 3.94Axis Bank Limited* Banks 1.41Kotak Mahindra Bank Limited Banks 0.30IndusInd Bank Limited Banks 0.21State Bank of India Banks 0.08ACC Limited Cement 0.76The Phoenix Mills Limited Construction 0.75Oberoi Realty Limited Construction 0.61Larsen & Toubro Limited Construction Project 0.27Sterling And Wilson Solar Limited Construction Project 0.10Titan Company Limited Consumer Durables 0.40
ITC Limited* Consumer Non Durables 2.28
Varun Beverages Limited* Consumer Non Durables 1.37
Marico Limited* Consumer Non Durables 1.29
Hindustan Unilever Limited Consumer Non Durables 1.11
Asian Paints Limited Consumer Non Durables 0.41
United Breweries Limited Consumer Non Durables 0.34
Tata Consumer Products Limited Consumer Non Durables 0.32
Tata Steel Limited Ferrous Metals 0.14Cholamandalam Financial Holdings Limited* Finance 1.43Muthoot Finance Limited Finance 0.84JM Financial Limited Finance 0.74Indian Energy Exchange Limited Finance 0.73ICICI Lombard General Insurance Company Limited
Finance 0.67
Housing Development Finance Corporation Limited
Finance 0.60
Bajaj Finserv Limited Finance 0.44Power Finance Corporation Limited Finance 0.41Mahindra & Mahindra Financial Services Limited
Finance 0.39
CreditAccess Grameen Limited Finance 0.32Bajaj Finance Limited Finance 0.21ICICI Prudential Life Insurance Company Limited
Finance 0.01
GAIL (India) Limited Gas 0.30Fortis Healthcare Limited Healthcare Services 0.67Bharat Forge Limited Industrial Products 0.59
PVR Limited Media & Entertainment 0.07
Hindalco Industries Limited Non - Ferrous Metals 0.52Vedanta Limited Non - Ferrous Metals 0.23
For SIP performance refer page 61. For scheme performance refer page 63-70. For Fund manager wise scheme performance refer page 71-74.
Special Feature: Nippon India Any Time Money Card
Company/Issuer Instrument/Rating % of AssetsUPL Limited Pesticides 0.52Reliance Industries Limited* Petroleum Products 4.06Bharat Petroleum Corporation Limited Petroleum Products 0.80Mangalore Refinery and Petrochemicals Limited
Petroleum Products 0.45
Lupin Limited Pharmaceuticals 0.94Cipla Limited Pharmaceuticals 0.93Sun Pharmaceutical Industries Limited Pharmaceuticals 0.90Syngene International Limited Pharmaceuticals 0.64Sanofi India Limited Pharmaceuticals 0.49Dr. Reddy's Laboratories Limited Pharmaceuticals 0.42Torrent Pharmaceuticals Limited Pharmaceuticals 0.09NLC India Limited Power 0.85Tata Power Company Limited Power 0.77Power Grid Corporation of India Limited Power 0.41Aditya Birla Fashion and Retail Limited Retailing 1.09Infosys Limited* Software 3.61Tech Mahindra Limited Software 0.95HCL Technologies Limited Software 0.91L&T Technology Services Limited Software 0.76Tata Consultancy Services Limited Software 0.75Cyient Limited Software 0.49Bharti Airtel Limited* Telecom - Services 1.39Vardhman Textiles Limited Textiles - Cotton 0.79Container Corporation of India Limited Transportation 0.44InterGlobe Aviation Limited Transportation 0.35Non-Hedge Total 56.20Hedge Total 10.68DEBTCorporate BondsVedanta Limited CRISIL AA 1.72Shriram Transport Finance Company Limited CRISIL AA+ 1.83Muthoot Fincorp Ltd CRISIL AA+(CE) 1.86Nirma Limited CRISIL AA- 4.61India Infradebt Limited CRISIL AAA 2.79Power Finance Corporation Limited CRISIL AAA 0.57Housing Development Finance Corporation Limited
CRISIL AAA 0.19
Reliance Industries Limited CRISIL AAA 0.13
REC LimitedCRISIL AAA/CRISIL AAA/CRISIL AAA
2.17
PNB Housing Finance Limited FITCH AA 0.37L&T Metro Rail (Hyderabad) Limited ICRA AAA(CE) 0.98Nabha Power Limited ICRA AAA(CE) 0.96Exchange Traded FundsNippon India Mutual Fund 0.33PTCINDIAN RECEIVABLE TRUST 19 – FEB 2019 CARE A(SO) 2.93Reduced Face Value Bonds - Non AmortisationIndInfravit Trust CRISIL AAA 1.89Zero Coupon Bond
EMBASSY OFFICE PARK REITCRISIL AAA/CRISIL AAA
3.16
Net Current Assets and Liabilities 6.62Grand Total 100.00
*Top 10 Holdings
Rating ProfileEquity, 66.87%
A+/A/A-/A1, 2.93%
AA-, 4.61%AA, 2.09%
AA+, 3.69%
AAA/SOV/A1+/Cash & Other Receivables, 19.47%
ETF, 0.33%
Asset AllocationEquity, 66.87%
Cash & Other Receivables, 6.62%
Exchange Traded Funds, 0.33%
PTC, 2.93%Zero Coupon Bond, 3.16%
Corporate Bond, 20.08%
June 2020Fundamentals 9
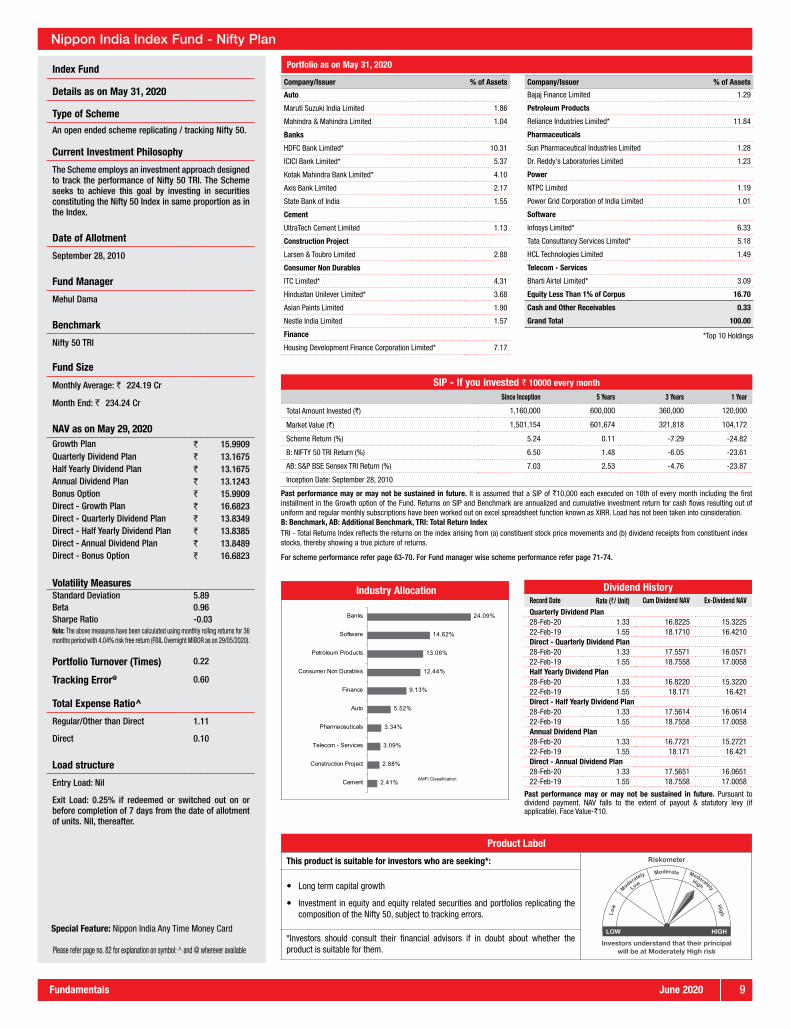
Index Fund
Details as on May 31, 2020
Type of Scheme
An open ended scheme replicating / tracking Nifty 50.
Current Investment Philosophy
The Scheme employs an investment approach designed to track the performance of Nifty 50 TRI. The Scheme seeks to achieve this goal by investing in securities constituting the Nifty 50 Index in same proportion as in the Index.
Date of Allotment
September 28, 2010
Fund Manager
Mehul Dama
Benchmark
Nifty 50 TRI
Fund Size
Monthly Average: ` 224.19 Cr
Month End: ` 234.24 Cr
NAV as on May 29, 2020Growth Plan ` 15.9909Quarterly Dividend Plan ` 13.1675Half Yearly Dividend Plan ` 13.1675Annual Dividend Plan ` 13.1243Bonus Option ` 15.9909Direct - Growth Plan ` 16.6823Direct - Quarterly Dividend Plan ` 13.8349Direct - Half Yearly Dividend Plan ` 13.8385Direct - Annual Dividend Plan ` 13.8489Direct - Bonus Option ` 16.6823
Volatility MeasuresStandard Deviation 5.89Beta 0.96Sharpe Ratio -0.03Note: The above measures have been calculated using monthly rolling returns for 36 months period with 4.04% risk free return (FBIL Overnight MIBOR as on 29/05/2020).
Portfolio Turnover (Times) 0.22
Tracking Error@ 0.60
Total Expense Ratio^
Regular/Other than Direct 1.11
Direct 0.10
Load structure
Entry Load: Nil
Exit Load: 0.25% if redeemed or switched out on or before completion of 7 days from the date of allotment of units. Nil, thereafter.
Industry Allocation
AMFI Classification
24.09%
14.62%
13.06%
12.44%
9.13%
5.52%
3.34%
3.09%
2.88%
2.41%
Banks
Software
Petroleum Products
Consumer Non Durables
Finance
Auto
Pharmaceuticals
Telecom - Services
Construction Project
Cement
Product Label
This product is suitable for investors who are seeking*:
Investors understand that their principalwill be at Moderately High risk
� Long term capital growth
� Investment in equity and equity related securities and portfolios replicating the composition of the Nifty 50, subject to tracking errors.
*Investors should consult their financial advisors if in doubt about whether the product is suitable for them.
Portfolio as on May 31, 2020
Special Feature: Nippon India Any Time Money Card
Nippon India Index Fund - Nifty Plan
SIP - If you invested ` 10000 every monthSince Inception 5 Years 3 Years 1 Year
Total Amount Invested (`) 1,160,000 600,000 360,000 120,000
Market Value (`) 1,501,154 601,674 321,818 104,172
Scheme Return (%) 5.24 0.11 -7.29 -24.82
B: NIFTY 50 TRI Return (%) 6.50 1.48 -6.05 -23.61
AB: S&P BSE Sensex TRI Return (%) 7.03 2.53 -4.76 -23.87
Inception Date: September 28, 2010
Past performance may or may not be sustained in future. It is assumed that a SIP of `10,000 each executed on 10th of every month including the first installment in the Growth option of the Fund. Returns on SIP and Benchmark are annualized and cumulative investment return for cash flows resulting out of uniform and regular monthly subscriptions have been worked out on excel spreadsheet function known as XIRR. Load has not been taken into consideration.B: Benchmark, AB: Additional Benchmark, TRI: Total Return IndexTRI - Total Returns Index reflects the returns on the index arising from (a) constituent stock price movements and (b) dividend receipts from constituent index stocks, thereby showing a true picture of returns.
For scheme performance refer page 63-70. For Fund manager wise scheme performance refer page 71-74.
Please refer page no. 82 for explanation on symbol: ^ and @ wherever available
Company/Issuer % of Assets
Auto
Maruti Suzuki India Limited 1.86
Mahindra & Mahindra Limited 1.04
Banks
HDFC Bank Limited* 10.31
ICICI Bank Limited* 5.37
Kotak Mahindra Bank Limited* 4.10
Axis Bank Limited 2.17
State Bank of India 1.55
Cement
UltraTech Cement Limited 1.13
Construction Project
Larsen & Toubro Limited 2.88
Consumer Non Durables
ITC Limited* 4.31
Hindustan Unilever Limited* 3.68
Asian Paints Limited 1.90
Nestle India Limited 1.57
Finance
Housing Development Finance Corporation Limited* 7.17
Company/Issuer % of Assets
Bajaj Finance Limited 1.29
Petroleum Products
Reliance Industries Limited* 11.84
Pharmaceuticals
Sun Pharmaceutical Industries Limited 1.28
Dr. Reddy's Laboratories Limited 1.23
Power
NTPC Limited 1.19
Power Grid Corporation of India Limited 1.01
Software
Infosys Limited* 6.33
Tata Consultancy Services Limited* 5.18
HCL Technologies Limited 1.49
Telecom - Services
Bharti Airtel Limited* 3.09
Equity Less Than 1% of Corpus 16.70
Cash and Other Receivables 0.33
Grand Total 100.00
*Top 10 Holdings
Dividend HistoryRecord Date Rate (`/ Unit) Cum Dividend NAV Ex-Dividend NAVQuarterly Dividend Plan28-Feb-20 1.33 16.8225 15.322522-Feb-19 1.55 18.1710 16.4210Direct - Quarterly Dividend Plan28-Feb-20 1.33 17.5571 16.057122-Feb-19 1.55 18.7558 17.0058Half Yearly Dividend Plan28-Feb-20 1.33 16.8220 15.322022-Feb-19 1.55 18.171 16.421Direct - Half Yearly Dividend Plan28-Feb-20 1.33 17.5614 16.061422-Feb-19 1.55 18.7558 17.0058Annual Dividend Plan28-Feb-20 1.33 16.7721 15.272122-Feb-19 1.55 18.171 16.421Direct - Annual Dividend Plan28-Feb-20 1.33 17.5651 16.065122-Feb-19 1.55 18.7558 17.0058
Past performance may or may not be sustained in future. Pursuant to dividend payment, NAV falls to the extent of payout & statutory levy (if applicable). Face Value-`10.

June 202010 Fundamentals
Index Fund
Details as on May 31, 2020
Type of Scheme
An open ended scheme replicating/tracking S&P BSE Sensex.
Current Investment Philosophy
The Scheme employs an investment approach designed to track the performance of S&P BSE Sensex TRI. The Scheme seeks to achieve this goal by investing in securities constituting the S&P BSE Sensex Index in same proportion as in the Index.
Date of Allotment
September 28, 2010
Fund Manager
Mehul Dama
Benchmark
S&P BSE Sensex TRI
Fund Size
Monthly Average: ` 74.49 Cr
Month End: ` 79.49 Cr
NAV as on May 29, 2020Growth Plan ` 16.0051Quarterly Dividend Plan ` 13.1783Half Yearly Dividend Plan ` 13.1776Annual Dividend Plan ` 13.1775Bonus Option ` 16.0051Direct - Growth Plan ` 16.6294Direct - Quarterly Dividend Plan ` 13.7801Direct - Half Yearly Dividend Plan ` 13.7657Direct - Annual Dividend Plan ` 13.7753Direct - Bonus Option ` 16.6294
Volatility MeasuresStandard Deviation 5.83Beta 0.96
Sharpe Ratio 0.00Note: The above measures have been calculated using monthly rolling returns for 36 months period with 4.04% risk free return (FBIL Overnight MIBOR as on 29/05/2020).
Portfolio Turnover (Times) 0.37
Tracking Error@ 0.63
Total Expense Ratio^
Regular/Other than Direct 0.55
Direct 0.10
Load structure
Entry Load: Nil
Exit Load: 0.25% if redeemed or switched out on or before completion of 7 days from the date of allotment of units. Nil, thereafter.
Industry Allocation
AMFI Classification
26.70%
15.98%
14.05%
13.29%
9.55%
5.22%
3.80%
3.25%
2.25%
1.47%
Banks
Software
Consumer Non Durables
Petroleum Products
Finance
Auto
Telecom - Services
Construction Project
Power
Pharmaceuticals
Product Label
This product is suitable for investors who are seeking*:
Investors understand that their principalwill be at Moderately High risk
� Long term capital growth
� Investment in equity and equity related securities and portfolios replicating the composition of the sensex, subject to tracking errors.
*Investors should consult their financial advisors if in doubt about whether the product is suitable for them.
Portfolio as on May 31, 2020
Special Feature: Nippon India Any Time Money Card
Nippon India Index Fund - Sensex Plan
SIP - If you invested ` 10000 every monthSince Inception 5 Years 3 Years 1 Year
Total Amount Invested (`) 1,160,000 600,000 360,000 120,000
Market Value (`) 1,534,600 621,981 330,304 104,594
Scheme Return (%) 5.69 1.44 -5.63 -24.19
B: S&P BSE Sensex TRI Return (%) 7.03 2.53 -4.76 -23.87
AB: Nifty 50 TRI Return (%) 6.50 1.48 -6.05 -23.61
Inception Date: September 28, 2010
Past performance may or may not be sustained in future. It is assumed that a SIP of `10,000 each executed on 10th of every month including the first installment in the Growth option of the Fund. Returns on SIP and Benchmark are annualized and cumulative investment return for cash flows resulting out of uniform and regular monthly subscriptions have been worked out on excel spreadsheet function known as XIRR. Load has not been taken into consideration.B: Benchmark, AB: Additional Benchmark, TRI: Total Return IndexTRI - Total Returns Index reflects the returns on the index arising from (a) constituent stock price movements and (b) dividend receipts from constituent index stocks, thereby showing a true picture of returns.
For scheme performance refer page 63-70. For Fund manager wise scheme performance refer page 71-74.
Please refer page no. 82 for explanation on symbol: ^ and @ wherever available
Company/Issuer % of Assets
Auto
Maruti Suzuki India Limited 2.14
Mahindra & Mahindra Limited 1.20
Bajaj Auto Limited 1.01
Banks
HDFC Bank Limited* 11.55
ICICI Bank Limited* 6.10
Kotak Mahindra Bank Limited* 4.14
Axis Bank Limited 2.51
State Bank of India 1.72
Cement
UltraTech Cement Limited 1.26
Construction Project
Larsen & Toubro Limited 3.25
Consumer Durables
Titan Company Limited 1.06
Consumer Non Durables
Hindustan Unilever Limited* 5.26
ITC Limited* 4.82
Asian Paints Limited 2.18
Nestle India Limited 1.79
Company/Issuer % of Assets
Finance
Housing Development Finance Corporation Limited* 8.17
Bajaj Finance Limited 1.38
Petroleum Products
Reliance Industries Limited* 13.29
Pharmaceuticals
Sun Pharmaceutical Industries Limited 1.47
Power
NTPC Limited 1.19
Power Grid Corporation of India Limited 1.06
Software
Infosys Limited* 7.40
Tata Consultancy Services Limited* 5.93
HCL Technologies Limited 1.71
Telecom - Services
Bharti Airtel Limited* 3.80
Equity Less Than 1% of Corpus 3.88
Cash and Other Receivables 0.72
Grand Total 100.00
*Top 10 Holdings
Dividend HistoryRecord Date Rate (`/ Unit) Cum Dividend NAV Ex-Dividend NAV
Quarterly Dividend Plan28-Feb-20 1.33 16.9207 15.420722-Feb-19 1.55 17.8002 16.0502Direct - Quarterly Dividend Plan28-Feb-20 1.33 17.6072 16.107222-Feb-19 1.55 18.3383 16.5883Half Yearly Dividend Plan28-Feb-20 1.33 16.9200 15.420022-Feb-19 1.55 17.8002 16.0502Direct - Half Yearly Dividend Plan28-Feb-20 1.33 17.6038 16.103822-Feb-19 1.55 18.3383 16.5883Annual Dividend Plan28-Feb-20 1.33 16.9198 15.419822-Feb-19 1.55 17.8002 16.0502Direct - Annual Dividend Plan28-Feb-20 1.33 17.6113 16.111322-Feb-19 1.55 18.3383 16.5883
Past performance may or may not be sustained in future. Pursuant to dividend payment, NAV falls to the extent of payout & statutory levy (if applicable). Face Value-`10.
June 2020Fundamentals 11
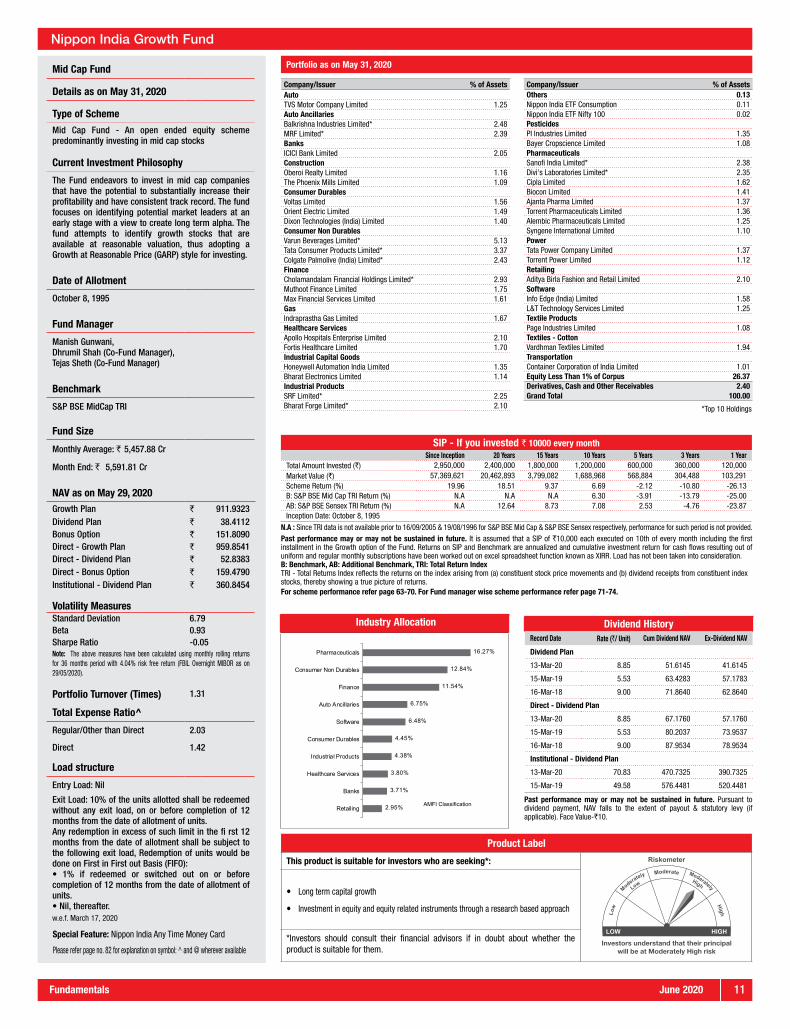
Mid Cap Fund
Details as on May 31, 2020
Type of Scheme
Mid Cap Fund - An open ended equity scheme predominantly investing in mid cap stocks
Current Investment Philosophy
The Fund endeavors to invest in mid cap companies that have the potential to substantially increase their profitability and have consistent track record. The fund focuses on identifying potential market leaders at an early stage with a view to create long term alpha. The fund attempts to identify growth stocks that are available at reasonable valuation, thus adopting a Growth at Reasonable Price (GARP) style for investing.
Date of Allotment
October 8, 1995
Fund Manager
Manish Gunwani,Dhrumil Shah (Co-Fund Manager), Tejas Sheth (Co-Fund Manager)
Benchmark
S&P BSE MidCap TRI
Fund Size
Monthly Average: ` 5,457.88 Cr
Month End: ` 5,591.81 Cr
NAV as on May 29, 2020Growth Plan ` 911.9323Dividend Plan ` 38.4112Bonus Option ` 151.8090Direct - Growth Plan ` 959.8541Direct - Dividend Plan ` 52.8383Direct - Bonus Option ` 159.4790Institutional - Dividend Plan ` 360.8454
Volatility MeasuresStandard Deviation 6.79Beta 0.93Sharpe Ratio -0.05Note: The above measures have been calculated using monthly rolling returns for 36 months period with 4.04% risk free return (FBIL Overnight MIBOR as on 29/05/2020).
Portfolio Turnover (Times) 1.31
Total Expense Ratio^
Regular/Other than Direct 2.03
Direct 1.42
Load structure
Entry Load: Nil
Exit Load: 10% of the units allotted shall be redeemed without any exit load, on or before completion of 12 months from the date of allotment of units.Any redemption in excess of such limit in the fi rst 12 months from the date of allotment shall be subject to the following exit load, Redemption of units would be done on First in First out Basis (FIFO):• 1% if redeemed or switched out on or before completion of 12 months from the date of allotment of units.• Nil, thereafter.
Industry Allocation
AMFI Classification
16.27%
12.84%
11.54%
6.75%
6.48%
4.45%
4.38%
3.80%
3.71%
2.95%
Pharmaceuticals
Consumer Non Durables
Finance
Auto Ancillaries
Software
Consumer Durables
Industrial Products
Healthcare Services
Banks
Retailing
Portfolio as on May 31, 2020
Dividend HistoryRecord Date Rate (`/ Unit) Cum Dividend NAV Ex-Dividend NAV
Dividend Plan
13-Mar-20 8.85 51.6145 41.6145
15-Mar-19 5.53 63.4283 57.1783
16-Mar-18 9.00 71.8640 62.8640
Direct - Dividend Plan
13-Mar-20 8.85 67.1760 57.1760
15-Mar-19 5.53 80.2037 73.9537
16-Mar-18 9.00 87.9534 78.9534
Institutional - Dividend Plan
13-Mar-20 70.83 470.7325 390.7325
15-Mar-19 49.58 576.4481 520.4481
Past performance may or may not be sustained in future. Pursuant to dividend payment, NAV falls to the extent of payout & statutory levy (if applicable). Face Value-`10.
Special Feature: Nippon India Any Time Money Card
Nippon India Growth Fund
SIP - If you invested ` 10000 every monthSince Inception 20 Years 15 Years 10 Years 5 Years 3 Years 1 Year
Total Amount Invested (`) 2,950,000 2,400,000 1,800,000 1,200,000 600,000 360,000 120,000Market Value (`) 57,369,621 20,462,893 3,799,082 1,688,968 568,884 304,488 103,291Scheme Return (%) 19.96 18.51 9.37 6.69 -2.12 -10.80 -26.13B: S&P BSE Mid Cap TRI Return (%) N.A N.A N.A 6.30 -3.91 -13.79 -25.00AB: S&P BSE Sensex TRI Return (%) N.A 12.64 8.73 7.08 2.53 -4.76 -23.87Inception Date: October 8, 1995
N.A : Since TRI data is not available prior to 16/09/2005 & 19/08/1996 for S&P BSE Mid Cap & S&P BSE Sensex respectively, performance for such period is not provided.Past performance may or may not be sustained in future. It is assumed that a SIP of `10,000 each executed on 10th of every month including the first installment in the Growth option of the Fund. Returns on SIP and Benchmark are annualized and cumulative investment return for cash flows resulting out of uniform and regular monthly subscriptions have been worked out on excel spreadsheet function known as XIRR. Load has not been taken into consideration.B: Benchmark, AB: Additional Benchmark, TRI: Total Return IndexTRI - Total Returns Index reflects the returns on the index arising from (a) constituent stock price movements and (b) dividend receipts from constituent index stocks, thereby showing a true picture of returns. For scheme performance refer page 63-70. For Fund manager wise scheme performance refer page 71-74.
Please refer page no. 82 for explanation on symbol: ^ and @ wherever available
Product Label
This product is suitable for investors who are seeking*:
Investors understand that their principalwill be at Moderately High risk
� Long term capital growth
� Investment in equity and equity related instruments through a research based approach
*Investors should consult their financial advisors if in doubt about whether the product is suitable for them.
Company/Issuer % of AssetsAutoTVS Motor Company Limited 1.25Auto AncillariesBalkrishna Industries Limited* 2.48MRF Limited* 2.39BanksICICI Bank Limited 2.05ConstructionOberoi Realty Limited 1.16The Phoenix Mills Limited 1.09Consumer DurablesVoltas Limited 1.56Orient Electric Limited 1.49Dixon Technologies (India) Limited 1.40Consumer Non DurablesVarun Beverages Limited* 5.13Tata Consumer Products Limited* 3.37Colgate Palmolive (India) Limited* 2.43FinanceCholamandalam Financial Holdings Limited* 2.93Muthoot Finance Limited 1.75Max Financial Services Limited 1.61GasIndraprastha Gas Limited 1.67Healthcare ServicesApollo Hospitals Enterprise Limited 2.10Fortis Healthcare Limited 1.70Industrial Capital GoodsHoneywell Automation India Limited 1.35Bharat Electronics Limited 1.14Industrial ProductsSRF Limited* 2.25Bharat Forge Limited* 2.10
Company/Issuer % of AssetsOthers 0.13Nippon India ETF Consumption 0.11Nippon India ETF Nifty 100 0.02PesticidesPI Industries Limited 1.35Bayer Cropscience Limited 1.08PharmaceuticalsSanofi India Limited* 2.38Divi's Laboratories Limited* 2.35Cipla Limited 1.62Biocon Limited 1.41Ajanta Pharma Limited 1.37Torrent Pharmaceuticals Limited 1.36Alembic Pharmaceuticals Limited 1.25Syngene International Limited 1.10PowerTata Power Company Limited 1.37Torrent Power Limited 1.12RetailingAditya Birla Fashion and Retail Limited 2.10SoftwareInfo Edge (India) Limited 1.58L&T Technology Services Limited 1.25Textile ProductsPage Industries Limited 1.08Textiles - CottonVardhman Textiles Limited 1.94TransportationContainer Corporation of India Limited 1.01Equity Less Than 1% of Corpus 26.37Derivatives, Cash and Other Receivables 2.40Grand Total 100.00
*Top 10 Holdings
w.e.f. March 17, 2020
June 202012 Fundamentals
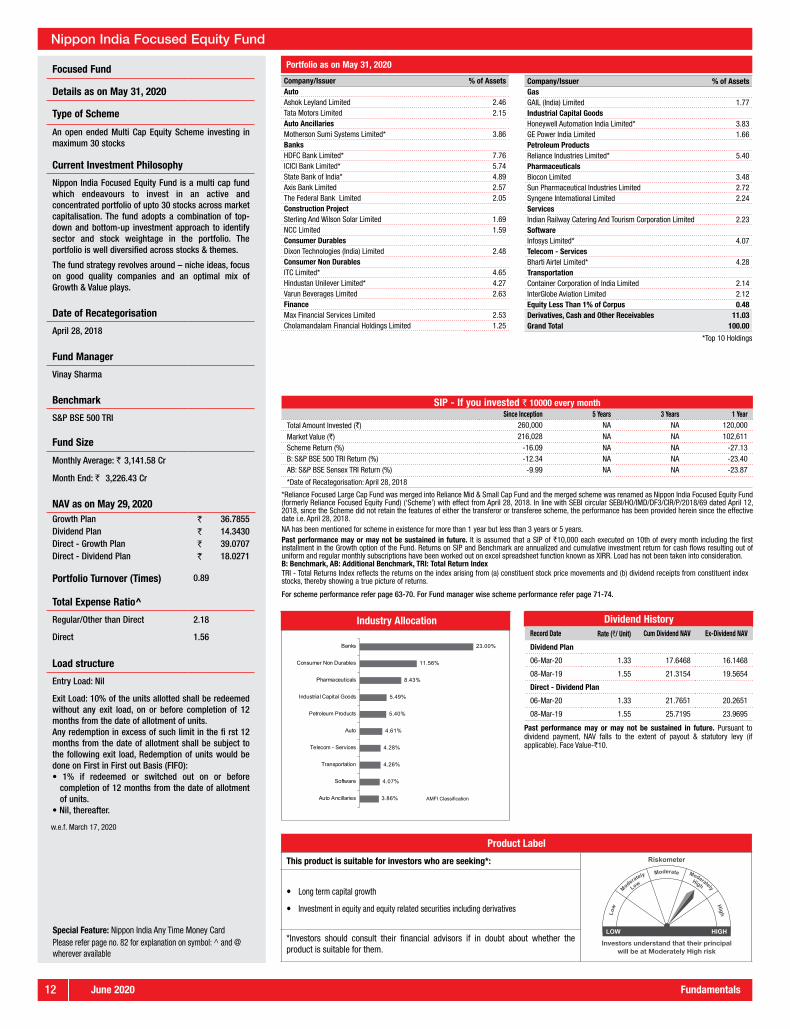
Focused Fund
Details as on May 31, 2020
Type of Scheme
An open ended Multi Cap Equity Scheme investing in maximum 30 stocks
Current Investment Philosophy
Nippon India Focused Equity Fund is a multi cap fund which endeavours to invest in an active and concentrated portfolio of upto 30 stocks across market capitalisation. The fund adopts a combination of top-down and bottom-up investment approach to identify sector and stock weightage in the portfolio. The portfolio is well diversified across stocks & themes.
The fund strategy revolves around – niche ideas, focus on good quality companies and an optimal mix of Growth & Value plays.
Date of Recategorisation
April 28, 2018
Fund Manager
Vinay Sharma
Benchmark
S&P BSE 500 TRI
Fund Size
Monthly Average: ` 3,141.58 Cr
Month End: ` 3,226.43 Cr
NAV as on May 29, 2020Growth Plan ` 36.7855Dividend Plan ` 14.3430Direct - Growth Plan ` 39.0707Direct - Dividend Plan ` 18.0271
Portfolio Turnover (Times) 0.89
Total Expense Ratio^
Regular/Other than Direct 2.18
Direct 1.56
Load structure
Entry Load: Nil
Exit Load: 10% of the units allotted shall be redeemed without any exit load, on or before completion of 12 months from the date of allotment of units.Any redemption in excess of such limit in the fi rst 12 months from the date of allotment shall be subject to the following exit load, Redemption of units would be done on First in First out Basis (FIFO):• 1% if redeemed or switched out on or before
completion of 12 months from the date of allotment of units.
• Nil, thereafter.
Industry Allocation
AMFI Classification
23.00%
11.56%
8.43%
5.49%
5.40%
4.61%
4.28%
4.26%
4.07%
3.86%
Banks
Consumer Non Durables
Pharmaceuticals
Industrial Capital Goods
Petroleum Products
Auto
Telecom - Services
Transportation
Software
Auto Ancillaries
Product Label
This product is suitable for investors who are seeking*:
Investors understand that their principalwill be at Moderately High risk
� Long term capital growth
� Investment in equity and equity related securities including derivatives
*Investors should consult their financial advisors if in doubt about whether the product is suitable for them.
Portfolio as on May 31, 2020
Dividend HistoryRecord Date Rate (`/ Unit) Cum Dividend NAV Ex-Dividend NAV
Dividend Plan
06-Mar-20 1.33 17.6468 16.1468
08-Mar-19 1.55 21.3154 19.5654
Direct - Dividend Plan
06-Mar-20 1.33 21.7651 20.2651
08-Mar-19 1.55 25.7195 23.9695
Past performance may or may not be sustained in future. Pursuant to dividend payment, NAV falls to the extent of payout & statutory levy (if applicable). Face Value-`10.
Special Feature: Nippon India Any Time Money Card
Nippon India Focused Equity Fund
Please refer page no. 82 for explanation on symbol: ^ and @ wherever available
Company/Issuer % of AssetsAutoAshok Leyland Limited 2.46Tata Motors Limited 2.15Auto AncillariesMotherson Sumi Systems Limited* 3.86BanksHDFC Bank Limited* 7.76ICICI Bank Limited* 5.74State Bank of India* 4.89Axis Bank Limited 2.57The Federal Bank Limited 2.05Construction ProjectSterling And Wilson Solar Limited 1.69NCC Limited 1.59Consumer DurablesDixon Technologies (India) Limited 2.48Consumer Non DurablesITC Limited* 4.65Hindustan Unilever Limited* 4.27Varun Beverages Limited 2.63FinanceMax Financial Services Limited 2.53Cholamandalam Financial Holdings Limited 1.25
Company/Issuer % of AssetsGasGAIL (India) Limited 1.77Industrial Capital GoodsHoneywell Automation India Limited* 3.83GE Power India Limited 1.66Petroleum ProductsReliance Industries Limited* 5.40PharmaceuticalsBiocon Limited 3.48Sun Pharmaceutical Industries Limited 2.72Syngene International Limited 2.24ServicesIndian Railway Catering And Tourism Corporation Limited 2.23SoftwareInfosys Limited* 4.07Telecom - ServicesBharti Airtel Limited* 4.28TransportationContainer Corporation of India Limited 2.14InterGlobe Aviation Limited 2.12Equity Less Than 1% of Corpus 0.48Derivatives, Cash and Other Receivables 11.03Grand Total 100.00
*Top 10 Holdings
SIP - If you invested ` 10000 every monthSince Inception 5 Years 3 Years 1 Year
Total Amount Invested (`) 260,000 NA NA 120,000
Market Value (`) 216,028 NA NA 102,611Scheme Return (%) -16.09 NA NA -27.13B: S&P BSE 500 TRI Return (%) -12.34 NA NA -23.40AB: S&P BSE Sensex TRI Return (%) -9.99 NA NA -23.87
*Date of Recategorisation: April 28, 2018
*Reliance Focused Large Cap Fund was merged into Reliance Mid & Small Cap Fund and the merged scheme was renamed as Nippon India Focused Equity Fund (formerly Reliance Focused Equity Fund) (‘Scheme’) with effect from April 28, 2018. In line with SEBI circular SEBI/HO/IMD/DF3/CIR/P/2018/69 dated April 12, 2018, since the Scheme did not retain the features of either the transferor or transferee scheme, the performance has been provided herein since the effective date i.e. April 28, 2018.NA has been mentioned for scheme in existence for more than 1 year but less than 3 years or 5 years.Past performance may or may not be sustained in future. It is assumed that a SIP of `10,000 each executed on 10th of every month including the first installment in the Growth option of the Fund. Returns on SIP and Benchmark are annualized and cumulative investment return for cash flows resulting out of uniform and regular monthly subscriptions have been worked out on excel spreadsheet function known as XIRR. Load has not been taken into consideration.B: Benchmark, AB: Additional Benchmark, TRI: Total Return IndexTRI - Total Returns Index reflects the returns on the index arising from (a) constituent stock price movements and (b) dividend receipts from constituent index stocks, thereby showing a true picture of returns.
For scheme performance refer page 63-70. For Fund manager wise scheme performance refer page 71-74.
w.e.f. March 17, 2020
June 2020Fundamentals 13
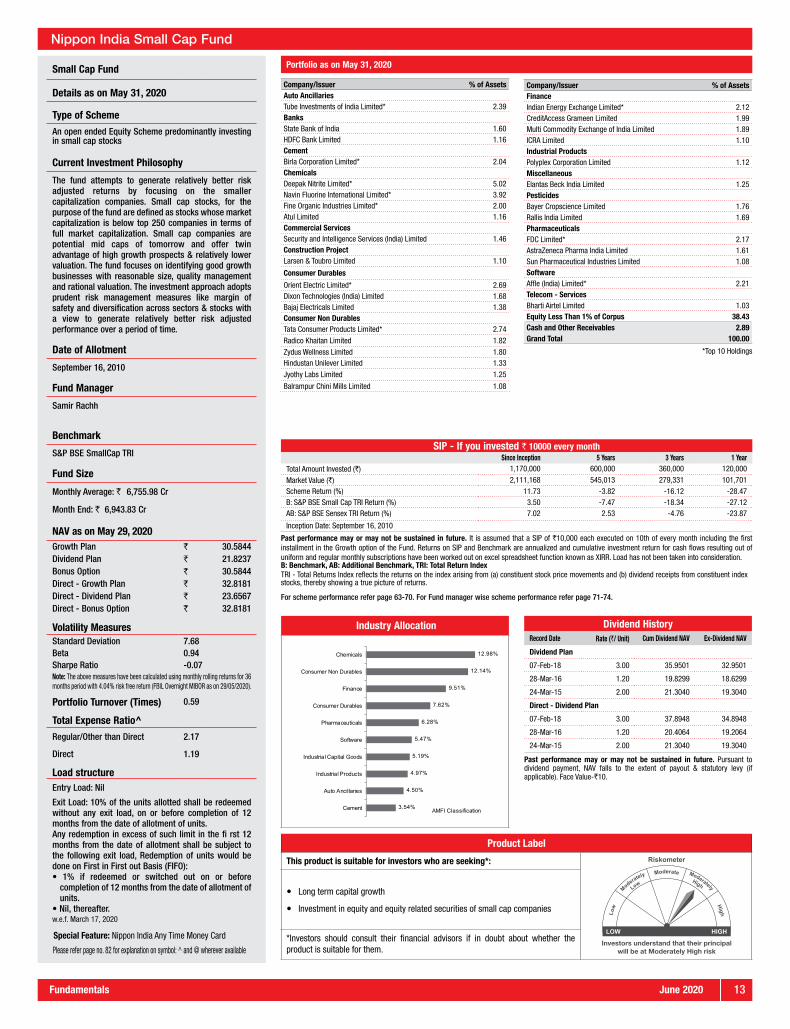
Small Cap Fund
Details as on May 31, 2020
Type of Scheme
An open ended Equity Scheme predominantly investing in small cap stocks
Current Investment Philosophy
The fund attempts to generate relatively better risk adjusted returns by focusing on the smaller capitalization companies. Small cap stocks, for the purpose of the fund are defined as stocks whose market capitalization is below top 250 companies in terms of full market capitalization. Small cap companies are potential mid caps of tomorrow and offer twin advantage of high growth prospects & relatively lower valuation. The fund focuses on identifying good growth businesses with reasonable size, quality management and rational valuation. The investment approach adopts prudent risk management measures like margin of safety and diversification across sectors & stocks with a view to generate relatively better risk adjusted performance over a period of time.
Date of Allotment
September 16, 2010
Fund Manager
Samir Rachh
Benchmark
S&P BSE SmallCap TRI
Fund Size
Monthly Average: ` 6,755.98 Cr
Month End: ` 6,943.83 Cr
NAV as on May 29, 2020Growth Plan ` 30.5844Dividend Plan ` 21.8237Bonus Option ` 30.5844Direct - Growth Plan ` 32.8181Direct - Dividend Plan ` 23.6567Direct - Bonus Option ` 32.8181
Volatility MeasuresStandard Deviation 7.68Beta 0.94Sharpe Ratio -0.07Note: The above measures have been calculated using monthly rolling returns for 36 months period with 4.04% risk free return (FBIL Overnight MIBOR as on 29/05/2020).
Portfolio Turnover (Times) 0.59
Total Expense Ratio^
Regular/Other than Direct 2.17
Direct 1.19
Load structureEntry Load: Nil
Exit Load: 10% of the units allotted shall be redeemed without any exit load, on or before completion of 12 months from the date of allotment of units.Any redemption in excess of such limit in the fi rst 12 months from the date of allotment shall be subject to the following exit load, Redemption of units would be done on First in First out Basis (FIFO):• 1% if redeemed or switched out on or before
completion of 12 months from the date of allotment of units.
• Nil, thereafter.
Portfolio as on May 31, 2020
Industry Allocation
AMFI Classification
12.98%
12.14%
9.51%
7.62%
6.28%
5.47%
5.19%
4.97%
4.50%
3.54%
Chemicals
Consumer Non Durables
Finance
Consumer Durables
Pharmaceuticals
Software
Industrial Capital Goods
Industrial Products
Auto Ancillaries
Cement
Dividend HistoryRecord Date Rate (`/ Unit) Cum Dividend NAV Ex-Dividend NAV
Dividend Plan
07-Feb-18 3.00 35.9501 32.9501
28-Mar-16 1.20 19.8299 18.6299
24-Mar-15 2.00 21.3040 19.3040
Direct - Dividend Plan
07-Feb-18 3.00 37.8948 34.8948
28-Mar-16 1.20 20.4064 19.2064
24-Mar-15 2.00 21.3040 19.3040
Past performance may or may not be sustained in future. Pursuant to dividend payment, NAV falls to the extent of payout & statutory levy (if applicable). Face Value-`10.
Special Feature: Nippon India Any Time Money Card
Nippon India Small Cap Fund
SIP - If you invested ` 10000 every monthSince Inception 5 Years 3 Years 1 Year
Total Amount Invested (`) 1,170,000 600,000 360,000 120,000
Market Value (`) 2,111,168 545,013 279,331 101,701Scheme Return (%) 11.73 -3.82 -16.12 -28.47B: S&P BSE Small Cap TRI Return (%) 3.50 -7.47 -18.34 -27.12AB: S&P BSE Sensex TRI Return (%) 7.02 2.53 -4.76 -23.87
Inception Date: September 16, 2010
Past performance may or may not be sustained in future. It is assumed that a SIP of `10,000 each executed on 10th of every month including the first installment in the Growth option of the Fund. Returns on SIP and Benchmark are annualized and cumulative investment return for cash flows resulting out of uniform and regular monthly subscriptions have been worked out on excel spreadsheet function known as XIRR. Load has not been taken into consideration.B: Benchmark, AB: Additional Benchmark, TRI: Total Return IndexTRI - Total Returns Index reflects the returns on the index arising from (a) constituent stock price movements and (b) dividend receipts from constituent index stocks, thereby showing a true picture of returns.
For scheme performance refer page 63-70. For Fund manager wise scheme performance refer page 71-74.
Please refer page no. 82 for explanation on symbol: ^ and @ wherever available
Company/Issuer % of AssetsAuto AncillariesTube Investments of India Limited* 2.39BanksState Bank of India 1.60HDFC Bank Limited 1.16CementBirla Corporation Limited* 2.04ChemicalsDeepak Nitrite Limited* 5.02Navin Fluorine International Limited* 3.92Fine Organic Industries Limited* 2.00Atul Limited 1.16Commercial ServicesSecurity and Intelligence Services (India) Limited 1.46Construction ProjectLarsen & Toubro Limited 1.10
Consumer Durables
Orient Electric Limited* 2.69Dixon Technologies (India) Limited 1.68Bajaj Electricals Limited 1.38Consumer Non DurablesTata Consumer Products Limited* 2.74
Radico Khaitan Limited 1.82Zydus Wellness Limited 1.80Hindustan Unilever Limited 1.33Jyothy Labs Limited 1.25
Balrampur Chini Mills Limited 1.08
Company/Issuer % of AssetsFinanceIndian Energy Exchange Limited* 2.12CreditAccess Grameen Limited 1.99Multi Commodity Exchange of India Limited 1.89ICRA Limited 1.10Industrial ProductsPolyplex Corporation Limited 1.12MiscellaneousElantas Beck India Limited 1.25PesticidesBayer Cropscience Limited 1.76Rallis India Limited 1.69PharmaceuticalsFDC Limited* 2.17AstraZeneca Pharma India Limited 1.61Sun Pharmaceutical Industries Limited 1.08SoftwareAffle (India) Limited* 2.21Telecom - ServicesBharti Airtel Limited 1.03Equity Less Than 1% of Corpus 38.43Cash and Other Receivables 2.89Grand Total 100.00
*Top 10 Holdings
Product Label
This product is suitable for investors who are seeking*:
Investors understand that their principalwill be at Moderately High risk
� Long term capital growth
� Investment in equity and equity related securities of small cap companies
*Investors should consult their financial advisors if in doubt about whether the product is suitable for them.
w.e.f. March 17, 2020

June 202014 Fundamentals
Value Fund
Details as on May 31, 2020
Type of Scheme
An open ended Equity Scheme following a value investment strategy
Current Investment Philosophy
Value investment strategy with an aim to participate in investment opportunities across all sectors and market capitalization. Fund endeavors to invest in undervalued stocks having the potential to deliver long term relatively better risk-adjusted returns. Undervalued stocks will be identified based on the evaluation of various factors including but not limited to stock valuation, financial strength, cash flows, company’s competitive advantage, business prospects and earnings potential.
Date of Allotment
June 8, 2005
Fund Manager
Meenakshi Dawar
Benchmark
S&P BSE Enhanced Value TRI
Fund Size
Monthly Average: ` 2,340.52 Cr
Month End: ` 2,417.87 Cr
NAV as on May 29, 2020Growth Plan ` 58.6831Dividend Plan ` 16.3353Direct - Growth Plan ` 62.0123Direct - Dividend Plan ` 22.5544
Volatility MeasuresStandard Deviation 6.52Beta 0.71Sharpe Ratio -0.06Note: The above measures have been calculated using monthly rolling returns for 36 months period with 4.04% risk free return (FBIL Overnight MIBOR as on 29/05/2020).
Portfolio Turnover (Times) 0.46
Total Expense Ratio^
Regular/Other than Direct 2.22
Direct 1.59
Load structure
Entry Load: Nil
Exit Load: 10% of the units allotted shall be redeemed without any exit load, on or before completion of 12 months from the date of allotment of units.Any redemption in excess of such limit in the fi rst 12 months from the date of allotment shall be subject to the following exit load, Redemption of units would be done on First in First out Basis (FIFO):• 1% if redeemed or switched out on or before
completion of 12 months from the date of allotment of units.
• Nil, thereafter.
Product Label
This product is suitable for investors who are seeking*:
Investors understand that their principalwill be at Moderately High risk
� Long term capital growth
� Investment in equity and equity related securities
*Investors should consult their financial advisors if in doubt about whether the product is suitable for them.
Portfolio as on May 31, 2020
Industry Allocation
AMFI Classification
18.48%
10.81%
9.01%
7.34%
7.10%
6.96%
4.34%
3.93%
3.70%
3.40%
Banks
Pharmaceuticals
Finance
Petroleum Products
Software
Consumer Non Durables
Construction Project
Industrial Capital Goods
Telecom - Services
Consumer Durables
Dividend HistoryRecord Date Rate (`/ Unit) Cum Dividend NAV Ex-Dividend NAV
Dividend Plan
06-Mar-20 1.55 20.3885 18.6385
08-Mar-19 1.77 23.8758 21.8758
01-Mar-18 2.50 26.6708 24.1708
Direct - Dividend Plan
06-Mar-20 1.55 27.4452 25.6952
08-Mar-19 1.77 31.2603 29.2603
01-Mar-18 2.50 33.9294 31.4294
Past performance may or may not be sustained in future. Pursuant to dividend payment, NAV falls to the extent of payout & statutory levy (if applicable). Face Value-`10.
Nippon India Value Fund
Special Feature: Nippon India Any Time Money Card
SIP - If you invested ` 10000 every monthSince Inception 10 Years 5 Years 3 Years 1 Year
Total Amount Invested (`) 1,800,000 1,200,000 600,000 360,000 120,000Market Value (`) 3,901,918 1,648,779 561,212 301,150 102,409Scheme Return (%) 9.69 6.22 -2.66 -11.49 -27.43B: S&P BSE Enhanced Value TRI Return (%) N.A -4.10 -13.67 -25.30 -37.23AB: S&P BSE Sensex TRI Return (%) 8.73 7.08 2.53 -4.76 -23.87
Inception Date: June 8, 2005
N.A : Since TRI data is not available prior to 30/04/2009 for S&P BSE Enhanced Value Index, performance for such period is not provided
Past performance may or may not be sustained in future. It is assumed that a SIP of `10,000 each executed on 10th of every month including the first installment in the Growth option of the Fund. Returns on SIP and Benchmark are annualized and cumulative investment return for cash flows resulting out of uniform and regular monthly subscriptions have been worked out on excel spreadsheet function known as XIRR. Load has not been taken into consideration.B: Benchmark, AB: Additional Benchmark, TRI: Total Return IndexTRI - Total Returns Index reflects the returns on the index arising from (a) constituent stock price movements and (b) dividend receipts from constituent index stocks, thereby showing a true picture of returns.For scheme performance refer page 63-70. For Fund manager wise scheme performance refer page 71-74.
Please refer page no. 82 for explanation on symbol: ^ and @ wherever available
Company/Issuer % of AssetsAuto
Maruti Suzuki India Limited 1.33
Auto AncillariesMRF Limited 1.19
Motherson Sumi Systems Limited 1.01
Banks
HDFC Bank Limited* 8.28
ICICI Bank Limited* 4.96
Axis Bank Limited 2.13
State Bank of India 1.94
Construction
The Phoenix Mills Limited 1.56
Construction Project
Larsen & Toubro Limited* 3.76
Consumer Durables
Dixon Technologies (India) Limited 1.30
Titan Company Limited 1.07
Consumer Non Durables
Hindustan Unilever Limited* 2.47
ITC Limited 1.89
United Breweries Limited 1.05
Engineering Services
RITES Limited 1.21
Finance
Muthoot Finance Limited* 3.44
Housing Development Finance Corporation Limited 1.37
Max Financial Services Limited 1.26
Company/Issuer % of AssetsICICI Lombard General Insurance Company Limited 1.14
Cholamandalam Financial Holdings Limited 1.03
Healthcare Services
Fortis Healthcare Limited 1.06
Industrial Capital Goods
Honeywell Automation India Limited 2.22
Bharat Electronics Limited 1.22
Others 0.26
Nippon India ETF NV20 0.26
Petroleum Products
Reliance Industries Limited* 4.96
Hindustan Petroleum Corporation Limited 1.33
Indian Oil Corporation Limited 1.05
Pharmaceuticals
Torrent Pharmaceuticals Limited* 3.11
Divi's Laboratories Limited* 2.87
Cipla Limited 1.69
Syngene International Limited 1.24
Sun Pharmaceutical Industries Limited 1.21
Software
Infosys Limited* 5.43
Tata Consultancy Services Limited 1.07
Telecom - Services
Bharti Airtel Limited* 3.70
Equity Less Than 1% of Corpus 20.06
Derivatives, Cash and Other Receivables 4.12
Grand Total 100.00
*Top 10 Holdings
w.e.f. March 17, 2020

June 2020Fundamentals 15
Multi Cap Fund
Details as on May 31, 2020
Type of Scheme
Multi Cap Fund - An open ended equity scheme investing across large cap, mid cap, small cap stocks
Current Investment Philosophy
It is a multi-cap, trend based fund with the flexibility to be overweight in a particular sector or market caps depending on the potential & opportunities as they arise. Investment in large caps may help to capture market movements & ensures liquidity in volatile times while exposure to niche themes (primarily mid/small cap companies) having scalable business models offers alpha creation possibilities. The investment in the emerging businesses can be further categorized as:
l Quality Mid cap plays with a track record and scalable business models
l Emerging or niche themes with sustainable competitive advantages
l Deep Value Component –> Deep Value Stocks - Currently mispriced by markets due to non-fundamental reasons
Date of Allotment
March 28, 2005
Fund Manager
Sailesh Raj Bhan
Benchmark
S&P BSE 500 TRI
Fund Size
Monthly Average: ` 6,844.34 Cr
Month End: ` 6,953.59 Cr
NAV as on May 29, 2020Growth Plan ` 66.5476Dividend Plan ` 19.0813Bonus Option ` 66.5476Direct - Growth Plan ` 70.3208Direct - Dividend Plan ` 24.9118Direct - Bonus Option ` 70.3208
Volatility Measures
Standard Deviation 7.00Beta 1.07Sharpe Ratio -0.10Note: The above measures have been calculated using monthly rolling returns for 36 months period with 4.04% risk free return (FBIL Overnight MIBOR as on 29/05/2020).
Portfolio Turnover (Times) 0.66
Total Expense Ratio^
Regular/Other than Direct 2.01
Direct 1.33
Load structure
Entry Load: Nil
Exit Load: 10% of the units allotted shall be redeemed without any exit load, on or before completion of 12 months from the date of allotment of units.Any redemption in excess of such limit in the fi rst 12 months from the date of allotment shall be subject to the following exit load, Redemption of units would be done on First in First out Basis (FIFO):• 1% if redeemed or switched out on or before
completion of 12 months from the date of allotment of units.
• Nil, thereafter.
Product Label
This product is suitable for investors who are seeking*:
Investors understand that their principalwill be at Moderately High risk
� Long term capital growth
� Investment in equity and equity related securities
*Investors should consult their financial advisors if in doubt about whether the product is suitable for them.
Portfolio as on October 31, 2019
Industry Allocation
AMFI Classification
23.02%
9.62%
7.49%
6.34%
6.08%
5.78%
5.69%
5.26%
4.44%
4.37%
Banks
Industrial Capital Goods
Auto
Petroleum Products
Retailing
Pharmaceuticals
Consumer Non Durables
Hotels, Resorts And OtherRecreational Activities
Construction Project
Telecom - Services
Dividend HistoryRecord Date Rate (`/ Unit) Cum Dividend NAV Ex-Dividend NAV
Dividend Plan
22-Mar-19 2.43 30.4022 27.6522
23-Mar-18 4.75 32.8016 28.0516
17-Mar-17 3.00 31.6909 28.6909
Direct - Dividend Plan
22-Mar-19 2.43 38.5624 35.8124
23-Mar-18 4.75 40.0800 35.3300
17-Mar-17 3.00 37.7756 34.7756
Past performance may or may not be sustained in future. Pursuant to dividend payment, NAV falls to the extent of payout & statutory levy (if applicable). Face Value-`10.
Special Feature: Nippon India Any Time Money Card
Nippon India Multi Cap Fund
Portfolio as on May 31, 2020
SIP - If you invested ` 10000 every monthSince Inception 15 Years 10 Years 5 Years 3 Years 1 Year
Total Amount Invested (`) 1,820,000 1,800,000 1,200,000 600,000 360,000 120,000
Market Value (`) 3,722,832 3,589,937 1,439,269 486,288 266,019 91,447
Scheme Return (%) 8.89 8.69 3.59 -8.32 -19.07 -42.94
B: S&P BSE 500 TRI Return (%) N.A N.A 6.60 0.08 -8.29 -23.40
AB: S&P BSE Sensex TRI Return (%) 8.90 8.73 7.08 2.53 -4.76 -23.87
Inception Date: March 28, 2005
N.A: Since TRI data is not available prior to 01/08/2006 for S&P BSE 500, performance for such period is not provided.Past performance may or may not be sustained in future. It is assumed that a SIP of `10,000 each executed on 10th of every month including the first installment in the Growth option of the Fund. Returns on SIP and Benchmark are annualized and cumulative investment return for cash flows resulting out of uniform and regular monthly subscriptions have been worked out on excel spreadsheet function known as XIRR. Load has not been taken into consideration.B: Benchmark, AB: Additional Benchmark, TRI: Total Return IndexTRI - Total Returns Index reflects the returns on the index arising from (a) constituent stock price movements and (b) dividend receipts from constituent index stocks, thereby showing a true picture of returns.
For scheme performance refer page 63-70. For Fund manager wise scheme performance refer page 71-74.
Please refer page no. 82 for explanation on symbol: ^ and @ wherever available
Company/Issuer % of AssetsAutoTVS Motor Company Limited 2.56Ashok Leyland Limited 2.01Tata Motors Limited 1.88Hero MotoCorp Limited 1.04BanksHDFC Bank Limited* 5.95State Bank of India* 5.10ICICI Bank Limited* 5.01Axis Bank Limited* 4.15Bank of Baroda 1.99ChemicalsLinde India Limited* 3.93Construction ProjectLarsen & Toubro Limited* 3.35Consumer Non DurablesITC Limited* 3.48Tata Consumer Products Limited 2.11Ferrous MetalsTata Steel Limited 1.27
Steel Authority of India Limited 1.06FinanceMax Financial Services Limited 1.58Hotels, Resorts And Other Recreational ActivitiesThe Indian Hotels Company Limited* 3.33EIH Limited 1.68Industrial Capital GoodsHoneywell Automation India Limited 2.55
Company/Issuer % of AssetsKennametal India Limited 1.67GE Power India Limited 1.24ABB India Limited 1.09Industrial ProductsBharat Forge Limited 1.88Petroleum ProductsHindustan Petroleum Corporation Limited 2.81Bharat Petroleum Corporation Limited 1.73Indian Oil Corporation Limited 1.26PharmaceuticalsSun Pharmaceutical Industries Limited* 3.21Divi's Laboratories Limited 2.58PowerCESC Limited 1.67NTPC Limited 1.41RetailingAditya Birla Fashion and Retail Limited 2.94Trent Limited 2.52SoftwareInfosys Limited 2.86Telecom - ServicesBharti Airtel Limited* 4.37TransportationVRL Logistics Limited 1.31Equity Less Than 1% of Corpus 9.78Cash and Other Receivables 1.64Grand Total 100.00
*Top 10 Holdings
w.e.f. March 17, 2020
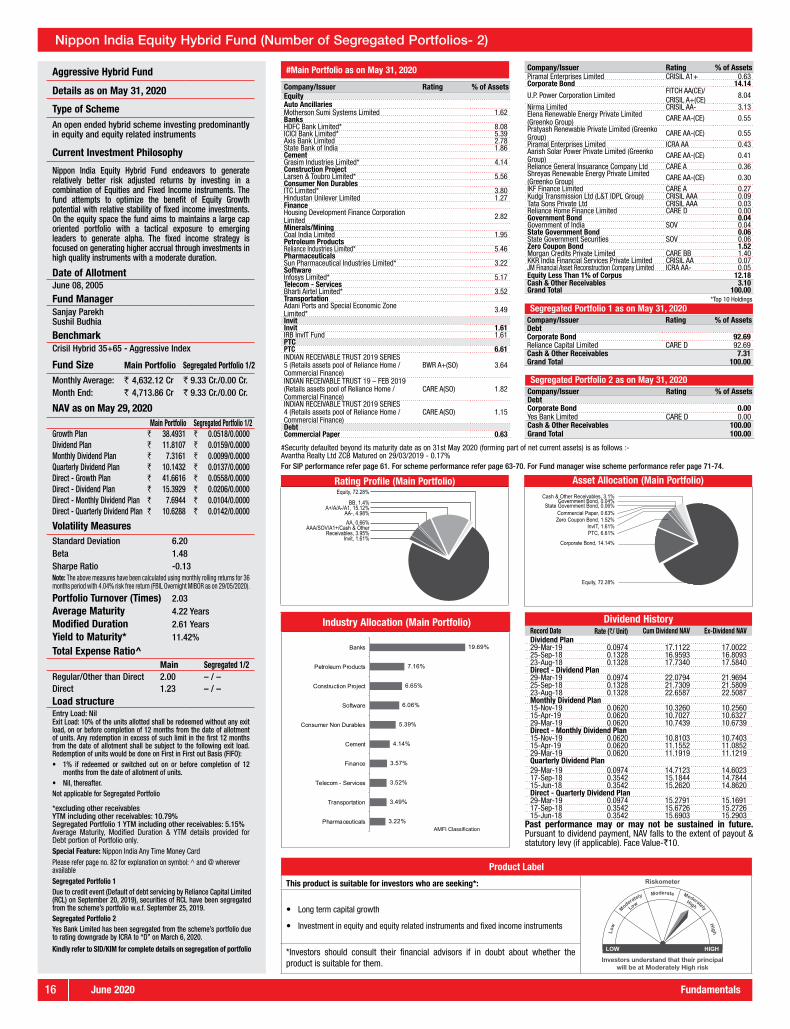
June 202016 Fundamentals
Asset Allocation (Main Portfolio)Cash & Other Receivables, 3.1%
Government Bond, 0.04%State Government Bond, 0.06%
Commercial Paper, 0.63%Zero Coupon Bond, 1.52%
InvIT, 1.61%PTC, 6.61%
Corporate Bond, 14.14%
Equity, 72.28%
Aggressive Hybrid Fund
Details as on May 31, 2020
Type of SchemeAn open ended hybrid scheme investing predominantly in equity and equity related instruments
Current Investment Philosophy
Nippon India Equity Hybrid Fund endeavors to generate relatively better risk adjusted returns by investing in a combination of Equities and Fixed Income instruments. The fund attempts to optimize the benefit of Equity Growth potential with relative stability of fixed income investments. On the equity space the fund aims to maintains a large cap oriented portfolio with a tactical exposure to emerging leaders to generate alpha. The fixed income strategy is focused on generating higher accrual through investments in high quality instruments with a moderate duration.
Date of AllotmentJune 08, 2005
Fund ManagerSanjay Parekh Sushil Budhia
BenchmarkCrisil Hybrid 35+65 - Aggressive Index
Fund Size Main Portfolio Segregated Portfolio 1/2
Monthly Average: ` 4,632.12 Cr ` 9.33 Cr./0.00 Cr.Month End: ` 4,713.86 Cr ` 9.33 Cr./0.00 Cr.
NAV as on May 29, 2020Main Portfolio Segregated Portfolio 1/2
Growth Plan ` 38.4931 ` 0.0518/0.0000Dividend Plan ` 11.8107 ` 0.0159/0.0000Monthly Dividend Plan ` 7.3161 ` 0.0099/0.0000Quarterly Dividend Plan ` 10.1432 ` 0.0137/0.0000Direct - Growth Plan ` 41.6616 ` 0.0558/0.0000Direct - Dividend Plan ` 15.3929 ` 0.0206/0.0000Direct - Monthly Dividend Plan ` 7.6944 ` 0.0104/0.0000Direct - Quarterly Dividend Plan ` 10.6288 ` 0.0142/0.0000
Volatility MeasuresStandard Deviation 6.20Beta 1.48Sharpe Ratio -0.13Note: The above measures have been calculated using monthly rolling returns for 36 months period with 4.04% risk free return (FBIL Overnight MIBOR as on 29/05/2020).
Portfolio Turnover (Times) 2.03Average Maturity 4.22 YearsModified Duration 2.61 YearsYield to Maturity* 11.42%
Total Expense Ratio^ Main Segregated 1/2Regular/Other than Direct 2.00 – / –Direct 1.23 – / –Load structureEntry Load: NilExit Load: 10% of the units allotted shall be redeemed without any exit load, on or before completion of 12 months from the date of allotment of units. Any redemption in excess of such limit in the first 12 months from the date of allotment shall be subject to the following exit load. Redemption of units would be done on First in First out Basis (FIFO):• 1% if redeemed or switched out on or before completion of 12
months from the date of allotment of units.• Nil, thereafter.Not applicable for Segregated Portfolio
*excluding other receivablesYTM including other receivables: 10.79%Segregated Portfolio 1 YTM including other receivables: 5.15%Average Maturity, Modified Duration & YTM details provided for Debt portion of Portfolio only.Special Feature: Nippon India Any Time Money CardPlease refer page no. 82 for explanation on symbol: ^ and @ wherever availableSegregated Portfolio 1Due to credit event (Default of debt servicing by Reliance Capital Limited (RCL) on September 20, 2019), securities of RCL have been segregated from the scheme’s portfolio w.e.f. September 25, 2019.Segregated Portfolio 2Yes Bank Limited has been segregated from the scheme’s portfolio due to rating downgrade by ICRA to “D” on March 6, 2020.
Kindly refer to SID/KIM for complete details on segregation of portfolio
Product Label
This product is suitable for investors who are seeking*:
Investors understand that their principalwill be at Moderately High risk
� Long term capital growth
� Investment in equity and equity related instruments and fixed income instruments
*Investors should consult their financial advisors if in doubt about whether the product is suitable for them.
#Main Portfolio as on May 31, 2020
Industry Allocation (Main Portfolio)
AMFI Classification
19.69%
7.16%
6.65%
6.06%
5.39%
4.14%
3.57%
3.52%
3.49%
3.22%
Banks
Petroleum Products
Construction Project
Software
Consumer Non Durables
Cement
Finance
Telecom - Services
Transportation
Pharmaceuticals
Dividend HistoryRecord Date Rate (`/ Unit) Cum Dividend NAV Ex-Dividend NAVDividend Plan29-Mar-19 0.0974 17.1122 17.002225-Sep-18 0.1328 16.9593 16.809323-Aug-18 0.1328 17.7340 17.5840Direct - Dividend Plan29-Mar-19 0.0974 22.0794 21.969425-Sep-18 0.1328 21.7309 21.580923-Aug-18 0.1328 22.6587 22.5087Monthly Dividend Plan15-Nov-19 0.0620 10.3260 10.256015-Apr-19 0.0620 10.7027 10.632729-Mar-19 0.0620 10.7439 10.6739Direct - Monthly Dividend Plan15-Nov-19 0.0620 10.8103 10.740315-Apr-19 0.0620 11.1552 11.085229-Mar-19 0.0620 11.1919 11.1219Quarterly Dividend Plan29-Mar-19 0.0974 14.7123 14.602317-Sep-18 0.3542 15.1844 14.784415-Jun-18 0.3542 15.2620 14.8620Direct - Quarterly Dividend Plan29-Mar-19 0.0974 15.2791 15.169117-Sep-18 0.3542 15.6726 15.272615-Jun-18 0.3542 15.6903 15.2903
Past performance may or may not be sustained in future. Pursuant to dividend payment, NAV falls to the extent of payout & statutory levy (if applicable). Face Value-`10.
Nippon India Equity Hybrid Fund (Number of Segregated Portfolios- 2)
#Security defaulted beyond its maturity date as on 31st May 2020 (forming part of net current assets) is as follows :-Avantha Realty Ltd ZCB Matured on 29/03/2019 - 0.17%For SIP performance refer page 61. For scheme performance refer page 63-70. For Fund manager wise scheme performance refer page 71-74.
Company/Issuer Rating % of AssetsEquityAuto AncillariesMotherson Sumi Systems Limited 1.62BanksHDFC Bank Limited* 8.08ICICI Bank Limited* 5.39Axis Bank Limited 2.78State Bank of India 1.86CementGrasim Industries Limited* 4.14Construction ProjectLarsen & Toubro Limited* 5.56Consumer Non DurablesITC Limited* 3.80Hindustan Unilever Limited 1.27FinanceHousing Development Finance Corporation Limited 2.82
Minerals/MiningCoal India Limited 1.95Petroleum ProductsReliance Industries Limited* 5.46PharmaceuticalsSun Pharmaceutical Industries Limited* 3.22SoftwareInfosys Limited* 5.17Telecom - ServicesBharti Airtel Limited* 3.52TransportationAdani Ports and Special Economic Zone Limited* 3.49
InvitInvit 1.61IRB InvIT Fund 1.61PTCPTC 6.61INDIAN RECEIVABLE TRUST 2019 SERIES 5 (Retails assets pool of Reliance Home / Commercial Finance)
BWR A+(SO) 3.64
INDIAN RECEIVABLE TRUST 19 – FEB 2019 (Retails assets pool of Reliance Home / Commercial Finance)
CARE A(SO) 1.82
INDIAN RECEIVABLE TRUST 2019 SERIES 4 (Retails assets pool of Reliance Home / Commercial Finance)
CARE A(SO) 1.15
DebtCommercial Paper 0.63
Company/Issuer Rating % of AssetsPiramal Enterprises Limited CRISIL A1+ 0.63Corporate Bond 14.14
U.P. Power Corporation LimitedFITCH AA(CE)/CRISIL A+(CE)
8.04
Nirma Limited CRISIL AA- 3.13Elena Renewable Energy Private Limited (Greenko Group) CARE AA-(CE) 0.55
Pratyash Renewable Private Limited (Greenko Group) CARE AA-(CE) 0.55
Piramal Enterprises Limited ICRA AA 0.43Aarish Solar Power Private Limited (Greenko Group) CARE AA-(CE) 0.41
Reliance General Insuarance Company Ltd CARE A 0.36Shreyas Renewable Energy Private Limited (Greenko Group) CARE AA-(CE) 0.30
IKF Finance Limited CARE A 0.27Kudgi Transmission Ltd (L&T IDPL Group) CRISIL AAA 0.09Tata Sons Private Ltd CRISIL AAA 0.03Reliance Home Finance Limited CARE D 0.00Government Bond 0.04Government of India SOV 0.04State Government Bond 0.06State Government Securities SOV 0.06Zero Coupon Bond 1.52Morgan Credits Private Limited CARE BB 1.40KKR India Financial Services Private Limited CRISIL AA 0.07JM Financial Asset Reconstruction Company Limited ICRA AA- 0.05Equity Less Than 1% of Corpus 12.18Cash & Other Receivables 3.10Grand Total 100.00
*Top 10 Holdings
Segregated Portfolio 1 as on May 31, 2020Company/Issuer Rating % of AssetsDebtCorporate Bond 92.69Reliance Capital Limited CARE D 92.69Cash & Other Receivables 7.31Grand Total 100.00
Segregated Portfolio 2 as on May 31, 2020Company/Issuer Rating % of AssetsDebtCorporate Bond 0.00Yes Bank Limited CARE D 0.00Cash & Other Receivables 100.00Grand Total 100.00
Rating Profile (Main Portfolio)Equity, 72.28%
BB, 1.4%A+/A/A-/A1, 15.12%
AA-, 4.98%AA, 0.66%
AAA/SOV/A1+/Cash & Other Receivables, 3.95%
Invit, 1.61%
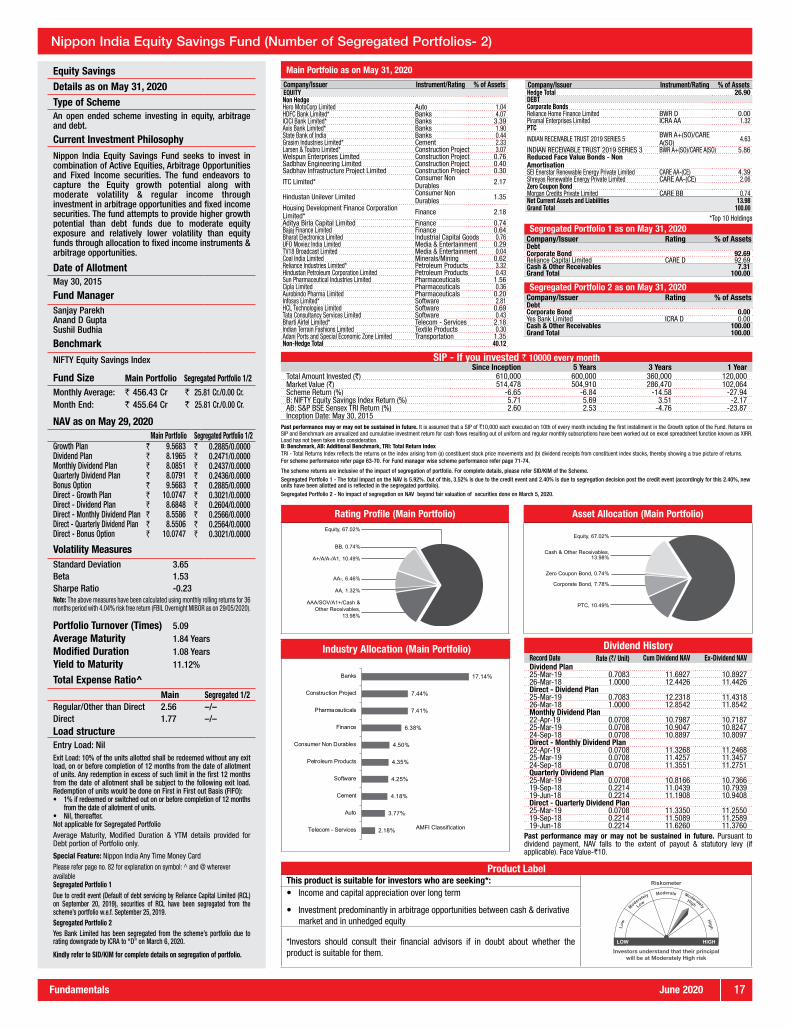
June 2020Fundamentals 17
Equity SavingsDetails as on May 31, 2020Type of SchemeAn open ended scheme investing in equity, arbitrage and debt.
Current Investment Philosophy
Nippon India Equity Savings Fund seeks to invest in combination of Active Equities, Arbitrage Opportunities and Fixed Income securities. The fund endeavors to capture the Equity growth potential along with moderate volatility & regular income through investment in arbitrage opportunities and fixed income securities. The fund attempts to provide higher growth potential than debt funds due to moderate equity exposure and relatively lower volatility than equity funds through allocation to fixed income instruments & arbitrage opportunities.
Date of AllotmentMay 30, 2015
Fund ManagerSanjay Parekh Anand D Gupta Sushil Budhia
Benchmark
NIFTY Equity Savings Index
Fund Size Main Portfolio Segregated Portfolio 1/2
Monthly Average: ` 456.43 Cr ` 25.81 Cr./0.00 Cr.Month End: ` 455.64 Cr ` 25.81 Cr./0.00 Cr.
NAV as on May 29, 2020Main Portfolio Segregated Portfolio 1/2
Growth Plan ` 9.5683 ` 0.2885/0.0000Dividend Plan ` 8.1965 ` 0.2471/0.0000Monthly Dividend Plan ` 8.0851 ` 0.2437/0.0000Quarterly Dividend Plan ` 8.0791 ` 0.2436/0.0000Bonus Option ` 9.5683 ` 0.2885/0.0000Direct - Growth Plan ` 10.0747 ` 0.3021/0.0000Direct - Dividend Plan ` 8.6848 ` 0.2604/0.0000Direct - Monthly Dividend Plan ` 8.5586 ` 0.2566/0.0000Direct - Quarterly Dividend Plan ` 8.5506 ` 0.2564/0.0000Direct - Bonus Option ` 10.0747 ` 0.3021/0.0000
Volatility MeasuresStandard Deviation 3.65Beta 1.53Sharpe Ratio -0.23Note: The above measures have been calculated using monthly rolling returns for 36 months period with 4.04% risk free return (FBIL Overnight MIBOR as on 29/05/2020).
Portfolio Turnover (Times) 5.09Average Maturity 1.84 YearsModified Duration 1.08 YearsYield to Maturity 11.12%
Total Expense Ratio^ Main Segregated 1/2Regular/Other than Direct 2.56 –/–Direct 1.77 –/–Load structureEntry Load: NilExit Load: 10% of the units allotted shall be redeemed without any exit load, on or before completion of 12 months from the date of allotment of units. Any redemption in excess of such limit in the first 12 months from the date of allotment shall be subject to the following exit load. Redemption of units would be done on First in First out Basis (FIFO):• 1% if redeemed or switched out on or before completion of 12 months
from the date of allotment of units.• Nil, thereafter. Not applicable for Segregated PortfolioAverage Maturity, Modified Duration & YTM details provided for Debt portion of Portfolio only.
Special Feature: Nippon India Any Time Money CardPlease refer page no. 82 for explanation on symbol: ^ and @ wherever availableSegregated Portfolio 1Due to credit event (Default of debt servicing by Reliance Capital Limited (RCL) on September 20, 2019), securities of RCL have been segregated from the scheme’s portfolio w.e.f. September 25, 2019.Segregated Portfolio 2Yes Bank Limited has been segregated from the scheme’s portfolio due to rating downgrade by ICRA to “D” on March 6, 2020.
Kindly refer to SID/KIM for complete details on segregation of portfolio.
Product LabelThis product is suitable for investors who are seeking*:
Investors understand that their principalwill be at Moderately High risk
� Income and capital appreciation over long term
� Investment predominantly in arbitrage opportunities between cash & derivative market and in unhedged equity
*Investors should consult their financial advisors if in doubt about whether the product is suitable for them.
Main Portfolio as on May 31, 2020
Dividend HistoryRecord Date Rate (`/ Unit) Cum Dividend NAV Ex-Dividend NAVDividend Plan25-Mar-19 0.7083 11.6927 10.892726-Mar-18 1.0000 12.4426 11.4426Direct - Dividend Plan25-Mar-19 0.7083 12.2318 11.431826-Mar-18 1.0000 12.8542 11.8542Monthly Dividend Plan22-Apr-19 0.0708 10.7987 10.718725-Mar-19 0.0708 10.9047 10.824724-Sep-18 0.0708 10.8897 10.8097Direct - Monthly Dividend Plan22-Apr-19 0.0708 11.3268 11.246825-Mar-19 0.0708 11.4257 11.345724-Sep-18 0.0708 11.3551 11.2751Quarterly Dividend Plan25-Mar-19 0.0708 10.8166 10.736619-Sep-18 0.2214 11.0439 10.793919-Jun-18 0.2214 11.1908 10.9408Direct - Quarterly Dividend Plan25-Mar-19 0.0708 11.3350 11.255019-Sep-18 0.2214 11.5089 11.258919-Jun-18 0.2214 11.6260 11.3760
Past performance may or may not be sustained in future. Pursuant to dividend payment, NAV falls to the extent of payout & statutory levy (if applicable). Face Value-`10.
SIP - If you invested ` 10000 every monthSince Inception 5 Years 3 Years 1 Year
Total Amount Invested (`) 610,000 600,000 360,000 120,000Market Value (`) 514,478 504,910 286,470 102,064Scheme Return (%) -6.65 -6.84 -14.58 -27.94B: NIFTY Equity Savings Index Return (%) 5.71 5.69 3.51 -2.17AB: S&P BSE Sensex TRI Return (%) 2.60 2.53 -4.76 -23.87Inception Date: May 30, 2015
Past performance may or may not be sustained in future. It is assumed that a SIP of `10,000 each executed on 10th of every month including the first installment in the Growth option of the Fund. Returns on SIP and Benchmark are annualized and cumulative investment return for cash flows resulting out of uniform and regular monthly subscriptions have been worked out on excel spreadsheet function known as XIRR. Load has not been taken into consideration.B: Benchmark, AB: Additional Benchmark, TRI: Total Return IndexTRI - Total Returns Index reflects the returns on the index arising from (a) constituent stock price movements and (b) dividend receipts from constituent index stocks, thereby showing a true picture of returns.For scheme performance refer page 63-70. For Fund manager wise scheme performance refer page 71-74.
The scheme returns are inclusive of the impact of segregation of portfolio. For complete details, please refer SID/KIM of the Scheme.Segregated Portfolio 1 - The total impact on the NAV is 5.92%. Out of this, 3.52% is due to the credit event and 2.40% is due to segregation decision post the credit event (accordingly for this 2.40%, new units have been allotted and is reflected in the segregated portfolio).Segregated Portfolio 2 - No impact of segregation on NAV beyond fair valuation of securities done on March 5, 2020.
Industry Allocation (Main Portfolio)
AMFI Classification
17.14%
7.44%
7.41%
6.38%
4.50%
4.35%
4.25%
4.18%
3.77%
2.18%
Banks
Construction Project
Pharmaceuticals
Finance
Consumer Non Durables
Petroleum Products
Software
Cement
Auto
Telecom - Services
Company/Issuer Instrument/Rating % of AssetsEQUITYNon HedgeHero MotoCorp Limited Auto 1.04HDFC Bank Limited* Banks 4.07ICICI Bank Limited* Banks 3.39Axis Bank Limited* Banks 1.90State Bank of India Banks 0.44Grasim Industries Limited* Cement 2.33Larsen & Toubro Limited* Construction Project 3.07Welspun Enterprises Limited Construction Project 0.76Sadbhav Engineering Limited Construction Project 0.40Sadbhav Infrastructure Project Limited Construction Project 0.30
ITC Limited* Consumer Non Durables 2.17
Hindustan Unilever Limited Consumer Non Durables 1.35
Housing Development Finance Corporation Limited* Finance 2.18
Aditya Birla Capital Limited Finance 0.74Bajaj Finance Limited Finance 0.64Bharat Electronics Limited Industrial Capital Goods 0.76UFO Moviez India Limited Media & Entertainment 0.29TV18 Broadcast Limited Media & Entertainment 0.04Coal India Limited Minerals/Mining 0.62Reliance Industries Limited* Petroleum Products 3.32Hindustan Petroleum Corporation Limited Petroleum Products 0.43Sun Pharmaceutical Industries Limited Pharmaceuticals 1.56Cipla Limited Pharmaceuticals 0.36Aurobindo Pharma Limited Pharmaceuticals 0.20Infosys Limited* Software 2.81HCL Technologies Limited Software 0.69Tata Consultancy Services Limited Software 0.43Bharti Airtel Limited* Telecom - Services 2.18Indian Terrain Fashions Limited Textile Products 0.30Adani Ports and Special Economic Zone Limited Transportation 1.35Non-Hedge Total 40.12
Company/Issuer Instrument/Rating % of AssetsHedge Total 26.90DEBTCorporate BondsReliance Home Finance Limited BWR D 0.00Piramal Enterprises Limited ICRA AA 1.32PTC
INDIAN RECEIVABLE TRUST 2019 SERIES 5 BWR A+(SO)/CARE A(SO) 4.63
INDIAN RECEIVABLE TRUST 2019 SERIES 3 BWR A+(SO)/CARE A(SO) 5.86Reduced Face Value Bonds - Non AmortisationSEI Enerstar Renewable Energy Private Limited CARE AA-(CE) 4.39Shreyas Renewable Energy Private Limited CARE AA-(CE) 2.06Zero Coupon BondMorgan Credits Private Limited CARE BB 0.74Net Current Assets and Liabilities 13.98Grand Total 100.00
*Top 10 Holdings
Segregated Portfolio 1 as on May 31, 2020Company/Issuer Rating % of AssetsDebtCorporate Bond 92.69Reliance Capital Limited CARE D 92.69Cash & Other Receivables 7.31Grand Total 100.00
Nippon India Equity Savings Fund (Number of Segregated Portfolios- 2)
Segregated Portfolio 2 as on May 31, 2020Company/Issuer Rating % of AssetsDebtCorporate Bond 0.00Yes Bank Limited ICRA D 0.00Cash & Other Receivables 100.00Grand Total 100.00
Rating Profile (Main Portfolio)Equity, 67.02%
BB, 0.74%
A+/A/A-/A1, 10.49%
AA-, 6.46%
AA, 1.32%
AAA/SOV/A1+/Cash & Other Receivables,
13.98%
Asset Allocation (Main Portfolio)
Equity, 67.02%
Cash & Other Receivables, 13.98%
Zero Coupon Bond, 0.74%
Corporate Bond, 7.78%
PTC, 10.49%

June 202018 Fundamentals
Sector FundDetails as on May 31, 2020Type of SchemeAn open ended equity scheme investing in Banking sector.Current Investment PhilosophyNippon India Banking Fund is a focused banking and financial services sector oriented fund investing across market caps within the sector. The fund is well diversified across sub segments like Private Banks, PSUs, NBFCs, Housing Fin Co’s, Broking houses, etc. The fund endeavors to generate superior alpha through active fund management. The alpha generation is attempted through tactical allocation across various sub segments and differentiated investment ideas. The fund thus attempts to lower risk through diversification while retaining the alpha creation potential.
Date of AllotmentMay 26, 2003Fund ManagerVinay SharmaBenchmarkNifty Bank TRIFund sizeMonthly Average: ` 1,685.11 CrMonth End: ` 1,701.83 CrNAV as on May 29, 2020Growth Plan ` 162.6508 Direct - Growth Plan ` 170.6739Dividend Plan ` 26.7339 Direct - Dividend Plan ` 35.0646Bonus Option ` 162.6508 Direct - Bonus Option ` 170.6740Portfolio Turnover (Times) 0.89
Total Expense Ratio^Regular/Other than Direct 2.38Direct 1.59Load structureEntry Load: Nil
Exit Load: 1% if redeemed or switched out on or before completion of 1 month from the date of allotment of units. Nil, thereafter.
W.e.f May 21, 2020
Portfolio as on May 31, 2020
Portfolio as on May 31, 2020
Record Date Rate (`/ Unit) Cum Dividend NAV Ex-Dividend NAVDividend Plan07-Feb-20 3.98 51.4992 46.999208-Feb-19 3.98 50.0401 45.540109-Feb-18 6.25 58.6318 52.3818
Record Date Rate (`/ Unit) Cum Dividend NAV Ex-Dividend NAVDirect - Dividend Plan07-Feb-20 3.98 66.0039 61.503908-Feb-19 3.98 62.4875 57.987509-Feb-18 6.25 71.1748 64.9248
Dividend History
Product LabelThis product is suitable for investors who are seeking*:
Investors understand that their principalwill be at High risk
� Long term capital growth
� Investment in equity and equity related securities of companies in banking sector and companies engaged in allied activities related to banking sector
*Investors should consult their financial advisors if in doubt about whether the product is suitable for them.
Product LabelThis product is suitable for investors who are seeking*:
Investors understand that their principalwill be at High risk
� Long term capital growth
� Investment in equity and equity related securities of companies engaged in or allied activities to the power and infrastructure space.
*Investors should consult their financial advisors if in doubt about whether the product is suitable for them.
Thematic FundDetails as on May 31, 2020Type of SchemeAn Open Ended Equity Scheme investing in power & infrastructure sectors
Current Investment PhilosophyIt is an investment opportunity to participate in India’s capex growth by investing in securities of companies in power and infra sectors. The portfolio has an adequate diversification within the power and infra sectors by spreading investment over a large range of companies. The fund provides opportunity within these sectors, with focused approach and flexibility to invest in Transportation, Energy, Resources, Communication and other power and infrastructure allied companies. The portfolio is focused on creating long term risk adjusted return.
Date of AllotmentMay 8, 2004Fund ManagerSanjay DoshiBenchmarkNifty Infrastructure TRIFund sizeMonthly Average: ` 905.98 CrMonth End: ` 933.64 Cr
NAV as on May 29, 2020Growth Plan ` 73.6772Dividend Plan ` 18.7816Bonus Option ` 73.6772Direct - Growth Plan ` 77.0382Direct - Dividend Plan ` 20.1804Direct - Bonus Option ` 77.0382Portfolio Turnover (Times) 0.58Total Expense Ratio^Regular/Other than Direct 2.44Direct 1.98Load structureEntry Load: Nil Exit Load: 1% if redeemed or switched out on or before completion of 1 month from the date of allotment of units. Nil, thereafter.W.e.f May 21, 2020
Record Date Rate (`/ Unit) Cum Dividend NAV Ex-Dividend NAVDividend Plan14-Feb-20 2.21 27.3613 24.861315-Feb-19 2.21 26.2801 23.780116-Feb-18 4.00 40.4197 36.4197
Record Date Rate (`/ Unit) Cum Dividend NAV Ex-Dividend NAVDirect - Dividend Plan14-Feb-20 2.21 29.1632 26.663215-Feb-19 2.21 27.7061 25.206116-Feb-18 4.00 42.1662 38.1662
Dividend History
Special Feature: Nippon India Any Time Money Card
Special Feature: Nippon India Any Time Money Card
Nippon India Banking Fund
Nippon India Power & Infra Fund
For SIP performance refer page 60. For scheme performance refer page 63-70. For Fund manager wise scheme performance refer page 70-73.
Past performance may or may not be sustained in future. Pursuant to dividend payment, NAV falls to the extent of payout & statutory levy (if applicable). Face Value-`10.
Past performance may or may not be sustained in future. Pursuant to dividend payment, NAV falls to the extent of payout & statutory levy (if applicable). Face Value-`10.
For SIP performance refer page 61. For scheme performance refer page 63-70. For Fund manager wise scheme performance refer page 71-74.
Volatility MeasuresStandard Deviation 7.30 Beta 1.01 Sharpe Ratio -0.12
Note: The above measures have been calculated using monthly rolling returns for 36 months period with 4.04% risk free return (FBIL Overnight MIBOR as on 29/05/2020).
Please refer page no. 82 for explanation on symbol: ^ and @ wherever available
Please refer page no. 82 for explanation on symbol: ^ and @ wherever available
Company/Issuer % of AssetsBanksHDFC Bank Limited* 16.22ICICI Bank Limited* 15.71State Bank of India* 7.61Axis Bank Limited* 5.78Kotak Mahindra Bank Limited* 5.28The Federal Bank Limited* 4.79Bank of Baroda* 3.06IndusInd Bank Limited 2.70RBL Bank Limited 1.97FinanceBajaj Finserv Limited* 6.16Bajaj Finance Limited* 3.75Max Financial Services Limited* 3.29
Company/Issuer % of AssetsMotilal Oswal Financial Services Limited 2.72Muthoot Finance Limited 2.27ICICI Prudential Life Insurance Company Limited 2.07Can Fin Homes Limited 1.79Cholamandalam Financial Holdings Limited 1.53CreditAccess Grameen Limited 1.49Cholamandalam Investment and Finance Company Limited 1.45Power Finance Corporation Limited 1.33General Insurance Corporation of India 1.22PNB Housing Finance Limited 1.11Equity Less Than 1% of Corpus 1.38Cash and Other Receivables 5.32Grand Total 100.00
*Top 10 Holdings
Company/Issuer % of AssetsCementUltraTech Cement Limited* 4.81Ambuja Cements Limited 2.26ACC Limited 2.04JK Lakshmi Cement Limited 1.29ConstructionPNC Infratech Limited 1.81Construction ProjectLarsen & Toubro Limited* 10.23KEC International Limited* 7.21NCC Limited 2.09Ferrous MetalsJindal Stainless (Hisar) Limited 2.19Healthcare ServicesFortis Healthcare Limited 1.05Industrial Capital GoodsGE Power India Limited* 5.16Bharat Electronics Limited* 4.95Apar Industries Limited* 3.46Industrial ProductsKSB Limited 1.82Kirloskar Pneumatic Company Limited 1.60
Company/Issuer % of AssetsPetroleum ProductsReliance Industries Limited* 9.02Bharat Petroleum Corporation Limited 3.03Indian Oil Corporation Limited 1.78PowerNTPC Limited* 4.72Tata Power Company Limited* 3.13Kalpataru Power Transmission Limited 2.02Telecom - Equipment & AccessoriesSterlite Technologies Limited 1.54Telecom - ServicesBharti Airtel Limited* 9.17TransportationAdani Ports and Special Economic Zone Limited 2.43Equity Less Than 1% of Corpus 6.49Cash and Other Receivables 4.69Grand Total 100.00
*Top 10 Holdings
Volatility MeasuresStandard Deviation 8.89 Beta 1.02 Sharpe Ratio -0.11
Note: The above measures have been calculated using monthly rolling returns for 36 months period with 4.04% risk free return (FBIL Overnight MIBOR as on 29/05/2020).
For SIP performance refer page 61. For scheme performance refer page 63-70. For Fund manager wise scheme performance refer page 71-74.

June 2020Fundamentals 19
Thematic FundDetails as on May 31, 2020Type of SchemeAn Open Ended Equity Scheme following consumption theme
Current Investment PhilosophyThe fund has a focused approach to investing in leaders or potential leaders that are likely to benefit directly or indirectly from domestic consumption led demand. It is well diversified across key segments like Consumer Non-Durables, Media & Entertainment, Automobile, Healthcare Services, Pharmaceuticals, etc., driven by relative attractiveness of Opportunities and Valuations. The fund has a flexi cap structure, allowing it to participate across market caps. Strong business model that allows for good ROE generation will be the primary basis for investment. Businesses with focus on sustainable profitable growth will be the core components of the investment universe.
Date of AllotmentSeptember 30, 2004Fund ManagerSailesh Raj BhanBenchmarkNifty India Consumption TRIFund sizeMonthly Average: ` 74.46 CrMonth End: ` 78.71 CrNAV as on May 29, 2020Growth Plan ` 61.3405 Direct - Growth Plan ` 64.9345Dividend Plan ` 15.9742 Direct - Dividend Plan ` 21.3562Bonus Option ` 61.3405 Direct - Bonus Option ` 64.9344Portfolio Turnover (Times) 0.81Total Expense Ratio^Regular/Other than Direct 2.74Direct 2.00Load structureEntry Load: Nil Exit Load: 1% if redeemed or switched out on or before completion of 1 month from the date of allotment of units. Nil, thereafter.W.e.f May 21, 2020
Portfolio as on May 31, 2020
Portfolio as on May 31, 2020
Volatility MeasuresStandard Deviation 5.71 Beta 0.96 Sharpe Ratio -0.05
Note: The above measures have been calculated using monthly rolling returns for 36 months period with 4.04% risk free return (FBIL Overnight MIBOR as on 29/05/2020).
Record Date Rate (`/ Unit) Cum Dividend NAV Ex-Dividend NAVDividend Plan24-Jan-20 1.33 19.9981 18.498118-Jan-19 1.55 19.4422 17.692219-Jan-18 2.50 24.4435 21.9435
Record Date Rate (`/ Unit) Cum Dividend NAV Ex-Dividend NAVDirect - Dividend Plan24-Jan-20 1.33 26.1448 24.644818-Jan-19 1.55 24.7609 23.010919-Jan-18 2.50 30.1875 27.6875
Dividend History
Product LabelThis product is suitable for investors who are seeking*:
Investors understand that their principalwill be at High risk
� Long term capital growth
� Investment in equity, equity related securities of companies that are likely to ben-efit directly or indirectly from domestic consumption led demand.
*Investors should consult their financial advisors if in doubt about whether the product is suitable for them.
Product LabelThis product is suitable for investors who are seeking*:
Investors understand that their principalwill be at High risk
� Long term capital growth
� Investment in equity and equity related securities of pharma & other associated companies
*Investors should consult their financial advisors if in doubt about whether the product is suitable for them.
Sector FundDetails as on May 31, 2020Type of SchemeAn open ended equity scheme investing in pharma sector
Current Investment PhilosophyThe Fund seeks to invest in pharma sector with focus on important segments of the sector viz Domestic Business, International & CRAMS and include deep value as well as high growth pharma businesses. The fund invests across market capitalization within the sector. It may suit investment horizon of around 2-3 years.
Date of AllotmentJune 5, 2004
Fund ManagerSailesh Raj Bhan
BenchmarkS&P BSE Healthcare TRI
Fund sizeMonthly Average: ` 2,889.72 CrMonth End: ` 2,991.57 CrNAV as on May 29, 2020Growth Plan ` 186.2081 Direct - Growth Plan ` 197.9576Dividend Plan ` 58.5822 Direct - Dividend Plan ` 74.4141Bonus Option ` 186.2081 Direct - Bonus Option ` 197.9576
Portfolio Turnover (Times) 0.31
Total Expense Ratio^Regular/Other than Direct 2.24Direct 1.29Load structureEntry Load: Nil Exit Load: 1% if redeemed or switched out on or before completion of 1 month from the date of allotment of units. Nil, thereafter.W.e.f May 21, 2020
Record Date Rate (`/ Unit) Cum Dividend NAV Ex-Dividend NAVDividend Plan28-Feb-20 3.98 52.8841 48.384101-Mar-19 4.43 56.5884 51.588401-Mar-18 6.00 58.6103 52.6103
Record Date Rate (`/ Unit) Cum Dividend NAV Ex-Dividend NAVDirect - Dividend Plan28-Feb-20 3.98 65.8193 61.319301-Mar-19 4.43 68.7031 63.703101-Mar-18 6.00 69.2904 63.2904
Dividend History
Special Feature: Nippon India Any Time Money Card
Nippon India Consumption Fund
Nippon India Pharma Fund
Past performance may or may not be sustained in future. Pursuant to dividend payment, NAV falls to the extent of payout & statutory levy (if applicable). Face Value-`10.
Past performance may or may not be sustained in future. Pursuant to dividend payment, NAV falls to the extent of payout & statutory levy (if applicable). Face Value-`10.
For SIP performance refer page 61. For scheme performance refer page 63-70. For Fund manager wise scheme performance refer page 71-74.
For SIP performance refer page 61. For scheme performance refer page 63-70. For Fund manager wise scheme performance refer page 71-74.
Volatility MeasuresStandard Deviation 5.81 Beta 0.83 Sharpe Ratio 0.17
Note: The above measures have been calculated using monthly rolling returns for 36 months period with 4.04% risk free return (FBIL Overnight MIBOR as on 29/05/2020).
Please refer page no. 82 for explanation on symbol: ^ and @ wherever available
Company/Issuer % of AssetsAutoMaruti Suzuki India Limited* 5.70Hero MotoCorp Limited* 5.40Mahindra & Mahindra Limited* 4.44Bajaj Auto Limited 3.44TVS Motor Company Limited 2.13Eicher Motors Limited 2.10Consumer DurablesDixon Technologies (India) Limited* 4.96Titan Company Limited 2.83Consumer Non DurablesITC Limited* 11.41Hindustan Unilever Limited* 7.84Tata Consumer Products Limited* 4.66Asian Paints Limited* 4.28United Spirits Limited* 3.77Varun Beverages Limited 2.51Dabur India Limited 2.41Marico Limited 2.18
Company/Issuer % of AssetsBritannia Industries Limited 2.15Colgate Palmolive (India) Limited 1.77Bajaj Consumer Care Limited 1.26Emami Limited 1.24United Breweries Limited 1.22Hotels, Resorts And Other Recreational ActivitiesThe Indian Hotels Company Limited 1.34Media & EntertainmentINOX Leisure Limited 1.83RetailingTrent Limited 2.80Aditya Birla Fashion and Retail Limited 2.29Telecom - ServicesBharti Airtel Limited* 11.30Equity Less Than 1% of Corpus 1.20Cash and Other Receivables 1.55Grand Total 100.00
*Top 10 Holdings
Company/Issuer % of AssetsHealthcare ServicesThyrocare Technologies Limited* 4.44Fortis Healthcare Limited 4.10Narayana Hrudayalaya Limited 2.59PharmaceuticalsAurobindo Pharma Limited* 11.96Cipla Limited* 10.40Dr. Reddy's Laboratories Limited* 10.14Sun Pharmaceutical Industries Limited* 9.99Divi's Laboratories Limited* 8.79Lupin Limited* 8.14Syngene International Limited* 5.73
Company/Issuer % of AssetsBiocon Limited* 4.75Sanofi India Limited* 4.52Cadila Healthcare Limited 4.02Abbott India Limited 3.92Alkem Laboratories Limited 2.35Indoco Remedies Limited 2.29Equity Less Than 1% of Corpus 0.98Cash and Other Receivables 0.89Grand Total 100.00
*Top 10 Holdings
Special Feature: Nippon India Any Time Money CardPlease refer page no. 82 for explanation on symbol: ^ and @ wherever available

June 202020 Fundamentals
ELSS
Details as on May 31, 2020
Type of Scheme
An open ended equity linked saving scheme with a statutory lock in of 3 years and tax benefit.
Current Investment Philosophy
Seeks to maintain balance between large cap companies and mid cap companies. Endeavors to invest in potential leaders. Invest in companies with potential of high growth prospects over medium term (2-3 years). Generally, the fund has two or three sector calls at a time. They are mostly in-line of emerging market trends. Small percentage of portfolio is invested in contrarian calls.
Significant percent of outstanding equity of the scheme is invested in high conviction mid-cap companies. Significant allocation/exposure is taken in Multinational Companies (MNC’s). Attempt to have a balanced portfolio on a macro basis, allocating to themes like Domestic, Consumption & Defensive.
Date of Allotment
September 21, 2005
Fund Manager
Ashwani Kumar
Benchmark
S&P BSE 100 TRI
Fund Size
Monthly Average: ` 7,428.08 Cr
Month End: ` 7,573.02 Cr
NAV as on May 29, 2020Growth Plan ` 38.2865Dividend Plan ` 12.7033Annual Dividend Plan ` 7.4814Direct - Growth Plan ` 40.5464Direct - Dividend Plan ` 15.8862Direct - Annual Dividend Plan ` 7.7620
Volatility MeasuresStandard Deviation 7.14Beta 1.10Sharpe Ratio -0.16Note: The above measures have been calculated using monthly rolling returns for 36 months period with 4.04% risk free return (FBIL Overnight MIBOR as on 29/05/2020).
Portfolio Turnover (Times) 1.09
Total Expense Ratio^
Regular/Other than Direct 2.02
Direct 1.30
Load structure
Entry Load: Nil
Exit Load: Nil Product Label
This product is suitable for investors who are seeking*:
Investors understand that their principalwill be at Moderately High risk
� Long term capital growth
� Investment in equity and equity related securities
*Investors should consult their financial advisors if in doubt about whether the product is suitable for them.
Portfolio as on May 31, 2020
Industry Allocation
AMFI Classification
15.81%
13.68%
12.83%
8.55%
6.65%
6.29%
4.90%
3.93%
3.62%
3.32%
Banks
Petroleum Products
Industrial Capital Goods
Auto
Finance
Ferrous Metals
Software
Power
Telecom - Services
Construction Project
Dividend HistoryRecord Date Rate (`/ Unit) Cum Dividend
NAVEx-Dividend NAV
Dividend Plan10-Jan-20 0.18 19.0858 18.885813-Nov-19 0.18 18.1582 17.958226-Sep-18 0.35 18.9787 18.5786Direct - Dividend Plan10-Jan-20 0.18 23.7499 23.549913-Nov-19 0.18 22.5239 22.323926-Sep-18 0.35 23.2553 22.8553Annual Dividend Plan29-Mar-19 0.80 11.9184 11.0184Direct - Annual Dividend Plan29-Mar-19 0.80 12.243 11.343
Past performance may or may not be sustained in future. Pursuant to dividend payment, NAV falls to the extent of payout & statutory levy (if applicable). Face Value-`10.
Nippon India Tax Saver (ELSS) Fund
SIP - If you invested ` 10000 every monthSince Inception 10 Years 5 Years 3 Years 1 Year
Total Amount Invested (`) 1,770,000 1,200,000 600,000 360,000 120,000
Market Value (`) 3,046,208 1,402,485 449,520 252,871 94,532Scheme Return (%) 7.02 3.08 -11.41 -22.08 -38.71B: S&P BSE 100 TRI Return (%) N.A 6.68 1.09 -6.76 -23.05AB: S&P BSE Sensex TRI Return (%) 8.52 7.08 2.53 -4.76 -23.87Inception Date: September 21, 2005
N.A: Since TRI data is not available prior to 01/08/2006 for S&P BSE 100, performance for such period is not provided.Past performance may or may not be sustained in future. It is assumed that a SIP of `10,000 each executed on 10th of every month including the first installment in the Growth option of the Fund. Returns on SIP and Benchmark are annualized and cumulative investment return for cash flows resulting out of uniform and regular monthly subscriptions have been worked out on excel spreadsheet function known as XIRR.Load has not been taken into consideration.B: Benchmark, AB: Additional Benchmark, TRI: Total Return IndexTRI - Total Returns Index reflects the returns on the index arising from (a) constituent stock price movements and (b) dividend receipts from constituent index stocks, thereby showing a true picture of returns.
For scheme performance refer page 63-70. For Fund manager wise scheme performance refer page 71-74.
Please refer page no. 82 for explanation on symbol: ^ and @ wherever available
Company/Issuer % of AssetsAutoTVS Motor Company Limited 3.29Hero MotoCorp Limited 2.78Ashok Leyland Limited 2.27BanksHDFC Bank Limited* 5.60ICICI Bank Limited* 5.13State Bank of India 1.92Axis Bank Limited 1.65Kotak Mahindra Bank Limited 1.07ChemicalsLinde India Limited 1.98Construction ProjectLarsen & Toubro Limited* 3.32Consumer Non DurablesITC Limited 2.11Ferrous MetalsSteel Authority of India Limited* 3.58Mishra Dhatu Nigam Limited 1.47Tata Steel Limited 1.14FinanceHousing Development Finance Corporation Limited 1.97REC Limited 1.79Power Finance Corporation Limited 1.79Industrial Capital Goods
Company/Issuer % of AssetsHoneywell Automation India Limited* 4.11Siemens Limited 3.30ABB India Limited 1.63Schneider Electric Infrastructure Limited 1.23Industrial ProductsVesuvius India Limited 1.23Minerals/MiningCoal India Limited 2.10Petroleum ProductsReliance Industries Limited* 7.38Hindustan Petroleum Corporation Limited* 3.45Bharat Petroleum Corporation Limited 2.85PowerNTPC Limited* 3.72SoftwareInfosys Limited* 4.57Telecom - ServicesBharti Airtel Limited* 3.62TransportationInterGlobe Aviation Limited 1.95Equity Less Than 1% of Corpus 13.66Cash and Other Receivables 2.36Grand Total 100.00
*Top 10 Holdings

June 2020Fundamentals 21
Arbitrage Fund
Details as on May 31, 2020
Type of Scheme
An open ended scheme investing in arbitrage opportunities
Current Investment Philosophy
A conservative arbitrage fund that aims to generate income through arbitrage opportunities arising out of pricing mismatch in a security between cash and derivative segment and with derivatives segment along with investments in debt securities and money market instruments. The fund portfolio is completely hedged and takes offsetting positions on various markets simultaneously. The arbitrage fund follows a market neutral strategy and carries no specific equity risk. In the absence of adequate arbitrage opportunities, the scheme may invest in short term debt or money market securities.
Date of Allotment
October 14, 2010
Fund Manager
Anand D Gupta Anju Chhajer
Benchmark
NIFTY 50 Arbitrage Index
Fund Size
Monthly Average: ` 7,495.66 Cr
Month End: ` 7,943.58 Cr
NAV as on May 29, 2020Growth Plan ` 20.3909Dividend Plan ` 12.5098Monthly Dividend Plan ` 10.8180Direct - Growth Plan ` 21.2474Direct - Dividend Plan ` 13.3705Direct - Monthly Dividend Plan ` 11.3096
Volatility MeasuresStandard Deviation 0.19Beta 0.40Sharpe Ratio 0.99Note: The above measures have been calculated using monthly rolling returns for 36 months period with 4.04% risk free return (FBIL Overnight MIBOR as on 29/05/2020).
Portfolio Turnover (Times) 13.26
Total Expense Ratio^
Regular/Other than Direct 1.02
Direct 0.31
Load structure
Entry Load: Nil
Exit Load: 0.25% if redeemed or switched out on or before completion of 1 month from the date of allotment of units. Nil, thereafter.
Product Label
This product is suitable for investors who are seeking*:
Investors understand that their principalwill be at Moderately Low risk
� Income over short term
� Income through arbitrage opportunities between cash and derivative market and arbitrage opportunities within the derivative segment
*Investors should consult their financial advisors if in doubt about whether the product is suitable for them.
Portfolio as on May 31, 2020
Industry Allocation
AMFI Classification
9.59%
9.27%
8.22%
6.93%
6.60%
6.50%
4.32%
3.21%
1.99%
1.54%
Banks
Software
Finance
Petroleum Products
Pharmaceuticals
Consumer Non Durables
Telecom - Services
Cement
Auto
Ferrous Metals
Dividend HistoryRecord Date Rate (`/ Unit) Cum Dividend NAV Ex-Dividend NAV
Dividend Plan23-Mar-20 0.1328 12.4154 12.265423-Dec-19 0.1328 12.4404 12.290424-Sep-19 0.1328 12.4248 12.2748Direct - Dividend Plan23-Mar-20 0.1328 13.2393 13.089323-Dec-19 0.1328 13.2317 13.081724-Sep-19 0.1328 13.1873 13.0373Monthly Dividend Plan23-Mar-20 0.0443 10.6566 10.606624-Feb-20 0.0443 10.6991 10.649127-Jan-20 0.0443 10.7038 10.6538Direct - Monthly Dividend Plan23-Mar-20 0.0443 11.1219 11.071924-Feb-20 0.0443 11.1563 11.106327-Jan-20 0.0443 11.1531 11.1031
Past performance may or may not be sustained in future. Pursuant to dividend payment, NAV falls to the extent of payout & statutory levy (if applicable). Face Value-`10.
Special Feature: Nippon India Any Time Money Card
Nippon India Arbitrage Fund
SIP - If you invested ` 10000 every monthSince Inception 5 Years 3 Years 1 Year
Total Amount Invested (`) 1,160,000 600,000 360,000 120,000
Market Value (`) 1,645,577 703,944 396,483 124,011Scheme Return (%) 7.08 6.40 6.50 6.65B: NIFTY 50 Arbitrage Index Return (%) 6.24 5.33 5.38 4.41AB: S&P BSE Sensex TRI Return (%) 7.03 2.53 -4.76 -23.87Inception Date: October 14, 2010
Past performance may or may not be sustained in future. It is assumed that a SIP of `10,000 each executed on 10th of every month including the first installment in the Growth option of the Fund. Returns on SIP and Benchmark are annualized and cumulative investment return for cash flows resulting out of uniform and regular monthly subscriptions have been worked out on excel spreadsheet function known as XIRR. Load has not been taken into consideration.B: Benchmark, AB: Additional Benchmark, TRI: Total Return IndexTRI - Total Returns Index reflects the returns on the index arising from (a) constituent stock price movements and (b) dividend receipts from constituent index stocks, thereby showing a true picture of returns.For scheme performance refer page 63-70. For Fund manager wise scheme performance refer page 71-74.
Please refer page no. 82 for explanation on symbol: ^ and @ wherever available
Company/Issuer Rating % of AssetsEquityBanksICICI Bank Limited* 3.95Axis Bank Limited* 2.62State Bank of India 1.21IndusInd Bank Limited 1.07CementUltraTech Cement Limited 1.47Grasim Industries Limited 1.16Consumer Non DurablesHindustan Unilever Limited* 4.97FinanceHousing Development Finance Corporation Limited*
6.12
Mutual Fund units 9.84Nippon India Mutual Fund ICRA A1+ 9.84Non - Ferrous MetalsVedanta Limited 1.05Petroleum ProductsReliance Industries Limited* 4.39Bharat Petroleum Corporation Limited* 1.56
Company/Issuer Rating % of AssetsPharmaceuticalsSun Pharmaceutical Industries Limited* 2.85Aurobindo Pharma Limited 1.12SoftwareInfosys Limited* 4.87Tata Consultancy Services Limited* 2.79Telecom - ServicesBharti Airtel Limited* 4.17DebtCorporate Bond 6.01REC Limited CRISIL AAA 4.58Power Finance Corporation Limited CRISIL AAA 0.77National Bank For Agriculture and Rural Development
CRISIL AAA 0.66
Floating Rate Note 0.94Shriram City Union Finance Limited CARE AA+ 0.94Equity Less Than 1% of Corpus 20.51Derivatives, Cash and Other Receivables 17.34Grand Total 100.00
*Top 10 Holdings

June 202022 Fundamentals
Thematic (International)
Details as on May 31, 2020
Type of Scheme
An open ended equity scheme following Japan focused theme.
Current Investment Philosophy
The Fund endeavors to create a portfolio of companies which are leaders or potential leaders in the growth oriented sectors of Japan and are listed on recognized stock exchanges of Japan, using a blend of top down and bottom up approach without any extreme sector bias.
Date of Allotment
August 26, 2014
Fund Manager
Kinjal Desai, Anju Chhajer
Benchmark
TOPIX TRI (Tokyo Stock Price Index)
Fund Size
Monthly Average: ` 36.16 Cr
Month End: ` 39.85 Cr
NAV as on May 29, 2020Growth Plan ` 13.8421Dividend Plan ` 13.8421Bonus Option ` 13.8421Direct - Growth Plan ` 14.4843Direct - Dividend Plan ` 14.4843Direct - Bonus Option ` 14.4843
Volatility MeasuresStandard Deviation 4.25Beta 1.04Sharpe Ratio 0.09Note: The above measures have been calculated using monthly rolling returns for 36 months period with 4.04% risk free return (FBIL Overnight MIBOR as on 29/05/2020).
Portfolio Turnover (Times) 0.25
Total Expense Ratio^
Regular/Other than Direct 2.38
Direct 1.33
Load structure
Entry Load: Nil
Exit Load: 1% if redeemed or switched out on or before completion of 1 year from the date of allotment of units. Nil, thereafter.
Product Label
This product is suitable for investors who are seeking*:
Investors understand that their principalwill be at High risk
� Long term capital growth
� Investment in equity and equity related securities of companies listed on recognized stock exchange of Japan
*Investors should consult their financial advisors if in doubt about whether the product is suitable for them.
Portfolio as on May 31, 2020
Industry Allocation
MSCI Classification
6.26%
5.68%
3.67%
3.41%
3.37%
3.26%
3.23%
3.22%
3.22%
3.18%
Building Products
Electronic Equipment & Instruments
Steel
Electronic Components
Research & Consulting Services
Other Diversified Financial Services
Brewers
Human Resource &Employment Services
Apparel Retail
Construction & Engineering
Nippon India Japan Equity Fund
SIP - If you invested ` 10000 every monthSince Inception 5 Years 3 Years 1 Year
Total Amount Invested (`) 700,000 600,000 360,000 120,000
Market Value (`) 854,049 714,878 398,275 125,681Scheme Return (%) 6.81 7.03 6.81 9.46
B: Topix TRI Return (%) 8.95 8.66 7.27 14.15AB: S&P BSE Sensex TRI Return (%) 3.04 2.54 -4.75 -23.87Inception Date: August 26, 2014
Past performance may or may not be sustained in future. It is assumed that a SIP of `10,000 each executed on 10th of every month including the first installment in the Growth option of the Fund. Returns on SIP and Benchmark are annualized and cumulative investment return for cash flows resulting out of uniform and regular monthly subscriptions have been worked out on excel spreadsheet function known as XIRR. Load has not been taken into consideration.B: Benchmark, AB: Additional Benchmark, TRI: Total Return IndexTRI - Total Returns Index reflects the returns on the index arising from (a) constituent stock price movements and (b) dividend receipts from constituent index stocks, thereby showing a true picture of returns.
For scheme performance refer page 63-70. For Fund manager wise scheme performance refer page 71-74.
Please refer page no. 82 for explanation on symbol: ^ and @ wherever available
Company/Issuer % of Assets
Apparel RetailFast Retailing Co Ltd* 3.22Automobile ManufacturersToyota Motor Corp 3.11BrewersAsahi Group Holdings Ltd* 3.23Building ProductsToto Ltd* 3.18Daikin Industries Ltd 3.09Construction & EngineeringJGC CORP* 3.18Construction & Farm Machinery & Heavy TrucksKomatsu Ltd 3.05Diversified BanksMitsubishi UFJ Financial Group Inc 3.05Diversified Real Estate ActivitiesMitsui Fudosan Co 3.16Electrical EquipmentNidec Corporation 3.05Electronic ComponentsOmron Corporation Ord* 3.41Electronic Equipment & InstrumentsSHIMADZU CORPORATION 3.05Hitachi Ltd 2.63Food RetailSeven & I Holdings 3.00HomebuildingSekisui Chemical Co Ltd* 3.17Human Resource & Employment ServicesRecruit Holdings Co Ltd* 3.22
Company/Issuer % of AssetsIT Consulting & Other ServicesNTT Data Corporation 3.02Industrial MachinerySMC Corp 2.89Other Diversified Financial ServicesOrix Corporation* 3.26Personal ProductsKao Corporation 2.91PharmaceuticalsTAKEDA PHARMACEUTICAL CO LTD 3.04Property & Casualty InsuranceMsand Ad Insurance Group Holdings Inc 3.08RailroadsEast Japan Railway 3.14Research & Consulting ServicesNihon M&A Center Inc* 3.37Semiconductor EquipmentTokyo Electron Ltd 3.05Specialty ChemicalsShin Etsu Chemical Co 3.13SteelHitachi Metals Ltd* 3.67Systems SoftwareTrend Micro Inc 3.04Tires & RubberBridgestone Corp 3.10Trading Companies & DistributorsMITSUBISHI CORP 3.07Cash and Other Receivables 6.43Grand Total 100.00
*Top 10 Holdings
Special Feature: Nippon India Any Time Money Card

June 2020Fundamentals 23
Thematic (International)
Details as on May 31, 2020
Type of Scheme
An open ended equity scheme following US focused theme.
Current Investment Philosophy
The fund endeavours to invest in a portfolio of high quality stocks listed on recognized stock exchanges of US. The investment strategy of the fund would be powered by the research support of Morningstar Investment Adviser India Private Limited (MIA), a group company of Morningstar, Inc. Morningstar employs their proprietary research methodology, focused on Economic Moats, to identify investment opportunity. The fund proposes to follow the Hare Strategy for its investments. The Hare portfolio invests in stocks of firms that are experiencing rapid growth, emphasizing those that possess sustainable competitive advantages.
Companies in this strategy tend to faster-growing with both higher risk and higher return potential. The investment philosophy would be a blend of top down and bottom up approach without any sector or market capitalization bias.
Date of Allotment
July 23, 2015
Fund Manager
Kinjal Desai, Anju Chhajer
Benchmark
S&P 500 TRI
Fund Size
Monthly Average: ` 128.54 Cr
Month End: ` 136.13 Cr
NAV as on May 29, 2020Growth Plan ` 18.4517Dividend Plan ` 18.4517Direct - Growth Plan ` 19.3670Direct - Dividend Plan ` 19.3670
Volatility MeasuresStandard Deviation 4.83Beta 0.94Sharpe Ratio 0.24Note: The above measures have been calculated using monthly rolling returns for 36 months period with 4.04% risk free return (FBIL Overnight MIBOR as on 29/05/2020).
Portfolio Turnover (Times) 0.07
Total Expense Ratio^
Regular/Other than Direct 2.74
Direct 1.50
Load structure
Entry Load: Nil
Exit Load: 1% if redeemed or switched out on or before completion of 1 year from the date of allotment of units. Nil, thereafter.
Product Label
This product is suitable for investors who are seeking*:
Investors understand that their principalwill be at High risk
� Long term capital growth
� Investment in equity and equity related securities of companies listed on recognized stock exchanges in the US.
*Investors should consult their financial advisors if in doubt about whether the product is suitable for them.
Portfolio as on May 31, 2020
Industry Allocation
MSCI Classification
14.36%
10.07%
9.37%
9.29%
8.90%
5.94%
5.55%
5.37%
5.23%
4.82%
Interactive Media &Services
Data Processing &Outsourced Services
Internet & Direct MarketingRetail
Managed Health Care
Automotive Retail
Systems Software
Home Improvement Retail
Trucking
Life Sciences Tools & Services
Health Care Distributors
Special Feature: Nippon India Any Time Money Card
Nippon India US Equity Opportunities Fund
SIP - If you invested ` 10000 every monthSince Inception 3 Year 1 Year
Total Amount Invested (`) 590,000 360,000 120,000
Market Value (`) 891,943 469,670 134,289
Scheme Return (%) 17.05 18.43 24.32
B: S&P 500 TRI Return (%) 15.36 15.20 16.62
AB: S&P BSE Sensex TRI Return (%) 2.41 -4.76 -23.87
Inception Date: July 23, 2015
Since the scheme is in existence for more than 3 years but less than 5 years, hence returns for 5 years period are not provided.
Past performance may or may not be sustained in future. It is assumed that a SIP of `10,000 each executed on 10th of every month including the first installment in the Growth option of the Fund. Returns on SIP and Benchmark are annualized a nd cumulative investment return for cash flows resulting out of uniform and regular monthly subscriptions have been worked out on excel spreadsheet function known as XIRR. Load has not been taken into consideration.B: Benchmark, AB: Additional Benchmark, TRI: Total Return IndexTRI - Total Returns Index reflects the returns on the index arising from (a) constituent stock price movements and (b) dividend receipts from constituent index stocks, thereby showing a true picture of returns.
For scheme performance refer page 63-70. For Fund manager wise scheme performance refer page 71-74.
Please refer page no. 82 for explanation on symbol: ^ and @ wherever available
Company/Issuer % of Assets
Asset Management & Custody Banks
Blackrock Inc 3.57
Automotive Retail
O'Reilly Automotive Inc* 5.15
Carmax Inc 3.75
Data Processing & Outsourced Services
Mastercard Incorporated* 5.48
Visa Inc 4.59
Health Care Distributors
Amerisource Bergen Corp* 4.82
Health Care Supplies
Align Technology Inc 3.28
Home Improvement Retail
Lowes Cos Inc* 5.55
Interactive Media & ServicesFacebook Inc* 5.61
Alphabet Inc A* 4.60
Alphabet Inc 4.03
Baidu Inc Spon ADR 0.12
Company/Issuer % of AssetsInternet & Direct Marketing RetailAmazon Com Inc* 5.09
Booking Holdings Inc 4.28
Life Sciences Tools & Services
Iqvia Holdings* 5.23
Managed Health CareUnitedhealth Group Inc* 4.72
Anthem INC 4.57
Movies & EntertainmentThe Walt Disney Company 2.64
Oil
Enbridge Inc 4.24
Systems Software
Microsoft Corp* 5.94
Trucking
Uber Technologies Inc 3.19
Lyft Inc 2.18
Cash and Other Receivables 7.35
Grand Total 100.00
*Top 10 Holdings
June 202024 Fundamentals
Overnight Fund
Details as on May 31, 2020
Type of Scheme
An open-ended debt scheme investing in overnight securities
Current Investment Philosophy
The fund endeavors to generate income commensurate with relatively low risk along with high liquidity by investing in debt and money market instruments maturing on or before next business day. It is suitable for investors with an investment horizon of 1 day to 7 days.
Date of Allotment
December 18, 2018
Fund Manager
Anju Chhajer
Benchmark
Crisil Overnight Index
Fund Size
Monthly Average: ` 4,961.89 Cr
Month End: ` 4,596.55 Cr
NAV as on May 31, 2020Growth Plan ` 107.5815Daily Dividend Plan ` 100.0050Weekly Dividend Plan ` 100.0218Monthly Dividend Plan ` 100.1642Quarterly Dividend Plan ` 100.7599Direct - Growth Plan ` 107.7380Direct - Daily Dividend Plan ` 100.0050Direct - Weekly Dividend Plan ` 100.0223Direct - Monthly Dividend Plan ` 100.1750Direct - Quarterly Dividend Plan ` 100.7853
Average Maturity 1 Days
Modified Duration 0 Days
Yield to Maturity* 3.24%
Total Expense Ratio^
Regular/Other than Direct: 0.17%
Direct: 0.07%
Load structure
Entry Load: Nil
Exit Load: Nil
*excluding other receivablesYTM including other receivables: 3.24%
Portfolio as on May 31, 2020
Nippon India Overnight Fund
Special Feature: Nippon India Any Time Money Card
Dividend History
Past performance may or may not be sustained in future. Pursuant to dividend payment, NAV falls to the extent of payout & statutory levy (if applicable). Face Value - `100.
Record Date Rate (`/ Unit) Cum Dividend NAV Ex-Dividend NAV
Monthly Dividend Plan
26-May-20 0.2810 100.4042 100.1232
27-Apr-20 0.2232 100.3565 100.1333
26-Mar-20 0.2716 100.5050 100.1280
Direct - Monthly Dividend Plan
26-May-20 0.2531 100.3857 100.1326
27-Apr-20 0.2312 100.3689 100.1377
26-Mar-20 0.2775 100.5173 100.1321
Quarterly Dividend Plan
19-Mar-20 0.8531 101.3807 100.1964
19-Dec-19 0.8727 101.4096 100.1981
19-Sep-19 0.9835 101.5668 100.2015
Direct - Quarterly Dividend Plan
19-Mar-20 0.8707 101.4088 100.2000
19-Dec-19 0.8893 101.4361 100.2015
19-Sep-19 1.0019 101.5957 100.2048
Please refer page no. 82 for explanation on symbol: ^ and @ wherever available
Company/Issuer Rating % of Assets
Tri-Party Repo & Cash & Other Receivables 100.00
Grand Total 100.00
Product Label
This product is suitable for investors who are seeking*:
Investors understand that their principalwill be at Low risk
� Income over short term
� Investment in Debt & Money Market Instruments with overnight maturity
*Investors should consult their financial advisors if in doubt about whether the product is suitable for them.
For scheme performance refer page 63-70. For Fund manager wise scheme performance refer page 71-74.
Asset Allocation
Tri-Party Repo & Cash & Other Receivables,
100%
Rating Profile
AAA/SOV/A1+/Cash & Other Receivables,
100%

June 2020Fundamentals 25
Liquid Fund
Details as on May 31, 2020
Type of Scheme
An open ended Liquid Scheme
Current Investment Philosophy
The fund will focus on reasonable carry with a view to maximize returns while ensuring adequate liquidity through investments in various money market and debt instruments with maturity up to 91 days. The endeavor will be to maintain average maturity of the portfolio in the range of 40 - 70 days under normal market conditions.
Date of AllotmentDecember 9, 2003
Fund ManagerAnju Chhajer
BenchmarkCrisil Liquid Fund Index
Fund SizeMonthly Average: ` 29,291.82 CrMonth End: ` 31,728.04 Cr
NAV as on May 31, 2020Growth Plan ` 4,866.2716Daily Dividend Plan ` 1,528.7400Weekly Dividend Plan ` 1,530.6047Monthly Dividend Plan ` 1,584.5788Quarterly Dividend Plan ` 1,015.1076Direct - Growth Plan ` 4,895.6516Direct - Daily Dividend Plan ` 1,528.7400Direct - Weekly Dividend Plan ` 1,530.6119Direct - Monthly Dividend Plan ` 1,587.8828Direct - Quarterly Dividend Plan ` 1,017.5007Retail - Growth Plan ` 4,443.7908Retail - Daily Dividend Plan ` 1,524.2800Retail - Weekly Dividend Plan ` 1,034.3356Retail - Monthly Dividend Plan ` 1,326.9226Retail - Quarterly Dividend Plan ` 1,228.0950
Average Maturity 47 Days
Modified Duration 45 Days
Yield to Maturity* 3.89%
Total Expense Ratio^Regular/Other than Direct: 0.27%Direct: 0.18%
Load structureEntry Load: NilExit Load:Investor exit upon subscription
Exit Load as % of redemption / switchout amount (including systematic transactions)
Up to Day 1 0.0070%Day 2 0.0065%Day 3 0.0060%Day 4 0.0055%Day 5 0.0050%Day 6 0.0045%Day 7 Onwards 0.0000%
*excluding other receivablesYTM including other receivables: 3.91%
Portfolio as on May 31, 2020
Dividend History
Nippon India Liquid Fund
Special Feature: Nippon India Any Time Money Card
Past performance may or may not be sustained in future. Pursuant to dividend payment, NAV falls to the extent of payout & statutory levy (if applicable). Face Value - `1000.
For scheme performance refer page 63-70. For Fund manager wise scheme performance refer page 71-74.
Record Date Rate (`/ Unit) Cum Dividend NAV Ex-Dividend NAVMonthly Dividend Plan26-May-20 6.8380 1590.8281 1583.990127-Apr-20 15.4579 1599.7271 1584.269226-Mar-20 1.0123 1587.0901 1585.6848Retail - Monthly Dividend Plan26-May-20 5.0074 1331.5724 1326.565027-Apr-20 12.1481 1338.9472 1326.799126-Mar-20 0.3145 1328.4217 1327.9851Direct - Monthly Dividend Plan26-May-20 6.9648 1594.2523 1587.287527-Apr-20 15.7236 1603.2906 1587.567026-Mar-20 1.1171 1590.5530 1589.0022
Record Date Rate (`/ Unit) Cum Dividend NAV Ex-Dividend NAVQuarterly Dividend Plan19-Mar-20 9.3803 1015.2844 1002.262119-Dec-19 9.9097 1017.3553 1003.598019-Sep-19 11.7904 1020.0494 1003.6812Retail - Quarterly Dividend Plan19-Mar-20 9.8679 1227.9023 1214.203019-Dec-19 10.5034 1230.4038 1215.822319-Sep-19 12.7661 1233.6479 1215.9251Direct - Quarterly Dividend Plan19-Mar-20 9.5459 1017.6232 1004.371019-Dec-19 10.0713 1019.6821 1005.700519-Sep-19 11.9626 1022.3896 1005.7823
Please refer page no. 82 for explanation on symbol: ^ and @ wherever available
Rating Profile
AAA/SOV/A1+/Cash & Other Receivables, 100%
Company/Issuer Rating % of AssetsCertificate of Deposit 18.81Bank of Baroda ICRA A1+/FITCH A1+ 6.82IDFC First Bank Limited CRISIL A1+ 3.91Axis Bank Limited ICRA A1+/CRISIL A1+ 3.29ICICI Bank Limited ICRA A1+/CARE A1+ 3.15IndusInd Bank Limited CRISIL A1+ 0.79Canara Bank FITCH A1+ 0.39National Bank For Agriculture and Rural Development
FITCH A1+ 0.31
Small Industries Dev Bank of India CARE A1+ 0.16Commercial Paper 48.64Reliance Jio Infocomm Limited CARE A1+/CRISIL A1+ 5.26Reliance Industries Limited CARE A1+/CRISIL A1+ 5.18Indian Oil Corporation Limited ICRA A1+ 2.82Bharat Petroleum Corporation Limited CRISIL A1+ 2.67National Bank For Agriculture and Rural Development
ICRA A1+/CRISIL A1+ 2.52
Hindustan Zinc Limited CRISIL A1+ 2.34Chambal Fertilizers & Chemicals Limited ICRA A1+ 2.03Vedanta Limited CRISIL A1+ 1.72Tata Steel Limited ICRA A1+ 1.58Hindustan Petroleum Corporation Limited CRISIL A1+ 1.57National Housing Bank CRISIL A1+ 1.57Grasim Industries Limited CRISIL A1+ 1.57UltraTech Cement Limited ICRA A1+ 1.57Mangalore Refinery and Petrochemicals Limited
ICRA A1+ 1.56
Ashok Leyland Limited ICRA A1+ 1.56Bahadur Chand Investments Pvt Limited (B M Munjal Group)
ICRA A1+ 1.40
Chennai Petroleum Corporation Limited CRISIL A1+ 0.94Tata Motors Limited CRISIL A1+ 0.94Tata Capital Financial Services Limited ICRA A1+ 0.94Bharti Telecom Limited CRISIL A1+ 0.93L&T Finance Limited CRISIL A1+ 0.78NLC India Limited CARE A1+ 0.78NTPC Limited CRISIL A1+ 0.63Dalmia Cement (Bharat) Limited ICRA A1+ 0.63LIC Housing Finance Limited CRISIL A1+ 0.63
Company/Issuer Rating % of AssetsTV18 Broadcast Limited CARE A1+ 0.62Network18 Media & Investments Limited CARE A1+ 0.62Export Import Bank of India CRISIL A1+ 0.61Alembic Pharmaceuticals Limited CRISIL A1+ 0.32Sterlite Technologies Limited ICRA A1+ 0.31Muthoot Finance Limited CRISIL A1+ 0.31Axis Finance Limited FITCH A1+ 0.31Torrent Power Limited CRISIL A1+ 0.31Standard Chartered Invest & Loans Limited CRISIL A1+ 0.31Aditya Birla Money Limited CRISIL A1+ 0.31Housing Development Finance Corporation Limited
CRISIL A1+ 0.23
Manappuram Finance Limited CRISIL A1+ 0.16Hero Cycles Limited CRISIL A1+ 0.08Corporate Bond 1.28Housing Development Finance Corporation Limited
CRISIL AAA 0.77
India Infradebt Limited CRISIL AAA 0.33Power Grid Corporation of India Limited CRISIL AAA 0.07Mahindra & Mahindra Financial Services Limited
FITCH AAA 0.06
L&T Finance Limited CARE AAA 0.03Floating Rate Note 0.95Mahindra & Mahindra Financial Services Limited
FITCH AAA 0.95
Government Bond 0.44Government of India SOV 0.44Treasury Bill 3.58Government of India SOV 3.58Cash Management Bills 25.59Government of India SOV 25.59Zero Coupon Bond 0.60Bajaj Finance Limited CRISIL AAA 0.60Cash & Other Receivables 0.10Grand Total 100.00
Product Label
This product is suitable for investors who are seeking*:
Investors understand that their principalwill be at Low risk
� Income over short term
� Investment in debt and money market instruments
*Investors should consult their financial advisors if in doubt about whether the product is suitable for them.
Asset Allocation
Commercial Paper, 48.64%Cash & Other Receivables, 0.1%
Government Bond, 0.44%Zero Coupon Bond, 0.6%
Floating Rate Note, 0.95%Corporate Bond, 1.28%
Certificate of Deposit, 18.81%
Treasury Bill, 29.18%

June 202026 Fundamentals
Money Market Fund
Details as on May 31, 2020
Type of SchemeAn open ended debt scheme investing in money market instruments
Current Investment PhilosophyThe fund would invest in money market instruments like Certificate of Deposits (CD), Commercial Papers (CP), etc. The portfolio duration would be maintained between 110 - 150 days.
Date of AllotmentJune 16, 2005
Fund ManagerAnju Chhajer
BenchmarkCRISIL Money Market Index
Fund SizeMonthly Average: ` 4,437.76 Cr
Month End: ` 4,217.99 Cr
NAV as on May 29, 2020Growth Plan ` 3,080.6422
Daily Dividend Plan ` 1,007.1481
Weekly Dividend Plan ` 1,007.5656
Monthly Dividend Plan ` 1,009.0498
Quarterly Dividend Plan ` 1,026.9147
Direct - Growth Plan ` 3,101.7977
Direct - Daily Dividend Plan ` 1,007.0823
Direct - Weekly Dividend Plan ` 1,007.5460
Direct - Monthly Dividend Plan ` 1,008.9990
Direct - Quarterly Dividend Plan ` 1,027.0131
Direct - Bonus Option ` 1,823.9228
Average Maturity 173 Days
Modified Duration 165 Days
Yield to Maturity* 4.43%
Total Expense Ratio^Regular/Other than Direct: 0.25%
Direct: 0.15%
Load structureEntry Load: Nil
Exit Load: Nil
*excluding other receivablesYTM including other receivables: 4.94%
Special Feature: Nippon India Any Time Money Card
Portfolio as on May 31, 2020
Record Date Rate (`/ Unit) Cum Dividend NAV Ex-Dividend NAV
Monthly Dividend Plan
26-May-20 9.0871 1018.4532 1009.3661
27-Apr-20 9.5462 1017.5287 1007.9825
25-Feb-20 3.8896 1011.5161 1006.1163
Direct - Monthly Dividend Plan
26-May-20 9.3166 1018.6270 1009.3104
27-Apr-20 9.6363 1017.7107 1008.0744
25-Feb-20 3.9484 1011.6071 1006.1257
Record Date Rate (`/ Unit) Cum Dividend NAV Ex-Dividend NAV
Quarterly Dividend Plan
19-Mar-20 8.6880 1014.5689 1002.5076
19-Dec-19 12.8398 1024.0729 1006.2479
19-Sep-19 14.5832 1026.9475 1006.7021
Direct - Quarterly Dividend Plan
19-Mar-20 8.9017 1014.7653 1002.4073
19-Dec-19 13.0243 1024.2698 1006.1886
19-Sep-19 14.7730 1027.1509 1006.6420
Dividend History
Nippon India Money Market Fund
Past performance may or may not be sustained in future. Pursuant to dividend payment, NAV falls to the extent of payout & statutory levy (if applicable). Face Value-`1000.
For scheme performance refer page 63-70. For Fund manager wise scheme performance refer page 71-74.
Rating Profile
AAA/SOV/A1+/Cash & Other Receivables,
100%
Company/Issuer Rating % of Assets
Certificate of Deposit 31.29
Axis Bank Limited ICRA A1+/CRISIL A1+ 8.11
Andhra Bank CARE A1+ 5.87
Bank of Baroda FITCH A1+ 3.50
ICICI Bank Limited ICRA A1+ 3.49
Small Industries Dev Bank of India CARE A1+ 3.47
IndusInd Bank Limited CRISIL A1+ 3.39
National Bank For Agriculture and Rural Development
CRISIL A1+/FITCH A1+
2.89
Export Import Bank of India CRISIL A1+ 0.58
Commercial Paper 56.60
LIC Housing Finance Limited CRISIL A1+ 8.05
JSW Steel Limited CARE A1+ 7.09
Reliance Jio Infocomm Limited CARE A1+ 7.05
Reliance Industries Limited CRISIL A1+/CARE A1+ 7.03
Larsen & Toubro Limited CRISIL A1+/ICRA A1+ 7.00
Housing Development Finance Corporation Limited
ICRA A1+/CRISIL A1+ 5.81
Company/Issuer Rating % of Assets
Deutsche Investments India Pvt Limited CRISIL A1+ 4.72
Bharat Petroleum Corporation Limited CRISIL A1+ 2.36
Grasim Industries Limited CRISIL A1+ 2.29
National Bank For Agriculture and Rural Development
ICRA A1+ 1.72
Tata Capital Housing Finance Limited CRISIL A1+ 1.71
Kotak Mahindra Investments Limited CRISIL A1+ 1.18
Hindustan Petroleum Corporation Limited CRISIL A1+ 0.59
Government Bond 11.59
Government of India SOV 11.59
Treasury Bill 0.82
Government of India SOV 0.82
Cash Management Bills 4.71
Government of India SOV 4.71
Cash & Other Receivables -5.01
Grand Total 100.00
Product Label
This product is suitable for investors who are seeking*:
Investors understand that their principalwill be at Moderately Low risk
� Income over short term
� Investment in money market instruments having residual maturity up to 1 year
*Investors should consult their financial advisors if in doubt about whether the product is suitable for them.
Please refer page no. 82 for explanation on symbol: ^ and @ wherever available
Asset Allocation
Commercial Paper, 56.6%
Cash & Other Receivables, -5.01%
Treasury Bill, 5.53%
Government Bond, 11.59%
Certificate of Deposit, 31.29%

June 2020Fundamentals 27
Ultra Short Duration Fund
Details as on May 31, 2020
Type of SchemeAn open ended ultra-short term debt scheme investing in debt and money market instruments such that the Macaulay duration of the portfolio is between 3 - 6 months. (Please refer to the page number 17 of the Scheme Information Document on which the concept of Macaulay’s Duration has been explained)
Current Investment Philosophy
The fund invests in debt and money market instruments with an endeavor to maintain portfolio duration between 160 - 180 days. The aim is to generate high gross yield through a portfolio investing across credit categories. Carry endeavors to protect against volatility.
Date of AllotmentDecember 7, 2001
Fund Manager
Vivek Sharma
Benchmark
NIFTY Ultra Short Duration Debt Index
Fund Size Main Portfolio Segregated Portfolio 1
Monthly Average: ` 756.34 Cr ` 29.80 Cr
Month End: ` 723.43 Cr ` 29.80 Cr
NAV as on May 29, 2020Main Portfolio Segregated Portfolio 1
Growth Plan ` 2,929.1017 ` 32.7070Daily Dividend Plan ` 1,107.3426 ` 12.3648Weekly Dividend Plan ` 1,086.4691 ` 12.1317Monthly Dividend Plan ` 999.1741 ` 11.1570Quarterly Dividend Plan ` 1,015.4890 ` 11.3392Direct - Growth Plan ` 3,104.3101 ` 34.4818Direct - Daily Dividend Plan ` 1,113.4868 ` 12.3682Direct - Weekly Dividend Plan ` 1,091.6900 ` 12.1366Direct - Monthly Dividend Plan ` 1,005.1530 ` 11.1649Direct - Quarterly Dividend Plan
` 1,022.8402 ` 11.4519
Average Maturity 263 DaysModified Duration 123 Days
Yield to Maturity* 9.62%
Total Expense Ratio^Main Segregated
Portfolio 1Regular/Other than Direct: 1.10% –Direct: 0.33% –
Load structure
Entry Load: Nil
Exit Load: Nil
Not applicable for Segregated Portfolio
*excluding other receivables
YTM including other receivables: 9.33%
Segregated Portfolio 1 YTM including other receivables: 5.37%
Special Feature: Nippon India Any Time Money Card
Please refer page no. 82 for explanation on symbol: ^ and @ wherever available
Segregated Portfolio 1 - Due to credit event (Default of debt servicing by Altico Capital India Limited (ACIL) on September 13, 2019), securities of ACIL have been segregated from the scheme’s portfolio w.e.f September 25, 2019.Kindly refer to SID/KIM for complete details on segregation of portfolio.
# Main Portfolio as on May 31, 2020
Dividend History
Past performance may or may not be sustained in future. Pursuant to dividend payment, NAV falls to the extent of payout & statutory levy (if applicable). Face Value-`1000.
##Security defaulted beyond its maturity date as on 31st May 2020 (forming part of net current assets) are as follows : 10.5% Altico Capital India Ltd Sr 10A NCD Matured on 26/09/2019 - 0.50%For scheme performance refer page 63-70. For Fund manager wise scheme performance refer page 71-74.
Record Date Rate (`/ Unit) Cum Dividend NAV Ex-Dividend NAVMonthly Dividend Plan
26-Aug-19 2.5574 1005.1180 1001.5677
25-Apr-19 5.4781 1008.4761 1000.8710
25-Mar-19 4.9982 1008.4928 1001.5539
Direct - Monthly Dividend Plan26-Aug-19 4.7923 1008.3544 1001.7014
25-Apr-19 5.9620 1009.7603 1001.4835
25-Mar-19 5.6903 1010.0663 1002.1666
Record Date Rate (`/ Unit) Cum Dividend NAV Ex-Dividend NAVQuarterly Dividend Plan19-Mar-19 14.6849 1025.7941 1005.4076
19-Dec-18 14.5798 1024.9312 1004.6906
19-Sep-18 13.5790 1023.1400 1004.2887
Direct - Quarterly Dividend Plan19-Mar-20 5.7626 1012.4629 1004.4629
19-Mar-19 16.1617 1033.7696 1011.3328
19-Dec-18 16.0932 1032.9392 1010.5976
Company/Issuer Rating % of AssetsCorporate Bond 70.64Panchshil Corporate Park Private Limited FITCH AAA(SO) 14.38Northern Arc Capital Limited FITCH A+ 11.76Piramal Enterprises Limited ICRA AA 10.39U.P. Power Corporation Limited CRISIL A+(CE) 8.86Clix Finance India Private Limited CARE AA- 8.31Vedanta Limited CRISIL AA 7.65Asirvad Microfinance Ltd CRISIL AA- 4.68Ahmedabad Maliya Tollway Limited (L&T IDPL Group)
ICRA AA(CE) 4.62
Floating Rate Note 10.39Jhajjar Power Limited (CLP group) FITCH AA- 10.39Zero Coupon Bond 4.42Morgan Credits Private Limited CARE BB 4.09JM Financial Asset Reconstruction Company Limited
ICRA AA- 0.32
Company/Issuer Rating % of Assets
TATA Realty & Infrastructure Limited CRISIL AA 0.02
PTC 4.65INDIAN RECEIVABLE TRUST 18 – FEB 2019 (Retails assets pool of Reliance Home / Commercial Finance)
CARE A(SO) 4.65
Cash & Other Receivables 9.90Grand Total 100.00
Product Label
This product is suitable for investors who are seeking*:
Investors understand that their principalwill be at Moderately Low risk
� Income over short term
� Investment in debt and money market instruments such that the Macaulay duration of the portfolio is between 3 - 6 months
*Investors should consult their financial advisors if in doubt about whether the product is suitable for them.
##Segregated Portfolio 1 as on May 31, 2020
Company/Issuer Rating % of AssetsCorporate Bond 50.00Altico Capital India Limited FITCH D 50.00
Cash & Other Receivables 50.00Grand Total 100.00
Nippon India Ultra Short Duration FundNippon India Ultra Short Duration Fund - Segregated Portfolio 1
#Security defaulted beyond its maturity date as on 31st May 2020 (forming part of net current assets) is as follows :- 14% Reliance Home Finance (Matured 31/10/2019) - 3.44%
Asset Allocation (Main Portfolio)
Corporate Bond, 70.64%
Cash & Other Receivables, 9.90%
Zero Coupon Bond, 4.42%
PTC, 4.65%
Floating Rate Note, 10.39%
Rating Profile (Main Portfolio)
AAA/SOV/A1+/Cash & Other Receivables,
24.28%BB, 4.09%
A+/A/A-/A1, 25.26%
AA-, 23.7%
AA, 22.67%
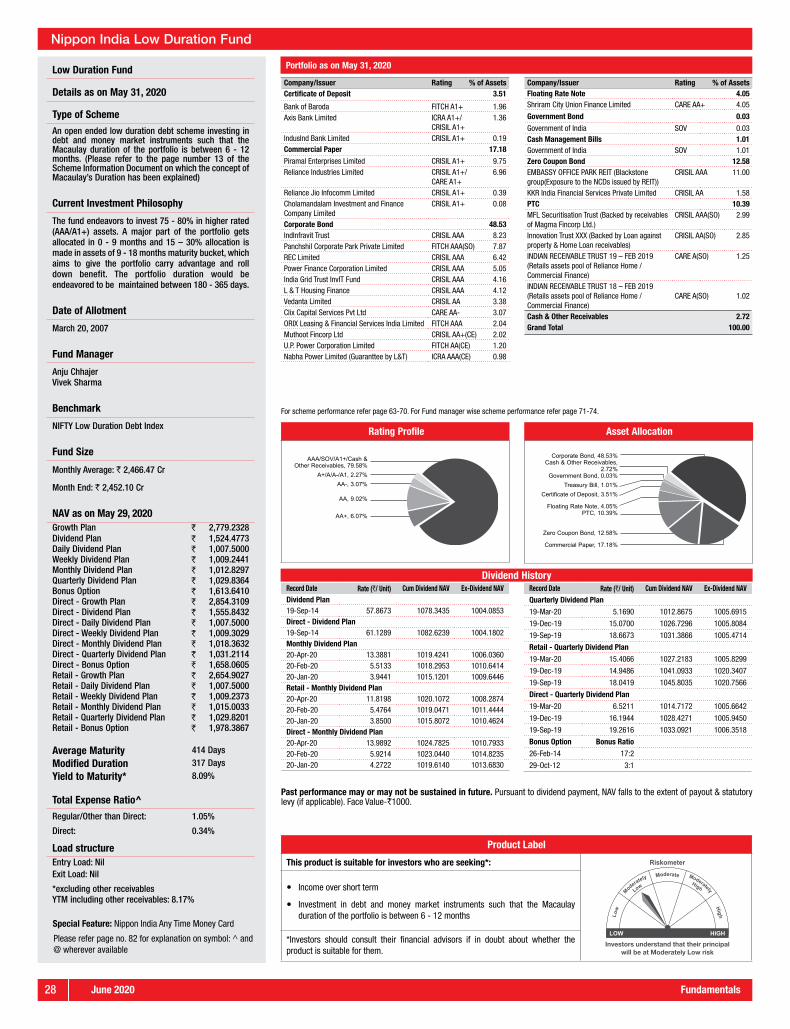
June 202028 Fundamentals
Low Duration Fund
Details as on May 31, 2020
Type of Scheme
An open ended low duration debt scheme investing in debt and money market instruments such that the Macaulay duration of the portfolio is between 6 - 12 months. (Please refer to the page number 13 of the Scheme Information Document on which the concept of Macaulay’s Duration has been explained)
Current Investment Philosophy
The fund endeavors to invest 75 - 80% in higher rated (AAA/A1+) assets. A major part of the portfolio gets allocated in 0 - 9 months and 15 – 30% allocation is made in assets of 9 - 18 months maturity bucket, which aims to give the portfolio carry advantage and roll down benefit. The portfolio duration would be endeavored to be maintained between 180 - 365 days.
Date of Allotment
March 20, 2007
Fund Manager
Anju Chhajer Vivek Sharma
Benchmark
NIFTY Low Duration Debt Index
Fund Size
Monthly Average: ` 2,466.47 Cr
Month End: ` 2,452.10 Cr
NAV as on May 29, 2020Growth Plan ` 2,779.2328Dividend Plan ` 1,524.4773Daily Dividend Plan ` 1,007.5000Weekly Dividend Plan ` 1,009.2441Monthly Dividend Plan ` 1,012.8297Quarterly Dividend Plan ` 1,029.8364Bonus Option ` 1,613.6410Direct - Growth Plan ` 2,854.3109Direct - Dividend Plan ` 1,555.8432Direct - Daily Dividend Plan ` 1,007.5000Direct - Weekly Dividend Plan ` 1,009.3029Direct - Monthly Dividend Plan ` 1,018.3632Direct - Quarterly Dividend Plan ` 1,031.2114Direct - Bonus Option ` 1,658.0605Retail - Growth Plan ` 2,654.9027Retail - Daily Dividend Plan ` 1,007.5000Retail - Weekly Dividend Plan ` 1,009.2373Retail - Monthly Dividend Plan ` 1,015.0033Retail - Quarterly Dividend Plan ` 1,029.8201Retail - Bonus Option ` 1,978.3867
Average Maturity 414 Days
Modified Duration 317 Days
Yield to Maturity* 8.09%
Total Expense Ratio^
Regular/Other than Direct: 1.05%
Direct: 0.34%
Load structureEntry Load: NilExit Load: Nil
*excluding other receivablesYTM including other receivables: 8.17%
Portfolio as on May 31, 2020
Record Date Rate (`/ Unit) Cum Dividend NAV Ex-Dividend NAVDividend Plan19-Sep-14 57.8673 1078.3435 1004.0853Direct - Dividend Plan19-Sep-14 61.1289 1082.6239 1004.1802Monthly Dividend Plan20-Apr-20 13.3881 1019.4241 1006.036020-Feb-20 5.5133 1018.2953 1010.641420-Jan-20 3.9441 1015.1201 1009.6446Retail - Monthly Dividend Plan20-Apr-20 11.8198 1020.1072 1008.287420-Feb-20 5.4764 1019.0471 1011.444420-Jan-20 3.8500 1015.8072 1010.4624Direct - Monthly Dividend Plan20-Apr-20 13.9892 1024.7825 1010.793320-Feb-20 5.9214 1023.0440 1014.823520-Jan-20 4.2722 1019.6140 1013.6830
Record Date Rate (`/ Unit) Cum Dividend NAV Ex-Dividend NAVQuarterly Dividend Plan19-Mar-20 5.1690 1012.8675 1005.6915
19-Dec-19 15.0700 1026.7296 1005.8084
19-Sep-19 18.6673 1031.3866 1005.4714
Retail - Quarterly Dividend Plan19-Mar-20 15.4066 1027.2183 1005.8299
19-Dec-19 14.9486 1041.0933 1020.3407
19-Sep-19 18.0419 1045.8035 1020.7566
Direct - Quarterly Dividend Plan19-Mar-20 6.5211 1014.7172 1005.6642
19-Dec-19 16.1944 1028.4271 1005.9450
19-Sep-19 19.2616 1033.0921 1006.3518
Bonus Option Bonus Ratio26-Feb-14 17:2
29-Oct-12 3:1
Dividend History
Nippon India Low Duration Fund
Special Feature: Nippon India Any Time Money Card
Past performance may or may not be sustained in future. Pursuant to dividend payment, NAV falls to the extent of payout & statutory levy (if applicable). Face Value-`1000.
For scheme performance refer page 63-70. For Fund manager wise scheme performance refer page 71-74.
Please refer page no. 82 for explanation on symbol: ^ and @ wherever available
Company/Issuer Rating % of AssetsCertificate of Deposit 3.51
Bank of Baroda FITCH A1+ 1.96Axis Bank Limited ICRA A1+/
CRISIL A1+1.36
IndusInd Bank Limited CRISIL A1+ 0.19Commercial Paper 17.18
Piramal Enterprises Limited CRISIL A1+ 9.75Reliance Industries Limited CRISIL A1+/
CARE A1+6.96
Reliance Jio Infocomm Limited CRISIL A1+ 0.39Cholamandalam Investment and Finance Company Limited
CRISIL A1+ 0.08
Corporate Bond 48.53IndInfravit Trust CRISIL AAA 8.23Panchshil Corporate Park Private Limited FITCH AAA(SO) 7.87REC Limited CRISIL AAA 6.42Power Finance Corporation Limited CRISIL AAA 5.05India Grid Trust InvIT Fund CRISIL AAA 4.16L & T Housing Finance CRISIL AAA 4.12Vedanta Limited CRISIL AA 3.38Clix Capital Services Pvt Ltd CARE AA- 3.07ORIX Leasing & Financial Services India Limited FITCH AAA 2.04Muthoot Fincorp Ltd CRISIL AA+(CE) 2.02U.P. Power Corporation Limited FITCH AA(CE) 1.20Nabha Power Limited (Guaranttee by L&T) ICRA AAA(CE) 0.98
Company/Issuer Rating % of AssetsFloating Rate Note 4.05Shriram City Union Finance Limited CARE AA+ 4.05
Government Bond 0.03Government of India SOV 0.03Cash Management Bills 1.01Government of India SOV 1.01Zero Coupon Bond 12.58EMBASSY OFFICE PARK REIT (Blackstone group(Exposure to the NCDs issued by REIT))
CRISIL AAA 11.00
KKR India Financial Services Private Limited CRISIL AA 1.58PTC 10.39MFL Securitisation Trust (Backed by receivables of Magma Fincorp Ltd.)
CRISIL AAA(SO) 2.99
Innovation Trust XXX (Backed by Loan against property & Home Loan receivables)
CRISIL AA(SO) 2.85
INDIAN RECEIVABLE TRUST 19 – FEB 2019 (Retails assets pool of Reliance Home / Commercial Finance)
CARE A(SO) 1.25
INDIAN RECEIVABLE TRUST 18 – FEB 2019 (Retails assets pool of Reliance Home / Commercial Finance)
CARE A(SO) 1.02
Cash & Other Receivables 2.72Grand Total 100.00
Product Label
This product is suitable for investors who are seeking*:
Investors understand that their principalwill be at Moderately Low risk
� Income over short term
� Investment in debt and money market instruments such that the Macaulay duration of the portfolio is between 6 - 12 months
*Investors should consult their financial advisors if in doubt about whether the product is suitable for them.
Rating Profile
AAA/SOV/A1+/Cash & Other Receivables, 79.58%
A+/A/A-/A1, 2.27%AA-, 3.07%
AA, 9.02%
AA+, 6.07%
Asset Allocation
Corporate Bond, 48.53%Cash & Other Receivables,
2.72%Government Bond, 0.03%
Treasury Bill, 1.01%Certificate of Deposit, 3.51%
Floating Rate Note, 4.05%PTC, 10.39%
Zero Coupon Bond, 12.58%
Commercial Paper, 17.18%

June 2020Fundamentals 29
Corporate Bond Fund
Details as on May 31, 2020
Type of Scheme
An open ended debt scheme predominantly investing in AA+ and above rated corporate bonds
Current Investment Philosophy
The fund seeks to benefit from opportunities available in the corporate bond market space at different points in time. Therefore, this fund invests based on short to medium term interest rate view and shape of the yield curve. It endeavors to maintain portfolio duration between 1 - 1.5 years and invests predominantly in AAA/AA+ rated instruments. The fund is suitable for investors with 6 - 12 months investment horizon.
Date of Allotment
September 14, 2000
Fund Manager
Vivek Sharma
Benchmark
50% NIFTY Short Duration Debt Index + 50% NIFTY Low Duration Debt Index
Fund Size
Monthly Average: ` 513.99 Cr
Month End: ` 462.62 Cr
NAV as on May 29, 2020
Growth Plan ` 42.5531Dividend Plan ` 13.6329Daily Dividend Plan ` 17.0777Weekly Dividend Plan ` 17.0899Monthly Dividend Plan ` 11.3799Quarterly Dividend Plan ` 11.8121Bonus Option ` 30.3912Direct - Growth Plan ` 43.8200Direct - Dividend Plan ` 13.8854Direct - Daily Dividend Plan ` 17.0779Direct - Weekly Dividend Plan ` 17.0904Direct - Monthly Dividend Plan ` 11.4913Direct - Quarterly Dividend Plan ` 11.9298Direct - Bonus Option ` 31.2858
Average Maturity 2.40 Years
Modified Duration 1.71 Years
Yield to Maturity* 9.39%
Total Expense Ratio^
Regular/Other than Direct: 0.74%
Direct: 0.34%
Load structure
Entry Load: Nil
Exit Load: Nil
*excluding other receivablesYTM including other receivables: 9.95%
Portfolio as on May 31, 2020
Record Date Rate (`/ Unit) Cum Dividend NAV Ex-Dividend NAV
Dividend Plan
29-Dec-15 0.1464 10.3121 10.1094
29-Dec-14 0.1645 10.2902 10.0636
22-Sep-14 0.4097 10.5668 10.0410
Direct - Dividend Plan
29-Dec-15 0.1530 10.3268 10.1149
29-Dec-14 0.1720 10.3036 10.0667
22-Sep-14 0.5244 10.7161 10.0432
Monthly Dividend Plan
20-May-20 0.0185 11.3933 11.3748
20-Apr-20 0.2071 11.5536 11.3465
20-Feb-20 0.1052 11.5961 11.4500
Dividend History
Record Date Rate (`/ Unit) Cum Dividend NAV Ex-Dividend NAV
Direct - Monthly Dividend Plan
20-May-20 0.0218 11.5070 11.4852
20-Apr-20 0.2122 11.6681 11.4559
20-Feb-20 0.1087 11.7072 11.5563
Quarterly Dividend Plan
20-Mar-20 0.2028 11.7744 11.4929
20-Dec-19 0.1046 11.8323 11.6871
20-Sep-19 0.2063 11.9328 11.6464
Direct - Quarterly Dividend Plan
20-Mar-20 0.2116 11.8926 11.5988
20-Dec-19 0.1127 11.9492 11.7927
20-Sep-19 0.2154 12.0487 11.7497
Nippon India Prime Debt Fund
Special Feature: Nippon India Any Time Money Card
Past performance may or may not be sustained in future. Pursuant to dividend payment, NAV falls to the extent of payout & statutory levy (if applicable). Face Value-`10.
For scheme performance refer page 63-70. For Fund manager wise scheme performance refer page 71-74.
Please refer page no. 82 for explanation on symbol: ^ and @ wherever available
Company/Issuer Rating % of Assets
Commercial Paper 16.15
Piramal Enterprises Limited CRISIL A1+ 16.15
Corporate Bond 41.38
IndInfravit Trust CRISIL AAA 10.91
Panchshil Corporate Park Private Limited FITCH AAA(SO) 8.22
U.P. Power Corporation Limited CRISIL A+(CE) 6.81
REC Limited CRISIL AAA 5.60
India Infradebt Limited CRISIL AAA 5.40
Swarna Tollway Private Limited (Maquire Group)
CRISIL AAA 3.20
Ahmedabad Maliya Tollway Limited (L&T IDPL Group)
ICRA AA(CE) 0.85
Shriram Transport Finance Company Limited CRISIL AA+ 0.22
Adani Transmission Limited FITCH AA+ 0.17
Company/Issuer Rating % of Assets
Floating Rate Note 10.74
Shriram City Union Finance Limited CARE AA+ 10.74
State Government Bond 0.43
State Government Securities SOV 0.43
Zero Coupon Bond 7.08
EMBASSY OFFICE PARK REIT (Blackstone group(Exposure to the NCDs issued by REIT))
CRISIL AAA 7.08
PTC 20.78
Innovation Trust XXX (Backed by Loan against property & Home Loan receivables)
CRISIL AA(SO) 12.05
INDIAN RECEIVABLE TRUST 18 – FEB 2019 (Retails assets pool of Reliance Home / Commercial Finance)
CARE A(SO) 8.72
Cash & Other Receivables 3.44
Grand Total 100.00
Product Label
This product is suitable for investors who are seeking*:
Investors understand that their principalwill be at Moderate risk
� Income over medium term
� Investment predominantly in AA+ and above rated corporate bonds
*Investors should consult their financial advisors if in doubt about whether the product is suitable for them.
Rating Profile
AAA/SOV/A1+/Cash & Other Receivables,
60.43%A+/A/A-/A1, 15.53%
AA, 12.9%
AA+, 11.14%
Asset Allocation
Corporate Bond, 41.38%Cash & Other Receivables,
3.44%State Government Bond,
0.43%Zero Coupon Bond, 7.08%
Floating Rate Note, 10.74%
Commercial Paper, 16.15%
PTC, 20.78%

June 202030 Fundamentals
Dividend History
Banking & PSU Fund
Details as on May 31, 2020
Type of Scheme
An open ended debt scheme predominantly investing in Debt instruments of banks, Public Sector Undertakings, Public Financial Institutions and Municipal Bonds
Current Investment Philosophy
Portfolio Duration will be maintained between 1.5 - 3.5 years. The fund will tactically use up to 10 years G-Secs/ SDLs/ AAA Bonds to generate alpha. Strategy is to capture opportunity on the desired part of yield curve depending on the interest rate expectations going forward.
Date of Allotment
May 15, 2015
Fund Manager
Prashant Pimple Hardik Shah
Benchmark
NIFTY Banking & PSU Debt Index
Fund Size
Monthly Average: ` 4,605.45 Cr
Month End: ` 4,972.81 Cr
NAV as on May 29, 2020Growth Plan ` 15.2828
Dividend Plan ` 15.2828Weekly Dividend Plan ` 10.4518Monthly Dividend Plan ` 10.4987Quarterly Dividend Plan ` 10.9554Direct - Growth Plan ` 15.5100Direct - Dividend Plan ` 15.5129Direct - Weekly Dividend Plan ` 10.4513Direct - Monthly Dividend Plan ` 10.5443Direct - Quarterly Dividend Plan ` 11.0008Direct - Bonus Option ` 15.5101
Average Maturity 2.98 Years
Modified Duration 2.45 Years
Yield to Maturity* 5.65%
Total Expense Ratio^
Regular/Other than Direct: 0.79%
Direct: 0.30%
Load structure
Entry Load: Nil
Exit Load: Nil
*excluding other receivablesYTM including other receivables: 5.64%
Portfolio as on May 31, 2020
Special Feature: Nippon India Any Time Money Card
Nippon India Banking & PSU Debt Fund
Past performance may or may not be sustained in future. Pursuant to dividend payment, NAV falls to the extent of payout & statutory levy (if applicable). Face Value-`10.
For scheme performance refer page 63-70. For Fund manager wise scheme performance refer page 71-74.
Record Date Rate (`/ Unit) Cum Dividend NAV Ex-Dividend NAV
Monthly Dividend Plan
19-May-20 0.1196 10.5763 10.4567
20-Apr-20 0.2533 10.6725 10.4192
20-Feb-20 0.1154 10.6920 10.5318
Direct - Monthly Dividend Plan
19-May-20 0.1234 10.6242 10.5008
20-Apr-20 0.2582 10.7206 10.4624
20-Feb-20 0.1186 10.7359 10.5712
Record Date Rate (`/ Unit) Cum Dividend NAV Ex-Dividend NAV
Quarterly Dividend Plan
19-Mar-20 0.1896 10.6317 10.3685
19-Dec-19 0.1575 10.8630 10.6443
19-Sep-19 0.2278 10.9408 10.6245
Direct - Quarterly Dividend Plan
19-Mar-20 0.1982 10.6769 10.4017
19-Dec-19 0.1650 10.9056 10.6765
19-Sep-19 0.2353 10.9817 10.6550
Please refer page no. 82 for explanation on symbol: ^ and @ wherever available
Company/Issuer Rating % of Assets
Certificate of Deposit 3.02
Small Industries Dev Bank of India CARE A1+ 2.01
Bank of Baroda FITCH A1+ 1.01
Commercial Paper 4.62
Bharat Petroleum Corporation Limited CRISIL A1+ 2.51
National Housing Bank CRISIL A1+ 1.51
Indian Oil Corporation Limited ICRA A1+ 0.60
Corporate Bond 79.15
Housing Development Finance Corporation Limited
CRISIL AAA 7.44
National Bank For Agriculture and Rural Development
CRISIL AAA 7.41
REC Limited CRISIL AAA 7.38
Indian Railway Finance Corporation Limited CRISIL AAA 7.35
Power Finance Corporation Limited CRISIL AAA 7.01
NTPC Limited CRISIL AAA 6.11
ICICI Bank Limited ICRA AAA 5.90
Company/Issuer Rating % of Assets
Small Industries Dev Bank of India CARE AAA/ICRA AAA 5.47
Axis Bank Limited CRISIL AAA 5.45
State Bank of India CRISIL AAA 5.36
Power Grid Corporation of India Limited CRISIL AAA 4.77
National Housing Bank CRISIL AAA 3.09
National Highways Auth Of Ind CRISIL AAA 2.41
HDB Financial Services Limited CRISIL AAA 1.31
Export Import Bank of India CRISIL AAA 0.82
Kotak Mahindra Bank Limited CRISIL AAA 0.77
Indian Oil Corporation Limited CRISIL AAA 0.52
Bharat Petroleum Corporation Limited CRISIL AAA 0.43
Reliance Industries Limited CRISIL AAA 0.10
NHPC Limited CARE AAA 0.05
Government Bond 10.43
Government of India SOV 10.43
Cash & Other Receivables 2.78
Grand Total 100.00
Product Label
This product is suitable for investors who are seeking*:
Investors understand that their principalwill be at Moderately Low risk
� Income over short to medium term
� Investments in debt and money market instruments of various maturities, consisting predominantly of securities issued by Banks, Public Sector undertakings, Public Financial Institutions & Municipal Bonds
*Investors should consult their financial advisors if in doubt about whether the product is suitable for them.
Rating Profile
AAA/SOV/A1+/Cash & Other Receivables,100%
Asset Allocation
Corporate Bond, 79.15%
Cash & Other Receivables, 2.78%
Certificate of Deposit, 3.02%
Commercial Paper, 4.62%
Government Bond, 10.43%

June 2020Fundamentals 31
Floater Fund
Details as on May 31, 2020
Type of Scheme
An open ended debt scheme predominantly investing in floating rate instruments (including fixed rate instruments converted to floating rate exposures using swaps/ derivatives)
Current Investment Philosophy
The fund intends to maintain duration of 3 - 3.5 years. The fund will endeavour to invest in high quality AAA/A1+ rated papers. SEBI restriction of up to 65% investments in floating rate instruments will be taken care through a mix of OIS trades & floating rate instruments.
Date of Allotment
August 27, 2004
Fund Manager
Anju Chhajer
Benchmark
CRISIL Short Term Bond Fund Index
Fund Size
Monthly Average: ` 9,451.47 Cr
Month End: ` 9,731.95 Cr
NAV as on May 29, 2020Growth Plan ` 32.5898Dividend Plan ` 14.7152Daily Dividend Plan ` 10.2342Weekly Dividend Plan ` 10.2394Monthly Dividend Plan ` 10.9414Quarterly Dividend Plan ` 11.0209Direct - Growth Plan ` 33.7424Direct - Dividend Plan ` 15.0862Direct - Daily Dividend Plan ` 10.2560Direct - Weekly Dividend Plan ` 10.2428Direct - Monthly Dividend Plan ` 11.1258Direct - Quarterly Dividend Plan ` 10.8892
Average Maturity 2.88 Years
Modified Duration 2.19 Years
Yield to Maturity* 6.29%
Total Expense Ratio^Regular/Other than Direct: 0.54%
Direct: 0.20%
Load structure
Entry Load: Nil
Exit Load: 0.50% if units redeemed or switched out on or before completion of 1 Month from the date of allotment of units. Nil, thereafter
*excluding other receivablesYTM including other receivables: 6.29%
Portfolio as on May 31, 2020
Dividend History
Nippon India Floating Rate Fund
Special Feature: Nippon India Any Time Money Card
Past performance may or may not be sustained in future. Pursuant to dividend payment, NAV falls to the extent of payout & statutory levy (if applicable). Face Value-`10.
For scheme performance refer page 63-70. For Fund manager wise scheme performance refer page 71-74.
Record Date Rate (`/ Unit) Cum Dividend NAV Ex-Dividend NAV
Dividend Plan
29-Dec-14 0.1553 10.3351 10.1212
19-Sep-14 0.6972 10.9355 10.0408
Direct - Dividend Plan
29-Dec-14 0.1628 10.3512 10.1269
19-Sep-14 0.7433 10.9971 10.0433
Monthly Dividend Plan
19-May-20 0.0848 10.9694 10.8846
20-Apr-20 0.2057 11.0588 10.8531
20-Feb-20 0.1186 11.0809 10.9162
Record Date Rate (`/ Unit) Cum Dividend NAV Ex-Dividend NAV
Direct - Monthly Dividend Plan
19-May-20 0.0888 11.1559 11.0671
20-Apr-20 0.2120 11.2466 11.0346
20-Feb-20 0.1233 11.2666 11.0954
Quarterly Dividend Plan
19-Mar-20 0.1938 10.7995 10.5304
19-Dec-19 0.1395 10.9553 10.7616
19-Sep-19 0.1640 10.9676 10.7399
Direct - Quarterly Dividend Plan
19-Mar-20 0.1987 10.6739 10.3981
19-Dec-19 0.1445 10.8258 10.6252
19-Sep-19 0.1691 10.8372 10.6024
Please refer page no. 82 for explanation on symbol: ^ and @ wherever available
Company/Issuer Rating % of Assets
Commercial Paper 0.51
Reliance Jio Infocomm Limited CARE A1+ 0.51
Corporate Bond 55.94
Housing Development Finance Corporation Limited
CRISIL AAA 6.73
Power Finance Corporation Limited CRISIL AAA 6.70
REC Limited CRISIL AAA 6.17
LIC Housing Finance Limited CRISIL AAA 3.95
India Grid Trust InvIT Fund CRISIL AAA 3.93
National Bank For Agriculture and Rural Development
ICRA AAA/CRISIL AAA
3.89
Indian Railway Finance Corporation Limited CRISIL AAA 3.77
Nabha Power Limited (Guaranttee by L&T) ICRA AAA(CE) 3.77
Jamnagar Utilities & Power Private Limited (Mukesh Ambani Group)
CRISIL AAA 2.68
Larsen & Toubro Limited CRISIL AAA 2.64
L & T Infrastructure Finance Company Limited CRISIL AAA 2.61
HDB Financial Services Limited CRISIL AAA 1.84
Reliance Industries Limited CRISIL AAA 1.63
ICICI Home Finance Company Limited CRISIL AAA 1.56
Sundaram Finance Limited CRISIL AAA 1.00
Tata Capital Housing Finance Limited CRISIL AAA 0.94
Tata Sons Private Ltd CRISIL AAA 0.73
Company/Issuer Rating % of Assets
Indian Oil Corporation Limited CRISIL AAA 0.53
Bajaj Finance Limited CRISIL AAA 0.31
Tata Capital Limited CRISIL AAA 0.26
L&T Finance Limited CARE AAA 0.12
Export Import Bank of India CRISIL AAA 0.11
Mahindra & Mahindra Financial Services Limited FITCH AAA 0.07
Floating Rate Note 8.61
Reliance Industries Limited CRISIL AAA 3.63
HDB Financial Services Limited CRISIL AAA 2.90
Tata Capital Financial Services Limited ICRA AAA 2.08
Government Bond 17.73
Government of India SOV 17.73
PTC 1.80
First Business Receivables Trust (Mukesh Ambani Group)
CRISIL AAA(SO) 1.80
State Government Bond 10.88
State Government Securities SOV 10.88
Zero Coupon Bond 1.86
Axis Finance Limited FITCH AAA 1.86
Cash & Other Receivables 2.69
Grand Total 100.00
Product Label
This product is suitable for investors who are seeking*:
Investors understand that their principalwill be at Moderately Low risk
� Income over short term
� Investment predominantly in floating rate instruments (Including fixed rate instruments converted to floating rate exposures using swaps/ derivatives)
*Investors should consult their financial advisors if in doubt about whether the product is suitable for them.
Rating Profile
AAA/SOV/A1+/Cash & Other Receivables, 100%
Asset Allocation
Corporate Bond, 55.94%Cash & Other Receivables,
2.69%Treasury Bill, 0.19%
Commercial Paper, 0.51%PTC, 1.8%
Zero Coupon Bond, 1.86%
Floating Rate Note, 8.61%
State Government Bond, 10.88%
Government Bond, 17.53%

June 202032 Fundamentals
Short Duration Fund
Details as on May 31, 2020
Type of Scheme
An open ended short term debt scheme investing in instruments such that the Macaulay duration of the portfolio is between 1 to 3 years. (Please refer to the page number 14 of the Scheme Information Document on which the concept of Macaulay’s Duration has been explained)
Current Investment Philosophy
Portfolio Duration will be maintained between 1.25 - 2.25 years. Fund will have allocation to G-Secs/ SDLs/ High grade bonds primarily in the 1 - 5 years duration bucket. The fund will tactically use G-Secs/SDLs with an aim to generate alpha. Strategy is to enhance returns through asset allocation and shape of the curve.
Date of Allotment
December 18, 2002
Fund Manager
Prashant Pimple Vivek Sharma
Benchmark
Crisil Short Term Bond Fund Index
Fund Size
Monthly Average: ` 6,161.34 Cr
Month End: ` 6,105.98 Cr
NAV as on May 29, 2020Growth Plan ` 38.4533Dividend Plan ` 15.6400Monthly Dividend Plan ` 11.2824Quarterly Dividend Plan ` 14.8327Direct - Growth Plan ` 40.3005Direct - Dividend Plan ` 16.3784Direct - Monthly Dividend Plan ` 11.4784Direct - Quarterly Dividend Plan ` 15.1011
Average Maturity 2.87 Years
Modified Duration 2.14 Years
Yield to Maturity* 6.56%
Total Expense Ratio^
Regular/Other than Direct: 1.11%
Direct: 0.31%
Load structure
Entry Load: Nil
Exit Load: Nil
*excluding other receivablesYTM including other receivables: 6.62%
Portfolio as on May 31, 2020
Dividend History
Nippon India Short Term Fund
Special Feature: Nippon India Any Time Money Card
Past performance may or may not be sustained in future. Pursuant to dividend payment, NAV falls to the extent of payout & statutory levy (if applicable). Face Value-`10.
For scheme performance refer page 63-70. For Fund manager wise scheme performance refer page 71-74.
Record Date Rate (`/ Unit) Cum Dividend NAV Ex-Dividend NAVDividend Plan19-Sep-14 0.5747 10.7899 10.0524Direct - Dividend Plan19-Sep-14 0.6228 10.9448 10.1456Monthly Dividend Plan26-May-20 0.1601 11.4567 11.296627-Apr-20 0.1013 11.3828 11.281525-Feb-20 0.0791 11.4383 11.3285Direct - Monthly Dividend Plan26-May-20 0.1689 11.6612 11.4923
Record Date Rate (`/ Unit) Cum Dividend NAV Ex-Dividend NAV27-Apr-20 0.1097 11.5853 11.475625-Feb-20 0.0846 11.6318 11.5144Quarterly Dividend Plan19-Mar-20 0.2280 14.6834 14.366919-Dec-19 0.2208 14.9023 14.595819-Sep-19 0.2550 14.9161 14.5621Direct - Quarterly Dividend Plan19-Mar-20 0.2502 14.9518 14.604519-Dec-19 0.2434 15.1709 14.833019-Sep-19 0.2777 15.1806 14.7951
Please refer page no. 82 for explanation on symbol: ^ and @ wherever available
Company/Issuer Rating % of AssetsCertificate of Deposit 4.16Bank of Baroda FITCH A1+ 2.45ICICI Bank Limited ICRA A1+ 0.81Axis Bank Limited ICRA A1+ 0.81
National Bank For Agriculture and Rural Development
CRISIL A1+ 0.10
Commercial Paper 0.89Larsen & Toubro Limited ICRA A1+ 0.81Reliance Industries Limited CARE A1+ 0.08Corporate Bond 63.13Power Finance Corporation Limited CRISIL AAA 8.20India Infradebt Limited CRISIL AAA 7.73REC Limited CARE AAA/
CRISIL AAA7.70
India Grid Trust InvIT Fund CRISIL AAA 6.86Reliance Industries Limited CRISIL AAA(CE)/
CRISIL AAA5.81
Housing Development Finance Corporation Limited
CRISIL AAA 4.72
Manappuram Finance Limited CARE AA 2.74Sikka Ports and Terminals Limited (Mukesh Ambani Group)
CRISIL AAA 2.71
National Bank For Agriculture and Rural Development
CRISIL AAA/ICRA AAA
2.62
Shriram Transport Finance Company Limited CRISIL AA+ 1.83L & T Infrastructure Finance Company Limited CRISIL AAA 1.66Muthoot Fincorp Ltd CRISIL AA+(CE) 1.62Indian Railway Finance Corporation Limited CRISIL AAA 1.35Swarna Tollway Private Limited (Maquire Group) CRISIL AAA 1.30LIC Housing Finance Limited CRISIL AAA 1.25
Company/Issuer Rating % of AssetsNational Housing Bank CRISIL AAA 0.84NTPC Limited CRISIL AAA 0.84Tata Capital Limited CRISIL AAA 0.83Nabha Power Limited (Guaranttee by L&T) ICRA AAA(CE) 0.69ICICI Bank Limited ICRA AAA 0.41Volkswagen Finance Pvt Limited FITCH AAA 0.41Small Industries Dev Bank of India CARE AAA 0.26Power Grid Corporation of India Limited CRISIL AAA 0.24Export Import Bank of India CRISIL AAA 0.14L&T Finance Limited ICRA AAA 0.12Muthoot Finance Limited CRISIL AA 0.06IOT Utkal Energy Services Limited CRISIL AAA 0.06NHPC Limited CARE AAA 0.05Larsen & Toubro Limited CRISIL AAA 0.05Food Corporation Of India (GOI ownership) CRISIL AAA(CE) 0.00National Highways Auth Of Ind CRISIL AAA 0.00Floating Rate Note 2.57Aditya Birla Finance Limited ICRA AAA 2.57Government Bond 21.02Government of India SOV 21.02PTC 2.70First Business Receivables Trust (Mukesh Ambani Group)
CRISIL AAA(SO) 2.70
State Government Bond 0.99State Government Securities SOV 0.99Zero Coupon Bond 1.48LIC Housing Finance Limited CRISIL AAA 1.34Axis Finance Limited FITCH AAA 0.14Cash & Other Receivables 3.05Grand Total 100.00
Product Label
This product is suitable for investors who are seeking*:
Investors understand that their principalwill be at Moderately Low risk
� Income over short term
� Investment in debt & money market instruments with portfolio Macaulay Duration between 1 - 3 years
*Investors should consult their financial advisors if in doubt about whether the product is suitable for them.
Rating Profile
AA, 2.81%
AA+, 3.45%
AAA/SOV/A1+/Cash & Other Receivables,
93.74%
Asset Allocation
Cash & Other Receivables, 3.05%Commercial Paper, 0.89%
State Government Bond, 0.99%Zero Coupon Bond, 1.48%Floating Rate Note, 2.57%
PTC, 2.7%
Certificate of Deposit, 4.16%
Government Bond, 21.02%
Corporate Bond, 63.13%
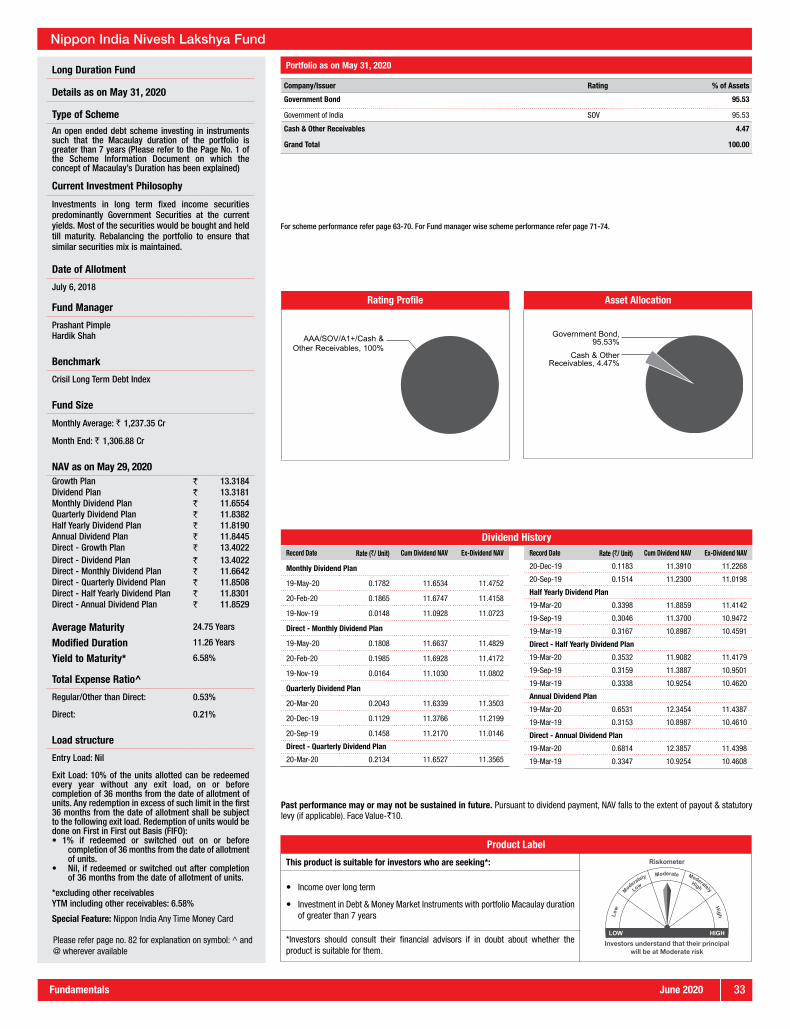
June 2020Fundamentals 33
Dividend HistoryRecord Date Rate (`/ Unit) Cum Dividend NAV Ex-Dividend NAV
Monthly Dividend Plan
19-May-20 0.1782 11.6534 11.4752
20-Feb-20 0.1865 11.6747 11.4158
19-Nov-19 0.0148 11.0928 11.0723
Direct - Monthly Dividend Plan
19-May-20 0.1808 11.6637 11.4829
20-Feb-20 0.1985 11.6928 11.4172
19-Nov-19 0.0164 11.1030 11.0802
Quarterly Dividend Plan
20-Mar-20 0.2043 11.6339 11.3503
20-Dec-19 0.1129 11.3766 11.2199
20-Sep-19 0.1458 11.2170 11.0146
Direct - Quarterly Dividend Plan
20-Mar-20 0.2134 11.6527 11.3565
Record Date Rate (`/ Unit) Cum Dividend NAV Ex-Dividend NAV
20-Dec-19 0.1183 11.3910 11.2268
20-Sep-19 0.1514 11.2300 11.0198
Half Yearly Dividend Plan
19-Mar-20 0.3398 11.8859 11.4142
19-Sep-19 0.3046 11.3700 10.9472
19-Mar-19 0.3167 10.8987 10.4591
Direct - Half Yearly Dividend Plan
19-Mar-20 0.3532 11.9082 11.4179
19-Sep-19 0.3159 11.3887 10.9501
19-Mar-19 0.3338 10.9254 10.4620
Annual Dividend Plan
19-Mar-20 0.6531 12.3454 11.4387
19-Mar-19 0.3153 10.8987 10.4610
Direct - Annual Dividend Plan
19-Mar-20 0.6814 12.3857 11.4398
19-Mar-19 0.3347 10.9254 10.4608
Long Duration Fund
Details as on May 31, 2020
Type of Scheme
An open ended debt scheme investing in instruments such that the Macaulay duration of the portfolio is greater than 7 years (Please refer to the Page No. 1 of the Scheme Information Document on which the concept of Macaulay’s Duration has been explained)
Current Investment Philosophy
Investments in long term fixed income securities predominantly Government Securities at the current yields. Most of the securities would be bought and held till maturity. Rebalancing the portfolio to ensure that similar securities mix is maintained.
Date of Allotment
July 6, 2018
Fund Manager
Prashant Pimple Hardik Shah
Benchmark
Crisil Long Term Debt Index
Fund Size
Monthly Average: ` 1,237.35 Cr
Month End: ` 1,306.88 Cr
NAV as on May 29, 2020Growth Plan ` 13.3184Dividend Plan ` 13.3181Monthly Dividend Plan ` 11.6554Quarterly Dividend Plan ` 11.8382Half Yearly Dividend Plan ` 11.8190Annual Dividend Plan ` 11.8445Direct - Growth Plan ` 13.4022Direct - Dividend Plan ` 13.4022Direct - Monthly Dividend Plan ` 11.6642Direct - Quarterly Dividend Plan ` 11.8508Direct - Half Yearly Dividend Plan ` 11.8301Direct - Annual Dividend Plan ` 11.8529
Average Maturity 24.75 Years
Modified Duration 11.26 Years
Yield to Maturity* 6.58%
Total Expense Ratio^
Regular/Other than Direct: 0.53%
Direct: 0.21%
Load structure
Entry Load: Nil
Exit Load: 10% of the units allotted can be redeemed every year without any exit load, on or before completion of 36 months from the date of allotment of units. Any redemption in excess of such limit in the first 36 months from the date of allotment shall be subject to the following exit load. Redemption of units would be done on First in First out Basis (FIFO):• 1% if redeemed or switched out on or before
completion of 36 months from the date of allotment of units.
• Nil, if redeemed or switched out after completion of 36 months from the date of allotment of units.
*excluding other receivablesYTM including other receivables: 6.58%
Special Feature: Nippon India Any Time Money Card
Portfolio as on May 31, 2020
Nippon India Nivesh Lakshya Fund
For scheme performance refer page 63-70. For Fund manager wise scheme performance refer page 71-74.
Please refer page no. 82 for explanation on symbol: ^ and @ wherever available
Rating Profile
AAA/SOV/A1+/Cash & Other Receivables, 100%
Company/Issuer Rating % of Assets
Government Bond 95.53
Government of India SOV 95.53
Cash & Other Receivables 4.47
Grand Total 100.00
Past performance may or may not be sustained in future. Pursuant to dividend payment, NAV falls to the extent of payout & statutory levy (if applicable). Face Value-`10.
Product Label
This product is suitable for investors who are seeking*:
Investors understand that their principalwill be at Moderate risk
� Income over long term
� Investment in Debt & Money Market Instruments with portfolio Macaulay duration of greater than 7 years
*Investors should consult their financial advisors if in doubt about whether the product is suitable for them.
Asset Allocation
Government Bond, 95.53%
Cash & Other Receivables, 4.47%

June 202034 Fundamentals
# Main Portfolio as on May 31, 2020
Dividend History
Nippon India Credit Risk Fund (Number of Segregated Portfolios- 2)
Past performance may or may not be sustained in future. Pursuant to dividend payment, NAV falls to the extent of payout & statutory levy (if applicable). Face Value-`10.
Record Date Rate (`/ Unit) Cum Dividend NAV Ex-Dividend NAVQuarterly Dividend Plan
23-Dec-19 0.1585 12.4801 12.2601
23-Sep-19 0.1585 12.6066 12.3866
21-Jun-19 0.1585 12.7962 12.5762
Record Date Rate (`/ Unit) Cum Dividend NAV Ex-Dividend NAVDirect - Quarterly Dividend Plan23-Dec-19 0.1714 12.8546 12.6166
23-Sep-19 0.1714 12.9756 12.7376
21-Jun-19 0.1714 13.1639 12.9259
Company/Issuer Rating % of AssetsCommercial Paper 1.88Piramal Enterprises Limited CRISIL A1+ 1.88Corporate Bond 54.50Renew Wind Energy (Raj One) Private Limited CARE A+(CE) 9.99Mariposa Agri Ventures And Hospitalities Private Limited (Muthoot Pappachan Group (Blue Muthoot))
UNRATED 9.11
Sanghi Industries Limited ICRA A 8.87Narmada Wind Energy Private Limited (Renew power Group.)
CARE A+(CE) 6.65
Indiabulls Housing Finance Limited CARE AA 6.21Piramal Enterprises Limited ICRA AA 3.55Aqua Space Developers Pvt Ltd (My Home group)
FITCH A 3.13
Clix Capital Services Pvt Ltd CARE AA- 1.35SEI Enerstar Renewable Energy Private Limited (Greenko Group)
CARE AA-(CE) 1.31
Clix Finance India Private Limited CARE AA- 1.08U.P. Power Corporation Limited CRISIL A+(CE)/
FITCH AA(CE)0.67
Vedanta Limited CRISIL AA 0.66Ahmedabad Maliya Tollway Limited (L&T IDPL Group)
ICRA AA(CE) 0.64
JM Financial Credit Solution Limited ICRA AA 0.50SEI Mihir Energy Private Limited (Greenko Group)
CARE AA-(CE) 0.41
Aarish Solar Power Private Limited (Greenko Group)
CARE AA-(CE) 0.37
Promont Hillside Private Limited (Tata Group) CARE AA(CE) 0.01Dewan Housing Finance Corporation Limited CARE D 0.00Government Bond 1.40Government of India SOV 1.40Zero Coupon Bond 17.08Vineha Enterprises Private Limited (AEGIS GROUP)
UNRATED 16.26
Company/Issuer Rating % of AssetsKKR India Financial Services Private Limited CRISIL AA 0.46Morgan Credits Private Limited CARE BB 0.36PTC 17.65Innovation Trust XXX (Backed by Loan against property & Home Loan receivables)
CRISIL AA(SO) 7.87
INDIAN RECEIVABLE TRUST 19 – FEB 2019 (Retails assets pool of Reliance Home / Commercial Finance)
CARE A(SO) 7.84
INDIAN RECEIVABLE TRUST 2019 SERIES 4 (Retails assets pool of Reliance Home / Commercial Finance)
CARE A(SO) 1.01
INDIAN RECEIVABLE TRUST 2019 SERIES 3 (Retails assets pool of Reliance Home / Commercial Finance)
CARE A(SO) 0.93
Cash & Other Receivables 7.49Grand Total 100.00
Product Label
This product is suitable for investors who are seeking*:
Investors understand that their principalwill be at Moderate risk
� Income over medium term
� Investment predominantly in AA and below rated corporate bonds
*Investors should consult their financial advisors if in doubt about whether the product is suitable for them.
For SIP performance refer page 61. For scheme performance refer page 63-70. For Fund manager wise scheme performance refer page 71-74.
Segregated Portfolio 1 as on May 31, 2020Company/Issuer Rating % of Assets Corporate Bond 96.85Vodafone Idea Limited CARE BB- 96.85
Cash & Other Receivables 3.15Grand Total 100.00
Credit Risk Fund
Details as on May 31, 2020
Type of SchemeAn open ended debt scheme predominantly investing in AA and below rated corporate bonds (excluding AA+ rated corporate bonds)
Current Investment Philosophy
The Fund focuses on maximizing accrual with increased allocation to AA- and below segment, while maintaining duration of 1.5 - 2.5 years. Core mandate is to generate returns through accrual, hence low duration profile. Emphasis is on credit risk diversification.
Date of AllotmentJune 08, 2005
Fund Manager
Sushil Budhia
Benchmark
NIFTY Credit Risk Bond Index
Fund Size Main Portfolio Segregated Portfolio 1/2
Monthly Average: ` 1,970.79 Cr ` 27.77 Cr./0.00 Cr.
Month End: ` 1,855.91 Cr ` 27.88 Cr./0.00 Cr.
NAV as on May 29, 2020
Main Portfolio Segregated Portfolio 1/2
Growth Plan ` 22.6967 ` 0.1497/0.0000Dividend Plan ` 12.4508 ` 0.0821/0.0000Quarterly Dividend Plan ` 10.8369 ` 0.0715/0.0000Direct - Growth Plan ` 24.1174 ` 0.1588/0.0000Direct - Dividend Plan ` 13.0576 ` 0.0860/0.0000Direct - Quarterly Dividend Plan
` 11.1830 ` 0.0736/0.0000
Institutional - Growth Plan ` 23.5399 ` 0.1515/0.0000
Average Maturity 2.07 Years
Modified Duration 1.53 Years
Yield to Maturity* 13.00%
Total Expense Ratio^Main Segregated 1/2
Regular/Other than Direct: 1.56% –Direct: 0.94% –
Load structureEntry Load: Nil
Exit Load: 10% of the units allotted shall be redeemed without any exit load, on or before completion of 12 months from the date of allotment of units. Any redemption in excess of such limit in the first 12 months from the date of allotment shall be subject to the following exit load. Redemption of units would be done on First in First out Basis (FIFO):
• 1% if redeemed or switched out on or before completion of 12 months from the date of allotment of units.
• Nil, thereafter.Not applicable for Segregated Portfolio
*excluding other receivables
YTM including other receivables: 12.23%
Segregated Portfolio 1 YTM including other receivables: 2.81%
Segregated Portfolio 1
Vodafone Idea Limited has been segregated from the scheme’s portfolio due to some adverse developments and rating downgrade by CARE to BB- on Feb 17, 2020.
Segregated Portfolio 2
Yes Bank Limited has been segregated from the scheme’s portfolio due to rating downgrade by ICRA to “D” on March 6, 2020.
Kindly refer to SID/KIM for complete details on segregation of portfolio.
Special Feature: Nippon India Any Time Money Card
Please refer page no. 82 for explanation on symbol: ^ and @ wherever available
Segregated Portfolio 2 as on May 31, 2020Company/Issuer Rating % of Assets Corporate Bond 0.00Yes Bank Limited CARE D 0.00
Cash & Other Receivables 100.00Grand Total 100.00
#Security defaulted beyond its maturity date as on 31st May 2020 (forming part of net current assets) are as follows : Avantha Realty Ltd ZCB Matured on 29/03/2019 - 0.63% 14% Reliance Home Fin Matured on 31/10/2019 - 1.88% 8.9% Reliance Home Finance Ltd Ser I Matured on 03/01/2020 - 2.81%
Rating Profile (Main Portfolio)
AA, 20.14%AAA/SOV/A1+/Cash &
Other Receivables, 10.77%
Unrated, 25.38%
D, 0%
BB, 0.36%
A+/A/A-/A1, 38.83%
AA-, 4.52%
Asset Allocation (Main Portfolio)
Corporate Bond, 54.5%
Cash & Other Receivables, 7.49%
Government Bond, 1.4%
Commercial Paper, 1.88%
Zero Coupon Bond, 17.08%
PTC, 17.65%

June 2020Fundamentals 35
Asset Allocation (Main Portfolio)
PTC, 51.93%
Cash & Other Receivables, 16.47%
Zero Coupon Bond, 0.05%
Corporate Bond, 31.55%
Rating Profile (Main Portfolio)
AA, 3.31%
AAA/SOV/A1+/Cash & Other Receivables,
16.47%
D, 6.37%
A+/A/A-/A1, 51.93%
AA-, 21.92%
#Portfolio as on May 31, 2020
Dividend History
Nippon India Strategic Debt Fund (Number of Segregated Portfolios- 2)
Special Feature: Nippon India Any Time Money Card
Past performance may or may not be sustained in future. Pursuant to dividend payment, NAV falls to the extent of payout & statutory levy (if applicable). Face Value-`10.
For scheme performance refer page 63-70. For Fund manager wise scheme performance refer page 71-74.
Record Date Rate (`/ Unit) Cum Dividend NAV Ex-Dividend NAV
Dividend Plan
06-May-16 1.1128 11.7941 10.2534
19-Sep-14 0.1253 10.2171 10.0563
Direct - Dividend Plan
06-May-16 1.2247 11.9533 10.2577
19-Sep-14 0.1375 10.2358 10.0593
Record Date Rate (`/ Unit) Cum Dividend NAV Ex-Dividend NAVQuarterly Dividend Plan19-Mar-19 0.0832 10.9184 10.802919-Dec-18 0.0970 10.8641 10.729519-Sep-18 0.0921 10.8091 10.6812Direct - Quarterly Dividend Plan19-Mar-19 0.0994 11.0192 10.881219-Dec-18 0.1149 10.9626 10.8031
19-Sep-18 0.1118 10.9072 10.7520
Please refer page no. 82 for explanation on symbol: ^ and @ wherever available
Company/Issuer Rating % of Assets
Corporate Bond 31.55
Dewan Housing Finance Corporation Limited CARE D 6.37
Aashman Energy Private Limited (Greenko Group) CARE AA-(CE) 5.86
Divyesh Power Private Limited (Greenko Group) CARE AA-(CE) 5.86
SEI Baskara Power Private Limited (Greenko Group)
CARE AA-(CE) 5.86
Zuvan Energy Private Limited (Greenko Group) CARE AA-(CE) 3.74
Indiabulls Housing Finance Limited CARE AA 3.31
Shreyas Renewable Energy Private Limited (Greenko Group)
CARE AA-(CE) 0.55
Zero Coupon Bond 0.05
JM Financial Asset Reconstruction Company Limited
ICRA AA- 0.05
PTC 51.93
INDIAN RECEIVABLE TRUST 19 – FEB 2019 (Retails assets pool of Reliance Home / Commercial Finance)
CARE A(SO) 37.20
INDIAN RECEIVABLE TRUST 2019 SERIES 3 (Retails assets pool of Reliance Home / Commercial Finance)
CARE A(SO) 14.72
Cash & Other Receivables 16.47
Grand Total 100.00
Product Label
This product is suitable for investors who are seeking*:
Investors understand that their principalwill be at Moderate risk
� Income over medium term
� Investment predominantly in debt and money market instruments with portfolio Macaulay Duration of 3 – 4 yrs
*Investors should consult their financial advisors if in doubt about whether the product is suitable for them.
Company/Issuer Rating % of AssetsCorporate Bond 96.85Vodafone Idea Limited CARE BB- 96.85
Cash & Other Receivables 3.15Grand Total 100.00
Segregated Portfolio 1 as on May 31, 2020Medium Duration Fund
Details as on May 31, 2020Type of SchemeAn open ended medium term debt scheme investing in instruments such that the Macaulay duration of the portfolio is between 3 to 4 years. (Please refer to the page number 14 of the Scheme Information Document on which the concept of Macaulay’s Duration has been explained)
Current Investment PhilosophyCore allocation will be into AA+ to AA- Corporate Bonds. Focus will be on carry with moderate duration. The fund intends to generate alpha through spread compression and rolldown over a 3 year period.
Date of AllotmentJune 26, 2014
Fund Manager
Sushil Budhia
Benchmark
25% of CRISIL AAA Medium Term Bond Index + 25% of CRISIL AA+ Medium Term Bond Index + 25% of CRISIL AA Medium Term Bond Index + 25% of CRISIL AA- Medium Term Bond Index
Fund Size Main Portfolio Segregated Portfolio 1/2
Monthly Average: ` 521.75 Cr ` 7.26 Cr./0.00 Cr.
Month End: ` 443.25 Cr ` 7.29 Cr./0.00 Cr.
NAV as on May 29, 2020
Main Portfolio Segregated Portfolio 1/2Growth Plan ` 10.4922 ` 0.0535/0.0000Dividend Plan ` 8.9782 ` 0.0458/0.0000Quarterly Dividend Plan ` 7.7390 ` 0.0395/0.0000Bonus Option ` 10.4931 ` 0.0535/0.0000Direct - Growth Plan ` 11.0514 ` 0.0563/0.0000Direct - Dividend Plan ` 9.3213 ` 0.0475/0.0000Direct - Quarterly Dividend Plan
` 7.8690 ` 0.0401/0.0000
Direct - Bonus Option ` 11.0527 ` 0.0563/0.0000
Average Maturity 4.55 Years
Modified Duration 2.70 Years
Yield to Maturity* 12.84%
Total Expense Ratio^Main Segregated 1/2
Regular/Other than Direct: 2.12% –Direct: 1.57% –
Load structure
Entry Load: Nil
Exit Load: 1%, if redeemed or switched out on or before completion of 12 months from the date of allotment of units. Nil, thereafter
Not applicable for Segregated Portfolio
*excluding other receivablesYTM including other receivables: 11.07%
Segregated Portfolio 1 YTM includingother receivables: 2.81%
Segregated Portfolio 1
Vodafone Idea Limited has been segregated from the scheme’s portfolio due to some adverse developments and rating downgrade by CARE to BB- on Feb 17, 2020.
Segregated Portfolio 2
Yes Bank Limited has been segregated from the scheme’s portfolio due to rating downgrade by ICRA to “D” on March 6, 2020.
Kindly refer to SID/KIM for complete details on segregation of portfolio.
Company/Issuer Rating % of AssetsCorporate Bond 0.00Yes Bank Limited ICRA D 0.00
Cash & Other Receivables 100.00Grand Total 100.00
Segregated Portfolio 2 as on May 31, 2020
#Security defaulted beyond its maturity date as on 31st May 2020 (forming part of net current assets) is as follows :- 14% Reliance Home Fin Matured on 31/10/2019 - 4.49% 8.7% Reliance Home Finance Ser I Tran I Matured on 03/01/2020 - 7.92% 8.64% Reliance Home Finance Ltd Annl Comp Matured on 25/05/2020 - 1.69%

June 202036 Fundamentals
Medium to Long Duration Fund
Details as on May 31, 2020
Type of Scheme
An open ended medium term debt scheme investing in instruments such that the Macaulay duration of the portfolio is between 4 to 7 years. (Please refer to the page number 14 of the Scheme Information Document on which the concept of Macaulay’s Duration has been explained)
Current Investment Philosophy
The fund will follow two pronged strategy: Core and Tactical. Core strategy to reflect medium to long term view on interest rates and yield curve. Tactical strategy to benefit out of short term opportunities in the market. Strategy will be implemented through high grade assets like G-Secs/ SDLs/ Corporate Bonds to generate alpha by actively using G-Secs, IRF and IRS curve.
Date of Allotment
January 1, 1998
Fund Manager
Vivek Sharma
Benchmark
NIFTY Medium to Long Duration Debt Index
Fund Size
Monthly Average: ` 329.90 Cr
Month End: ` 419.85 Cr
NAV as on May 29, 2020Growth Plan ` 68.6097Monthly Dividend Plan ` 10.7624Quarterly Dividend Plan ` 13.6139Half Yearly Dividend Plan ` 12.6211Annual Dividend Plan ` 13.0140Bonus Option ` 19.7248Direct - Growth Plan ` 72.9681Direct - Monthly Dividend Plan ` 11.3613Direct - Quarterly Dividend Plan ` 14.1328Direct - Half Yearly Dividend Plan ` 13.4675Direct - Annual Dividend Plan ` 14.2508Direct - Bonus Option ` 20.8514
Average Maturity 5.73 Years
Modified Duration 4.23 Years
Yield to Maturity* 5.16%
Total Expense Ratio^
Regular/Other than Direct: 1.75%
Direct: 1.02%
Load structure
Entry Load: Nil
Exit Load: 0.25% if units redeemed or switched out on or before completion of 15 days from the date of allotment of units. Nil, thereafter
*excluding other receivablesYTM including other receivables: 5.80%
Portfolio as on May 31, 2020
Dividend History
Nippon India Income Fund
Special Feature: Nippon India Any Time Money Card
Past performance may or may not be sustained in future. Pursuant to dividend payment, NAV falls to the extent of payout & statutory levy (if applicable). Face Value-`10.
For scheme performance refer page 63-70. For Fund manager wise scheme performance refer page 71-74.
Record Date Rate (`/ Unit) Cum Dividend NAV Ex-Dividend NAVMonthly Dividend Plan19-May-20 0.1080 10.8373 10.729320-Apr-20 0.1049 10.8229 10.718020-Feb-20 0.1927 10.8658 10.5983Direct - Monthly Dividend Plan19-May-20 0.1195 11.4439 11.324420-Apr-20 0.1168 11.4280 11.311220-Feb-20 0.2078 11.4664 11.1779Quarterly Dividend Plan19-Mar-20 0.4044 13.6375 13.076119-Dec-19 0.1284 13.4894 13.311119-Sep-19 0.2421 13.5718 13.2357Direct - Quarterly Dividend Plan19-Mar-20 0.4354 14.1598 13.555319-Dec-19 0.1495 14.0028 13.795219-Sep-19 0.2671 14.0846 13.7138Half Yearly Dividend Plan19-Mar-20 0.5526 12.8895 12.122319-Sep-19 0.7378 13.3687 12.3444
Record Date Rate (`/ Unit) Cum Dividend NAV Ex-Dividend NAV19-Mar-19 0.4400 13.0612 12.4504Direct - Half Yearly Dividend Plan19-Mar-20 0.6235 13.7829 12.917319-Sep-19 0.8219 14.2918 13.150819-Mar-19 0.5023 13.9573 13.2600Annual Dividend Plan19-Mar-20 1.2900 14.2911 12.500319-Mar-19 0.6512 13.6506 12.746619-Mar-18 0.2276 12.8787 12.5636Direct - Annual Dividend Plan19-Mar-20 1.4932 15.7413 13.668419-Mar-19 0.7899 15.0319 13.935319-Mar-18 0.3301 14.1866 13.7295Bonus Option Bonus Ratio19-Mar-15 40:126-Feb-13 5:3Direct - Bonus Option19-Mar-15 40:126-Feb-13 5:3
Please refer page no. 82 for explanation on symbol: ^ and @ wherever available
Company/Issuer Rating % of Assets
Corporate Bond 18.28
Reliance Industries Limited CRISIL AAA 6.45
Power Finance Corporation Limited CRISIL AAA 5.97
REC Limited CRISIL AAA 5.86
Government Bond 53.37
Government of India SOV 53.37
State Government Bond 0.00
State Government Securities SOV 0.00
Cash & Other Receivables 28.35
Grand Total 100.00
Product Label
This product is suitable for investors who are seeking*:
Investors understand that their principalwill be at Moderate risk
� Income over medium to long term
� Investment in debt and money market instruments with portfolio Macaulay Duration of 4 – 7 yrs
*Investors should consult their financial advisors if in doubt about whether the product is suitable for them.
Rating Profile
AAA/SOV/A1+/Cash & Other Receivables,
100%
Asset Allocation
Government Bond, 53.37%
Cash & Other Receivables, 28.35%
State Government Bond, 0.00%
Corporate Bond, 18.28%

June 2020Fundamentals 37
Special Feature: Nippon India Any Time Money Card
Dynamic Bond Fund
Details as on May 31, 2020
Type of Scheme
An open ended dynamic debt scheme investing across duration
Current Investment Philosophy
The fund intends to maintain a dynamic approach by actively managing duration in different interest rate scenarios and benefit from ensuing opportunity available in the debt market space. The duration management depicts the investment philosophy of this fund which involves taking medium to long term calls on the interest rates which gets reflected on majority of the portfolio (60% - 80%) and tactical fund management on 10% - 20% of the portfolio to take benefit of the short term opportunities in the market. Strategy is to generate alpha by actively using G-Secs, IRF and IRS curve.
Date of Allotment
November 15, 2004
Fund Manager
Prashant Pimple Hardik Shah
Benchmark
CRISIL Dynamic Debt Index
Fund Size
Monthly Average: ` 724.55 Cr
Month End: ` 721.08 Cr
NAV as on May 29, 2020Growth Plan ` 27.8901Dividend Plan ` 18.7596Quarterly Dividend Plan ` 10.9522Direct - Growth Plan ` 29.3067Direct - Dividend Plan ` 21.1732Direct - Quarterly Dividend Plan ` 11.0099
Average Maturity 7.27 Years
Modified Duration 5.20 Years
Yield to Maturity* 5.78%
Total Expense Ratio^
Regular/Other than Direct: 0.68%
Direct: 0.25%
Load structure
Entry Load: Nil
Exit Load: 1%, if units redeemed or switched out on or before completion of 1 month from the date of allotment of units. Nil, thereafter.
*excluding other receivablesYTM including other receivables: 5.90%
Portfolio as on May 31, 2020
Dividend History
Nippon India Dynamic Bond Fund
For SIP performance refer page 61. For scheme performance refer page 63-70. For Fund manager wise scheme performance refer page 71-74.
Past performance may or may not be sustained in future. Pursuant to dividend payment, NAV falls to the extent of payout & statutory levy (if applicable). Face Value-`10.
Record Date Rate (`/ Unit) Cum Dividend NAV Ex-Dividend NAV
Dividend Plan
25-Mar-15 0.9070 14.6923 13.4428
22-Sep-14 0.4881 14.0757 13.4493
25-Mar-14 0.4295 13.9030 13.3518
Direct - Dividend Plan
25-Mar-15 1.0459 16.1921 14.7512
22-Sep-14 0.5706 15.4877 14.7555
25-Mar-14 0.5499 15.3500 14.6444
Record Date Rate (`/ Unit) Cum Dividend NAV Ex-Dividend NAV
Quarterly Dividend Plan
20-Mar-20 0.2472 10.6754 10.3322
20-Dec-19 0.0493 10.6633 10.5949
20-Sep-19 0.1811 10.7922 10.5408
Direct - Quarterly Dividend Plan
20-Mar-20 0.2595 10.7368 10.3766
20-Dec-19 0.0607 10.7216 10.6373
20-Sep-19 0.1933 10.8484 10.5801
Rating Profile
AAA/SOV/A1+/Cash & Other Receivables,
100%
Please refer page no. 82 for explanation on symbol: ^ and @ wherever available
Company/Issuer Rating % of Assets
Corporate Bond 10.32
REC Limited CRISIL AAA 6.14
Power Finance Corporation Limited CRISIL AAA 4.17
Government Bond 19.13
Government of India SOV 19.13
State Government Bond 51.15
State Government Securities SOV 51.15
Cash & Other Receivables 19.40
Grand Total 100.00
Product Label
This product is suitable for investors who are seeking*:
Investors understand that their principalwill be at Moderate risk
� Income over long term
� Investment in debt and money market instruments across duration
*Investors should consult their financial advisors if in doubt about whether the product is suitable for them.
Asset Allocation
State Government Bond, 51.15%
Cash & Other Receivables, 19.4%
Corporate Bond, 10.32%
Government Bond, 19.13%
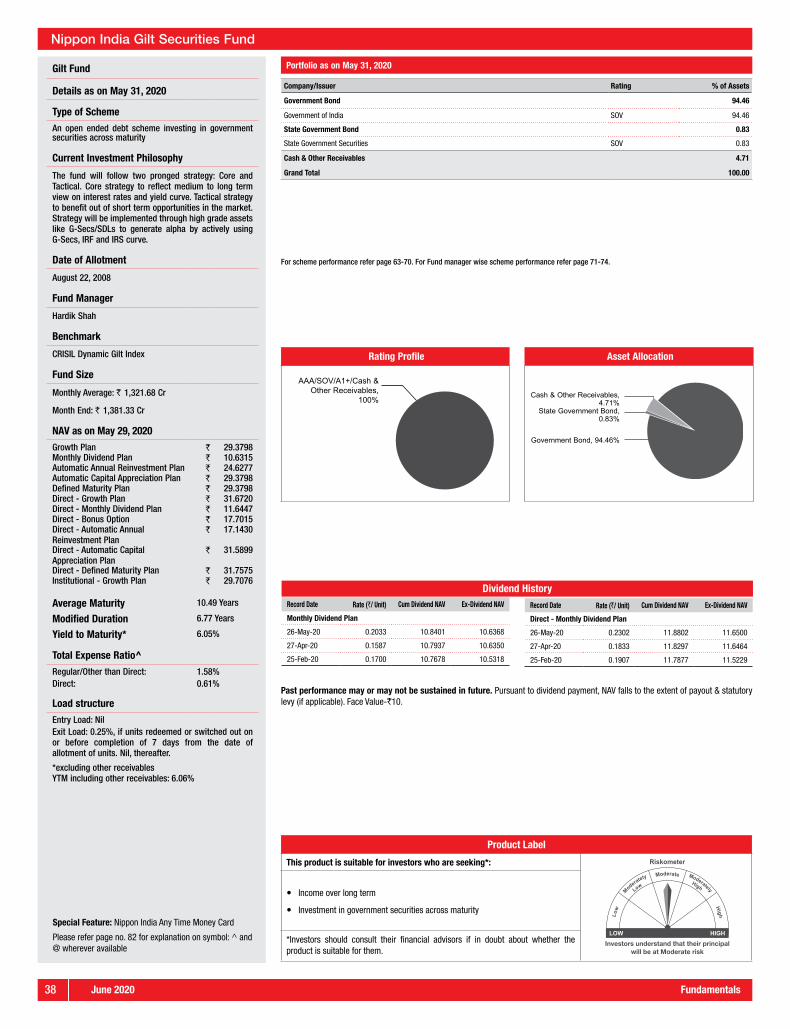
June 202038 Fundamentals
Special Feature: Nippon India Any Time Money CardSpecial Feature: Nippon India Any Time Money Card
Gilt Fund
Details as on May 31, 2020
Type of Scheme
An open ended debt scheme investing in government securities across maturity
Current Investment Philosophy
The fund will follow two pronged strategy: Core and Tactical. Core strategy to reflect medium to long term view on interest rates and yield curve. Tactical strategy to benefit out of short term opportunities in the market. Strategy will be implemented through high grade assets like G-Secs/SDLs to generate alpha by actively using G-Secs, IRF and IRS curve.
Date of Allotment
August 22, 2008
Fund Manager
Hardik Shah
Benchmark
CRISIL Dynamic Gilt Index
Fund Size
Monthly Average: ` 1,321.68 Cr
Month End: ` 1,381.33 Cr
NAV as on May 29, 2020
Growth Plan ` 29.3798Monthly Dividend Plan ` 10.6315Automatic Annual Reinvestment Plan ` 24.6277Automatic Capital Appreciation Plan ` 29.3798Defined Maturity Plan ` 29.3798Direct - Growth Plan ` 31.6720Direct - Monthly Dividend Plan ` 11.6447Direct - Bonus Option ` 17.7015Direct - Automatic Annual Reinvestment Plan
` 17.1430
Direct - Automatic Capital Appreciation Plan
` 31.5899
Direct - Defined Maturity Plan ` 31.7575Institutional - Growth Plan ` 29.7076
Average Maturity 10.49 Years
Modified Duration 6.77 Years
Yield to Maturity* 6.05%
Total Expense Ratio^
Regular/Other than Direct: 1.58%Direct: 0.61%
Load structure
Entry Load: NilExit Load: 0.25%, if units redeemed or switched out on or before completion of 7 days from the date of allotment of units. Nil, thereafter.
*excluding other receivablesYTM including other receivables: 6.06%
Portfolio as on May 31, 2020
Dividend History
Nippon India Gilt Securities Fund
Record Date Rate (`/ Unit) Cum Dividend NAV Ex-Dividend NAV
Monthly Dividend Plan
26-May-20 0.2033 10.8401 10.6368
27-Apr-20 0.1587 10.7937 10.6350
25-Feb-20 0.1700 10.7678 10.5318
Record Date Rate (`/ Unit) Cum Dividend NAV Ex-Dividend NAV
Direct - Monthly Dividend Plan
26-May-20 0.2302 11.8802 11.6500
27-Apr-20 0.1833 11.8297 11.6464
25-Feb-20 0.1907 11.7877 11.5229
Please refer page no. 82 for explanation on symbol: ^ and @ wherever available
Special Feature: Nippon India Any Time Money Card
For scheme performance refer page 63-70. For Fund manager wise scheme performance refer page 71-74.
Company/Issuer Rating % of Assets
Government Bond 94.46
Government of India SOV 94.46
State Government Bond 0.83
State Government Securities SOV 0.83
Cash & Other Receivables 4.71
Grand Total 100.00
Product Label
This product is suitable for investors who are seeking*:
Investors understand that their principalwill be at Moderate risk
� Income over long term
� Investment in government securities across maturity
*Investors should consult their financial advisors if in doubt about whether the product is suitable for them.
Past performance may or may not be sustained in future. Pursuant to dividend payment, NAV falls to the extent of payout & statutory levy (if applicable). Face Value-`10.
Rating Profile
AAA/SOV/A1+/Cash & Other Receivables,
100%
Asset Allocation
Cash & Other Receivables, 4.71%
State Government Bond, 0.83%
Government Bond, 94.46%
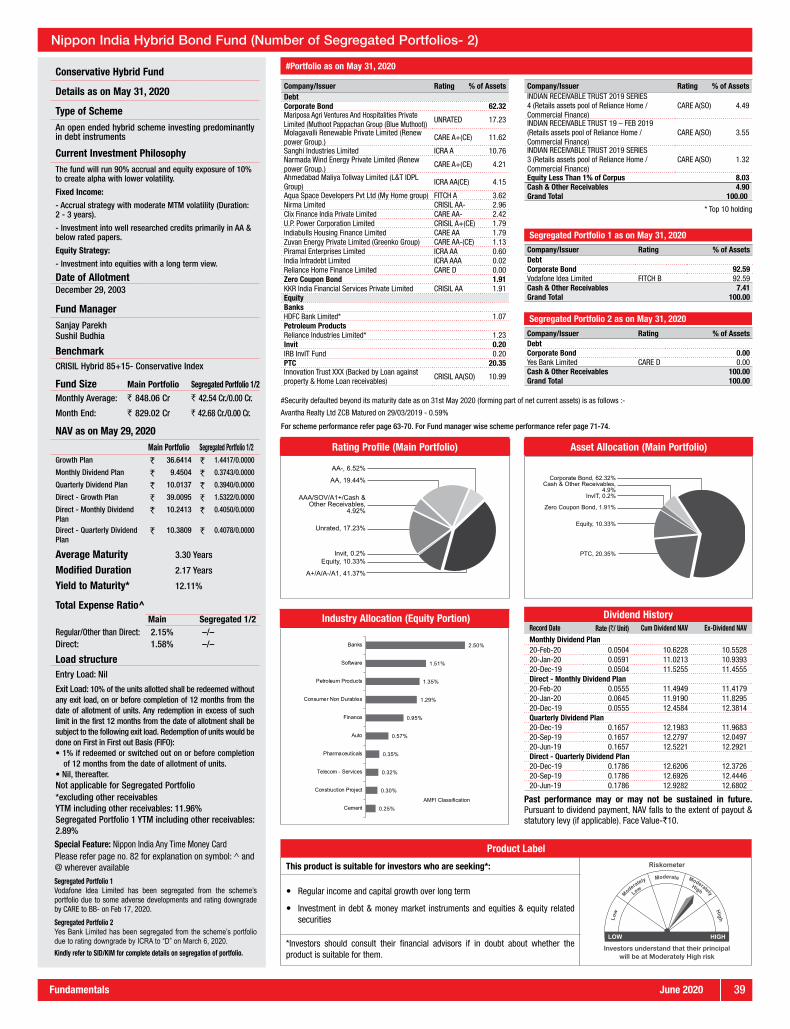
June 2020Fundamentals 39
Asset Allocation (Main Portfolio)
Corporate Bond, 62.32%Cash & Other Receivables,
4.9%InvIT, 0.2%
Zero Coupon Bond, 1.91%
Equity, 10.33%
PTC, 20.35%
#Portfolio as on May 31, 2020
Dividend HistoryRecord Date Rate (`/ Unit) Cum Dividend NAV Ex-Dividend NAVMonthly Dividend Plan20-Feb-20 0.0504 10.6228 10.552820-Jan-20 0.0591 11.0213 10.939320-Dec-19 0.0504 11.5255 11.4555Direct - Monthly Dividend Plan20-Feb-20 0.0555 11.4949 11.417920-Jan-20 0.0645 11.9190 11.829520-Dec-19 0.0555 12.4584 12.3814Quarterly Dividend Plan20-Dec-19 0.1657 12.1983 11.968320-Sep-19 0.1657 12.2797 12.049720-Jun-19 0.1657 12.5221 12.2921Direct - Quarterly Dividend Plan20-Dec-19 0.1786 12.6206 12.372620-Sep-19 0.1786 12.6926 12.444620-Jun-19 0.1786 12.9282 12.6802
Past performance may or may not be sustained in future. Pursuant to dividend payment, NAV falls to the extent of payout & statutory levy (if applicable). Face Value-`10.
Special Feature: Nippon India Any Time Money Card
For scheme performance refer page 63-70. For Fund manager wise scheme performance refer page 71-74.
Please refer page no. 82 for explanation on symbol: ^ and @ wherever available
Company/Issuer Rating % of AssetsDebtCorporate Bond 62.32Mariposa Agri Ventures And Hospitalities Private Limited (Muthoot Pappachan Group (Blue Muthoot))
UNRATED 17.23
Molagavalli Renewable Private Limited (Renew power Group.)
CARE A+(CE) 11.62
Sanghi Industries Limited ICRA A 10.76Narmada Wind Energy Private Limited (Renew power Group.)
CARE A+(CE) 4.21
Ahmedabad Maliya Tollway Limited (L&T IDPL Group)
ICRA AA(CE) 4.15
Aqua Space Developers Pvt Ltd (My Home group) FITCH A 3.62Nirma Limited CRISIL AA- 2.96Clix Finance India Private Limited CARE AA- 2.42U.P. Power Corporation Limited CRISIL A+(CE) 1.79Indiabulls Housing Finance Limited CARE AA 1.79Zuvan Energy Private Limited (Greenko Group) CARE AA-(CE) 1.13Piramal Enterprises Limited ICRA AA 0.60India Infradebt Limited ICRA AAA 0.02Reliance Home Finance Limited CARE D 0.00Zero Coupon Bond 1.91KKR India Financial Services Private Limited CRISIL AA 1.91EquityBanksHDFC Bank Limited* 1.07Petroleum ProductsReliance Industries Limited* 1.23Invit 0.20IRB InvIT Fund 0.20PTC 20.35Innovation Trust XXX (Backed by Loan against property & Home Loan receivables)
CRISIL AA(SO) 10.99
Company/Issuer Rating % of AssetsINDIAN RECEIVABLE TRUST 2019 SERIES 4 (Retails assets pool of Reliance Home / Commercial Finance)
CARE A(SO) 4.49
INDIAN RECEIVABLE TRUST 19 – FEB 2019 (Retails assets pool of Reliance Home / Commercial Finance)
CARE A(SO) 3.55
INDIAN RECEIVABLE TRUST 2019 SERIES 3 (Retails assets pool of Reliance Home / Commercial Finance)
CARE A(SO) 1.32
Equity Less Than 1% of Corpus 8.03Cash & Other Receivables 4.90Grand Total 100.00
* Top 10 holding
Industry Allocation (Equity Portion)
AMFI Classification
2.50%
1.51%
1.35%
1.29%
0.95%
0.57%
0.35%
0.32%
0.30%
0.25%
Banks
Software
Petroleum Products
Consumer Non Durables
Finance
Auto
Pharmaceuticals
Telecom - Services
Construction Project
Cement
Product Label
This product is suitable for investors who are seeking*:
Investors understand that their principalwill be at Moderately High risk
� Regular income and capital growth over long term
� Investment in debt & money market instruments and equities & equity related securities
*Investors should consult their financial advisors if in doubt about whether the product is suitable for them.
Conservative Hybrid Fund
Details as on May 31, 2020
Type of Scheme
An open ended hybrid scheme investing predominantly in debt instruments
Current Investment PhilosophyThe fund will run 90% accrual and equity exposure of 10% to create alpha with lower volatility.
Fixed Income:
- Accrual strategy with moderate MTM volatility (Duration: 2 - 3 years).
- Investment into well researched credits primarily in AA & below rated papers.
Equity Strategy:
- Investment into equities with a long term view.
Date of AllotmentDecember 29, 2003
Fund Manager
Sanjay Parekh Sushil Budhia
BenchmarkCRISIL Hybrid 85+15- Conservative Index
Fund Size Main Portfolio Segregated Portfolio 1/2Monthly Average: ` 848.06 Cr ` 42.54 Cr./0.00 Cr.
Month End: ` 829.02 Cr ` 42.68 Cr./0.00 Cr.
NAV as on May 29, 2020
Main Portfolio Segregated Portfolio 1/2Growth Plan ` 36.6414 ` 1.4417/0.0000
Monthly Dividend Plan ` 9.4504 ` 0.3743/0.0000
Quarterly Dividend Plan ` 10.0137 ` 0.3940/0.0000
Direct - Growth Plan ` 39.0095 ` 1.5322/0.0000
Direct - Monthly Dividend Plan
` 10.2413 ` 0.4050/0.0000
Direct - Quarterly Dividend Plan
` 10.3809 ` 0.4078/0.0000
Average Maturity 3.30 Years
Modified Duration 2.17 Years
Yield to Maturity* 12.11%
Total Expense Ratio^Main Segregated 1/2
Regular/Other than Direct: 2.15% –/–Direct: 1.58% –/–
Load structureEntry Load: Nil
Exit Load: 10% of the units allotted shall be redeemed without any exit load, on or before completion of 12 months from the date of allotment of units. Any redemption in excess of such limit in the first 12 months from the date of allotment shall be subject to the following exit load. Redemption of units would be done on First in First out Basis (FIFO):• 1% if redeemed or switched out on or before completion
of 12 months from the date of allotment of units.• Nil, thereafter.Not applicable for Segregated Portfolio*excluding other receivablesYTM including other receivables: 11.96%Segregated Portfolio 1 YTM including other receivables: 2.89%
Company/Issuer Rating % of AssetsDebtCorporate Bond 92.59Vodafone Idea Limited FITCH B 92.59Cash & Other Receivables 7.41Grand Total 100.00
Segregated Portfolio 1 as on May 31, 2020
Nippon India Hybrid Bond Fund (Number of Segregated Portfolios- 2)
Segregated Portfolio 1Vodafone Idea Limited has been segregated from the scheme’s portfolio due to some adverse developments and rating downgrade by CARE to BB- on Feb 17, 2020.
Segregated Portfolio 2Yes Bank Limited has been segregated from the scheme’s portfolio due to rating downgrade by ICRA to “D” on March 6, 2020.Kindly refer to SID/KIM for complete details on segregation of portfolio.
Segregated Portfolio 2 as on May 31, 2020
#Security defaulted beyond its maturity date as on 31st May 2020 (forming part of net current assets) is as follows :-
Avantha Realty Ltd ZCB Matured on 29/03/2019 - 0.59%
Company/Issuer Rating % of AssetsDebtCorporate Bond 0.00Yes Bank Limited CARE D 0.00Cash & Other Receivables 100.00Grand Total 100.00
Rating Profile (Main Portfolio)
AA-, 6.52%
AA, 19.44%
AAA/SOV/A1+/Cash & Other Receivables,
4.92%
Unrated, 17.23%
Invit, 0.2%Equity, 10.33%
A+/A/A-/A1, 41.37%
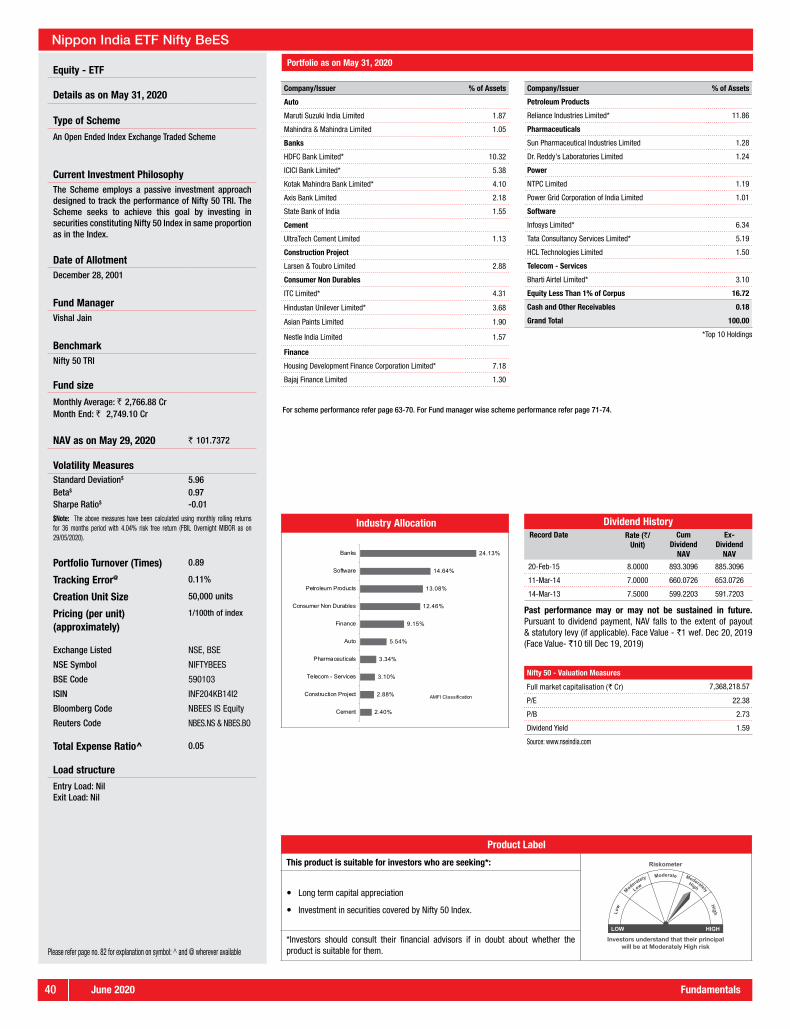
June 202040 Fundamentals
Equity - ETF
Details as on May 31, 2020
Type of Scheme
An Open Ended Index Exchange Traded Scheme
Current Investment PhilosophyThe Scheme employs a passive investment approach designed to track the performance of Nifty 50 TRI. The Scheme seeks to achieve this goal by investing in securities constituting Nifty 50 Index in same proportion as in the Index.
Date of AllotmentDecember 28, 2001
Fund ManagerVishal Jain
BenchmarkNifty 50 TRI
Fund size
Monthly Average: ` 2,766.88 CrMonth End: ` 2,749.10 Cr
NAV as on May 29, 2020 ` 101.7372
Volatility MeasuresStandard Deviation$ 5.96Beta$ 0.97Sharpe Ratio$ -0.01
$Note: The above measures have been calculated using monthly rolling returns for 36 months period with 4.04% risk free return (FBIL Overnight MIBOR as on 29/05/2020).
Portfolio Turnover (Times) 0.89
Tracking Error@ 0.11%
Creation Unit Size 50,000 units
Pricing (per unit)(approximately)
1/100th of index
Exchange Listed NSE, BSE
NSE Symbol NIFTYBEES
BSE Code 590103
ISIN INF204KB14I2
Bloomberg Code NBEES IS Equity
Reuters Code NBES.NS & NBES.BO
Total Expense Ratio^ 0.05
Load structure
Entry Load: NilExit Load: Nil
Portfolio as on May 31, 2020
Nippon India ETF Nifty BeES
Industry Allocation
AMFI Classification
24.13%
14.64%
13.08%
12.46%
9.15%
5.54%
3.34%
3.10%
2.88%
2.40%
Banks
Software
Petroleum Products
Consumer Non Durables
Finance
Auto
Pharmaceuticals
Telecom - Services
Construction Project
Cement
Dividend HistoryRecord Date Rate (`/
Unit)Cum
Dividend NAV
Ex-Dividend
NAV
20-Feb-15 8.0000 893.3096 885.3096
11-Mar-14 7.0000 660.0726 653.0726
14-Mar-13 7.5000 599.2203 591.7203
Past performance may or may not be sustained in future. Pursuant to dividend payment, NAV falls to the extent of payout & statutory levy (if applicable). Face Value - `1 wef. Dec 20, 2019 (Face Value- `10 till Dec 19, 2019)
Nifty 50 - Valuation Measures
Full market capitalisation (` Cr) 7,368,218.57
P/E 22.38
P/B 2.73
Dividend Yield 1.59
Source: www.nseindia.com
For scheme performance refer page 63-70. For Fund manager wise scheme performance refer page 71-74.
Please refer page no. 82 for explanation on symbol: ^ and @ wherever available
Company/Issuer % of Assets
Auto
Maruti Suzuki India Limited 1.87
Mahindra & Mahindra Limited 1.05
Banks
HDFC Bank Limited* 10.32
ICICI Bank Limited* 5.38
Kotak Mahindra Bank Limited* 4.10
Axis Bank Limited 2.18
State Bank of India 1.55
Cement
UltraTech Cement Limited 1.13
Construction Project
Larsen & Toubro Limited 2.88
Consumer Non Durables
ITC Limited* 4.31
Hindustan Unilever Limited* 3.68
Asian Paints Limited 1.90
Nestle India Limited 1.57
Finance
Housing Development Finance Corporation Limited* 7.18
Bajaj Finance Limited 1.30
Company/Issuer % of Assets
Petroleum Products
Reliance Industries Limited* 11.86
Pharmaceuticals
Sun Pharmaceutical Industries Limited 1.28
Dr. Reddy's Laboratories Limited 1.24
Power
NTPC Limited 1.19
Power Grid Corporation of India Limited 1.01
Software
Infosys Limited* 6.34
Tata Consultancy Services Limited* 5.19
HCL Technologies Limited 1.50
Telecom - Services
Bharti Airtel Limited* 3.10
Equity Less Than 1% of Corpus 16.72
Cash and Other Receivables 0.18
Grand Total 100.00
*Top 10 Holdings
Product Label
This product is suitable for investors who are seeking*:
Investors understand that their principalwill be at Moderately High risk
� Long term capital appreciation
� Investment in securities covered by Nifty 50 Index.
*Investors should consult their financial advisors if in doubt about whether the product is suitable for them.
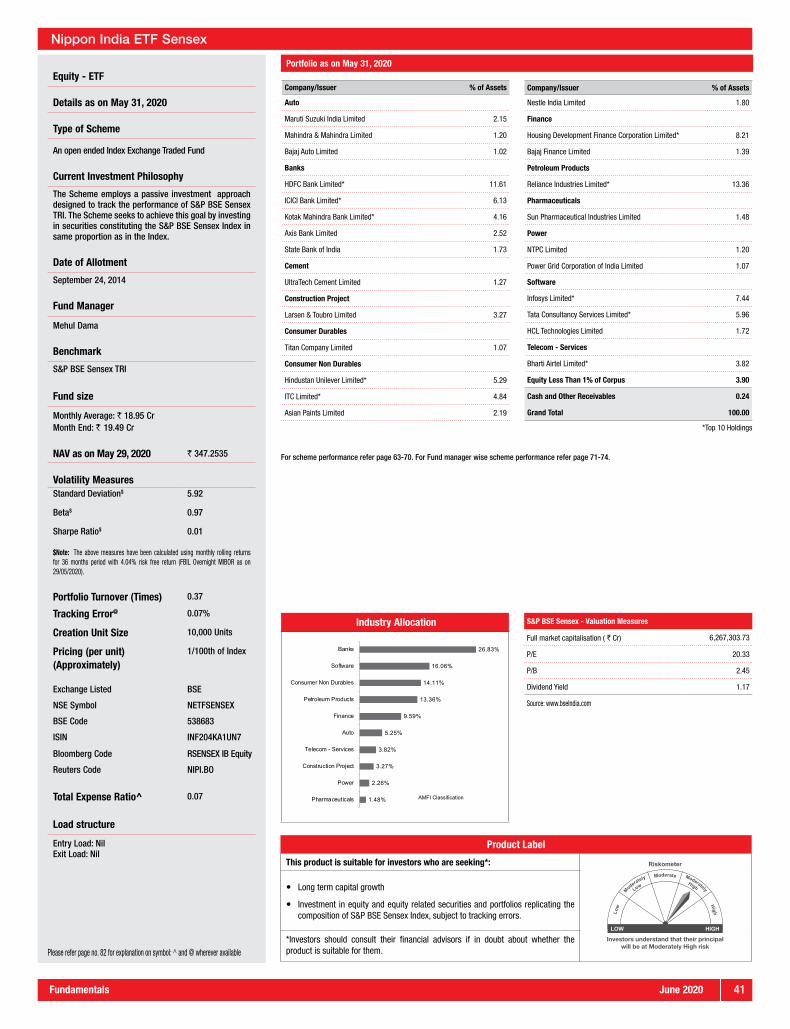
June 2020Fundamentals 41
Equity - ETF
Details as on May 31, 2020
Type of Scheme
An open ended Index Exchange Traded Fund
Current Investment Philosophy
The Scheme employs a passive investment approach designed to track the performance of S&P BSE Sensex TRI. The Scheme seeks to achieve this goal by investing in securities constituting the S&P BSE Sensex Index in same proportion as in the Index.
Date of Allotment
September 24, 2014
Fund Manager
Mehul Dama
Benchmark
S&P BSE Sensex TRI
Fund size
Monthly Average: ` 18.95 CrMonth End: ` 19.49 Cr
NAV as on May 29, 2020 ` 347.2535
Volatility MeasuresStandard Deviation$ 5.92
Beta$ 0.97
Sharpe Ratio$ 0.01
$Note: The above measures have been calculated using monthly rolling returns for 36 months period with 4.04% risk free return (FBIL Overnight MIBOR as on 29/05/2020).
Portfolio Turnover (Times) 0.37
Tracking Error@ 0.07%
Creation Unit Size 10,000 Units
Pricing (per unit)(Approximately)
1/100th of Index
Exchange Listed BSE
NSE Symbol NETFSENSEX
BSE Code 538683
ISIN INF204KA1UN7
Bloomberg Code RSENSEX IB Equity
Reuters Code NIPI.BO
Total Expense Ratio^ 0.07
Load structure
Entry Load: NilExit Load: Nil
Portfolio as on May 31, 2020
Nippon India ETF Sensex
Industry Allocation
AMFI Classification
26.83%
16.06%
14.11%
13.36%
9.59%
5.25%
3.82%
3.27%
2.26%
1.48%
Banks
Software
Consumer Non Durables
Petroleum Products
Finance
Auto
Telecom - Services
Construction Project
Power
Pharmaceuticals
S&P BSE Sensex - Valuation Measures
Full market capitalisation ( ` Cr) 6,267,303.73
P/E 20.33
P/B 2.45
Dividend Yield 1.17
Source: www.bseIndia.com
For scheme performance refer page 63-70. For Fund manager wise scheme performance refer page 71-74.
Please refer page no. 82 for explanation on symbol: ^ and @ wherever available
Company/Issuer % of Assets
Auto
Maruti Suzuki India Limited 2.15
Mahindra & Mahindra Limited 1.20
Bajaj Auto Limited 1.02
Banks
HDFC Bank Limited* 11.61
ICICI Bank Limited* 6.13
Kotak Mahindra Bank Limited* 4.16
Axis Bank Limited 2.52
State Bank of India 1.73
Cement
UltraTech Cement Limited 1.27
Construction Project
Larsen & Toubro Limited 3.27
Consumer Durables
Titan Company Limited 1.07
Consumer Non Durables
Hindustan Unilever Limited* 5.29
ITC Limited* 4.84
Asian Paints Limited 2.19
Company/Issuer % of Assets
Nestle India Limited 1.80
Finance
Housing Development Finance Corporation Limited* 8.21
Bajaj Finance Limited 1.39
Petroleum Products
Reliance Industries Limited* 13.36
Pharmaceuticals
Sun Pharmaceutical Industries Limited 1.48
Power
NTPC Limited 1.20
Power Grid Corporation of India Limited 1.07
Software
Infosys Limited* 7.44
Tata Consultancy Services Limited* 5.96
HCL Technologies Limited 1.72
Telecom - Services
Bharti Airtel Limited* 3.82
Equity Less Than 1% of Corpus 3.90
Cash and Other Receivables 0.24
Grand Total 100.00
*Top 10 Holdings
Product Label
This product is suitable for investors who are seeking*:
Investors understand that their principalwill be at Moderately High risk
� Long term capital growth
� Investment in equity and equity related securities and portfolios replicating the composition of S&P BSE Sensex Index, subject to tracking errors.
*Investors should consult their financial advisors if in doubt about whether the product is suitable for them.

June 202042 Fundamentals
Portfolio as on May 31, 2020
Nippon India ETF NV20
Equity - ETF
Details as on May 31, 2020
Type of Scheme
An open ended Index Exchange Traded Fund
Current Investment Philosophy
Nippon India ETF NV20 is a passively managed exchange traded fund which will employ an investment approach designed to track the performance of Nifty 50 Value 20 TRI. The Scheme seeks to achieve this goal by investing in securities constituting the Nifty 50 Value 20 Index in same proportion as in the Index.
Date of Allotment
June 18, 2015
Fund Manager
Mehul Dama
Benchmark
Nifty 50 Value 20 TRI
Fund size
Monthly Average: ` 21.77 CrMonth End: ` 22.78 Cr
NAV as on May 29, 2020 ` 51.3692
Volatility MeasuresStandard Deviation 4.86Beta 0.98Sharpe Ratio 0.06
Note: The above measures have been calculated using monthly rolling returns for 36 months period with 4.04% risk free return (FBIL Overnight MIBOR as on 29/05/2020).
Portfolio Turnover (Times) 0.58
Tracking Error@ 0.47%
Creation Unit Size 30,000 units
Pricing (per unit)(approximately)
1/100th of index
Exchange Listed NSE
NSE Symbol NETFNV20
ISIN INF204KB18I3
Bloomberg Code RELNV20 IS Equity
Reuters Code NNET.NS
Total Expense Ratio^ 0.37
Load structure
Entry Load: NilExit Load: Nil
Industry Allocation
AMFI Classification
41.23%
27.70%
7.62%
5.72%
4.22%
3.56%
2.63%
2.57%
1.48%
1.46%
Software
Consumer Non Durables
Power
Auto
Petroleum Products
Ferrous Metals
Oil
Minerals/Mining
Gas
Non - Ferrous Metals
Nifty 50 Value 20 - Valuation Measures
Full market capitalisation (` Cr) 2,865,080.87
P/E 13.94
P/B 2.51
Dividend Yield 3.48
Source: www.nseindia.com
For scheme performance refer page 63-70. For Fund manager wise scheme performance refer page 71-74.
Please refer page no. 82 for explanation on symbol: ^ and @ wherever available
Company/Issuer % of Assets
Auto
Bajaj Auto Limited* 3.06
Hero MotoCorp Limited 2.66
Consumer Non Durables
ITC Limited* 14.95
Hindustan Unilever Limited* 12.75
Ferrous Metals
Tata Steel Limited 1.93
JSW Steel Limited 1.62
Gas
GAIL (India) Limited 1.48
Media & Entertainment
Zee Entertainment Enterprises Limited 1.45
Minerals/Mining
Coal India Limited 2.57
Non - Ferrous Metals
Vedanta Limited 1.46
Company/Issuer % of Assets
Oil
Oil & Natural Gas Corporation Limited 2.63
Petroleum Products
Bharat Petroleum Corporation Limited 2.39
Indian Oil Corporation Limited 1.84
Power
NTPC Limited* 4.12
Power Grid Corporation of India Limited* 3.51
Software
Tata Consultancy Services Limited* 15.36
Infosys Limited* 15.09
HCL Technologies Limited* 5.18
Tech Mahindra Limited* 2.85
Wipro Limited* 2.74
Cash and Other Receivables 0.34
Grand Total 100.00
*Top 10 Holdings
Product Label
This product is suitable for investors who are seeking*:
Investors understand that their principalwill be at Moderately High risk
� Long term capital growth
� investment in equity and equity related securities and portfolios replicating the composition of Nifty 50 Value 20 Index, subject to tracking errors
*Investors should consult their financial advisors if in doubt about whether the product is suitable for them.
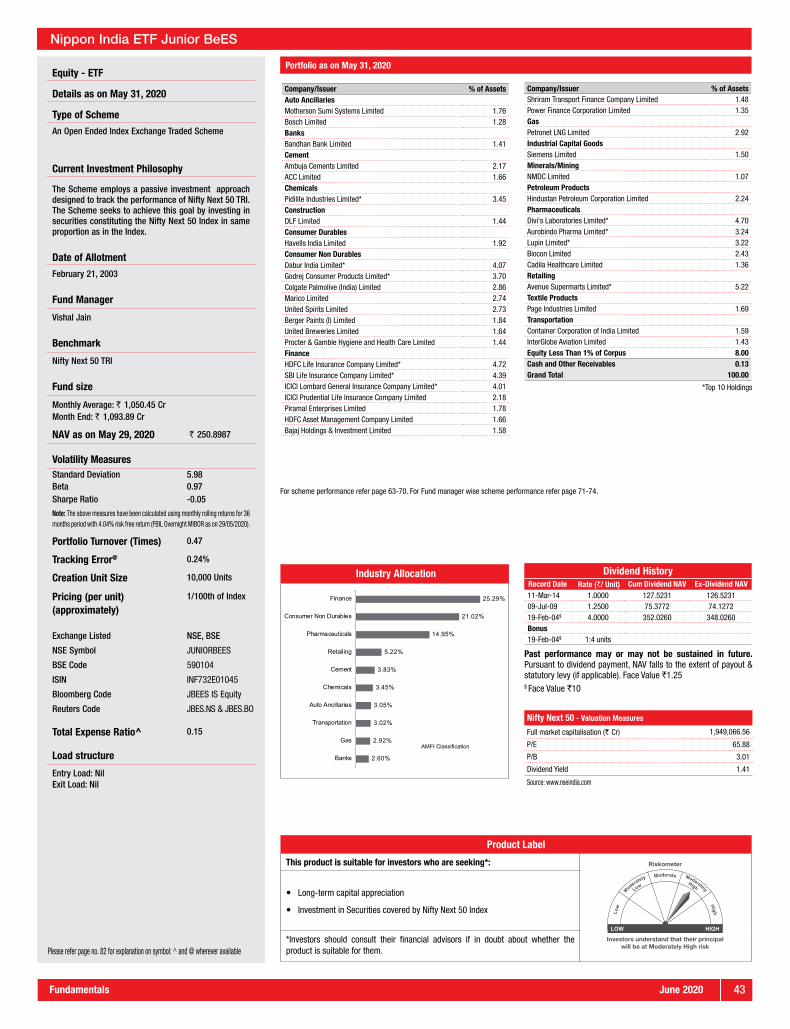
June 2020Fundamentals 43
Nippon India ETF Junior BeES
Equity - ETF
Details as on May 31, 2020
Type of Scheme
An Open Ended Index Exchange Traded Scheme
Current Investment Philosophy
The Scheme employs a passive investment approach designed to track the performance of Nifty Next 50 TRI. The Scheme seeks to achieve this goal by investing in securities constituting the Nifty Next 50 Index in same proportion as in the Index.
Date of Allotment
February 21, 2003
Fund Manager
Vishal Jain
Benchmark
Nifty Next 50 TRI
Fund size
Monthly Average: ` 1,050.45 CrMonth End: ` 1,093.89 Cr
NAV as on May 29, 2020 ` 250.8987
Volatility MeasuresStandard Deviation 5.98Beta 0.97Sharpe Ratio -0.05
Note: The above measures have been calculated using monthly rolling returns for 36 months period with 4.04% risk free return (FBIL Overnight MIBOR as on 29/05/2020).
Portfolio Turnover (Times) 0.47
Tracking Error@ 0.24%
Creation Unit Size 10,000 Units
Pricing (per unit)(approximately)
1/100th of Index
Exchange Listed NSE, BSE
NSE Symbol JUNIORBEES
BSE Code 590104
ISIN INF732E01045
Bloomberg Code JBEES IS Equity
Reuters Code JBES.NS & JBES.BO
Total Expense Ratio^ 0.15
Load structure
Entry Load: NilExit Load: Nil
Industry Allocation
AMFI Classification
25.29%
21.02%
14.95%
5.22%
3.83%
3.45%
3.05%
3.02%
2.92%
2.60%
Finance
Consumer Non Durables
Pharmaceuticals
Retailing
Cement
Chemicals
Auto Ancillaries
Transportation
Gas
Banks
Dividend HistoryRecord Date Rate (`/ Unit) Cum Dividend NAV Ex-Dividend NAV11-Mar-14 1.0000 127.5231 126.523109-Jul-09 1.2500 75.3772 74.127219-Feb-04$ 4.0000 352.0260 348.0260Bonus19-Feb-04$ 1:4 units
Past performance may or may not be sustained in future. Pursuant to dividend payment, NAV falls to the extent of payout & statutory levy (if applicable). Face Value `1.25$ Face Value `10
Nifty Next 50 - Valuation Measures
Full market capitalisation (` Cr) 1,949,066.56
P/E 65.88
P/B 3.01
Dividend Yield 1.41
Source: www.nseindia.com
Please refer page no. 82 for explanation on symbol: ^ and @ wherever available
Portfolio as on May 31, 2020
Company/Issuer % of AssetsAuto AncillariesMotherson Sumi Systems Limited 1.76Bosch Limited 1.28BanksBandhan Bank Limited 1.41CementAmbuja Cements Limited 2.17ACC Limited 1.66ChemicalsPidilite Industries Limited* 3.45ConstructionDLF Limited 1.44Consumer DurablesHavells India Limited 1.92Consumer Non DurablesDabur India Limited* 4.07Godrej Consumer Products Limited* 3.70Colgate Palmolive (India) Limited 2.86Marico Limited 2.74United Spirits Limited 2.73Berger Paints (I) Limited 1.84United Breweries Limited 1.64Procter & Gamble Hygiene and Health Care Limited 1.44FinanceHDFC Life Insurance Company Limited* 4.72SBI Life Insurance Company Limited* 4.39ICICI Lombard General Insurance Company Limited* 4.01ICICI Prudential Life Insurance Company Limited 2.18Piramal Enterprises Limited 1.78HDFC Asset Management Company Limited 1.66Bajaj Holdings & Investment Limited 1.58
Company/Issuer % of AssetsShriram Transport Finance Company Limited 1.48Power Finance Corporation Limited 1.35GasPetronet LNG Limited 2.92Industrial Capital GoodsSiemens Limited 1.50Minerals/MiningNMDC Limited 1.07Petroleum ProductsHindustan Petroleum Corporation Limited 2.24PharmaceuticalsDivi's Laboratories Limited* 4.70Aurobindo Pharma Limited* 3.24Lupin Limited* 3.22Biocon Limited 2.43Cadila Healthcare Limited 1.36RetailingAvenue Supermarts Limited* 5.22Textile ProductsPage Industries Limited 1.69TransportationContainer Corporation of India Limited 1.59InterGlobe Aviation Limited 1.43Equity Less Than 1% of Corpus 8.00Cash and Other Receivables 0.13Grand Total 100.00
*Top 10 Holdings
For scheme performance refer page 63-70. For Fund manager wise scheme performance refer page 71-74.
Product Label
This product is suitable for investors who are seeking*:
Investors understand that their principalwill be at Moderately High risk
� Long-term capital appreciation
� Investment in Securities covered by Nifty Next 50 Index
*Investors should consult their financial advisors if in doubt about whether the product is suitable for them.

June 202044 Fundamentals
Portfolio as on May 31, 2020
Nippon India ETF Nifty 100
Equity - ETF
Details as on May 31, 2020
Type of Scheme
An open ended Index Exchange Traded Fund
Current Investment Philosophy
The Scheme employs a passive investment approach designed to track the performance of Nifty 100 TRI. The Scheme seeks to achieve this goal by investing in securities constituting Nifty 100 Index in same proportion as in the Index.
Date of Allotment
March 22, 2013
Fund Manager
Mehul Dama
Benchmark
Nifty 100 TRI
Fund size
Monthly Average: ` 5.69 CrMonth End: ` 5.88 Cr
NAV as on May 29, 2020 ` 100.2107
Volatility Measures
Standard Deviation 5.89
Beta 0.97
Sharpe Ratio -0.03
Note: The above measures have been calculated using monthly rolling returns for 36 months period with 4.04% risk free return (FBIL Overnight MIBOR as on 29/05/2020).
Portfolio Turnover (Times) 0.06
Tracking Error@ 0.12%
Creation Unit Size 100,000 Units
Pricing (per unit)(approximately)
1/100th of Index
Exchange Listed NSE, BSE
NSE Symbol NETFNIF100
BSE Code 537483
ISIN INF204K014N5
Bloomberg Code RCNX100 IS Equity
Reuters Code NIPO.NS & NIPO.BO
Total Expense Ratio^ 0.97
Load structure
Entry Load: NilExit Load: Nil
Industry Allocation
AMFI Classification
21.04%
13.60%
12.67%
11.52%
11.36%
4.95%
4.93%
2.75%
2.60%
2.47%
Banks
Consumer Non Durables
Software
Petroleum Products
Finance
Pharmaceuticals
Auto
Telecom - Services
Cement
Construction Project
Nifty 100 - Valuation Measures
Full market capitalisation (` Cr) 9,319,120.82
P/E 24.71
P/B 2.76
Dividend Yield 1.56
Source: www.nseindia.com
For scheme performance refer page 63-70. For Fund manager wise scheme performance refer page 71-74.
Please refer page no. 82 for explanation on symbol: ^ and @ wherever available
Company/Issuer % of Assets
Auto
Maruti Suzuki India Limited 1.60
Banks
HDFC Bank Limited* 8.84
ICICI Bank Limited* 4.61
Kotak Mahindra Bank Limited* 3.52
Axis Bank Limited 1.86
State Bank of India 1.33
Construction Project
Larsen & Toubro Limited 2.47
Consumer Non Durables
ITC Limited* 3.70
Hindustan Unilever Limited* 3.16
Asian Paints Limited 1.63
Nestle India Limited 1.34
Finance
Housing Development Finance Corporation Limited* 6.16
Bajaj Finance Limited 1.11
Company/Issuer % of Assets
Petroleum Products
Reliance Industries Limited* 10.16
Pharmaceuticals
Sun Pharmaceutical Industries Limited 1.10
Dr. Reddy's Laboratories Limited 1.06
Power
NTPC Limited 1.02
Software
Infosys Limited* 5.43
Tata Consultancy Services Limited* 4.45
HCL Technologies Limited 1.28
Telecom - Services
Bharti Airtel Limited* 2.65
Equity Less Than 1% of Corpus 31.01
Cash and Other Receivables 0.51
Grand Total 100.00
*Top 10 Holdings
Product Label
This product is suitable for investors who are seeking*:
Investors understand that their principalwill be at Moderately High risk
� Long term capital growth
� Investment in equity and equity related securities and portfolios replicating the composition of Nifty 100 Index, subject to tracking errors.
*Investors should consult their financial advisors if in doubt about whether the product is suitable for them.
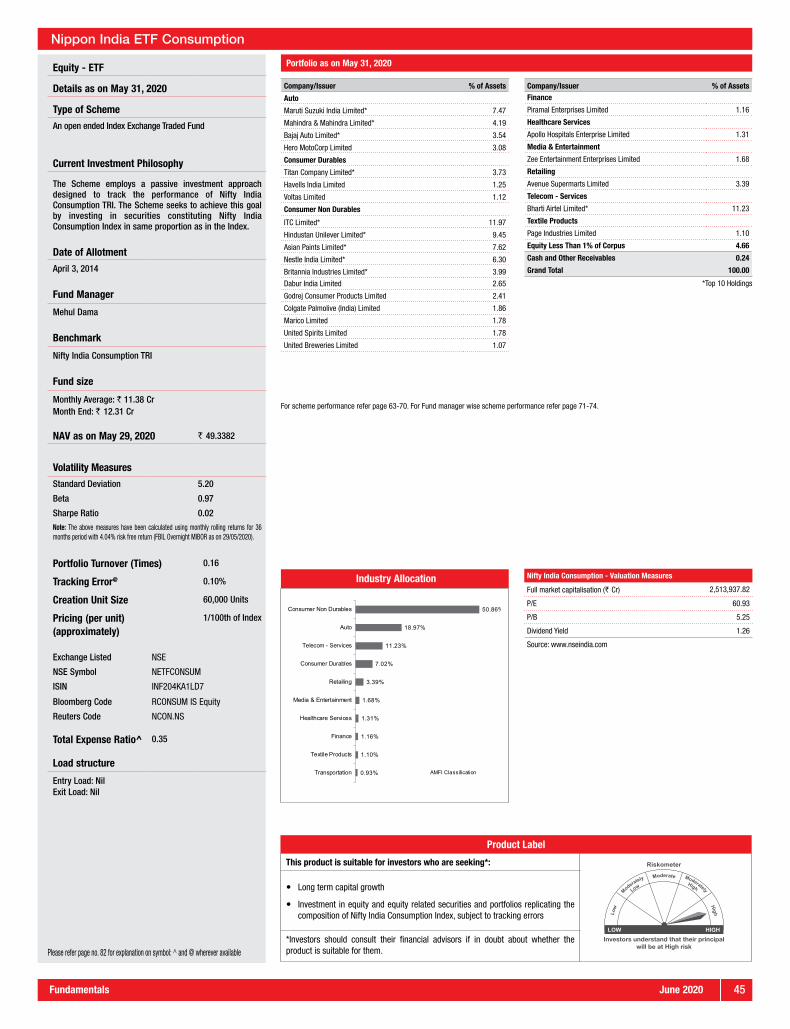
June 2020Fundamentals 45
Portfolio as on May 31, 2020
Nippon India ETF Consumption
Equity - ETF
Details as on May 31, 2020
Type of Scheme
An open ended Index Exchange Traded Fund
Current Investment Philosophy
The Scheme employs a passive investment approach designed to track the performance of Nifty India Consumption TRI. The Scheme seeks to achieve this goal by investing in securities constituting Nifty India Consumption Index in same proportion as in the Index.
Date of Allotment
April 3, 2014
Fund Manager
Mehul Dama
Benchmark
Nifty India Consumption TRI
Fund size
Monthly Average: ` 11.38 CrMonth End: ` 12.31 Cr
NAV as on May 29, 2020 ` 49.3382
Volatility Measures
Standard Deviation 5.20
Beta 0.97
Sharpe Ratio 0.02
Note: The above measures have been calculated using monthly rolling returns for 36 months period with 4.04% risk free return (FBIL Overnight MIBOR as on 29/05/2020).
Portfolio Turnover (Times) 0.16
Tracking Error@ 0.10%
Creation Unit Size 60,000 Units
Pricing (per unit)(approximately)
1/100th of Index
Exchange Listed NSE
NSE Symbol NETFCONSUM
ISIN INF204KA1LD7
Bloomberg Code RCONSUM IS Equity
Reuters Code NCON.NS
Total Expense Ratio^ 0.35
Load structure
Entry Load: NilExit Load: Nil
Industry Allocation
AMFI Classification
50.86%
18.97%
11.23%
7.02%
3.39%
1.68%
1.31%
1.16%
1.10%
0.93%
Consumer Non Durables
Auto
Telecom - Services
Consumer Durables
Retailing
Media & Entertainment
Healthcare Services
Finance
Textile Products
Transportation
Nifty India Consumption - Valuation Measures
Full market capitalisation (` Cr) 2,513,937.82
P/E 60.93
P/B 5.25
Dividend Yield 1.26
Source: www.nseindia.com
For scheme performance refer page 63-70. For Fund manager wise scheme performance refer page 71-74.
Please refer page no. 82 for explanation on symbol: ^ and @ wherever available
Company/Issuer % of Assets
Auto
Maruti Suzuki India Limited* 7.47
Mahindra & Mahindra Limited* 4.19
Bajaj Auto Limited* 3.54
Hero MotoCorp Limited 3.08
Consumer Durables
Titan Company Limited* 3.73
Havells India Limited 1.25
Voltas Limited 1.12
Consumer Non Durables
ITC Limited* 11.97
Hindustan Unilever Limited* 9.45
Asian Paints Limited* 7.62
Nestle India Limited* 6.30
Britannia Industries Limited* 3.99
Dabur India Limited 2.65
Godrej Consumer Products Limited 2.41
Colgate Palmolive (India) Limited 1.86
Marico Limited 1.78
United Spirits Limited 1.78
United Breweries Limited 1.07
Company/Issuer % of AssetsFinance
Piramal Enterprises Limited 1.16
Healthcare Services
Apollo Hospitals Enterprise Limited 1.31
Media & Entertainment
Zee Entertainment Enterprises Limited 1.68
Retailing
Avenue Supermarts Limited 3.39
Telecom - Services
Bharti Airtel Limited* 11.23
Textile Products
Page Industries Limited 1.10
Equity Less Than 1% of Corpus 4.66
Cash and Other Receivables 0.24
Grand Total 100.00
*Top 10 Holdings
Product Label
This product is suitable for investors who are seeking*:
Investors understand that their principalwill be at High risk
� Long term capital growth
� Investment in equity and equity related securities and portfolios replicating the composition of Nifty India Consumption Index, subject to tracking errors
*Investors should consult their financial advisors if in doubt about whether the product is suitable for them.

June 202046 Fundamentals
Portfolio as on May 31, 2020
Nippon India ETF Dividend Opportunities
Equity - ETF
Details as on May 31, 2020
Type of Scheme
An open ended Index Exchange Traded Fund
Current Investment Philosophy
The Scheme employs a passive investment approach designed to track the performance of Nifty Dividend Opportunities 50 TRI. The Scheme seeks to achieve this goal by investing in securities constituting Nifty Dividend Opportunities 50 Index in same proportion as in the Index.
Date of Allotment
April 15, 2014
Fund Manager
Mehul Dama
Benchmark
Nifty Dividend Opportunities 50 TRI
Fund size
Monthly Average: ` 1.60 CrMonth End: ` 1.67 Cr
NAV as on May 29, 2020 ` 25.1438
Volatility Measures
Standard Deviation 4.60
Beta 0.96
Sharpe Ratio -0.08
Note: The above measures have been calculated using monthly rolling returns for 36 months period with 4.04% risk free return (FBIL Overnight MIBOR as on 29/05/2020).
Portfolio Turnover (Times) 0.60
Tracking Error@ 0.38%
Creation Unit Size 75,000 Units
Pricing (per unit)(approximately)
1/100th of Index
Exchange Listed NSE
NSE Symbol NETFDIVOPP
ISIN INF204KA1MS3
Bloomberg Code RDIVOPP IS Equity
Reuters Code NDIV.NS
Total Expense Ratio^ 0.16
Load structure
Entry Load: NilExit Load: Nil
Industry Allocation
AMFI Classification
25.66%
23.17%
10.49%
7.79%
7.47%
6.06%
4.14%
3.76%
2.78%
2.69%
Software
Consumer Non Durables
Power
Petroleum Products
Auto
Finance
Minerals/Mining
Oil
Gas
Non - Ferrous Metals
Nifty Dividend Opportunities 50 - Valuation Measures
Full market capitalisation (` Cr) 3,008,797.67
P/E 12.35
P/B 1.87
Dividend Yield 4.67
Source: www.nseindia.com
For scheme performance refer page 63-70. For Fund manager wise scheme performance refer page 71-74.
Please refer page no. 82 for explanation on symbol: ^ and @ wherever available
Company/Issuer % of Assets
Auto
Bajaj Auto Limited* 4.00
Hero MotoCorp Limited* 3.47
Consumer Non Durables
ITC Limited* 11.76
Hindustan Unilever Limited* 9.30
Colgate Palmolive (India) Limited 2.10
Finance
ICICI Prudential Life Insurance Company Limited 1.60
Muthoot Finance Limited 1.06
Gas
Petronet LNG Limited 2.15
Minerals/Mining
Coal India Limited 3.35
Non - Ferrous Metals
Vedanta Limited 1.90
Oil
Oil & Natural Gas Corporation Limited* 3.44
Company/Issuer % of Assets
Petroleum Products
Bharat Petroleum Corporation Limited 3.12
Indian Oil Corporation Limited 2.40
Hindustan Petroleum Corporation Limited 1.65
Power
NTPC Limited* 5.37
Power Grid Corporation of India Limited* 4.58
Software
Tata Consultancy Services Limited* 10.35
Infosys Limited* 10.17
Tech Mahindra Limited* 3.71
Telecom - Equipment & Accessories
Bharti Infratel Limited 2.22
Equity Less Than 1% of Corpus 11.39
Cash and Other Receivables 0.92
Grand Total 100.00
*Top 10 Holdings
Product Label
This product is suitable for investors who are seeking*:
Investors understand that their principalwill be at High risk
� Long term capital growth
� Investment in equity and equity related securities and portfolios replicating the composition of Nifty Dividend Opportunities 50 Index, subject to tracking errors.
*Investors should consult their financial advisors if in doubt about whether the product is suitable for them.

June 2020Fundamentals 47
Portfolio as on May 31, 2020
Nippon India ETF Infra BeES
Equity - ETF
Details as on May 31, 2020
Type of Scheme
An open ended index scheme listed on the Exchange in the form of an Exchange Traded Fund (ETF) tracking the Nifty Infrastructure Index
Current Investment Philosophy
The Scheme employs a passive investment approach designed to track the performance of Nifty Infrastructure TRI. The Scheme seeks to achieve this goal by investing in securities constituting the Nifty Infrastructure Index in same proportion as in the Index.
Date of Allotment
September 29, 2010
Fund Manager
Mehul Dama
Benchmark
Nifty Infrastructure Index TRI
Fund size
Monthly Average: ` 10.58 CrMonth End: ` 11.03 Cr
NAV as on May 29, 2020 ` 294.4097
Volatility Measures
Standard Deviation 6.67
Beta 0.97
Sharpe Ratio -0.06
Note: The above measures have been calculated using monthly rolling returns for 36 months period with 4.04% risk free return (FBIL Overnight MIBOR as on 29/05/2020).
Portfolio Turnover (Times) 0.81
Tracking Error@ 0.27%
Creation Unit Size 5,000 Units
Pricing (per unit)(approximately)
1/10th of Index
Exchange Listed NSE
NSE Symbol INFRABEES
ISIN INF732E01268
Bloomberg Code IBEES IS Equity
Reuters Code IFRB.NS
Total Expense Ratio^ 1.10
Load structure
Entry Load: NilExit Load: Nil
Industry Allocation
AMFI Classification
31.15%
12.83%
12.29%
11.45%
9.36%
5.22%
4.43%
3.02%
2.90%
1.98%
Petroleum Products
Cement
Telecom - Services
Construction Project
Power
Gas
Transportation
Oil
Auto
Auto Ancillaries
Nifty Infrastructure Index - Valuation Measures
Full market capitalisation (` Cr) 2,612,101.70
P/E 24.51
P/B 1.93
Dividend Yield 2.11
Source: www.nseindia.com
For scheme performance refer page 63-70. For Fund manager wise scheme performance refer page 71-74.
Please refer page no. 82 for explanation on symbol: ^ and @ wherever available
Company/Issuer % of Assets
Auto
Eicher Motors Limited 2.30
Auto Ancillaries
MRF Limited 1.23
Cement
UltraTech Cement Limited* 4.48
Shree Cement Limited* 2.76
Grasim Industries Limited 2.31
Ambuja Cements Limited 1.40
ACC Limited 1.07
Construction Project
Larsen & Toubro Limited* 11.45
Gas
Petronet LNG Limited 1.88
GAIL (India) Limited 1.70
Indraprastha Gas Limited 1.64
Healthcare Services
Apollo Hospitals Enterprise Limited 1.30
Oil
Oil & Natural Gas Corporation Limited* 3.02
Company/Issuer % of Assets
Petroleum Products
Reliance Industries Limited* 24.86
Bharat Petroleum Corporation Limited* 2.74
Indian Oil Corporation Limited 2.10
Hindustan Petroleum Corporation Limited 1.44
Power
NTPC Limited* 4.72
Power Grid Corporation of India Limited* 4.02
Telecom - Equipment & Accessories
Bharti Infratel Limited 1.95
Telecom - Services
Bharti Airtel Limited* 12.29
Transportation
Adani Ports and Special Economic Zone Limited* 2.49
Container Corporation of India Limited 1.03
Equity Less Than 1% of Corpus 5.60
Cash and Other Receivables 0.25
Grand Total 100.00
*Top 10 Holdings
Product Label
This product is suitable for investors who are seeking*:
Investors understand that their principalwill be at High risk
� Long-term capital appreciation
� Investment in Securities covered by Nifty Infrastructure Index
*Investors should consult their financial advisors if in doubt about whether the product is suitable for them.

June 202048 Fundamentals
Portfolio as on May 31, 2020
Nippon India ETF Bank BeES
Equity - ETF
Details as on May 31, 2020
Type of Scheme
An Open Ended Index Exchange Traded Scheme
Current Investment Philosophy
The Scheme employs a passive investment approach designed to track the performance of Nifty Bank TRI. The Scheme seeks to achieve this goal by investing in securities constituting the Nifty Bank Index in same proportion as in the Index.
Date of Allotment
May 27, 2004
Fund Manager
Vishal Jain
Benchmark
Nifty Bank TRI
Fund size
Monthly Average: ` 4,194.28 CrMonth End: ` 4,150.37 Cr
NAV as on May 29, 2020 ` 194.1890
Volatility MeasuresStandard Deviation 8.31Beta 0.98Sharpe Ratio -0.06
Note:The above measures have been calculated using monthly rolling returns for 36 months period with 4.04% risk free return (FBIL Overnight MIBOR as on 29/05/2020).
Portfolio Turnover (Times) 0.62
Tracking Error@ 0.49%
Creation Unit Size 10,000 units
Pricing (per unit)(approximately)
1/100th of index
Exchange Listed NSE, BSE
NSE Symbol BANKBEES
BSE Code 590106
ISIN INF204KB15I9
Bloomberg Code BBEES IS Equity
Reuters Code BBES.NS & BBES.BO
Total Expense Ratio^ 0.18
Load structure
Entry Load: NilExit Load: Nil
Dividend History
Record Date Rate (`/ Unit) Cum Dividend NAV Ex-Dividend NAV
20-Feb-15 13.0000 1,923.0249 1,910.0249
11-Mar-14 11.0000 1,220.3525 1,209.3525
14-Mar-13 18.0000 1,220.1859 1,202.1859
Past performance may or may not be sustained in future. Pursuant to dividend payment, NAV falls to the extent of payout & statutory levy (if applicable). Face Value - `1 wef. Dec 20, 2019 (Face Value- `10 till Dec 19, 2019).
Nifty Bank - Valuation Measures
Full market capitalisation (` Cr) 1,347,319.44
P/E 22.17
P/B 1.80
Dividend Yield 0.50
Source: www.nseindia.com
For scheme performance refer page 63-70. For Fund manager wise scheme performance refer page 71-74.
Please refer page no. 82 for explanation on symbol: ^ and @ wherever available
Company/Issuer % of Assets
Banks
HDFC Bank Limited* 32.57
ICICI Bank Limited* 19.65
Kotak Mahindra Bank Limited* 14.98
Axis Bank Limited* 12.71
State Bank of India* 10.19
IndusInd Bank Limited* 3.91
Bandhan Bank Limited* 1.51
The Federal Bank Limited* 1.47
Equity Less Than 1% of Corpus 2.97
Cash and Other Receivables 0.04
Grand Total 100.00
*Top 10 Holdings
Product Label
This product is suitable for investors who are seeking*:
Investors understand that their principalwill be at High risk
� Long-term capital appreciation
� Investment in Securities covered by Nifty Bank Index
*Investors should consult their financial advisors if in doubt about whether the product is suitable for them.
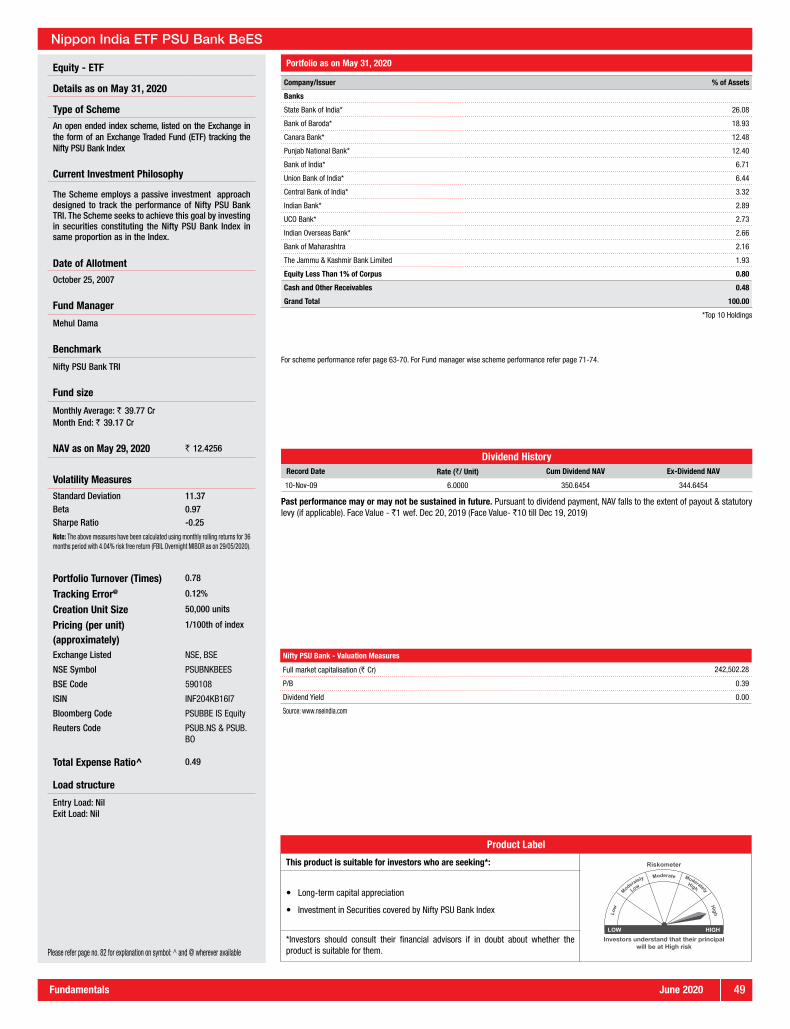
June 2020Fundamentals 49
Portfolio as on May 31, 2020
Nippon India ETF PSU Bank BeES
Equity - ETF
Details as on May 31, 2020
Type of Scheme
An open ended index scheme, listed on the Exchange in the form of an Exchange Traded Fund (ETF) tracking the Nifty PSU Bank Index
Current Investment Philosophy
The Scheme employs a passive investment approach designed to track the performance of Nifty PSU Bank TRI. The Scheme seeks to achieve this goal by investing in securities constituting the Nifty PSU Bank Index in same proportion as in the Index.
Date of Allotment
October 25, 2007
Fund Manager
Mehul Dama
Benchmark
Nifty PSU Bank TRI
Fund size
Monthly Average: ` 39.77 CrMonth End: ` 39.17 Cr
NAV as on May 29, 2020 ` 12.4256
Volatility Measures
Standard Deviation 11.37Beta 0.97Sharpe Ratio -0.25
Note: The above measures have been calculated using monthly rolling returns for 36 months period with 4.04% risk free return (FBIL Overnight MIBOR as on 29/05/2020).
Portfolio Turnover (Times) 0.78
Tracking Error@ 0.12%
Creation Unit Size 50,000 units
Pricing (per unit)(approximately)
1/100th of index
Exchange Listed NSE, BSE
NSE Symbol PSUBNKBEES
BSE Code 590108
ISIN INF204KB16I7
Bloomberg Code PSUBBE IS Equity
Reuters Code PSUB.NS & PSUB.BO
Total Expense Ratio^ 0.49
Load structure
Entry Load: NilExit Load: Nil
Dividend HistoryRecord Date Rate (`/ Unit) Cum Dividend NAV Ex-Dividend NAV
10-Nov-09 6.0000 350.6454 344.6454
Past performance may or may not be sustained in future. Pursuant to dividend payment, NAV falls to the extent of payout & statutory levy (if applicable). Face Value - `1 wef. Dec 20, 2019 (Face Value- `10 till Dec 19, 2019)
Nifty PSU Bank - Valuation Measures
Full market capitalisation (` Cr) 242,502.28
P/B 0.39
Dividend Yield 0.00
Source: www.nseindia.com
For scheme performance refer page 63-70. For Fund manager wise scheme performance refer page 71-74.
Please refer page no. 82 for explanation on symbol: ^ and @ wherever available
Company/Issuer % of Assets
Banks
State Bank of India* 26.08
Bank of Baroda* 18.93
Canara Bank* 12.48
Punjab National Bank* 12.40
Bank of India* 6.71
Union Bank of India* 6.44
Central Bank of India* 3.32
Indian Bank* 2.89
UCO Bank* 2.73
Indian Overseas Bank* 2.66
Bank of Maharashtra 2.16
The Jammu & Kashmir Bank Limited 1.93
Equity Less Than 1% of Corpus 0.80
Cash and Other Receivables 0.48
Grand Total 100.00
*Top 10 Holdings
Product Label
This product is suitable for investors who are seeking*:
Investors understand that their principalwill be at High risk
� Long-term capital appreciation
� Investment in Securities covered by Nifty PSU Bank Index
*Investors should consult their financial advisors if in doubt about whether the product is suitable for them.
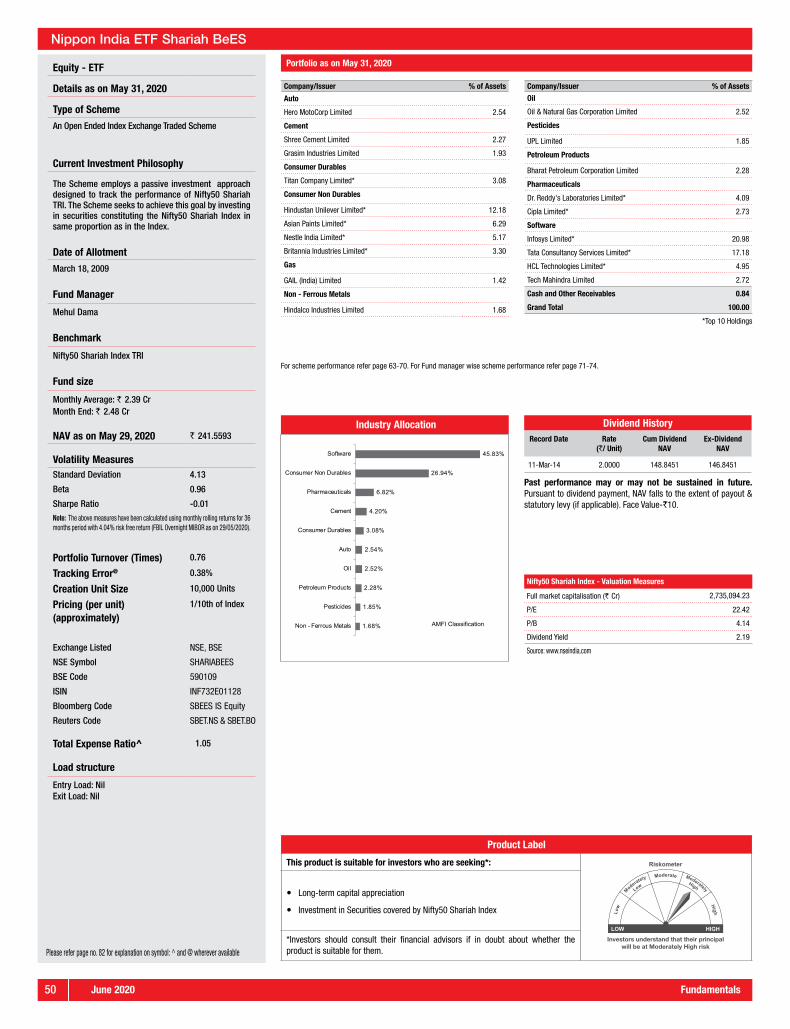
June 202050 Fundamentals
Portfolio as on May 31, 2020
Nippon India ETF Shariah BeES
Equity - ETF
Details as on May 31, 2020
Type of Scheme
An Open Ended Index Exchange Traded Scheme
Current Investment Philosophy
The Scheme employs a passive investment approach designed to track the performance of Nifty50 Shariah TRI. The Scheme seeks to achieve this goal by investing in securities constituting the Nifty50 Shariah Index in same proportion as in the Index.
Date of Allotment
March 18, 2009
Fund Manager
Mehul Dama
Benchmark
Nifty50 Shariah Index TRI
Fund size
Monthly Average: ` 2.39 CrMonth End: ` 2.48 Cr
NAV as on May 29, 2020 ` 241.5593
Volatility MeasuresStandard Deviation 4.13
Beta 0.96
Sharpe Ratio -0.01
Note: The above measures have been calculated using monthly rolling returns for 36 months period with 4.04% risk free return (FBIL Overnight MIBOR as on 29/05/2020).
Portfolio Turnover (Times) 0.76
Tracking Error@ 0.38%
Creation Unit Size 10,000 Units
Pricing (per unit)(approximately)
1/10th of Index
Exchange Listed NSE, BSE
NSE Symbol SHARIABEES
BSE Code 590109
ISIN INF732E01128
Bloomberg Code SBEES IS Equity
Reuters Code SBET.NS & SBET.BO
Total Expense Ratio^ 1.05
Load structure
Entry Load: NilExit Load: Nil
Industry Allocation
AMFI Classification
45.83%
26.94%
6.82%
4.20%
3.08%
2.54%
2.52%
2.28%
1.85%
1.68%
Software
Consumer Non Durables
Pharmaceuticals
Cement
Consumer Durables
Auto
Oil
Petroleum Products
Pesticides
Non - Ferrous Metals
Dividend HistoryRecord Date Rate
(`/ Unit)Cum Dividend
NAVEx-Dividend
NAV
11-Mar-14 2.0000 148.8451 146.8451
Past performance may or may not be sustained in future. Pursuant to dividend payment, NAV falls to the extent of payout & statutory levy (if applicable). Face Value-`10.
Nifty50 Shariah Index - Valuation Measures
Full market capitalisation (` Cr) 2,735,094.23
P/E 22.42
P/B 4.14
Dividend Yield 2.19
Source: www.nseindia.com
For scheme performance refer page 63-70. For Fund manager wise scheme performance refer page 71-74.
Please refer page no. 82 for explanation on symbol: ^ and @ wherever available
Company/Issuer % of Assets
Auto
Hero MotoCorp Limited 2.54
Cement
Shree Cement Limited 2.27
Grasim Industries Limited 1.93
Consumer Durables
Titan Company Limited* 3.08
Consumer Non Durables
Hindustan Unilever Limited* 12.18
Asian Paints Limited* 6.29
Nestle India Limited* 5.17
Britannia Industries Limited* 3.30
Gas
GAIL (India) Limited 1.42
Non - Ferrous Metals
Hindalco Industries Limited 1.68
Company/Issuer % of Assets
Oil
Oil & Natural Gas Corporation Limited 2.52
Pesticides
UPL Limited 1.85
Petroleum Products
Bharat Petroleum Corporation Limited 2.28
Pharmaceuticals
Dr. Reddy's Laboratories Limited* 4.09
Cipla Limited* 2.73
Software
Infosys Limited* 20.98
Tata Consultancy Services Limited* 17.18
HCL Technologies Limited* 4.95
Tech Mahindra Limited 2.72
Cash and Other Receivables 0.84
Grand Total 100.00
*Top 10 Holdings
Product Label
This product is suitable for investors who are seeking*:
Investors understand that their principalwill be at Moderately High risk
� Long-term capital appreciation
� Investment in Securities covered by Nifty50 Shariah Index
*Investors should consult their financial advisors if in doubt about whether the product is suitable for them.

June 2020Fundamentals 51
Portfolio as on May 31, 2020
Nippon India ETF Nifty Midcap 150
Equity - ETF
Details as on May 31, 2020
Type of Scheme
An Open Ended Index Exchange Traded Scheme
Current Investment Philosophy
The Scheme employs a passive investment approach designed to track the performance of Nifty Midcap 150 TRI. The Scheme seeks to achieve this goal by investing in securities constituting Nifty Midcap 150 Index in same proportion as in the Index.
Date of Allotment
January 31, 2019
Fund Manager
Mehul Dama
Benchmark
Nifty Midcap 150 TRI
Fund size
Monthly Average: ` 185.27 CrMonth End: ` 195.76 Cr
NAV as on May 29, 2020 ` 50.7156
Creation Unit Size 35,000 Units
Pricing (per unit)(approximately)
1/100th of Index
Exchange Listed NSE
NSE Symbol NETFMID150
ISIN INF204KB1V68
Bloomberg Code RENM150 IS Equity
Reuters Code NTFM.NS
Total Expense Ratio^ 0.24
Load structure
Entry Load: NilExit Load: Nil
Please refer page no. 82 for explanation on symbol: ^ and @ wherever available
Industry Allocation
AMFI Classification
12.01%
11.21%
7.72%
7.33%
7.26%
6.44%
6.04%
5.81%
4.87%
4.34%
Pharmaceuticals
Finance
Consumer Non Durables
Industrial Products
Consumer Durables
Auto Ancillaries
Software
Banks
Gas
Power
Nifty Midcap 150 Index - Valuation Measures
Full market capitalisation (` Cr) 1,885,259.80
P/E 21.90
P/B 2.29
Dividend Yield 1.26
Source: www.nseindia.com
Company/Issuer % of Assets
Auto Ancillaries
MRF Limited* 1.75
Balkrishna Industries Limited 1.22
Exide Industries Limited 1.04
Banks
City Union Bank Limited 1.38
The Federal Bank Limited 1.24
Cement
The Ramco Cements Limited 1.12
Chemicals
Aarti Industries Limited 1.20
Atul Limited 1.01
Consumer Durables
Voltas Limited* 1.54
Crompton Greaves Consumer Electricals Limited 1.29
Bata India Limited 1.11
Consumer Non Durables
Tata Consumer Products Limited* 2.12
Jubilant Foodworks Limited* 1.76
Finance
Muthoot Finance Limited 1.30
Max Financial Services Limited 1.29
Sundaram Finance Limited 1.19
REC Limited 1.14
LIC Housing Finance Limited 1.01
Gas
Indraprastha Gas Limited* 2.29
Company/Issuer % of Assets
Healthcare Services
Apollo Hospitals Enterprise Limited* 1.81
Industrial Capital Goods
Bharat Electronics Limited 1.03
Industrial Products
SRF Limited 1.33
Bharat Forge Limited 1.14
Pesticides
PI Industries Limited* 1.45
Pharmaceuticals
Torrent Pharmaceuticals Limited* 1.61
IPCA Laboratories Limited 1.41
Alkem Laboratories Limited 1.27
Abbott India Limited 1.22
Power
Adani Green Energy Limited 1.35
Retailing
Trent Limited* 1.46
Software
Info Edge (India) Limited* 2.59
MphasiS Limited 1.07
Larsen & Toubro Infotech Limited 1.04
Equity Less Than 1% of Corpus 53.99
Cash and Other Receivables 0.23
Grand Total 100.00
*Top 10 Holdings
Product Label
This product is suitable for investors who are seeking*:
Investors understand that their principalwill be at Moderately High risk
� Long term capital growth
� Investment in equity and equity related securities and portfolios replicating the composition of Nifty Midcap 150 Index, subject to tracking errors
*Investors should consult their financial advisors if in doubt about whether the product is suitable for them.
For scheme performance refer page 63-70. For Fund manager wise scheme performance refer page 71-74.
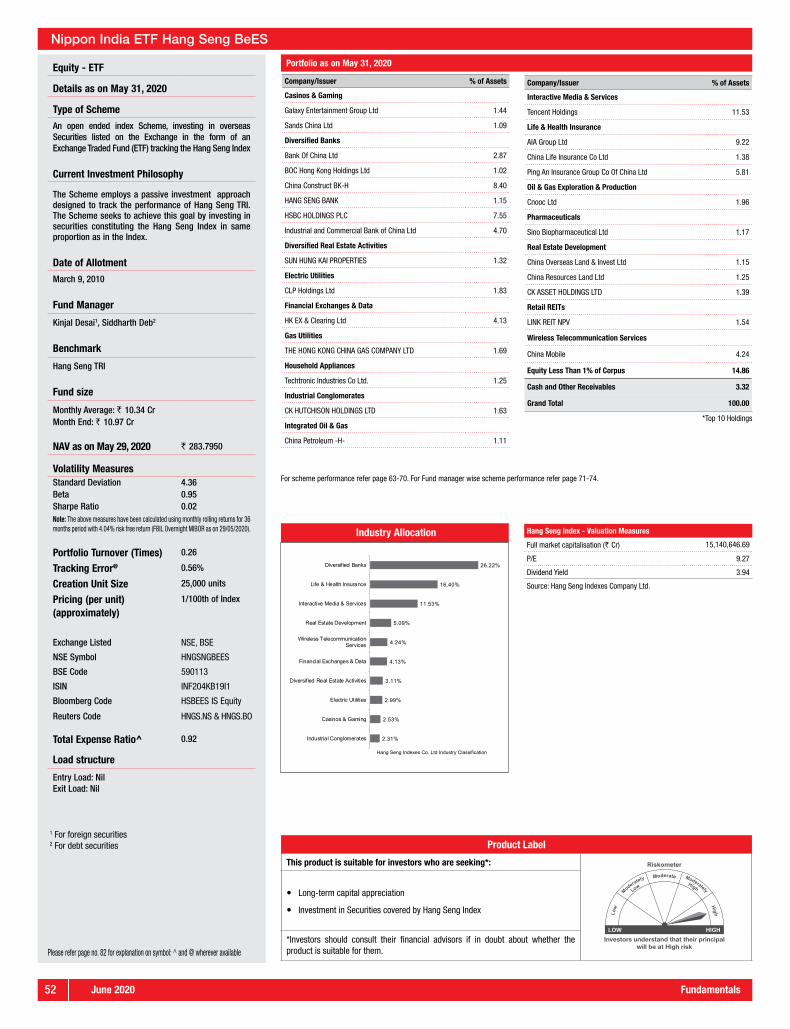
June 202052 Fundamentals
Portfolio as on May 31, 2020
Nippon India ETF Hang Seng BeES
Equity - ETF
Details as on May 31, 2020
Type of Scheme
An open ended index Scheme, investing in overseas Securities listed on the Exchange in the form of an Exchange Traded Fund (ETF) tracking the Hang Seng Index
Current Investment Philosophy
The Scheme employs a passive investment approach designed to track the performance of Hang Seng TRI. The Scheme seeks to achieve this goal by investing in securities constituting the Hang Seng Index in same proportion as in the Index.
Date of Allotment
March 9, 2010
Fund Manager
Kinjal Desai1, Siddharth Deb2
Benchmark
Hang Seng TRI
Fund size
Monthly Average: ` 10.34 CrMonth End: ` 10.97 Cr
NAV as on May 29, 2020 ` 283.7950
Volatility MeasuresStandard Deviation 4.36Beta 0.95Sharpe Ratio 0.02Note: The above measures have been calculated using monthly rolling returns for 36 months period with 4.04% risk free return (FBIL Overnight MIBOR as on 29/05/2020).
Portfolio Turnover (Times) 0.26
Tracking Error@ 0.56%
Creation Unit Size 25,000 units
Pricing (per unit)(approximately)
1/100th of Index
Exchange Listed NSE, BSE
NSE Symbol HNGSNGBEES
BSE Code 590113
ISIN INF204KB19I1
Bloomberg Code HSBEES IS Equity
Reuters Code HNGS.NS & HNGS.BO
Total Expense Ratio^ 0.92
Load structure
Entry Load: NilExit Load: Nil
1 For foreign securities 2 For debt securities
Industry Allocation
Hang Seng Indexes Co. Ltd Industry Classification
26.22%
16.40%
11.53%
5.09%
4.24%
4.13%
3.11%
2.99%
2.53%
2.31%
Diversified Banks
Life & Health Insurance
Interactive Media & Services
Real Estate Development
Wireless TelecommunicationServices
Financial Exchanges & Data
Diversified Real Estate Activities
Electric Utilities
Casinos & Gaming
Industrial Conglomerates
Hang Seng Index - Valuation Measures
Full market capitalisation (` Cr) 15,140,646.69
P/E 9.27
Dividend Yield 3.94
Source: Hang Seng Indexes Company Ltd.
For scheme performance refer page 63-70. For Fund manager wise scheme performance refer page 71-74.
Please refer page no. 82 for explanation on symbol: ^ and @ wherever available
Company/Issuer % of Assets
Casinos & Gaming
Galaxy Entertainment Group Ltd 1.44
Sands China Ltd 1.09
Diversified Banks
Bank Of China Ltd 2.87
BOC Hong Kong Holdings Ltd 1.02
China Construct BK-H 8.40
HANG SENG BANK 1.15
HSBC HOLDINGS PLC 7.55
Industrial and Commercial Bank of China Ltd 4.70
Diversified Real Estate Activities
SUN HUNG KAI PROPERTIES 1.32
Electric Utilities
CLP Holdings Ltd 1.83
Financial Exchanges & Data
HK EX & Clearing Ltd 4.13
Gas Utilities
THE HONG KONG CHINA GAS COMPANY LTD 1.69
Household Appliances
Techtronic Industries Co Ltd. 1.25
Industrial Conglomerates
CK HUTCHISON HOLDINGS LTD 1.63
Integrated Oil & Gas
China Petroleum -H- 1.11
Company/Issuer % of Assets
Interactive Media & Services
Tencent Holdings 11.53
Life & Health Insurance
AIA Group Ltd 9.22
China Life Insurance Co Ltd 1.38
Ping An Insurance Group Co Of China Ltd 5.81
Oil & Gas Exploration & Production
Cnooc Ltd 1.96
Pharmaceuticals
Sino Biopharmaceutical Ltd 1.17
Real Estate Development
China Overseas Land & Invest Ltd 1.15
China Resources Land Ltd 1.25
CK ASSET HOLDINGS LTD 1.39
Retail REITs
LINK REIT NPV 1.54
Wireless Telecommunication Services
China Mobile 4.24
Equity Less Than 1% of Corpus 14.86
Cash and Other Receivables 3.32
Grand Total 100.00
*Top 10 Holdings
Product Label
This product is suitable for investors who are seeking*:
Investors understand that their principalwill be at High risk
� Long-term capital appreciation
� Investment in Securities covered by Hang Seng Index
*Investors should consult their financial advisors if in doubt about whether the product is suitable for them.

June 2020Fundamentals 53
Nippon India ETF Sensex Next 50
Equity - ETF
Details as on May 31, 2020
Type of Scheme
An Open ended Index Exchange Traded Fund
Current Investment Philosophy
The Scheme employs a passive investment approach designed to track the performance of S&P BSE Sensex Next 50 TRI. The Scheme seeks to achieve this goal by investing in securities constituting the S&P BSE Sensex Next 50 Index in same proportion as in the Index.
Date of Allotment
July 30, 2019
Fund Manager
Mehul Dama
Benchmark
S&P BSE Sensex Next 50 TRI
Fund size
Monthly Average: ` 9.74 CrMonth End: ` 10.12 Cr
NAV as on May 29, 2020 ` 26.1256
Creation Unit Size 110,000 Units
Pricing (per unit)(approximately)
1/1000th of Index
Exchange Listed BSE
BSE Symbol NETFSNX150
BSE Code 542747
ISIN INF204KB15D0
Bloomberg Code RESENN50 IB Equity
Reuters Code NIPN.BO
Total Expense Ratio^ 0.25
Load structure
Entry Load: NilExit Load: Nil
Portfolio as on May 31, 2020
Since the fund has not completed one year, the scheme performance has not been provided.
Please refer page no. 82 for explanation on symbol: ^ and @ wherever available
Company/Issuer % of AssetsAutoAutoTVS Motor Company Limited 1.05Auto AncillariesMRF Limited 1.93Motherson Sumi Systems Limited 1.80Bosch Limited 1.31Exide Industries Limited 1.18BanksThe Federal Bank Limited 1.40CementShree Cement Limited 2.94Ambuja Cements Limited 2.21ACC Limited 1.69ChemicalsPidilite Industries Limited* 3.55Consumer DurablesHavells India Limited 1.95Voltas Limited 1.72Crompton Greaves Consumer Electricals Limited 1.46Consumer Non DurablesTata Consumer Products Limited* 3.51Colgate Palmolive (India) Limited 2.92Marico Limited 2.79FinanceHDFC Life Insurance Company Limited* 4.13SBI Life Insurance Company Limited* 3.98ICICI Prudential Life Insurance Company Limited 2.22Piramal Enterprises Limited 1.82Bajaj Holdings & Investment Limited 1.61Shriram Transport Finance Company Limited 1.51REC Limited 1.29LIC Housing Finance Limited 1.14
Company/Issuer % of AssetsGasPetronet LNG Limited* 2.99Indraprastha Gas Limited 2.59Healthcare ServicesApollo Hospitals Enterprise Limited 1.93Industrial Capital GoodsSiemens Limited 1.52Industrial ProductsBharat Forge Limited 1.29Minerals/MiningNMDC Limited 1.09Petroleum ProductsHindustan Petroleum Corporation Limited 2.27PharmaceuticalsDivi's Laboratories Limited* 4.79Aurobindo Pharma Limited* 3.29Lupin Limited* 3.27Biocon Limited 2.47PowerTata Power Company Limited 1.04RetailingAvenue Supermarts Limited* 3.77SoftwareInfo Edge (India) Limited 2.92Telecom - Equipment & AccessoriesBharti Infratel Limited* 3.07Textile ProductsPage Industries Limited 1.71TransportationContainer Corporation of India Limited 1.63InterGlobe Aviation Limited 1.46Equity Less Than 1% of Corpus 5.56Cash and Other Receivables 0.23Grand Total 100.00
*Top 10 Holdings
Product Label
This product is suitable for investors who are seeking*:
Investors understand that their principalwill be at Moderately High risk
� Long term capital appreciation
� Investment in equity and equity related securities and portfolios replicating the composition of S&P BSE SENSEX Next 50 Index, subject to tracking errors
*Investors should consult their financial advisors if in doubt about whether the product is suitable for them.
S&P BSE Sensex Next 50 Index - Valuation Measures
Full market capitalisation (` Cr) 1,620,781.41
P/E 19.51
P/B 2.09
Dividend Yield 1.61
Source: www.bseindia.com
Industry Allocation
AMFI Classification
18.97%
13.83%
9.22%
6.84%
6.21%
5.59%
5.13%
3.77%
3.55%
3.36%
Finance
Pharmaceuticals
Consumer Non Durables
Cement
Auto Ancillaries
Gas
Consumer Durables
Retailing
Chemicals
Banks

June 202054 Fundamentals
Portfolio as on May 31, 2020
CPSE ETF
Equity - ETF
Details as on May 31, 2020
Type of Scheme
An Open Ended Index Exchange Traded Scheme
Current Investment Philosophy
The Scheme employs a passive investment approach designed to track the performance of Nifty CPSE TRI. The Scheme seeks to achieve this goal by investing in securities constituting the Nifty CPSE Index in same proportion as in the Index.
Date of Allotment
March 28, 2014
Fund Manager
Vishal Jain
Benchmark
Nifty CPSE TRI
Fund size
Monthly Average: ` 10,230.71 CrMonth End: ` 10,656.96 Cr
NAV as on May 29, 2020 ` 17.2882
Volatility MeasuresStandard Deviation 6.63Beta 0.97Sharpe Ratio -0.23
Note: The above measures have been calculated using monthly rolling returns for 36 months period with 4.04% risk free return (FBIL Overnight MIBOR as on 29/05/2020).
Portfolio Turnover (Times) 2.26
Tracking Error@ 0.60%
Creation Unit Size 100,000 Units
Pricing (per unit)(approximately)
1/100th of Index
Exchange Listed NSE, BSE
NSE Symbol CPSEETF
BSE Code 538057
ISIN INF457M01133
Bloomberg Code CPSEBE IS Equity
Reuters Code GOMS.NS & GOMS.BO
Total Expense Ratio^ 0.0095
Load structure
Entry Load: NilExit Load: Nil
Industry Allocation
AMFI Classification
42.16%
26.37%
24.02%
6.48%
0.84%
Power
Oil
Minerals/Mining
Industrial Capital Goods
Construction
Nifty CPSE Index - Valuation Measures
Full market capitalisation (` Cr) 461,709.06
P/E 7.32
P/B 0.97
Dividend Yield 7.10
Source: www.nseindia.com
For scheme performance refer page 63-70. For Fund manager wise scheme performance refer page 71-74.
Please refer page no. 82 for explanation on symbol: ^ and @ wherever available
Company/Issuer % of Assets
Industrial Capital Goods
Bharat Electronics Limited* 5.89
Minerals/Mining
Coal India Limited* 18.49
NMDC Limited* 5.53
Oil
Oil & Natural Gas Corporation Limited* 24.11
Oil India Limited* 2.26
Company/Issuer % of Assets
Power
NTPC Limited* 19.35
Power Grid Corporation of India Limited* 17.69
NHPC Limited* 3.60
Equity Less Than 1% of Corpus 2.95
Cash and Other Receivables 0.13
Grand Total 100.00
*Top 10 Holdings
Product Label
This product is suitable for investors who are seeking*:
Investors understand that their principalwill be at High risk
� Long term capital appreciation
� Investment in Securities covered by the Nifty CPSE Index
*Investors should consult their financial advisors if in doubt about whether the product is suitable for them.

June 2020Fundamentals 55
Portfolio as on October 31, 2019
Nippon India ETF Long Term Gilt
For scheme performance refer page 63-70. For Fund manager wise scheme performance refer page 71-74.
Fixed Income - ETFDetails as on May 31, 2020Type of SchemeAn open ended Index Exchange Traded FundCurrent Investment PhilosophyThe Scheme employs a passive investment approach designed to track the performance of Nifty 8-13 yr G-Sec Index. The Scheme seeks to achieve this goal by investing in securities constituting Nifty 8-13 yr G Sec Index in same proportion as in the Index.
Date of AllotmentJuly 5, 2016
Fund ManagerPrashant Pimple
Benchmark Nifty 8-13 yr G-Sec Index
Fund sizeMonthly Average: ` 8.75 CrMonth End: ` 9.79 CrNAV as on May 29, 2020 ` 21.6712
Tracking Error@ 1.17%
Creation Unit Size 250,000 Units
Pricing (per unit)(approximately) 1/100th of Index
Exchange Listed NSENSE Symbol NETFLTGILT
ISIN INF204KB1882Bloomberg Code RELGILT IS EquityReuters Code NTFL.NS
Average Maturity 9.48 YearsModified Duration 6.86 YearsYield to Maturity* 5.94%
Total Expense Ratio^ 0.10%
Load structureEntry Load: NilExit Load: Nil*excluding other receivablesYTM including other receivables: 6.26%
Nippon India ETF Liquid BeES
Fixed Income - ETF
Details as on May 31, 2020
Type of SchemeAn open ended liquid scheme, listed on the Exchange in the form of an ETF, investing in Tri-Party Repo/Repo & Reverse Repo with daily Dividend and compulsory reinvestment of DividendCurrent Investment PhilosophyAll investments of the scheme would be in Tri-Party Repo, Repos, Reserve Repos and other Money Market Instruments.
Date of AllotmentJuly 8, 2003
Fund ManagerSiddharth Deb
Benchmark Nifty 1D Rate Index
Fund sizeMonthly Average: ` 2,908.90 CrMonth End: ` 2,913.10 Cr
NAV as on May 31, 2020 ` 1,000.0000
Creation Unit Size 2500 Units
Exchange Listed NSE, BSENSE Symbol LIQUIDBEESBSE Code 590096ISIN INF732E01037Bloomberg Code LBEES IS EquityReuters Code LBES.NS & LBES.BOAverage Maturity 1.25 Days
Modified Duration 0.24 Days
Total Expense Ratio^ 0.76%
Load structureEntry Load: NilExit Load: Nil
Portfolio as on May 31, 2020
For scheme performance refer page 63-70. For Fund manager wise scheme performance refer page 71-74.
Please refer page no. 82 for explanation on symbol: ^ and @ wherever available
Please refer page no. 82 for explanation on symbol: ^ and @ wherever available
Asset Allocation
Cash & Other Receivables, 1.91%
Government Bond, 98.09%
Rating Profile
AAA/SOV/A1+/Cash & Other Receivables, 100.00%
Rating Profile
AAA/SOV/A1+/Cash & Other Receivables, 100%
Company/Issuer % of Assets
Tri-Party Repo 99.18
Cash & Other Receivables 0.82
Grand Total 100.00
Portfolio as on May 31, 2020
Holding Rating Asset(%)Government Bond 98.097.88% GOI (MD 19/03/2030) SOV 10.60
6.79% GOI (MD 26/12/2029) SOV 14.03
6.68% GOI (MD 17/09/2031) SOV 11.34
Holding Rating Asset(%)7.26% GOI (MD 14/01/2029) SOV 20.25
6.45% GOI (MD 07/10/2029) Sov 41.87
Cash and Other Receivables 1.91Grand Total 100.00
Product Label
This product is suitable for investors who are seeking*:
Investors understand that their principalwill be at Moderate risk
� Income over long term
� Investments in Gilt Securities replicating the composition of Nifty 8-13 yr G-Sec Index, subject to tracking errors
*Investors should consult their financial advisors if in doubt about whether the product is suitable for them.
Product Label
This product is suitable for investors who are seeking*:
Investors understand that their principalwill be at Low risk
� Current Income with high degree of liquidity
� Investment in Tri-Party Repo/Repo & Reverse Repo predominantly & Money Market Instruments.
*Investors should consult their financial advisors if in doubt about whether the product is suitable for them.
Asset Allocation
Cash & Other Receivables, 0.82%
Tri-Party Repo, 99.18%

June 202056 Fundamentals
Portfolio as on May 31, 2020
Nippon India Gold Savings Fund
For SIP performance refer page 61. For scheme performance refer page 63-70. For Fund manager wise scheme performance refer page 71-74.
Gold - FOFDetails as on May 31, 2020Type of SchemeAn open ended Fund of Fund SchemeCurrent Investment PhilosophyThe Scheme employs an investment approach designed to track the performance of Nippon India ETF Gold BeES. The Scheme seeks to achieve this goal by investing in Nippon India ETF Gold BeES.Date of AllotmentMarch 7, 2011
Fund ManagerMehul Dama
Benchmark Domestic Prices of GoldFund sizeMonthly Average: ` 940.48 CrMonth End: ` 952.46 Cr
NAV as on May 29, 2020Growth Plan ` 19.2875Dividend Plan ` 19.2875Direct - Growth Plan ` 19.9043Direct - Dividend Plan ` 19.9043Total Expense Ratio^
(expense ratio including the underlying fund)Regular/Other than Direct: 1.30Direct: 0.89Load structureEntry Load: Nil
Exit Load: 1% If redeemed or switched out on or before completion of 15 days from the date of allotment of units. Nil, thereafter; wef Apr 27, 2020
Product Label
This product is suitable for investors who are seeking*:
Investors understand that their principalwill be at Moderately High risk
• Portfolio diversification through asset allocation
• Investment in physical gold
*Investors should consult their financial advisors if in doubt about whether the product is suitable for them.
Portfolio as on May 31, 2020
Nippon India ETF Gold BeES
For scheme performance refer page 63-70. For Fund manager wise scheme performance refer page 71-74.
Gold - ETFDetails as on May 31, 2020Type of SchemeAn open ended scheme, listed on the Exchange in the form of an Exchange Traded Fund (ETF) investing in physical gold
Current Investment PhilosophyThe Scheme employs an investment approach designed to track the performance of physical gold. The Scheme seeks to achieve this goal by investing in physical gold and gold related securities.
Date of AllotmentMarch 8, 2007Fund ManagerMehul Dama
Benchmark Domestic Prices of Gold
Fund sizeMonthly Average: ` 3,845.26 CrMonth End: ` 3,996.36 Cr
NAV as on May 29, 2020 ` 41.5293
Portfolio Turnover (Times) 0.15Tracking Error@ 0.08%
Creation Unit Size 100,000 units
Pricing (per unit)(approximately)
Approx 0.01 Gram of Gold
Exchange Listed NSE, BSENSE Symbol GOLDBEESBSE Code 590095ISIN INF204KB17I5Bloomberg Code GBEES IS EquityReuters Code GBES.NS,GBES.BO
Total Expense Ratio^ 0.79Load structureEntry Load: NilExit Load: Nil
Volatility MeasuresStandard Deviation 3.41 Beta 0.97 Sharpe Ratio 0.29
Note: The above measures have been calculated using monthly rolling returns for 36 months period with 4.04% risk free return (FBIL Overnight MIBOR as on 29/05/2020).
Volatility MeasuresStandard Deviation 3.56 Beta 0.94 Sharpe Ratio 0.26
Note: The above measures have been calculated using monthly rolling returns for 36 months period with 4.04% risk free return (FBIL Overnight MIBOR as on 29/05/2020).
Please refer page no. 82 for explanation on symbol: ^ and @ wherever available
Please refer page no. 82 for explanation on symbol: ^ and @ wherever available
Special Feature: Nippon India Any Time Money Card
Company/Issuer % of Assets
Others 99.50
Gold 99.50
Cash and Other Receivables 0.50
Grand Total 100.00
Company/Issuer % of Assets
Others 99.82
Nippon India ETF Gold Bees 99.82
Cash and Other Receivables 0.18
Grand Total 100.00
Product Label
This product is suitable for investors who are seeking*:
Investors understand that their principalwill be at Moderately High risk
� Long term capital growth
� Returns that are commensurate with the performance of Nippon India ETF Gold BeES through investment in securities of Nippon India ETF Gold BeES
*Investors should consult their financial advisors if in doubt about whether the product is suitable for them.
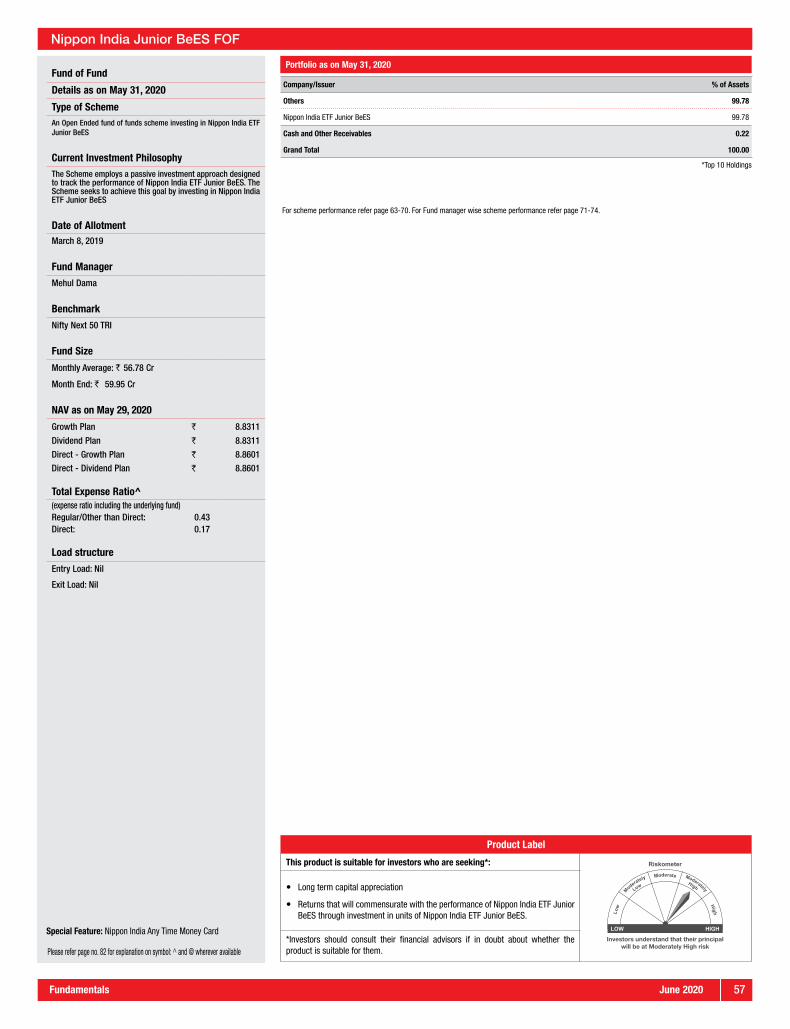
June 2020Fundamentals 57
Nippon India Junior BeES FOF
Fund of Fund
Details as on May 31, 2020
Type of SchemeAn Open Ended fund of funds scheme investing in Nippon India ETF Junior BeES
Current Investment PhilosophyThe Scheme employs a passive investment approach designed to track the performance of Nippon India ETF Junior BeES. The Scheme seeks to achieve this goal by investing in Nippon India ETF Junior BeES
Date of AllotmentMarch 8, 2019
Fund Manager
Mehul Dama
Benchmark
Nifty Next 50 TRI
Fund Size
Monthly Average: ` 56.78 Cr
Month End: ` 59.95 Cr
NAV as on May 29, 2020
Growth Plan ` 8.8311
Dividend Plan ` 8.8311
Direct - Growth Plan ` 8.8601
Direct - Dividend Plan ` 8.8601
Total Expense Ratio^(expense ratio including the underlying fund)Regular/Other than Direct: 0.43Direct: 0.17
Load structure
Entry Load: Nil
Exit Load: Nil
Portfolio as on May 31, 2020
Please refer page no. 82 for explanation on symbol: ^ and @ wherever available
Company/Issuer % of Assets
Others 99.78
Nippon India ETF Junior BeES 99.78
Cash and Other Receivables 0.22
Grand Total 100.00
*Top 10 Holdings
Special Feature: Nippon India Any Time Money Card
Product Label
This product is suitable for investors who are seeking*:
Investors understand that their principalwill be at Moderately High risk
� Long term capital appreciation
� Returns that will commensurate with the performance of Nippon India ETF Junior BeES through investment in units of Nippon India ETF Junior BeES.
*Investors should consult their financial advisors if in doubt about whether the product is suitable for them.
For scheme performance refer page 63-70. For Fund manager wise scheme performance refer page 71-74.
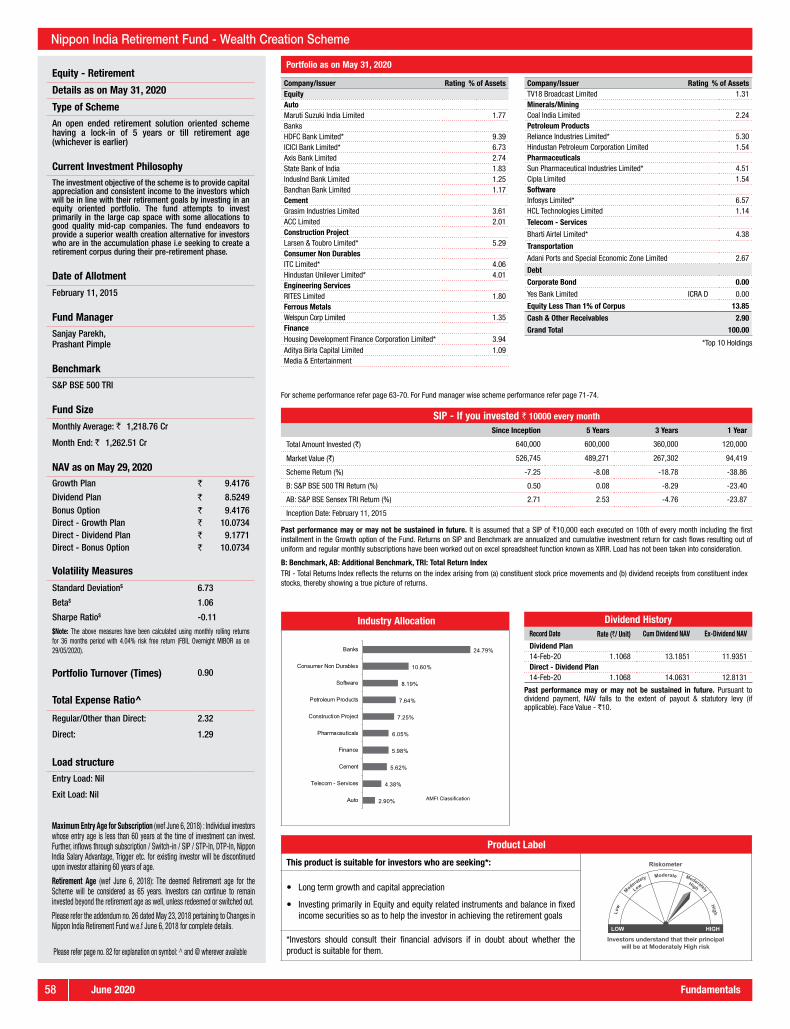
June 202058 Fundamentals
Equity - Retirement
Details as on May 31, 2020
Type of Scheme
An open ended retirement solution oriented scheme having a lock-in of 5 years or till retirement age (whichever is earlier)
Current Investment PhilosophyThe investment objective of the scheme is to provide capital appreciation and consistent income to the investors which will be in line with their retirement goals by investing in an equity oriented portfolio. The fund attempts to invest primarily in the large cap space with some allocations to good quality mid-cap companies. The fund endeavors to provide a superior wealth creation alternative for investors who are in the accumulation phase i.e seeking to create a retirement corpus during their pre-retirement phase.
Date of Allotment
February 11, 2015
Fund Manager
Sanjay Parekh, Prashant Pimple
Benchmark
S&P BSE 500 TRI
Fund Size
Monthly Average: ` 1,218.76 Cr
Month End: ` 1,262.51 Cr
NAV as on May 29, 2020Growth Plan ` 9.4176
Dividend Plan ` 8.5249Bonus Option ` 9.4176Direct - Growth Plan ` 10.0734Direct - Dividend Plan ` 9.1771Direct - Bonus Option ` 10.0734
Volatility Measures
Standard Deviation$ 6.73
Beta$ 1.06
Sharpe Ratio$ -0.11
$Note: The above measures have been calculated using monthly rolling returns for 36 months period with 4.04% risk free return (FBIL Overnight MIBOR as on 29/05/2020).
Portfolio Turnover (Times) 0.90
Total Expense Ratio^
Regular/Other than Direct: 2.32
Direct: 1.29
Load structure
Entry Load: Nil
Exit Load: Nil
Portfolio as on May 31, 2020
Industry Allocation
AMFI Classification
24.79%
10.60%
8.19%
7.64%
7.25%
6.05%
5.98%
5.62%
4.38%
2.90%
Banks
Consumer Non Durables
Software
Petroleum Products
Construction Project
Pharmaceuticals
Finance
Cement
Telecom - Services
Auto
Nippon India Retirement Fund - Wealth Creation Scheme
For scheme performance refer page 63-70. For Fund manager wise scheme performance refer page 71-74.
Please refer page no. 82 for explanation on symbol: ^ and @ wherever available
Maximum Entry Age for Subscription (wef June 6, 2018) : Individual investors whose entry age is less than 60 years at the time of investment can invest. Further, inflows through subscription / Switch-in / SIP / STP-In, DTP-In, Nippon India Salary Advantage, Trigger etc. for existing investor will be discontinued upon investor attaining 60 years of age.
Retirement Age (wef June 6, 2018): The deemed Retirement age for the Scheme will be considered as 65 years. Investors can continue to remain invested beyond the retirement age as well, unless redeemed or switched out.
Please refer the addendum no. 26 dated May 23, 2018 pertaining to Changes in Nippon India Retirement Fund w.e.f June 6, 2018 for complete details.
Company/Issuer Rating % of AssetsEquityAutoMaruti Suzuki India Limited 1.77BanksHDFC Bank Limited* 9.39ICICI Bank Limited* 6.73Axis Bank Limited 2.74State Bank of India 1.83IndusInd Bank Limited 1.25Bandhan Bank Limited 1.17CementGrasim Industries Limited 3.61ACC Limited 2.01Construction ProjectLarsen & Toubro Limited* 5.29Consumer Non DurablesITC Limited* 4.06Hindustan Unilever Limited* 4.01Engineering ServicesRITES Limited 1.80Ferrous MetalsWelspun Corp Limited 1.35FinanceHousing Development Finance Corporation Limited* 3.94Aditya Birla Capital Limited 1.09Media & Entertainment
Company/Issuer Rating % of AssetsTV18 Broadcast Limited 1.31Minerals/MiningCoal India Limited 2.24Petroleum ProductsReliance Industries Limited* 5.30Hindustan Petroleum Corporation Limited 1.54PharmaceuticalsSun Pharmaceutical Industries Limited* 4.51Cipla Limited 1.54SoftwareInfosys Limited* 6.57HCL Technologies Limited 1.14Telecom - Services
Bharti Airtel Limited* 4.38
Transportation
Adani Ports and Special Economic Zone Limited 2.67
Debt
Corporate Bond 0.00
Yes Bank Limited ICRA D 0.00
Equity Less Than 1% of Corpus 13.85
Cash & Other Receivables 2.90
Grand Total 100.00
*Top 10 Holdings
Product Label
This product is suitable for investors who are seeking*:
Investors understand that their principalwill be at Moderately High risk
� Long term growth and capital appreciation
� Investing primarily in Equity and equity related instruments and balance in fixed income securities so as to help the investor in achieving the retirement goals
*Investors should consult their financial advisors if in doubt about whether the product is suitable for them.
SIP - If you invested ` 10000 every monthSince Inception 5 Years 3 Years 1 Year
Total Amount Invested (`) 640,000 600,000 360,000 120,000
Market Value (`) 526,745 489,271 267,302 94,419
Scheme Return (%) -7.25 -8.08 -18.78 -38.86
B: S&P BSE 500 TRI Return (%) 0.50 0.08 -8.29 -23.40
AB: S&P BSE Sensex TRI Return (%) 2.71 2.53 -4.76 -23.87
Inception Date: February 11, 2015
Past performance may or may not be sustained in future. It is assumed that a SIP of `10,000 each executed on 10th of every month including the first installment in the Growth option of the Fund. Returns on SIP and Benchmark are annualized and cumulative investment return for cash flows resulting out of uniform and regular monthly subscriptions have been worked out on excel spreadsheet function known as XIRR. Load has not been taken into consideration.
B: Benchmark, AB: Additional Benchmark, TRI: Total Return IndexTRI - Total Returns Index reflects the returns on the index arising from (a) constituent stock price movements and (b) dividend receipts from constituent index stocks, thereby showing a true picture of returns.
Dividend HistoryRecord Date Rate (`/ Unit) Cum Dividend NAV Ex-Dividend NAV
Dividend Plan14-Feb-20 1.1068 13.1851 11.9351Direct - Dividend Plan14-Feb-20 1.1068 14.0631 12.8131
Past performance may or may not be sustained in future. Pursuant to dividend payment, NAV falls to the extent of payout & statutory levy (if applicable). Face Value - `10.

June 2020Fundamentals 59
Asset Allocation
Cash & Other Receivables, 3.85%
Equity, 10.98%
Government Bond, 85.16%
Fixed Income - Retirement
Details as on May 31, 2020
Type of Scheme
An open ended retirement solution oriented scheme having a lock-in of 5 years or till retirement age (whichever is earlier)
Current Investment PhilosophyThe investment objective of the scheme is to provide capital appreciation and consistent income to the investors which will be in line with their retirement goals by investing in fixed income oriented portfolio with a low to moderate exposure (upto 30%) in equities. Thus the fund attempts to generate potentially higher returns by combining stability of fixed income along with growth possibilities of equities. On the fixed income allocation the fund will attempt to have an optimal blend of duration and accruals with investments in high quality instruments. The equity portolio will be invested pre-dominantly in large cap companies with tactical allocation to mid cap stocks. The fund is well suited for investors in the post -retirement phase seeking regular income with lower volatility.
Date of AllotmentFebruary 11, 2015
Fund ManagerSanjay Parekh, Prashant Pimple
Benchmark80% of CRISIL Long Term Debt Index +20% of S&P BSE 500 TRI
Fund SizeMonthly Average: ` 246.86 Cr
Month End: ` 249.39 Cr
NAV as on May 29, 2020Growth Plan ` 13.7678Dividend Plan ` 13.7698Bonus Option ` 13.7680Direct - Growth Plan ` 14.7642Direct - Dividend Plan ` 14.7642Direct - Bonus Option ` 14.7642
Average Maturity 21.64 Years
Modified Duration 10.44 Years
Yield to Maturity* 6.43%
Total Expense Ratio^Regular/Other than Direct: 2.19%
Direct: 1.25%
Load structureEntry Load: Nil
Exit Load: Nil
*excluding other receivablesYTM including other receivables: 6.43%
Average Maturity, Modified Duration & YTM details provided for Debt portion of Portfolio only.
Industry Allocation (Equity Portion)
AMFI Classification
4.22%
1.13%
0.88%
0.87%
0.76%
0.65%
0.47%
0.47%
0.46%
0.40%
Banks
Software
Pharmaceuticals
Petroleum Products
Finance
Cement
Construction Project
Ferrous Metals
Industrial Capital Goods
Consumer Non Durables
Portfolio as on May 31, 2020
Nippon India Retirement Fund - Income Generation Scheme
For SIP performance refer page 61. For scheme performance refer page 63-70. For Fund manager wise scheme performance refer page 71-74.
Please refer page no. 82 for explanation on symbol: ^ and @ wherever available
Rating Profile
AAA/SOV/A1+/Cash & Other Receivables, 89.02%
Equity, 10.98%
Company/Issuer Rating % of Assets
Debt
Government Bond 85.16
Government of India SOV 85.16
Equity
Banks
HDFC Bank Limited* 2.03
Software
Infosys Limited* 1.07
Equity Less Than 1% of Corpus 7.89
Cash & Other Receivables 3.85
Grand Total 100.00
* Top 10 holding
Maximum Entry Age for Subscription (wef June 6, 2018) : Individual investors whose entry age is less than 60 years at the time of investment can invest. Further, inflows through subscription / Switch-in / SIP / STP-In, DTP-In, Nippon India Salary Advantage, Trigger etc. for existing investor will be discontinued upon investor attaining 60 years of age.
Retirement Age (wef June 6, 2018): The deemed Retirement age for the Scheme will be considered as 65 years. Investors can continue to remain invested beyond the retirement age as well, unless redeemed or switched out.
Please refer the addendum no. 26 dated May 23, 2018 pertaining to Changes in Nippon India Retirement Fund w.e.f June 6, 2018 for complete details.
Product Label
This product is suitable for investors who are seeking*:
Investors understand that their principalwill be at Moderately High risk
� income over long term along with capital growth
� Investing primarily in fixed income securities and balance in equity and equity related instruments so as to help the investor in achieving the retirement goals
*Investors should consult their financial advisors if in doubt about whether the product is suitable for them.

CP CD OTHERS
Nippon India Overnight Fund 4,597 0 days 1 day 3.24% 0.17% 0.07% - - - - - - - - - 100.00 Nil
Nippon India Liquid Fund 31,728 45 days 47 days 3.89% 0.27% 0.18% 48.64 18.81 - 1.88 29.62 0.95 - - - 0.10 # Refer footnote
Nippon India Money Market Fund 4,218 165 days 173 days 4.43% 0.25% 0.15% 56.60 31.29 - - 17.11 - - - - -5.01 Nil
Nippon India Ultra Short Duration Fund^^ 723 123 days 263 days 9.62% 1.10% 0.33% - - - 75.06 - 10.39 4.65 - - 9.90 Nil
Nippon India Low Duration Fund 2,452 0.87 1.13 8.09% 1.05% 0.34% 17.18 3.51 - 61.11 1.04 4.05 10.39 - - 2.72 Nil
Nippon India Prime Debt Fund 463 1.71 2.40 9.39% 0.74% 0.34% 16.15 - - 48.46 0.43 10.74 20.78 - - 3.44 Nil
Nippon India Floating Rate Fund 9,732 2.19 2.88 6.29% 0.54% 0.20% 0.51 - - 57.80 28.61 8.61 1.80 - - 2.69 0.50% <= 1 Month; Nil thereafter
Nippon India Short Term Fund 6,106 2.14 2.87 6.56% 1.11% 0.31% 0.89 4.16 - 64.61 22.02 2.57 2.70 - - 3.05 Nil
Nippon India Banking & PSU Debt Fund 4,973 2.45 2.98 5.65% 0.79% 0.30% 4.62 3.02 - 79.15 10.43 - - - - 2.78 Nil
Nippon India Credit Risk Fund^^ 1,856 1.53 2.07 13.00% 1.56% 0.94% 1.88 - - 71.58 1.40 - 17.65 - - 7.49 1% <= 12 Months; Nil thereafter**
Nippon India Strategic Debt Fund^^ 443 2.70 4.55 12.84% 2.12% 1.57% - - - 31.60 - - 51.93 - - 16.47 1% <= 1 Year; Nil thereafter
Nippon India Dynamic Bond Fund 721 5.20 7.27 5.78% 0.68% 0.25% - - - 10.32 70.28 - - - - 19.40 1% <= 1 Month; Nil thereafter
Nippon India Income Fund 420 4.23 5.73 5.16% 1.75% 1.02% - - - 18.28 53.37 - - - - 28.35 0.25% <= 15 days; Nil thereafter
Nippon India Gilt Securities Fund 1,381 6.77 10.49 6.05% 1.58% 0.61% - - - - 95.29 - - - - 4.71 0.25% <= 7 days; Nil thereafter
Nippon India Nivesh Lakshya Fund 1,307 11.26 24.75 6.58% 0.53% 0.21% - - - - 95.53 - - - - 4.47 **Refer footnote
Nippon India Hybrid Bond Fund*^^ 829 2.17 3.30 12.11% 2.15% 1.58% - - - 64.23 - - 20.35 0.20 10.33 4.90 1% <= 12 Months; Nil thereafter**
Exit LoadCorporate Debt
T-biils/ G-Secs/
SDLs
Floating Rate Notes
Month end AUM(Rs. Cr)
Modified Duration(Years)
Average Maturity(Years)
YTM$
TER^ Asset Allocation (%)
^^ Segregated Funds: Plz refer to the SID/KIM of the respective funds for the detailed information.^Total Expense Ratio - As on last day of the month & includes additional expenses provided in Regulation 52(6A)(b) and 52(6A)(c) of SEBI (Mutual Funds) Regulations, 1996 and Goods and Service Tax on Management Fees. Kindly refere to respective Scheme Pages for the Complete Details of the Parameters.
Abridged Analysis of Fixed Income Funds as on 31.05.2020
Name of the Scheme/ Parameters
Money Market Instruments includes CPs, CDs, MF units, Corporate Bond Repo & BRDS. Equity includes index, equity futures & equity shares. Corporate Debt includes debentures & bonds.$YTM displayed above is for the invested amount of the portfolio (i.e. excluding other receivables), please refer to the Scheme Page for the entire portfolio YTM (i.e. including other receivables). *YTM for debt portion of the portfolio in case of Nippon India Hybrid Bond Fund.**10% of the units allotted can be redeemed every year without any exit load, on or before completion of 12 months(Nippon India Hybrid Bond Fund, Nippon India Credit Risk Fund) / 36 months(Nippon India Nivesh Lakshya Fund) from the date of allotment of units. Any redemption in excess of such limit in the first 12 months/36 months from the date of allotment shall be subject to the following exit load, Redemption of units would be done on First in First out Basis (First In First Out).#Exit Load in Nippon India Liquid Fund (w.e.f. Oct 20, 2019), for redemptions within 7 days as below:Day 1 - 0.0070%; Day 2 - 0.0065%; Day 3 - 0.0060%; Day 4 - 0.0055%; Day 5 - 0.0050%; Day 6 - 0.0045; Nil 7th day onwards
PTC InvIT Equity
Cash & Other
Receivables
Regular Direct
Money Market Instruments

June 2020Fundamentals 61
SYSTEMATIC INVESTMENT PLAN (SIP) RETURNS
Nippon India Banking FundSince Inception 15 Years 10 Years 5 Years 3 Years 1 Year
Total Amount Invested (`) 2,050,000 1,800,000 1,200,000 600,000 360,000 120,000
Market Value (`) 6,202,526 3,666,817 1,338,860 444,079 228,246 79,712
Scheme Return (%) 11.86 8.94 2.17 -11.89 -28.01 -57.98
B: Nifty Bank TRI Return (%) 11.97 9.66 5.38 -5.13 -19.33 -50.94
AB: S&P BSE Sensex TRI Return (%)
10.83 8.73 7.08 2.53 -4.76 -23.87
Inception Date: May 26, 2003
Nippon India Power & Infra FundSince Inception 15 Years 10 Years 5 Years 3 Years 1 Year
Total Amount Invested (`) 1,930,000 1,800,000 1,200,000 600,000 360,000 120,000
Market Value (`) 3,220,414 2,399,256 1,241,441 501,857 271,634 100,061
Scheme Return (%) 6.07 3.73 0.68 -7.08 -17.82 -30.86
B: Nifty Infrastructure TRI Return (%)
2.54 1.37 1.49 -0.74 -5.27 -11.55
AB: S&P BSE Sensex TRI Return (%)
9.82 8.73 7.08 2.53 -4.76 -23.87
Inception Date: May 8, 2004
Nippon India Consumption FundSince Inception 15 Years 10 Years 5 Years 3 Years 1 Year
Total Amount Invested (`) 1,890,000 1,800,000 1,200,000 600,000 360,000 120,000
Market Value (`) 4,046,365 3,521,192 1,708,284 608,677 346,745 115,359
Scheme Return (%) 9.07 8.46 6.91 0.57 -2.47 -7.52
B: Nifty India Consumption TRI Return (%)
N.A N.A N.A 4.64 -1.09 -3.80
AB: S&P BSE Sensex TRI Return (%)
9.45 8.73 7.08 2.53 -4.76 -23.87
Inception Date: September 30, 2004
NA: Since TRI data is not available prior to 14-02-2012 for Nifty India Consumption , performance for such period is not provided
Nippon India Pharma Fund
Since Inception 15 Years 10 Years 5 Years 3 Years 1 Year
Total Amount Invested (`) 1,920,000 1,800,000 1,200,000 600,000 360,000 120,000
Market Value (`) 9,520,766 7,578,244 2,425,635 787,369 464,610 148,235
Scheme Return (%) 17.98 17.42 13.56 10.94 17.65 49.60
B: S&P BSE Healthcare TRI Return (%)
N.A 12.06 8.95 3.52 9.25 36.46
AB: S&P BSE Sensex TRI Return (%)
9.74 8.73 7.08 2.53 -4.76 -23.87
Inception Date: June 5, 2004
NA: Since TRI data is not available prior to 23/08/2004 for S&P BSE Healthcare , performance for such period is not provided.
Nippon India Equity Hybrid FundSince Inception 10 Years 5 Years 3 Years 1 Year
Total Amount Invested (`) 1,800,000 1,200,000 600,000 360,000 120,000
Market Value (`) 3,257,956 1,412,381 488,300 268,192 95,390
Scheme Return (%) 7.52 3.22 -8.16 -18.58 -37.51
B: CRISIL Hybrid 35+65 Aggressive Index Return (%)
9.15 8.24 4.68 0.13 -9.05
AB: S&P BSE Sensex TRI Return (%) 8.73 7.08 2.53 -4.76 -23.87
Inception Date: June 8, 2005
The scheme returns are inclusive of the impact of segregation of portfolio. For complete details, please refer SID/KIM of the Scheme.
Segregated Portfolio 1 - The total impact on the NAV is 0.25%. Out of this, 0.15% is due to the credit event and 0.10% is due to segregation decision post the credit event (accordingly for this 0.10%, new units have been allotted and is reflected in the segregated portfolio).
Segregated Portfolio 2 - No impact of segregation on NAV beyond fair valuation of securities done on March 5,2020.
Nippon India Credit Risk FundSince Inception 10 Years 5 Years 3 Years 1 Year
Total Amount Invested (`) 1,800,000 1,200,000 600,000 360,000 120,000
Market Value (`) 2,723,502 1,486,520 593,283 333,624 109,652
Scheme Return (%) 5.32 4.22 -0.45 -4.98 -16.50
B: NIFTY Credit Risk Bond Index Return (%)
9.17 9.18 8.56 8.73 9.58
AB: Crisil 10 Yr Gilt Index Return (%) 7.50 8.20 8.98 10.92 13.67
Inception Date: June 9, 2005
The scheme returns are inclusive of the impact of segregation of portfolio. For complete details, please refer SID/KIM of the Scheme.Segregated Portfolio 1 - Impact of segregation on NAV is negative (0.56%).Segregated Portfolio 2 - No impact of segregation on NAV beyond fair valuation of securities done on March 5,2020.
Nippon India Dynamic Bond FundSince Inception 15 Years 10 Years 5 Years 3 Years 1 Year
Total Amount Invested (`)
1,870,000 1,800,000 1,200,000 600,000 360,000 120,000
Market Value (`) 3,534,886 3,341,910 1,866,228 738,890 413,929 127,720
Scheme Return (%) 7.73 7.82 8.60 8.36 9.47 12.93
B: Crisil Dynamic Debt Index Return (%)
8.92 8.97 9.25 9.39 10.64 14.00
AB: Crisil 10 Yr Gilt Index Return (%)
7.44 7.50 8.20 8.98 10.92 13.67
Inception Date: November 15, 2004
Nippon India Gold Savings FundSince Inception 5 Years 3 Years 1 Year
Total Amount Invested (`) 1,110,000 600,000 360,000 120,000
Market Value (`) 1,641,431 875,094 500,594 142,416
Scheme Return (%) 8.28 15.26 23.10 38.88
B: Domestic Prices of Gold Return (%) 10.03 17.09 25.56 43.72
AB: NA Return (%) N.A N.A N.A N.A
Inception Date: March 07, 2011
Nippon India Retirement Fund - Income Generation SchemeSince Inception 5 Years 3 Years 1 Year
Total Amount Invested (`) 640,000 600,000 360,000 120,000
Market Value (`) 759,069 704,030 395,062 122,918
Scheme Return (%) 6.40 6.41 6.26 4.83
B: Custom Benchmark* Return (%) 8.83 8.85 8.73 9.17
AB: Crisil 10 Yr Gilt Index Return (%) 8.88 8.98 10.92 13.67
Inception Date: February 11, 2015
*80% of CRISIL Long Term Debt Index +20% of S&P BSE 500 TRI
Nippon India Balanced Advantage FundSince Inception 15 Years 10 Years 5 Years 3 Years 1 Year
Total Amount Invested (`)
1,870,000 1,800,000 1,200,000 600,000 360,000 120,000
Market Value (`) 4,576,423 4,041,556 1,787,717 639,184 344,151 111,103
Scheme Return (%) 10.69 10.11 7.78 2.53 -2.96 -14.24
B: CRISIL Hybrid 35+65 - Aggressive Index Return (%)
9.39 9.15 8.24 4.68 0.13 -9.05
AB: S&P BSE Sensex TRI Return (%)
9.28 8.73 7.08 2.53 -4.76 -23.87
Inception Date: November 15, 2004
Details as on May 31, 2020Past performance may or may not be sustained in future and the same may not necessarily provide the basis for comparison with other investment.
B: Benchmark, AB: Additional Benchmark, TRI: Total Return IndexTRI - Total Returns Index reflects the returns on the index arising from (a) constituent stock price movements and (b) dividend receipts from constituent index stocks, thereby showing a true picture of returns.
It is assumed that a SIP of `10,000 each executed on 10th of every month including the first installment.
Load has not been taken into consideration.
Returns on SIP and Benchmark are annualised and cumulative investment return for cash flows resulting out of uniform and regular monthly subscriptions have been worked out on excel spreadsheet function known as XIRR.

June 202062 Fundamentals
FUND MANAGER'S / EXPERIENCE AS ON MAY 31, 2020
Fund Manager (Industry Experience) Managing the Fund since
Fund Manager (Industry Experience) Managing the Fund since
Fund Manager (Industry Experience) Managing the Fund since
Equity Fund Management Team
Mr. Manish Gunwani (22 years)
Nippon India Growth Fund Sep 2017
Nippon India Balanced Advantage Fund May 2018
Nippon India Capital Builder Fund IV - Series D Jan 2018
Mr. Sailesh Raj Bhan (23 Years)Nippon India Pharma Fund Jun 2004
Nippon India Consumption Fund Sep 2004
Nippon India Multi Cap Fund Mar 2005
Nippon India Large Cap Fund Aug 2007
Nippon India India Opportunities Fund - Series A Sep 2018
Mr. Ashwani Kumar (27 Years)Nippon India Tax Saver (ELSS) Fund Sep 2005
Nippon India Capital Builder Fund IV - Series B Nov 2017
Mr. Sanjay Parekh (26 Years)
Nippon India Hybrid Bond Fund Apr 2012
Nippon India Equity Hybrid Fund Apr 2012
Nippon India Retirement Fund - Wealth Creation Scheme
Feb 2015
Nippon India Retirement Fund - Income Generation Scheme
Feb 2015
Nippon India Equity Savings Fund May 2015
Nippon India Capital Protection Oriented Fund II - Plan A
Mar 2020
Various Series of Nippon India Dual Advantage Fixed Tenure Fund
Mr. Samir Rachh (28 Years)Nippon India Small Cap Fund Jan 2017
Nippon India Capital Builder Fund IV - Series C Dec 2017
Nippon India Capital Builder Fund IV - Series D Feb 2019
Mr. Vishal Jain (23 Years)Nippon India ETF Junior BeES Nov 2018
CPSE ETF Nov 2018
Nippon India ETF Bank BeES Nov 2018
Nippon India ETF Nifty BeES Nov 2018
Mr. Mehul Dama (14 Years)
Nippon India ETF PSU Bank BeES Nov 2018
Nippon India ETF Gold BeES Nov 2018
Nippon India ETF Infra BeES Nov 2018
Nippon India ETF Shariah BeES Nov 2018
Nippon India Index Fund - Nifty Plan Nov 2018
Nippon India Index Fund - Sensex Plan Nov 2018
Nippon India ETF Dividend Opportunities Nov 2018
Nippon India ETF Consumption Nov 2018
Nippon India ETF Nifty 100 Nov 2018
Nippon India ETF Sensex Nov 2018
Nippon India ETF NV20 Nov 2018
Nippon India Gold Savings Fund Nov 2018
Nippon India ETF Nifty Midcap 150 Jan 2019
Nippon India Junior BeES FOF Mar 2019
Nippon India ETF Sensex Next 50 Jul 2019
Mr. Ashutosh Bhargava (15 Years)
Nippon India Quant Fund Sep 2017
Co - Fund Manager
Nippon India Balanced Advantage Fund May 2018
Mr. Dhrumil Shah (13 Years)
Co-Fund Manager
Nippon India Growth Fund Feb 2019
Ms. Meenakshi Dawar (10 Years)
Nippon India Value Fund May 2018
Nippon India Vision Fund May 2019
Nippon India Capital Builder Fund IV - Series B Nov 2017
Nippon India Capital Builder Fund IV - Series C Dec 2017
Nippon India Capital Builder Fund IV - Series D Jan 2018
Mr. Sanjay Doshi (15 Years)
Nippon India Power & Infra Fund Jan 2017
Co-Fund Manager
Nippon India Vision Fund May 2019
Mr. Vinay Sharma (15 Years)
Nippon India Banking Fund Apr 2018
Nippon India Focused Equity Fund May 2018
Ms. Kinjal Desai (7 Years)
Dedicated Fund Manager for Overseas Investments
Nippon India Japan Equity Fund May 2018
Nippon India US Equity Opportunities Fund May 2018
Nippon India ETF Hang Seng BeES May 2018
Mr. Arun Sundaresan (16 Years)
Co-Fund Manager
Nippon India Quant Fund May 2018
Mr. Anand Gupta (26 Years)
Nippon India Equity Savings Fund Sep 2018
Nippon India Arbitrage Fund Sep 2018
Mr. Tejas Sheth (14 years)
Co-Fund Manager
Nippon India Growth Fund May 2019
Ms. Aishwarya Deepak Agarwal (19 years)
Nippon India Capital Builder Fund IV – Series A Jun 2019
Fixed Income Fund Management Team
Mr. Amit Tripathi (21 Years)
Nippon India Yearly Interval Fund - Series 1
Nippon India Interval Fund - All Series
All Series of Nippon India Fixed Horizon Fund
Mr. Prashant Pimple (19 Years)
Nippon India Dynamic Bond Fund Oct 2008
Nippon India Short Term Fund Oct 2008
Nippon India ETF Long Term Gilt Jul 2016
Nippon India Nivesh Lakshya Fund Jul 2018
Nippon India Banking & PSU Debt Fund Feb 2020
Nippon India Balanced Advantage Fund Feb 2020
Nippon India Retirement Fund - Income Generation Scheme
Feb 2020
Nippon India Retirement Fund - Wealth Creation Scheme
Feb 2020
Ms. Anju Chhajer (23 Years)
Nippon India Low Duration Fund Oct 2009
Nippon India Liquid Fund Oct 2013
Nippon India Japan Equity Fund Aug 2014
Nippon India US Equity Opportunities Fund Jul 2015
Nippon India Overnight Fund Dec 2018
Nippon India Money Market Fund Feb 2020
Nippon India Floating Rate Fund Feb 2020
Nippon India Arbitrage Fund Feb 2020
Nippon India Capital Protection Oriented Fund II - Plan A
Mar 2020
Various Series of Nippon India Dual Advantage Fixed Tenure Fund
Mr. Vivek Sharma (13 Years)
Nippon India Ultra Short Duration Fund Oct 2013
Nippon India Income Fund Feb 2020
Nippon India Prime Debt Fund Feb 2020
Nippon India Short Term Fund Feb 2020
Nippon India Low Duration Fund Feb 2020
Mr. Siddharth Deb (13 Years)
Nippon India ETF Liquid BeES Nov 2012
Nippon India ETF Hang Seng BeES Nov 2016
Mr. Hardik Shah (10 Years)
Nippon India Banking & PSU Debt Fund Feb 2020
Nippon India Dynamic Bond Fund Feb 2020
Nippon India Gilt Securities Fund Feb 2020
Nippon India Nivesh Lakshya Fund Feb 2020
Mr. Sushil Budhia (18 Years)
Nippon India Credit Risk Fund Feb 2020
Nippon India Strategic Debt Fund Feb 2020
Nippon India Hybrid Bond Fund Feb 2020
Nippon India Equity Hybrid Fund Feb 2020
Nippon India Equity Savings Fund Feb 2020
For changes in Fund Managers for few of the schemes of Nippon India Mutual Funds w.e.f. February 1st, 2020, kindly refer notice cum addendum no. 131, dated January 30, 2020.

June 2020Fundamentals 63
SCHEME PERFORMANCE AS ON MAY 31, 2020
Nippon India Large Cap FundNAV as on May 29, 2020: ` 26.0371
ParticularsCAGR %
1 Year 3 Years 5 Years Since InceptionNippon India Large Cap Fund -28.55 -3.56 1.47 7.75
B: S&P BSE 100 TRI -18.42 0.56 3.97 7.47
AB: S&P BSE Sensex TRI -17.41 2.64 4.48 7.48
Value of `10000 Invested
Nippon India Large Cap Fund 7,151 8,971 10,757 26,037
B: S&P BSE 100 TRI 8,163 10,169 12,151 25,167
AB: S&P BSE Sensex TRI 8,264 10,813 12,451 25,214
Inception Date: Aug 8, 2007
Fund Manager: Sailesh Raj Bhan (Since Aug 2007)
Nippon India Vision FundNAV as on May 29, 2020: ` 410.5098
ParticularsCAGR %
1 Year 3 Years 5 Years Since InceptionNippon India Vision Fund -24.54 -7.99 -1.49 16.26
B: Nifty Large Midcap 250 TRI -19.18 -1.47 4.27 NA
AB: S&P BSE Sensex TRI -17.41 2.64 4.48 11.03
Value of `10000 Invested
Nippon India Vision Fund 7,551 7,790 9,275 410,509
B: Nifty Large Midcap 250 TRI 8,086 9,565 12,328 NA
AB: S&P BSE Sensex TRI 8,264 10,813 12,451 132,052
Inception Date: Oct 8, 1995
Fund Manager: Meenakshi Dawar (Since May 2019), Sanjay Doshi (Co-Fund Manager) (Since May 2019)
As TRI data is not available since Since Inception of the scheme, benchmark performance is calculated using composite CAGR of S&P BSE Sensex PRI values from date 06-Oct-1995 to date 19-Aug-1996 and TRI values since date 19-Aug-1996
NA has been mentioned for scheme in existence for more than 1 year but less than 3 years or 5 years or instances where benchmark data for corresponding period is not available.
Nippon India Quant Fund NAV as on May 29, 2020: ` 22.7755
ParticularsCAGR %
1 Year 3 Years 5 Years Since Inception
Nippon India Quant Fund -13.35 -0.63 2.43 7.03
B: S&P BSE 200 TRI -17.90 0.29 4.11 7.23
AB: S&P BSE Sensex TRI -17.41 2.64 4.48 7.24
Value of `10000 Invested
Nippon India Quant Fund 8,669 9,812 11,279 22,775
B: S&P BSE 200 TRI 8,214 10,088 12,232 23,306
AB: S&P BSE Sensex TRI 8,264 10,813 12,451 23,344
Inception Date: Apr 18, 2008
Fund Manager : Ashutosh Bhargava (Since Sep 2017), Arun Sundaresan [Co-Fund Manager] (Since May 2018)
Nippon India Balanced Advantage Fund NAV as on May 29, 2020: ` 83.1198
ParticularsCAGR %
1 Year 3 Years 5 Years Since Inception
Nippon India Balanced Advantage Fund -10.16 0.96 3.96 14.59
B: CRISIL Hybrid 35+65 - Aggressive Index -6.69 3.81 6.36 11.40
AB: S&P BSE Sensex TRI -17.41 2.64 4.48 13.05
Value of `10000 Invested
Nippon India Balanced Advantage Fund 8,987 10,292 12,148 83,120
B: CRISIL Hybrid 35+65 - Aggressive Index 9,333 11,186 13,613 53,585
AB: S&P BSE Sensex TRI 8,264 10,813 12,451 67,424
Inception Date: Nov 15, 2004
Fund Manager: Manish Gunwani (Since May 2018); Ashutosh Bhargava (Co-Fund Manager)(Since May 2018); Prashant Pimple (Since Feb,2020)
Nippon India Index Fund - Nifty PlanNAV as on May 29, 2020: ` 15.9909
ParticularsCAGR %
1 Year 3 Years 5 Years Since Inception
Nippon India Index Fund - Nifty Plan -19.72 0.04 2.62 4.97
B: Nifty 50 TRI -18.62 1.23 3.93 6.19
AB: S&P BSE Sensex TRI -17.41 2.64 4.48 6.53
Value of `10000 Invested
Nippon India Index Fund - Nifty Plan 8,033 10,012 11,383 15,991
B: Nifty 50 TRI 8,143 10,372 12,126 17,875
AB: S&P BSE Sensex TRI 8,264 10,813 12,451 18,437
Inception Date: Sep 28, 2010
Fund Manager: Mehul Dama (Since Nov 2018)
Nippon India Index Fund - Sensex PlanNAV as on May 29, 2020: ` 16.0051
ParticularsCAGR %
1 Year 3 Years 5 Years Since Inception
Nippon India Index Fund - Sensex Plan -17.99 1.69 3.31 4.98
B: S&P BSE Sensex TRI -17.41 2.64 4.48 6.53
AB: Nifty 50 TRI -18.62 1.23 3.93 6.19
Value of `10000 Invested
Nippon India Index Fund - Sensex Plan 8,206 10,516 11,770 16,005
B: S&P BSE Sensex TRI 8,264 10,813 12,451 18,437
AB: Nifty 50 TRI 8,143 10,372 12,126 17,875
Inception Date: Sep 28, 2010
Fund Manager: Mehul Dama (Since Nov 2018)
Nippon India Growth FundNAV as on May 29, 2020: ` 911.9323
ParticularsCAGR %
1 Year 3 Years 5 Years Since Inception
Nippon India Growth Fund -19.97 -3.20 2.40 20.08
B: S&P BSE MidCap TRI -20.54 -5.79 3.23 NA
AB: S&P BSE Sensex TRI -17.41 2.64 4.48 11.03
Value of ` 10000 Invested
Nippon India Growth Fund 8,008 9,072 11,261 911,929
B: S&P BSE MidCap TRI 7,951 8,363 11,724 NA
AB: S&P BSE Sensex TRI 8,264 10,813 12,451 132,052
Inception Date: Oct 8, 1995Fund Manager: Manish Gunwani (Since Sep 2017), Dhrumil Shah - Co-Fund Manager (Since Feb 2019), Tejas Sheth Co-Fund Manager (Since May 2019)As TRI data is not available since Since Inception of the scheme, benchmark performance is calculated using composite CAGR of S&P BSE Sensex PRI values from date 06/10/1995 to date 19/08/1996 and TRI values since date 19/08/1996NA has been mentioned for scheme in existence for more than 1 year but less than 3 years or 5 years or instances where benchmark data for corresponding period is not available.
Nippon India Focused Equity FundNAV as on May 29, 2020: ` 36.7855
ParticularsCAGR %
1 Year 3 Years 5 Years Since Inception*Nippon India Focused Equity Fund -24.18 NA NA -11.57B: S&P BSE 500 TRI -18.93 NA NA -7.35AB: S&P BSE Sensex TRI -17.41 NA NA -2.36Value of ` 10000 InvestedNippon India Focused Equity Fund 7,582 NA NA 7,735B: S&P BSE 500 TRI 8,112 NA NA 8,527AB: S&P BSE Sensex TRI 8,264 NA NA 9,515*Date of Recategorisation: April 28 2018Fund Manager: Vinay Sharma (Since May 2018)
*Reliance Focused Large Cap Fund was merged into Reliance Mid & Small Cap Fund and the merged scheme was renamed as Nippon India Focused Equity Fund (formerly Reliance Focused Equity Fund) (‘Scheme’) with effect from April 28, 2018. In line with SEBI circular SEBI/HO/IMD/DF3/CIR/P/2018/69 dated April 12, 2018, since the Scheme did not retain the features of either the transferor or transferee scheme, the performance has been provided herein since the effective date i.e. April 28, 2018.NA has been mentioned for scheme in existence for more than 1 year but less than 3 years or 5 years.

June 202064 Fundamentals
SCHEME PERFORMANCE AS ON MAY 31, 2020
Nippon India Small Cap FundNAV as on May 29, 2020: ` 30.5844
ParticularsCAGR %
1 Year 3 Years 5 Years Since InceptionNippon India Small Cap Fund -25.52 -5.73 4.87 12.21B: S&P BSE SmallCap TRI -25.74 -9.40 0.25 1.91AB: S&P BSE Sensex TRI -17.41 2.64 4.48 6.89Value of `10000 InvestedNippon India Small Cap Fund 7,454 8,379 12,688 30,584B: S&P BSE SmallCap TRI 7,432 7,440 10,125 12,016AB: S&P BSE Sensex TRI 8,264 10,813 12,451 19,090Inception Date: Sep 16, 2010Fund Manager: Samir Rachh (Since Jan 2017)
Nippon India Value FundNAV as on May 29, 2020: ` 58.6831
ParticularsCAGR %
1 Year 3 Years 5 Years Since InceptionNippon India Value Fund -23.02 -3.16 2.08 12.54B: S&P BSE Enhanced Value TRI -36.11 -17.14 -4.84 NAAB: S&P BSE Sensex TRI -17.41 2.64 4.48 12.49Value of `10000 InvestedNippon India Value Fund 7,703 9,081 11,084 58,683B: S&P BSE Enhanced Value TRI 6,396 5,692 7,801 NAAB: S&P BSE Sensex TRI 8,264 10,813 12,451 58,293Inception Date: Jun 8, 2005Fund Manager: Meenakshi Dawar (Since May 2018)NA has been mentioned for scheme in existence for more than 1 year but less than 3 years or 5 years or instances where benchmark data for corresponding period is not available.
Nippon India Multi Cap FundNAV as on May 29, 2020: ` 66.5476
ParticularsCAGR %
1 Year 3 Years 5 Years Since InceptionNippon India Multi Cap Fund -34.75 -7.13 -2.38 13.30B: S&P BSE 500 TRI -18.93 -0.76 3.75 11.87AB: S&P BSE Sensex TRI -17.41 2.64 4.48 12.73Value of `10000 InvestedNippon India Multi Cap Fund 6,532 8,012 8,865 66,548B: S&P BSE 500 TRI 8,112 9,775 12,024 54,887AB: S&P BSE Sensex TRI 8,264 10,813 12,451 61,672Inception Date: Mar 28, 2005Fund Manager: Sailesh Raj Bhan (Since Mar 2005)As TRI data is not available since Since Inception of the scheme, benchmark performance is calculated using composite CAGR of S&P BSE 500 PRI values from date 28/03/2005 to date 01/08/2006 and TRI values since date 01/08/2006
Nippon India Equity Hybrid FundNAV as on May 29, 2020: ` 38.4931
ParticularsCAGR %
1 Year 3 Years 5 Years Since InceptionNippon India Equity Hybrid Fund -28.52 -8.14 -0.56 9.41B:CRISIL Hybrid 35+65 - Aggressive Index -6.69 3.81 6.36 11.03AB: S&P BSE Sensex TRI -17.41 2.64 4.48 12.49Value of `10000 InvestedNippon India Equity Hybrid Fund 7,154 7,754 9,721 38,493B:CRISIL Hybrid 35+65 - Aggressive Index 9,333 11,186 13,613 47,955AB: S&P BSE Sensex TRI 8,264 10,813 12,451 58,293Inception Date: Jun 8, 2005Fund Manager: Sanjay Parekh (Since Apr 2012), Sushil Budhia (Since Feb, 2020)The scheme returns are inclusive of the impact of segregation of portfolio. For complete details, please refer SID/KIM of the Scheme.Segregated Portfolio 1 - The total impact on the NAV is 0.25%. Out of this, 0.15% is due to the credit event and 0.10% is due to segregation decision post the credit event (accordingly for this 0.10%, new units have been allotted and is reflected in the segregated portfolio).Segregated Portfolio 2 - No impact of segregation on NAV beyond fair valuation of securities done on March 5, 2020.
Nippon India Equity Savings FundNAV as on May 29, 2020: ` 9.5683
ParticularsCAGR %
1 Year 3 Years 5 Years Since InceptionNippon India Equity Savings Fund -24.75 -6.76 -0.88 -0.88B: NIFTY Equity Savings Index -0.99 5.42 6.32 6.32AB: S&P BSE Sensex TRI -17.41 2.64 4.48 4.48Value of `10000 InvestedNippon India Equity Savings Fund 7,531 8,107 9,568 9,568B: NIFTY Equity Savings Index 9,901 11,714 13,591 13,591AB: S&P BSE Sensex TRI 8,264 10,813 12,451 12,451Inception Date: May 30, 2015Fund Manager: Sanjay Parekh (Since May 2015), Anand D Gupta(Since Sept 2018); Sushil Budhia (Since Feb,2020)
The scheme returns are inclusive of the impact of segregation of portfolio. For complete details, please refer SID/KIM of the Scheme.Segregated Portfolio 1 - The total impact on the NAV is 5.92%. Out of this, 3.52% is due to the credit event and 2.40% is due to segregation decision post the credit event (accordingly for this 2.40%, new units have been allotted and is reflected in the segregated portfolio).Segregated Portfolio 2 - No impact of segregation on NAV beyond fair valuation of securities done on March 5,2020.
Nippon India Banking FundNAV as on May 29, 2020: ` 162.6508
ParticularsCAGR %
1 Year 3 Years 5 Years Since Inception
Nippon India Banking Fund -45.73 -12.37 -2.05 17.80
B: Nifty Bank TRI -38.30 -5.83 1.24 17.26
AB: S&P BSE Sensex TRI -17.41 2.64 4.48 16.51
Value of `10000 Invested
Nippon India Banking Fund 5,436 6,731 9,014 162,650
B: Nifty Bank TRI 6,178 8,352 10,635 150,362
AB: S&P BSE Sensex TRI 8,264 10,813 12,451 134,876
Inception Date: May 26, 2003
Fund Manager: Vinay Sharma (Since Apr 2018)
Nippon India Power & Infra FundNAV as on May 29, 2020: ` 73.6772
ParticularsCAGR %
1 Year 3 Years 5 Years Since Inception
Nippon India Power & Infra Fund -28.86 -9.60 0.07 13.23
B: Nifty Infrastructure TRI -13.12 -2.17 -0.86 7.09
AB: S&P BSE Sensex TRI -17.41 2.64 4.48 13.10
Value of `10000 Invested
Nippon India Power & Infra Fund 7,121 7,390 10,037 73,677
B: Nifty Infrastructure TRI 8,691 9,365 9,576 30,046
AB: S&P BSE Sensex TRI 8,264 10,813 12,451 72,291
Inception Date: May 8, 2004
Fund Manager: Sanjay Doshi (Since Jan 2017)
Nippon India Consumption FundNAV as on May 29, 2020: ` 61.3405
ParticularsCAGR %
1 Year 3 Years 5 Years Since Inception
Nippon India Consumption Fund -5.83 -1.45 4.57 12.27
B: Nifty India Consumption TRI -2.96 3.56 7.06 NA
AB: S&P BSE Sensex TRI -17.41 2.64 4.48 13.43
Value of `10000 Invested
Nippon India Consumption Fund 9,419 9,572 12,507 61,341
B: Nifty India Consumption TRI 9,705 11,106 14,067 NA
AB: S&P BSE Sensex TRI 8,264 10,813 12,451 72,093
Inception Date: Sep 30, 2004
Fund Manager: Sailesh Raj Bhan (Since Sep 2004)
NA has been mentioned for scheme in existence for more than 1 year but less than 3 years or 5 years or instances where benchmark data for corresponding period is not available.
Nippon India Pharma FundNAV as on May 29, 2020: ` 186.2081
ParticularsCAGR %
1 Year 3 Years 5 Years Since Inception
Nippon India Pharma Fund 29.40 15.31 6.39 20.06
B: S&P BSE Healthcare TRI 18.94 5.68 -0.87 13.75
AB: S&P BSE Sensex TRI -17.41 2.64 4.48 14.18
Value of `10000 Invested
Nippon India Pharma Fund 12,931 15,327 13,637 186,208
B: S&P BSE Healthcare TRI 11,888 11,799 9,570 78,534
AB: S&P BSE Sensex TRI 8,264 10,813 12,451 83,446
Inception Date: Jun 5, 2004
Fund Manager: Sailesh Raj Bhan (Since Jun 2004)
As TRI data is not available since Since Inception of the scheme, benchmark performance is calculated using composite CAGR of S&P BSE HC PRI values from date 04/06/2004 to date 23/08/2004 and TRI values since date 23/08/2004
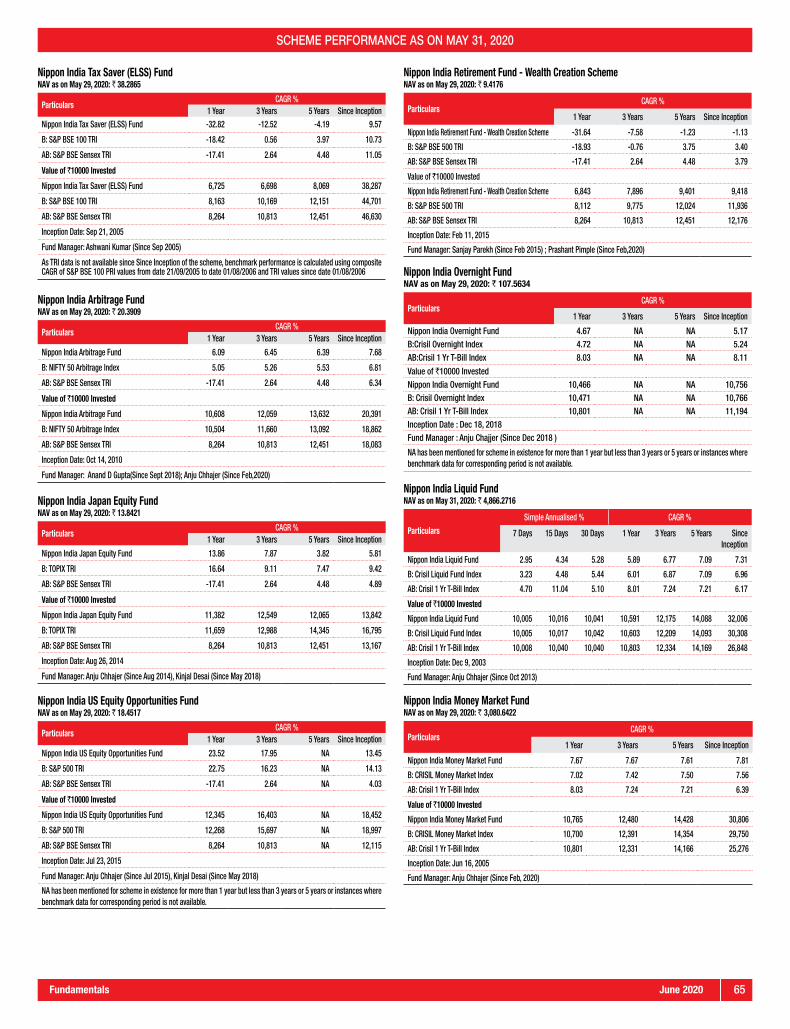
June 2020Fundamentals 65
SCHEME PERFORMANCE AS ON MAY 31, 2020
Nippon India Tax Saver (ELSS) FundNAV as on May 29, 2020: ` 38.2865
ParticularsCAGR %
1 Year 3 Years 5 Years Since InceptionNippon India Tax Saver (ELSS) Fund -32.82 -12.52 -4.19 9.57
B: S&P BSE 100 TRI -18.42 0.56 3.97 10.73
AB: S&P BSE Sensex TRI -17.41 2.64 4.48 11.05
Value of `10000 Invested
Nippon India Tax Saver (ELSS) Fund 6,725 6,698 8,069 38,287
B: S&P BSE 100 TRI 8,163 10,169 12,151 44,701
AB: S&P BSE Sensex TRI 8,264 10,813 12,451 46,630
Inception Date: Sep 21, 2005
Fund Manager: Ashwani Kumar (Since Sep 2005)
As TRI data is not available since Since Inception of the scheme, benchmark performance is calculated using composite CAGR of S&P BSE 100 PRI values from date 21/09/2005 to date 01/08/2006 and TRI values since date 01/08/2006
Nippon India Arbitrage FundNAV as on May 29, 2020: ` 20.3909
ParticularsCAGR %
1 Year 3 Years 5 Years Since Inception
Nippon India Arbitrage Fund 6.09 6.45 6.39 7.68
B: NIFTY 50 Arbitrage Index 5.05 5.26 5.53 6.81
AB: S&P BSE Sensex TRI -17.41 2.64 4.48 6.34
Value of `10000 Invested
Nippon India Arbitrage Fund 10,608 12,059 13,632 20,391
B: NIFTY 50 Arbitrage Index 10,504 11,660 13,092 18,862
AB: S&P BSE Sensex TRI 8,264 10,813 12,451 18,083
Inception Date: Oct 14, 2010
Fund Manager: Anand D Gupta(Since Sept 2018); Anju Chhajer (Since Feb,2020)
Nippon India Japan Equity FundNAV as on May 29, 2020: ` 13.8421
ParticularsCAGR %
1 Year 3 Years 5 Years Since Inception
Nippon India Japan Equity Fund 13.86 7.87 3.82 5.81
B: TOPIX TRI 16.64 9.11 7.47 9.42
AB: S&P BSE Sensex TRI -17.41 2.64 4.48 4.89
Value of `10000 Invested
Nippon India Japan Equity Fund 11,382 12,549 12,065 13,842
B: TOPIX TRI 11,659 12,988 14,345 16,795
AB: S&P BSE Sensex TRI 8,264 10,813 12,451 13,167
Inception Date: Aug 26, 2014
Fund Manager: Anju Chhajer (Since Aug 2014), Kinjal Desai (Since May 2018)
Nippon India US Equity Opportunities FundNAV as on May 29, 2020: ` 18.4517
ParticularsCAGR %
1 Year 3 Years 5 Years Since Inception
Nippon India US Equity Opportunities Fund 23.52 17.95 NA 13.45
B: S&P 500 TRI 22.75 16.23 NA 14.13
AB: S&P BSE Sensex TRI -17.41 2.64 NA 4.03
Value of `10000 Invested
Nippon India US Equity Opportunities Fund 12,345 16,403 NA 18,452
B: S&P 500 TRI 12,268 15,697 NA 18,997
AB: S&P BSE Sensex TRI 8,264 10,813 NA 12,115
Inception Date: Jul 23, 2015
Fund Manager: Anju Chhajer (Since Jul 2015), Kinjal Desai (Since May 2018)
NA has been mentioned for scheme in existence for more than 1 year but less than 3 years or 5 years or instances where benchmark data for corresponding period is not available.
Nippon India Retirement Fund - Wealth Creation SchemeNAV as on May 29, 2020: ` 9.4176
ParticularsCAGR %
1 Year 3 Years 5 Years Since Inception
Nippon India Retirement Fund - Wealth Creation Scheme -31.64 -7.58 -1.23 -1.13
B: S&P BSE 500 TRI -18.93 -0.76 3.75 3.40
AB: S&P BSE Sensex TRI -17.41 2.64 4.48 3.79
Value of `10000 Invested
Nippon India Retirement Fund - Wealth Creation Scheme 6,843 7,896 9,401 9,418
B: S&P BSE 500 TRI 8,112 9,775 12,024 11,936
AB: S&P BSE Sensex TRI 8,264 10,813 12,451 12,176
Inception Date: Feb 11, 2015
Fund Manager: Sanjay Parekh (Since Feb 2015) ; Prashant Pimple (Since Feb,2020)
Nippon India Overnight FundNAV as on May 29, 2020: ` 107.5634
ParticularsCAGR %
1 Year 3 Years 5 Years Since Inception
Nippon India Overnight Fund 4.67 NA NA 5.17B:Crisil Overnight Index 4.72 NA NA 5.24AB:Crisil 1 Yr T-Bill Index 8.03 NA NA 8.11
Value of `10000 InvestedNippon India Overnight Fund 10,466 NA NA 10,756B: Crisil Overnight Index 10,471 NA NA 10,766AB: Crisil 1 Yr T-Bill Index 10,801 NA NA 11,194Inception Date : Dec 18, 2018Fund Manager : Anju Chajjer (Since Dec 2018 )
NA has been mentioned for scheme in existence for more than 1 year but less than 3 years or 5 years or instances where benchmark data for corresponding period is not available.
Nippon India Liquid FundNAV as on May 31, 2020: ` 4,866.2716
ParticularsSimple Annualised % CAGR %
7 Days 15 Days 30 Days 1 Year 3 Years 5 Years Since Inception
Nippon India Liquid Fund 2.95 4.34 5.28 5.89 6.77 7.09 7.31
B: Crisil Liquid Fund Index 3.23 4.48 5.44 6.01 6.87 7.09 6.96
AB: Crisil 1 Yr T-Bill Index 4.70 11.04 5.10 8.01 7.24 7.21 6.17
Value of `10000 Invested
Nippon India Liquid Fund 10,005 10,016 10,041 10,591 12,175 14,088 32,006
B: Crisil Liquid Fund Index 10,005 10,017 10,042 10,603 12,209 14,093 30,308
AB: Crisil 1 Yr T-Bill Index 10,008 10,040 10,040 10,803 12,334 14,169 26,848
Inception Date: Dec 9, 2003
Fund Manager: Anju Chhajer (Since Oct 2013)
Nippon India Money Market FundNAV as on May 29, 2020: ` 3,080.6422
ParticularsCAGR %
1 Year 3 Years 5 Years Since Inception
Nippon India Money Market Fund 7.67 7.67 7.61 7.81
B: CRISIL Money Market Index 7.02 7.42 7.50 7.56
AB: Crisil 1 Yr T-Bill Index 8.03 7.24 7.21 6.39
Value of `10000 Invested
Nippon India Money Market Fund 10,765 12,480 14,428 30,806
B: CRISIL Money Market Index 10,700 12,391 14,354 29,750
AB: Crisil 1 Yr T-Bill Index 10,801 12,331 14,166 25,276
Inception Date: Jun 16, 2005
Fund Manager: Anju Chhajer (Since Feb, 2020)

June 202066 Fundamentals
SCHEME PERFORMANCE AS ON MAY 31, 2020
Nippon India Ultra Short Duration FundNAV as on May 29, 2020: ` 2,929.1017
ParticularsCAGR %
1 Year 3 Years 5 Years Since InceptionNippon India Ultra Short Duration Fund 0.55 4.49 5.38 5.99B: NIFTY Ultra Short Duration Debt Index 7.32 7.60 7.71 7.84AB: Crisil 1 Yr T-Bill Index 8.03 7.24 7.21 6.19Value of `10000 InvestedNippon India Ultra Short Duration Fund 10,055 11,408 12,994 29,291B: NIFTY Ultra Short Duration Debt Index 10,730 12,457 14,500 40,377AB: Crisil 1 Yr T-Bill Index 10,801 12,331 14,166 30,377Inception Date: Dec 7, 2001Fund Manager: Vivek Sharma(Since Oct 2013)The scheme returns are inclusive of the impact of segregation of portfolio. For complete details, please refer SID/KIM of the Scheme.Segregated Portfolio 1 - The total impact on the NAV is 5.43%. Out of this, 3.98% is due to the credit event and 1.45% is due to segregation decision post the credit event (accordingly for this 1.45%, new units have been allotted and is reflected in the segregated portfolio). A part payment i.e. 6.06% of our total exposure in Altico Capital India Limited is recovered on 30th Dec, 2019.
Nippon India Low Duration FundNAV as on May 29, 2020: ` 2,779.2328
ParticularsCAGR %
1 Year 3 Years 5 Years Since Inception
Nippon India Low Duration Fund 6.13 7.02 7.46 8.05B: NIFTY Low Duration Debt Index 7.85 7.55 7.75 8.54AB: Crisil 1 Yr T-Bill Index 8.03 7.24 7.21 6.64
Value of `10000 InvestedNippon India Low Duration Fund 10,612 12,256 14,337 27,792B: NIFTY Low Duration Debt Index 10,783 12,440 14,530 29,504AB: Crisil 1 Yr T-Bill Index 10,801 12,331 14,172 23,358Inception Date: Mar 20, 2007Fund Manager: Anju Chhajer(Since Oct 2009); Vivek Sharma (Since Feb,2020)
Nippon India Prime Debt FundNAV as on May 29, 2020: ` 42.5531
ParticularsCAGR %
1 Year 3 Years 5 Years Since Inception
Nippon India Prime Debt Fund 7.24 7.26 7.74 7.62B:Custom Benchmark* 8.82 7.79 7.97 NAAB: Crisil 1 Yr T-Bill Index 8.03 7.24 7.21 6.53
Value of `10000 InvestedNippon India Prime Debt Fund 10,722 12,336 14,525 42,553B:Custom Benchmark* 10,880 12,522 14,677 NAAB: Crisil 1 Yr T-Bill Index 10,801 12,331 14,172 34,777Inception Date: Sep 14, 2000Fund Manager: Vivek Sharma (Since Feb,2020)*50% of NIFTY Short Duration Debt Index + 50% of NIFTY Low Duration Debt IndexNA has been mentioned for scheme in existence for more than 1 year but less than 3 years or 5 years or instances where benchmark data for corresponding period is not available.
Nippon India Banking & PSU Debt FundNAV as on May 29, 2020: ` 15.2828
ParticularsCAGR %
1 Year 3 Years 5 Years Since Inception
Nippon India Banking & PSU Debt Fund 11.62 8.62 8.72 8.77B: NIFTY Banking & PSU Debt Index 11.13 8.00 8.13 8.23AB: Crisil 1 Yr T-Bill Index 8.03 7.24 7.21 7.25
Value of `10000 InvestedNippon India Banking & PSU Debt Fund 11,159 12,814 15,195 15,283B: NIFTY Banking & PSU Debt Index 11,109 12,596 14,790 14,903AB: Crisil 1 Yr T-Bill Index 10,801 12,331 14,172 14,234Inception Date: May 15, 2015Fund Manager: Prashant Pimple (Since Feb,2020); Hardik Shah (Since Feb,2020)
Nippon India Floating Rate FundNAV as on May 29, 2020: ` 32.5898
ParticularsCAGR %
1 Year 3 Years 5 Years Since Inception
Nippon India Floating Rate Fund 9.98 7.76 7.87 7.78
B: CRISIL Short Term Bond Fund Index 10.47 8.17 8.38 7.70
AB: Crisil 1 Yr T-Bill Index 8.03 7.24 7.21 6.30
Value of `10000 Invested
Nippon India Floating Rate Fund 10,995 12,510 14,608 32,590
B: CRISIL Short Term Bond Fund Index 11,044 12,656 14,961 32,186
AB: Crisil 1 Yr T-Bill Index 10,801 12,331 14,172 26,200
Inception Date: Aug 27, 2004
Fund Manager: Anju Chhajer (Since Feb, 2020)
Nippon India Short Term FundNAV as on May 29, 2020: ` 38.4533
ParticularsCAGR %
1 Year 3 Years 5 Years Since Inception
Nippon India Short Term Fund 9.12 7.26 7.74 8.02
B: Crisil Short Term Bond Fund Index 10.47 8.17 8.38 7.35
AB: Crisil 1 Yr T-Bill Index 8.03 7.24 7.21 6.15
Value of `10000 Invested
Nippon India Short Term Fund 10,910 12,339 14,522 38,453
B: Crisil Short Term Bond Fund Index 11,044 12,656 14,961 34,515
AB: Crisil 1 Yr T-Bill Index 10,801 12,331 14,172 28,360
Inception Date: Dec 18, 2002
Fund Manager: Prashant Pimple (Since Oct 2008); Vivek Sharma (Since Feb,2020)
Nippon India Nivesh Lakshya FundNAV as on May 29, 2020: ` 13.3184
ParticularsCAGR %
1 Year 3 Years 5 Years Since Inception
Nippon India Nivesh Lakshya Fund 15.35 NA NA 16.29
B: Crisil Long Term Debt Index 15.46 NA NA 13.62
AB: Crisil 10 Yr Gilt Index 13.06 NA NA 13.04
Value of `10000 Invested
Nippon India Nivesh Lakshya Fund 11,530 NA NA 13,318
B: Crisil Long Term Debt Index 11,542 NA NA 12,743
AB: Crisil 10 Yr Gilt Index 11,302 NA NA 12,620
Inception Date: July 6, 2018
Fund Manager: Prashant Pimple (Since July 2018); Hardik Shah (Since Feb, 2020)
NA stands for schemes in existence for more than 1 year but less than 3 years or 5 years or instances where benchmark data for corresponding period is not available
Nippon India Credit Risk FundNAV as on May 29, 2020: ` 22.6967
ParticularsCAGR %
1 Year 3 Years 5 Years Since Inception
Nippon India Credit Risk Fund -10.62 -0.36 3.33 5.62
B: NIFTY Credit Risk Bond Index 9.45 8.11 8.74 8.93
AB: Crisil 10 Yr Gilt Index 13.06 7.38 8.29 6.83
Value of `10000 Invested
Nippon India Credit Risk Fund 8,941 9,893 11,783 22,697
B: NIFTY Credit Risk Bond Index 10,942 12,633 15,208 36,038
AB: Crisil 10 Yr Gilt Index 11,302 12,378 14,901 26,906
Inception Date: Jun 08, 2005
Fund Manager: Sushil Budhia (Since Feb,2020)
The scheme returns are inclusive of the impact of segregation of portfolio. For complete details, please refer SID/KIM of the Scheme.Segregated Portfolio 1 - Impact of segregation on NAV is negative (0.56%).Segregated Portfolio 2 - No impact of segregation on NAV beyond fair valuation of securities done on March 5,2020.
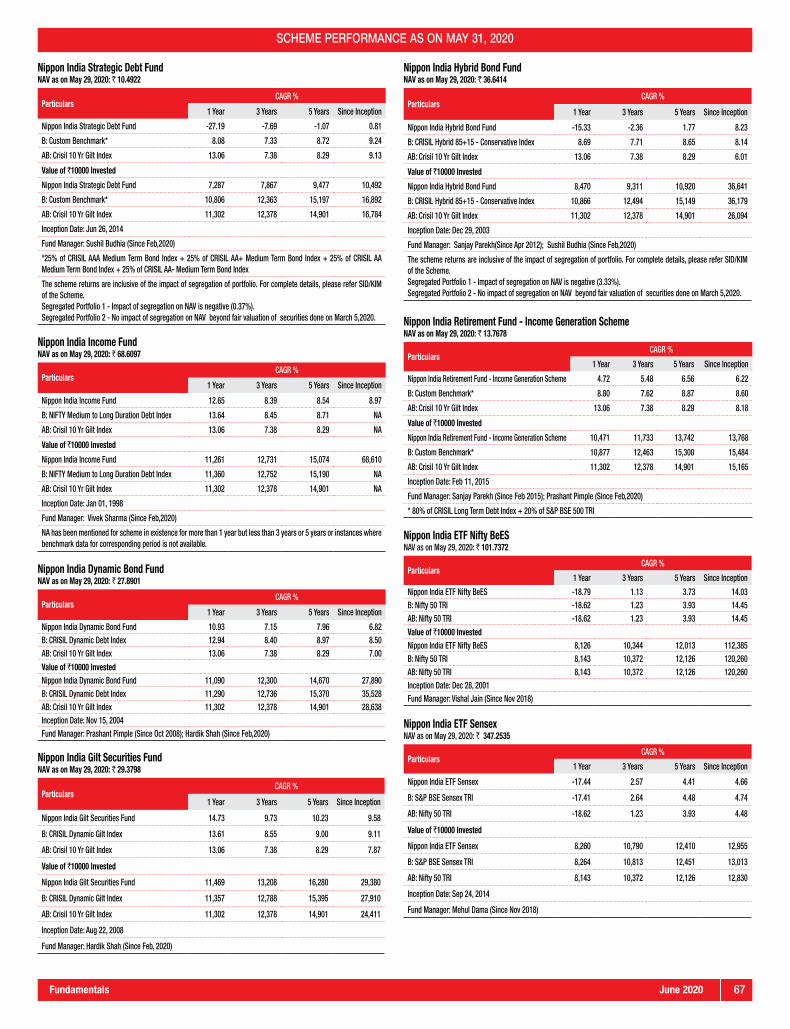
June 2020Fundamentals 67
SCHEME PERFORMANCE AS ON MAY 31, 2020
Nippon India Strategic Debt FundNAV as on May 29, 2020: ` 10.4922
ParticularsCAGR %
1 Year 3 Years 5 Years Since Inception
Nippon India Strategic Debt Fund -27.19 -7.69 -1.07 0.81
B: Custom Benchmark* 8.08 7.33 8.72 9.24
AB: Crisil 10 Yr Gilt Index 13.06 7.38 8.29 9.13
Value of `10000 Invested
Nippon India Strategic Debt Fund 7,287 7,867 9,477 10,492
B: Custom Benchmark* 10,806 12,363 15,197 16,892
AB: Crisil 10 Yr Gilt Index 11,302 12,378 14,901 16,784
Inception Date: Jun 26, 2014
Fund Manager: Sushil Budhia (Since Feb,2020)
*25% of CRISIL AAA Medium Term Bond Index + 25% of CRISIL AA+ Medium Term Bond Index + 25% of CRISIL AA Medium Term Bond Index + 25% of CRISIL AA- Medium Term Bond Index
The scheme returns are inclusive of the impact of segregation of portfolio. For complete details, please refer SID/KIM of the Scheme.Segregated Portfolio 1 - Impact of segregation on NAV is negative (0.37%).Segregated Portfolio 2 - No impact of segregation on NAV beyond fair valuation of securities done on March 5,2020.
Nippon India Income FundNAV as on May 29, 2020: ` 68.6097
ParticularsCAGR %
1 Year 3 Years 5 Years Since Inception
Nippon India Income Fund 12.65 8.39 8.54 8.97
B: NIFTY Medium to Long Duration Debt Index 13.64 8.45 8.71 NA
AB: Crisil 10 Yr Gilt Index 13.06 7.38 8.29 NA
Value of `10000 Invested
Nippon India Income Fund 11,261 12,731 15,074 68,610
B: NIFTY Medium to Long Duration Debt Index 11,360 12,752 15,190 NA
AB: Crisil 10 Yr Gilt Index 11,302 12,378 14,901 NA
Inception Date: Jan 01, 1998
Fund Manager: Vivek Sharma (Since Feb,2020)
NA has been mentioned for scheme in existence for more than 1 year but less than 3 years or 5 years or instances where benchmark data for corresponding period is not available.
Nippon India Dynamic Bond FundNAV as on May 29, 2020: ` 27.8901
ParticularsCAGR %
1 Year 3 Years 5 Years Since Inception
Nippon India Dynamic Bond Fund 10.93 7.15 7.96 6.82B: CRISIL Dynamic Debt Index 12.94 8.40 8.97 8.50AB: Crisil 10 Yr Gilt Index 13.06 7.38 8.29 7.00
Value of `10000 InvestedNippon India Dynamic Bond Fund 11,090 12,300 14,670 27,890B: CRISIL Dynamic Debt Index 11,290 12,736 15,370 35,528AB: Crisil 10 Yr Gilt Index 11,302 12,378 14,901 28,638Inception Date: Nov 15, 2004Fund Manager: Prashant Pimple (Since Oct 2008); Hardik Shah (Since Feb,2020)
Nippon India Gilt Securities FundNAV as on May 29, 2020: ` 29.3798
ParticularsCAGR %
1 Year 3 Years 5 Years Since Inception
Nippon India Gilt Securities Fund 14.73 9.73 10.23 9.58
B: CRISIL Dynamic Gilt Index 13.61 8.55 9.00 9.11
AB: Crisil 10 Yr Gilt Index 13.06 7.38 8.29 7.87
Value of `10000 Invested
Nippon India Gilt Securities Fund 11,469 13,208 16,280 29,380
B: CRISIL Dynamic Gilt Index 11,357 12,788 15,395 27,910
AB: Crisil 10 Yr Gilt Index 11,302 12,378 14,901 24,411
Inception Date: Aug 22, 2008
Fund Manager: Hardik Shah (Since Feb, 2020)
Nippon India Hybrid Bond FundNAV as on May 29, 2020: ` 36.6414
ParticularsCAGR %
1 Year 3 Years 5 Years Since Inception
Nippon India Hybrid Bond Fund -15.33 -2.36 1.77 8.23
B: CRISIL Hybrid 85+15 - Conservative Index 8.69 7.71 8.65 8.14
AB: Crisil 10 Yr Gilt Index 13.06 7.38 8.29 6.01
Value of `10000 Invested
Nippon India Hybrid Bond Fund 8,470 9,311 10,920 36,641
B: CRISIL Hybrid 85+15 - Conservative Index 10,866 12,494 15,149 36,179
AB: Crisil 10 Yr Gilt Index 11,302 12,378 14,901 26,094
Inception Date: Dec 29, 2003
Fund Manager: Sanjay Parekh(Since Apr 2012); Sushil Budhia (Since Feb,2020)
The scheme returns are inclusive of the impact of segregation of portfolio. For complete details, please refer SID/KIM of the Scheme.Segregated Portfolio 1 - Impact of segregation on NAV is negative (3.33%).Segregated Portfolio 2 - No impact of segregation on NAV beyond fair valuation of securities done on March 5,2020.
Nippon India Retirement Fund - Income Generation SchemeNAV as on May 29, 2020: ` 13.7678
ParticularsCAGR %
1 Year 3 Years 5 Years Since Inception
Nippon India Retirement Fund - Income Generation Scheme 4.72 5.48 6.56 6.22
B: Custom Benchmark* 8.80 7.62 8.87 8.60
AB: Crisil 10 Yr Gilt Index 13.06 7.38 8.29 8.18
Value of `10000 Invested
Nippon India Retirement Fund - Income Generation Scheme 10,471 11,733 13,742 13,768
B: Custom Benchmark* 10,877 12,463 15,300 15,484
AB: Crisil 10 Yr Gilt Index 11,302 12,378 14,901 15,165
Inception Date: Feb 11, 2015
Fund Manager: Sanjay Parekh (Since Feb 2015); Prashant Pimple (Since Feb,2020)
* 80% of CRISIL Long Term Debt Index + 20% of S&P BSE 500 TRI
Nippon India ETF Nifty BeESNAV as on May 29, 2020: ` 101.7372
ParticularsCAGR %
1 Year 3 Years 5 Years Since Inception
Nippon India ETF Nifty BeES -18.79 1.13 3.73 14.03B: Nifty 50 TRI -18.62 1.23 3.93 14.45AB: Nifty 50 TRI -18.62 1.23 3.93 14.45
Value of `10000 InvestedNippon India ETF Nifty BeES 8,126 10,344 12,013 112,385B: Nifty 50 TRI 8,143 10,372 12,126 120,260AB: Nifty 50 TRI 8,143 10,372 12,126 120,260Inception Date: Dec 28, 2001Fund Manager: Vishal Jain (Since Nov 2018)
Nippon India ETF SensexNAV as on May 29, 2020: ` 347.2535
ParticularsCAGR %
1 Year 3 Years 5 Years Since Inception
Nippon India ETF Sensex -17.44 2.57 4.41 4.66
B: S&P BSE Sensex TRI -17.41 2.64 4.48 4.74
AB: Nifty 50 TRI -18.62 1.23 3.93 4.48
Value of `10000 Invested
Nippon India ETF Sensex 8,260 10,790 12,410 12,955
B: S&P BSE Sensex TRI 8,264 10,813 12,451 13,013
AB: Nifty 50 TRI 8,143 10,372 12,126 12,830
Inception Date: Sep 24, 2014
Fund Manager: Mehul Dama (Since Nov 2018)

June 202068 Fundamentals
SCHEME PERFORMANCE AS ON MAY 31, 2020
Nippon India ETF NV20NAV as on May 29, 2020: ` 51.3692
ParticularsCAGR %
1 Year 3 Years 5 Years Since InceptionNippon India ETF NV20 -12.32 6.64 NA 6.74B: Nifty 50 Value 20 TRI -11.09 7.40 NA 7.37AB: S&P BSE Sensex TRI -17.41 2.64 NA 4.98Value of `10000 InvestedNippon India ETF NV20 8,771 12,124 NA 13,812B: Nifty 50 Value 20 TRI 8,894 12,385 NA 14,220AB: S&P BSE Sensex TRI 8,264 10,813 NA 12,719Inception Date: Jun 18, 2015Fund Manager: Mehul Dama (Since Nov 2018)NA has been mentioned for scheme in existence for more than 1 year but less than 3 years or 5 years or instances where benchmark data for corresponding period is not available.
Nippon India ETF Junior BeESNAV as on May 29, 2020: ` 250.8987
ParticularsCAGR %
1 Year 3 Years 5 Years Since Inception
Nippon India ETF Junior BeES -12.47 -1.67 4.72 18.29B: Nifty Next 50 TRI -12.49 -1.45 5.32 19.50AB: Nifty 50 TRI -18.62 1.23 3.93 15.14Value of `10000 InvestedNippon India ETF Junior BeES 8,756 9,507 12,595 182,162B: Nifty Next 50 TRI 8,754 9,571 12,965 217,264AB: Nifty 50 TRI 8,143 10,372 12,126 114,264Inception Date: Feb 21, 2003Fund Manager: Vishal Jain (Since Nov 2018)
Nippon India ETF Nifty 100NAV as on May 29, 2020: ` 100.2107
ParticularsCAGR %
1 Year 3 Years 5 Years Since Inception
Nippon India ETF Nifty 100 -18.75 -0.25 3.15 8.58B: Nifty 100 TRI -17.83 0.82 4.18 9.62AB: S&P BSE Sensex TRI -17.41 2.64 4.48 9.41Value of `10000 InvestedNippon India ETF Nifty 100 8,129 9,924 11,678 18,074B: Nifty 100 TRI 8,222 10,249 12,277 19,353AB: S&P BSE Sensex TRI 8,264 10,813 12,451 19,097Inception Date: Mar 22, 2013Fund Manager: Mehul Dama (Since Nov 2018)
Nippon India ETF ConsumptionNAV as on May 29, 2020: ` 49.3382
ParticularsCAGR %
1 Year 3 Years 5 Years Since Inception
Nippon India ETF Consumption -3.08 3.43 7.03 10.49B: Nifty India Consumption TRI -2.96 3.56 7.06 10.57AB: S&P BSE Sensex TRI -17.41 2.64 4.48 7.54Value of `10000 InvestedNippon India ETF Consumption 9,693 11,063 14,053 18,485B: Nifty India Consumption TRI 9,705 11,106 14,067 18,568AB: S&P BSE Sensex TRI 8,264 10,813 12,451 15,649Inception Date: Apr 3, 2014Fund Manager: Mehul Dama (Since Nov 2018)
Nippon India ETF Dividend OpportunitiesNAV as on May 29, 2020: ` 25.1438
ParticularsCAGR %
1 Year 3 Years 5 Years Since Inception
Nippon India ETF Dividend Opportunities -18.36 -1.39 3.75 6.40B: Nifty Dividend Opportunities 50 TRI -18.76 -1.41 3.70 6.43AB: S&P BSE Sensex TRI -17.41 2.64 4.48 7.60Value of `10000 InvestedNippon India ETF Dividend Opportunities 8,169 9,590 12,026 14,627B: Nifty Dividend Opportunities 50 TRI 8,129 9,585 11,994 14,649AB: S&P BSE Sensex TRI 8,264 10,813 12,451 15,665Inception Date: Apr 15, 2014Fund Manager: Mehul Dama (Since Nov 2018)
Nippon India ETF Infra BeESNAV as on May 29, 2020: ` 294.4097
ParticularsCAGR %
1 Year 3 Years 5 Years Since InceptionNippon India ETF Infra BeES -14.27 -3.35 -1.93 -2.42B: Nifty Infrastructure TRI -13.12 -2.17 -0.86 -1.37AB: Nifty 50 TRI -18.62 1.23 3.93 6.26Value of `10000 InvestedNippon India ETF Infra BeES 8,577 9,030 9,068 7,888B: Nifty Infrastructure TRI 8,691 9,365 9,576 8,750AB: Nifty 50 TRI 8,143 10,372 12,126 17,989Inception Date: Sep 29, 2010Fund Manager: Mehul Dama (Since Nov 2018)
Nippon India ETF Bank BeESNAV as on May 29, 2020: ` 194.1890
ParticularsCAGR %
1 Year 3 Years 5 Years Since InceptionNippon India ETF Bank BeES -39.23 -6.41 0.69 14.29B: Nifty Bank TRI -38.30 -5.83 1.24 14.86AB: Nifty 50 TRI -18.62 1.23 3.93 13.35Value of `10000 InvestedNippon India ETF Bank BeES 6,085 8,199 10,352 84,897B: Nifty Bank TRI 6,178 8,352 10,635 91,916AB: Nifty 50 TRI 8,143 10,372 12,126 74,365Inception Date: May 27, 2004Fund Manager: Vishal Jain (Since Nov 2018)
Nippon India ETF PSU Bank BeESNAV as on May 29, 2020: ` 12.4256
ParticularsCAGR %
1 Year 3 Years 5 Years Since InceptionNippon India ETF PSU Bank BeES -65.41 -31.83 -20.37 -5.67B: Nifty PSU Bank TRI -65.31 -31.50 -19.99 -5.22AB: Nifty 50 TRI -18.62 1.23 3.93 5.64Value of `10000 InvestedNippon India ETF PSU Bank BeES 3,469 3,172 3,198 4,790B: Nifty PSU Bank TRI 3,479 3,218 3,274 5,091AB: Nifty 50 TRI 8,143 10,372 12,126 19,974Inception Date: Oct 25, 2007Fund Manager: Mehul Dama (Since Nov 2018)
Nippon India ETF Shariah BeESNAV as on May 29, 2020: ` 241.5593
ParticularsCAGR %
1 Year 3 Years 5 Years Since InceptionNippon India ETF Shariah BeES -6.91 2.51 5.27 12.42B: Nifty 50 Shariah TRI -6.03 3.72 6.45 13.53AB: Nifty 50 TRI -18.62 1.23 3.93 12.97Value of `10000 InvestedNippon India ETF Shariah BeES 9,311 10,770 12,931 37,139B: Nifty 50 Shariah TRI 9,398 11,158 13,672 41,441AB: Nifty 50 TRI 8,143 10,372 12,126 39,236Inception Date: Mar 18, 2009Fund Manager: Mehul Dama (Since Nov 2018)
Nippon India ETF Hang Seng BeESNAV as on May 29, 2020: ` 283.7950
ParticularsCAGR %
1 Year 3 Years 5 Years Since Inception
Nippon India ETF Hang Seng BeES -4.57 4.20 2.23 8.44
B: Hang Seng TRI -3.92 5.22 3.30 9.53
AB: Nifty 50 TRI -18.62 1.23 3.93 7.68
Value of `10000 Invested
Nippon India ETF Hang Seng BeES 9,544 11,313 11,167 22,907
B: Hang Seng TRI 9,609 11,647 11,763 25,369
AB: Nifty 50 TRI 8,143 10,372 12,126 21,309
Inception Date: Mar 09, 2010
Fund Manager: Siddharth Deb (Since Nov 2016), Kinjal Desai (Since May 2018)
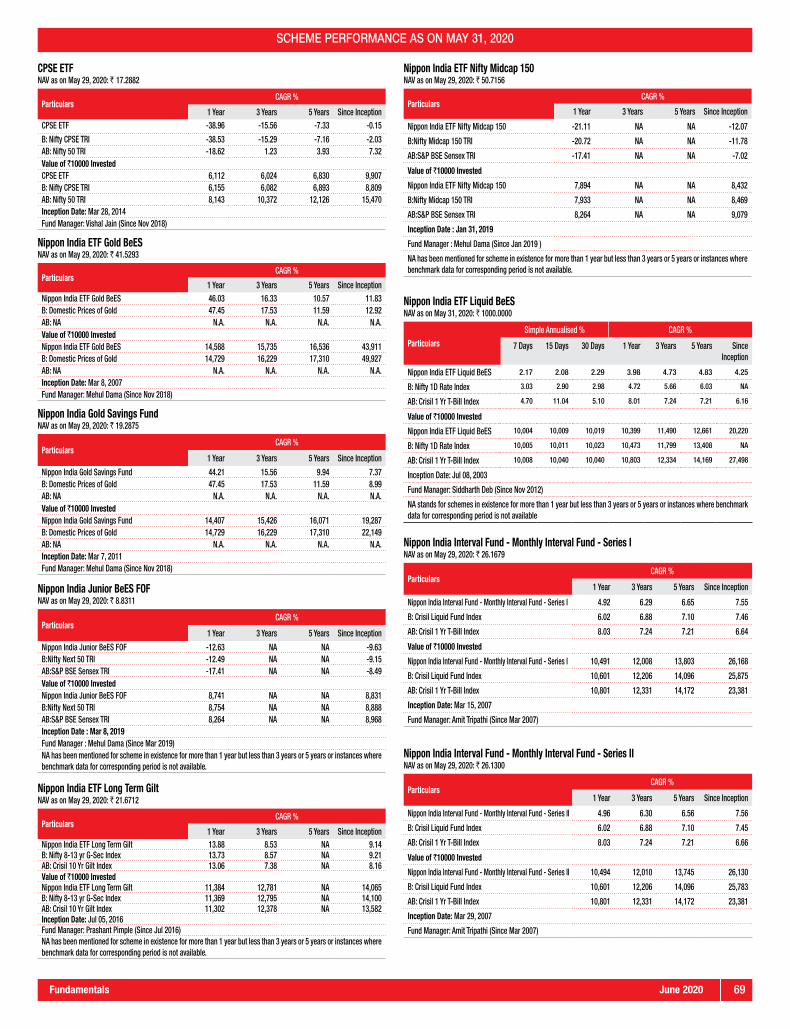
June 2020Fundamentals 69
SCHEME PERFORMANCE AS ON MAY 31, 2020
CPSE ETFNAV as on May 29, 2020: ` 17.2882
ParticularsCAGR %
1 Year 3 Years 5 Years Since InceptionCPSE ETF -38.96 -15.56 -7.33 -0.15
B: Nifty CPSE TRI -38.53 -15.29 -7.16 -2.03AB: Nifty 50 TRI -18.62 1.23 3.93 7.32Value of `10000 InvestedCPSE ETF 6,112 6,024 6,830 9,907B: Nifty CPSE TRI 6,155 6,082 6,893 8,809AB: Nifty 50 TRI 8,143 10,372 12,126 15,470Inception Date: Mar 28, 2014Fund Manager: Vishal Jain (Since Nov 2018)
Nippon India ETF Gold BeESNAV as on May 29, 2020: ` 41.5293
ParticularsCAGR %
1 Year 3 Years 5 Years Since InceptionNippon India ETF Gold BeES 46.03 16.33 10.57 11.83B: Domestic Prices of Gold 47.45 17.53 11.59 12.92AB: NA N.A. N.A. N.A. N.A.Value of `10000 InvestedNippon India ETF Gold BeES 14,588 15,735 16,536 43,911B: Domestic Prices of Gold 14,729 16,229 17,310 49,927AB: NA N.A. N.A. N.A. N.A.Inception Date: Mar 8, 2007Fund Manager: Mehul Dama (Since Nov 2018)
Nippon India Gold Savings FundNAV as on May 29, 2020: ` 19.2875
ParticularsCAGR %
1 Year 3 Years 5 Years Since Inception
Nippon India Gold Savings Fund 44.21 15.56 9.94 7.37B: Domestic Prices of Gold 47.45 17.53 11.59 8.99AB: NA N.A. N.A. N.A. N.A.Value of `10000 InvestedNippon India Gold Savings Fund 14,407 15,426 16,071 19,287B: Domestic Prices of Gold 14,729 16,229 17,310 22,149AB: NA N.A. N.A. N.A. N.A.Inception Date: Mar 7, 2011Fund Manager: Mehul Dama (Since Nov 2018)
Nippon India Junior BeES FOFNAV as on May 29, 2020: ` 8.8311
ParticularsCAGR %
1 Year 3 Years 5 Years Since Inception
Nippon India Junior BeES FOF -12.63 NA NA -9.63B:Nifty Next 50 TRI -12.49 NA NA -9.15AB:S&P BSE Sensex TRI -17.41 NA NA -8.49Value of `10000 InvestedNippon India Junior BeES FOF 8,741 NA NA 8,831B:Nifty Next 50 TRI 8,754 NA NA 8,888AB:S&P BSE Sensex TRI 8,264 NA NA 8,968Inception Date : Mar 8, 2019Fund Manager : Mehul Dama (Since Mar 2019)NA has been mentioned for scheme in existence for more than 1 year but less than 3 years or 5 years or instances where benchmark data for corresponding period is not available.
Nippon India ETF Long Term GiltNAV as on May 29, 2020: ` 21.6712
ParticularsCAGR %
1 Year 3 Years 5 Years Since InceptionNippon India ETF Long Term Gilt 13.88 8.53 NA 9.14B: Nifty 8-13 yr G-Sec Index 13.73 8.57 NA 9.21AB: Crisil 10 Yr Gilt Index 13.06 7.38 NA 8.16Value of `10000 InvestedNippon India ETF Long Term Gilt 11,384 12,781 NA 14,065B: Nifty 8-13 yr G-Sec Index 11,369 12,795 NA 14,100AB: Crisil 10 Yr Gilt Index 11,302 12,378 NA 13,582Inception Date: Jul 05, 2016Fund Manager: Prashant Pimple (Since Jul 2016)NA has been mentioned for scheme in existence for more than 1 year but less than 3 years or 5 years or instances where benchmark data for corresponding period is not available.
Nippon India ETF Nifty Midcap 150NAV as on May 29, 2020: ` 50.7156
ParticularsCAGR %
1 Year 3 Years 5 Years Since Inception
Nippon India ETF Nifty Midcap 150 -21.11 NA NA -12.07
B:Nifty Midcap 150 TRI -20.72 NA NA -11.78
AB:S&P BSE Sensex TRI -17.41 NA NA -7.02
Value of `10000 Invested
Nippon India ETF Nifty Midcap 150 7,894 NA NA 8,432
B:Nifty Midcap 150 TRI 7,933 NA NA 8,469
AB:S&P BSE Sensex TRI 8,264 NA NA 9,079
Inception Date : Jan 31, 2019
Fund Manager : Mehul Dama (Since Jan 2019 )
NA has been mentioned for scheme in existence for more than 1 year but less than 3 years or 5 years or instances where benchmark data for corresponding period is not available.
Nippon India ETF Liquid BeESNAV as on May 31, 2020: ` 1000.0000
ParticularsSimple Annualised % CAGR %
7 Days 15 Days 30 Days 1 Year 3 Years 5 Years Since Inception
Nippon India ETF Liquid BeES 2.17 2.08 2.29 3.98 4.73 4.83 4.25
B: Nifty 1D Rate Index 3.03 2.90 2.98 4.72 5.66 6.03 NA
AB: Crisil 1 Yr T-Bill Index 4.70 11.04 5.10 8.01 7.24 7.21 6.16
Value of `10000 Invested
Nippon India ETF Liquid BeES 10,004 10,009 10,019 10,399 11,490 12,661 20,220
B: Nifty 1D Rate Index 10,005 10,011 10,023 10,473 11,799 13,408 NA
AB: Crisil 1 Yr T-Bill Index 10,008 10,040 10,040 10,803 12,334 14,169 27,498
Inception Date: Jul 08, 2003
Fund Manager: Siddharth Deb (Since Nov 2012)
NA stands for schemes in existence for more than 1 year but less than 3 years or 5 years or instances where benchmark data for corresponding period is not available
Nippon India Interval Fund - Monthly Interval Fund - Series INAV as on May 29, 2020: ` 26.1679
ParticularsCAGR %
1 Year 3 Years 5 Years Since Inception
Nippon India Interval Fund - Monthly Interval Fund - Series I 4.92 6.29 6.65 7.55
B: Crisil Liquid Fund Index 6.02 6.88 7.10 7.46
AB: Crisil 1 Yr T-Bill Index 8.03 7.24 7.21 6.64
Value of `10000 Invested
Nippon India Interval Fund - Monthly Interval Fund - Series I 10,491 12,008 13,803 26,168
B: Crisil Liquid Fund Index 10,601 12,206 14,096 25,875
AB: Crisil 1 Yr T-Bill Index 10,801 12,331 14,172 23,381
Inception Date: Mar 15, 2007
Fund Manager: Amit Tripathi (Since Mar 2007)
Nippon India Interval Fund - Monthly Interval Fund - Series IINAV as on May 29, 2020: ` 26.1300
ParticularsCAGR %
1 Year 3 Years 5 Years Since Inception
Nippon India Interval Fund - Monthly Interval Fund - Series II 4.96 6.30 6.56 7.56
B: Crisil Liquid Fund Index 6.02 6.88 7.10 7.45
AB: Crisil 1 Yr T-Bill Index 8.03 7.24 7.21 6.66
Value of `10000 Invested
Nippon India Interval Fund - Monthly Interval Fund - Series II 10,494 12,010 13,745 26,130
B: Crisil Liquid Fund Index 10,601 12,206 14,096 25,783
AB: Crisil 1 Yr T-Bill Index 10,801 12,331 14,172 23,381
Inception Date: Mar 29, 2007
Fund Manager: Amit Tripathi (Since Mar 2007)

June 202070 Fundamentals
SCHEME PERFORMANCE AS ON MAY 31, 2020
Nippon India Interval Fund - Quarterly Interval Fund - Series INAV as on May 29, 2020: ` 26.7231
ParticularsCAGR %
1 Year 3 Years 5 Years Since Inception
Nippon India Interval Fund - Quarterly Interval Fund - Series I 4.56 6.33 6.68 7.75B: Crisil Liquid Fund Index 6.02 6.88 7.10 7.43AB: Crisil 1 Yr T-Bill Index 8.03 7.24 7.21 6.65
Value of `10000 InvestedNippon India Interval Fund - Quarterly Interval Fund - Series I 10,455 12,021 13,820 26,723B: Crisil Liquid Fund Index 10,601 12,206 14,096 25,702AB: Crisil 1 Yr T-Bill Index 10,801 12,331 14,172 23,336Inception Date: Apr 03, 2007Fund Manager: Amit Tripathi (Since Apr 2007)
Nippon India Interval Fund - Quarterly Interval Fund - Series IINAV as on May 29, 2020: ` 27.4826
ParticularsCAGR %
1 Year 3 Years 5 Years Since Inception
Nippon India Interval Fund - Quarterly Interval Fund - Series II
5.64 7.09 7.22 8.04
B: Crisil Liquid Fund Index 6.02 6.88 7.10 7.41AB: Crisil 1 Yr T-Bill Index 8.03 7.24 7.21 6.63
Value of `10000 InvestedNippon India Interval Fund - Quarterly Interval Fund - Series II 10,562 12,279 14,175 27,483B: Crisil Liquid Fund Index 10,601 12,206 14,096 25,455AB: Crisil 1 Yr T-Bill Index 10,801 12,331 14,172 23,143Inception Date: May 07, 2007Fund Manager: Amit Tripathi (Since May 2007)
Nippon India Interval Fund - Quarterly Interval Fund - Series IIINAV as on May 29, 2020: ` 26.6379
ParticularsCAGR %
1 Year 3 Years 5 Years Since Inception
Nippon India Interval Fund - Quarterly Interval Fund - Series III 4.65 6.27 6.75 7.83
B: Crisil Liquid Fund Index 6.02 6.88 7.10 7.39
AB: Crisil 1 Yr T-Bill Index 8.03 7.24 7.21 6.63
Value of `10000 Invested
Nippon India Interval Fund - Quarterly Interval Fund - Series III 10,463 11,999 13,866 26,638
B: Crisil Liquid Fund Index 10,601 12,206 14,096 25,232
AB: Crisil 1 Yr T-Bill Index 10,801 12,331 14,172 23,009
Inception Date: Jun 06, 2007Fund Manager: Amit Tripathi (Since Jun 2007)
Nippon India Interval Fund - Annual Interval Fund - Series INAV as on May 29, 2020: ` 20.3734
ParticularsCAGR %
1 Year 3 Years 5 Years Since Inception
Nippon India Interval Fund - Annual Interval Fund - Series I 6.42 7.08 7.39 5.59
B: Crisil Short Term Bond Fund Index 10.47 8.17 8.38 8.29
AB: Crisil 10 Yr Gilt Index 13.06 7.38 8.29 7.39
Value of `10000 Invested
Nippon India Interval Fund - Annual Interval Fund - Series I 10,640 12,276 14,289 20,373
B: Crisil Short Term Bond Fund Index 11,044 12,656 14,961 28,336
AB: Crisil 10 Yr Gilt Index 11,302 12,378 14,901 25,408
Inception Date: May 26, 2011
Fund Manager: Amit Tripathi (Since May 2011)
Nippon India Yearly Interval Fund - Series 1NAV as on May 29, 2020: ` 17.7066
ParticularsCAGR %
1 Year 3 Years 5 Years Since Inception
Nippon India Yearly Interval Fund - Series 1 7.48 7.49 7.64 8.08
B: Crisil Short Term Bond Fund Index 10.47 8.17 8.38 8.69
AB: Crisil 1 Yr T-Bill Index 8.03 7.24 7.21 7.24
Value of `10000 Invested
Nippon India Yearly Interval Fund - Series 1 10,746 12,416 14,455 17,707
B: Crisil Short Term Bond Fund Index 11,044 12,656 14,961 18,446
AB: Crisil 1 Yr T-Bill Index 10,801 12,331 14,172 16,719
Inception Date: Jan 23, 2013
Fund Manager: Amit Tripathi (Since Jan 2013)
Performance as on May 31, 2020B: Benchmark, AB: Additional Benchmark, TRI: Total Return IndexTRI - Total Returns Index reflects the returns on the index arising from (a) constituent stock price movements and (b) dividend receipts from constituent index stocks, thereby showing a true picture of returns. The performance of the equity scheme is benchmarked to the Total Return variant of the Index.Different plans shall have a different expense structure. The performance details provided herein are of Growth Plan (Regular Plan), except for Nippon India ETF Liquid BeES, where the performance provided are of Daily Dividend Re-investment Plan. For Exchange Traded Funds of Nippon India Mutual Fund, performance is provided at Scheme level using Dividend Reinvestment NAV's, since there are no separate plan/option under such Schemes.
Period for which scheme’s performance has been provided is computed basis last day of the month-end preceding the date of advertisement.Past performance may or may not be sustained in future and the same may not necessarily provide the basis for comparison with other investment. Performance of the schemes (wherever provided) are calculated basis CAGR for the past 1 year, 3 years, 5 years and since inception. Further (wherever applicable), Returns for 7 days, 15 days and 30 days are computed on a simple annualized basis. Dividends (if any) are assumed to be reinvested at the prevailing NAV. In case of LIQUIDBEES, returns are based on gross dividend per unit declared by the Fund. Bonus (if any) declared has been adjusted. Performance of dividend option would be Net of Dividend distribution tax, if any. Face value of scheme is `10/- per unit. Face Value of Nippon India Low Duration Fund is `1000/- per unit. Face Value of Nippon India Money Market Fund, Nippon India Liquid Fund & Nippon India Ultra Short Duration Fund is `1000/- per unit w.e.f 5th Aug 2012. Face value of Nippon India ETF Junior BeES is `1.25 per unit. Face value of Nippon India ETF Liquid BeES is `1000. Face value of Nippon India Overnight Fund is `100 per unit. Face Value of Nippon India ETF Nifty BeES, Nippon India ETF Bank BeES, Nippon India ETF PSU Bank BeES, Nippon India ETF NV20, Nippon India ETF Hang Seng BeES has changed from `10/- per unit to `1/- per unit. w.e.f 20th Dec 2019. Face value of Nippon India ETF Gold BeES has changed from `100/- per unit to `1/- per unit w.e.f 20th Dec 2019. In case, the start/end date of the concerned period is non-business day (NBD), the NAV of the previous date is considered for computation of returns. Schemes which have not completed one year, performance details for the same are not provided. Performance details of closed ended schemes are not provided since these are not comparable with other schemes.
Product Label (Nippon India Interval Fund - A Debt Oriented Interval Scheme) This product is suitable for investors who are seeking*:
Investors understand that their principalwill be at Moderately Low risk
• Regular returns & growth of capital over the term of the fund, with the flexibility to enter / exit at fixed intervals
• Investment in fixed income securities, money market and G-sec instruments
*Investors should consult their financial advisors if in doubt about whether the product is suitable for them.

June 2020Fundamentals 71
SCHEME PERFORMANCE - FUND MANAGER WISE AS ON MAY 31, 2020Fund Manager: Manish Gunwani
Scheme Name/sCAGR %
1 Year Return 3 Years Return 5 Years ReturnScheme Benchmark Scheme Benchmark Scheme Benchmark
Nippon India Balanced Advantage Fund -10.16 -6.69 0.96 3.81 3.96 6.36Nippon India Growth Fund -19.97 -20.54 -3.20 -5.79 2.40 3.23
Note:a. Mr. Manish Gunwani manages 2 open-ended schemes of Nippon India Mutual Fund.b. In case the number of schemes managed by a fund manager is more than six, in the performance data of other schemes, the top 3 and bottom 3 schemes managed by fund manager has been provided herein.c. Period for which scheme’s performance has been provided is computed basis last day of the month-end preceding the date of advertisement.d. Different plans shall have a different expense structure. The performance details provided herein are of Growth Plan (Regular Plan).
Fund Manager: Sailesh Raj Bhan
Scheme Name/sCAGR %
1 Year Return 3 Years Return 5 Years ReturnScheme Benchmark Scheme Benchmark Scheme Benchmark
Nippon India Pharma Fund 29.40 18.94 15.31 5.68 6.39 -0.87Nippon India Consumption Fund -5.83 -2.96 -1.45 3.56 4.57 7.06Nippon India Large Cap Fund -28.55 -18.42 -3.56 0.56 1.47 3.97Nippon India Multi Cap Fund -34.75 -18.93 -7.13 -0.76 -2.38 3.75
Note:a. Mr. Sailesh Raj Bhan manages 4 open-ended schemes of Nippon India Mutual Fund .b. In case the number of schemes managed by a fund manager is more than six, in the performance data of other schemes, the top 3 and bottom 3 schemes managed by fund manager has been provided herein.c. Period for which scheme’s performance has been provided is computed basis last day of the month-end preceding the date of advertisementd. Different plans shall have a different expense structure. The performance details provided herein are of Growth Plan (Regular Plan).
Fund Manager: Ashwani Kumar
Scheme Name/sCAGR %
1 Year Return 3 Years Return 5 Years ReturnScheme Benchmark Scheme Benchmark Scheme Benchmark
Nippon India Tax Saver (ELSS) Fund -32.82 -18.42 -12.52 0.56 -4.19 3.97
Note:a. Mr. Ashwani Kumar manages 1 open-ended scheme of Nippon India Mutual Fund .b. In case the number of schemes managed by a fund manager is more than six, in the performance data of other schemes, the top 3 and bottom 3 schemes managed by fund manager has been provided herein.c. Period for which scheme’s performance has been provided is computed basis last day of the month-end preceding the date of advertisementd. Different plans shall have a different expense structure. The performance details provided herein are of Growth Plan (Regular Plan).
Fund Manager: Anand Gupta
Scheme Name/sCAGR %
1 Year Return 3 Years Return 5 Years ReturnScheme Benchmark Scheme Benchmark Scheme Benchmark
Nippon India Arbitrage Fund 6.09 5.05 6.45 5.26 6.39 5.53
Nippon India Equity Savings Fund ## -24.75 -0.99 -6.76 5.42 -0.88 6.32
Note:a. Mr. Anand Gupta manages 2 open-ended schemes of Nippon India Mutual Fund .b. In case the number of schemes managed by a fund manager is more than six, in the performance data of other schemes, the top 3 and bottom 3 schemes managed by fund manager has been provided herein.c. Period for which scheme’s performance has been provided is computed basis last day of the month-end preceding the date of advertisementd. Different plans shall have a different expense structure. The performance details provided herein are of Growth Plan (Regular Plan).
Fund Manager: Sanjay Parekh
Scheme Name/sCAGR %
1 Year Return 3 Years Return 5 Years ReturnScheme Benchmark Scheme Benchmark Scheme Benchmark
Nippon India Retirement Fund - Income Generation Scheme 4.72 8.80 5.48 7.62 6.56 8.87Nippon India Hybrid Bond Fund ## -15.33 8.69 -2.36 7.71 1.77 8.65Nippon India Equity Savings Fund ## -24.75 -0.99 -6.76 5.42 -0.88 6.32Nippon India Equity Hybrid Fund ## -28.52 -6.69 -8.14 3.81 -0.56 6.36Nippon India Retirement Fund - Wealth Creation Scheme -31.64 -18.93 -7.58 -0.76 -1.23 3.75
Note:a. Mr. Sanjay Parekh manages 5 open-ended schemes of Nippon India Mutual Fund .b. In case the number of schemes managed by a fund manager is more than six, in the performance data of other schemes, the top 3 and bottom 3 schemes managed by fund manager has been provided herein.c. Period for which scheme’s performance has been provided is computed basis last day of the month-end preceding the date of advertisementd. Different plans shall have a different expense structure. The performance details provided herein are of Growth Plan (Regular Plan).
Fund Manager: Samir Rachh
Scheme Name/sCAGR %
1 Year Return 3 Years Return 5 Years ReturnScheme Benchmark Scheme Benchmark Scheme Benchmark
Nippon India Small Cap Fund -25.52 -25.74 -5.73 -9.40 4.87 0.25
Note:a. Mr. Samir Rachh manages 1 open-ended scheme of Nippon India Mutual Fund .b. In case the number of schemes managed by a fund manager is more than six, in the performance data of other schemes, the top 3 and bottom 3 schemes managed by fund manager has been provided herein.c. Period for which scheme’s performance has been provided is computed basis last day of the month-end preceding the date of advertisementd. Different plans shall have a different expense structure. The performance details provided herein are of Growth Plan (Regular Plan).

June 202072 Fundamentals
SCHEME PERFORMANCE - FUND MANAGER WISE AS ON MAY 31, 2020Co-Fund Manager: Dhrumil Shah
Scheme Name/sCAGR %
1 Year Return 3 Years Return 5 Years ReturnScheme Benchmark Scheme Benchmark Scheme Benchmark
Nippon India Growth Fund -19.97 -20.54 -3.20 -5.79 2.40 3.23
Note:a. Mr. Dhrumil Shah manages 1 open-ended scheme of Nippon India Mutual Fund .b. In case the number of schemes managed by a fund manager is more than six, in the performance data of other schemes, the top 3 and bottom 3 schemes managed by fund manager has been provided herein.c. Period for which scheme’s performance has been provided is computed basis last day of the month-end preceding the date of advertisementd. Different plans shall have a different expense structure. The performance details provided herein is of Growth Plan (Regular Plan).
Fund Manager: Vishal Jain
Scheme Name/s
CAGR %
1 Year Return 3 Years Return 5 Years Return
Scheme Benchmark Scheme Benchmark Scheme Benchmark
Nippon India ETF Junior BeES -12.47 -12.49 -1.67 -1.45 4.72 5.32
Nippon India ETF Nifty BeES -18.79 -18.62 1.13 1.23 3.73 3.93
CPSE ETF -38.96 -38.53 -15.56 -15.29 -7.33 -7.16
Nippon India ETF Bank BeES -39.23 -38.30 -6.41 -5.83 0.69 1.24
Note:a. Mr. Vishal Jain manages 4 open-ended schemes of Nippon India Mutual Fund .b. In case the number of schemes managed by a fund manager is more than six, in the performance data of other schemes, the top 3 and bottom 3 schemes managed by fund manager has been provided herein are on the basis of 1 Year CAGR returnsc. Period for which scheme’s performance has been provided is computed basis last day of the month-end preceding the date of advertisementd. Different plans shall have a different expense structure. The Scheme does not offer any Plans/Options. The performance details are provided at Scheme level using Dividend Reinvestment NAV's.
Fund Manager: Mehul Dama
Scheme Name/s
CAGR %
1 Year Return 3 Years Return 5 Years Return
Scheme Benchmark Scheme Benchmark Scheme Benchmark
TOP 3
Nippon India ETF Gold BeES* 46.03 47.45 16.33 17.53 10.57 11.59
Nippon India Gold Savings Fund# 44.21 47.45 15.56 17.53 9.94 11.59
Nippon India ETF Consumption* -3.08 -2.96 3.43 3.56 7.03 7.06
BOTTOM 3
Nippon India Index Fund - Nifty Plan# -19.72 -18.62 0.04 1.23 2.62 3.93
Nippon India ETF Nifty Midcap 150* -21.11 -20.72 N.A. N.A. N.A. N.A.
Nippon India ETF PSU Bank BeES* -65.41 -65.31 -31.83 -31.50 -20.37 -19.99
Note:a. Mr. Mehul Dama manages 15 open-ended schemes of Nippon India Mutual Fund .b. In case the number of schemes managed by a fund manager is more than six, in the performance data of other schemes, the top 3 and bottom 3 schemes managed by fund manager has been provided herein are on the basis of 1 Year CAGR
returnsc. Period for which scheme’s performance has been provided is computed basis last day of the month-end preceding the date of advertisementd. Different plans shall have a different expense structure. # The performance details provided herein are of Growth Plan (Regular Plan).* The Scheme does not offer any Plans/Options. The performance details are provided at Scheme level using Dividend Reinvestment NAV's.
Fund manager: Ashutosh Bhargava
Scheme Name/s
CAGR %
1 Year Return 3 Years Return 5 Years Return
Scheme Benchmark Scheme Benchmark Scheme Benchmark
Nippon India Balanced Advantage Fund# -10.16 -6.69 0.96 3.81 3.96 6.36
Nippon India Quant Fund -13.35 -17.90 -0.63 0.29 2.43 4.11
Note:a. Mr. Ashutosh Bhargava manages 2 open-ended schemes of Nippon India Mutual Fund .b. In case the number of schemes managed by a fund manager is more than six, in the performance data of other schemes, the top 3 and bottom 3 schemes managed by fund manager has been provided herein.c. Period for which scheme’s performance has been provided is computed basis last day of the month-end preceding the date of advertisementd. Different plans shall have a different expense structure. The performance details provided herein is of Growth Plan (Regular Plan).# Co-Fund Manager
Fund Manager: Sanjay Doshi
Scheme Name/s
CAGR %
1 Year Return 3 Years Return 5 Years Return
Scheme Benchmark Scheme Benchmark Scheme Benchmark
Nippon India Vision Fund# -24.54 -19.18 -7.99 -1.47 -1.49 4.27
Nippon India Power & Infra Fund -28.86 -13.12 -9.60 -2.17 0.07 -0.86
Note:a. Mr. Sanjay Doshi manages 2 open-ended schemes of Nippon India Mutual Fund . b. In case the number of schemes managed by a fund manager is more than six, in the performance data of other schemes, the top 3 and bottom 3 schemes managed by fund manager has been provided herein. c. Period for which scheme’s performance has been provided is computed basis last day of the month-end preceding the date of advertisement d. Different plans shall have a different expense structure. The performance details provided herein is of Growth Plan (Regular Plan).# Co-Fund Manager
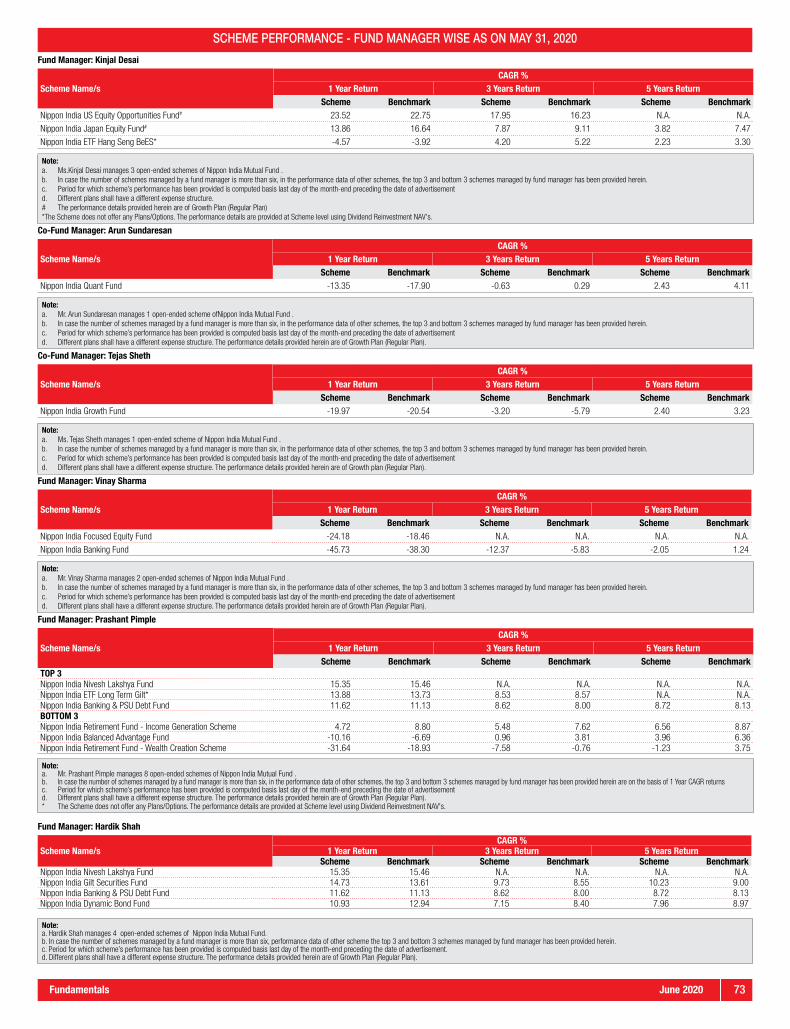
June 2020Fundamentals 73
SCHEME PERFORMANCE - FUND MANAGER WISE AS ON MAY 31, 2020
Fund Manager: Kinjal Desai
Scheme Name/sCAGR %
1 Year Return 3 Years Return 5 Years ReturnScheme Benchmark Scheme Benchmark Scheme Benchmark
Nippon India US Equity Opportunities Fund# 23.52 22.75 17.95 16.23 N.A. N.A.
Nippon India Japan Equity Fund# 13.86 16.64 7.87 9.11 3.82 7.47
Nippon India ETF Hang Seng BeES* -4.57 -3.92 4.20 5.22 2.23 3.30
Note:a. Ms.Kinjal Desai manages 3 open-ended schemes of Nippon India Mutual Fund .b. In case the number of schemes managed by a fund manager is more than six, in the performance data of other schemes, the top 3 and bottom 3 schemes managed by fund manager has been provided herein.c. Period for which scheme’s performance has been provided is computed basis last day of the month-end preceding the date of advertisementd. Different plans shall have a different expense structure. # The performance details provided herein are of Growth Plan (Regular Plan) *The Scheme does not offer any Plans/Options. The performance details are provided at Scheme level using Dividend Reinvestment NAV's.
Co-Fund Manager: Arun Sundaresan
Scheme Name/sCAGR %
1 Year Return 3 Years Return 5 Years ReturnScheme Benchmark Scheme Benchmark Scheme Benchmark
Nippon India Quant Fund -13.35 -17.90 -0.63 0.29 2.43 4.11
Note:a. Mr. Arun Sundaresan manages 1 open-ended scheme ofNippon India Mutual Fund .b. In case the number of schemes managed by a fund manager is more than six, in the performance data of other schemes, the top 3 and bottom 3 schemes managed by fund manager has been provided herein.c. Period for which scheme’s performance has been provided is computed basis last day of the month-end preceding the date of advertisementd. Different plans shall have a different expense structure. The performance details provided herein are of Growth Plan (Regular Plan).
Co-Fund Manager: Tejas Sheth
Scheme Name/sCAGR %
1 Year Return 3 Years Return 5 Years ReturnScheme Benchmark Scheme Benchmark Scheme Benchmark
Nippon India Growth Fund -19.97 -20.54 -3.20 -5.79 2.40 3.23
Note:a. Ms. Tejas Sheth manages 1 open-ended scheme of Nippon India Mutual Fund . b. In case the number of schemes managed by a fund manager is more than six, in the performance data of other schemes, the top 3 and bottom 3 schemes managed by fund manager has been provided herein. c. Period for which scheme’s performance has been provided is computed basis last day of the month-end preceding the date of advertisement d. Different plans shall have a different expense structure. The performance details provided herein are of Growth plan (Regular Plan).
Fund Manager: Vinay Sharma
Scheme Name/sCAGR %
1 Year Return 3 Years Return 5 Years ReturnScheme Benchmark Scheme Benchmark Scheme Benchmark
Nippon India Focused Equity Fund -24.18 -18.46 N.A. N.A. N.A. N.A.
Nippon India Banking Fund -45.73 -38.30 -12.37 -5.83 -2.05 1.24
Note:a. Mr. Vinay Sharma manages 2 open-ended schemes of Nippon India Mutual Fund .b. In case the number of schemes managed by a fund manager is more than six, in the performance data of other schemes, the top 3 and bottom 3 schemes managed by fund manager has been provided herein.c. Period for which scheme’s performance has been provided is computed basis last day of the month-end preceding the date of advertisementd. Different plans shall have a different expense structure. The performance details provided herein are of Growth Plan (Regular Plan).
Fund Manager: Prashant Pimple
Scheme Name/sCAGR %
1 Year Return 3 Years Return 5 Years ReturnScheme Benchmark Scheme Benchmark Scheme Benchmark
TOP 3Nippon India Nivesh Lakshya Fund 15.35 15.46 N.A. N.A. N.A. N.A.Nippon India ETF Long Term Gilt* 13.88 13.73 8.53 8.57 N.A. N.A.Nippon India Banking & PSU Debt Fund 11.62 11.13 8.62 8.00 8.72 8.13BOTTOM 3Nippon India Retirement Fund - Income Generation Scheme 4.72 8.80 5.48 7.62 6.56 8.87Nippon India Balanced Advantage Fund -10.16 -6.69 0.96 3.81 3.96 6.36Nippon India Retirement Fund - Wealth Creation Scheme -31.64 -18.93 -7.58 -0.76 -1.23 3.75
Note:a. Mr. Prashant Pimple manages 8 open-ended schemes of Nippon India Mutual Fund .b. In case the number of schemes managed by a fund manager is more than six, in the performance data of other schemes, the top 3 and bottom 3 schemes managed by fund manager has been provided herein are on the basis of 1 Year CAGR returnsc. Period for which scheme’s performance has been provided is computed basis last day of the month-end preceding the date of advertisementd. Different plans shall have a different expense structure. The performance details provided herein are of Growth Plan (Regular Plan). * The Scheme does not offer any Plans/Options. The performance details are provided at Scheme level using Dividend Reinvestment NAV's.
Fund Manager: Hardik Shah
Scheme Name/sCAGR %
1 Year Return 3 Years Return 5 Years ReturnScheme Benchmark Scheme Benchmark Scheme Benchmark
Nippon India Nivesh Lakshya Fund 15.35 15.46 N.A. N.A. N.A. N.A.Nippon India Gilt Securities Fund 14.73 13.61 9.73 8.55 10.23 9.00Nippon India Banking & PSU Debt Fund 11.62 11.13 8.62 8.00 8.72 8.13Nippon India Dynamic Bond Fund 10.93 12.94 7.15 8.40 7.96 8.97
Note:a. Hardik Shah manages 4 open-ended schemes of Nippon India Mutual Fund.b. In case the number of schemes managed by a fund manager is more than six, performance data of other scheme the top 3 and bottom 3 schemes managed by fund manager has been provided herein. c. Period for which scheme’s performance has been provided is computed basis last day of the month-end preceding the date of advertisement.d. Different plans shall have a different expense structure. The performance details provided herein are of Growth Plan (Regular Plan).

June 202074 Fundamentals
SCHEME PERFORMANCE - FUND MANAGER WISE AS ON MAY 31, 2020
Fund Manager: Anju Chhajer
Scheme Name/sCAGR %
1 Year Return 3 Years Return 5 Years ReturnScheme Benchmark Scheme Benchmark Scheme Benchmark
TOP 3Nippon India US Equity Opportunities Fund 23.52 22.75 17.95 16.23 N.A. N.A.Nippon India Japan Equity Fund 13.86 16.64 7.87 9.11 3.82 7.47Nippon India Floating Rate Fund 9.98 10.47 7.76 8.17 7.87 8.38BOTTOM 3Nippon India Arbitrage Fund 6.09 5.05 6.45 5.26 6.39 5.53Nippon India Liquid Fund 5.89 6.01 6.77 6.87 7.09 7.09Nippon India Overnight Fund 4.67 4.72 N.A. N.A. N.A. N.A.
Note:a. Ms. Anju Chhajer manages 8 open-ended schemes of Nippon India Mutual Fund .b. In case the number of schemes managed by a fund manager is more than six, in the performance data of other schemes, the top 3 and bottom 3 schemes managed by fund manager has been provided herein are on the basis of 1 Year CAGR returns.c. Period for which scheme’s performance has been provided is computed basis last day of the month-end preceding the date of advertisementd. Different plans shall have a different expense structure. The performance details provided herein are of Growth Plan (Regular Plan).
Fund Manager: Vivek Sharma
Scheme Name/sCAGR %
1 Year Return 3 Years Return 5 Years ReturnScheme Benchmark Scheme Benchmark Scheme Benchmark
Nippon India Income Fund 12.65 13.64 8.39 8.45 8.54 8.71Nippon India Short Term Fund 9.12 10.47 7.26 8.17 7.74 8.38Nippon India Prime Debt Fund 7.24 8.82 7.26 7.79 7.74 7.97Nippon India Low Duration Fund 6.13 7.85 7.02 7.55 7.46 7.75Nippon India Ultra Short Duration Fund## 0.55 7.32 4.49 7.60 5.38 7.71
Note:a. Mr. Vivek Sharma manages 5 open-ended schemes of Nippon India Mutual Fund .b. In case the number of schemes managed by a fund manager is more than six, in the performance data of other schemes, the top 3 and bottom 3 schemes managed by fund manager has been provided herein.c. Period for which scheme’s performance has been provided is computed basis last day of the month-end preceding the date of advertisementd. Different plans shall have a different expense structure. The performance details provided herein are of Growth Plan (Regular Plan).
Fund Manager: Siddharth Deb
Scheme Name/sCAGR %
1 Year Return 3 Years Return 5 Years ReturnScheme Benchmark Scheme Benchmark Scheme Benchmark
Nippon India ETF Liquid BeES*@ 3.98 4.72 4.73 5.66 4.83 6.03Nippon India ETF Hang Seng BeES* -4.57 -3.92 4.20 5.22 2.23 3.30
Note:a. Mr. Siddharth Deb manages 2 open-ended schemes of Nippon India Mutual Fund.b. In case the number of schemes managed by a fund manager is more than six, in the performance data of other schemes, the top 3 and bottom 3 schemes managed by fund manager has been provided herein.c. Period for which scheme’s performance has been provided is computed basis last day of the month-end preceding the date of advertisementd. Different plans shall have a different expense structure. @ The performance details provided herein are of Daily Dividend Re-investment Plan.* The Scheme does not offer any Plans/Options. The performance details are provided at Scheme level using Dividend Reinvestment NAV's.
Fund Manager: Meenakshi Dawar
Scheme Name/sCAGR %
1 Year Return 3 Years Return 5 Years ReturnScheme Benchmark Scheme Benchmark Scheme Benchmark
Nippon India Value Fund -23.02 -36.11 -3.16 -17.14 2.08 -4.84Nippon India Vision Fund -24.54 -19.18 -7.99 -1.47 -1.49 4.27
Note:a. Ms. Meenakshi Dawar manages 2 open-ended schemes of Nippon India Mutual Fund . b. In case the number of schemes managed by a fund manager is more than six, in the performance data of other schemes, the top 3 and bottom 3 schemes managed by fund manager has been provided herein. c. Period for which scheme’s performance has been provided is computed basis last day of the month-end preceding the date of advertisement d. Different plans shall have a different expense structure. The performance details provided herein are of Growth plan (Regular Plan).
Fund Manager: Sushil Budhia
Scheme Name/sCAGR %
1 Year Return 3 Years Return 5 Years ReturnScheme Benchmark Scheme Benchmark Scheme Benchmark
Nippon India Credit Risk Fund ## -10.62 9.45 -0.36 8.11 3.33 8.74Nippon India Hybrid Bond Fund ## -15.33 8.69 -2.36 7.71 1.77 8.65Nippon India Equity Savings Fund ## -24.75 -0.99 -6.76 5.42 -0.88 6.32Nippon India Strategic Debt Fund ## -27.19 8.08 -7.69 7.33 -1.07 8.72Nippon India Equity Hybrid Fund ## -28.52 -6.69 -8.14 3.81 -0.56 6.36
Note:a. Sushil Budhia manages 5 open-ended schemes of Nippon India Mutual Fund.b. In case the number of schemes managed by a fund manager is more than six, performance data of other scheme the top 3 and bottom 3 schemes managed by fund manager has been provided herein. c. Period for which scheme’s performance has been provided is computed basis last day of the month-end preceding the date of advertisement.d. Different plans shall have a different expense structure. The performance details provided herein are of Growth Plan (Regular Plan).
Past performance may or may not be sustained in future and the same may not necessarily provide the basis for comparison with other Investment. Dividends (if any) are assumed to be reinvested at the prevailing NAV. In case of LIQUIDBEES, returns are based on gross dividend per unit declared by the Fund. Bonus (if any) declared has been adjusted. Performance of dividend option would be Net of Dividend distribution tax, if any. The performance of the equity scheme is benchmarked to the Total Return variant of the Index. Face value of scheme is `10/- per unit. Face Value of Nippon India Low Duration Fund is `1000/- per unit. Face Value of Nippon India Money Market Fund, Nippon India Liquid Fund & Nippon India Ultra Short Duration Fund is `1000/- per unit w.e.f 5th Aug 2012. Face value of Nippon India ETF Junior BeES is `1.25/- per unit. Face value of Nippon India ETF Liquid BeES is `1000/- per unit. Face value of Nippon India Overnight Fund is `100/- per unit. Face Value of Nippon India ETF Nifty BeES, Nippon India ETF Bank BeES, Nippon India ETF PSU Bank BeES, Nippon India ETF NV20, Nippon India ETF Hang Seng BeES has changed from `10/- per unit to `1/- per unit. w.e.f 20th Dec 2019. Face value of Nippon India ETF Gold BeES has changed from `100/- per unit to `1/- per unit w.e.f 20th Dec 2019. In case, the start/end date of the concerned period is non-business day (NBD), the NAV of the previous date is considered for computation of returns. Schemes which have not completed one year, performance details for the same are not provided. Performance details of closed ended schemes are not provided since these are not comparable with other schemes.The performance of the equity scheme/s are benchmarked to the Total Return variant of the Index.NA has been mentioned for scheme in existence for more than 1 year but less than 3 years or 5 years or instances where benchmark data for corresponding period is not available.##The Scheme Returns are inclusive of the impact of Segregation of portfolio in the respective schemes. For impact on NAV on account of Segregation of portfolio, please refer SID/KIM of the relevant Schemes and detailed Performance of the respective schemes in this doccument.
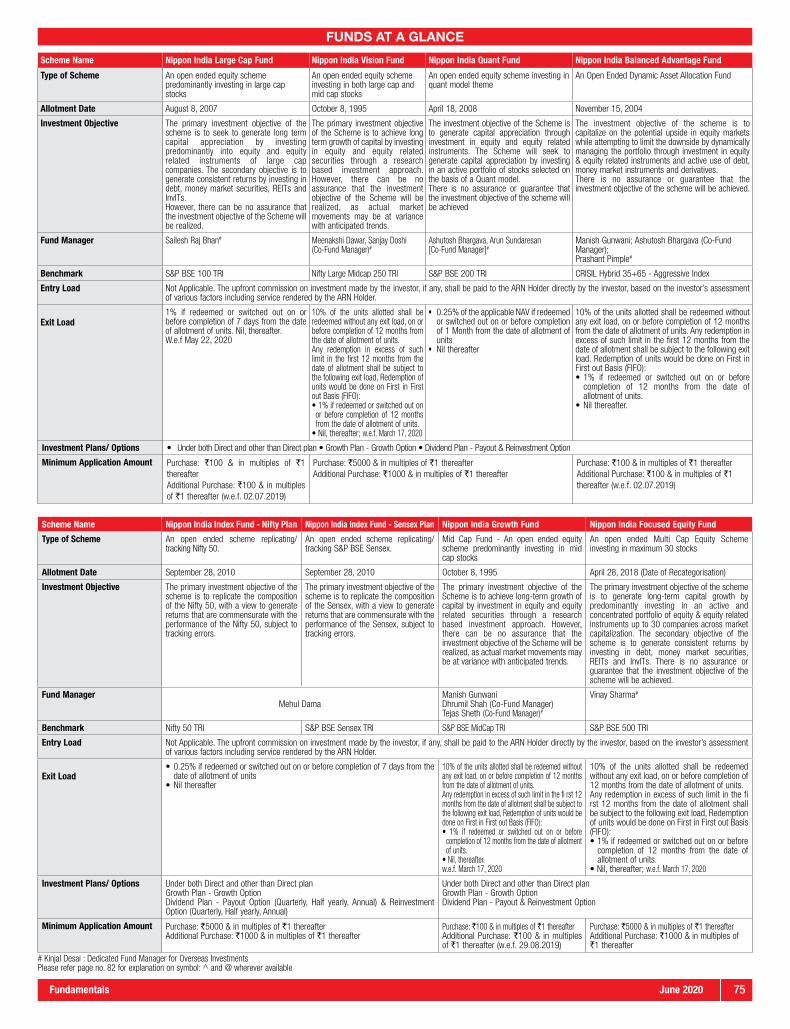
June 2020Fundamentals 75
FUNDS AT A GLANCE
Scheme Name Nippon India Large Cap Fund Nippon India Vision Fund Nippon India Quant Fund Nippon India Balanced Advantage Fund
Type of Scheme An open ended equity scheme predominantly investing in large cap stocks
An open ended equity schemeinvesting in both large cap and mid cap stocks
An open ended equity scheme investing in quant model theme
An Open Ended Dynamic Asset Allocation Fund
Allotment Date August 8, 2007 October 8, 1995 April 18, 2008 November 15, 2004
Investment Objective The primary investment objective of the scheme is to seek to generate long term capital appreciation by investing predominantly into equity and equity related instruments of large cap companies. The secondary objective is to generate consistent returns by investing in debt, money market securities, REITs and InvITs.However, there can be no assurance that the investment objective of the Scheme will be realized.
The primary investment objective of the Scheme is to achieve long term growth of capital by investing in equity and equity related securities through a research based investment approach. However, there can be no assurance that the investment objective of the Scheme will be realized, as actual market movements may be at variance with anticipated trends.
The investment objective of the Scheme is to generate capital appreciation through investment in equity and equity related instruments. The Scheme will seek to generate capital appreciation by investing in an active portfolio of stocks selected on the basis of a Quant model. There is no assurance or guarantee that the investment objective of the scheme will be achieved
The investment objective of the scheme is to capitalize on the potential upside in equity markets while attempting to limit the downside by dynamically managing the portfolio through investment in equity & equity related instruments and active use of debt, money market instruments and derivatives.There is no assurance or guarantee that the investment objective of the scheme will be achieved.
Fund Manager Sailesh Raj Bhan# Meenakshi Dawar, Sanjay Doshi (Co-Fund Manager)#
Ashutosh Bhargava, Arun Sundaresan [Co-Fund Manager]#
Manish Gunwani; Ashutosh Bhargava (Co-Fund Manager); Prashant Pimple#
Benchmark S&P BSE 100 TRI Nifty Large Midcap 250 TRI S&P BSE 200 TRI CRISIL Hybrid 35+65 - Aggressive Index
Entry Load Not Applicable. The upfront commission on investment made by the investor, if any, shall be paid to the ARN Holder directly by the investor, based on the investor’s assessment of various factors including service rendered by the ARN Holder.
Exit Load1% if redeemed or switched out on or before completion of 7 days from the date of allotment of units. Nil, thereafter.W.e.f May 22, 2020
10% of the units allotted shall be redeemed without any exit load, on or before completion of 12 months from the date of allotment of units.Any redemption in excess of such limit in the first 12 months from the date of allotment shall be subject to the following exit load, Redemption of units would be done on First in First out Basis (FIFO):• 1% if redeemed or switched out on or before completion of 12 months from the date of allotment of units.
• Nil, thereafter; w.e.f. March 17, 2020
• 0.25% of the applicable NAV if redeemed or switched out on or before completion of 1 Month from the date of allotment of units
• Nil thereafter
10% of the units allotted shall be redeemed without any exit load, on or before completion of 12 months from the date of allotment of units. Any redemption in excess of such limit in the first 12 months from the date of allotment shall be subject to the following exit load. Redemption of units would be done on First in First out Basis (FIFO):• 1% if redeemed or switched out on or before
completion of 12 months from the date of allotment of units.
• Nil thereafter.
Investment Plans/ Options • Under both Direct and other than Direct plan • Growth Plan - Growth Option • Dividend Plan - Payout & Reinvestment Option
Minimum Application Amount Purchase: `100 & in multiples of `1 thereafterAdditional Purchase: `100 & in multiples of `1 thereafter (w.e.f. 02.07.2019)
Purchase: `5000 & in multiples of `1 thereafterAdditional Purchase: `1000 & in multiples of `1 thereafter
Purchase: `100 & in multiples of `1 thereafterAdditional Purchase: `100 & in multiples of `1 thereafter (w.e.f. 02.07.2019)
Scheme Name Nippon India Index Fund - Nifty Plan Nippon India Index Fund - Sensex Plan Nippon India Growth Fund Nippon India Focused Equity Fund
Type of Scheme An open ended scheme replicating/tracking Nifty 50.
An open ended scheme replicating/tracking S&P BSE Sensex.
Mid Cap Fund - An open ended equity scheme predominantly investing in mid cap stocks
An open ended Multi Cap Equity Scheme investing in maximum 30 stocks
Allotment Date September 28, 2010 September 28, 2010 October 8, 1995 April 28, 2018 (Date of Recategorisation)
Investment Objective The primary investment objective of the scheme is to replicate the composition of the Nifty 50, with a view to generate returns that are commensurate with the performance of the Nifty 50, subject to tracking errors.
The primary investment objective of the scheme is to replicate the composition of the Sensex, with a view to generate returns that are commensurate with the performance of the Sensex, subject to tracking errors.
The primary investment objective of the Scheme is to achieve long-term growth of capital by investment in equity and equity related securities through a research based investment approach. However, there can be no assurance that the investment objective of the Scheme will be realized, as actual market movements may be at variance with anticipated trends.
The primary investment objective of the scheme is to generate long-term capital growth by predominantly investing in an active and concentrated portfolio of equity & equity related instruments up to 30 companies across market capitalization. The secondary objective of the scheme is to generate consistent returns by investing in debt, money market securities, REITs and InvITs. There is no assurance or guarantee that the investment objective of the scheme will be achieved.
Fund ManagerMehul Dama
Manish GunwaniDhrumil Shah (Co-Fund Manager)Tejas Sheth (Co-Fund Manager)#
Vinay Sharma#
Benchmark Nifty 50 TRI S&P BSE Sensex TRI S&P BSE MidCap TRI S&P BSE 500 TRI
Entry Load Not Applicable. The upfront commission on investment made by the investor, if any, shall be paid to the ARN Holder directly by the investor, based on the investor’s assessment of various factors including service rendered by the ARN Holder.
Exit Load• 0.25% if redeemed or switched out on or before completion of 7 days from the
date of allotment of units• Nil thereafter
10% of the units allotted shall be redeemed without any exit load, on or before completion of 12 months from the date of allotment of units.Any redemption in excess of such limit in the fi rst 12 months from the date of allotment shall be subject to the following exit load, Redemption of units would be done on First in First out Basis (FIFO):• 1% if redeemed or switched out on or before
completion of 12 months from the date of allotment of units.
• Nil, thereafter.w.e.f. March 17, 2020
10% of the units allotted shall be redeemed without any exit load, on or before completion of 12 months from the date of allotment of units.Any redemption in excess of such limit in the fi rst 12 months from the date of allotment shall be subject to the following exit load, Redemption of units would be done on First in First out Basis (FIFO):• 1% if redeemed or switched out on or before
completion of 12 months from the date of allotment of units.
• Nil, thereafter; w.e.f. March 17, 2020
Investment Plans/ Options Under both Direct and other than Direct plan Growth Plan - Growth OptionDividend Plan - Payout Option (Quarterly, Half yearly, Annual) & Reinvestment Option (Quarterly, Half yearly, Annual)
Under both Direct and other than Direct plan Growth Plan - Growth OptionDividend Plan - Payout & Reinvestment Option
Minimum Application Amount Purchase: `5000 & in multiples of `1 thereafterAdditional Purchase: `1000 & in multiples of `1 thereafter
Purchase: `100 & in multiples of `1 thereafterAdditional Purchase: `100 & in multiples of `1 thereafter (w.e.f. 29.08.2019)
Purchase: `5000 & in multiples of `1 thereafterAdditional Purchase: `1000 & in multiples of `1 thereafter
# Kinjal Desai : Dedicated Fund Manager for Overseas InvestmentsPlease refer page no. 82 for explanation on symbol: ^ and @ wherever available

June 202076 Fundamentals
FUNDS AT A GLANCE
Scheme Name Nippon India Small Cap Fund Nippon India Value Fund Nippon India Multi Cap Fund Nippon India Equity Hybrid Fund (Number of Segregated Portfolios - 2)
Nippon India Equity Savings Fund (Number of Segregated Portfolios - 2)
Type of Scheme An open ended Equity Scheme predominantly investing in Small Cap stocks
An open ended Equity Scheme following a value investment strategy
Multi Cap Fund - An open ended equity scheme investing across large cap, mid cap, small cap stocks
An open ended hybrid scheme invest ing predominantly in equity and equity related instruments
An open ended scheme investing in equity, arbitrage and debt.
Allotment Date September 16, 2010 June 8, 2005 March 28, 2005 June 8, 2005 May 30, 2015
Investment Objective The primary investment objective of the scheme is to generate long term capital appreciation by investing predominantly in equity and equity related instruments of small cap companies and the secondary objective is to generate consistent returns by investing in debt and money market securities.
The primary investment objective of this scheme is to seek capital appreciation and/or to generate consistent returns by actively investing in equity/ equity related securities predominantly into value stocks.However there can be no assurance that the investment objective of the Scheme will be realized..
The primary investment objective of the scheme is to seek to generate capital appreciation & provide long-term growth opportunities by investing in a portfolio constituted of equity securities & equity related securities and the secondary objective is to generate consistent returns by investing in debt and money market securities.
The primary investment objective of this option is to generate consistent returns and appreciation of capital by investing in a mix of securities comprising of equity, equity related instruments & fixed income instruments.
The primary investment objective of this fund is to generate income and capital appreciation by investing in arbitrage opportunities & pure equity investments along with investments in debt securities & money market instruments. However, there can be no assurance or guarantee that the investment objective of the scheme will be achieved.
Fund Manager Samir Rachh# Meenakshi Dawar# Sailesh Raj Bhan# Sanjay Parekh, Sushil Budhia#
Sanjay Parekh, Anand D Gupta; Sushil Budhia#
Benchmark S&P BSE SmallCap TRI S&P BSE Enhanced Value TRI S&P BSE 500 TRI CRISIL Hybrid 35+65 - Aggressive Index
NIFTY Equity Savings Index
Entry Load Not Applicable. The upfront commission on investment made by the investor, if any, shall be paid to the ARN Holder directly by the investor, based on the investor’s assessment of various factors including service rendered by the ARN Holder.
Exit Load 10% of the units allotted shall be redeemed without any exit load, on or before completion of 12 months from the date of allotment of units.Any redemption in excess of such limit in the fi rst 12 months from the date of allotment shall be subject to the following exit load, Redemption of units would be done on First in First out Basis (FIFO):• 1% if redeemed or switched out on or before completion of 12 months from the date of allotment of
units.• Nil, thereafter.
w.e.f. March 17, 2020
• 10% of the units allotted shall be redeemed without any exit load, on or before completion of 12 months from the date of allotment of units. Any redemption of units would be done on First in First Out Basis (FIFO)
• 1% if redeemed or switched out on or before 12 months from the date of allotment of units
• Nil thereafter
• 10% of the units allotted shall be redeemed without any exit load, on or before completion of 12 months from the date of allotment of units. Any redemption in excess of such limit in the first 12 months from the date of allotment shall be subject to the following exit load. Redemption of units would be done on First in First out Basis (FIFO):
• 1% if redeemed or switched out on or before completion of 12 months from the date of allotment of units.
• Nil thereafter.
Not Applicable for Segregated PortfolioInvestment Plans/ Options Under both Direct and other than Direct plan
Growth Plan - Growth OptionDividend Plan - Payout & Reinvestment Option
Under both Direct and other than Direct plan Growth Plan - Growth OptionDividend Plan - Payout Option (Adhoc, Monthly, Quarterly) &Reinvestment Option (Adhoc, Monthly, Quarterly)
Minimum Application Amount Purchase: `5000 & in multiples of `1 thereafterAdditional Purchase: `1000 & inmultiples of `1 thereafter
Purchase: `500 & in multiples of `1 thereafterAdditional Purchase: `500 & in multiples of `1 thereafter
Purchase: `100 & in multiples of `1 thereafterAdditional Purchase: `100 & in multiples of `1 thereafter (w.e.f. 29.08.2019)
Purchase: ̀ 500 & in multiples of `1 thereafterAdditional Purchase: `500 & in multiples of `1 thereafter
Purchase: `5000 & in multiples of `1 thereafterAdditional Purchase: `1000 & in multiples of `1 thereafter
Scheme Name Nippon India Banking Fund Nippon India Power & Infra Fund Nippon India Consumption Fund Nippon India Pharma Fund
Type of Scheme An open ended equity scheme investing in Banking sector. An Open Ended Equity Scheme investing in power & infrastructure sectors
An Open Ended Equity Scheme following consumption theme
An Open Ended Equity Scheme investing in pharma sector
Allotment Date May 26, 2003 May 8, 2004 September 30, 2004 June 5, 2004
Investment Objective The primary investment objective of the scheme is to seek to generate continuous returns by actively investing in equity and equity related securities of companies in the Banking Sector and companies engaged in allied activities related to Banking Sector. The AMC will have the discretion to completely or partially invest in any of the type of securities stated above with a view to maximize the returns or on defensive considerations. However, there can be no assurance that the investment objective of the Scheme will be realized, as actual market movements may be at variance with anticipated trends.
The investment objective of the scheme is to seek long term capital appreciation by investing in equity/equity related instruments of the companies that are engaged in or allied to the power and infrastructure space in India. There is no assurance or guarantee that the investment objective of the scheme will be achieved.
The investment objective of the scheme is to seek long term capital appreciation by investing atleast 80% of its net assets in equity/equity related instruments of the companies that are likely to benefit directly or indirectly from the domestic consumption led demand.There is no assurance or guarantee that the investment objective of the scheme will be achieved.
The primary investment objective of the scheme is to seek to generate consistent returns by investing in equity and equity related or fixed income securities of Pharma and other associated companies.
Fund Manager Vinay Sharma# Sanjay Doshi# Sailesh Raj Bhan Sailesh Raj Bhan#
Benchmark Nifty Bank TRI Nifty Infrastructure TRI Nifty India Consumption TRI S&P BSE Healthcare TRI
Entry Load Not Applicable. The upfront commission on investment made by the investor, if any, shall be paid to the ARN Holder directly by the investor, based on the investor’s assessment of various factors including service rendered by the ARN Holder.
Exit Load 1% if redeemed or switched out on or before completion of 1 month from the date of allotment of units. Nil, thereafter.W.e.f May 21, 2020
Investment Plans/ Options • Under both Direct and other than Direct plan • Growth Plan - Growth Option • Dividend Plan - Payout & Reinvestment
Minimum Application Amount Purchase: `5000 & in multiples of `1 thereafterAdditional Purchase: `1000 & in multiples of `1 thereafter
# Kinjal Desai : Dedicated Fund Manager for Overseas InvestmentsPlease refer page no. 82 for explanation on symbol: ^ and @ wherever available

June 2020Fundamentals 77
FUNDS AT A GLANCEScheme Name Nippon India Tax Saver (ELSS) Fund Nippon India Arbitrage Fund Nippon India Japan Equity Fund Nippon India US Equity Opportunities FundType of Scheme An open ended equity linked saving scheme
with a statutory lock in of 3 years and tax benefit.
An open ended scheme investing in arbitrage opportunities
An open ended equity scheme following Japan focused theme.
An open ended equity scheme following US focused theme.
Allotment Date September 21, 2005 October 14, 2010 August 26, 2014 July 23, 2015Investment Objective The primary objective of the scheme is to
generate long term capital appreciation from a portfolio that is invested predominantly in equity and equity related instruments.However, there can be no assurance that the scheme's investment objective shall be achieved
The investment objective of the scheme is to generate income by taking advantage of the arbitrage opportunities that potentially exists between cash and derivative market and within the derivative segment along with investments in debt securities & money market instruments.
The primary investment objective of Nippon India Japan Equity Fund is to provide long term capital appreciation to investors by primarily investing in equity and equity related securities of companies listed on the recognized stock exchanges of Japan and the secondary objective is to generate consistent returns by investing in debt and money market securities of India. However, there can be no assurance or guarantee that the investment objective of the scheme will be achieved.
The primary investment objective of Nippon India US Equity Opportunities Fund is to provide long term capital appreciation to investors by primarily investing in equity and equity related securities of companies listed on recognized stock exchanges in the US and the secondary objective is to generate consistent returns by investing in debt and money market securities in India. However, there can be no assurance or guarantee that the investment objective of the scheme will be achieved.
Fund Manager Ashwani Kumar# Anand D Gupta; Anju Chhajer# Anju Chhajer, Kinjal DesaiBenchmark S&P BSE 100 TRI NIFTY 50 Arbitrage Index TOPIX (Tokyo Stock Price Index) TRI S&P 500 TRIEntry Load Not Applicable. The upfront commission on investment made by the investor, if any, shall be paid to the ARN Holder directly by the investor, based on the investor’s assessment of
various factors including service rendered by the ARN Holder.Exit Load Not Applicable • 0.25% if redeemed/switched on or before
completion of 1 month from the date of allotment of units
• Nil thereafter
• 1% if redeemed or switched out on or before completion of 1 year from the date of allotment of units
• Nil thereafter
Investment Plans/ Options Under both Direct and other than Direct planGrowth Plan - Growth OptionDividend Plan - Payout (Adhoc, Annual)
Under both Direct and other than Direct plan Growth Plan - Growth OptionDividend Plan - Payout Option(Adhoc, Monthly*) & Reinvestment Option (Adhoc, Monthly*)*Monday preceding last Thursday of themonth
Under both Direct and other than Direct plan Growth Plan - Growth OptionDividend Plan - Payout & Reinvestment Option
Minimum Application Amount Purchase: `500 & in multiples of `500 thereafterAdditional Purchase: `500 & in multiples of `500 thereafter
Purchase: `5000 & in multiples of `1 thereafterAdditional Purchase: `1000 & in multiples of`1 thereafter
Purchase: `5000 & in multiples of `1 thereafterAdditional Purchase: `1000 & in multiples of `1 thereafter
Scheme Name Nippon India Overnight Fund Nippon India Liquid Fund Nippon India Money Market Fund Nippon India Ultra Short Duration Fund / Segregated Portfolio 1
Type of Scheme An open-ended debt scheme investing in overnight securities
An open ended Liquid Scheme An open ended debt scheme investing in money market instruments
An open ended ultra-short term debt scheme investing in debt and money market instruments such that the Macaulay duration of the portfolio is between 3 - 6 months. (Please refer to the page number 14 of the Scheme Information Document on which the concept of Macaulay’s Duration has been explained)
Allotment Date December 18, 2018 December 9, 2003 June 16, 2005 December 7, 2001
Investment Objective To generate optimal returns with low risk and high liquidity by investing in debt and money market instruments with overnight maturity. However, there can be no assurance or guarantee that the investment objective of the scheme will be achieved.
The investment objective of the Scheme is to generate optimal returns consistent with moderate levels of risk and high liquidity by investing in debt and money market instruments.
The investment objective of the Scheme is to generate optimal returns consistent with moderate levels of risk and liquidity by investing in money market instruments
The investment objective of the Scheme is to generate optimal returns consistent with moderate levels of risk and liquidity by investing in debt and money market instruments.
Fund Manager Anju Chhajer Anju Chhajer# Anju Chhajer# Vivek Sharma#
Benchmark Crisil Overnight Index Crisil Liquid Fund Index CRISIL Money Market Index NIFTY Ultra Short Duration Debt Index
Entry Load Not Applicable. The upfront commission on investment made by the investor, if any, shall be paid to the ARN Holder directly by the investor, based on the investor’s assessment of various factors including service rendered by the ARN Holder.
Exit Load Nil Upto Day 1 - 0.0070%Day 2 - 0.0065%Day 3 - 0.0060%Day 4 - 0.0055%Day 5 - 0.0050%Day 6 - 0.0045%Day 7 onwards - 0.0000%(as a % of redemption/switch out amount)
Nil Nil(Not Applicable for Segregated Portfolio)
Investment Plans/ Options Under both Direct and Regular Plan Growth OptionDividend Option - Payout Option (Monthly, Quarterly) & Reinvestment Option (Daily, Weekly, Monthly, Quarterly)
Under both Direct and other than Direct plan Growth Plan - Growth OptionDividend Plan - Payout Option (Monthly, Quarterly) & Reinvestment Option (Daily, Weekly, Monthly, Quarterly)
Minimum Application Amount Purchase: `5000 & in multiples of `1 thereafterAdditional Purchase: `1000 & in multiples of ` 1 thereafter
Purchase:Daily Dividend Option - `10000 & in multiples of `1 thereafter Weekly Dividend Option - `5000 & in multiples of `1 thereafter Other Plans and Options - `100 and in multiples of `1 thereafterAdditional Purchase:Daily Dividend Option- `10000 & in multiples of `1 thereafter Weekly Dividend Option- `1000 & in multiples of `1 thereafter Other Plans and Options- `100 & in multiples of `1 thereafter
Purchase:Daily Dividend Option - `10000 & in multiples of `1 thereafterOther Plans and Options - `500 & in multiples of `1 thereafter (w.e.f. 29.08.2019)Additional Purchase:Daily Dividend Option - `10000 & in multiples of `1 thereafterOther Plans and Options - `500 & in multiples of `1 thereafter (w.e.f. 29.08.2019)
Purchase:Daily Dividend Option - `10000 & in multiples of `1 thereafter Weekly Dividend Option - `5000 & in multiples of `1 thereafter Other Plans and Options - `100 and in multiples of `1 thereafter Additional Purchase:Daily Dividend Option- `10000 & in multiples of `1 thereafter Weekly Dividend Option- `1000 & in multiples of `1 thereafter Other Plans and Options- `100 & in multiples of `1 thereafter
# Kinjal Desai : Dedicated Fund Manager for Overseas InvestmentsPlease refer page no. 82 for explanation on symbol: ^ and @ wherever available

June 202078 Fundamentals
Scheme Name Nippon India Low Duration Fund Nippon India Prime Debt Fund Nippon India Banking & PSU Debt Fund Nippon India Floating Rate FundType of Scheme An open ended low duration debt scheme investing in debt and money
market instruments such that the Macaulay duration of the portfolio is between 6 - 12 months. (Please refer to the page number 13 of the Scheme Information Document on which the concept of Macaulay’s Duration has been explained)
An open ended debt scheme predominantly investing in AA+ and above rated corporate bonds
An open ended debt scheme predominantly investing in Debt instruments of banks, Public Sector Undertakings, Public Financial Institutions and Municipal Bonds
An open ended debt scheme predominantly investing in floating rate instruments (including fixed rate instruments converted to floating rate exposures using swaps / derivatives)
Allotment Date March 20, 2007 September 14, 2000 May 15, 2015 April 27, 2004Investment Objective The investment objective of the Scheme is to generate optimal returns
consistent with moderate levels of risk and liquidity by investing in debt securities and money market securities.
To generate income through investments predominantly in debt instruments of various maturities with a view to maximizing income while maintaining the optimum balance of yield, safety and liquidity.
To generate income over short to medium term horizon through investments in debt and money market instruments of various maturities, consisting predominantly of securities issued by entities such as Banks, Public Sector Undertakings (PSUs) and Public Financial Institutions (PFIs). However, there can be no assurance or guarantee that the investment objective of the Scheme will be achieved.
The primary objective of the scheme is to generate regular income through investment predominantly in floating rate and money market instruments and fixed rate debt instruments.
Fund Manager Anju Chhajer Vivek Sharma#
Vivek Sharma# Prashant Pimple; Hardik Shah#
Anju Chhajer#
Benchmark NIFTY Low Duration Debt Index 50% NIFTY Short Duration Debt Index + 50% NIFTY Low Duration Debt Index
NIFTY Banking & PSU Debt Index CRISIL Short Term Bond Fund Index
Entry Load Not Applicable. The upfront commission on investment made by the investor, if any, shall be paid to the ARN Holder directly by the investor, based on the investor’s assessment of various factors including service rendered by the ARN Holder.
Exit Load
Nil
• 0.50%, if units are redeemed or switched out on or before completion of 1 month from the date of allotment of units.
• Nil thereafterInvestment Plans/ Options Under both Direct and other than Direct plan
Growth Plan - Growth OptionDividend Plan - Payout Option (Adhoc, Weekly, Monthly, Quarterly) & Reinvestment Option (Adhoc, Daily, Weekly, Monthly, Quarterly)
Under both Direct and other than Direct plan Growth Plan - Growth OptionDividend Plan - Payout Option (Adhoc, Weekly, Monthly, Quarterly) & Reinvestment Option (Adhoc, Daily, Weekly, Monthly, Quarterly)
Under both Direct and other than Direct planGrowth Plan - Growth OptionDividend Plan - Payout Option (Adhoc, Weekly, Monthly, Quarterly) & Reinvestment Option (Adhoc, Weekly, Monthly, Quarterly)
Under both Direct and other than Direct plan Growth Plan - Growth OptionDividend Plan - Payout Option (Adhoc, Weekly, Monthly, Quarterly) & Reinvestment Option (Adhoc, Daily, Weekly, Monthly, Quarterly)
Minimum Application Amount Purchase:Daily Dividend Option - `10000 & in multiples of `1 thereafterWeekly Dividend Option - `5000 & in multiples of `1 thereafterOther Plans and Options - `500 and in multiples of `1 thereafterAdditional Purchase:Daily Dividend Option - `10000 & in multiples of `1 thereafterWeekly Dividend Option - `1000 & in multiples of `1 thereafterOther Plans and Options - `100 & in multiples of `1 thereafter
Purchase:Growth Plan - `1000 & in multiples of `1 thereafterOther Plans and Options - `5000 & in multiples of `1 thereafterAdditional Purchase: `1000 & in multiples of `1 thereafter
Purchase: `5000 & in multiples of `1 thereafterAdditional Purchase: `1000 & in multiples of `1 thereafter
Scheme Name Nippon India Short Term Fund Nippon India Nivesh Lakshya Fund Nippon India Credit Risk Fund (Number of Segregated Portfolios- 2)
Nippon India Strategic Debt Fund (Number of Segregated Portfolios - 2)
Type of Scheme An open ended short term debt scheme investing in instruments such that the Macaulay duration of the portfolio is between 1 to 3 years. (Please refer to the page number 14 of the Scheme Information Document on which the concept of Macaulay’s Duration has been explained)
An open ended debt scheme investing in instruments such that the Macaulay duration of the portfolio is greater than 7 years (Please refer to the Page No. 1 of the Scheme Information Document on which the concept of Macaulay’s Duration has been explained)
An open ended debt scheme predominantly investing in AA and below rated corporate bonds (excluding AA+ rated corporate bonds)
An open ended medium term debt scheme investing in instruments such that the Macaulay duration of the portfolio is between 3 to 4 years. (Please refer to the page number 14 of the Scheme Information Document on which the concept of Macaulay’s Duration has been explained)
Allotment Date December 18, 2002 July 6, 2018 June 8, 2005 June 26, 2014
Investment Objective The primary investment objective of the scheme is to generate stable returns for investors with a short term investment horizon by investing in debt and money market instruments.
The primary investment objective of the scheme is to generate optimal returns consistent with moderate levels of risk. This income may be complemented by capital appreciation of the portfolio. Accordingly, investments shall predominantly be made in Debt & Money Market Instruments
The primary investment objective of this option is to generate optimal returns consistent with moderate levels of risk. This income may be complemented by capital appreciation of the portfolio. Accordingly investments shall predominantly be made in Debt & Money Market Instrument.
To generate income through investments in a range of debt and money market instruments of various maturities with a view to maximizing income while maintaining the optimum balance of yield, safety and liquidity.
Fund Manager Prashant Pimple Vivek Sharma#
Prashant Pimple Hardik Shah#
Sushil Budhia# Sushil Budhia#
Benchmark Crisil Short Term Bond Fund Index Crisil Long Term Debt Index NIFTY Credit Risk Bond Index 25% of CRISIL AAA Medium Term Bond Index + 25% of CRISIL AA+ Medium Term Bond Index + 25% of CRISIL AA Medium Term Bond Index + 25% of CRISIL AA- Medium Term Bond Index
Entry Load Not Applicable. The upfront commission on investment made by the investor, if any, shall be paid to the ARN Holder directly by the investor, based on the investor’s assessment of various factors including service rendered by the ARN Holder.
Exit Load Nil 10% of the units allotted can be redeemed every year without any exit load, on or before completion of 36 months from the date of allotment of units. Any redemption in excess of such limit in the first 36 months from the date of allotment shall be subject to the following exit load. Redemption of units would be done on First in First out Basis (FIFO):• 1% if redeemed or switched out on or before 36 months
from the date of allotment of units.• Nil, thereafter
10% of the units allotted shall be redeemed without any exit load, on or before completion of 12 months from the date of allotment of units. Any redemption in excess of such limit in the first 12 months from the date of allotment shall be subject to the following exit load. Redemption of units would be done on First in First out Basis (FIFO):• 1% if redeemed or switched out on or before
completion of 12 months from the date of allotment of units
• Nil thereafter
• 1% if redeemed within 12 months from the date of allotment of units
• Nil, thereafter
Not Applicable for Segregated PortfolioInvestment Plans/ Options Under both Direct and other than Direct plan
Growth Plan - Growth Option Dividend Plan - Payout Option (Adhoc, Monthly, Quarterly) & Reinvestment Option (Adhoc, Monthly, Quarterly)
Under both Direct and Regular PlanGrowth Plan - Growth OptionDividend Plan - Payout Option (Adhoc,Monthly, Quarterly, Half yearly, Annual) & Reinvestment Option (Adhoc, Monthly, Quarterly, Half yearly, Annual)
Under both Direct and other than Direct planDividend Plan - Payout Option (Adhoc, Quarterly) & Reinvestment Option (Adhoc, Quarterly)
Minimum Application Amount Purchase: `500 & in multiples of `1 thereafterAdditional Purchase: `500 & in multiples of `1 thereafter (w.e.f. 29.08.2019)
Purchase: ` 5000 & in multiples of ` 1 thereafterAdditional Purchase: ` 1000 & in multiples of ` 1 thereafter
Purchase: `500 & in multiples of `1 thereafterAdditional Purchase: `500 & in multiples of `1 thereafter
Purchase: `5000 & in multiples of `1 thereafterAdditional Purchase: `1000 & in multiples of `1 thereafter
FUNDS AT A GLANCE
# Kinjal Desai : Dedicated Fund Manager for Overseas InvestmentsPlease refer page no. 82 for explanation on symbol: ^ and @ wherever available
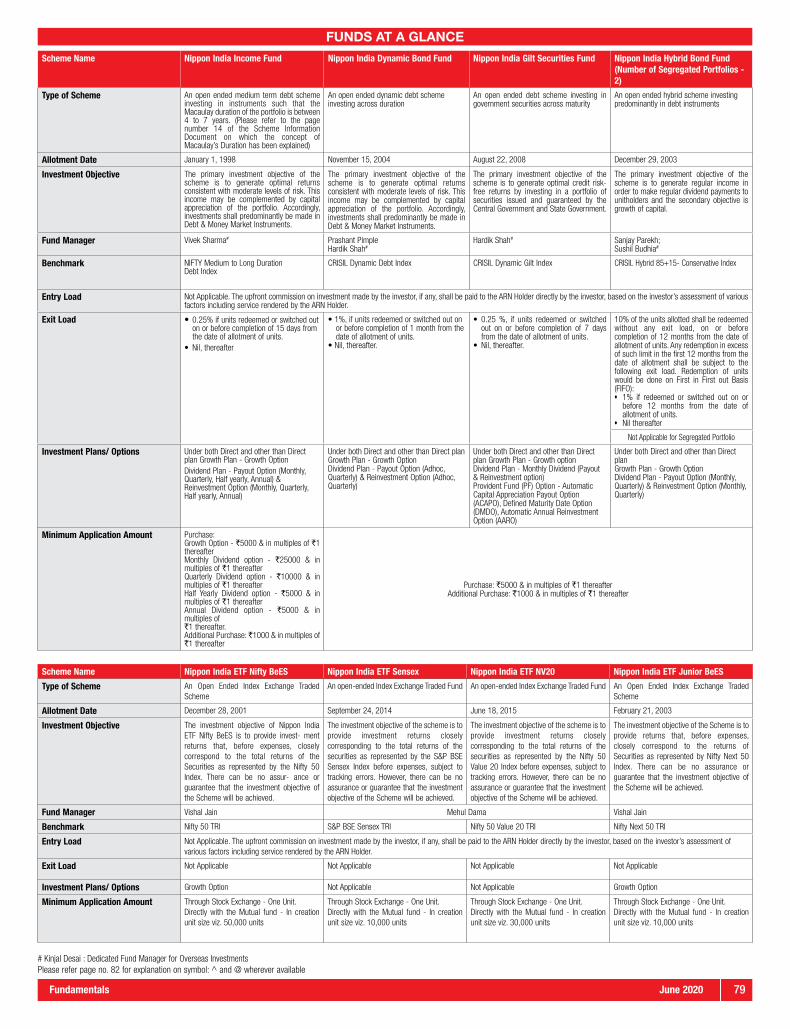
June 2020Fundamentals 79
FUNDS AT A GLANCE
Scheme Name Nippon India Income Fund Nippon India Dynamic Bond Fund Nippon India Gilt Securities Fund Nippon India Hybrid Bond Fund (Number of Segregated Portfolios - 2)
Type of Scheme An open ended medium term debt scheme investing in instruments such that the Macaulay duration of the portfolio is between 4 to 7 years. (Please refer to the page number 14 of the Scheme Information Document on which the concept of Macaulay’s Duration has been explained)
An open ended dynamic debt scheme investing across duration
An open ended debt scheme investing in government securities across maturity
An open ended hybrid scheme investing predominantly in debt instruments
Allotment Date January 1, 1998 November 15, 2004 August 22, 2008 December 29, 2003
Investment Objective The primary investment objective of the scheme is to generate optimal returns consistent with moderate levels of risk. This income may be complemented by capital appreciation of the portfolio. Accordingly, investments shall predominantly be made in Debt & Money Market Instruments.
The primary investment objective of the scheme is to generate optimal returns consistent with moderate levels of risk. This income may be complemented by capital appreciation of the portfolio. Accordingly, investments shall predominantly be made in Debt & Money Market Instruments.
The primary investment objective of the scheme is to generate optimal credit risk-free returns by investing in a portfolio of securities issued and guaranteed by the Central Government and State Government.
The primary investment objective of the scheme is to generate regular income in order to make regular dividend payments to unitholders and the secondary objective is growth of capital.
Fund Manager Vivek Sharma# Prashant Pimple Hardik Shah#
Hardik Shah# Sanjay Parekh; Sushil Budhia#
Benchmark NIFTY Medium to Long Duration Debt Index
CRISIL Dynamic Debt Index CRISIL Dynamic Gilt Index CRISIL Hybrid 85+15- Conservative Index
Entry Load Not Applicable. The upfront commission on investment made by the investor, if any, shall be paid to the ARN Holder directly by the investor, based on the investor’s assessment of various factors including service rendered by the ARN Holder.
Exit Load • 0.25% if units redeemed or switched out on or before completion of 15 days from the date of allotment of units.
• Nil, thereafter
• 1%, if units redeemed or switched out on or before completion of 1 month from the date of allotment of units.
• Nil, thereafter.
• 0.25 %, if units redeemed or switched out on or before completion of 7 days from the date of allotment of units.
• Nil, thereafter.
10% of the units allotted shall be redeemed without any exit load, on or before completion of 12 months from the date of allotment of units. Any redemption in excess of such limit in the first 12 months from the date of allotment shall be subject to the following exit load. Redemption of units would be done on First in First out Basis (FIFO):• 1% if redeemed or switched out on or
before 12 months from the date of allotment of units.
• Nil thereafter
Not Applicable for Segregated Portfolio
Investment Plans/ Options Under both Direct and other than Direct plan Growth Plan - Growth OptionDividend Plan - Payout Option (Monthly, Quarterly, Half yearly, Annual) & Reinvestment Option (Monthly, Quarterly, Half yearly, Annual)
Under both Direct and other than Direct plan Growth Plan - Growth OptionDividend Plan - Payout Option (Adhoc, Quarterly) & Reinvestment Option (Adhoc, Quarterly)
Under both Direct and other than Direct plan Growth Plan - Growth optionDividend Plan - Monthly Dividend (Payout & Reinvestment option)Provident Fund (PF) Option - Automatic Capital Appreciation Payout Option (ACAPO), Defined Maturity Date Option (DMDO), Automatic Annual Reinvestment Option (AARO)
Under both Direct and other than Direct plan Growth Plan - Growth OptionDividend Plan - Payout Option (Monthly, Quarterly) & Reinvestment Option (Monthly, Quarterly)
Minimum Application Amount Purchase:Growth Option - `5000 & in multiples of `1 thereafterMonthly Dividend option - `25000 & in multiples of `1 thereafterQuarterly Dividend option - `10000 & in multiples of `1 thereafterHalf Yearly Dividend option - `5000 & in multiples of `1 thereafterAnnual Dividend option - `5000 & in multiples of`1 thereafter.Additional Purchase: `1000 & in multiples of `1 thereafter
Purchase: `5000 & in multiples of `1 thereafterAdditional Purchase: `1000 & in multiples of `1 thereafter
Scheme Name Nippon India ETF Nifty BeES Nippon India ETF Sensex Nippon India ETF NV20 Nippon India ETF Junior BeES
Type of Scheme An Open Ended Index Exchange Traded Scheme
An open-ended Index Exchange Traded Fund An open-ended Index Exchange Traded Fund An Open Ended Index Exchange Traded Scheme
Allotment Date December 28, 2001 September 24, 2014 June 18, 2015 February 21, 2003
Investment Objective The investment objective of Nippon India ETF Nifty BeES is to provide invest- ment returns that, before expenses, closely correspond to the total returns of the Securities as represented by the Nifty 50 Index. There can be no assur- ance or guarantee that the investment objective of the Scheme will be achieved.
The investment objective of the scheme is to provide investment returns closely corresponding to the total returns of the securities as represented by the S&P BSE Sensex Index before expenses, subject to tracking errors. However, there can be no assurance or guarantee that the investment objective of the Scheme will be achieved.
The investment objective of the scheme is to provide investment returns closely corresponding to the total returns of the securities as represented by the Nifty 50 Value 20 Index before expenses, subject to tracking errors. However, there can be no assurance or guarantee that the investment objective of the Scheme will be achieved.
The investment objective of the Scheme is to provide returns that, before expenses, closely correspond to the returns of Securities as represented by Nifty Next 50 Index. There can be no assurance or guarantee that the investment objective of the Scheme will be achieved.
Fund Manager Vishal Jain Mehul Dama Vishal Jain
Benchmark Nifty 50 TRI S&P BSE Sensex TRI Nifty 50 Value 20 TRI Nifty Next 50 TRI
Entry Load Not Applicable. The upfront commission on investment made by the investor, if any, shall be paid to the ARN Holder directly by the investor, based on the investor’s assessment of various factors including service rendered by the ARN Holder.
Exit Load Not Applicable Not Applicable Not Applicable Not Applicable
Investment Plans/ Options Growth Option Not Applicable Not Applicable Growth Option
Minimum Application Amount Through Stock Exchange - One Unit.Directly with the Mutual fund - In creation unit size viz. 50,000 units
Through Stock Exchange - One Unit.Directly with the Mutual fund - In creation unit size viz. 10,000 units
Through Stock Exchange - One Unit.Directly with the Mutual fund - In creation unit size viz. 30,000 units
Through Stock Exchange - One Unit.Directly with the Mutual fund - In creation unit size viz. 10,000 units
# Kinjal Desai : Dedicated Fund Manager for Overseas InvestmentsPlease refer page no. 82 for explanation on symbol: ^ and @ wherever available
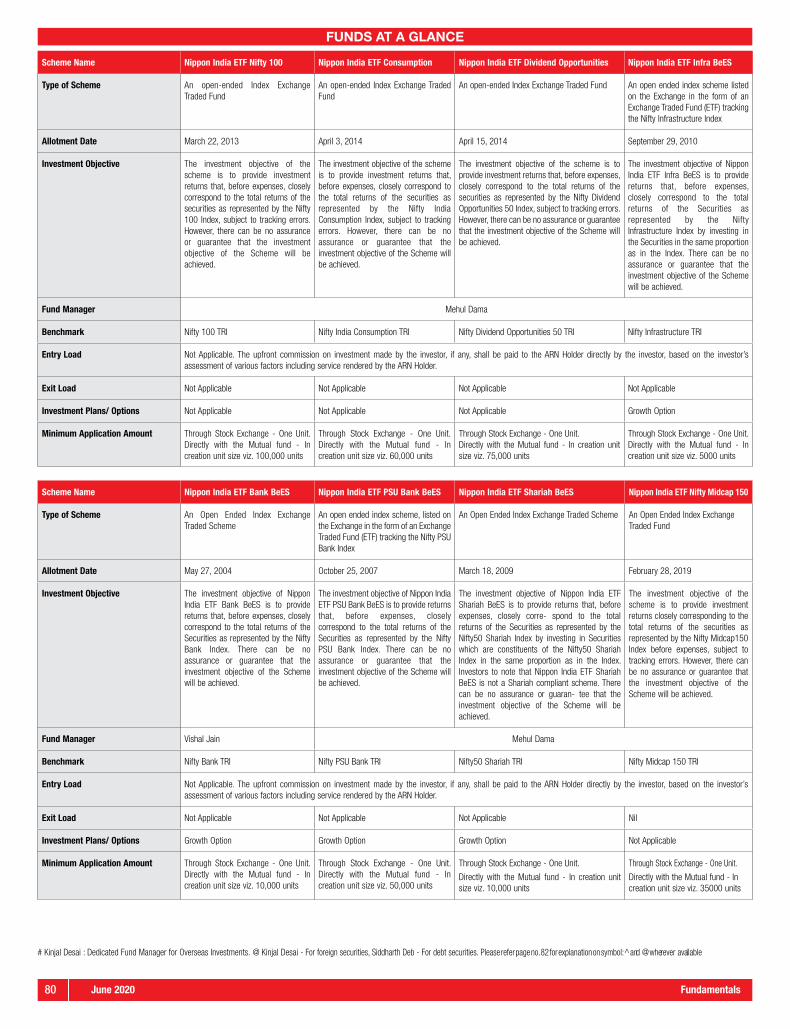
June 202080 Fundamentals
FUNDS AT A GLANCE
Scheme Name Nippon India ETF Nifty 100 Nippon India ETF Consumption Nippon India ETF Dividend Opportunities Nippon India ETF Infra BeES
Type of Scheme An open-ended Index Exchange Traded Fund
An open-ended Index Exchange Traded Fund
An open-ended Index Exchange Traded Fund An open ended index scheme listed on the Exchange in the form of an Exchange Traded Fund (ETF) tracking the Nifty Infrastructure Index
Allotment Date March 22, 2013 April 3, 2014 April 15, 2014 September 29, 2010
Investment Objective The investment objective of the scheme is to provide investment returns that, before expenses, closely correspond to the total returns of the securities as represented by the Nifty 100 Index, subject to tracking errors. However, there can be no assurance or guarantee that the investment objective of the Scheme will be achieved.
The investment objective of the scheme is to provide investment returns that, before expenses, closely correspond to the total returns of the securities as represented by the Nifty India Consumption Index, subject to tracking errors. However, there can be no assurance or guarantee that the investment objective of the Scheme will be achieved.
The investment objective of the scheme is to provide investment returns that, before expenses, closely correspond to the total returns of the securities as represented by the Nifty Dividend Opportunities 50 Index, subject to tracking errors. However, there can be no assurance or guarantee that the investment objective of the Scheme will be achieved.
The investment objective of Nippon India ETF Infra BeES is to provide returns that, before expenses, closely correspond to the total returns of the Securities as represented by the Nifty Infrastructure Index by investing in the Securities in the same proportion as in the Index. There can be no assurance or guarantee that the investment objective of the Scheme will be achieved.
Fund Manager Mehul Dama
Benchmark Nifty 100 TRI Nifty India Consumption TRI Nifty Dividend Opportunities 50 TRI Nifty Infrastructure TRI
Entry Load Not Applicable. The upfront commission on investment made by the investor, if any, shall be paid to the ARN Holder directly by the investor, based on the investor’s assessment of various factors including service rendered by the ARN Holder.
Exit Load Not Applicable Not Applicable Not Applicable Not Applicable
Investment Plans/ Options Not Applicable Not Applicable Not Applicable Growth Option
Minimum Application Amount Through Stock Exchange - One Unit. Directly with the Mutual fund - In creation unit size viz. 100,000 units
Through Stock Exchange - One Unit.Directly with the Mutual fund - In creation unit size viz. 60,000 units
Through Stock Exchange - One Unit.Directly with the Mutual fund - In creation unit size viz. 75,000 units
Through Stock Exchange - One Unit.Directly with the Mutual fund - In creation unit size viz. 5000 units
Scheme Name Nippon India ETF Bank BeES Nippon India ETF PSU Bank BeES Nippon India ETF Shariah BeES Nippon India ETF Nifty Midcap 150
Type of Scheme An Open Ended Index Exchange Traded Scheme
An open ended index scheme, listed on the Exchange in the form of an Exchange Traded Fund (ETF) tracking the Nifty PSU Bank Index
An Open Ended Index Exchange Traded Scheme An Open Ended Index Exchange Traded Fund
Allotment Date May 27, 2004 October 25, 2007 March 18, 2009 February 28, 2019
Investment Objective The investment objective of Nippon India ETF Bank BeES is to provide returns that, before expenses, closely correspond to the total returns of the Securities as represented by the Nifty Bank Index. There can be no assurance or guarantee that the investment objective of the Scheme will be achieved.
The investment objective of Nippon India ETF PSU Bank BeES is to provide returns that, before expenses, closely correspond to the total returns of the Securities as represented by the Nifty PSU Bank Index. There can be no assurance or guarantee that the investment objective of the Scheme will be achieved.
The investment objective of Nippon India ETF Shariah BeES is to provide returns that, before expenses, closely corre- spond to the total returns of the Securities as represented by the Nifty50 Shariah Index by investing in Securities which are constituents of the Nifty50 Shariah Index in the same proportion as in the Index. Investors to note that Nippon India ETF Shariah BeES is not a Shariah compliant scheme. There can be no assurance or guaran- tee that the investment objective of the Scheme will be achieved.
The investment objective of the scheme is to provide investment returns closely corresponding to the total returns of the securities as represented by the Nifty Midcap150 Index before expenses, subject to tracking errors. However, there can be no assurance or guarantee that the investment objective of the Scheme will be achieved.
Fund Manager Vishal Jain Mehul Dama
Benchmark Nifty Bank TRI Nifty PSU Bank TRI Nifty50 Shariah TRI Nifty Midcap 150 TRI
Entry Load Not Applicable. The upfront commission on investment made by the investor, if any, shall be paid to the ARN Holder directly by the investor, based on the investor’s assessment of various factors including service rendered by the ARN Holder.
Exit Load Not Applicable Not Applicable Not Applicable Nil
Investment Plans/ Options Growth Option Growth Option Growth Option Not Applicable
Minimum Application Amount Through Stock Exchange - One Unit. Directly with the Mutual fund - In creation unit size viz. 10,000 units
Through Stock Exchange - One Unit. Directly with the Mutual fund - In creation unit size viz. 50,000 units
Through Stock Exchange - One Unit.
Directly with the Mutual fund - In creation unit size viz. 10,000 units
Through Stock Exchange - One Unit.
Directly with the Mutual fund - In creation unit size viz. 35000 units
# Kinjal Desai : Dedicated Fund Manager for Overseas Investments. @ Kinjal Desai - For foreign securities, Siddharth Deb - For debt securities. Please refer page no. 82 for explanation on symbol: ̂ and @ wherever available

June 2020Fundamentals 81
FUNDS AT A GLANCE
Scheme Name CPSE ETF Nippon India ETF Sensex Next 50
Nippon India ETF Liquid BeES Nippon India ETF Gold BeES Nippon India ETF Hang Seng BeES
Type of Scheme An Open Ended Index Exchange Traded Scheme
An Open ended Index Exchange Traded Fund
An open ended liquid scheme, listed on the Exchange in the form of an ETF, investing in Tri-Party Repo/Repo & Reverse Repo with daily Dividend and compulsory reinvestment of Dividend.
An open ended scheme, listed on the Exchange in the form of an Exchange Traded Fund (ETF) investing in physical gold
An open ended index Scheme, investing in overseas Securities listed on the Exchange in the form of an Exchange Traded Fund (ETF) tracking the Hang Seng Index
Allotment Date March 28, 2014 July 30, 2019 July 8, 2003 March 8, 2007 March 9, 2010
Investment Objective The investment objective of the Scheme is to provide returns that, before expenses, closely correspond to the total returns of the Securities as represented by the Nifty CPSE Index, by investing in the Securities which are constituents of the Nifty CPSE Index in the same proportion as in the Index. However the performance of the Scheme may differ from that of underlying index due to tracking error. There can be no assurance or guarantee that the investment objective of the Scheme would be achieved.
The investment objective of the scheme is to provide investment returns closely corresponding to the total returns of the securities as represented by the S&P BSE SENSEX Next 50 Index before expenses, subject to tracking errors. However, there can be no assurance or guarantee that the investment objective of the Scheme will be achieved.
The investment objective of Nippon India ETF Liquid BeES is to seek to provide current income, commensurate with low risk while providing a high level of liquidity through a portfolio of Tri-Party Repo/Repo & Reverse Repo. The Scheme will provide returns that before expenses, closely correspond to the returns of Nifty 1D Rate index.There can be no assurance or guarantee that the investment objective of the Scheme will be achieved
The investment objective of Nippon India ETF Gold BeES is to provide returns that, before expenses, closely correspond to the returns provided by Domestic Prices of Gold through physical gold. There can be no assurance or guarantee that the investment objective of the Scheme will be achieved.
The investment objective of Nippon India ETF Hang Seng BeES is to provide returns that, before expenses, closely correspond to the total returns of Securities as represented by Hang Seng Index of Hang Seng Data Services Limited, by investing in the Securities in the same proportion as in the index. There can be no assurance or guarantee that the investment objective of the Scheme will be achieved.
Fund Manager Vishal Jain Mehul Dama Siddharth Deb Mehul Dama Siddharth Deb, Kinjal Desai@
Benchmark Nifty CPSE TRI S&P BSE Sensex Next 50 TRI Nifty 1D Rate Index Domestic Prices of Gold Hang Seng TRI
Entry Load Not Applicable. The upfront commission on investment made by the investor, if any, shall be paid to the ARN Holder directly by the investor, based on the investor’s assessment of various factors including service rendered by the ARN Holder.
Exit Load Not Applicable
Investment Plans/ Options
Growth Option Not Applicable Dividend Option - Daily Dividend Reinvestment
Growth Option Growth Option
Minimum Application Amount
Through Stock Exchange - One Unit.
Directly with the Mutual fund - In creation unit size viz. 100,000 units
Through Stock Exchange - One Unit.Directly with the Mutual fund - In creation unit size viz. 1,10,000 units
Through Stock Exchange - One Unit.
Directly with the Mutual fund - In creation unit size viz. 2500 units.
Through Stock Exchange - One Unit.Directly with the Mutual fund - In creation unit size viz. 1,00,000 units
Through Stock Exchange - One Unit.Directly with the Mutual fund - In creation unit size viz. 25000 units
Scheme Name Nippon India ETF Long Term Gilt Nippon India Gold Savings Fund Nippon India Junior BeES FOF Nippon India Retirement Fund - Wealth Creation Scheme
Nippon India Retirement Fund-Income Generation Scheme
Type of Scheme An Open ended Index Exchange Traded Fund An open-ended Fund of Fund Scheme
An Open Ended fund of funds scheme investing in Nippon India ETF Junior BeES
An open ended retirement solution oriented scheme having a lock-in of 5 years or till retirement age (whichever is earlier)
Allotment Date July 5, 2016 March 7, 2011 March 8, 2019 February 11, 2015
Investment Objective The investment objective of the scheme is to provide investment returns closely corresponding to the total returns of the securities as represented by the Nifty 8-13 yr G-Sec Index before expenses, subject to tracking errors. However, there can be no assurance or guarantee that the investment objective of the Scheme will be achieved.
The investment objective of the scheme is to seek to provide returns that closely correspond to returns provided by Nippon India ETF Gold BeES.
The investment objective of the Scheme is to seek to provide returns that closely correspond to returns provided by Nippon India ETF Junior BeES by investing in units of Nippon India ETF Junior BeES. However, there can be no assurance or guarantee that the investment objective of the Scheme will be achieved
The investment objective of the scheme is to provide capital appreciation and consistent income to the investors which will be in line with their retirement goals by investing in a mix of securities comprising of equity, equity related instruments and fixed income securities. However, there can be no assurance or guarantee that the investment objective of the Scheme will be achieved.
Fund Manager Prashant Pimple Mehul Dama Sanjay Parekh, Prashant Pimple#
Sanjay Parekh, Prashant Pimple#
Benchmark Nifty 8-13 yr G-Sec Index Domestic Prices of Gold Nifty Next 50 TRI S&P BSE 500 TRI 80% of CRISIL Long Term Debt Index +20% of S&P BSE 500 TRI
Entry Load Not Applicable. The upfront commission on investment made by the investor, if any, shall be paid to the ARN Holder directly by the investor, based on the investor’s assessment of various factors including service rendered by the ARN Holder.
Exit Load Not Applicable • 1% if redeemed or switched out on or before completion of 15 days from the date of allotment of units
• Nil thereafter.wef Apr 27, 2020
Nil Nil
Investment Plans/ Options Growth Option Under both Direct and other than Direct plan Growth Plan - Growth OptionDividend Plan - Payout & Reinvestment Option
Under both Direct and other than Direct plan Growth Plan - Growth OptionDividend Plan - Payout Option
Minimum Application Amount Through Stock Exchange - One Unit.Directly with the Mutual fund - In creation unit size viz. 250000 units
Purchase: ` 100 & in multiples of ` 1 thereafter Additional Purchase: ` 100 & in multiples of ` 1 thereafter.
Purchase: ` 5000 & in multiples of ` 1 thereafter Additional Purchase: ` 1000 & in multiples of ` 1 thereafter
Purchase: `5000 and in multiples of `500 thereafter Additional Purchase: `1000 & in the multiple of `500 thereafter
# Kinjal Desai : Dedicated Fund Manager for Overseas InvestmentsPlease refer page no. 82 for explanation on symbol: ^ and @ wherever available

June 202082 Fundamentals
DISCLAIMERS, STATUTORY DETAILS & RISK FACTORS
Exit Load – If charged, the same shall be credited to the scheme immediately net of Goods & Service Tax, if any.
Exit load levied on the Units redeemed will be the rate prevailing at the time of the allotment of the Units. For Special products registrations, load for each transaction is based on the load structure applicable as on the registration date.
^Total Expense Ratio - As on last day of the month & includes additional expenses provided in Regulation 52(6A)(b) and 52(6A)(c) of SEBI (Mutual Funds) Regulations, 1996 and Goods and Service Tax on Management Fees.
@ Tracking Error – Calculated using daily value focused period of 3 years.
Withholding Tax on Dividend: The Finance Act, 2020 has abolished dividend distribution tax on dividend declared and paid by Mutual Fund scheme. W.e.f. 01.04.2020 dividend received from Mutual fund scheme is taxable in the hands of investor and mutual fund scheme is required to withhold tax on dividend as per applicable rate.
Kindly refer addendum no. 63 dated September 28, 2012 for details about discontinued plan. Direct plan got introduced w.e.f. 01/01/2013. Kindly refer addendum no. 95 dated December 31, 2012 for details about direct plan.
Kindly refer addendum no. 66 dated June 11, 2015 for details about discontinued bonus plan/option.
Scheme Related Disclosures
For change in Benchmark for few of the schemes of Nippon India Mutual Fund w.e.f. July 10, 2019 kindly refer notice cum addendum no. 42 dated July 09, 2019
For change in Fund Manager for few of the scheme of Nippon India Mutual Fund w.e.f. August 02, 2019 kindly refer notice cum addendum no. 52 dated August 02, 2019
For change in the Controlling Interest of RNAM, kindly refer notice cum addendum no. 56 dated August 21, 2019
For Segregated Portfolios details, w.e.f. Sept 25, 2019 kindly refer notice cum addendum no. 57 dated August 21, 2019
For change in minimum amount application and minimum additional investment for few of the scheme of Nippon India Mutual Fund w.e.f. August 29, 2019 kindly refer notice cum addendum no. 58 dated August 26, 2019
For changes in Exit load for Nippon India Liquid Fund w.e.f. October 20, 2019, kindly refer notice cum addendum no. 85, dated October 17, 2019.
For changes in the face value of units and Creation Unit size for few of the Nippon India ETF Funds w.e.f. December 20, 2019, kindly refer notice cum addendum no. 107, dated December 06, 2019.
For changes in Fund Managers for few of the schemes of Nippon India Mutual Funds w.e.f. February 1st, 2020, kindly refer notice cum addendum no. 131, dated January 30, 2020.
For changes in Exit load for few of the schemes of Nippon India Mutual Funds w.e.f. March 17, 2020, kindly refer notice cum addendum no. 153, dated March 14, 2020.
For Revision in the fresh subscription limit through SIP or STP or such other special product, in Nippon India Small Cap Fund wef. March 17, 2020, kindly refer notice cum addendum no. 154 dated March 14, 2020.
For withdrawal of limit for subscription of units in Nippon India Small Cap Fund w.e.f. April 03,2020, kindly refer notice cum addendum no. 159, dated March 30, 2020.
For revision in Exit load for Nippon India Gold savings Fund w.e.f. April 27, 2020, kindly refer notice cum addendum no. 7, dated April 23, 2020.
For revision in Exit load for Nippon India Sector specific Funds w.e.f. May 21, 2020, kindly refer notice cum addendum no. 15, dated May 19, 2020.
For revision in Exit load for Nippon India Large Cap Fund w.e.f. May 22, 2020, kindly refer notice cum addendum no. 17, dated May 20, 2020.
With a view to bring uniformity in returns of the schemes and their respective benchmarks from currency perspective, the returns of S&P 500 and Topix (Tokyo Price Index) along with respective underlying schemes i.e. Nippon India US Equity Opportunities Fund and Nippon India Japan Equity Fund are published in INR terms.
For changes in the Name of Asset Management Company (AMC) & Trustee Company from Reliance Nippon Life Asset Management Limited to “Nippon Life India Asset Management Limited” w.e.f. January 13, 2020 and the name of the Trustee Company of NIMF,from Reliance Capital Trustee Co. Limited to “Nippon Life India Trustee Limited” w.e.f. January 15, 2020, kindly refer notice cum addendum no. 126, dated January 15, 2020.
Nippon Life Insurance Company (“NLI”), which is a mutual company incorporated and existing under the laws of Japan, has acquired 75% stake in Reliance Mutual Fund (RMF) and has now become the ‘sole sponsor’ of RMF. As a result of this acquisition and in order to appropriately associate the name of the Mutual Fund with its current sponsor, the fund house is now named as Nippon India Mutual Fund. The names of all the existing schemes has changed by substituting the word ‘Reliance’ prefixed before each scheme name with ‘Nippon India’. Investors are further, requested to refer addendum No. 76 dated September 27, 2019 and addendum No. 78 dated October 1, 2019..
For Completion of “Proposed Transaction” as referred in our Notice Cum Addendum No. 56 dated August 21, 2019 , kindly refer to Notice cum Addendum 78, dated 1st Oct, 2019.
For Revision in the fresh subscription limit through SIP or STP or such other special product from Rs. 1 lakh to Rs. 5 lakhs in Nippon India Small Cap Fund wef. Oct 18 2019, kindly refer notice cum addendum no. 82 dated Oct 11, 2019.
*Reliance Focused Large Cap Fund was merged into Reliance Mid & Small Cap Fund and the merged scheme was renamed as Nippon India Focused Equity Fund (formerly Reliance Focused Equity Fund) (‘Scheme’) with effect from April 28, 2018. In line with SEBI circular SEBI/HO/IMD/DF3/CIR/P/2018/69 dated April 12, 2018, since the Scheme did not retain the features of either the transferor or transferee scheme, the performance has been provided herein since the effective date i.e. April 28, 2018.
The investors of Nippon India Gold Savings Fund & Nippon India Junior BeES FOF will be bearing the recurring expenses of the scheme, in addition to the expenses of underlying scheme.
Disclaimer: The Fact sheet “Fundamentals” is meant for general reading purpose only and is not meant to serve as a professional guide for the readers. This document has been prepared on the basis of publicly available information, internally developed data and other sources believed to be reliable. The Sponsor, the Investment Manager, the Trustee or any of their respective directors, employees, affiliates or representatives (“entities & their affiliates”) do not assume any responsibility for, or warrant the authenticity, accuracy, completeness, adequacy and reliability of such information. Whilst no action has been solicited based upon the information provided herein; due care has been taken to ensure that the facts are accurate and opinions given are fair and reasonable. This information is not intended to be an offer or solicitation for the purchase or sale of any financial product or instrument. Recipients of this information are advised to rely on their own analysis, interpretations & investigations. Readers are also advised to seek independent professional advice order to arrive at an informed investment decision. Entities & their affiliates shall not be liable for any direct, indirect, special, incidental, consequential, punitive or exemplary damages, including loss of profits, arising in any way from the information contained in this material. Entities & their affiliates including persons involved in the preparation or issuance of this material may from time to time have long or short positions in and buy or sell the securities there of, of company(ies)/ specific economic sectors mentioned herein. NAV of the plan/option of certain schemes are not provided for certain cases as the NAV was not computed because there were no investors as on the date on which the NAV details are provided.
Mutual Fund investments are subject to market risks, read all scheme related documents carefully.

June 2020Fundamentals 83
THIS PAGE IS INTENTIONALLY KEPT BLANK

How To Read Factsheet
Fund Manager: An employee of the asset management company such as a mutual fund or life insurer, who manages investments of the scheme. He is usually part of a larger team of fund managers and research analysts.
Application Amount for Fresh Subscription: This is the minimum investment amount for a new investor in a mutual fund scheme.
Minimum Additional Amount: This is the minimum investment amount for an existing investor in a mutual fund scheme.
Yield to Maturity: The Yield to Maturity or the YTM is the rate of return anticipated on a bond if held until maturity. YTM is expressed as an annual rate. The YTM factors in the bond’s current market price, par value, coupon interest rate and time to maturity.
SIP: SIP or systematic investment plan works on the principle of making periodic investments of a fixed sum. It works similar to a recurring bank deposit. For instance, an investor may opt for an SIP that invests Rs 500 every 15th of the month in an equity fund for a period of three years.
NAV: The NAV or the net asset value is the total asset value per unit of the mutual fund after deducting all related and permissible expenses. The NAV is calculated at the end of every business day. It is the value at which the investor enters or exits the mutual fund.
Benchmark: A group of securities, usually a market index, whose performance is used as a standard or benchmark to measure investment performance of mutual funds, among other investments. Some typical benchmarks include the Nifty, Sensex, BSE200, BSE500, 10-Year Gsec.
Entry Load: A mutual fund may have a sales charge or load at the time of entry and/or exit to compensate the distributor/agent. Entry load is charged at the time an investor purchases the units of a mutual fund. The entry load is added to the prevailing NAV at the time of investment.
For instance, if the NAV is Rs. 100 and the entry load is 1 %, the investor will enter the fund at Rs. 101.
Note: SEBI, vide circular dated June 30, 2009 has abolished entry load and mandated that the upfront commission to distributors will be paid by the investor directly to the distributor, based on his assessment of various factors including the service rendered by the distributor.
Exit Load: Exit load is charged at the time an investor redeems the units of a mutual fund. The exit load is deducted from the prevailing NAV at the time of redemption. For instance, if the NAV is Rs. 100 and the exit load is 1 %, the redemption price would be Rs.99 per unit.
Modified Duration: Modified duration is the price sensitivity and the percentage change in price for a unit change in yield.
Standard Deviation: Standard deviation is a statistical measure of the range of an investment’s performance. When a mutual fund has a high standard deviation, its means its range of performance is wide, implying greater volatility.
Sharpe Ratio: The Sharpe Ratio, named after its founder, the Nobel Laureate William Sharpe, is a measure of risk-adjusted returns. It is calculated using standard deviation and excess return to determine reward per unit of risk.
Beta Ratio (Portfolio Beta): Beta is a measure of an investment’s volatility vis-a-vis the market. Beta of less than 1 means that the security will be less volatile than the market. A beta of greater than 1 implies that the security’s price will be more volatile than the market.
Average portfolio PE (Average P/E): It is price to earnings ratio of the stocks calculated for the entire portfolio on a weighted average basis.
Average portfolio price to book ratio (Average P/BV): It is price to book value of the stocks calculated for the entire portfolio on a weighted average basis.
Average portfolio dividend yield (Average Dividend Yield): It is dividend yield of the stocks calculated for the entire portfolio on a weighted average basis.
Net Equity: Net equity level is the net equity exposure percentage adjusted for any derivative positions in stocks or index for hedging or rebalancing purpose.
R Squared: It is a statistical measure of how closely the portfolio returns are correlated with its benchmark.
AUM: AUM or assets under management refers to the recent/ updated cumulative market value of investments managed by a mutual fund or any investment firm.
Holdings: The holdings or the portfolio is a mutual fund’s latest or updated reported statement of investments/securities. These are usually displayed in terms of percentage to net assets or the rupee value or both. The objective is to give investors an idea of where their money is being invested by the fund manager.
Nature of Scheme: The investment objective and underlying investments determine the nature of the mutual fund scheme. For instance, a mutual fund that aims at generating capital appreciation by investing in stock markets is an equity fund or growth fund. Likewise, a mutual fund that aims at capital preservation by investing in debt markets is a debt fund or income fund. Each of these categories may have subcategories.
Rating Profile: Mutual funds invest in securities after evaluating their creditworthiness as disclosed by the ratings. A depiction of the mutual fund in various investments based on their ratings becomes the rating profile of the fund. Typically, this is a feature of debt funds.


![Build in Canada Programme d’innovation Innovation Program ...€¦ · 13 TestDepartmentsbyParcipaonLevel & [CATEGORY NAME] [CATEGORY NAME] [CATEGORY NAME] [CATEGORY NAME] NaonalResearchCouncil](https://static.fdocuments.us/doc/165x107/5f224b4457407520eb2cd843/build-in-canada-programme-dainnovation-innovation-program-13-testdepartmentsbyparcipaonlevel.jpg)