CATCHMENT-WIDE MODELLING OF LAND-USE …flrc/workshops/12/Manuscripts/Green_2...SPASMO uses daily...
16
1 CATCHMENT-WIDE MODELLING OF LAND-USE IMPACTS ON THE RUATANIWHA PLAINS Steve Green 1 , Andrew Manderson 2 , Brent Clothier 1 , Alec Mackay 2 and Monique Benson 3 1 The New Zealand Institute for Plant & Food Research Limited, Palmerston North, New Zealand 2 AgResearch, Palmerston North, New Zealand 3 Hawke’s Bay Regional Council, Napier, New Zealand Abstract The Hawke‟s Bay Regional Council (HBRC) is currently undertaking a water storage project for the Ruataniwha Plains. They are seeking information to define the potential volumes of water that are needed now, and in the future, to irrigate a range of agricultural and horticultural enterprises. In addition, the Council are also seeking information to help to assess the potential effects of land use change on surface and groundwater quality as a result of irrigating from stored water. The current land use has been identified (using the Agribase™ and recent ortho-corrected aerial photography) as a mix of dryland sheep and beef, extensive arable, some dairy and finishing farms and a small amount of horticulture. There is also some land that is currently under irrigation. Model outputs have been simulated for these farming enterprises. The provision of a reliable supply of irrigation water is expected to change the mix and intensity of land uses and altering the environmental impacts. We are running computer simulations for a number of future farm scenarios. Modelling is being carried out in two stages. Firstly, at the enterprise scale, we are using Plant & Food Research‟s SPASMO model (Soil Plant Atmosphere System Model) to simulate the daily water and nutrient balances for a range of land based enterprises, soil type and microclimates. Model outputs from SPASMO are then being imported into AgResearch‟s GIS landscape modelling tools to aggregate the water and nutrient balances across a number of sub-catchments (irrigation zones). The task of the enterprise-scale modelling is to assess the impacts of land use intensification on the water balance and nutrient fate. In this article, we discuss the modelling approach that is being used to simulate irrigation demand and nutrient loads from a range of land use activities. Some preliminary results are presented for selected farm enterprises. Keywords soil water balance, land use, irrigation allocation, nutrient drainage fluxes, modelling Introduction The Hawke‟s Bay Regional Council (HBRC) is seeking information to define potential volumes of water needed now and in the future to irrigate a range of agricultural and horticultural enterprises on the Ruataniwha plains. A water-storage project is being planned for this area (Tonkin & Taylor 2009). The council is also seeking information to help them to assess the potential impacts of land-use change on surface and ground water quality and
Transcript of CATCHMENT-WIDE MODELLING OF LAND-USE …flrc/workshops/12/Manuscripts/Green_2...SPASMO uses daily...

1
CATCHMENT-WIDE MODELLING OF LAND-USE IMPACTS
ON THE RUATANIWHA PLAINS
Steve Green1, Andrew Manderson
2, Brent Clothier
1, Alec Mackay
2
and Monique Benson3
1The New Zealand Institute for Plant & Food Research Limited,
Palmerston North, New Zealand 2AgResearch, Palmerston North, New Zealand
3Hawke’s Bay Regional Council, Napier, New Zealand
Abstract
The Hawke‟s Bay Regional Council (HBRC) is currently undertaking a water storage project
for the Ruataniwha Plains. They are seeking information to define the potential volumes of
water that are needed now, and in the future, to irrigate a range of agricultural and
horticultural enterprises. In addition, the Council are also seeking information to help to
assess the potential effects of land use change on surface and groundwater quality as a result
of irrigating from stored water.
The current land use has been identified (using the Agribase™ and recent ortho-corrected
aerial photography) as a mix of dryland sheep and beef, extensive arable, some dairy and
finishing farms and a small amount of horticulture. There is also some land that is currently
under irrigation. Model outputs have been simulated for these farming enterprises. The
provision of a reliable supply of irrigation water is expected to change the mix and intensity
of land uses and altering the environmental impacts. We are running computer simulations
for a number of future farm scenarios.
Modelling is being carried out in two stages. Firstly, at the enterprise scale, we are using
Plant & Food Research‟s SPASMO model (Soil Plant Atmosphere System Model) to
simulate the daily water and nutrient balances for a range of land based enterprises, soil type
and microclimates. Model outputs from SPASMO are then being imported into AgResearch‟s
GIS landscape modelling tools to aggregate the water and nutrient balances across a number
of sub-catchments (irrigation zones). The task of the enterprise-scale modelling is to assess
the impacts of land use intensification on the water balance and nutrient fate. In this article,
we discuss the modelling approach that is being used to simulate irrigation demand and
nutrient loads from a range of land use activities. Some preliminary results are presented for
selected farm enterprises.
Keywords soil water balance, land use, irrigation allocation, nutrient drainage fluxes,
modelling
Introduction
The Hawke‟s Bay Regional Council (HBRC) is seeking information to define potential
volumes of water needed now and in the future to irrigate a range of agricultural and
horticultural enterprises on the Ruataniwha plains. A water-storage project is being planned
for this area (Tonkin & Taylor 2009). The council is also seeking information to help them to
assess the potential impacts of land-use change on surface and ground water quality and

2
quantity. A multi-Crown Research Institute (CRI) team has been engaged in this project.
AgResearch (AgR) has been assigned the task of spatially mapping and defining „current land
use‟ and land-use change scenarios for irrigable land located on the Ruataniwha Plains in
Central Hawke‟s Bay. Plant & Food Research (PFR) has been assigned the task of simulating
the irrigation demand and nutrient losses (nitrogen (N) & phosphorus (P)) from a range of
farming enterprises. Results of this modelling are then being passed on to NIWA for
inclusion in a ground and surface water interactions model to predict the impact of land use
intensification on the quality of the receiving waters.
The specific area of interest has been defined and bounded according to four irrigation zones
(Tonkin & Taylor 2009). A fifth „up-stream‟ zone (non-irrigated) has subsequently been
added to this study in order to accommodate part of a recharge zone for the NIWA modelling
(the red area in the first image of Figure 1).The purpose of this article is to provide an
overview of each step of the calculation procedure that has been used to generate the water
and nutrient loads. Details of the NIWA modelling are described elsewhere (Rutherford
2012).
Materials and Methods
The modelling framework
The calculation procedure involves a 4-step process, as shown in Figure 1.
Firstly, AgR determines the current mix of soil/climate/land cover/farm type using a
suite of national databases entered into their GIS landscape-modelling platform. The
definition of each farm type is based on model farms described in a feasibility study
of on-farm economics for the proposed Ruataniwha Irrigation Scheme, prepared by
Macfarlane Rural Business Ltd (Macfarlane et al. 2011).
Secondly, PFR models the environmental impacts of each farm type, on the receiving
ground and surface waters, for a range of soils and climate zones across the
Ruataniwha plains by modelling each of the enterprises that make up each farm type.
Model outputs from PFR include daily/weekly/monthly totals of irrigation, soil-water
drainage and runoff (mm) as well as discharges of nitrate-nitrogen (N) and total
phosphorous (mg/L and kg N (or P)/ha/y) associated with each farm enterprise.
Thirdly, model outputs from PFR are passed back to AgR for summation at the farm
scale by aggregating the enterprises associated with each model farm. Enterprise scale
values for water and nutrient loads are generated by combining a GIS overlay of land
cover with a “look up” table of N and P discharge predictions for a combination of
climates and soils and a mix of agricultural and non-agricultural land areas.
Lastly, the enterprise scale outputs are passed onto NIWA for inclusion in a ground
and surface water interactions model where the impacts on water quality are being
assessed.

3
Figure 1. Modelling framework used to generate daily/weekly/monthly values of water and
nutrient (nitrogen (N) & phosphorus (P)) loads associated with a mix of farming enterprises
on the Ruataniwha plains.
Soil water and nutrient balance
All water and nutrient calculations have been carried out using Plant & Food Research‟s
SPASMO model (Deurer et al. 2011; Green et al. 2008; Sarmah et al. 2005). This model
considers the movement of water, solute (e.g. N and P), pesticide, and dissolved organic
matter (i.e. dissolved organic carbon (DOC) and dissolved organic nitrogen (DON)) through
a one-dimensional soil profile, plus overland flow of sediment and nutrients. The focus of this
study is on irrigation demands and the N and P loads under a range of land use scenarios on
the Ruataniwha plains.
The soil-water balance is calculated by considering the inputs (rainfall and irrigation) and
losses (plant uptake, evaporation, runoff and drainage) of water from the soil profile. The
model includes components to predict the carbon and nitrogen budgets of the soil. These
components allow for a calculation of plant growth and uptake of N, various exchange and
transformation processes that occur in the soil and aerial environment, recycling of nutrients
and organic material to the soil biomass, and the addition of surface-applied fertilizer and/or
effluent to the land, and the returns of dung and urine from grazing animals (Rosen et al.
2004). Model results for the water balance are expressed in terms of mm (= one litre of water
per square metre of ground area). The concentration and leaching losses of nutrients are
expressed in terms of mg L-1
and kg ha-1
, respectively. All calculations are run on a daily
basis and the results are presented on a per hectare basis.
+ + + =
5 irrigation zones 53 possible soil
types
9 farming types (plus
non-agricultural)4350 unique unit
combinations for
current land use
scenario
50 eligible virtual
climate stations
Monthly N & P
output variables
(456 months)
Spatial summaries
(e.g. net loss by
catchment)
Spasmo
happens here
Spasmo outputs
compiled into single
look up table

4
Climate Inputs
SPASMO uses daily values of global radiation, air temperature (maximum and minimum),
relative humidity (maximum and minimum), wind speed and rainfall. These climate variables
are used to calculate a daily water balance, and to grow each of the crops according to a well-
defined set of allocation rules that determine dry matter production according to light
interception (a function of the green-leaf area) and the availability of soil water and nutrients.
Crop growth is curtailed if water and N are in short supply. Irrigation is supplied on the basis
of need (Green et al. 1999). In the case of pastoral systems, the grazing management is
dictated by animal feed requirements, production targets and pasture supply.
Daily values (1972-2011) of climate variables are used to calculate a local value for the
potential evapotranspiration (ETO, mm/d) using the FAO-56 Penman-Monteith model (Allen
et al. 1998). The climate data are sourced from NIWA‟s Virtual Climate Station Network
(VCSN) using the Cliflo search engine (www.cliflo.niwa.co.nz). The location of each climate
station is shown in Figure 2.
Figure 2. A GIS overlay showing the location of NIWA‟s Virtual Climate Network Stations
(VCNS) and the map of the underlying soil series. For the purpose of modelling, daily
climate data (1972-20011) were compiled and an assessment of the land area of each soil
series was made for each soil grid.

5
Soil properties
SPASMO requires a comprehensive set of soil physical and hydraulic properties to calculate
the soil water balance. It also computes the various N transformation processes that occur
naturally (e.g. decomposition of plant organic nitrogen, Urea NH4+ NO3
- N20 N2
gas), as well as those occurring following the surface-addition of water, fertilizer and/or
effluent to the land. These processes are described using first-order rate constants that are
moderated by the soil conditions (i.e. temperature, moisture content, C:N ratio, etc.). Three
forms of mineral N (i.e. urea, ammonium and nitrate), two forms of organic N (i.e. dissolved
and resident organic nitrogen) and two forms of P (dissolved reactive P and dissolved organic
P) are modelled in the soil domain using a simultaneous set of equations to describe
convection, diffusion and sorption of each nutrient species.
Table 1. Physical and hydraulic properties for a range of soil series found in one of the
climate zone grids (NCNS30503) shown in Figure 2. Selected properties include, but are not
restricted to, total porosity (TP), field capacity (FC), stress point (SP), wilting point (WP),
and total available water (TAW=FC-WP). All values expressed as mm of water per m of soil.
soil series SAT FC SP WP TAW
Argyll 210 100 62 35 65
Tukituki 193 92 39 14 79
Tikokino 345 236 172 119 117
Takapau 405 297 228 168 129
Taniwha 406 317 246 181 136
Irongate 488 285 193 123 162
Okawa 476 281 180 112 169
Mangatewai 444 368 277 190 178
Poporangi 486 413 314 218 195
Twyford 462 292 170 90 202
Omarunui 545 364 248 157 207
Flaxmere 558 365 244 151 214
Requisite soil profile properties are deduced from Landcare Research‟s Fundamental Soil
Layers (FSL) and National Soils Database (NSDB). These properties include soil texture
(sand, clay and stone content), bulk density, water-holding capacity, drainage class, and the
soil organic carbon and nitrogen content. A total of 53 soil series have been identified from
soil mapping of the Ruataniwha Plains (Figure 2). The soils range from extremely light (a
shallow sandy loam with 40-60% stone content) through to poorly drained silty clay loam
(Table 1).
For the purpose of calculation, SPASMO requires a functional form for the soil‟s water
retention curve. This was achieved by fitting each set of water retention data (i.e. the total
porosity (TP), field capacity (FC), wilting point (WP) points shown in Figure 3) to the van
Genuchten (1980). FC is given by the water content at a potential of -10 kPa; WP is defined
by the water content at a potential of -1500 kPa. The refill point for irrigation is typically at a
potential of about –100 kPa.

6
Figure 3. Water retention properties for the Ruataniwha series soil: „left panel‟ is the top 20
cm of loam, „middle panel‟ is 40 cm of silt loam, and „right panel‟ is 40 cm of sandy loam.
The van Genuchten (1980) model was fitted to each water retention curve.
Model farm scenarios and land uses
AgResearch was assigned the task to spatially map and define „current land use‟ and land use
change scenarios that would be feasible for irrigable land on the Ruataniwha Plains based on
the nine „model farms‟ (Table 2) taken from the Macfarlane report (2011). The water and
nutrient loadings for each of the enterprises for each of the model farms was calculated for
each of the soils and microclimates found within the irrigation zones. The end result was a
table of monthly outputs (spanning 480 months) from the 4350 model runs. AgResearch‟s
GIS modelling platform was then used to interrogate these look-up tables and average the
model outputs across the enterprises that make up each model farm.
Table 2. Model farm types and stocking rates (SU = stock unit) identified in the McFarlane et
al. (2011) report.
Scenario No. Model Farm Type Stocking Rate
1 Sheep and beef breeding and finishing 10-11 SU
2 Mixed livestock with dairy support 10-11 SU
3 Finishing farms 10-11 SU
4 Intensive mixed livestock 5SU + cropping
5 Arable with a range of crops 5SU + cropping
6 Dairy heavy soils 21 SU
7 Dairy light soils 23 SU
8 Pipfruit -
9 Viticulture -
1
10
100
1000
10000
0.0 20.0 40.0 60.0
So
il M
atr
ic p
ote
ntial [
kP
a]
Soil water content [%]
1
10
100
1000
10000
0.0 20.0 40.0 60.0
So
il M
atr
ic p
ote
ntial [
kP
a]
Soil water content [%]
1
10
100
1000
10000
0.0 20.0 40.0 60.0
So
il M
atr
ic p
ote
ntial [
kP
a]
Soil water content [%]

7
For the purpose of modelling, each farm type is specified by a production target (e.g. dairy is
represented by kg of milk solids per ha, sheep and beef are represented by live weight gains,
and arable and horticulture are represented by kg of product per hectare). For each model run,
the input parameters for SPASMO were „set‟ to achieve the expected yields and production
volumes that were specified in the Macfarlane et al. (2011) report.
Initial model runs compared the enterprises in the pre- and post-storage model farm types
described in the Macfarlane‟s (2011) prefeasibility study of the proposed irrigation scheme.
The timing and amount of irrigation was based on best practice (matching irrigation to crop
needs), with advice from a panel of expert scientists. The fertilizer regimes for each farm
were set to match the demands for each crop, based on the nutrient requirements to achieve a
healthy, actively-growing crop. We have chosen to assume the same annual inputs of N and P
fertilizer as specified in the Macfarlane et al. (2011) report. Then expert opinion was sought
to specify the timings for each fertilizer application for the pastoral simulations, in order to
follow a maintenance schedule proposed by AgResearch.
Specific details for each farm scenario can be found in the Macfarlane et al. (2011) report. In
all cases, SPASMO has been parameterized to match, as closely as possible, each of the nine
model farm types listed in Table 2. Salient details for some of those farm types are presented
below in order to convey the degree of detail involved in the SPASMO simulations.
Horticulture – apples and wine grapes
A set of crop-dependent parameters have been used to simulate the seasonal development of
dry matter (DM) going into the leaves, shoots, roots and fruits. The plant growth component
of the model is similar to that of Eckersten & Jansson (1991), where daily biomass
production is modelled using a potential production rate (kg m2 d
-1) that depends on the
amount of light intercepted by the green leaves. Nitrogen accumulation to the various plant
organs depends on the leaf nitrogen content and the potential supply of N from the root-zone
soil. If water and nutrients are limiting, plant growth and N-uptake are curtailed. Model
parameters for crop growth and N-uptake were selected here to match typical values for leaf
area index, fruit yield and the nitrogen contents of the various plant parts.
The crop model is very dynamic and responsive to changes in the climate as well as the water
and nutrient status of the root-zone soil (Green et al. 2006). Some crop parameters are needed
to account for physiological events (e.g. budburst, flowering, fruit maturity, leaf fall), while
other parameters deal with aspects of management (e.g. harvest, summer/winter pruning,
irrigation, nitrogen fertilization). An example of model outputs for the DM allocation in
grapes is shown in Figure 4.
For simplicity it is assumed that all crop material (i.e. bunches of mature grapes or numbers
of mature apples) would be harvested and the corresponding dry matter, along with its N and
P content, would be removed from the vineyard or orchard. Following leaf fall and pruning
events, all plant biomass is assumed to be mulched (i.e. mowed up) and returned to a surface
layer, where it slowly decomposes, releasing dissolved organic matter (i.e. both carbon,
nitrogen and phosphorous) to the soil profile. Litter decomposition is a very important
process for returning nutrients and carbon to the soil system. In terms of potential nitrate
leaching, our own measurements from apple orchards near Hastings have found annual
leaching loss of ~10 kg N/ha (Figure 5). We report these values here simply to establish how
much N leaches from apples.

8
Figure 4. SPASMO (Soil Plant Atmosphere System Model) includes components for crop
phenology (i.e. budburst, flowering and harvest) that help establish dry-matter allocation
(DM), and irrigation management of the grapevines. The bottom panels show data sourced
from regional grape trials in Marlborough (blue symbols) compared against predictions from
SPASMO (red symbols). The phenology models are based on growing degree days (GDD).
The crop growth model is based on daily values of global radiation (Rg), leaf area index
(LAI), air temperature (Ta), soil water (W) and soil nitrogen (N) content. The phenology data
were provided by Alistair Hall (PFR, pers. comm.).
Figure 5. Drainage and nitrate leaching under an apple orchard in the Hawke‟s Bay, as
measured with six passive-wick drainage meters (S Green, unpublished).
0
200
400
600
800
1000
1200
Sep Oct Nov Dec Jan Feb Mar Apr May Jun Jul
pla
nt
DM
[kg
/ha]
leaf DM shoot DM bunch DM
Dynamics of crop growth and nutrient uptake: e.g. Viticulture:
0.0
20.0
40.0
60.0
80.0
100.0
120.0
0 100 200 300 400 500 600 700 800
Bu
b b
rea
k [%
]
GDD sum (degree-day)
0.0
20.0
40.0
60.0
80.0
100.0
120.0
1100 1200 1300 1400 1500 1600
Flow
erin
g [%
]
GDD sum (degree-day)
0.0
5.0
10.0
15.0
20.0
25.0
2000 2200 2400 2600 2800 3000 3200 3400B
rix
[%]
GDD sum (degree-day)
budburst flowering harvest
• phenology GDD
• growth f(Rg, Ta, W, N)
• uptake f(supply & demand)
Trimming (LAI ~ 1.0)
Leaf fall
Winter pruning
0
2
4
6
8
10
12
0
100
200
300
400
500
600
Dec Feb Apr Jun Aug Oct Dec
Cu
mu
lative
NO
3 lo
ss [k
g/h
a]
Cu
mu
lative
dra
ina
ge
[mm
]
Drainage NO3 loss

9
Horticulture – Vegetables and arable crops
The growth and development of a sequence of arable crops including oats, lucerne, barley,
potatoes, wheat, maize, vining peas and forage brassicas are modelled using the same sets of
allocation equations as for the tree and vine crops, but with parameter values adjusted to the
expected yields and nutrient uptakes for each crop. These parameter values are deduced from
data reported in Thorup-Kristenson (2006) and Karam et al. (2002), the modelling paper of
Tei et al. (1996), the guidelines of the forage brassica group (de Ruiter et al. 2009), and
fertilizer guidelines either reported on the internet (HortPlus™ and the Yates Growers‟
Guides) or deduced from the Macfarlane et al. (2011) report. An example showing the
dynamics of crop growth and nitrogen uptake for dryland lucerne is shown in Figure 6, and
an example showing the dynamics of crop growth and nutrient uptake for maize silage is
shown in Figure 7.
SPASMO accommodates multiple crop rotations in a single calendar year, with all crop
residues being ploughed back after harvest. The modelling framework accounts for the
release and movement of dissolved organic matter (i.e. dissolved organic-C, organic-N and
organic-P) originating from the breakdown of any plant material left after each crop harvest.
This decomposition is important, since it alters the soil C:N ratio and this has an impact on
rates of nitrogen-mineralization. The modelling procedure used by SPASMO to simulate
nitrogen mineralization has been previously verified against data from laboratory incubation
studies (Figure 8).
Figure 6. The relationship between annual dry-matter (DM) production and total nitrogen
uptake by dryland lucerne. The open markers represent data from Rothamsted, UK (Bell &
Nutman 1971) and the filled markers are calculations using SPASMO (long-term averages)
for climate station No. 27371. Note: Lucerne is a legume and so no nitrogen fertilizer was
applied, yet the plants still accumulated some 290-350 kg N/ha each year.
0
100
200
300
400
0.0 2.0 4.0 6.0 8.0 10.0 12.0
Nit
roge
n co
nten
t [k
g/h
a]
annual DM yield [kg/ha]
SPASMO data
10
0
4000
8000
12000
16000
Jul Nov Mar Jul Nov Mar Jul Nov Mar Jul Nov Mar Jul Nov Mar
Cro
p m
atte
r p
rod
uctio
n [k
g/h
a]
stem & leaf ear
0.0
1.0
2.0
3.0
4.0
6400 6600 6800 7000 7200 7400 7600 7800 8000 8200
Pla
nt n
itro
ge
n c
on
ten
t [%
}
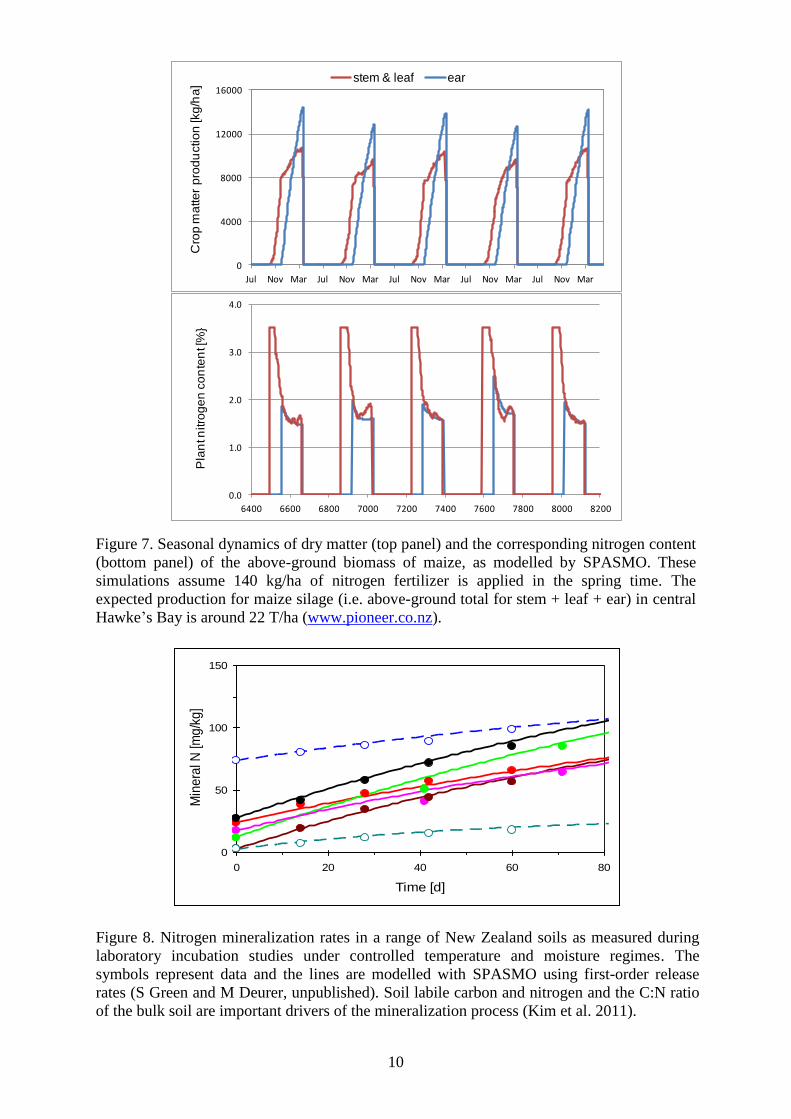
Figure 7. Seasonal dynamics of dry matter (top panel) and the corresponding nitrogen content
(bottom panel) of the above-ground biomass of maize, as modelled by SPASMO. These
simulations assume 140 kg/ha of nitrogen fertilizer is applied in the spring time. The
expected production for maize silage (i.e. above-ground total for stem + leaf + ear) in central
Hawke‟s Bay is around 22 T/ha (www.pioneer.co.nz).
Figure 8. Nitrogen mineralization rates in a range of New Zealand soils as measured during
laboratory incubation studies under controlled temperature and moisture regimes. The
symbols represent data and the lines are modelled with SPASMO using first-order release
rates (S Green and M Deurer, unpublished). Soil labile carbon and nitrogen and the C:N ratio
of the bulk soil are important drivers of the mineralization process (Kim et al. 2011).
0
50
100
150
0 20 40 60 80
Time [d]
Min
era
l N [m
g/k
g]

11
Pasture simulations.
The pasture growth component of SPASMO is described in Rosen et al. (2004). For the
present study, values of the model parameters were set to match results from our field
experiments from an irrigated dairy farm at Tikokino (Green et al. 2000), which is within the
proposed irrigation zone. The pasture growth component appears to be „well-tuned‟ to local
growing conditions (Figure 9).
Figure 9. The cumulative pasture production from an irrigated dairy farm near Tikokino as
measured from „pasture cages‟ on the farm (symbol) and as modelled using SPASMO (see
Green et al. 2000 for details).
Figure 10. Measured (symbol) and modelled nitrate leaching from a dairy farm near Taupo. A
total of 45 drainage lysimeters were installed in three paddocks, and they are being monitored
at 1 to 2-month intervals to assess the drainage of water and the leaching of nitrate and
ammonium (Green 2009, unpublished).
0.0
5.0
10.0
15.0
20.0
25.0
30.0
35.0
Sep Jan May Sep Jan May Sep
pastu
re p
rod
uctio
n [T/h
a]
Pasture cuts SPASMO model
0.0
25.0
50.0
75.0
100.0
Jan/07 Apr/07 Aug/07 Nov/07 Feb/08 Jun/08 Sep/08 Dec/08 Mar/09 Jul/09
Cu
mu
lative
nitra
te le
ach
ed
[kg
/ha
]
12
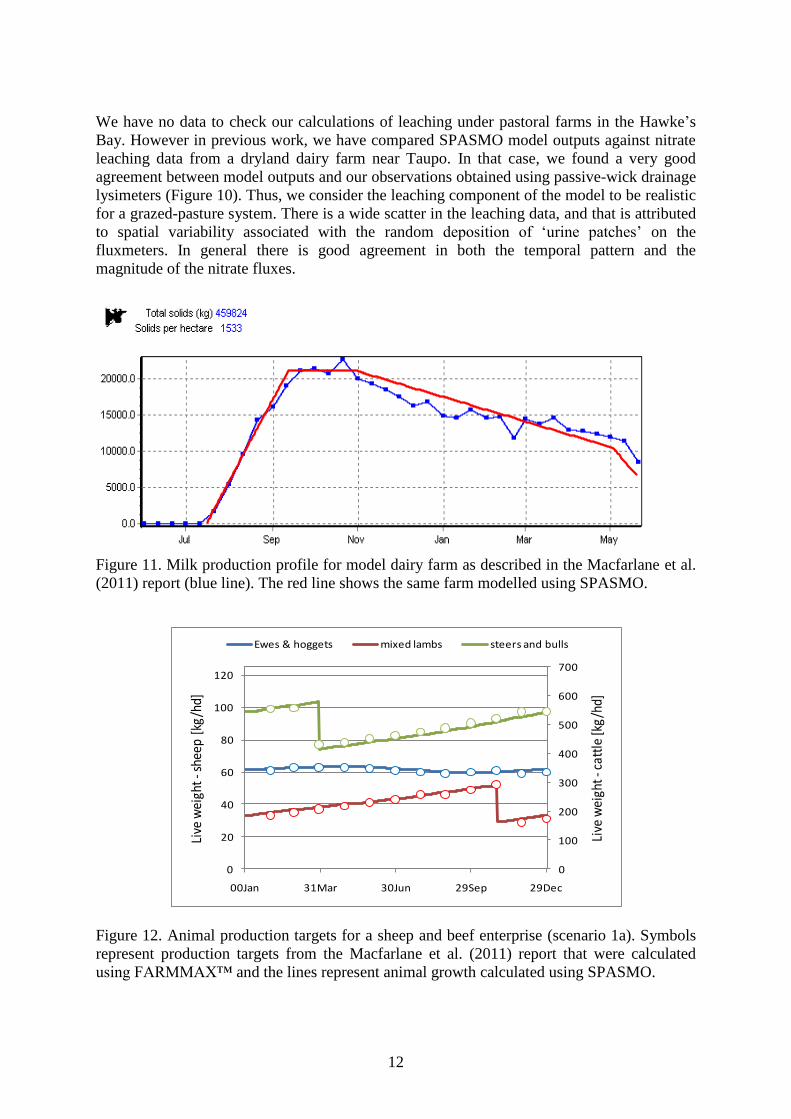
We have no data to check our calculations of leaching under pastoral farms in the Hawke‟s
Bay. However in previous work, we have compared SPASMO model outputs against nitrate
leaching data from a dryland dairy farm near Taupo. In that case, we found a very good
agreement between model outputs and our observations obtained using passive-wick drainage
lysimeters (Figure 10). Thus, we consider the leaching component of the model to be realistic
for a grazed-pasture system. There is a wide scatter in the leaching data, and that is attributed
to spatial variability associated with the random deposition of „urine patches‟ on the
fluxmeters. In general there is good agreement in both the temporal pattern and the
magnitude of the nitrate fluxes.
Figure 11. Milk production profile for model dairy farm as described in the Macfarlane et al.
(2011) report (blue line). The red line shows the same farm modelled using SPASMO.
Figure 12. Animal production targets for a sheep and beef enterprise (scenario 1a). Symbols
represent production targets from the Macfarlane et al. (2011) report that were calculated
using FARMMAX™ and the lines represent animal growth calculated using SPASMO.
0
100
200
300
400
500
600
700
0
20
40
60
80
100
120
00Jan 31Mar 30Jun 29Sep 29Dec
Live
wei
ght -
catt
le [k
g/h
d]
Live
wei
ght -
shee
p [k
g/h
d]
Ewes & hoggets mixed lambs steers and bulls

13
For each pastoral system, stocking rates of our model farms were matched to those described
in the Macfarlane et al. (2011) report. SPASMO outputs were then cross-checked against
calculations of animal feed intake predicted by farm consultants using AgResearch‟s
FARMMAX™ model (Figures 11 and 12). Thus we are also confident that the animal
component of the farm model approximately matches expected farm production rates.
Results and Discussion
The task here was to simulate an irrigation demand and potential nitrate leaching from a
range of farming enterprises. Each simulation involved a unique combination of
soil+climate+enterprise type. Some model farm types (e.g. arable with a range of crops)
required us to generate model runs for more than 10 different parcels of land on each farm
unit. Thus, many hours were spent „cranking the handle‟. Initial model outputs were
straightforward and involved a calculation of the irrigation demands for pasture (Figure 13).
Those model outputs were used to assist in refining the size of the storage dam and specifying
the infrastructure to deliver water where and when it is needed. That work is in progress with
Tonkin and Taylor.
Figure 13. SPASMO was used to calculate the average (weekly) irrigation demand for
pasture growing on the Ruataniwha Plains. This average considers 52 soil types across the
four irrigation zones (total area ~32000 ha). The blue line is the model output each week and
the red line represents a 3-week running mean. Year to year variation is a reflection of the
variable and erratic nature of summer rainfall.
Model outputs for the annual losses of nitrate-nitrogen for a range of model farm types are
presented in Figure 14. SPASMO calculates between 3-11 kg N/ha is lost from grape
vineyards and between 6-15 kg N/ha is lost from apples, on average. The latter estimates for
apples are in accordance with our data from Hastings (cf. Figs 14b and Fig. 5). Some soils
like the Tukituki and Argyl gravelly sands, have very low water and nutrient holding
capacities and are probably better suited to grapes rather than the other farming enterprises.
The small amounts of N leached under apples and grape production reflects the small
amounts of N used in the production of both these crops and the adoptation of deficit
irrigation regimes.
0.0
5.0
10.0
15.0
20.0
25.0
30.0
35.0
40.0
Jun Oct Feb Jun Oct Feb Jun Oct Feb Jun Oct Feb Jun Oct Feb
We
ekly
Irri
ga
tio
n d
em
an
d [
mm
/da
y]

14
In general, the irrigated pastoral systems (irrigated sheep and beef finishing, and irrigated
dairy) tend to leach more N than the irrigated tree and vine crops. This is due to a
combination of factors. Associated with irrigation is the use of N-fertilizer in the irrigated
dairy operation, further increasing forage and milk production. While direct N leaching losses
from N-fertiliser application can occur, it is the impact that the added N-fertiliser has on
animal returns of urine (which is highly mobile) through the increased amounts of forage
grown, that leads to increased N leaching losses. Irrigation increases the risk of N leaching
losses occurring in season. It should be noted that our model outputs for pastoral farming
represent the scenario with all animals being wintered on-farm, and with no mitigation
options (e.g. feed pads, inhibitors, wintering off) being considered. In that case, we calculate
large losses on the shallow stony soils (e.g. the outlier on Figure 14c), which could be
reduced in practice mitigation practices. AgResearch, we are currently working through a
range of mitigation options, in their modelling of the land use impacts, to identify options that
will reduce the potential losses of N and P.
Figure 14. Model outputs of nitrate leaching under a range of model farms: (a) wine grapes,
(b) apples, (c) intensive sheep and beef, (d) dairy on light soils (wintered on-farm). The effect
of soil type is expressed via the soil‟s wilting point (WP). Some of the very stony soils (e.g.
the outlier in scenario (c)) have a very low WP (Table 1).
Eventually, the modelling team (AgResearch, NIWA and PFR) will be simulating the impacts
of five alternative land-use scenarios. These will be the pre-storage scenario that represents
the current mix of land uses, plus four future land-use scenarios. Presently, we have only just
completed our modelling of the existing land-use scenarios plus one half of the „fully
implemented‟ mix of post-storage land uses. From that modelling, we have already generated
0
50
100
150
200
250
300
0 5 10 15 20
Soil
wilt
ing
po
int
[mm
/m]
Annual nitrate leaching (kg NO3-N/ha)
grapes - scenario 9
0
50
100
150
200
250
300
0 5 10 15 20
Soil
wilt
ing
po
int
[mm
/m]
Annual nitrate leaching (kg NO3-N/ha)
Apples scenario 8
0
50
100
150
200
250
300
350
0 10 20 30 40
Soil
wil
tin
g p
oin
t [m
m/m
]
Annual nitrate leaching (kg NO3-N/ha)
sheep & beef (1b)
0
50
100
150
200
250
300
0 20 40 60 80 100
Soil
wilt
ing
poin
t [m
m/m
]
Annual nitrate leaching (kg NO3-N/ha)
dairy on light soils
a b
c d

15
more than 2 GB of model outputs across the full complement of about 18,000 different
combinations of climate & soil & farm type. That represents a very large data set.
Key model outputs from this study have now been passed to NIWA to model the effects of
land use intensification on water quality in the Tukituki and Waipawa Rivers. The aim of the
current research project was to first model the dynamics of land use on the Ruataniwha Plains
and the influence this has on surface and ground water quality, then to use this model to
assess the potential effects of land use change on surface and groundwater quality as a result
of irrigating from stored water, and finally to develop and test workable farm management
and other mitigation opportunities to offset any defined potential adverse effects associated
with realistic land use change scenarios modelled using the NIWA land use / water quality
model.
References
Allen RG, Pereira LS, Raes D, Smith M 1998. Crop Evapotranspiration. Guidelines for
computing crop water requirements. FAO Irrigation and Drainage Paper No. 56. Food and
Agriculture Organization of the United Nations, Rome, 301 pp.
Bell F, Nutman PS 1971. Experiments on nitrogen fixation by nodulated lucerne. Plant and
Soil (Special Issue) SVW-05, 231-264.
Deurer M, Green SR, Clothier BE, Mowat A 2011. Can product water footprints indicate the
hydrological impact of primary production? – A case study of New Zealand kiwifruit.
Journal of Hydrology 408 (2011) 246–256.
de Ruiter J, Wilson D, Maley S, Fletcher A, Fraser T, Scott W, Berryman S, Dumbleton A,
Nichol W 2009. Management practices for forage brassicas. Forage Brassica Development
Group (FBDG) report. Plant and Food Research. 62 pp.
Eckersten H, Jansson PE 1991. Modelling water flow, nitrogen uptake and production for
wheat. Fertilizer Research 27:313-330.
Green SR, Clothier BE, Mills TM, Millar A 1999. Risk assessment of the irrigation
requirements for field crops in a maritime climate. Journal of Crop Production 2(2):353-377.
Green SR, Vogeler I, Deurer M, and Clothier B, 2000. Modeling the impact of irrigation on
nitrate leaching from a dairy farm. HortResearch Client Report No. 2001/302, 62 pp.
Green SR, Sivakumaran S, van den Dijssel C, Mills TM, Blattmann P, Snelgar WP,
Clearwater MJ, Judd, M 2006. A Water and Nitrogen Budget for „Hort16A‟ Kiwifruit
Vines. Acta Hort 753: 527-534.
Green SR, Clothier BE, van den Dijssel C, Deurer M, Davidson P 2008. Measurement and
modelling the stress response of grapevines to soil-water deficits in their rootzones. Chapter
15, In Soil Science Society America Monograph “Modeling the response of crops to limited
water: Recent advances in understanding and modeling water stress effects on plant growth
processes”, L. Ahuja et al. [Eds] (in press).
Karam F, Mounzer O, Sarkis F, Lahoud R 2002. Yield and nitrogen recovery of lettuce under
different irrigation regimes. Journal of Applied Horticulture 4: 70-76.
Kim I, Deurer M, Sivakumaran S, Huh K, Green S and Clothier B 2011. The impact of soil
carbon management and environmental conditions on N mineralization. Biol Fertil Soils.
DOI 10.1007/s00374-010-0526-0

16
Macfarlane A, Eaton H, Nicholls A, Everest M, Lewis C, Osborn S, Baker D, Emms C 2011.
Feasibility study of on-farm economics for proposed Ruataniwha irrigation scheme.
Unpublished client report to Hawke‟s Bay Regional Council, May 2011.
Sarmah AJ, Close ME, Pang L, Lee R, Green SR 2005. Field study of pesticide leaching in a
Himatangi sand (Manawatu) and a Kiripaka boudery clay loam (Northland). 2. Simulation
using LEACHM, HYDRUS-1D, GLEAMS and SPASMO models. Aust. J. Soil Res. 43:
471-489.
Rosen MR, Reeves RR, Green SR, Clothier BE, Ironside N 2004 Prediction of groundwater
nitrate contamination after closure of an unlined sheep feedlot in New Zealand. Vadose
Zone Journal 3: 990-1006.
Rutherford K 2012. Modelling the effects of land use on nutrients entering the Tukituki River,
Hawke‟s Bay. A report prepared for Hawke‟s Bay Regional Council. NIWA Client Report
No. 12201, 41 pp.
Tei F, Scaife A, Aikman DP 1996. Growth of lettuce, onion, and red beet. 1. Growth analysis,
light interception, and radiation use efficiency. Annals of Botany 78: 633-643.
Thorup-Kristensen K 2006. Root growth and nitrogen uptake of carrot, early cabbage, onion and
lettuce following a range of green manures. Soil Use and Management 22: 29-38.
Tonkin & Taylor 2009. Prefeasibility Study of Water Augmentation Opportunities -
Ruataniwha Plains. A report prepared for Hawke‟s Bay Regional Council. T&T Ref:
25916.000
van Genuchten MT 1980. A closed form equation for predicting the hydraulic conductivity of
unsaturated soils. Soil Science Society of America Journal 44: 892-898.