Catalyzing Private investment for a low-Carbon eConomy
74
THE WORLD BANK CATALYZING PRIVATE INVESTMENT FOR A LOW-CARBON ECONOMY World Bank Group Progress on Renewable Energy and Energy Efficiency in Fiscal 2007
Transcript of Catalyzing Private investment for a low-Carbon eConomy

THE WORLD BANK
Catalyzing Private investment for a low-Carbon eConomy
World Bank Group Progress on Renewable Energy and Energy Efficiency
in Fiscal 2007
THE WORLD BANK
The World Bank Group1818 H Street, NW
Washington, DC 20433www.worldbank.org
www.ifc.orgwww.miga.org
This publication is printed on recycled paper. November 2007.

THE WORLD BANK
Catalyzing Private investment for a low-Carbon eConomy
World Bank Group Progress on Renewable Energy and Energy Efficiency
in Fiscal 2007
November 2007

ii
Copyright © 2007
The International Bank for Reconstruction and Development / The World Bank Group
1818 H Street, NWWashington, D.C. 20433, USA
All rights reserved
First printing: November 2007
Manufactured in the United States of America This document is a product of the staff of the World Bank Group. The findings, interpretations, and conclusions expressed herein do not necessarily reflect the views of the Board of Executive Directors of the World Bank Group or the governments they represent.

iii
Contents
Acronyms and Abbreviations vii
Units of Measure vi
Foreword ix
Acknowledgments x
Executive Summary xiLeveraging World Bank Group Resources xiWorld Bank Group Financial Support for Renewable Energy and Energy Efficiency xiiTechnical Assistance xiv
Introduction 1
Selling Solar: Lessons from a Decade of IFC and World Bank Experience 5World Bank Group Solar Photovoltaics Projects 5Key Lessons of Experience from Solar PV Projects 8Future Support for Photovoltaics 11Case One: Stimulating Solar Technology Improvement in China 12Case Two: Lighting Africa: Catalyzing Markets for Modern Lighting 14
Expanding Energy Efficiency Interventions 17Opportunities and Benefits of Energy Efficiency 17Barriers to Energy Efficiency Investments 18World Bank Group Energy Efficiency Investments 19Private Sector Finance for Energy Efficiency 19Energy Efficiency Action Plan 20Case Three: Promoting Energy Efficiency Investments through 22 Financial Intermediation in China
Building a Sustainable Hydropower Partnership 25An Abundant Resource 25The Multiple Benefits of Hydropower 25The World Bank Group’s Hydropower Investments 26Managing the Risks of Hydropower Projects 27Engaging the Private Sector 28The World Bank Group’s Hydropower Strategy 30Case Four: Sri Lanka—Private Sector Leadership in Small Hydropower 32Case Five: Bujagali Hydropower: Financing and Risk Mitigation 34
Toward a Low-Carbon Economy: Renewable Energy and Energy Efficiency Portfolio Review 37Financial Commitments 37Technical Assistance and Sector Studies 40

iv
The Way Forward 45Case Six: ESMAP Helps Create a Framework for Renewable Energy and 46 Energy Efficiency in Morocco
Annex 1: Institutional Support for Renewable Energy and Energy Efficiency 47Roles of the Institutions 47Definitions 48Different Reporting Styles 49
Annex 2: Annual Renewable Energy and Energy Efficiency Portfolio Review 51
Annex 3: FY07 Renewable Energy and Energy Efficiency Projects 55
List of BoxesBox 1: Applying WBG Instruments for Renewable Energy and Energy Efficiency Scale-Up 2Box 2: Sustainable Solar Market Packages 8Box 3: Moving Up the Value Chain—Moser Baer in India 9Box 4: The Price of Poor Lighting 14Box 5: IFC Financial Intermediation in Energy Efficiency 21Box 6: Identification of New Energy Efficiency Opportunities through 21
the IFC’s Investment Tracking SystemBox 7: Cornerstones of Progress 33Box 8: Wind Umbrella Project, Mexico 41Box 9: Improving Residential Energy Efficiency in Serbia 42Box 10: Shanghai: Developing a Green Electricity Scheme 42
List of Tables Table 1: World Bank Group Commitments for Renewable Energy and xiii
Energy Efficiency in FY07Table 2: World Bank Group Solar PV Initiatives 6Table 3: Energy Efficiency Opportunities in Important Consuming Sectors 18Table 4: Nam Theun 2 Project Risk Allocation 31Table 5: World Bank Group Commitments for Renewable Energy and Energy Efficiency, FY07 37Table 6: Measuring Progress in New Renewable Energy and Energy Efficiency Lending 38
against the Bonn CommitmentTable 7: Number of Projects by Region, FY07 40
List of FiguresFigure 1: World Bank Group Commitments for Renewable Energy and xiii
Energy Efficiency, FY90–07Figure 2: Share of World Bank Group Commitments for Renewable Energy and xiv
Energy Efficiency Relative to Total Energy Commitments, FY90–07Figure 3: Reductions in Greenhouse Gas Emissions by Consuming Sector through 2050 18Figure 4: Hydropower Potential and Production by Region 25

v
Figure 5: World Bank Group Annual Hydropower Financial Commitments 26Figure 6: Regional Distribution of World Bank Group Hydropower Projects 27Figure 7: Sri Lanka Small Hydropower Growth 32Figure 8: World Bank Group Renewable Energy and Energy Efficiency Commitments, 38
FY90–07Figure 9: Share of Renewable Energy and Energy Efficiency Relative 39
to the World Bank Group’s Total Energy CommitmentFigure 10: World Bank Group Renewable Energy and Energy Efficiency Commitments 39
by Region, FY07Figure 11: World Map with Distribution of Renewable Energy and Energy Efficiency Projects 41Figure 12: Sectoral Commitments by Region, FY07 43Figure 13: Number of AAA Products with Renewable Energy and Energy Efficiency Focus, 45
FY00–07


vii
AAA Analytical and advisory activity
AFR Africa RegionASTAE Asia Alternative Energy
ProgramBEL Bujagali Energy Ltd.BOOT Build-Own-Operate-TransferCEIF Clean Energy Investment
FrameworkCEPALCO Cagayan Electric Power and
Light CompanyCFB-IBRD The World Bank’s Carbon
Finance BusinessCFU Carbon Finance UnitCG Competitive Grant (Facility)CHEEF China Energy Efficiency
Financing ProjectCNG Compressed natural gasCRESP China Renewable Energy
Scale-Up ProgramDVD Digital video discEAP East Asia and Pacific RegionECA Europe and Central Asia
RegionEE Energy efficiencyEEfSD Energy Efficiency Action Plan
for Sustainable DevelopmentEETG Energy Efficiency Thematic
GroupEIA Environmental Impact
AssessmentESCO Energy service companyESMAP Energy Sector Management
Assistance ProgramFI Financial institutionFINESSE Financing Energy Services for
Small-Scale Energy UsersFYR Former Yugoslav RepublicGDP Gross domestic productGEF Global Environment Facility
Acronyms and Abbreviations
IBRD International Bank for Reconstruction and Development
IDA International Development Association
IEA International Energy AgencyIFC International Finance
CorporationIPO Initial public offeringIPP Independent power producerIREDA India Renewable Energy
Development AgencyIRIN Integrated Regional
Information Networks (IRIN), U.N. Office for the Coordination of Humanitarian Affairs
IUCN World Conservation UnionLCR Latin America and Caribbean
RegionLED Light-emitting diodeLLC Limited liability corporationMBIL Moser Baer India Ltd.MIGA Multilateral Investment
Guarantee AgencyMNA Middle East and North Africa
RegionNGO Nongovernmental
organizationNOZ-PV Netherlands Research
Program PVOECD Organisation for Economic
Co-operation and Development
PNOC-EDC Philippines National Oil Company’s Energy Development Corporation
PV Photovoltaic(s)PVMTI Photovoltaic Market
Transformation Initiative

viii
QR Quick Response (Facility)RE Renewable energyREDP Renewable Energy
Development Project (China)RETG Renewable Energy Thematic
GroupSAR South Asia RegionSDG Solar Development GroupSHP Small hydropowerSHS Solar home systemSME Small and medium enterpriseSSMP Sustainable Solar Market
PackageUETCL Uganda Electricity
Transmission Company Limited
UNEP United Nations Environment Programme
UNF United Nations FoundationVCD Video compact discWBG World Bank GroupY Yuan (currency of China)
Units of MeasureGWh Gigawatt-hourkm KilometerkWp Kilowatt-peakMW MegawattWp Watts-peak
ix
Renewable energy and energy efficiency are at the nexus of the goals of the World Bank Group’s energy work: poverty alleviation, energy security, and climate change mitigation. Oil and gas price rises, the instability of energy markets, the major impacts of climate change that the Intergovern-mental Panel on Climate Change and Sir Nicholas Stern’s reports convincingly articulated, and the need to meet the Millennium Development Goals by 2015 have given even greater urgency to enhanced support for clean energy.
To overcome these challenges and do so in a sustainable manner, the World Bank Group has com-mitted more than US$11 billion since 1990 for renewable energy and energy efficiency with commit-ments in fiscal 2007 rising to US$1.4 billion, or 40 percent of total energy sector lending. Every dollar of our funds has leveraged about two dollars of investment from the private sector, governments, and others. The progress we have achieved establishes the base of experience for implementing the Clean Energy Investment Framework (CEIF). The CEIF was launched in 2006 to give greater impe-tus to addressing the challenge of energy access for growth and the causes and impacts of climate change. Renewable energy and energy efficiency will also be central to the World Bank Group’s Climate Change Strategy that will be issued shortly.
Achieving the goals of the CEIF and the Climate Change Strategy demands actions on a number of fronts—policy, governance, capacity, and investment. The investment challenge remains paramount, and more so for renewable energy and energy efficiency, which are more capital intensive than other forms of energy. The World Bank Group, although one of the largest multilateral lenders for energy, is only one player in the field, and cannot possibly meet the investment needs alone. Our total fi-nancial commitment for the energy sector in the 2007 financial year was US$3.6 billion. Although we continue to grow our energy investments in absolute terms, we increasingly see our role as a catalyst in working with the private sector and others to leverage our resources. This is a vital mission if we are to help our partner countries in their transition to a low-carbon economy. The poor are, after all, the most vulnerable and the least able to adapt to the devastating impacts of climate change.
Previous renewable energy and energy efficiency progress reports focused on how the World Bank Group was meeting the commitment it made in June 2004 in Bonn, Germany, to increase our support for new renewable energy and energy efficiency by 20 percent per year; and defining the impact our support has had in improving lives. This report focuses on the efforts we are making to work in partnership with the private sector in order to leverage our resources. Accordingly, we are pleased that this report is jointly prepared by the International Finance Corporation and the World Bank.
Rachel Kyte, Director Jamal Saghir, Director International Finance Corporation Chair, Energy and Mining Sector Board The World Bank
Foreword

x
The report was prepared jointly by the Environment and Social Development Department of the International Finance Corporation (IFC), and the Energy, Transport and Water Department in the World Bank’s Sustainable Development Vice Presidency. The work was led by Alan Miller (IFC) and Anil Cabraal (World Bank).
Other principal contributors were Patrick Avato, Malcolm Cosgrove-Davies, Daryl Fields, Enno Heijndermans, Jeremy Levin, Natalie Magradze, Jessica Morey, Ashok Sarkar, Sunil de Silva, Rus-sell Sturm, and Chris Walsh.
Aldo Baietti, Francis Gagnon, Lucie Giraud, Debora Oliveira and Geoff Revell provided written contributions, background materials, or other support.
Photos are credited to: Africa Energy Unit (World Bank), Paul Baringanire, Anil Cabraal, Curt Car-nemark, the Comisión Federal de Electricidad, (Mexico), Ousmane Dione, Daryl Fields, Evan Mills, Zhang Minji, Yevgeny Pashin, D. Riffet / Médiathèque EDF, Lasse Ringius, Gennadiy Ratushenko, Trevor Samson, Dominic Sansoni, Adriana Valencia, and the World Bank Photo Library.
The portfolio analysis was conducted by Patrick Avato (World Bank) and Cecilia Lim (IFC), with support from Elif Kiratli. Production coordination was provided by Eileen Fredriksen. Rebecca Kary provided editing support, and Bob Reinecke was responsible for the typesetting.
The report was prepared under the overall guidance of Rachel Kyte and Jamal Saghir, and is issued under the auspices of the Energy and Mining Sector Board.
Cover: Jepirachi wind power project, Colombia (Adriana Valencia)
Please address questions or comments to Alan Miller ([email protected]) or Anil Cabraal ([email protected]).
Acknowledgments
xi
Evidence is mounting that developing countries will be disproportionately affected by the ad-verse impacts of climate change, putting at risk hard-earned development gains. Sir Nicholas Stern’s 2006 economic review of climate change estimated that “business as usual” emissions of greenhouse gases might lead to damages between 5 and 20 percent of gross domestic product (GDP) over the next 200 years. The poor are the most vulnerable and least able to adapt. At the same time, increasing energy supply and services are critical for economic growth for all developing countries. A consensus is growing that moderating and managing climate change is central to every aspect of poverty reduction, economic growth, and development.
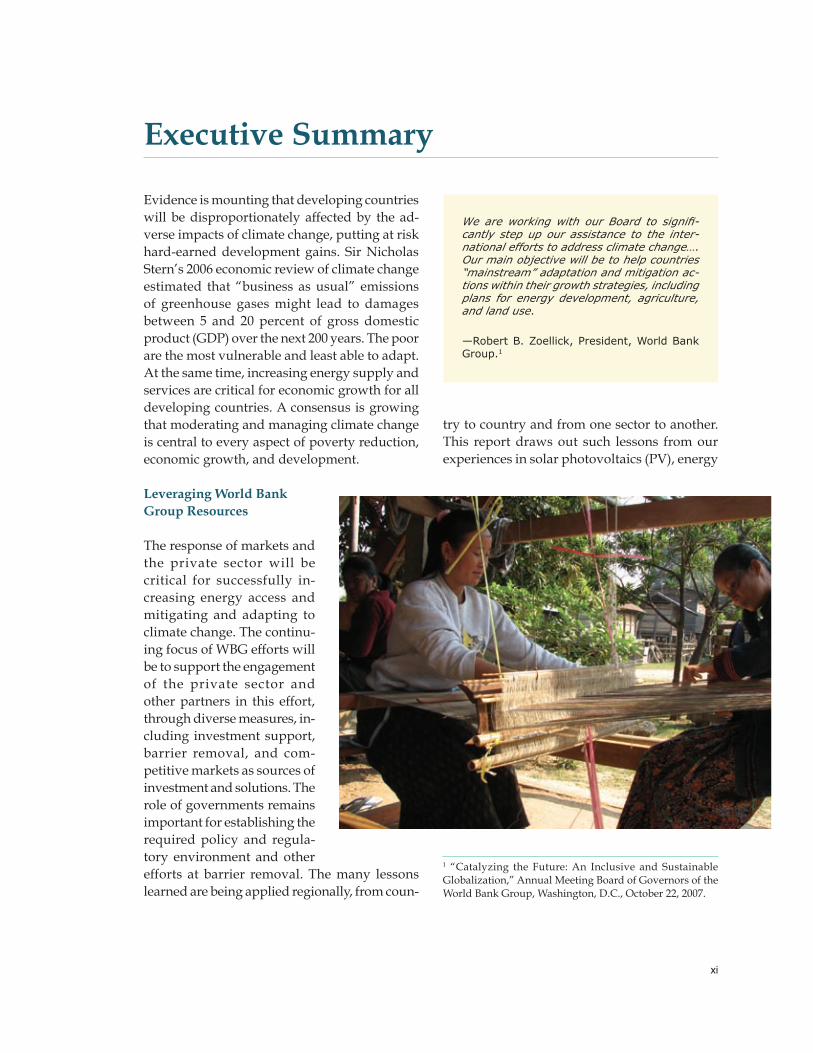
Leveraging World Bank Group Resources
The response of markets and the private sector will be critical for successfully in-creasing energy access and mitigating and adapting to climate change. The continu-ing focus of WBG efforts will be to support the engagement of the private sector and other partners in this effort, through diverse measures, in-cluding investment support, barrier removal, and com-petitive markets as sources of investment and solutions. The role of governments remains important for establishing the required policy and regula-tory environment and other efforts at barrier removal. The many lessons learned are being applied regionally, from coun-
Executive Summary
try to country and from one sector to another. This report draws out such lessons from our experiences in solar photovoltaics (PV), energy
We are working with our Board to signifi-cantly step up our assistance to the inter-national efforts to address climate change…. Our main objective will be to help countries “mainstream” adaptation and mitigation ac-tions within their growth strategies, including plans for energy development, agriculture, and land use.
—Robert B. Zoellick, President, World Bank Group.1
1 “Catalyzing the Future: An Inclusive and Sustainable Globalization,” Annual Meeting Board of Governors of the World Bank Group, Washington, D.C., October 22, 2007.

xii
efficiency, and hydropower. Among them are the following:
Improve the policy and regulatory environ-ment to reduce energy price distortions, mitigate regulatory risks, streamline ap-proval processes, and increase transparency in decision making.Adhere strictly to good environmental and social management principles and ensure that all parties—from consumers and af-fected communities, to energy suppliers and financiers—benefit. Embed sustainability principles in executing agencies.Although economic viability may be com-pelling, financial viability, as well as market and consumer confidence, are sine qua non for project success and scale-up. Pay heed to quality and meet consumer expectations in service and value.Increase access to pre-investment and invest-ment financing, and introduce risk manage-ment and credit enhancement instruments. Benefit from new instruments, such as those offered by the carbon markets.Introduce business models better suited to renewable energy and energy efficiency, including distributed generation. Be adapt-able and take advantage of innate capacities within each country.Build capacity and increase knowledge among the domestic financial sector, indus-try, utilities, engineering, policy makers, and consumers. Support South–South knowl-edge exchanges.Facilitate access to improved technologies and strengthen the capacity to plan, design, construct, and integrate such technologies into the energy supply sectors.
The WBG brings to bear a wide range of financial and nonfinancial instruments to support the development of renewable energy and energy efficiency. Among them are conventional lend-ing instruments; equity and quasi-equity; partial
•
•
•
•
•
•
•
risk guarantees; currency, commodity, and inter-est rate risk management; and carbon finance; as well as capacity building and policy, legal, and regulatory support.
World Bank Group Financial Support for Renewable Energy and Energy Efficiency
In fiscal 2007 (July 1, 2006, to June 30, 2007), total WBG financial com-mitments for renewable energy, including hydro-power of all sizes, and energy efficiency rose to US$1.4 billion (Table 1). This represents a 67 per-cent scale-up in financing for renewable energy 2
and energy efficiency from US$860 million in fis-cal 2006. The GEF has been an important partner, contributing US$128 million in co-financing for World Bank projects. The World Bank’s Carbon Finance Unit has been an important contribu-tor—its impact is even greater, since every dollar of carbon financing is estimated to leverage five to six dollars in investment funds. In fiscal 2007, the WBG supported 63 renewable energy and energy efficiency projects in 32 countries with more than half the financing going to Africa. Commitments for new renewable energy and energy efficiency were US$683 million, and US$751 million was committed for hydropower projects greater than 10 MW per facility. As shown in Figure 1, the cumulative WBG financial commitments to renewable energy and energy efficiency from fiscal 1990 to fiscal 2007 exceeded US$11 billion, with a nearly steady increase in commitments from 2002.
The World Bank (IBRD and IDA), in partner-ship with GEF, committed US$821 million for
2 New renewable energy comprises energy from solar, wind, biomass, and geothermal energy, as well as hydropower facilities with capacities up to 10 MW per facility.
World Bank Group funding for renewable energy—compris-ing wind, solar, biomass, geo-thermal, and hydropower—and energy efficiency projects rose by two-thirds in fiscal 2007 to US$1.43 billion.

xiii
Table 1: World Bank Group Commitments for Renewable Energy and Energy Efficiency in FY07
Source of funds New renewable energy Hydro > 10MW Energy efficiency Total
World Bank (IBRD/IDA) 70 430 49 549
GEF (World Bank) 121 0 7 128
World Bank (Carbon Finance) 68 66 10 144
IFC (own funds) 154 140 156 450
IFC (Carbon Finance) 7 0 0 7
MIGA 0 115 40 155
Total 421 751 262 1,433
Note: Some columns may not add up exactly because of rounding.Source: WBG databases.
renewable energy and energy efficiency proj-ects and activities. MIGA committed US$155 million in guarantees for clean energy–related investments, with significant expected leverage in additional private sector financing. The IFC made 25 investments totaling US$450 million in energy efficiency and renewable energy, such as biomass cogeneration systems, hydropower, wind, geothermal, solar PV manufacturing. The total value of the renewable energy and energy efficiency investments supported by the IFC ex-ceeded US$1.1 billion, of which US$763 million
came from com-mercial investors. Thus, every dollar of IFC lending was associated with US$2 of private sector investment.
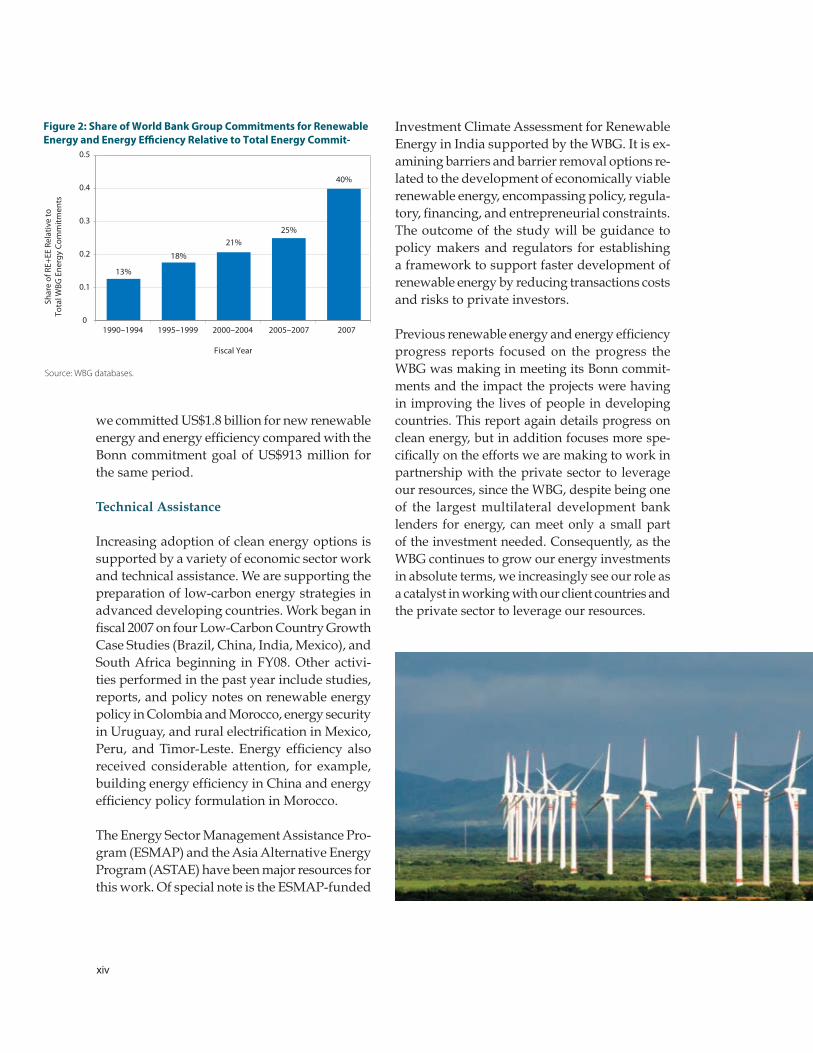
There has been a steady rise in the share of financing the WBG committed for low carbon renewable energy and energy efficiency since 1990 (Figure 2). In 1990–94 the share was about 13 percent of total energy sector commitments. The share of renewable energy and energy effi-ciency financing rose to 25 percent of total energy commitments in the three years, fiscal 2005–07, and 40 percent in FY 07.
At the Bonn International Conference on Re-newable Energies in June 2004, the WBG made a commitment to accelerate its support for new renewable energy and energy efficiency.The WBG committed to increasing our financial com-mitments for new renewable energy and energy efficiency at a growth rate of 20 percent per year between fiscal 2005 and 2009, compared with a baseline commitment of US$209 million (equal to the average of the previous three years). The WBG has exceeded its Bonn commitment by al-most 100 percent. From fiscal 2005 to fiscal 2007,
Figure 1: World Bank Group Commitments for Renewable Energy and Energy E�ciency, FY90–07
14,000
12,000
10,000
8,000
6,000
4,000
2,000200
1990
1991
1992
1993
1994
1995
1996
1997
1998
1999
2000
2001
2002
2003
2004
2005
2006
2007
400
600
800
1,000
1,200
1,600
1,400
Ann
ual U
S$ m
illio
ns
Cum
ulat
ive
US$
mill
ions
Energy e�ciencyNew renewable energyHydro > 10 MWCumulative commitment
Source: WBG databases.
In fiscal 2007 the share of renewable energy and energy efficiency financing reached 40 percent of total energy commitments.
xiv
we committed US$1.8 billion for new renewable energy and energy efficiency compared with the Bonn commitment goal of US$913 million for the same period.
Technical Assistance
Increasing adoption of clean energy options is supported by a variety of economic sector work and technical assistance. We are supporting the preparation of low-carbon energy strategies in advanced developing countries. Work began in fiscal 2007 on four Low-Carbon Country Growth Case Studies (Brazil, China, India, Mexico), and South Africa beginning in FY08. Other activi-ties performed in the past year include studies, reports, and policy notes on renewable energy policy in Colombia and Morocco, energy security in Uruguay, and rural electrification in Mexico, Peru, and Timor-Leste. Energy efficiency also received considerable attention, for example, building energy efficiency in China and energy efficiency policy formulation in Morocco.
The Energy Sector Management Assistance Pro-gram (ESMAP) and the Asia Alternative Energy Program (ASTAE) have been major resources for this work. Of special note is the ESMAP-funded
Investment Climate Assessment for Renewable Energy in India supported by the WBG. It is ex-amining barriers and barrier removal options re-lated to the development of economically viable renewable energy, encompassing policy, regula-tory, financing, and entrepreneurial constraints. The outcome of the study will be guidance to policy makers and regulators for establishing a framework to support faster development of renewable energy by reducing transactions costs and risks to private investors.
Previous renewable energy and energy efficiency progress reports focused on the progress the WBG was making in meeting its Bonn commit-ments and the impact the projects were having in improving the lives of people in developing countries. This report again details progress on clean energy, but in addition focuses more spe-cifically on the efforts we are making to work in partnership with the private sector to leverage our resources, since the WBG, despite being one of the largest multilateral development bank lenders for energy, can meet only a small part of the investment needed. Consequently, as the WBG continues to grow our energy investments in absolute terms, we increasingly see our role as a catalyst in working with our client countries and the private sector to leverage our resources.
Figure 2: Share of World Bank Group Commitments for Renewable Energy and Energy E�ciency Relative to Total Energy Commit-
01990–1994
13%
1995–1999
18%
2000–2004
21%
2005–2007
25%
2007
40%
0.1
0.2
0.3
0.4
0.5
Source: WBG databases.
Shar
e of
RE+
EE R
elat
ive
to
Tota
l WBG
Ene
rgy
Com
mitm
ents
Fiscal Year

�
Introduction
Presently, renewable energy’s contribution to global primary energy is only 13 percent of the total, with traditional biomass and large hydro-power contributing the largest share. The share of new renewable energy is tiny at about 0.5 percent of global primary energy use.3 Energy efficiency opportunities are hardly tapped. Nevertheless, with high oil prices, energy supply uncertainties, and climate change concerns, there is a greater appreciation of the role that renewable energy and energy efficiency can play in increasing sup-ply and moderating demand, and in helping to move toward a low-carbon economy.
There is also recognition that multilateral finan-cial resources and government resources are inadequate to meet the investment needs. There-fore, the large amounts of financing needed for transitioning to a low-carbon economy will only be available through the efficient mobilization
of private capital. From the point of view of private investors, mobilizing private capital for renewable energy and energy efficiency in developing countries will require obtaining risk-adjusted returns from such investments comparable with returns from more traditional energy alternatives.
Renewable energy and energy efficiency scale-up demands concerted action on a number of fronts—policy, legal, regulatory, technical, financial, and risk mitigation. The three WBG agencies—the World Bank, IFC, and MIGA—bring to bear their individual strengths to offer a menu of services to their member countries. A few examples illustrate this unique capability (Box 1).
3 International Energy Agency, “Renewables in Global En-ergy Supply,” Paris, January 2007.
�
Box 1: Applying WBG Instruments for Renewable Energy and Energy Efficiency Scale-Up
Meeting a national renewable energy goal in China. China committed itself to raising its share of renew-able energy to 15 percent of total electricity generation by 2020 as a substitute for coal-fired power generation and for uplifting regions where economic development lags. To support this commitment, the Government of China promulgated its landmark Renewable Energy Law. The World Bank supported this effort first with technical assistance and then with IBRD and GEF financing, and approved the Renewable Energy Scale-Up Project. Financing for the first phase is US$174 million from IBRD and US$40 million from GEF. In parallel, an IFC loan of up to US$22 million to Zhongda Sanchuan, a local hydropower development company based in Zhejiang, supports three run-of-river hydropower stations along the White Water River in Yunnan Province. The World Bank Carbon Finance Unit is purchasing carbon offsets from a 100 MW wind farm in Huitingxile, Inner Mongolia.
Building markets for renewable energy in South Africa. The Renewable Energy Market Transformation Project supported by the Bank will help establish policy and regulatory frameworks and build insti-tutional capacity for renewable energy development. The US$17 million is funded by a US$6 million grant from GEF, US$2.3 million contribution from the South African government, and US$9 million leveraged from the private sector. The project’s four-year objective is to assist the government meet its target of supplying 4 percent of electricity with renewable energy by 2013.
Leveraging private finance for energy efficiency by IFC. Over more than a decade, IFC has developed and refined a highly successful approach to leveraging commercial lending for energy efficiency in-vestments through training and risk mitigation instruments provided to local financial institutions in emerging markets. The IFC model started in Hungary with a US$5 million grant from the GEF that was expanded with additional GEF support to cover several countries in Central Europe, and subsequently was adapted to projects in China, Russia, and a new facility in development in the Philippines.
Creating the foundation for a global wind industry in India. The WBG support for new renewable en-ergy began in 1994 when the Government of India set policy targets and offered financial incentives to stimulate new renewable energy development. These have had the desired effect of producing a large and vibrant market for wind energy and small hydropower, among others. Today India is the third largest wind market globally. It has a strong domestic wind turbine manufacturing industry that is expanding internationally. In 2007 the IFC made a corporate loan of up to US$33 million to MSPL Limited, one of India’s largest iron ore manufacturers to help them construct two new wind farms in Maharashtra State to increase their installed capacity from 111 MW to about 150 MW. This financing also illustrates the growing global trend toward investment in wind and other renewable energy projects by industrial companies from outside the energy sector—a trend that India set in the early 1990s.
Geothermal industry privatization in the Philippines. The IFC made a US$50 million equity investment in the Philippines National Oil Company’s Energy Development Corporation (PNOC-EDC) as part of the state-owned enterprise’s initial public offering (IPO) on the Philippines Stock Exchange. The investment supported the Philippine government’s goal of privatizing energy sector assets and expanding the geothermal energy sector. It is expected that with the success of the IPO and competitive selection of a new private sector majority shareholder, PNOC-EDC can both expand its development of local renewable energy projects and become a global player in the development of geothermal resources. This project used a new instrument that was developed jointly by the World Bank and IFC—Subnational Finance—to support well-run subnational entities, such as local governments and public economic enterprises, in their financing programs without the need for national government guarantees.
Carbon finance for leveraging investments. The World Bank was a pioneer in establishing the carbon market beginning with the Prototype Carbon Fund. Today, the World Bank manages ten carbon funds and facilities which are public-private partnerships bringing together ten governments and 65 private sector firms from industrialized countries. They have entrusted the World Bank to manage more than US$2billion in funds for the purchase of carbon emissions reductions in developing and transition economies.

�
Given the scale of investments needed to in-crease or improve access to energy in developing countries, there is an urgency to move beyond traditional investment vehicles to leverage pri-vate investment. The WBG is employing its full range of financial and nonfinancial instruments to overcome the hurdles to private investment in developing countries. Among them are proj-ect risks, subsidies for fossil fuels, unfavorable utility regulatory policies, and other factors that increase the perceived risks. The result of these barriers is reduced availability and higher costs for financing, particularly when dealing with new technologies or those not widely used in a particular region. Even when financial markets are well developed within a country, financing large infrastructure projects may be difficult without some additional support—again par-
ticularly if new technology is involved. Smaller, widely dispersed opportunities (such as im-provements in the energy efficiency of buildings) are also typically difficult to finance because of relatively high transaction costs. There is also a higher risk perception because of the lack of awareness and experience among investors and financiers. An integrated approach combining country support, technological support, and creative financing is therefore most likely to be effective.
This report examines how the WBG has sup-ported renewable energy and energy efficiency to respond to calls for urgent action on clean energy, improve energy security, and increase access to energy for development. The WBG’s renewable energy and energy efficiency progress

�
4 In June 2004, at the Bonn International Conference on Renewable Energies, the World Bank Group committed to scaling up its renewable energy and energy efficiency financial assistance by an average of 20 percent per year over five years (FY05–09) and to reporting on its annual performance in supporting renewable energy and energy efficiency (the “Bonn target”).5 World Bank Sustainable Development Network, “Clean Energy for Development Investment Framework: Progress Report on the World Bank Group Action Plan.” Report to the Development Committee, World Bank, Washington, D.C., September 27, 2007.
in fiscal 2007, including our response to the com-mitment made in Bonn, Germany, in June 2004, is described in Chapter 5.4
The previous report focused on the development outcomes and the positive changes that can be made in peoples’ lives through the effective use of renewable energy and energy efficiency technologies. The fiscal 2004 and fiscal 2005 reports informed the readers of the specifics of each WBG institution’s support for renewable energy and energy efficiency.
This report highlights the role of the WBG in le-veraging and mobilizing private investment for renewable energy and energy efficiency. It draws lessons from projects that the WBG supports and discusses how a range of financial instruments at our disposal is used to leverage private capital. To this end, the report discusses three areas of applications—hydropower, energy efficiency, and solar PV. Case studies throughout the report illustrate different models used to partner with the private sector to support renewable energy and energy efficiency development.
The private sector response has been positive, and the outcomes encouraging. The results have
established the basis for an enduring partner-ship to support the dual goals of development and climate protection. Looking forward, the emphasis on renewable energy and energy efficiency development within the WBG will continue as we operationalize the Clean Energy Investment Framework (CEIF).5 The World Bank Group launched the CEIF in 2006 to address cli-mate change not only as a risk to development, but also as an opportunity for Bank clients to accelerate their economic transformation and take advantage of new technologies. Renewable energy and energy efficiency will contribute significantly to this enhanced strategy.

�
Selling Solar: Lessons from a Decade of IFC and World Bank Experience
Together the World Bank and the IFC constitute a major financier of PV in developing countries with projects valued at more than US$600 mil-lion that serve about 1.3 million households and other facilities in about 30 countries in Africa, Asia, and Latin America (see Table 2). They range from support for the installation of 400,000 PV systems in China, and financing solar light-ing for teachers in remote areas of Papua New Guinea, to the provision of lighting and basic electricity services for rural Ethiopians to a grid-connected 1 MW PV system in the Philippines that demonstrates the value of conjunctive use of PV and hydropower. The chapter highlights lessons emerging from WBG experiences in sup-porting PV for development.
World Bank Group Solar Photovoltaics Projects
With its mandate to further economic develop-ment through the private sector, the IFC had its first involvement with investing in PV markets in 1989 when it made a US$3 million investment (debt and equity) in Shenzhen YK Solar PV En-ergy Co., Ltd., a solar PV manufacturer in China. Although the investment, made using regular IFC funds, did not meet its original expectations, it established an important precedent for invest-ing in solar PV businesses in frontier markets by not only demonstrating confidence in viability of the PV technology, but also by focusing on com-mercializing the deployment of this technology in the developing world.
In the mid-1990s, the World Bank began support-ing PV systems (or solar home systems, SHSs), as a least-cost alternative to grid extension for governments to deliver on promises of energy
for development. The high priority accorded to rural electrification, the large numbers of unelec-trified households, and the availability of financ-ing through public programs also appeared to be potentially well suited to introducing PV for off-grid electrification on a large scale. World Bank experience is encouraging, with about 0.65 million installations completed out of its 1.2 million portfolio in 23 countries.
To date, the IFC has managed five GEF-funded solar PV initiatives: IFC/GEF Small and Me-dium Scale Enterprise Program (SME Program), Photovoltaic Market Transformation Initiative (PVMTI), Solar Development Group (SDG), Re-newable Energy and Energy Efficiency Fund, and

�
Table 2: World Bank Group Solar PV Initiatives
Target number Solar PV Total cost Country Project of systems capacity (kWp) (US$ million)
Argentina Renewable Energy in the Rural Market 30,000 2,843 36.0
Bangladesh Rural Electrification & Renewable 198,000 9,900 91.4 Energy Development
Bolivia Decentralized Energy, ICT for Rural Transformation 60,000 2,600 38.6
Burkina Faso Energy Access Project 2,100 100 2.0
Cambodia Rural Electrification and Transmission 10,000 400 4.0
Cape Verde Energy and Water Project 4,500 129 2.5
China Renewable Energy Development 400,000 10,000 144.9
Ethiopia Energy Access 6,300 407 5.4
India Renewable Resources Development 45,000 2,500 24.0
Indonesia Solar Home Systems 8,500 425 3.8
Lao PDR Southern Provinces Rural Electrification, and 13,000 460 4.3 Rural Electrification Projects
Mali Household Energy and Universal Access Project 10,000 350 3.5
Mexico Renewable Energy for Agriculture, and Rural Electrification (FY08) 8,345 1,767 27.6
Mongolia Renewable Energy and Rural Access 50,000 520 5.2
Mozambique Energy Reform and Access, and PV for Schools and Health Clinics 9,800 1,096 13.5
Nicaragua Off-grid Electrification for Rural Development 6,000 215 3.0
Pacific Islands Regional Sustainable Energy Finance 21,000 630 16.5
Papua New Guinea Teachers Solar Lighting 2,500 100 2.2
Philippines Rural Power and IFC 1 MW grid-tied project 135,000 10,000 120.0
Sri Lanka Energy Services Delivery, Renewable Energy for 180,000 7,200 62.3 Rural Economic Development (RERED), and RERED Additional Financing
Tanzania Energy Development and Access (FY08) 11,800 800 20.0
Uganda Energy for Rural Transformation 8,300 600 18.8
Zambia Increased Access to Energy (FY08) 8,300 415 11.0
Multiple countries IFC-financed financing facilities 100,000+ 8146 25.3
Totals 1.33 61.62 US$686 million MW million
* Includes projects of the SME Program in Bangladesh, Dominican Republic, Honduras, Tunisia, and Vietnam, and PVMTI in India, Kenya, and Morocco.Source: Anil Cabraal, 21st European Solar Photovoltaics and Solar Energy Conference, Dresden, Germany, September 2006 (with data updated, November 2, 2007).
�
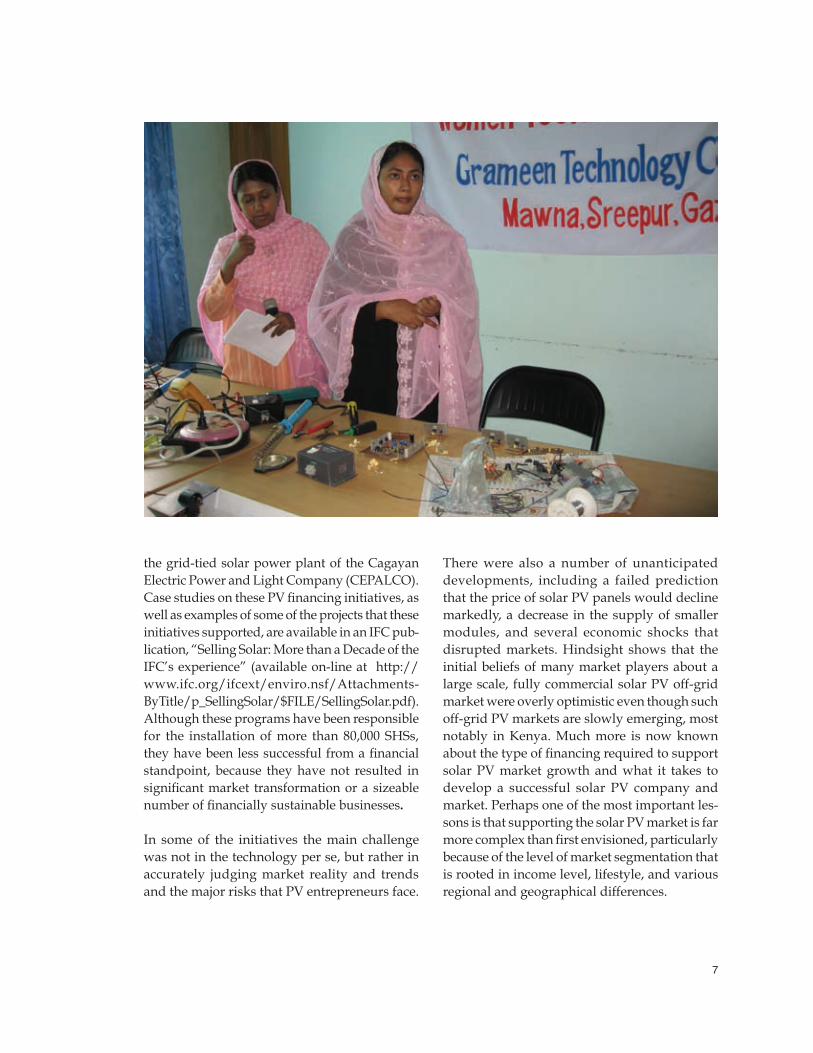
the grid-tied solar power plant of the Cagayan Electric Power and Light Company (CEPALCO). Case studies on these PV financing initiatives, as well as examples of some of the projects that these initiatives supported, are available in an IFC pub-lication, “Selling Solar: More than a Decade of the IFC’s experience” (available on-line at http://www.ifc.org/ifcext/enviro.nsf/Attachments-ByTitle/p_SellingSolar/$FILE/SellingSolar.pdf). Although these programs have been responsible for the installation of more than 80,000 SHSs, they have been less successful from a financial standpoint, because they have not resulted in significant market transformation or a sizeable number of financially sustainable businesses.
In some of the initiatives the main challenge was not in the technology per se, but rather in accurately judging market reality and trends and the major risks that PV entrepreneurs face.
There were also a number of unanticipated developments, including a failed prediction that the price of solar PV panels would decline markedly, a decrease in the supply of smaller modules, and several economic shocks that disrupted markets. Hindsight shows that the initial beliefs of many market players about a large scale, fully commercial solar PV off-grid market were overly optimistic even though such off-grid PV markets are slowly emerging, most notably in Kenya. Much more is now known about the type of financing required to support solar PV market growth and what it takes to develop a successful solar PV company and market. Perhaps one of the most important les-sons is that supporting the solar PV market is far more complex than first envisioned, particularly because of the level of market segmentation that is rooted in income level, lifestyle, and various regional and geographical differences.

�
Key Lessons of Experience
Lesson 1: Project designs must remain flexible and adaptable to address issues of affordabil-ity, risks and other market constraints.
Affordability varies among market segments (such as relative income levels or market ap-plications), and it remains a challenge for PV companies to sell to the niche market segments even where PV is the least-cost energy alterna-tive for the consumer. High first costs, lack of financing, limited awareness are among the constraints faced. Project designs must therefore be able to quickly adapt to market conditions so that responsive solutions are created to address barriers. Four such examples are projects sup-ported by the World Bank and GEF:
Bangladesh Renewable Energy for Rural Electrification project where 8,000 solar
•
home systems are being installed monthly.The Off-Grid Rural Electrification Project in Nicaragua brings electricity services to households, public centers, and productive uses by facilitating access to microfinancing and strengthening the institutional capacity to implement a national rural electrification strategy.Papua New Guinea Teachers Solar Lighting Project where financing for solar lighting systems for teachers posted in remote areas is provided through the Teachers Savings and Loan Society.The Sustainable Solar Market approach first introduced in the Philippines under the World Bank and GEF-assisted Rural Power Project and now being considered in Tanza-nia and Zambia (see Box 2).
In these and other solar projects, it was impera-tive during implementation to adapt to chang-ing market needs, such as by extending the eligibility of PV system sizes to smaller, more affordable systems, such as solar lanterns, or by introducing loan guarantee facilities or capacity building support to entrepreneurs and microfi-nance institutions.
Lesson 2: PV must be considered as one of sev-eral options for rural electricity provision.
All consumers prefer access to unlimited sup-plies of electricity at low prices. As grid-based rural electrification is often a highly valued political tool, significant government resources are employed in grid extension, even when it is a drain on government budgets and where economic justification is weak. As a result of these subsidies the cost of grid electricity to the end user is significantly less than alternative options.
However, there is now an increasing apprecia-tion by governments and rural electrification au-thorities that PV is an economic least cost option
•
•
•
Box 2: Sustainable Solar Market Packages
The Sustainable Solar Market Package (SSMP) is a contracting mechanism that provides for the supply and installation of PV sys-tems along with a maintenance and repair contracts (five years with option to extend) to schools, clinics, and other community fa-cilities in a defined rural area, bundled with requirements and incentives for commercial sales to households, businesses, and other nongovernmental customers in the same area. By bundling institutional, community, and household applications in a particular area, the SSMP approach addresses some of the important affordability and sustainability issues of the past PV projects: standardiza-tion, reduced transactions costs, and larger business volume, and reduced risks. In the Philippines, 7 SSMP contracts to benefit 76 villages are under implementation with more SSMP packages under preparation to benefit 572 villages. In Tanzania and in Zambia, un-der World Bank projects that will be approved in FY08, about 10 SSMP packages are planned to be implemented in each country.

�
for rural electricity provision, especially where the alternatives are small generators, batteries or kerosene lighting. With oil prices exceeding US$90 per barrel, and kerosene subsidies becom-ing untenable, PV’s attractiveness is increasing. The Philippines, for example, has a formal rural electrification planning process that demarcates villages where grid extension is not viable.
Where solar PV is least cost, market and will-ingness to pay studies must be conducted to confirm that consumers will indeed demand these systems before PV financing programs are established. Subsidies to buy down first costs, access to financing through rural banks or microfinance organizations may be necessary to enhance affordability.
Lesson 3: Private equity is not the most appro-priate financial mechanism for investing in PV businesses in developing countries.
An important lesson for the IFC was that, while private equity and venture capital firms are heavily involved in the manufacturing of PV for developed country markets (Box 3), the risks and economics of PV in the developing world mean that the returns that such investors typically seek
are less than they could obtain in other ventures. Nevertheless, China is an exception, where PV dealers depend primarily on private equity to finance their businesses. As experiences from China, India, the Philippines, and several other countries show, there are profitable opportuni-ties for entrepreneurs in developing countries to supply PV modules to developed-country markets that are highly subsidized.6
Lesson 4: Good government relations and sup-port are strong success factors
Although there are examples of companies able to establish successful PV rural electricity ventures without government support, those companies fortunate enough to operate with such support (or with some form of subsidy or market aggregation support) tended to be more successful than companies operating without explicit government support. Given the value of mobilizing private enterprises to extend PV electricity services as an economic alternative to grid extension, public-private partnerships for risk sharing or to buy down the first cost of PV systems can be effective. Such commercial retail market opportunities do exist in develop-ing countries, as experiences in China, India, Kenya, and Sri Lanka, among others, have demonstrated.
Lesson 5: Quality must not be compromised
The most expensive form of electricity is a power supply that is not working. Quality of systems and ability to obtain spare parts and repair ser-vices must be an integral part of any PV electric-ity program. The World Bank was a pioneer in introducing quality requirements enforcement beginning with a project in Indonesia. All World
Box 3: Moving Up the Value Chain—Moser Baer in India
Moser Baer India Ltd. (MBIL) is the third-larg-est manufacturer of recordable optical storage media products (CDs and DVDs) in the world. MBIL is also an existing IFC client. Currently, MBIL is undertaking a two-year diversification program that involves setting up an export-oriented solar PV cell and module manufactur-ing facility with an installed annual production capacity of 80 MW in Greater Noida, India. The IFC has recently approved a US$22.5 million long-term loan to the company to sup-port a total investment of US$92 million. The project has the potential to avoid 80,000 tons of CO2 emissions annually and will contribute to the creation of about 600 new jobs.
6 See the report, “Renewable Energy Network for the 21st Century,” on power generation policies at http://gsr.ren21.net/index.php?title=Power_Generation_Promotion_Poli-cies.
�0
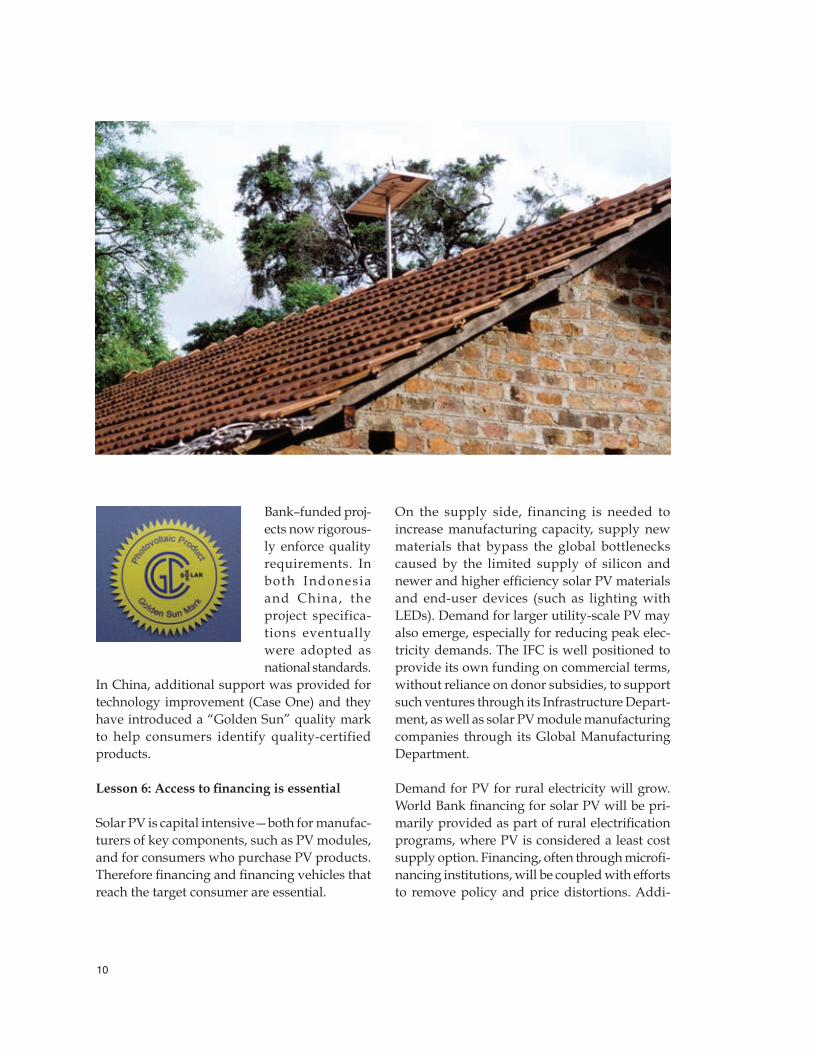
Bank–funded proj-ects now rigorous-ly enforce quality requirements. In both Indonesia and China, the project specifica-tions eventually were adopted as national standards.
In China, additional support was provided for technology improvement (Case One) and they have introduced a “Golden Sun” quality mark to help consumers identify quality-certified products.
Lesson 6: Access to financing is essential
Solar PV is capital intensive—both for manufac-turers of key components, such as PV modules, and for consumers who purchase PV products. Therefore financing and financing vehicles that reach the target consumer are essential.
On the supply side, financing is needed to increase manufacturing capacity, supply new materials that bypass the global bottlenecks caused by the limited supply of silicon and newer and higher efficiency solar PV materials and end-user devices (such as lighting with LEDs). Demand for larger utility-scale PV may also emerge, especially for reducing peak elec-tricity demands. The IFC is well positioned to provide its own funding on commercial terms, without reliance on donor subsidies, to support such ventures through its Infrastructure Depart-ment, as well as solar PV module manufacturing companies through its Global Manufacturing Department.
Demand for PV for rural electricity will grow. World Bank financing for solar PV will be pri-marily provided as part of rural electrification programs, where PV is considered a least cost supply option. Financing, often through microfi-nancing institutions, will be coupled with efforts to remove policy and price distortions. Addi-

��
tional support will be provided to strengthen the capacity of governments, the private sector, nongovernmental organizations (NGOs), and financial intermediaries.
IFC support for PV for rural electricity will continue. Instead of solar PV–focused initia-tives, such as the SDG and PVMTI, the IFC will employ financial vehicles open to a wider range of clean energy opportunities, such as the Envi-ronmental Business Finance Program and the Sustainable Energy Facility. Important features are a more streamlined approval process and emphasis on debt instruments over equity, with convertibility features to take advantage of any potential upside.
Future Support for Photovoltaics
Having extensively evaluated not just its own experience, but also the experience of several important players in the solar PV business, the WBG remains cautiously optimistic that it is
not a question of “if,” but ”when,” the goal of a self-sustaining solar PV market in developing countries will be reached. We also recognize that PV is but one rural electricity option and therefore should be offered as one option on a menu of options to meet rural electricity service goals. Moreover, we recognize that electricity is merely an intermediate product and that it is the services rendered by electricity that matters for operating motors, lighting, refrigeration, communications, and so forth. To this end, the World Bank and IFC have embarked on a joint project, Lighting Africa (Case Two). It will catalyze local and international lighting-related companies into offering the unelectrified popu-lation greater access to modern and affordable off-grid lighting products while displacing fuel-based lighting products, such as kerosene lamps or candles, for which developing-country consumers spend about US$40 billion annually. PV technology is expected to be a principal source of power for such off-grid lighting ap-plications.

��
Case One
stimulating sOlar teChnOlOgy imprOvement in China
China, along with the World Bank and GEF, launched the China Renewable Energy Develop-ment Project (REDP) in December 2001. Since then, the Photovoltaic Market Development and Technol-ogy Improvement Components of this project have achieved impressive results. By June 2007 it had supported the installation of 374,000 PV systems with a total PV module capacity of about 9 MW, benefiting more than 2 million people in the north-western provinces. More than 30 companies have established dealerships throughout these provinc-es, which provide PV components and systems that meet the project’s quality standards.
The Technology Improvement Component offered Chinese PV companies assistance in research, development, demonstration, and innovation. It has helped improve the quality of PV components and systems through a number of means including cost-shared research and development, national standards setting and enforcement, strengthening testing and quality monitoring.
The REDP introduced two innovations: a Competi-tive Grant (CG) Facility and a Quick Response (QR) Facility that specifically addressed the problem of low-quality PV components and systems found in the Chinese market before the REDP. The design of these facilities was based on the successful Nether-lands Research Program PV (NOZ-PV) from 1997 to 2001.
The CG and QR facilities received about 200 propos-als seeking US$3.3 million. These funds leveraged US$8.3 million from the proponents. The supported projects have had direct impact on the market by rapidly introducing into the Chinese and inter-national markets high-quality and innovative PV products. Results from two of the beneficiaries are outlined below.

��
Beijing Sunpu developed a new Solar Home System “plug and play” unit built of durable plastic. The plastic casing gives the PV system an attrac-tive appearance and provides room for including a radio, VCD or DVD player, and speakers. Two casing sizes have been developed—one for small systems (10–30 Wp) and one for larger systems (30–60 Wp). The total project cost was Y 572,000 (US$77,000), with a CG Facility grant of Y 150,000 (US$20,000).
Ningbo Solar Electric Power Company devel-oped a new silver paste for its PV cell production process using CG funding. The increased perfor-mance permitted the company to increase the rating of their large PV modules from 160 to 170 Wp at a lower unit cost. The total project cost was Y 844,000 (US$114,000), and the CG Facility grant was Y 250,000 (US$34,000), which amounted to 30 percent of the project cost.
The technology improvement approach has been replicated under the World Bank/GEF–assisted China Renewable Energy Scale-Up Program (CRESP) where a CG Facility is used to facilitate technol-ogy transfer of wind turbine technology to China, improve the technology of biomass energy equip-ment manufactured in China, and demonstrate innovative renewable energy technologies.
The Grant from REDP can be regarded as the fire in snowing winter. Our company sold the PV integrated system with a metal case in the domestic market. The shape of the metal case was often distorted because of the pressure it was under during transportation. And it always led to a refund.
Under the support of TI component of REDP, our company developed a plastic case for the PV integrated system. It solved the problem mentioned above, won the satisfaction of the dealer and user, and doubled our sales. At the same time, we improved the outward appearance and the coherence of the system. The improved system also sold abroad, for example, in Southeast Asia.
So, we will say thanks to the Project Man-agement Office of the REDP, wish REDP will continue in China.
—Mr. Mingshan Xiao, Chief Marketing Officer, Sanpu
The companies surveyed have also reported that they invested about US$75 million equivalent in 2004 and 2005 in their companies and manufactur-ing facilities to produce these new and improved technologies.
��
Case twO
lighting afriCa: Catalyzing markets fOr mOdern lighting
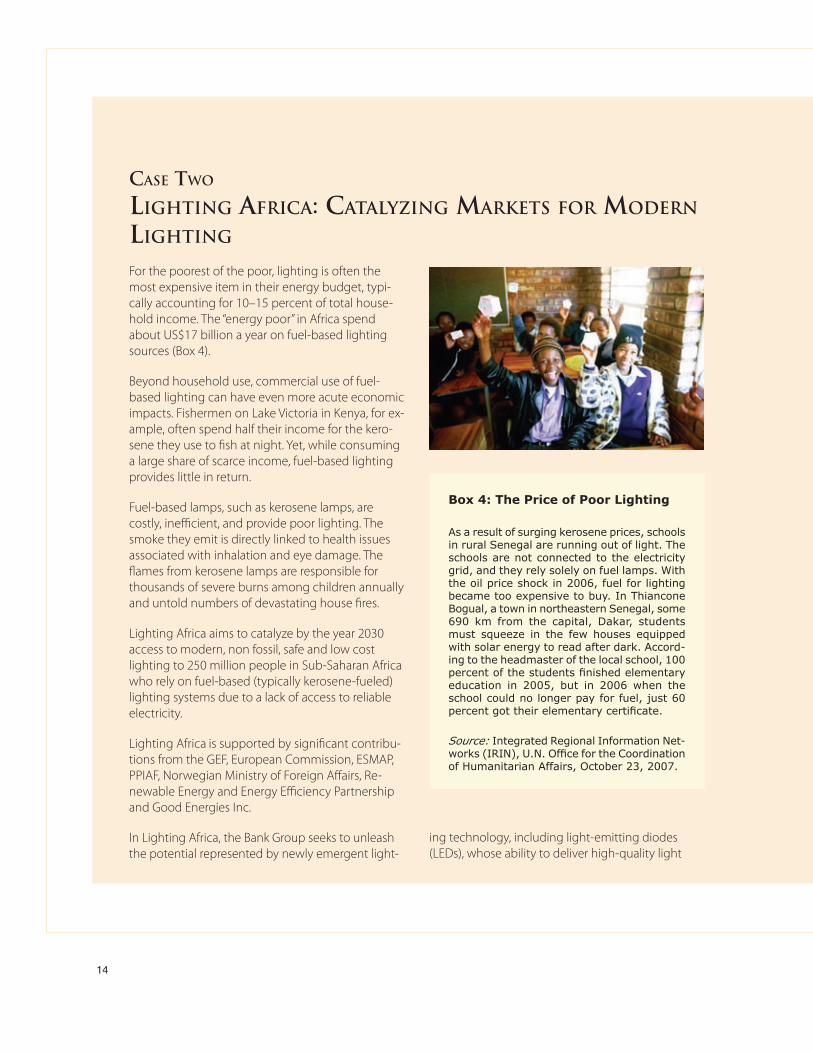
For the poorest of the poor, lighting is often the most expensive item in their energy budget, typi-cally accounting for 10–15 percent of total house-hold income. The “energy poor” in Africa spend about US$17 billion a year on fuel-based lighting sources (Box 4).
Beyond household use, commercial use of fuel-based lighting can have even more acute economic impacts. Fishermen on Lake Victoria in Kenya, for ex-ample, often spend half their income for the kero-sene they use to fish at night. Yet, while consuming a large share of scarce income, fuel-based lighting provides little in return.
Fuel-based lamps, such as kerosene lamps, are costly, inefficient, and provide poor lighting. The smoke they emit is directly linked to health issues associated with inhalation and eye damage. The flames from kerosene lamps are responsible for thousands of severe burns among children annually and untold numbers of devastating house fires.
Lighting Africa aims to catalyze by the year 2030 access to modern, non fossil, safe and low cost lighting to 250 million people in Sub-Saharan Africa who rely on fuel-based (typically kerosene-fueled) lighting systems due to a lack of access to reliable electricity.
Lighting Africa is supported by significant contribu-tions from the GEF, European Commission, ESMAP, PPIAF, Norwegian Ministry of Foreign Affairs, Re-newable Energy and Energy Efficiency Partnership and Good Energies Inc.
In Lighting Africa, the Bank Group seeks to unleash the potential represented by newly emergent light-
Box 4: The Price of Poor Lighting
As a result of surging kerosene prices, schools in rural Senegal are running out of light. The schools are not connected to the electricity grid, and they rely solely on fuel lamps. With the oil price shock in 2006, fuel for lighting became too expensive to buy. In Thiancone Bogual, a town in northeastern Senegal, some 690 km from the capital, Dakar, students must squeeze in the few houses equipped with solar energy to read after dark. Accord-ing to the headmaster of the local school, 100 percent of the students finished elementary education in 2005, but in 2006 when the school could no longer pay for fuel, just 60 percent got their elementary certificate.
Source: Integrated Regional Information Net-works (IRIN), U.N. Office for the Coordination of Humanitarian Affairs, October 23, 2007.
ing technology, including light-emitting diodes (LEDs), whose ability to deliver high-quality light
��
with very low levels of electricity input offers an alternative to fuel-based lighting using a variety of renewable sources of electricity where the electric grid is unavailable. Because of the energy efficiency and low power requirements of these lights, self-generated packaged lighting systems that include a solar cell or mechanical hand crank, for example, can be priced at an affordable level—and marketed on self-sustaining commercial terms. Thus, Light-ing Africa is not a give-away program, but rather undertakes a number of market-catalyzing actions to do what the industry cannot efficiently do itself in aggregating market demand, capturing market in-formation, catalyzing consumer and supplier financ-ing, and ensuring product quality in the market.
The initiative will facilitate the transition to modern lighting services in the following ways:
Catalyzing the private sector, including strengthening ties between the interna-tional lighting industry and local suppliers and service providers to profitably manufacture, market, and distribute significantly lower cost products.
•
Facilitating consumer access to a range of affordable, reliable, and high-quality light-ing products and services—for example, by providing consumer education services and consumer finance, and by executing a product quality assurance program.
Improving market conditions for the scale-up of modern lighting products by reducing existing technical, financial, policy, information, and institutional barriers. This includes the development of methods for obtaining CDM credits for distributed lighting.
Mobilizing the international communi-ty—governments, private sector, international organizations and NGOs—to aggressively promote the use of modern lighting services for the poor in Africa.
See http://www.lightingafrica.org for more informa-tion.
•
•
•
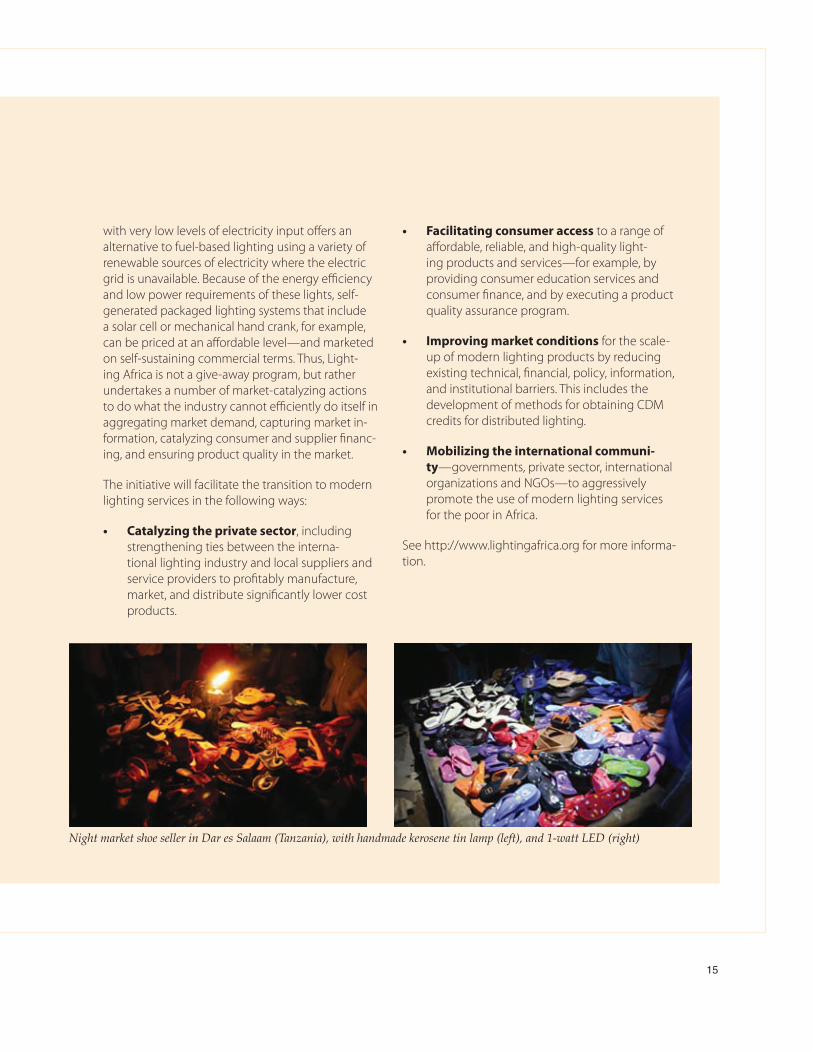
Night market shoe seller in Dar es Salaam (Tanzania), with handmade kerosene tin lamp (left), and 1-watt LED (right)


��
Expanding Energy Efficiency Interventions
It is possible to improve energy efficiency in many ways. The production, distribution, and use of energy all offer opportunities. Buildings can be in-sulated better, industries can upgrade equipment, and inefficient power plants can be rehabilitated or replaced with more efficient ones. These op-portunities can be captured in every sector of the economy, but despite cost savings, this does not happen readily because of a variety of barriers. It can be that the companies are not informed about the possibilities, that they lack the money and cannot obtain financing, that the laws in place are not favorable, that the projects are too small, or that the technology is not available or proven in a particular location. The solutions need to be as diverse as the problems, and they need to include modifying laws, improving technologies, setting the right prices, and opening markets. The World Bank Group has projects in each of these areas with the goal of transforming energy markets and bringing other sources of investment to cap-ture energy efficiency opportunities.
Opportunities and Benefits of Energy Efficiency
Every country and every sector of the economy have the potential for energy savings (see Table 3). The production of energy can be more efficient by improv-ing power plants and transmission systems.
The use of energy in buildings, industries, and transports can be reduced by 33 percent by 2050 according to the International Energy Agency.7
The lighting sector in developing countries has enormous potential for energy savings and im-proved quality. The demand for electric lighting is increasing twice as fast in developing countries (3.6 percent) as in industrial countries (1.8 per-cent). Developing countries are using more and more electricity, including for lighting. Whereas lighting is on the order of 5–15 percent of energy use for households in industrial countries, in the developing world it is typically much greater. Remarkably, poor households without access to electricity can pay as much for kerosene used in lanterns as their wealthier counterparts pay for
7 IEA, “Energy Technology Perspectives,” Paris, 2006.

��
Table 3: Energy Efficiency Opportunities in Important Consuming Sectors
Sector Energy efficiency improvement opportunities
Buildings Integrated building design, better insulation, advanced windows, energy-efficient lighting, space conditioning, water heating, and refrigeration technologies.
Industry Industrial processes, cogeneration, waste heat recovery, preheating, and efficient drives (motor, pump, compressors).
Cities and District heating systems, combined heat and power, efficient street lighting, efficient water municipalities supply, pumping, and sewage removal systems.
Agriculture Efficient irrigation pumping and efficient water use, such as drip irrigation.
Power supply New thermal power plants: Combined cycle, supercritical boilers, integrated gasification combined cycle (IGCC), and other advanced combustion technologies.
Existing generation facilities: Refurbishment and repowering (including hydropower), improved operation and maintenance practices, and better resource utilization (higher plant load factors and availability).
Reduced transmission and distribution losses: High-voltage lines, better-insulated conductors, capacitors, efficient and low-loss transformers, and improved metering systems and instrumentation.
Transport Efficient gasoline and diesel engines, urban mass transport systems, modal shifts to inter- and intracity rail and water transport, improved fleet usage, and compressed natural gas (CNG) vehicles.
Households Lighting, appliance efficiency, and improved cook stoves.
much higher-quality electric lighting. The quality and efficiency of lighting technologies adopted in the next twenty years will have significant impli-cations for the environment and development.
Energy efficiency reduces the demand for funds in developing countries by deferring the need for new power plants and fuel whose cost is rising. It also reduces costs of operation and maintenance, and can improve productivity. Companies increase their financial performance and countries become more competitive thanks to an efficient private sector. Less energy use also provides public benefits by reducing pollution and improving work conditions from better light and indoor air quality. When it comes to climate change, energy efficiency is the largest, least expensive, and fastest way to reduce its effects over the next decades (see Figure 3).
Barriers to Energy Efficiency Investments
Although the economics of energy efficiency measures are compelling and often underlie
the financial decisions that drive larger project designs, a focus on energy efficiency is rarely the primary rationale of an investment decision. More often, an industrial operator seeks to mod-ernize or expand its operations, or a commercial building operator seeks more reliable space conditioning equipment or more attractive and
Energy E�ciency: US$447 Million
Figure 3: Reductions in Greenhouse Gas Emissions by Consuming Sector through 2050
End-use e�ciency
Power generation
CCS in fuel transformation
CCS in industryFuel mix in building
sand industry
Bio fuels in transport
Source:IEA,“EnergyTechnologyPerspectives,”Paris,2006.
Coal to gas
Nuclear
Fossil fuel generatione�ciency
CCS
Hydropower
Biomass
Other renewables

��
functional lighting, and the associated energy efficiency cost savings provides the fi-nancial return necessary for the project to go ahead.
While projects with strong energy efficiency compo-nents are appealing finan-cially, cost-saving measures are rarely recognized as creditworthy by banks, and even less frequently viewed as a target business for lend-ing. Since debt financing is usually critical for energy efficiency investment, this lack of recognition is a seri-ous constraint. Financial institutions traditionally have not organized products and marketing efforts to capture en-ergy efficiency opportunities—a major missing force for investment. The lack of a systematic business focus on the energy efficiency market opportunity has transcended global financial markets—from the larger international financial institutions to local commercial banks and leas-ing companies.
World Bank Group Energy Efficiency Investments
Since 1990, the World Bank Group has invested nearly $3.1 billion in energy efficiency in about 120 projects in 40 countries. There are projects in all regions with a significant concentration in Europe, Central Asia, East Asia and Pacific. A few sectors have received a larger share of the investments, in particular industries, district heating, and electric power. In the past much of the energy efficiency investment was for im-proving district heating systems. This fiscal year saw the beginning of several projects to provide modern and efficient lighting technologies for grid-connected and off-grid consumers.
Private Sector Finance for Energy Efficiency
Convincing private banks to invest in energy efficiency is a key feature of the World Bank Group approach as it allows leveraging its own resources. The World Bank offers technical as-sistance and financial intermediary loans for this purpose. For example,
The World Bank brought together domestic banks in Brazil, China, and India to share experiences, create partnerships, and ex-plore opportunities for energy efficiency investment.8 This project highlighted the importance of a dialogue between banks and technology suppliers. One such exchange led to new lending programs for energy ef-ficiency in several Indian banks. Major Chi-nese banks created a concept for an energy
•
8 The project is funded by the Energy Sector Management Assistance Programme (ESMAP) and the United Nations Foundation (UNF).and is implemented with the United Na-tions Environment Programme (UNEP). A World Bank book expected for the end of 2007 will synthesize the practical knowledge from the project, together with additional knowl-edge from efforts in different countries on this topic.

�0
efficiency financing project (see Case Study Three). In Brazil, banks developed a loan guarantee for energy service companies. In the Second Renewable Energy Project with the India Renewable Energy Develop-ment Agency (IREDA), energy efficiency investments were supported through an IDA credit of US$17 million that leveraged an additional US$58 million from IREDA’s own resources, loans from other commercial sources, and developer’s equity and saved an equivalent of 86 MW of generation capacity at an investment cost of under US$900/kW. Five million dollars in cofinancing from GEF
•
helped offer advice on setting up energy efficiency service companies, training, and outreach.
The IFC’s strategy to mobilize en-ergy efficiency investments makes the most of its position as a lender for private sector projects in devel-oping countries. First, it targets op-portunities emerging from its own investment business, and second, it explores the corporation’s network of more than 400 commercial finan-cial institution clients (see Box 5).
Energy Efficiency Action Plan
After years of effort to catalyze substantial energy efficiency invest-ment in client countries, the WBG began evaluating its own business in order to understand best how to more systematically and strategical-ly support client countries in energy efficiency. The World Bank launched an Energy Efficiency Action Plan for Sustainable Development (EEfSD) in 2007 to guide actions in client countries on multiple fronts. The
Action Plan comprises four tracks:
1. Integrating energy efficiency within eco-nomic and sector work.
2. Mainstreaming energy efficiency in in-vestment operations by systematically integrating energy efficiency operations within the core energy practice by replicat-ing the “business-as-usual” and proven energy sector project designs and instru-ments.
3. Improving the internal operational, learn-ing, and analytic capacity to provide broad-based analytical and operational support, including developing new finance instru-ments or adapting existing ones.

��
Box 5: IFC Financial Intermediation in Energy Efficiency
The size of investments in energy efficiency is often smaller than the amount the IFC and World Bank find most efficient, despite the potential for high returns and development impact. These projects, however, are a perfect fit for many financial institutions in developing countries, such as commercial banks and leasing companies.
In 1997 the IFC began to work with some of the 400 financial institutions among its clients. Although energy efficiency is not a specific business for most of them, they all have loans for sustainable energy projects in their portfolio. The IFC works with the institutions to align energy efficiency investments with their business strategy. This may include, for example, lending to small and medium enterprises (SMEs), marketing new products to existing clients, or using a bank’s position as a holder of accounts for municipal governments. The IFC then works with their management to develop financial products, train the bank staff to market the new product, and develop credit procedures for what might be a new class of borrowers in their pipeline. This includes how to assess risk and value in investments for energy efficiency.
The IFC will choose to use financial tools or advisory services depending on the needs of each client. This includes enabling long-term financing in local currency or sharing the risk with the financial in-stitution while it builds experience. In each case, IFC support is a short-term boost to build capacity and enthusiasm for a growing investment business.
Results to date are impressive. The IFC has supported more than 20 financial institutions, leading to an estimated more than US$120 million in energy efficiency lending and a much larger pipeline of expected future investment.
4. Monitoring, evaluation, and outreach in rela-tion to developmental outcomes and results.
In 2004, IFC started to identify clean energy components within its own investments as part
of a process to determine whether such efforts could be expanded. This new tracking system will be extended to the World Bank to identify new energy efficiency investment opportunities (Box 6).
Box 6: Identification of New Energy Efficiency Opportunities through the IFC’s Investment Tracking System
Starting in fiscal 2005, by developing and refining an investment tracking system that identifies the energy efficiency and renewable energy components embedded in its core investment business, the IFC has developed a full understanding of where energy efficiency opportunities emerge across the industry sectors in its portfolio. The exercise has identified a broad range of energy efficiency invest-ments across the power generation and distribution business, municipal water system investments, and throughout the general manufacturing, chemicals, agribusiness, and mining businesses. In the process, the IFC identified close to US$2 billion in energy efficiency and renewable energy investment resident in 25 projects in its portfolio of fiscal 2007 new investment commitments. These investments are typically a small part of a much larger loan, and most often take place without any deliberate promotion or incentives from IFC, but driven by the production efficiency gains inherent to energy efficiency applications. Based on this profile, the IFC has identified a portfolio of energy efficiency investment opportunities it is seeking to replicate and expand by systematically identifying similar opportunities in the market and working with project sponsors as part of the IFC’s appraisal process. The IFC seeks to leverage its financial appraisal and review procedures to promote greater energy efficiency investment and offering more value to its clients and greater overall development impact.

��
Case three
prOmOting energy effiCienCy investments thrOugh finanCial intermediatiOn in China
The National Development and Reform Commis-sion of China launched the “1000 Large Industrial Enterprises Energy Conservation Action Plan” in April 2006, targeting the top 1,008 largest industrial energy consumers. Together, these account for approximately 30 percent of China’s total primary energy consumption. The conservation oppor-tunity in these industries is often referred to as a “goldmine” of energy savings by Chinese energy
conservation experts because of the potential for significant savings.
The estimated energy conservation investments needed to achieve the 20 percent energy efficien-cy target of the National Development and Reform Commission surpass US$50 billion—most of them in the industrial sectors. The World Bank-GEF funded First and Second China Energy Conserva-

��
tion Projects in the 1990s successfully introduced an energy performance contracting mechanism through energy management companies to sup-port small commercially viable energy conserva-tion projects. The proposed China Energy Efficiency Financing (CHEEF) project, prepared by the World Bank in fiscal 2007, is an important follow-up. The CHEEF project complements and reinforces several ongoing World Bank/IFC energy efficiency projects through a focus on the medium-size and large industrial energy conservation investment market. The proposed CHEEF project will provide (a) a Bank loan of US$200 million to support energy conser-vation investments in target industries through the selected participating financial institutions; and (b) a GEF technical assistance grant of US$13.5 million to strengthen the government capability to enforce related laws, regulations, and standards; and (c) assist the private financial institutions to
develop and sustain energy conservation lending business lines.
This integrated IBRD/GEF funded project is de-signed to help remove the principal barriers imped-ing investments in medium-size and large industrial energy conservation projects. The GEF grant-fi-nanced technical assistance activities will address the knowledge, institutional, and capacity gaps of the banking sector, mitigate the risk concerns of enterprises, and strengthen the governmental supervision of industrial energy conservation. The efforts of the energy conservation financial inter-mediary lending program are expected to dem-onstrate the financial viability of medium-size and large industrial energy conservation investments, and provide direct support to the government’s energy conservation priorities during the 11th Five-Year Plan period.


��
Building a Sustainable Hydropower Partnership
Hydropower is the largest global source of af-fordable renewable energy, yet in the develop-ing world less than a quarter of the potential of this abundant resource has been tapped. When developed appropriately, with attention to social and environmental risks, hydropower projects can provide multiple economic and environmen-tal benefits to the world’s poor. For these reasons, after a decade of declining lending, the WBG is re-engaging in hydropower as a way to contrib-ute to its mission: to eradicate poverty and help build sustainable development. However, the financing requirements of many large projects exceed the funds available from public sources, like the WBG, and thus the private sector plays a critical role in hydropower development. To en-sure the financial, environmental and social suc-cess of these projects, the World Bank is working in partnership with national governments, civil society organizations, and the private sector to support and plan quality hydropower projects in developing countries.
An Abundant Resource
Hydropower potential of varying sizes and configurations (pico, micro, mini, run-of-river, through to dams and storage reservoirs) amounts to roughly 7 billion GWh per year in developing countries9. Yet, only 23 percent of the energy potential has been developed, compared with 72 percent in OECD countries (see Figure 4). And, in terms of water management, per capita water storage in Africa amounts to less than one fiftieth of that in North America or Australia.
The Multiple Benefits of Hydropower
Appropriate multipurpose hydropower devel-opment, as part of a menu of options, can bring significant benefits in terms of access to electric-ity, diversified energy options, managing water scarcity (and over-abundance), and support-
–200000
300000
800000
1300000
1800000
2300000
Figure 4: Hydropower Potential and Production by Region
Source: World Atlas and Industry Guide (2006 edition), a publication of The International Journal on Hydropower and Dams. Aqua~Media International, Sutton, Surrey, U.K.
EAP w/o
China
EAP w/
China
ECA LAC MENA SA SSA OECDHi Non-OECD
Economically feasible hydropower potential (GWh/year)Production by hydro plants in 2004/05 (or average) (GWh/year)
9 The international community considers hydropower of all sizes and configurations to be renewable, as acknowledged at the World Summit on Sustainable Development in Johan-nesburg, South Africa, and the International Renewable Energies Conference in Bonn, Germany.

��
ing water-dependent activities. Hydropower contributes to the energy security agenda as a low-carbon source of electricity drawn from an indigenous natural resource that reduces susceptibility to the oil price shocks that developing countries have experienced in the last five years. It also provides unique, complementary services to an energy system that mixes thermal and renewable sources, adding reserve capacity to back up intermittent sources, such as wind and solar. Beyond energy, hydropower storage projects—when designed and operated sustainably—can help manage the drought and flood stresses of naturally volatile hydrology and the allocation of this increasingly scarce resource across multiple users, thereby contributing to water security. Finally, hydropower also offers the opportunity to build transboundary cooperation through regional initiatives in both water management and the development of power pools, with benefits beyond the river.10
Financial benefits of low carbon generation are being exploited in hydropower projects. Between 2005 and 2007, carbon credit was extended to 15 WBG projects valuing US$110 million. Increas-ingly, the carbon market is accessed by larger projects in both the private and public sectors. For example, the 59 MW Felou project in Senegal recently accessed US$3.1 million through the signature of an Emissions Reduction Purchase Agreement with the World Bank Spanish Carbon Fund, and the larger 412 MW plant in India is exploring carbon financing of US$15 million.
The World Bank Group’s Hydropower Investments
The WBG is re-engaging in hydropower for both energy and water security. After a decade of de-clining lending, the Bank now supports a range of projects, from small run-of-river and rehabilita-tion to large multiyear storage and multipurpose investments. Thirty-five hydropower projects
have been approved in the last three years, amounting to US$1.6 billion in commitments (to support a total of US$4.9 billion in project investments and 6,224 MW; see Figure 5). Major projects have recently been approved in Africa (Democratic Republic of Congo, Senegal, Sierra Leone, and Uganda) and Asia (India and People’s Democratic Republic of Laos), with several re-habilitation projects in Eastern Europe (Georgia, Macedonia, and Ukraine). New projects are under discussion in Brazil, Ethiopia, Georgia, Guinea, India, Rwanda/Nile Equatorial Lakes, Tajikistan, and Vietnam, along with carbon finance projects in Madagascar and Sri Lanka (Figure 6).
Regionally, the hydropower story varies con-siderably:
In India, the focus is on addressing an elec-tricity gap that is compromising growth and on realigning the balance among renewable and nonrenewable energy resources. The Rampur project benefiting from a combina-tion of IBRD financing and carbon finance
•
01995 1996 1997 1998 2000 2001 2002 2003 2004 2005 2006 2007 2008
200
400
US$
Mill
ions
600
800
1000
1200
Source: World Bank Group data, Washington, D.C., 2007.
Figure 5: World Bank Group Annual Hydropower Financial Commitments
*FY08 is Q1
10 C. Sadoff and D. Grey (2003), “Beyond the River: The Ben-efits of Cooperation on International Rivers,” in Water Science & Technology, Vol. 47, No. 6, pp. 91–96, IWA Publishing.

��
will add 412 MW into the Northern India Electricity Grid.In Africa, hydropower needs to be addressed from a water management perspective, giv-en the challenges of multiple demands for water and the predominance of international rivers. On the Niger River, for example, the Bank is aiding nine countries in developing a river basin organization that will enhance regional coordination, development, and sustainability of water resources along the third longest river in Africa. The regional context is also an important driver from the energy side as well. A recently approved project in the Democratic Republic of Congo will rehabilitate two Inga plants for a total increase of 600 MW in supply to the South-ern Africa Power Pool. Coupled with invest-ments in transmission and distribution, this additional energy will increase the reliability of electricity supply in the region.In Eastern Europe, the WBG is assisting countries in rehabilitating and upgrading facilities to feed into an emerging regional power pool.In East Asia, challenges and opportunities are arising in the effort to ensure that projects al-leviate poverty in host countries while feed-
•
•
•
ing demand for energy in multiple countries, such as the Nam Theun 2 project in Laos that serves Laos, Thailand, and Vietnam.
Managing the Risks of Hydropower Projects
Along with the potential development benefits of hydropower, the WBG also recognizes that hydropower, like many natural resource proj-ects, poses risks, particularly when it involves regulation of rivers or resettlement of local communities. Hence, hydropower must be developed cautiously in the context of broader development goals, including (a) responsible environmental management, (b) poverty alle-viation and social development, (c) integrated water and energy management, and (d) institu-tional development.
There has been exceptional development in the past decade in understanding how to address what used to be overwhelming environmental and social risks. The contraction of Bank lending in the 1990s was in part a response to concerns about the environmental and social impacts of dams, and the balance between benefits and costs of development. The World Commission on Dams, in which the World Bank partici-pated, produced a useful reference document that identifies important issues and outlined important strategic priorities for dams. The WBG also actively participated in the United Nations’ follow-up to the Commission: the Dams and Development Program.11 Its final report, “Dams and Development: Relevant Practices for Improved Decision-Making,” provides a positive and constructive compendium for ad-dressing environmental and social concerns. These endeavors complement the industry’s own efforts to raise awareness and improve practices through the International Hydropower Association’s Sustainability Protocol.12
11 http://www.unep.org/dams.12 http://www.hydropower.org.
Middle East and North Africa
Region2%
South Asia Region
15%Africa Region
23%
East Asia and Paci�c Region
21%
Europe and Central Asia Region
15%
Latin America and Caribbean
Region24%
Figure 6: Regional Distribution of World Bank Group Hydropower Projects
Source: World Bank Group data, Washington, D.C., 2007.Note: The number of projects counts separate WBG engagements, which in some cases support a single hydropower.

��
WBG projects are themselves subject to the “most sophisticated set of policies, operational proce-dures, and guidelines among the international donor community,”13 which has prompted in-novative approaches to sustainability. The Nam Theun 2 project, for example, includes a conser-vation offset to protect a regionally significant biodiversity area. Nearly 10 times the inundation area in the Nakai Nam Theun watershed, the offset is supported by long-term financing (US$1 million per year for 30 years) and an innovative institutional and capacity building arrangement. In the Nile Basin, the proposed Rosumo Falls multipurpose project undertook a comprehen-sive strategic environmental assessment to com-pare various options from a “triple bottom line” perspective.14 With this ongoing experience, the Bank continues to synthesize lessons learned and refine “best practices” to improve the outcomes of hydropower projects.
Engaging the Private Sector
The private sector plays a critical role in hydro-power. The financing requirements of many
large projects exceed funds available from gov-ernments and public sources. Private participa-tion can also bring additional skills in financial management, procurement, and project man-agement. However, the financial crises of the second half of the 1990s, coupled with reduced lending from multilateral development banks for hydropower, greatly cooled the prospects for private sector participation. Today, the lack of strong regulatory and enabling environments set against intense scrutiny of larger projects raises considerable risk for private capital. The inherent complexities of large hydropower (such as large upfront costs, long project development time, and environmental and social impacts) further compromise investment.
The WBG is addressing the challenge and op-portunity for private sector participation by (a) taking a programmatic approach to institutional
13 World Commission on Dams, Dams and Development: A New Framework for Decision-Making. Earthscan, 2000.14 Triple bottom line refers to the three values in sustainable development: economic, environmental, and social.

��
and regulatory development (as in the recently approved Development Program Loan to the state of Himachal Pradesh in India) and (b) act-ing as financial intermediary, providing targeted financial support, convening multiple parties, and accessing a range of financial instruments and models.
Given the hiatus in new project development for hydropower, knowledge and experience in attracting private participation in these projects is lacking. A recent study of financing water in-frastructure explored project financing models, instruments, and project structures (for example, BOOT and government).15 The extent of private sector involvement and appropriate structure for public-private partnership will depend on site- and country-specific circumstances. It will also depend on the type of project. Many small and medium run-of-river projects that have limited financial risk, low environmental consequences, and no resettlement complications are bankable
by the private sector. The WBG has been success-ful in supporting the entry of the private sector for small and medium hydropower projects as exemplified by projects in several countries:
The World Bank Carbon Finance Unit began purchasing carbon offsets from La Esperan-za, a run-of-river private hydropower proj-ect located in the waters of Intibucá River, Honduras, in 2007. The project developer is also developing forestry and land protection programs around the river basin, cleaning the garbage from the lake area, and gener-ating local direct and indirect jobs. Further, La Esperanza electrifies the local village. More recently, La Esperanza has funded a tree planting program in the surrounding community with more than 30,000 trees that were donated by La Esperanza.
•
15 C. Head, The Financing of Water Infrastructure: A Review of Case Studies. World Bank, Washington, D.C., 2006.

�0
In India, the World Bank supported two financial intermediation projects over the last 15 years that has resulted in 79 small hydropower projects with 276 MW in total capacity. The projects helped launch several small hydropower project developers, some of whom are also investing in other coun-tries. The success of the schemes funded by the World Bank and IREDA has also raised interest from commercial banks, leading to the gradual emergence of a competitive com-mercial market for funding such schemes. Consequently, total small hydropower capacity in the country stands at more than 2,000 MW as of 2007.The IFC is financing Hidromaule S.A. in Chile, a hydropower generation company owned by an Italian-Chilean consortium. The company’s initial project, Lircay, is a 20 MW run-of-river hydropower project located along the Lircay River in the VII Region of Chile, approximately 30 km to the northeast of the city of Talca. The Lir-cay hydropower project takes advantage of water rights owned by the Canal Maule Association, a long-established irrigation group formed mainly by small and medium agriculturists and with approximately 2,200 shareholders.In Sri Lanka, an indigenous renewable ener-gy industry was born in 1997 that today has invested more than US$130 million in more than 100 MW of small hydropower plants (Case Four). This industry emerged thanks to policy, legal, regulatory, and financial sup-port from the World Bank to establish a small power purchase framework and to invest in renewable energy. This achievement also led the IFC to set up a facility in Sri Lanka to create more standardized financial terms for distributed generation to expand and extend this small power model.
At the other end of the spectrum, large storage projects with multipurpose operations demand
•
•
•
a more complex mix of public and private struc-tures in order to balance public and private benefits and a range of risks. The Nam Theun 2 project’s complex private-public partnership involved more than 30 parties, with explicit allocation of risks across Nam Theun Power Company equity holders, project sponsors, and private participants, as well as the Government of Laos and the WBG (see Table 4).
Generally, risks are allocated to the party best able to manage it at the least cost to the overall project. Risk instruments, such as guarantees, have had a significant role in recent Bank proj-ects. Three projects—Bujagali (see Case Five), Bambuna in Sierra Leone, and Nam Theun 2—took advantage of risk guarantees from IDA or MIGA, or both, as in the case of Nam Theun 2. MIGA guarantees against political risks, such as war, civil disturbance, expropriation, and for-eign exchange inconvertibility, and the insurance requires no host country backing. IDA partial risk guarantees cover commercial bank debt. During the past three years, the value of risk guarantees for WBG hydropower was valued at US$518 million.
The World Bank Group’s Hydropower Strategy
Looking forward, the WBG will continue to build a pipeline of sustainable projects that add value to water management and mixed energy portfolios. The portfolio, a combination of lend-ing, technical assistance, and analytical advisory services will continue to be characterized by diversity, with projects ranging from small local plants and rehabilitation of existing facilities to pumped storage and multipurpose transna-tional projects. The contribution of hydropower to the renewable energy portfolio will build on the following:
Region-specific lending strategies, taking into consideration country programs and
•

��
capacities, sector needs, and constraints, and Bank value added.Attention to environmental and social man-agement and cross-cutting issues, such as revenue management and benefit sharing across all stakeholders, retaining water flows to sustain the environment, and climate change.Alignment of financial instruments to hy-dropower needs, addressing public-private
•
•
partnerships, funding for regional projects, and transaction costs of Bank lending.Continued emphasis on capacity building to enhance regulatory environments and embed sustainability principles in execut-ing agencies.
•
Table 4: Nam Theun 2 Project Risk Allocation
NTPC Equity Holders, Project Sponsors Phase Risks/Obligation and Private participants(a) Lao PDR (b) IDA PRG
Pre-Construction Project design • Pre-construction works • Financing •Construction Cost overruns • Construction delays •Operation Operations and maintenance • Tariffs • Transmission • Hydrological • “B-period” tariffs •Concession Team Thai Baht devaluation • Lao political force majeure • • • Changes in Lao PDR law • • Natural force majeure(c) • • • Lao—expropriation • • Thailand political force majeure • Thailand —expropriation •(a) Including EGAT as an off-taker; Engineering, Procurement and Construction (EPC) contractors; project lenders and GOL, as
shareholder in NTPC.(b) Excludes risks taken by GOL as an NTPC shareholder.(c) Natural force majeure: acts of God, earthquakes, fires, typhons, etc.
Source: World Bank, “IDA Guarantee Paves Renewed Interest in Private Hydropower—the Nam Theun 2 Project,” Project Finance and Guarantees Group, Washington, D.C., June 2005, p. 5.

��
Case fOur
sri lanka—private seCtOr leadership in small hydrOpOwer
Sri Lanka’s small hydropower (SHP) industry has received international acclaim in recent years. Ten years since the first grid-connected, privately owned small hydropower project was commis-sioned by Premasiri Sumanasekera in Dick Oya, the industry has grown into a 109 MW success story (Figure 7). Domestic private sector investment in the industry of about US$130 million has contrib-uted 4 percent of the nation’s gross generation. Between 2005 and 2006 the only new generation that was added was from these private small hydro-power generators. In a world pressured by escalat-ing oil prices, the Government of Sri Lanka is now committed to build on the SHP industry’s achieve-ment and reduce the burden on the consumer by prioritizing the development of indigenous, economical sources of energy. The National Energy Policy and Strategy has set a target of meeting 10 percent of the total demand from new renewable energy sources by 2015.
An effective framework has evolved over a decade to attract private sector investment for the devel-opment of small-scale, run-of-river hydropower projects in Sri Lanka. This framework rests on six important cornerstones, which together provide a powerful incentive and support structure that tilts the scale toward continued investor confidence, which in turn overcomes numerous obstacles in the process (see Box 7).
The SHP industry is now endowed with a skilled pool of local engineers and engineering firms. Lo-cal engineers have ingeniously adapted imported technology and know-how to suit indigenous conditions. As a result of their efforts, the cost of development in Sri Lanka is 20–30 percent less than internationally accepted benchmarks. Their techni-
cal prowess has evolved over the years and enabled them to resourcefully counter ever-increasing input costs. Consequently, local expertise is now sought after internationally, and three Sri Lankan engineer-
0
1997 1998 1999 2000 2001 2002 2003 2004 2005 2006 2007(mid-year)
50
100
150
200
Source: DFCC Consulting (Pvt) Ltd.
SPPA SignedCommissioned
Figure 7: Sri Lanka Small Hydropower Growth
Cum
ulat
ive
MW
109.4 MW (June 30, 2007)
Renewable Power Expansion under SPPA

��
ing firms are already designing, constructing, and investing in small hydropower projects in Africa.
Indigenous, new renewable energy generation is having a significant positive impact on the economy, society, and environment of Sri Lanka. The country’s energy security is improved be-cause of the diversification of the energy mix, local private sector investment is mobilized to develop
Box 7: Cornerstones of Progress
1. A straightforward application process to reserve a site for development based on a Letter of Intent issued on a first-come, first-served basis.
2. A 15-year standardized, non-negotiable power purchase agreement with the util-ity ensures that this Must Run facility is operated and maintained in a manner consistent with Prudent Utility Practices.
3. A power purchase tariff with a guaranteed floor price based on the avoided cost of marginal generation of utility-owned ther-mal power plants.
4. Tax and import duty concessions that are available to other energy and nonenergy investments meeting Board of Invest-ments criteria.
5. Medium- to long-term project financing through the World Bank–funded Energy Services Delivery Project and thereafter the Renewable Energy for Rural Economic Development Project (additional financ-ing of US$40 million was injected into the RERED project in FY07 by the World Bank).
6. Strong domestic entrepreneurial capacity and local technical expertise.
the nation’s infrastructure, and policy makers are encouraged to steer the country toward sustain-able development by balancing economic prog-ress with the conservation of the environment and empowerment of rural communities. The quality of life of villagers in the vicinity of SHP plants has improved in large part because of better road ac-cess, bigger bridges and, in some areas, access to grid electricity. The provision of basic infrastructure facilities undoubtedly translates into enhanced income-generation opportunities for these com-munities. The country as a whole also benefits from a significant foreign exchange savings of about US$30 million generated by the 346 GWh that these SHPs supplied to the national grid in 2006 (assuming 60 percent of generation displaced oil-based power at US$80/barrel of oil). Sustainable development has thus become a reality as tangible economic gains are derived, while the environment profits from the reduction of polluting emissions equivalent to 221,000 metric tons of carbon every year.

��
Case five
Bujagali hydrOpOwer: finanCing and risk mitigatiOn
An ongoing electricity crisis is a major impediment to foreign investment in Uganda. It has placed a significant strain on economic growth and has contributed to a decline in GDP growth down to 5 percent in 2006 from 6 percent in previous years.
The 250 MW run-of-river Bujagali Hydropower Project is a major component of the Ugandan government’s least-cost energy sector expansion strategy that will supply enough power to meet the country’s needs once it is commissioned in 2011. The associated transmission line is being financed by the African Development Bank.
The estimated US$870 million project is structured on an IPP basis. The project company, Bujagali Energy Ltd. (BEL), will sell power to Uganda Electric-ity Transmission Company Ltd. (UETCL, Uganda’s national transmission company) under a 30-year Power Purchase Agreement. The WBG’s support of this project has been pivotal in mobilizing the financing package needed for what is the largest single private investment in Uganda—and among the largest in East Africa.
Major Challenges and Lessons Learned
The Bujagali project faced the normal challenges of engineering, environmental, and social issues, as well as financing, involved in any large hydropower project. However, the project’s large size with re-spect to the economy and the sector, as well as the country environment, called for both innovation and dedication to see the transaction through.
The Ugandan government’s commitment to devel-oping Bujagali has played a defining role in meeting these challenges. The government undertook a
transparent selection process for the project spon-sor and required the sponsor to follow a transparent process for selection of the engineering, procure-ment, and construction contractor. The government has also engendered public support through a well-orchestrated communications campaign. In addi-tion, the government retained highly qualified legal services for support throughout the transaction, which provided confidence to all participants that Uganda’s interests were adequately represented.
To lay the groundwork for such substantial invest-ments in the sector, the government had previously undertaken a comprehensive power sector reform program, including unbundling of the power util-ity, promotion of private sector participation, and creation of a sound legal and regulatory frame-work. The robust sector framework created by the government has allowed electricity prices to remain at or near cost-reflective levels. The bankability of

��
projects such as Bujagali depend heavily on the general confidence that a committed government can establish through reform actions, as well as sustained support of the donor community.
The challenges faced by the project required focused and carefully crafted strategies for WBG engagement. The main features of this experience can be summarized as follows:
• Leveraging effect: An innovative combination of a US$115 million IDA partial risk guarantee, US$130 million in IFC loans, and US$115 mil-lion of MIGA guarantee for equity investment resulted in the mobilization of nearly US$870 million of project financing for this project.
• Rigorous analysis and effective external communication: The WBG team pursued rigor-ous analysis and external communication with the wider public, business, and investment com-munity to ensure compliance with policies.
• Efficient collaboration within the WBG team: The success of this project hinged on co-
operation within the IDA/IFC/MIGA WBG team in close collaboration with key project stakehold-ers in the government, the project sponsor, and other members of the lending consortium.
• Strong package of accompanying support to the energy sector: In parallel to the Bujagali preparation, IDA supported the power sector reform process with technical assistance and with financial support to the privatization of the distribution company (which also received MIGA support). IDA also provided a power sector de-velopment loan supporting the sector’s finances and 50 MW of additional temporary thermal generation capacity to help mitigate the short-term power shortage.
• Signaling effect: The substantial participation of the WBG in the Bujagali Project has signaled to its clients, financing partners, and to the private sector its willingness and capacity to re-engage in the development of a public-private partner-ship in support of “transformative” energy and infrastructure projects in Africa, especially the largely untapped hydroelectric potential.

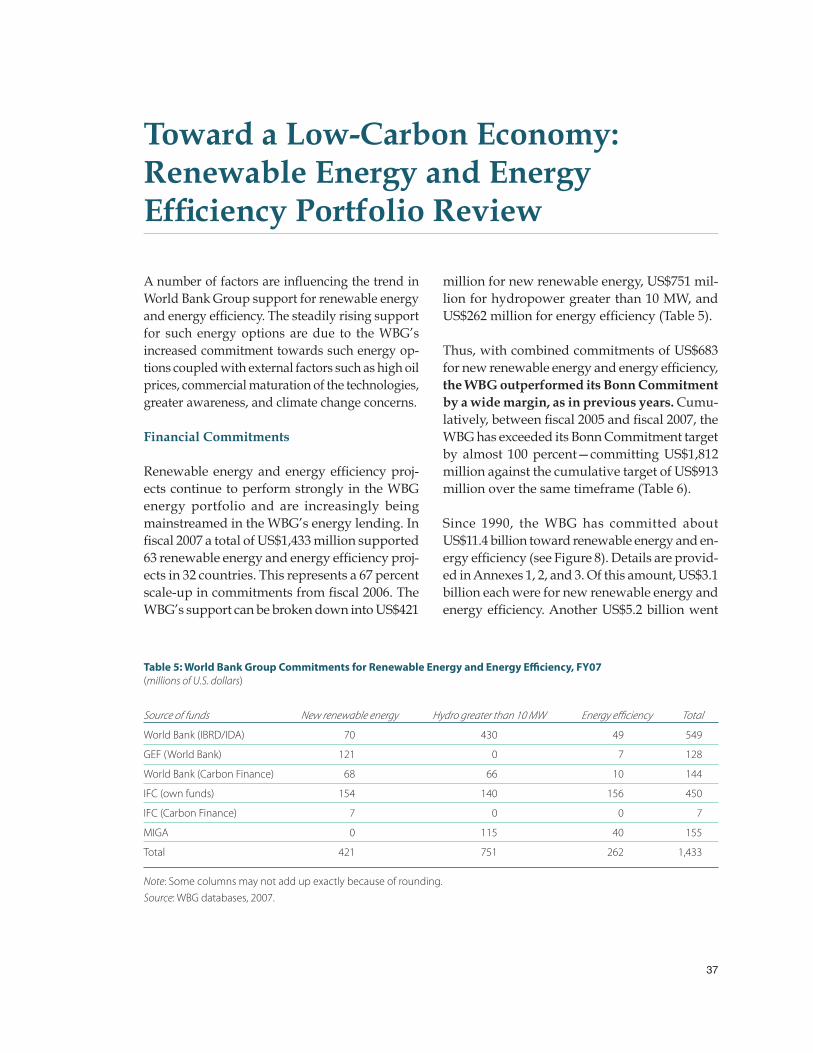
��
Toward a Low-Carbon Economy: Renewable Energy and Energy Efficiency Portfolio Review
A number of factors are influencing the trend in World Bank Group support for renewable energy and energy efficiency. The steadily rising support for such energy options are due to the WBG’s increased commitment towards such energy op-tions coupled with external factors such as high oil prices, commercial maturation of the technologies, greater awareness, and climate change concerns.
Financial Commitments
Renewable energy and energy efficiency proj-ects continue to perform strongly in the WBG energy portfolio and are increasingly being mainstreamed in the WBG’s energy lending. In fiscal 2007 a total of US$1,433 million supported 63 renewable energy and energy efficiency proj-ects in 32 countries. This represents a 67 percent scale-up in commitments from fiscal 2006. The WBG’s support can be broken down into US$421
million for new renewable energy, US$751 mil-lion for hydropower greater than 10 MW, and US$262 million for energy efficiency (Table 5).
Thus, with combined commitments of US$683 for new renewable energy and energy efficiency, the WBG outperformed its Bonn Commitment by a wide margin, as in previous years. Cumu-latively, between fiscal 2005 and fiscal 2007, the WBG has exceeded its Bonn Commitment target by almost 100 percent—committing US$1,812 million against the cumulative target of US$913 million over the same timeframe (Table 6).
Since 1990, the WBG has committed about US$11.4 billion toward renewable energy and en-ergy efficiency (see Figure 8). Details are provid-ed in Annexes 1, 2, and 3. Of this amount, US$3.1 billion each were for new renewable energy and energy efficiency. Another US$5.2 billion went
Table 5: World Bank Group Commitments for Renewable Energy and Energy Efficiency, FY07(millions of U.S. dollars)
Source of funds New renewable energy Hydro greater than 10 MW Energy efficiency Total
World Bank (IBRD/IDA) 70 430 49 549
GEF (World Bank) 121 0 7 128
World Bank (Carbon Finance) 68 66 10 144
IFC (own funds) 154 140 156 450
IFC (Carbon Finance) 7 0 0 7
MIGA 0 115 40 155
Total 421 751 262 1,433
Note: Some columns may not add up exactly because of rounding.Source: WBG databases, 2007.

��
to hydropower projects with capacities greater than 10 MW per facility. During the same period, the share of total WBG energy lending devoted to renewable energy and energy efficiency has been steadily increasing. The average share of renewable energy and energy efficiency of total energy commitments has doubled since 1990–94 to 25 percent in 2005–07 and reached 40 percent in fiscal 2007 (Figure 9).16
Commitments for large hydropower projects increased substantially over previous years, most prominently in Sub-Saharan Africa. The continent’s vast underexploited hydropower resources offer large potential for further ex-pansions as a low-carbon solution to increasing energy access. The WBG has renewed its efforts to support countries’ benefit from this resource while at the same time continuing to maintain and refine its stringent and comprehensive envi-
Table 6: Measuring Progress in New Renewable Energy and Energy Efficiency Lending against the Bonn Commitment(millions of U.S. dollars)
New RE and EE FY02–04 Total commitments FY02 FY03 FY04 average FY05 FY06 FY07 FY05–07
Actual 204 178 245 209* 461 668 683 1,812
Bonn commitment target n.a. n.a. n.a. n.a. 251 301 361 913
n.a. Not applicable.* The baseline of US$209 million was set as the average annual lending commitment for new renewable energy (RE) and energy efficiency (EE) made by the IBRD and IDA, the World Bank’s Carbon Finance Business (CFB-IBRD), and the GEF (IBRD and IDA) in fiscal 2002, 2003, and 2004. The baseline comprises exclusively of new RE and EE.Note: This includes the additional US$168 million in IFC fiscal 2005 commitments that were not reported in the fiscal 2005 RE and EE progress report (World Bank Group Progress on Renewable Energy and Energy Efficiency: Fiscal Year 2005, December 2005). Commitment amounts for two IFC projects included in last year’s RE and EE progress report have also been revised (Dominican Republic Basic Energy was US$12 million and is now US$6.34 million, and India Allain Duhangan Hydropower was US$49 million and is now US$47 million). The additional IFC fiscal 05 commitments were principally EE and RE investment com-ponents of IFC projects in agriculture, industry, transport, and other nonenergy sectors.
16 IBRD-IDA energy sector investments include oil, gas, and coal (including coal mine closing or rehabilitation; transmission and distribution of oil, gas, and electricity; power generation and associated environmental controls and plant rehabilitation; district heating and plant rehabilitation; renewable energy; and energy efficiency and conservation). IFC investments in the energy sector include investments from the IFC’s own account; MIGA investments refer to gross liability exposure. IFC and MIGA investments in en-ergy sector consist of investments in the power sector, oil, gas, and coal mining, as well as electricity and gas services. Previous IFC assessments referenced only “stand-alone” projects whose sole focus was energy efficiency or renew-able energy, thus missing the full scope of investment in sustainable energy undertaken as a component of larger investments in various sectors. Subsequently, the IFC has identified additional renewable energy and energy effi-ciency investments in commitments IFC had made in other sectors, such as agriculture, water supply, industry and in corporate loans to financial intermediaries. For more details, see Choices Matter: 2005 Sustainability Report at www.ifc.org/SustainabilityReport.
Figure 8: World Bank Group Commitments for Renewable Energy and Energy E�ciency, FY90–07
14,000
12,000
10,000
8,000
6,000
4,000
2,000200
1990
1991
1992
1993
1994
1995
1996
1997
1998
1999
2000
2001
2002
2003
2004
2005
2006
2007
400
600
800
1,000
1,200
1,600
1,400
Ann
ual U
S$ m
illio
ns
Cum
ulat
ive
US$
mill
ions
Energy e�ciencyNew renewable energyHydro > 10 MWCumulative commitment
Source: WBG databases.

��
ronmental and social safeguard policies. The Bu-jagali Hydropower Project in Uganda (see Case Five) and the Regional and Domestic Power Markets Development Project in the Democratic Republic of Congo accounted for the majority of large hydropower commitments last year.
With US$549 million of combined commitments, the IBRD and IDA provided the largest funding for renewable energy and energy efficiency of all the WBG institutions. These commitments focused predominantly on large hydropower projects, which received US$430 million in fund-ing, followed by US$70 million for new renewable energy and US$49 million for energy efficiency. In addition, the GEF has been an important partner by contributing US$128 million in co-financing for World Bank projects. IFC committed a total of US$450 million, with US$154 million going to new renewable energy, US$156 million to energy efficiency, and US$140 million to large hydropow-er projects. World Bank Carbon Finance activities contributed an additional US$144 million and MIGA contributed US$155 million.
Sub-Saharan Africa received US$735 million in renewable energy and energy efficiency com-mitments for 12 projects, which accounted for 51 percent of total renewable energy and energy
efficiency commitments (Figure 10). The major-ity of these commitments were devoted to large hydropower projects, followed by investments in energy efficiency improvements. Eleven projects were developed in South Asia, which ac-counted for US$183 million in funding devoted mostly to new renewable energy. Also in East Asia and Pacific, Latin America and Caribbean, and Middle East North Africa regions, WBG activities were focused mainly on new renew-able energy. In contrast, activities in Europe and Central Asia were focused predominantly on energy efficiency improvements, which attracted US$97 million in commitments.
A total of 32 projects with new renewable energy projects or components of projects were ap-proved in fiscal 2007. For example, solar thermal power generation received two large commit-ments from GEF in Mexico and Morocco, with a combined value of US$93.6 million. Geothermal power generation received about US$72 million in commitments with projects in Kenya, Philip-pines, and Europe and Central Asia. Wind power was supported with almost US$70 million (see Box 8)—mostly through Carbon Finance and the IFC—and biomass energy received US$51 million in commitments. In addition, several projects supported a portfolio of different new
Figure 9: Share of World Bank Group Commitments for Renewable Energy and Energy E�ciency Relative to Total Energy Commitments, FY90–07
01990–1994
13%
1995–1999
18%
2000–2004
21%
2005–2007
25%
2007
40%
0.1
0.2
0.3
0.4
0.5
Source: WBG databases.
Shar
e of
RE+
EE R
elat
ive
to
Tota
l WBG
Ene
rgy
Com
mitm
ents
Fiscal Year
New REHydro > 10 MWEE
0AFR EAP ECA LCR SARMNA
400
300
200
100
500
600
700
800
Source: WBG databases.
Ann
ual U
S$ m
illio
ns
Figure 10: World Bank Group Renewable Energy and Energy E�ciency Commitments by Region, FY07

�0
renewable energy technologies. Such projects include a US$40 million IDA commitment to Sri Lanka supporting small hydropower, solar home systems, and bioenergy, and a US$9.5 million GEF project in the Pacific Islands sup-porting solar PV, picohydro, and biodiesel technologies.
See Table 7 and Figure 11 for breakdown of the number of projects by region and sector. Figure 12 shows the funds committed for new renew-able energy, energy efficiency, and hydropower greater than 10 MW, by region.
Energy efficiency improvements were supported in 21 projects worldwide. On the electricity sup-ply side, for example, these include a US$39.6 million MIGA guarantee on investments into im-proving energy efficiency in power transmission and distribution in Uganda. Similarly, a US$9 million carbon finance project in the Nigerian city of Aba focused on improving efficiency through the development of a gas-fired cogeneration plant and reduction of transmission and distribu-tion losses through upgraded transmission lines. On the demand side, examples include a US$27 million IBRD commitment to a residential energy efficiency project in Serbia (see Box 9).
Technical Assistance and Sector Studies
In addition to operational activities, the WBG engages in a variety of economic sector work and technical assistance focused on renewable energy and energy efficiency. This work is an integral part of the WBG activities, which is val-ued as an important source of information and advice for policy makers and other stakeholders. In addition, these activities are an important component in the preparation of future lending activities. As shown in Figure 13, Analytical and Advisory Activities in renewable energy and energy efficiency have sharply risen in fiscal 2007, with 21 activities completed. Activities per-formed in the past year include studies, reports, and policy notes on renewable energy policy in Colombia and Morocco, energy security in Uruguay and rural electrification in Mexico, Peru, and Timor-Leste. Energy efficiency also received considerable attention, for example, building energy efficiency in China and energy efficiency policy formulation in Morocco. These figures show increasing interest in activities re-lated to renewable energy and energy efficiency on the part of client countries and pave the way for strong operational and lending activities in the coming years.
Table 7: Number of Projects by Region, FY07
Region Energy efficiency Hydro > 10 MW New renewable energy Total
AFR 5 3 4 12
EAP 3 3 8 14
ECA 5.5 1 2.5 9
LCR 4 1 9 14
MNA 0.5 1 1.5 3
SAR 3 1 7 11
Grand total 21 10 32 63
Note: Projects that contain both a new RE and an EE component have been divided and counted as 0.5 to avoid double count-ing. These projects include LCR’s Bertin Ltd., FYR Macedonia Sustainable Energy, Peru BBVA Banco Continental, and Morocco’s Energy Sector Development Policy Loan.Source: WBG databases.

��
Box 8: Wind Umbrella Project, Mexico
This Carbon Finance project aims at promot-ing investments in wind energy to reduce greenhouse gas emissions, to contribute to the further development of the international carbon market in Mexico through the supply of Emissions Reductions under the Clean De-velopment Mechanism and to improve energy security. The project is the first large-scale investment in wind energy in the country and is expected to reduce about 4 million tCO2e over a 20-year operating period and produce an equivalent amount of emissions reduc-tions for sale. At the same time, the project is expected to facilitate the development of other wind projects in Mexico through its demonstration effect and by building capacity, knowledge, and experience in the develop-ment, operation, and maintenance of wind energy generation facilities.
Figure 11: World Map with Distribution of Renewable Energy and Energy Efficiency Projects
Energy Sector Management Assistance Program
The Energy Sector Management Assis-tance Program (ES-
MAP), is a multidonor trust-funded global tech-nical assistance program that has reached its 25th anniversary. This program provides policy advice on sustainable energy development to govern-ments of developing countries and economies in transition. ESMAP promotes the role of energy in poverty reduction and economic growth in an environmentally responsible manner to achieve the Millennium Development Goals.
ESMAP helps build consensus on energy poli-cies, develops innovative energy solutions, and facilitates the leveraging of incremental financ-ing among both public and private development partners. ESMAP offers support to the WBG in four thematic areas, Energy Security and Energy Efficiency, Renewable Energy, Energy Poverty, and Market Efficiency and Governance. It sup-
ports both regional activities that provide better service to individual developing countries, and cutting-edge research and global projects.

��
ESMAP supports collaboration across the energy sector and shares ideas, good practices, and project experiences across regions. ESMAP has established an Energy Efficiency Thematic Group (EETG) and a Renewable Energy Thematic Group (RETG) within the World Bank. In July 2007, the EETG sponsored a joint roundtable in Tokyo with the World Bank and the Government of Japan on market opportunities and best practices in the area of energy efficiency policies and investments. The RETG held its first meeting in June 2007, fo-cusing discussions on “deep green” RE scenarios and the global wind power outlook.
In 2006, ESMAP’s energy efficiency portfolio comprised 23 projects for a total commitment of US$3.8 million while renewable energy comprised 15 projects and US$2.2 million of commitments.
In fiscal 2007, ESMAP supported a variety of studies, including Shanghai: Developing a Green Electricity Scheme (see Box 10), a survey and
analysis of different existing green electricity schemes worldwide, and Considering Trade Poli-cies for Liquid Biofuels, an international analysis of the interaction between national biofuels poli-cies, agricultural policies, and trade policies and their effect on international markets of biofuels and other agricultural products. Moreover, Risk Assessment Methods for Power Utility Planning analyzes the methods currently used for plan-ning power generation technology portfolios. It concludes that most current planning methods are inadequate for comparing fuel-intensive thermal generation technologies with free-fuel capital intensive renewables, such as hydro, wind, and geothermal because of difficulties in handling fuel price risk systematically. ES-MAP and the World Bank are now working on incorporating these lessons into new activities and developing more appropriate planning methods.
Box 10: Shanghai: Developing a Green Electricity Scheme
Upon the request of the City of Shanghai, China, in 2003, the World Bank—supported by grants from ESMAP and ASTAE—launched a project to help the city in designing and in-troducing a practical green electricity scheme. The scheme allows consumers to purchase, on a voluntary basis, part or all of their electric-ity from renewable energy resources, such as wind and solar, thereby contributing to making the city’s electricity portfolio more sustainable and reducing local air pollution. At its launch in 2005, the project enlisted 14 large electric-ity-consuming companies to commit to buying a total of 6.54 GWh of renewable electricity branded as “Jade Electricity” annually. With this critical mass of demand ensured, the scheme was subsequently able to attract additional cus-tomers, including businesses of varying sizes and households. It is believed that the success of this project can be replicated in other cities in developing countries. A more detailed de-scription of the scheme and the lessons derived from it can be found in the report Shanghai: Developing a Green Electricity Scheme (ESMAP technical paper 105/06).
Box 9: Improving Residential Energy Efficiency in Serbia
The principal aim of the project is to provide additional financing to expand an existing demand-side energy efficiency project in the Republic of Serbia that aims at reducing the rate of electricity use in buildings. Especially for heating, electricity consumption in the Serbian residential sector is very large, which leads to high heating costs, unsustainable electricity demand, and avoidable greenhouse gas emissions. To alleviate these problems, the project aims at improving energy ef-ficiency in three social care buildings, eight schools, and six hospitals that were left out of the original project because of a cost overrun. Moreover, it expands the scope of the original project to include the rehabilitation of the heat supply system of the Nis Clinical Center, other demand-side efficiency improvements at the University of Kragujevac, 20 schools, 7 social care buildings (such as orphanages), and 11 hospitals across Serbia.
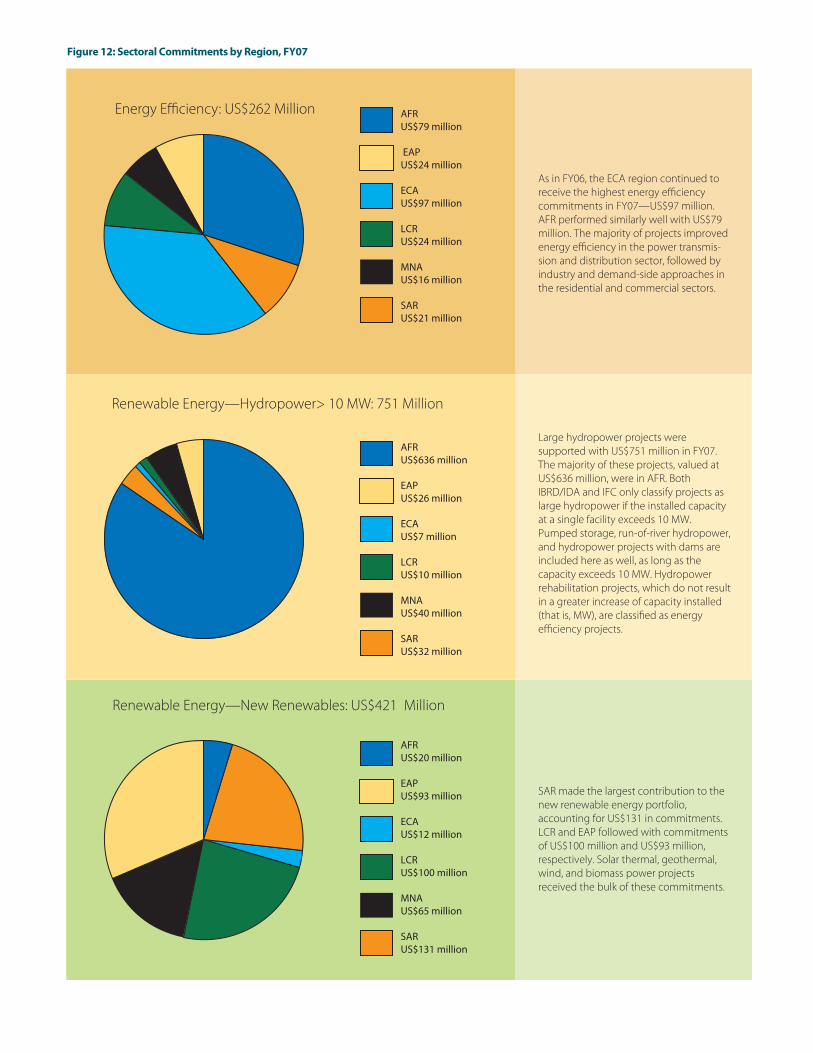
��41
Energy E�ciency: US$262 Million
Renewable Energy—Hydropower> 10 MW: 751 Million
Renewable Energy—New Renewables: US$421 Million
Figure 12: Sectoral Commitments by Region, FY07
As in FY06, the ECA region continued to receive the highest energy e�ciency commitments in FY07—US$97 million. AFR performed similarly well with US$79 million. The majority of projects improved energy e�ciency in the power transmis-sion and distribution sector, followed by industry and demand-side approaches in the residential and commercial sectors.
Large hydropower projects were supported with US$751 million in FY07. The majority of these projects, valued at US$636 million, were in AFR. Both IBRD/IDA and IFC only classify projects as large hydropower if the installed capacity at a single facility exceeds 10 MW. Pumped storage, run-of-river hydropower, and hydropower projects with dams are included here as well, as long as the capacity exceeds 10 MW. Hydropower rehabilitation projects, which do not result in a greater increase of capacity installed (that is, MW), are classi�ed as energy e�ciency projects.
SAR made the largest contribution to the new renewable energy portfolio, accounting for US$131 in commitments. LCR and EAP followed with commitments of US$100 million and US$93 million, respectively. Solar thermal, geothermal, wind, and biomass power projects received the bulk of these commitments.
AFRUS$79 million
EAPUS$24 million
ECAUS$97 million
LCRUS$24 million
MNAUS$16 million
SARUS$21 million
AFRUS$636 million
EAPUS$26 million
ECAUS$7 million
LCRUS$10 million
MNAUS$40 million
SARUS$32 million
AFRUS$20 million
EAPUS$93 million
ECAUS$12 million
LCRUS$100 million
MNAUS$65 million
SARUS$131 million
��
Asia Alternative Energy Program
The Asia Alternative Energy Program (ASTAE) grew out of the Financing Energy Services for Small-Scale Energy Users (FINESSE) project initiated by ESMAP and bilateral donors in 1989. Following a joint request
from Asian borrowers and donor partners, the Bank acted to implement the FINESSE recom-mendations by creating ASTAE in January 1992. The original objective of ASTAE—to mainstream energy efficiency and renewable energy in World Bank operations—was achieved. The initial target of a 10 percent share of renewable energy and energy efficiency lending in the Asia energy sector was surpassed during FY97–00. With the support of ASTAE, more than US$1 billion of renewable energy and energy efficiency projects or project components were developed, including about US$500 million in World Bank loans and GEF grants. The projects supported by ASTAE and ap-proved between FY93 and FY02 provided access to 660,000 households, installed 570 MW of renew-able electricity-generating capacity, and avoided 720 MW of conventional electricity-generating capacity as a result of efficiency improvements.
Since then, ASTAE has embarked on a more ambitious strategy to scale up renewable en-ergy and energy efficiency to make a direct and immediate impact on the World Bank’s overall mission of poverty alleviation and growing em-phasis on environmental protection in the two regions—South Asia, and East Asia and Pacific. ASTAE’s work plan focuses on the following key components:
Support successful implementation. ASTAE will continue to provide support for the projects currently under implementation. In the past, ASTAE assistance has been extremely valu-able in helping to redesign projects to adapt to shifting conditions.
•
Scale up impact of renewable energy and energy efficiency through programmatic approaches. To make a measurable impact on reducing greenhouse gas emissions and providing increased access to modern energy, more and larger projects are required. This will require a shift from working on stand-alone projects to working strategically on multiple projects on a programmatic basis. The projects will not be ends in themselves, as in the past, but will be seen as vehicles to build capacity and provide the momentum for policy and institutional change and the creation of an enabling environment for scale-up.Strengthen the enabling environment. Large-scale renewable energy and energy effi-ciency development requires that countries establish an institutional, policy, financial and regulatory framework that helps at-tract capital from international financial institutions, export credit agencies and, most importantly, the domestic and international private sector. ASTAE will use its cross-coun-try experiences to share best practices.Develop project pipeline. ASTAE will continue to support new project development us-ing the programmatic approach. The new projects will include both grid-connected and off-grid renewable energy applications, as well as market-based energy efficiency projects. ASTAE will continue its work in meeting energy needs in the agriculture, health, rural, and urban sectors.
The ASTAE work is supported by the World Bank, Government of the Netherlands, Canadian International Development Agency, United Na-tions Development Programme, and U.K. De-partment for International Development. Other sponsors have included the U.S. Department of Energy, U.S. Agency for International Develop-ment, Government of Finland, Government of the Swiss Confederation, European Community, U.S. Export Council for Renewable Energy (US/ECRE), German Federal Ministry for Economic
•
•
•

��
Cooperation, and the Royal Danish Ministry of Foreign Affairs.
The Way Forward
Broad consensus is now emerging that the world needs to address the dual challenges of increasing energy supply and services that are critical for economic growth for all developing countries and moderating and managing climate change. The World Bank Group launched the CEIF in 2006 to address these challenges. The growing recognition of the enormous challenge
of climate change has led to calls from govern-ments, the private sector, and the public for the WBG to adopt a more comprehensive approach beyond the CEIF. This approach would address climate change not only as a risk to development, but also as an opportunity for Bank clients to accelerate their economic transformation and take advantage of new technologies. The WBG would expand its role in supporting meaningful, country-specific, and country-driven climate ac-tions, focusing on the highest development and climate impacts. Broadening the WBG strategy would mean including the following elements: (a) a comprehensive approach to climate change, extending beyond clean energy and addressing sectors such as transport, agriculture, forests, and urban development; (b) a stepped-up pro-gram in policy research and knowledge sharing; (c) an enhanced role in the acceleration of new technology; and (d) an increased engagement in climate risk management.17 Renewable energy and energy efficiency will contribute signifi-cantly to this enhanced strategy.
17 World Bank Sustainable Development Network, “Clean Energy for Development Investment Framework: Progress Report on the World Bank Group Action Plan.” Report to the Development Committee, World Bank, Washington, D.C., September 27, 2007, p. 5.
Technical AssistanceEconomic and sector work
0FY01FY00 FY02 FY03 FY04 FY07FY06FY05
15
10
5
20
25
Source: WBG databases.
Figure 13: Number of AAA Products with Renewable Energy and Energy E�ciency Focus, FY00–07

��
Case six
Creating a framewOrk fOr renewaBle energy and energy effiCienCy in mOrOCCO
Morocco is 95 percent dependent on imported fossil fuels. This has focused the attention of the government on the need to ensure energy supply security and absorb energy price shocks. Morocco is well endowed with renewable energy resources, and has a substantial potential for energy efficiency improvements. Since 2005 the government has been actively engaged in an energy sector dialogue with the World Bank in order to prepare an energy sector development policy loan. ESMAP, the trust-funded World Bank Energy Sector Management Assistance Program, provided support to this dia-logue. ESMAP is now catalyzing activities for energy efficiency and renewable energy in Morocco by giving assistance to formulate policies and regula-tions. The projects have provided a legal framework for energy efficiency and renewable energy in Morocco, including special financing mechanisms. They have also created a new energy management agency focused on the following:
• Increasing the role of renewable energy in Morocco with the objective of generating 20 percent of electricity from domestic renewable energy sources by 2015.
• Promoting more efficient utilization of energy in industry and public buildings and for residential use.
• Reducing greenhouse gas emissions by 10 per-cent by 2015.
In 2006, ESMAP-supported projects focused on building consensus among stakeholders on goals and measures that will promote wind electricity and energy efficiency. These projects supported working groups within the government that were able to draw on lessons learned from previous ef-forts in Morocco and best practices from elsewhere.
This process helped the government prepare a comprehensive legal framework for energy man-agement. The framework eventually took the form of a single law on energy efficiency and renewable energy that will be used to prepare additional nec-essary regulations to promote investments. The law sets up goals, such as 1,000 MW of additional wind-electricity generation capacity by 2012, mandatory energy efficiency audits, and the preparation of im-proved sectoral energy efficiency standards. The law also establishes an energy management agency. The agency will be charged with promoting energy efficiency and supporting small renewable energy technologies for households and businesses.
The law also launches two special funds. One fund will pool donor financing to support private sector investment in large wind and power generation ca-pacity. Another fund will support energy efficiency investments. In 2007 ESMAP supports additional work to prepare the business plans and to design the organization of the new energy management agency and the funds.

��
Annex 1: Institutional Support for Renewable Energy and Energy Efficiency
This annex describes the various WBG institutions and units and the role that each plays in contribut-ing to renewable energy and energy efficiency. It also provides definitions of renewable energy and energy efficiency. Last, it discusses the methodology used to compute the data in this report.
Roles of the Institutions
The World Bank Group
In this report, the WBG refers to four closely associ-ated World Bank institutions that directly support renewable energy and energy efficiency activities.18 The four institutions are the IBRD, IDA, the IFC, and MIGA. There are six operational regions under the IBRD and IDA. The report disaggregates the com-mitments made by these regions and institutions. In addition, the WBG is an implementing agency for the GEF. This report provides information on WBG-ad-ministered GEF projects. The WBG’s Carbon Finance Business (CFB-IBRD) is reported separately because it is a unique business line that purchases emissions reductions and does not directly invest in projects.
The IBRD
The IBRD (International Bank for Reconstruction and Development) aims to reduce poverty in mid-dle-income and creditworthy poorer countries by promoting sustainable development through loans and guarantees and, in the nonlending area, AAAs (http://www.worldbank.org/ibrd).
IDA
Contributions to IDA (International Development As-sociation) enable the World Bank to provide approxi-mately US$6–9 billion a year in highly concessional
financing to the world’s 80 poorest countries (home to 2.5 billion people). IDA’s interest-free credits and grants are vital because these countries have little or no capacity to borrow on market terms (http://www.worldbank.org/ida).
The IFC
The IFC’s (International Finance Corporation’s) mandate is to further economic development through the private sector. Working with business partners, it invests in private enterprises in developing coun-tries and provides long-term loans, guarantees, and risk management and advisory services to its clients (http://www.ifc.org).
MIGA
MIGA (Multilateral Investment Guarantee Agency) provides political risk insurance against noncommer-cial risks to eligible foreign investors and commercial banks for qualified investments in developing mem-ber countries (http://www.miga.org).
Carbon Finance
Both the IBRD and the IFC have Carbon Finance Units (CFUs) that leverage public and private investment for projects that generate greenhouse gas emission reductions. This helps to grow the market by extend-ing carbon finance to both developing and transition economies. The funds are provided by private compa-nies and governments seeking to purchase emission
18 There is also a fifth institution that is a part of the World Bank Group: the International Centre for Settlement of Investment Disputes (ICSID). Because this institution does not directly support any RE or EE activities, for this annual report, World Bank Group precludes ICSID.

��
reductions to learn how to originate transactions in this complex emerging market. The Carbon Finance Business (CFB-IBRD) is divided into separate business lines—the IBRD CFU ( ) and the IFC CFU (http://www.ifc.org/carbonfinance).
ESMAP
ESMAP (Energy Sector Management Assistance Program) is a global technical assistance program and knowledge partnership sponsored by a group of donors, including Canada, Denmark, Finland, Germany, the Netherlands, Norway, Sweden, the United Kingdom, the United Nations Foundation, the United Nations Development Programme, and the World Bank. ESMAP is managed by the World Bank (http://www.worldbank.org/esmap).
ASTAE
In 1992, the World Bank and donor partners estab-lished ASTAE (Asia Alternative Energy Program) to support the transition to environmentally sustainable energy use in developing countries in Asia. ASTAE supports upstream economic and sector work, much like ESMAP, and it also provides assistance in renew-able energy and energy efficiency project identifica-tion, preparation, and supervision (http://www.worldbank.org/astae/).
The GEF
The Global Environment Facility (GEF), established in 1991, helps developing countries fund projects and programs that protect the global environment. GEF grants support projects related to biodiversity, climate change, international waters, land deg-radation, the ozone layer, and persistent organic pollutants.
GEF is an independent financial organization that provides grants to developing countries for projects that benefit the global environment and promote sustainable livelihoods in local communities. The GEF is the WBG’s largest partner in the area of renewable
energy and energy efficiency investments (http://www.thegef.org).
Definitions
Following are the definitions used for reporting on the WBG’s activities. Commitment amounts used in the report were prorated to include only those project components that clearly fall into one of the following categories.
New Renewable Energy
Projects that had at least one of the following were considered projects with a new renewable energy component: solar energy for heat and power, wind energy for mechanical and electrical power gen-eration, geothermal and biomass energy for power generation and heat, and hydropower of 10 MW or less per installation.
Energy Efficiency
Energy efficiency comprises end-use thermal and electricity efficiency activities (for example, industry, transport, buildings, and appliances), power sector rehabilitation, loss reduction in transmission and distribution, and improvements in the efficiency of district heating systems. Hydropower rehabilitation projects, which do not result in increased capac-ity (MW), are also classified as energy efficiency. However, this report does not include loss reduction due to rehabilitation of transmission or distribution networks if the share of transmission and distribution investments cannot be clearly disaggregated from other objectives, such as network expansion and load increase. Neither does it include Development Policy Loan commitments unless the share attributable to efficiency can be clearly determined.
Hydropower Greater Than 10 MW
The World Bank considers hydropower, regardless of scale, to be renewable energy. However, for re-porting purposes, hydropower projects in which the

��
installed capacity at a single facility exceeds 10 MW are reported separately. Pumped storage, run-of-river hydropower, and hydropower projects with dams are included here if the capacity exceeds 10 MW.
The WBG supports projects that may be cross-sectoral in nature. For example, renewable energy and energy efficiency components may be embedded within an agricultural, health, or power project. In such blended projects, sometimes it is not easy to specify precisely what the size of each sectoral component is. In this report, as far as possible, great care has been taken to show only the commitment amount associated with new renewables, energy efficiency, or hydropower greater than10 MW. For example, in a particular project, the total commitment made by the IBRD and IDA may be US$100 million. This project may have three different sectoral components: agro-industry, 50 percent; health, 30 percent; and new renewables, 20 percent. In such a case, only US$20 million has been included as the project’s contribution to renewable energy.
Different Reporting Styles
The various World Bank institutions have differing styles of reporting their data because of their differ-ent kinds of business. For example, MIGA provides guarantees to projects against various kinds of risks, whereas the IBRD and IDA provide project finance and guarantees. Emissions reductions purchases by carbon finance are a revenue stream. The IFC provides both equity and loan financing, as well as guarantees. For the purposes of this report and to arrive at an estimate of the WBG’s total commitments toward renewable energy and energy efficiency, we have added commitments made by each WBG institution. The following distinctions should be kept in mind when reading this report.
IBRD and IDA
For IBRD- and IDA-assisted projects, commitment amounts toward renewable energy, energy efficiency, or both for each project have been used to estimate
the cumulative total for the WBG. Only those proj-ect components that could clearly be attributed to a renewable energy and energy efficiency category were counted.
The IFC
The report shows IFC (International Finance Cor-poration) net investments from its own account for renewable energy and energy efficiency investment. Previous IFC assessments referred only to stand-alone projects whose sole focus was energy efficiency or renewable energy, thus missing the full scope of investment in sustainable energy undertaken as a component of larger investments in various sectors. The IFC has since revised its methodology so that it now identifies renewable energy and energy ef-ficiency investments in commitments it has made in other sectors, such as agriculture, water supply, industry, and transport, and in corporate loans to financial intermediaries. The new methodology as-sesses the percentage of IFC investment in proportion to the full project cost and applies that proportion to the full renewable energy or energy efficiency project value. This methodology has been used to update the IFC’s fiscal 2005 renewable energy and energy efficiency commitment amounts. For more details, see “Choices Matter: 2005 Sustainability Report” at www.ifc.org/SustainabilityReport.
MIGA
MIGA (Multilateral Investment Guarantee Agency) normally reports the maximum liability of its guar-antee and the foreign direct investment that the guarantee leveraged. For the purposes of arriving at a cumulative total for the WBG, this report added together only the MIGA maximum liability.
Carbon Finance
For purposes of this report, to compare carbon asset purchases and regular project financing, this report considered signed Emission Reductions Purchase Agreements to be the appropriate measure and added

�0
those amounts to arrive at the total commitment—that is, the Carbon Finance Business’ (CFB-IBRD’s) equiva-lent of Board approval for World Bank loans.
The GEF
For approved GEF (Global Environment Facility) projects, this report uses the commitment amounts for each project.

Ann
ex 2
: Ann
ual R
enew
able
Ene
rgy
and
Ener
gy E
ffici
ency
Por
tfol
io R
evie
w
Ann
ual T
able
1: W
BG R
enew
able
Ene
rgy
and
Ener
gy E
ffici
ency
Com
mit
men
ts (U
S$ m
illio
ns)
19
90
1991
19
92
1993
19
94
1995
19
96
1997
19
98
1999
20
00
2001
20
02
2003
20
04
2005
20
06
2007
G
rand
tota
l
New
Ren
ewab
les
53
2 56
22
7 30
0 59
47
33
6 15
23
9 44
4 26
16
9 10
5 19
2 21
8 22
1 42
1 3,
129
Ener
gy E
ffici
ency
0
265
54
10
59
148
380
56
356
26
295
193
67
168
67
243
447
262
3,09
4
Hyd
ropo
wer
(>10
MW
) 0
150
161
938
186
317
819
15
461
0 32
0 0
181
237
81
447
192
751
5,25
3
Gra
nd to
tal
53
417
271
1,17
4 54
5 52
4 1,
245
407
832
264
1,05
9 21
9 41
6 51
0 33
9 90
8 86
0 1,
433
11,4
76
Ann
ual T
able
2: W
BG R
enew
able
Ene
rgy
and
Ener
gy E
ffici
ency
Com
mit
men
ts (U
S$ m
illio
ns) b
y In
stit
utio
n or
Uni
t
19
90
1991
19
92
1993
19
94
1995
19
96
1997
19
98
1999
20
00
2001
20
02
2003
20
04
2005
20
06
2007
G
rand
tota
l
GEF
0
0 3
36
56
35
10
78
28
56
111
14
37
70
83
100
48
128
892
GEF
-IFC/
TF
0 0
0 0
0 0
37
33
30
5
0 19
0
14
8 20
0
165
IBRD
Car
bon
Fina
nce
0 0
0 0
0 0
0 0
0 0
0 2
8 10
48
23
14
14
4 24
9
IBRD
/IDA
53
392
196
1,11
3 30
3 45
2 1,
108
146
534
137
691
197
340
290
194
445
370
549
7,50
8
IFC
0 25
72
26
18
6 7
36
135
206
15
1 6
13
135
0 22
1 39
3 45
0 1,
925
IFC
Carb
on F
inan
ce
0 0
0 0
0 0
0 0
0 0
0 0
0 0
0 21
13
7
34
MIG
A 0
0 0
0 0
30
35
15
65
26
252
0 0
5 0
91
2 15
5 67
5
Spec
ial F
inan
cing
0
0 0
0 0
0 20
0
0 0
0 0
0 0
0 0
0 0
20
Tota
l com
mitm
ent
53
417
271
1,17
4 54
5 52
4 1,
245
407
832
264
1,05
9 21
9 41
6 51
0 33
9 90
8 86
0 1,
433
11,4
76
Ann
ual T
able
3: W
BG N
ew R
enew
able
s Co
mm
itm
ents
(US$
mill
ions
) by
Inst
itut
ion
or U
nit
19
90
1991
19
92
1993
19
94
1995
19
96
1997
19
98
1999
20
00
2001
20
02
2003
20
04
2005
20
06
2007
G
rand
tota
l
GEF
0
0 3
26
30
10
7 39
6
56
66
9 36
16
62
47
47
12
1 58
0
GEF
-IFC/
TF
0 0
0 0
0 0
30
30
0 14
0
0 0
0 14
1
0 0
89
IBRD
Car
bon
Fina
nce
0 0
0 0
0 0
0 0
0 0
0 2
4 10
19
4
8 68
11
5
IBRD
/IDA
53
2 20
20
1 27
0 19
8
132
10
128
127
9 12
8 64
97
13
9 13
6 70
1,
610
IFC
0 0
33
0 0
0 0
135
0 15
0
6 1
15
0 18
17
15
4 39
3
IFC
Carb
on F
inan
ce
0 0
0 0
0 0
0 0
0 0
0 0
0 0
0 10
13
7
23
MIG
A 0
0 0
0 0
30
2 0
0 26
25
2 0
0 0
0 0
0 0
311
Tota
l com
mitm
ent
53
2 56
22
7 30
0 59
47
33
6 15
23
9 44
4 26
16
9 10
5 19
2 21
8 22
1 42
1 3,
129

Ann
ual T
able
4: W
BG E
nerg
y Effi
cien
cy C
omm
itm
ents
(US$
mill
ions
) by
Inst
itut
ion
or U
nit
1991
19
92
1993
19
94
1995
19
96
1997
19
98
1999
20
00
2001
20
02
2003
20
04
2005
20
06
2007
G
rand
tota
l
GEF
0 0
10
26
25
3 39
22
1
45
5 1
54
22
53
1 7
312
GEF
-IFC/
TF
0
0 0
0 0
7 3
0 16
5
0 19
0
0 7
20
0 76
IBRD
Car
bon
Fina
nce
0
0 0
0 0
0 0
0 0
0 0
0 0
13
4 0
10
28
IBRD
/IDA
26
5 54
0
33
123
350
14
328
9 24
4 18
8 35
34
32
23
11
5 49
1,
897
IFC
0
0 0
0 0
0 0
6
1
12
75
0 15
6 30
9 15
6 71
5
IFC
Carb
on F
inan
ce
0
0 0
0 0
0 0
0 0
0 0
0 0
0 0
0 0
0
MIG
A
0 0
0 0
0 0
0 0
0 0
0 0
5 0
0 1.
8 39
.6
7
Spec
ial F
inan
cing
0 0
0 0
0 20
0
0 0
0 0
0 0
0 0
0 0
20
Tota
l com
mitm
ent
26
5 54
10
59
14
8 38
0 56
35
6 26
29
5 19
3 67
16
8 67
24
3 44
7 26
2 3,
094
Ann
ual T
able
5: W
BG H
ydro
pow
er (>
10
MW
) Com
mit
men
ts (U
S$ m
illio
ns) b
y In
stit
utio
n or
Uni
t
1991
19
92
1993
19
94
1995
19
96
1997
19
98
1999
20
00
2001
20
02
2003
20
04
2005
20
06
2007
G
rand
tota
l
IBRD
Car
bon
Fina
nce
0
0 0
0 0
0 0
0 0
0 0
4 0
15
15
6 66
10
6
IBRD
/IDA
12
5 12
2 91
2 0
310
750
0 19
6 0
320
0 17
7 19
2 66
28
3 11
9 43
0 4,
001
IFC
25
39
26
18
6 7
36
0 20
0 0
0 0
0 45
0
47
67
140
817
IFC
Carb
on F
inan
ce
0
0 0
0 0
0 0
0 0
0 0
0 0
0 11
0
0 11
MIG
A
0 0
0 0
0 33
15
65
0
0 0
0 0
0 91
0
115
203
Tota
l com
mitm
ent
15
0 16
1 93
8 18
6 31
7 81
9 15
46
1 —
32
0 —
18
1 23
7 81
44
7 19
2 75
1 5,
253
Ann
ual T
able
6: W
BG R
enew
able
Ene
rgy
and
Ener
gy E
ffici
ency
Com
mit
men
ts (U
S$ m
illio
ns) b
y Re
gion
19
90
1991
19
92
1993
19
94
1995
19
96
1997
19
98
1999
20
00
2001
20
02
2003
20
04
2005
20
06
2007
G
rand
tota
l
AFR
0 12
7 73
20
3 0
3 12
30
20
1 7
124
0 78
32
46
10
1 12
6 73
5 1,
898
EAP
51
0 12
1 41
0 31
0 36
7 40
0 14
5 12
3 13
9 51
3 8
124
177
47
368
232
143
3,67
6
ECA
0 29
0 0
0 33
14
0 38
1 14
23
8 15
68
18
6 75
13
9 14
7 26
0 31
3 11
7 2,
416
LCR
2
75
340
199
10
2 41
18
6 79
21
9 6
30
78
30
92
141
133
1,66
4
MN
A 0
0 0
0 2
4 0
0 0
0 0
0 0
0 40
9
11
121
188
OTH
0
0 0
0 0
0 32
14
8 0
25
0 12
1
0 13
0
1 0
232
SAR
0 0
2 22
2 0
0 41
9 29
85
0
135
7 10
8 85
15
77
35
18
3 1,
402
Gra
nd to
tal
53
417
271
1,17
4 54
5 52
4 1,
245
407
832
264
1,05
9 21
9 41
6 51
0 33
9 90
8 86
0 1,
433
11,4
76
(continuous from previous section)

Ann
ual T
able
7: W
BG N
ew R
enew
able
s Co
mm
itm
ents
(US$
mill
ions
) by
Regi
on
19
90
1991
19
92
1993
19
94
1995
19
96
1997
19
98
1999
20
00
2001
20
02
2003
20
04
2005
20
06
2007
G
rand
tota
l
AFR
0 2
18
3 0
3 8
30
5 6
124
0 16
32
46
46
19
20
37
7
EAP
51
0 0
0 30
0 49
0
112
2 13
9 0
3 18
0
37
129
103
93
1,03
5
ECA
0 0
0 0
0 0
7 0
9 6
6 2
0 0
56
10
11
12
119
LCR
2 0
37
2 0
3 2
20
0 78
20
4 6
26
35
0 15
56
10
0 58
6
MN
A 0
0 0
0 0
4 0
0 0
0 0
0 0
0 40
1
5 65
11
5
OTH
0
0 0
0 0
0 30
14
5 0
10
0 12
1
0 13
0
0 0
212
SAR
0 0
2 22
2 0
0 0
29
0 0
110
2 10
8 38
0
17
27
131
685
Gra
nd to
tal
53
2 56
22
7 30
0 59
47
33
6 15
23
9 44
4 26
16
9 10
5 19
2 21
8 22
1 42
1 3,
129
Ann
ual T
able
8: W
BG E
nerg
y Effi
cien
cy C
omm
itm
ents
(US$
mill
ions
) by
Regi
on
1991
19
92
1993
19
94
1995
19
96
1997
19
98
1999
20
00
2001
20
02
2003
20
04
2005
20
06
2007
G
rand
tota
l
AFR
0
0 0
0 0
4 0
1 1
0 0
0 0
0 4
30
79
40
EAP
0
54
10
10
8 0
33
121
0 19
3 5
1 32
11
77
72
24
64
8
ECA
26
5 0
0 33
14
0 37
4 14
22
9 9
62
183
65
131
41
79
292
97
2,01
5
LCR
0
0 0
14
0 0
6 0
1 15
0
0 6
15
61
38
24
180
MN
A
0 0
0 2
0 0
0 0
0 0
0 0
0 0
9 6
16
17
OTH
0 0
0 0
0 2
3 0
15
0 0
0 0
0 0
1 0
20
SAR
0
0 0
0 0
0 0
6 0
25
5 1
0 0
13
8 21
79
Gra
nd to
tal
26
5 54
10
59
14
8 38
0 56
35
6 26
29
5 19
3 67
16
8 67
24
3 44
7 26
2 3,
094
Ann
ual T
able
9: W
BG H
ydro
pow
er (>
10
MW
) Com
mit
men
ts (U
S$ m
illio
ns) b
y Re
gion
1991
19
92
1993
19
94
1995
19
96
1997
19
98
1999
20
00
2001
20
02
2003
20
04
2005
20
06
2007
G
rand
tota
l
AFR
12
5 55
20
0 0
0 0
0 19
6 0
0 0
62
0 0
51
77
636
1,40
2
EAP
0
67
400
0 31
0 40
0 0
0 0
320
0 10
5 14
5 0
163
57
26
1,99
3
ECA
25
0
0 0
0 0
0 0
0 0
0 10
8
51
170
11
7 28
2
LCR
0
39
338
186
7 0
15
186
0 0
0 4
37
15
16
47
10
898
MN
A
0 0
0 0
0 0
0 0
0 0
0 0
0 0
0 0
40
40
SAR
0
0 0
0 0
419
0 79
0
0 0
0 47
15
47
0
32
638
Gra
nd to
tal
15
0 16
1 93
8 18
6 31
7 81
9 15
46
1 -
320
- 18
1 23
7 81
44
7 19
2 75
1 5,
253
(continuous from previous section)

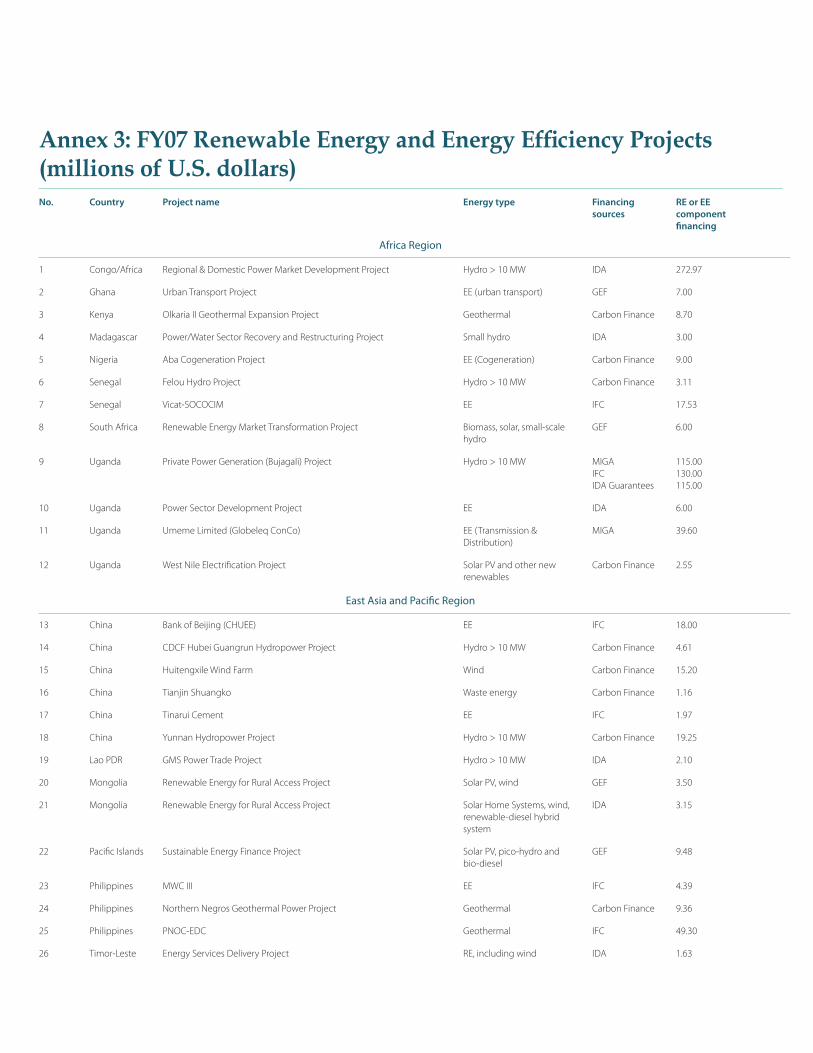
Annex 3: FY07 Renewable Energy and Energy Efficiency Projects (millions of U.S. dollars)No. Country Projectname Energytype Financing REorEE sources component financing
Africa Region
1 Congo/Africa Regional & Domestic Power Market Development Project Hydro > 10 MW IDA 272.97
2 Ghana Urban Transport Project EE (urban transport) GEF 7.00
3 Kenya Olkaria II Geothermal Expansion Project Geothermal Carbon Finance 8.70
4 Madagascar Power/Water Sector Recovery and Restructuring Project Small hydro IDA 3.00
5 Nigeria Aba Cogeneration Project EE (Cogeneration) Carbon Finance 9.00
6 Senegal Felou Hydro Project Hydro > 10 MW Carbon Finance 3.11
7 Senegal Vicat-SOCOCIM EE IFC 17.53
8 South Africa Renewable Energy Market Transformation Project Biomass, solar, small-scale GEF 6.00 hydro
9 Uganda Private Power Generation (Bujagali) Project Hydro > 10 MW MIGA 115.00 IFC 130.00 IDA Guarantees 115.00
10 Uganda Power Sector Development Project EE IDA 6.00
11 Uganda Umeme Limited (Globeleq ConCo) EE (Transmission & MIGA 39.60 Distribution)
12 Uganda West Nile Electrification Project Solar PV and other new Carbon Finance 2.55 renewables
East Asia and Pacific Region
13 China Bank of Beijing (CHUEE) EE IFC 18.00
14 China CDCF Hubei Guangrun Hydropower Project Hydro > 10 MW Carbon Finance 4.61
15 China Huitengxile Wind Farm Wind Carbon Finance 15.20
16 China Tianjin Shuangko Waste energy Carbon Finance 1.16
17 China Tinarui Cement EE IFC 1.97
18 China Yunnan Hydropower Project Hydro > 10 MW Carbon Finance 19.25
19 Lao PDR GMS Power Trade Project Hydro > 10 MW IDA 2.10
20 Mongolia Renewable Energy for Rural Access Project Solar PV, wind GEF 3.50
21 Mongolia Renewable Energy for Rural Access Project Solar Home Systems, wind, IDA 3.15 renewable-diesel hybrid system
22 Pacific Islands Sustainable Energy Finance Project Solar PV, pico-hydro and GEF 9.48 bio-diesel
23 Philippines MWC III EE IFC 4.39
24 Philippines Northern Negros Geothermal Power Project Geothermal Carbon Finance 9.36
25 Philippines PNOC-EDC Geothermal IFC 49.30
26 Timor-Leste Energy Services Delivery Project RE, including wind IDA 1.63

��
Europe and Central Asia Region
27 Europe and GeoFund 1 Geothermal GEF 4.53 Central Asia
28 Bosnia EKI EE IFC 0.77
29 Macedonia, Sustainable Energy Project New renewables, including GEF 5.00 Former Yugoslav solar, hydro, biomass, EE Republic
30 Poland Puck Wind Farm Project Wind Carbon Finance 2.44
31 Russian MDM Bank EE IFC 50.00 Federation
32 Serbia Energy Efficiency Additional Financing Project EE IBRD 27.16
33 Serbia Pro-Credit Serbia EE IFC 19.10
34 Ukraine Hydropower Rehabilitation – Proto Carbon Finance Project Hydro > 10 MW Carbon Finance 7.15
35 Ukraine Sandora II EE IFC 0.40
Latin America & Caribbean Region
36 Brazil Bauducco EE IFC 1.08
37 Brazil Bertin LTD EE IFC 1.62 Cattle waste fat bio-diesel IFC 1.62
38 Brazil Lages Cogen Facility Biomass Cogeneration Carbon Finance 7.50
39 Brazil Vale do Parana Bagasse Cogeneration IFC 5.95
40 Chile Hidromaule 20 MW IFC 9.70
41 Colombia Furatena Energy Efficiency Project EE Carbon Finance 0.66
42 Mexico CFE Wind Farm Project Wind Carbon Finance 1.22
43 Mexico Hybrid Solar Thermal Integrated Cycle Project Solar Thermal GEF 49.35
44 Mexico Umbrella Waste Management Project Waste energy Carbon Finance 1.56
45 Mexico Wind Umbrella Project Wind Carbon Finance 16.73
46 Nicaragua Nicaragua Sugar Bagasse cogeneration IFC 3.25
47 Peru BBVA Continental New renewable energy IFC 8.40 credit-line to bank EE IFC 19.60
48 Peru Laredo Expansion EE IFC 0.84
49 Uruguay Orion Pulp and paper biomass IFC 4.20 cogeneration
Middle East and North Africa Region
50 Iraq Dokan & Derbankdikhan Emergency Hydropower Project Hydro > 10 MW IDA 40.00
51 Morocco Integrated Solar Combined Cycle Power Project Solar Thermal GEF 43.20
52 Morocco Energy Sector Development Policy Loan Solar, wind IBRD 22.00 EE IBRD 16.00
(continuous from previous section)

��
South Asia Region
53 India Allain Duhangan Hydro Project Hydro > 10 MW Carbon Finance 31.73
54 India Balrampur II Biomass cogeneration IFC 10.40
55 India BHSL Biomass cogeneration + IFC 15.30 ethanol
56 India CCIL II EE IFC 3.91
57 India CF IHDC Small hydro IFC-Carbon 7.40
58 India Electrotherm EE IFC 2.60
59 India Moser Baer Photovoltaic Ltd. (MBPV) Export-oriented solar PV IFC 22.50 manufacturing plant investment with 80 MW p.a. production capacity
60 India MSPL Two wind projects of 37 MW IFC 33.00
61 India West Coast Paper EE IFC 14.60
62 Nepal Nepal Village Micro Hydro Carbon Offset Project Micro-hydro Carbon Finance 1.96
63 Sri Lanka Technical Assistance to the Ministry of Public Works Small hydro, solar home systems, bio-energy IDA 40.00
Notes: RE stands for renewable energy, and EE stands for energy efficiency.In the absence of a precise methodology, the IFC assesses the percentage of IFC investment in proportion to the full project cost and applies that proportion to the full RE/EE project value. For more details, see “Choices Matter: 2005 Sustainability Report” at www.ifc.org/SustainabilityRe-port/.
Fuel cells are categorized as RE by IFC regardless of whether the energy resource used to generating the hydrogen has been a fossil fuel or renewable energy resource. For the World Bank and for this report, fuel cells are only filed as renewable energy of the energy resource used to generating hydrogen is a renewable energy resource.
Hydropower rehabilitation projects, which do not result in greater output, are classified as EE by the WBG.
(continuous from previous section)


THE WORLD BANK
Catalyzing Private investment for a low-Carbon eConomy
World Bank Group Progress on Renewable Energy and Energy Efficiency
in Fiscal 2007
THE WORLD BANK
The World Bank Group1818 H Street, NW
Washington, DC 20433www.worldbank.org
www.ifc.orgwww.miga.org
This publication is printed on recycled paper. November 2007.