![Rachmaninov 3rd Piano Concerto [First Movement] · PDF file53-g e5 = 5 !5 = 5 5 5 5 5 4 5 5 =5 5 = 5e5 5 5 5 5 5 5 5e5 5 5!55 5 5 5 5 5e5 5 5 5 5 5 5! 5 $3e55 5 5: 5 5 5 55 5e 55 5](https://static.fdocuments.us/doc/165x107/5a78944a7f8b9a1f128d15db/rachmaninov-3rd-piano-concerto-first-movement-53-g-e5-5-5-5-5-5-5-5-4-5.jpg)
Catalyst2014_FanEngagement_Deck_12-5
12
2014 5 th ANNUAL U.S. SPORTS FAN ENGAGEMENT STUDY
-
Upload
bret-werner -
Category
Documents
-
view
75 -
download
2
Transcript of Catalyst2014_FanEngagement_Deck_12-5

2014
5th ANNUAL U.S. SPORTS FAN ENGAGEMENT STUDY
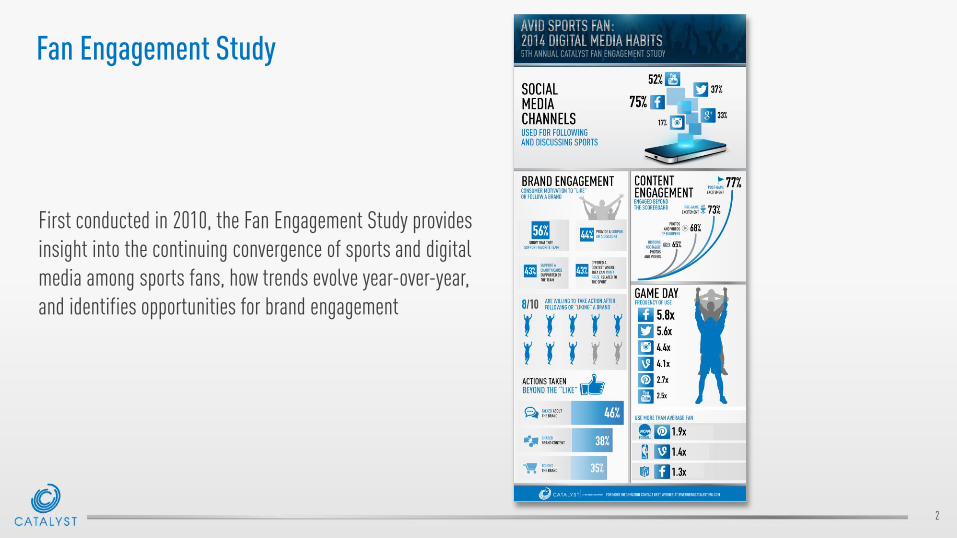
Fan Engagement Study
First conducted in 2010, the Fan Engagement Study provides insight into the continuing convergence of sports and digital media among sports fans, how trends evolve year-over-year, and identifies opportunities for brand engagement
2
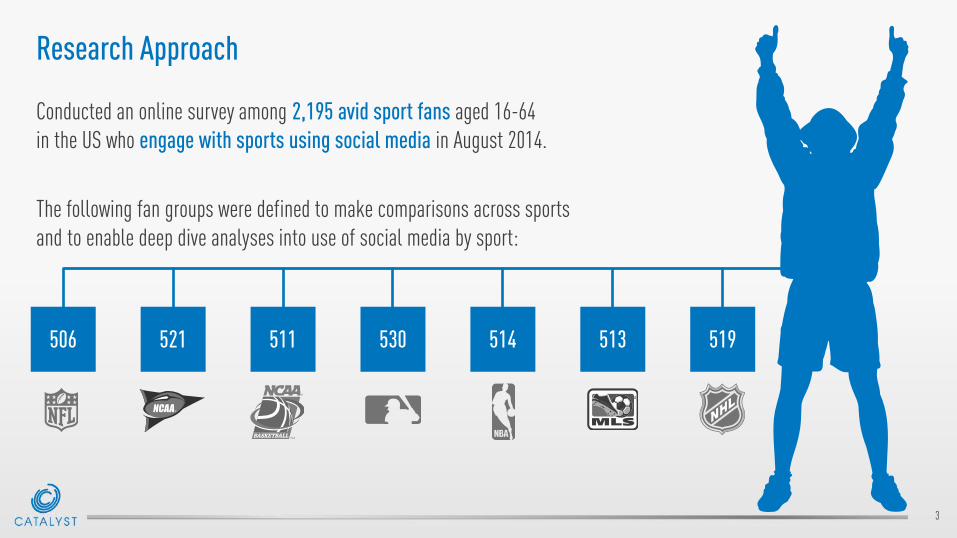
Research Approach
Conducted an online survey among 2,195 avid sport fans aged 16-64 in the US who engage with sports using social media in August 2014.
The following fan groups were defined to make comparisons across sports and to enable deep dive analyses into use of social media by sport:
3
506 521 511 530 514 513 519

Social Media increases its rank as a primary source of sports info; yet still not trusted as much as traditional sources
4
TV
Non-Social Web
Social Media
Newspapers
Radio
Magazines
2011 2012 2013 2014 2014 Rank 2011 2012 2013 2014 2014 Rank
Primary Sports Trusted Sports
1.4 1.6 1.6 1.6 1
3.7 3.4 3.0 3.3 2
3.7 3.6 3.6 3 3.4
3.6 3.8 3.8 3.8 4
Which of the following, if any, social media sites or location-based services do you use in relation to these sports? (Select all that apply] Base: 16-64 year-old social media sports fans
3.9 4.0 4.2 4.0 5
4.6 4.8 4.9 4.9 6
1.6 1.7 1.7 1.7 1
3.6 3.2 2.8 3.1 2
3.3 3.5 4.5 5
3.9 3.8 3.4 3.5 3
4.2 4.2 4.1 4
4.4 4.6 4.6 4.7 6
3.8
4.2

Soccer fans are the most dependent on social media
5
80%
66% 66%
41%
48%
26%
73% 72% 77% 76% 70% 72%
46% 54% 47% 55% 40%
31% 37% 32% 35% 33% 35%
31% 40% 33% 43% 28% 43%
14% 18% 16% 22% 11% 18%
Which of the following, if any, social media sites or location-based services do you use in relation to these sports? (Select all that apply] Base: 16-64 year-old social media sports fans
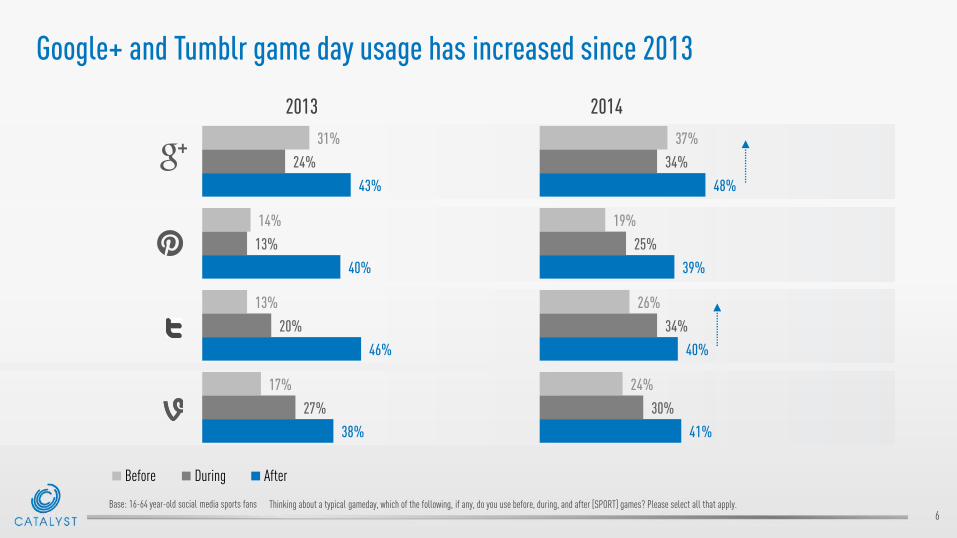
Google+ and Tumblr game day usage has increased since 2013
6
31%
14%
13%
17%
24%
13%
20%
27%
43%
40%
46%
38%
2013
37%
19%
26%
24%
34%
25%
34%
30%
48%
39%
40%
41%
2014
Thinking about a typical gameday, which of the following, if any, do you use before, during, and after [SPORT] games? Please select all that apply. Base: 16-64 year-old social media sports fans
Before During After

Fans are checking social media sites more frequently on gameday; Instagram, Vine and Pinterest saw the biggest upticks YOY
7 Thinking about a typical [SPORT] gameday, how often do you check or post to each of the social networking sites? Base: 16-64 year-old social media sports fans
6.0
4.3
2.6
2.0 1.8 1.4
1.1 0.8
5.6 5.8
4.4
3.1 3.1
2.5
4.1
2.7
2013
2014
College Football
Fans use Pinterest
1.9x more than the average
sports fan on game day

Teams and media outlets remain the top follows on social media; athletes, leagues and super fans gain momentum
8 During the [SPORT] season, how frequently do you follow each of these sources on social media for [SPORT]? Base: 16-64 year-old social media sports fans
62% 68%
62% 64%
38% 42%
46%
83% 80%
61% 64%
36% 35% 26%
86% 77%
70% 69%
44% 42% 42%
Teams Media Athletes Leagues Bloggers/Analysts (Changedto
Media Personalities)
Celebrities Super fans(Changed to Social Media
Celebrities)
Follow Often/Sometimes 2012 2013 2014
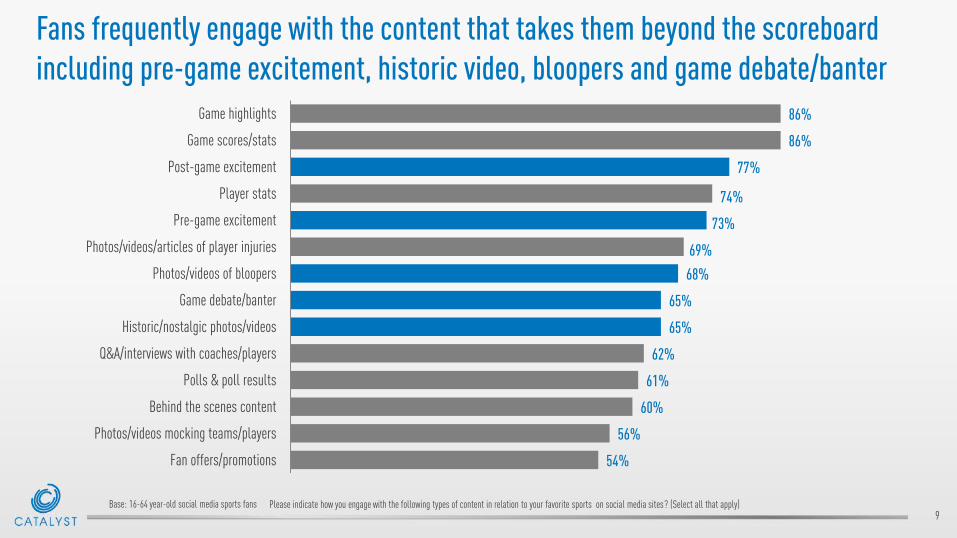
Fans frequently engage with the content that takes them beyond the scoreboard including pre-game excitement, historic video, bloopers and game debate/banter
9 Please indicate how you engage with the following types of content in relation to your favorite sports on social media sites? (Select all that apply) Base: 16-64 year-old social media sports fans
54%
56%
60%
61%
62%
65%
65%
68%
69%
73%
74%
77%
86%
86%
Fan offers/promotions
Photos/videos mocking teams/players
Behind the scenes content
Polls & poll results
Q&A/interviews with coaches/players
Historic/nostalgic photos/videos
Game debate/banter
Photos/videos of bloopers
Photos/videos/articles of player injuries
Pre-game excitement
Player stats
Post-game excitement
Game scores/stats
Game highlights

Connection with a fan’s favorite team drives brand engagement – eight in ten fans want to interact with brands in context of sports
10
Which of the following ways motivated you to ‘Like’ or follow brands when it comes to the sport(s) you mentioned? What have you done after ‘liking’ or ‘following’ a brand on Facebook or Twitter?
Base: 16-64 year-old social media sports fans who have ever liked/followed a brand displayed/promoted at a sporting event
30%
43%
43%
44%
44%
56%
Gave me a chance to meet a favorite athlete
Support a charity cause supported by the team
Offered a contest where I could win a prizerelated to the sport
Interesting advertising/promotion
Provided a coupon/discount
Showed that they support my favorite team
Why like/follow brands on social media
32%
35%
38%
46%
79%
Posted/tweeted about the brand on socialnetworking sites
Bought the brand
Shared a post/retweeted content that the brandbroadcasted
Talked about the brand with friends/family
Any action
Actions after liking/following a brand
More action vs. 2013 (up 10% pts.)
Summary Social media increases its rank as a primary source for sports information, yet still not trusted as much as traditional sources Soccer fans most dependent on social media for following/discussing sport Google+ and Tumblr game day usage has increased since 2013 Fans are checking social media sites more frequently on game day – Instagram, Vine and Pinterest saw the biggest upticks since last year Fans frequently engage with content that takes them beyond the score board including pre-game excitement, historic video, bloopers, game debate/banter Connection with a fan’s favorite team drives brand engagement–Eight-in-ten fans want to interact with brands in the context of sports
11

12
For more on how your brand can connect with fans, catalystimg.com, or Bret Werner at [email protected]
© 2014 IMG The trademarks, tradenames and logos used herein are the property of IMG. No part of this presentation may be used without permission. All rights reserved.


![[XLS] · Web view1 5 2 5 3 5 4 5 5 5 6 5 7 5 8 5 9 5 10 5 11 5 12 5 13 5 14 5 15 3 16 5 17 5 18 5 19 5 20 5 21 5 22 3 23 5 24 3 25 5 26 3 27 3 28 5 29 5 30 5 31 5 32 5 33 5 34 5 35](https://static.fdocuments.us/doc/165x107/5b0121497f8b9ad85d8da2f2/xls-view1-5-2-5-3-5-4-5-5-5-6-5-7-5-8-5-9-5-10-5-11-5-12-5-13-5-14-5-15-3-16-5.jpg)