Casting the Tax Net Wider
56
Policy Research Working Paper 7850 Casting the Tax Net Wider Experimental Evidence from Costa Rica Anne Brockmeyer Marco Hernandez Stewart Kettle Spencer Smith Macroeconomics and Fiscal Management Global Practice Group October 2016 WPS7850 Public Disclosure Authorized Public Disclosure Authorized Public Disclosure Authorized Public Disclosure Authorized Public Disclosure Authorized Public Disclosure Authorized Public Disclosure Authorized Public Disclosure Authorized
Transcript of Casting the Tax Net Wider

Policy Research Working Paper 7850
Casting the Tax Net Wider
Experimental Evidence from Costa Rica
Anne BrockmeyerMarco Hernandez
Stewart KettleSpencer Smith
Macroeconomics and Fiscal Management Global Practice GroupOctober 2016
WPS7850P
ublic
Dis
clos
ure
Aut
horiz
edP
ublic
Dis
clos
ure
Aut
horiz
edP
ublic
Dis
clos
ure
Aut
horiz
edP
ublic
Dis
clos
ure
Aut
horiz
edP
ublic
Dis
clos
ure
Aut
horiz
edP
ublic
Dis
clos
ure
Aut
horiz
edP
ublic
Dis
clos
ure
Aut
horiz
edP
ublic
Dis
clos
ure
Aut
horiz
ed

Produced by the Research Support Team
Abstract
The Policy Research Working Paper Series disseminates the findings of work in progress to encourage the exchange of ideas about development issues. An objective of the series is to get the findings out quickly, even if the presentations are less than fully polished. The papers carry the names of the authors and should be cited accordingly. The findings, interpretations, and conclusions expressed in this paper are entirely those of the authors. They do not necessarily represent the views of the International Bank for Reconstruction and Development/World Bank and its affiliated organizations, or those of the Executive Directors of the World Bank or the governments they represent.
Policy Research Working Paper 7850
This paper is a product of the Macroeconomics and Fiscal Management Global Practice Group. It is part of a larger effort by the World Bank to provide open access to its research and make a contribution to development policy discussions around the world. Policy Research Working Papers are also posted on the Web at http://econ.worldbank.org. The authors may be contacted at [email protected].
The majority of firms in developing countries are informal, and encouraging them to register with the tax authority has proven challenging and costly. This paper argues that incomplete tax filing among registered firms constitutes an important intermediate form of informality, which can be tackled with much higher cost-effectiveness. Using a nationwide randomized experiment in Costa Rica, The paper shows that credible enforcement emails tripled the income tax filing rate and doubled the payment rate among
previously non-filing firms. The treatment effect was even higher when the email listed examples of third-party reports of a firm’s transactions, with the return on an email reach-ing US$ 19. It also shows that the intervention had no negative spillovers on other tax compliance dimensions, the treatment effects persisted in the medium term, and treated firms became more likely to file information reports about their suppliers or clients, thereby increasing the tax authorities’ information set for future tax enforcement.

Casting the Tax Net Wider:
Experimental Evidence from Costa Rica
Anne Brockmeyer, Marco Hernandez, Stewart Kettle, and Spencer Smith*
Keywords: informality, tax evasion, �rms, communication experiment.
JEL codes: H25, H26, H32, O10.
*Brockmeyer: The World Bank, email: [email protected]; Hernandez: The World Bank, email: [email protected]; Kettle: Behavioural Insights Team, email: [email protected];Smith: Department of Economics, University of Oxford, email: [email protected]. We thankChristopher Adam, Miriam Bruhn, David McKenzie, Simon Quinn, Gabriel Tourek, and seminar/conference par-ticipants at the Paci�c Conference for Development Economics, the Centre for the Studies of African EconomiesConference, the Oxford University Development Lunch, and the Centre for Business Taxation Seminar for helpfulcomments. We are grateful to the Ministry of Finance and the General Directorate of Taxation of Costa Rica fortheir collaboration. In particular, we thank Fernando Rodriguez Garro and Carlos Vargas Duran, as well as to LauraBadilla Castro, Lorena Chacon Sanchez, Graciela Garcia Santamaria, Mercedes Padilla Delgado, Manuel EnriqueRamos Campos, Karla Salas Corrales, Ronald Solorzano Vega, and Giovanni Tencio Pereira. All errors are our own.

1 Introduction
Developing countries struggle to raise su�cient tax revenues to fund public services and anti-poverty
programs. Indeed, low income countries have signi�cantly lower tax to GDP ratios than high income
countries, despite similar tax rates for major taxes (Gordon and Li 2009; Besley and Persson 2013).
A large part of the tax revenue gap can thus be explained by low compliance with statutory tax
obligations, one key aspect of which is non-�ling. In Costa Rica, about 25% of tax-registered �rms,
and over 60% of �rms that are unregistered but known to the tax authority through third-party
reports from other �rms do not �le their income tax declaration. The numbers are similar in
Guatemala, where 28% of registered �rms do not �le, and across the Latin America region, where
the average non-�ling rate ranges from 20% to 30%.1 Similar to other forms of non-compliance, non-
�ling generates costs in terms of lost government revenue, horizontal inequity between taxpayers,
and resource misallocation (Skinner and Slemrod 1985; Gordon and Li 2009). Yet, despite its
empirical importance, non-�ling has received little attention in the literature, which has focused
on tax registration of fully informal �rms2 (e.g. De Andrade, Bruhn, and McKenzie 2014) and
misreporting among tax �lers (e.g. Carrillo, Pomeranz, and Singhal 2016), notably �nding these
compliance gaps di�cult to address.3
This paper argues that compliance at the tax �ling margin can be enhanced with simple and
highly cost-e�ective interventions. We evaluate a nation-wide randomized trial conducted by the
tax authority of Costa Rica, in which 49,757 non-�ling �rms were requested by email to submit their
income tax declaration for 2014.4 To design the strongest possible message, the emails combined
three features tested in previous communication interventions aimed at reducing misreporting or
payment arrears. Speci�cally, the emails contained strong deterrence content, integrated insights
1Kettle et al. (2016) for Guatemala. In discussion with the authors, o�cials from the Inter-American Centerof Tax Administrations reported an average non-�ling rate of 20-30% among tax registered �rms in the region. Ataxpayer is considered a non-�ler if it does not �le within two months of the �ling deadline.
2For the purpose of this paper, �rms that are not tax registered are considered fully informal. Firms that complypartially but not fully with their tax �ling obligations (e.g. �le income tax but not sales tax, or do not �le regularly)are considered partially informal.
3Formalizing �rms has proven challenging and costly, because the �rms' (private) bene�t of formalization is oftenlower than the cost of formalization, especially for small �rms (McKenzie and Sakho 2010; de Mel, McKenzie, andWoodru� 2013; Bruhn and McKenzie 2013). Interventions to reduce misreporting have shown success for the value-added tax (Pomeranz 2015; Naritomi 2015), but have been less successful for the income tax, where �rms can shiftevasion from the sales margin to the less veri�able cost margin (Carrillo, Pomeranz, and Singhal 2016; Slemrod et al.2015).
4Table 1 summarizes the experiment. A parallel SMS experiment, which targeted �rms that did not have an emailaddress but had a cell phone number on �le, is discussed in the Appendix. It is unfortunately not possible to trackwhich �rms received or opened the message.
2

from behavioral economics, and, where possible, leveraged third-party information that the tax
authority collected about taxpayers' business activities.
The deterrence content included a threat of audit (as in Slemrod, Blumenthal, and Christian
(2001), Kleven et al. (2011), and Pomeranz (2015)) and of a temporary �rm closure, as well as
a threat of public shaming through the publication of a list of non-�lers online (similar to Perez-
Truglia and Troiano (2016)). These deterrence messages are strong but credible. Every year, the tax
authority conducts approximately 550 audits5, targeting �rms with large estimated tax liabilities
regardless of their �ling status, and realizes several hundred week-long �rm closures, which cover all
four administrative regions of the country.6 The threat of audit and shop closure are routinely used
by the tax authority in compliance communications with taxpayers.7 While the likelihood of an audit
or shop closure for any particular �rm is low, the monetary and particularly the reputational costs
are substantive. Shop closures for instance, are accompanied by an o�cial sign on the business's
door indicating closure by the tax authority. The authority also began to publish names of non-�lers
for the sales tax in August 2015, and routinely publishes the names of late-payers, i.e. taxpayers
who �led but have outstanding liabilities to pay.
Additionally, the emails incorporated insights from behavioral economics, such as personalization
of the messages (Haynes et al. 2013), the inclusion of a clear call to action (Gabaix and Laibson
2005; BIT 2015) and of a direct web link to the income tax declaration (BIT 2014), simpli�ed text
(BIT 2014; Dwenger et al. 2016), and a social norm statement (e.g., �8 out of 10 taxpayers have
already �led�) (Wenzel 2005; Hallsworth et al. 2014; Del Carpio 2014; ).8
Finally, the messages leveraged available third-party reported information about taxpayers' busi-
ness activities, i.e. information that the tax authority collects through informative declarations pre-
sented by other �rms, state institutions and credit/debit card processing companies.9 In the sample
5The number of audits realized in 2012, 2013 and 2014 were 537, 667 and 752, respectively. Of these, less than10% were targeted at large taxpayers.
6In 2014, the tax authority conducted 293 �rm closures, of which 94 were for non-�ling, 167 for non-payment and32 for irregularities in the use of receipts. The distribution of �rm closures across regions corresponds approximatelyto the distribution of population and economic activity. Of the total, 140 closures took place in the central region,65 in the south, 52 in the north, 36 in the paci�c region. In 2015, the tax authority conducted 138 closures, ofwhich 45 were for non-�ling, 73 for non-payment and 20 for irregularities in the use of receipts. 83 closures were stillpending as of December 2015. The circumstances triggering �rm closure are outlined in Costa Rica's Reglamento de
Procedimiento Tributario, articles 252-269.7Previous communication campaigns conducted by the tax authority did not incorporate all late-�lers and varied
both the method of communication (emails, phone calls, personal visits) and the content of the messages for di�erentgroups in a non-random way.
8Some studies cited in Hallsworth (2014) �nd that a social norm can back�re among relatively compliant taxpayers.This is not a concern for our study, which deals only with non-compliers, none of whom conform to the norm.
9Third-party reporting requirements in Costa Rica are described in more detail in Section 2.
3

of �rms for which no third-party information was available, the emails either did not mention third-
party information at all (treatment 1), or mentioned the general use of these information by the tax
authority (treatment 2), without making a statement about the (non-)availability of information
for the taxpayer in question. In the sample of �rms for which third-party information was available,
the emails either mentioned the existence of third-party information about the taxpayer in question
(treatment 1), or provided speci�c examples of the taxpayer's third-party reported sales, such as
the name of a client �rm and the reported purchase amount (treatment 2). Unlike Carrillo, Pomer-
anz, and Singhal (2016), we use examples rather than the total amount of third-party reported
sales in the message, as the amounts are small for many taxpayers, and it is possible that �rms
over-estimate the total amount of third-party reports, in which case providing examples rather than
speci�c amounts might lead to larger compliance gains. The experiment design allows us to test
whether the existence of third-party information increases �rms' response to a baseline deterrence
message and whether leveraging third-party information can further strengthen the message.
We analyze the impact of the intervention using rich administrative data on multiple taxes and
�ling obligations of �rms, and �nd three sets of results. First, the emails sent to non-�lers tripled
their rate of income tax �ling and more than doubled the rate and amount of payment, relative
to the control group that received no message. Among �rms covered by third-party information,
listing speci�c examples of third-party information about the �rm had an additional positive e�ect
on all outcomes, and signi�cantly increased the rate of �ling by two percentage points (p.p.). The
�ling rate reached 34% among �rms covered by third-party information and 19% among �rms not
covered by third-party information. While the proportional treatment e�ect is larger in the latter
group, the absolute e�ect on payment is an order of magnitude larger in the former group. The
return on the (strongest) email is US$ 19 for �rms with third-party information and US$ 0.39 for
�rms without third-party information.10
Second, we advance the understanding of compliance spillover e�ects by examining whether
the treatment had an impact on a wide variety of compliance outcomes that were not speci�cally
targeted by the intervention. The possibility of negative spillovers on other compliance margins is
indeed a key concern for compliance interventions. In our experiment, we �nd no negative impact on
compliance with sales tax �ling or payment, and a signi�cant but small increase in the deregistration
rate by 1-2 p.p., though this latter result applies only to �rms with extremely small reported tax
10Figures in US dollars are calculated using an exchange rate of 545 Costa Rican colones (CRC) per U.S. dollar.
4

liabilities. Instead, we �nd that the intervention increased the rate of income tax �ling and payment,
both in the �scal years prior to the intervention�meaning that treated taxpayers were more likely
to catch up with previous outstanding obligations�and also in the year following the intervention.
The persistence of the treatment e�ect one year later without any further communication suggests
that the intervention did not just act as a reminder or nudge, but led taxpayers to update their
belief about enforcement. In addition, we �nd that the emails, and particularly those mentioning
speci�c examples of third-party information, induced a higher share of �rms to �le an informative
declaration, reporting transactions with clients and suppliers, an e�ect that also persists in the year
following the intervention. This means the intervention increased the tax authority's information
set for future tax enforcement.
Third, in an e�ort to provide guidance for targeting future communication interventions, we
analyze heterogeneity in the main treatment e�ect on tax �ling and payment. We �nd that the
impact on �ling is driven by smaller �rms and the self-employed, and the impact on payment
is driven by larger �rms, particularly corporations. This can be explained by the presence of an
exemption threshold in the tax schedule for the self-employed, but not for corporations. We also �nd
that �rms with a better past compliance record respond more strongly to the treatment. Finally,
we provide some evidence suggesting that the treatment mentioning speci�c examples of third-party
information generates an improvement in taxpayers' reporting behavior conditional on �ling, leading
�rms to declare higher sales without fully o�setting this e�ect through a cost increase.
Given an overall cost-bene�t ratio of about 1:5, we conclude that the email intervention is a cost-
e�ective and sustainable way to �cast the tax net wider,� by not only increasing present compliance
but also past and future compliance among targeted taxpayers, as well as broadening the tax
authority's information set for future tax enforcement. Targeting the intervention at �rms covered
by third-party information, particularly corporations, and those with a better past compliance
record can further increase cost-e�ectiveness.
This paper contributes to three strands of literature. First, we contribute to the literature
on taxation and development, as reviewed in Besley and Persson (2013), that analyzed how tax
capacity grows along the development path and which interventions are best suited to accelerate
this process. While most recent contributions in this literature have focused on misreporting on
the intensive margin (Best et al. 2015; Pomeranz 2015; Naritomi 2015, Carrillo, Pomeranz, and
Singhal 2016), our study highlights the importance of compliance gaps on the extensive margin,
5

and the cost-e�ectiveness of simple interventions to reduce these compliance gaps. In this sense, our
study is a complement to Brockmeyer and Hernandez (2016) who conduct a systematic anatomy of
compliance in Costa Rica, uncovering substantial compliance gaps on the extensive margin. The role
of third-party information in enhancing tax compliance has featured prominently in the literature
(Kleven et al. 2011; Kleven, Kreiner, and Saez 2015). Third-party reporting has been shown to
enhance tax compliance at the intensive margin for the value-added tax (Pomeranz 2015; Naritomi
2015), but was also found to generate evasion shifting to the cost margin, when applied to income
taxation (Carrillo, Pomeranz, and Singhal 2016, Slemrod et al. 2015). Our study focuses on the role
of third-party reporting in enhancing compliance on the extensive margin, showing that information
is both a tool for strengthening deterrence interventions and a by-product of better �ling compliance.
Second, this experiment adds to other communication experiments to increase tax compliance,
as reviewed in Dwenger et al. (2016) and Hallsworth (2014). Our study uses a cost e�ective delivery
method - emails - and maximizes message impact by combining di�erent message elements that
have proven successful in other contexts. As expected, the observed treatment e�ect of our emails
is substantially larger than treatment e�ects in most other studies. Besides, our study is one of few
in this literature to focus on �rms, including corporations, as opposed to individual taxpayers, and
the �rst with Kettle et al. (2016) to focus on tax �ling.11 Indeed, most studies in this literature
have focused on correct reporting of liabilities or on the payment of already assessed liabilities, such
as property tax liabilities. Furthermore, we extend the literature by using rich administrative data
to measure a variety of outcomes. Contrary to compliance crowd-out, we �nd positive impacts on
compliance in prior tax periods, �ling of informative declarations, and a persistence of the main
treatment e�ects in the medium term.
Finally, this paper contributes to the literature on �rm formalization, as reviewed in Bruhn
and McKenzie (2014) and De Andrade, Bruhn, and McKenzie (2014). This literature found that
providing information, reducing registration costs or simplifying regulation is relatively ine�ective in
encouraging �rms to formalize. Only enforcement, e.g. in the form of inspection visits, or payment
of about one month of pro�ts were found to signi�cantly increase registration rates. We suggest
that encouraging regular tax �ling among �rms that are tax-registered but do not �le (regularly) is
a more cost-e�ective way of casting the tax net wider. As non-�lers are �rms that have chosen to
11Hallsworth (2014) refers to three other papers considering �ling behavior, but all are focused on individualtaxpayers.
6

register for taxes, their perceived bene�t from compliance (tax �ling), likely exceeds that of fully
informal �rms that chose not to register. In addition, the tax authority already has the contact
information and in some cases also third-party reports about the business activities of these �rms,
which can be leveraged to estimate outstanding tax liabilities and contact non-�lers. In general,
we extend this literature by considering an empirically important intermediate form of informality
which has so far received little attention.
The rest of this paper is organized as follows. Section 2 describes the tax system and the
mechanisms of third-party reporting in Costa Rica, and the data we use. Section 3 presents the
experimental design. We discuss the results of the experiment in Section 4. Section 5 concludes.
2 Context and Data
2.1 Income and Sales Tax
Total tax revenues in Costa Rica represented 13.5% of GDP in 2014 (Oviedo et al. 2015). Sales
tax revenues constitute the largest share (36%) of total revenues, followed by income tax revenues
from corporations (16%) and income tax revenues from wage earners and self-employed individuals
(10%) (CR Ministry of Finance 2015).12
All �rms in Costa Rica are subject to the income tax, and a subset of �rms is subject to the
sales tax. The income tax schedule depends on whether a �rm is registered as a corporation or as
an unincorporated �rm, i.e. a self-employed individual. There are no size requirements for either
�rm type. Corporations face an average tax rate on pro�ts of 10, 20 or 30%, depending on their
revenue level. The self-employed face a marginal tax rate on pro�ts between 0 and 25%, depending
on their pro�t level. The self-employed thus have lower tax rates on average, and the self-employed
below the exemption threshold can �le an income tax declaration without incurring a liability. The
vast majority of �rms is required to �le the income tax declaration by December 15 for the previous
�scal year (October 1 to September 30). A few large �rms use the calendar year as �scal year and
�le the annual declaration by March 15. Firms have to make three quarterly advance tax payments
for the annual income tax if their previous year's liability or their average liability over the last
12Costa Rica's aggregate statistics do not distinguish between wage earners and un-incorporated �rms, which arelisted together as personas físicas. Our analysis focuses on �rms.
7

three years is non-zero, with the maximum of these two amounts determining the level of advance
payments.
Firms selling manufactured goods and certain service businesses, such as hotels and restaurants,
are also liable for the monthly sales tax. The sales tax is e�ectively a VAT, with a recrediting
mechanism for taxed inputs, but has a relatively narrow base that excludes most services (see
Brockmeyer and Hernandez (2016) for details). Approximately 20% of income tax-liable �rms are
liable for the sales tax.
Instead of paying the regular income tax (and, where applicable, the sales tax), retailers in
certain sectors and below certain size thresholds (i.e., those with annual purchases below 150 base
salaries, net assets below 350 base salaries, or with less than six employees) can opt into a simpli�ed
regime. Under the simpli�ed regime, a tax is levied on inputs at sector-speci�c rates that vary from
3% to 9.8%. Firms in this regime declare on a quarterly basis, and can claim credit for withholding
by state institutions for the income tax, but not for withholding by credit card institutions for
the sales tax. During the period we study, approximately 30,000 �rms �led their taxes under the
simpli�ed regime, while 360,000 �rms �led their income taxes under the regular regime. Firms
can opt into or out of the simpli�ed regime by submitting a D140 modi�cation form, or deregister
completely by submitting a D141 deregistration form.
Figure 1 shows the percentage of tax-registered �rms that did not �le a tax declaration in 2014
by �rm and tax type. For the income tax, this share was 19% of corporations and 25% of the
self-employed.13 It is lower but still substantial for the sales tax�19% for corporations and 14%
for the self-employed. This proportion has been stable over the last �ve years, and is based on a
tax register that is updated on a regular basis. However, it is possible that the tax register contains
inactive �rms whose owners decided not to deregister, as deregistration requires a personal visit to
the tax o�ce and the payment of any outstanding tax obligations. Even among �rms covered by
third-party information, i.e., shown to be economically active, 12% did not �le their income tax for
the 2014 tax year.
13The corresponding �gures in Brockmeyer and Hernandez (2016) are comparable, albeit lower, as they use analgorithm based on tax declarations and registration/deregistration records to construct snapshots of the tax registerat di�erent points in time, but do not directly observe the tax register. The �gures in this paper are the authority'sown estimates based on all available data.
8

2.2 Third-Party Information
To enforce taxes, the Costa Rican tax authority makes use of third-party information from di�erent
sources. The relevant informative declarations, submitted by public or private sector agents about
the economic activities of tax-liable �rms and individuals, are explained below. An informant
submits one informative declaration for each customer or provider, specifying their tax identi�cation
number, the transaction amount, the tax withheld (if applicable), and the income or transaction
type (in general categories). Taxpayers are not provided with the informative declarations at the
time they �le their tax declaration, and they are not noti�ed about the existence of an informative
record. Given the structure of reporting requirements, �rms should be aware of the existence of
third-party reports about them, but �rms with unsophisticated accounting systems might not be
able to accurately estimate the amount of third-party reports.14
� Firms have to report transactions with clients and suppliers (form D151) if the accumulated
annual amount of transactions with a single transaction partner reaches CRC 2.5 million.
The payment of rent, commissions, professional service fees, or interests must be reported if
the annual transaction amount with a single transaction partner reaches CRC 50,000. These
transactions must be reported by both the seller and the purchaser.15 As compliance with
this reporting requirement is considered to be incomplete, a �rm may not know whether it
has been reported by a client or supplier.
� State institutions report all purchases from private �rms (form D150). They also withhold
tax at a rate of 2%, which is remitted to the tax authority as an advance payment on the
income tax.16 State institutions are considered to be highly compliant with their reporting
obligation, so that a �rm selling to a state entity can be relatively certain that the transaction
will be reported to the tax authority.
� Credit or debit card companies report all card sales by a�liated businesses (form D153).
14In the case that a taxpayer inquires about the information held about her economic activities, the tax authorityis legally obligated to provide the information.
15Similar to the D151 informative declaration, form D158 must be �led by the organizers of agricultural auctions,and the declaration covers all sales and purchases at the auction. As this declaration covers very few taxpayers, wedo not include it in our analysis.
16The D150 informative declaration is also �led by a small number of �rms purchasing certain speci�ed services(e.g. transport, communications) from non-resident �rms. Firms in this case withhold tax at a rate of 3% on thespeci�ed purchases. However, less than 1% of �rms in the full sample of income tax returns are a�ected by thisscheme, which we thus do not take into account in our analysis.
9

They also withhold tax at a �rm-speci�c rate between 0% and 6%.17 The withheld amount
is remitted to the tax authority as advance payment on the sales tax. Card companies are
also considered to be highly compliant with their reporting obligation, so that a �rm can be
relatively certain that its card-machine sales will be reported to the tax authority.
The �ling deadline for third-party reports by �rms and state institutions is the same as the �ling
deadline for the income tax, December 15. Credit and debit card reports are �led monthly. The
tax authority uses all informative declarations, combined with customs declarations on imports
and exports, to automatically cross-check all income tax returns. Taxpayers with strong discrep-
ancies between third-party information and the self-assessed tax declaration, and/or meeting other
criteria18, are selected for partial audits or full audits.
Third-party reports, combined with the list of tax registered �rms, are also used to identify non-
�lers, i.e. �rms that have not complied with their �ling obligations, for the income tax, the sales
tax or third-party reports (reporting transactions with suppliers or clients). The tax authority uses
di�erent communication interventions, variably relying on emails, phone calls, or personal visits, to
follow up with non-�lers. However, given human resource constraints, the non-�ler campaigns do
not systematically cover all non-�lers and all �ling obligations each year.
2.3 Data
The data set used in this paper includes the anonymized income and sales tax returns for 2013-2015
for �rms �ling in Costa Rica, both corporations and self-employed. This amounts to about 360,000
income tax returns per year and 68,000 sales tax returns per month. The data allows us to measure
compliance prior to the experiment (2013), estimate the e�ect of the experiment on �ling for the
�scal year 2014, and estimate the medium term impact on �ling in 2015. The data includes all line
items from the tax declarations, and we match it with payment receipts, including advance payments
and �nal payments, to estimate payment compliance. Finally, we match the �rms' declarations with
third-party reports submitted by other �rms, state institutions, and credit/debit card companies.
These data identify sellers and purchasers, transaction types, transaction amounts, and tax withheld
where applicable. About 72% of �rms who �led an income tax return in 2014 were reported by at
least one client or supplier, 9% were reported by a credit or debit card company, and 6% by a state
17See Brockmeyer and Hernandez (2016) for details on this withholding scheme.18Such as pertaining to speci�c sectors or reporting a pro�t rate substantially di�erent from the sector speci�c rate.
10

institution.
3 Experiment Design
Our study design relies on a randomized communication experiment implemented by the tax au-
thority in Costa Rica. Table 1 summarizes the experiment design. The target population included
115,000 �rms that were registered with the tax authority, but had not �led their income tax declara-
tion for 2014 by February 15, 2015, two months after the regular �ling deadline. Of these non-�lers,
the experiment targeted 49,757 �rms that had an email address on �le.19 The experiment was di-
vided into two sub-experiments, targeting �rms that were covered by at least one third-party report
from a client or supplier (N = 12, 515), i.e. the �rms that were reported to be economically active,
and those that were not covered by any third-party report (N = 37, 242). To determine which
�rms were covered by third-party information, the authority considered all reports by other �rms,
by state institutions, and by credit/debit card companies.20
3.1 Firms Covered by Third-Party Information
Firms covered by third-party information were randomly assigned to one of three groups: a control
group and two treatment groups. The control group received no email message. Firms in the
treatment group received an email from the tax authority, requesting it to �le the income tax
declaration for 2014, as shown in Figure A1 in the Appendix. The message content was similar to
past communication campaigns. It emphasized that not �ling taxes is a serious o�ense, and that
o�enders could be audited or subject to business closure, as stipulated in the law. Additionally, the
message integrated �ndings from behavioral design to strengthen the message impact, as studied
by Hallsworth et al. (2014), BIT (2015), and Kettle et al. (2016). The message used shortened and
simpli�ed text (with legal details below the main body of the email), featured a clear call to action
written in red capital letters��Please �le your income tax return in the next 10 days��, provided
19Given the costs of sending letters as well as their slow and incomplete delivery, the tax authority contacts �rmsby post only in the context of audits, when a written announcement of the audit is required.
20A small number of �rms in the study shared the same primary email address, either because they had a commonowner or shared a common legal representative. For this reason, �rms were grouped into clusters based on theirprimary email address and randomization took place at the cluster level. Throughout our analysis, we use standarderrors that are robust to within-cluster correlation, and the results are robust to limiting the sample to clusterswith only one �rm (98% of clusters). The full experiment sample, including the SMS experiment described in theAppendix, contains 80,605 �rms and 77,300 clusters. The mean number of �rms per cluster is 1.04 and the medianis 1.
11

a direct link the the tax form, and was personalized with the name of the addressee featuring in
the address �eld. The message also presented the social norm��8 out of 10 [tax-registered] Costa
Ricans have �led their 2014 income tax return��and introduced the possibility of public shaming
through the publication of names. The social norm and the deterrence content of the message
are all fact-based and credible, given the usual enforcement activities the tax authority conducts
through audits, �rm closures, and the online publication of the list of late-�lers (for the sales tax)
and late-payers (for various taxes).21
As the tax authority routinely uses third-party information in its enforcement activities and
mentions this to taxpayers, the baseline treatment message (treatment 1) also stated that �We
have third-party information, con�rming that you or your client performed activities in 2014 which
require you to pay taxes.�22 Treatment 2 further strengthened this statement by providing �rms
with speci�c examples of third-party information held by the tax authority about their activities:
Treatment 2 (T2):
We have third-party information con�rming that you or your client performed activities
in 2014 which require you to pay taxes. From third-party reports (D150, D151 and D153),
we know about your operations, for example:
• Sales of at least XXX reported by COMPANY,
• Sales from credit/debit cards of at least ZZZ reported by BANK,
• Sales or contracts with state entities of at least WWW.
For each type of third-party information held by the tax authority (reports from other �rms,
state institutions, and credit/debit card companies), it listed the transaction amount and purchaser
of the highest reported transaction. Providing evidence of third-party reported transactions and
transaction partners clearly demonstrates the tax authority's possession of third-party reports and
thus makes the message highly credible. In addition, providing examples rather than the total
amount of third-party reported transactions, as in Carrillo, Pomeranz, and Singhal (2016), allows
us to apply this treatment to small or marginally formal �rms with very small third-party reports.
21As the message style and content used in past communication campaigns with non-�lers varied from year to year,relied on a diverse set of communication methods (emails, SMS, phone calls, invitations for personal interview), andmessages were not systematically sent to all late �lers, we consider that a treatment e�ect compared to the controlgroup cannot simply be due to sending a di�erent message.
22This mention of �your client� is added to make the message suitable for being sent directly to the �rm or the�rm's legal representative.
12

Finally, the design of the treatment allows us to test whether �rms over- or under-estimate the
amount of information that the tax authority holds about them.
3.2 Firms Not Covered by Third-Party Information
As in the �rst sub-experiment, �rms not covered by third-party information were also assigned
randomly to either a control group, which received no email, or one of two treatment groups. The
treated groups received an email that was nearly identical to the email in the �rst sub-experiment,
as shown in Figure A2 in the Appendix. The only di�erence is the paragraph on third-party
information, which was either omitted entirely (treatment 1), or replaced by a weaker but true
statement (treatment 2):
Treatment 2 (T2):
The tax authority uses information from third-party returns (D150, D151 and D153) to
identify economic activity and sources of income.
This treatment thus does not claim that the tax authority has third-party information about
the taxpayer in question, but it may encourage compliance among �rms who are uncertain about
whether they have been reported by a supplier or client.
As the message content here di�ers slightly from sub-experiment 1, comparing treatment e�ects
across sub-experiments confounds the di�erence in treatment and the di�erence in the target pop-
ulation, which may both generate di�erent treatment e�ects. The most comparable treatments are
the weaker message for �rms covered by third-party information (T1) and the stronger message for
�rms not covered by third-party information (T2). We will return to this comparison in our analysis
of how treatment e�ects di�er for �rms covered and not covered by third-party information.
3.3 Experiment Timing
The experiment took place between March and April 2015, as shown in 1. The list of non-�lers was
extracted on February 15, 2015, two-and-a-half weeks before any emails were sent to �rms covered by
third-party information and seven weeks before any emails were sent to �rms not covered by third-
party information. The emails were sent on speci�c dates. As emails were not sent automatically but
manually by individual tax o�cers in the regional tax authority, the interventions were sequenced
13

to accommodate the available human resources. Given the existing communication systems and
data management procedures, it was not possible to update the list of non-�lers at the start of each
experiment. Some �rms in the experiment sample had thus already �led by the time the emails were
sent. This allows us to demonstrate parallel trends in the treatment and control groups between
the extraction of the list and the start date of the experiment. Moreover, the fact that emails are
delivered instantly, as opposed to letters which vary in their delivery time, allows us to test whether
treatment e�ects emerge sharply at the start of the experiment.
3.4 Balance of Randomization
To assess the internal validity of the experimental design, we examine the balance of treatment and
control groups in terms of characteristics and compliance outcomes at baseline. Table 2 presents
balance in terms of �rm characteristics that are relevant to compliance behavior, and of which we
include a subset as controls in our estimation. The characteristics include the �rm type (corporation
or self-employed), whether the �rm has a legal representative, a secondary email address on �le23,
whether it is located in the capital city of San José, and the total transaction amount reported by
third-parties. The latter is measured by indicators capturing whether the total amount of third-
party reported sales for a given �rm, as per the sum of reports by client companies, state institutions,
and credit/debit card companies, is above CRC 2.5 million or above CRC 6 million. These cuto�s
correspond to the priority group designations used by the tax authority in prior communication
campaigns targeting non-compliant �rms, when �rms with larger third-party reports were more
likely to be contacted.
In addition, as some regional tax o�ces deviated from the experiment design and contacted
�rms prior to the start of the experiment date through phone calls and emails (di�erent from the
experimental emails presented in the previous sections), we also consider whether the occurrence
of such early communication is balanced across treatment groups. Finally, as we expect past tax
compliance to be a predictor of future compliance, we also consider past compliance as measured
by a series of dummy variables that capture whether the �rm made any quarterly advance tax
payments for 2014, and whether it �led income tax, had a positive net liability, made a payment,
23When treated �rms had two email addresses on �le, the tax authority sent the same email to the two addresses.For experiment 1, all (and only) �rms with a legal representative have a second email address on �le; for experiment2, we test whether the proportion of �rms with two email addresses is balanced across control and treatment groups,and we control for second email addresses when we estimate treatment e�ects.
14

or submitted a third-party informative declaration (D151) about a client or supplier in 2013.
Table 2 covers experiment 1 in columns 1-4 and experiment 2 in columns 5-8. Column 1 (5)
displays the average for the control group, columns 2 and 3 (5 and 7) show the di�erence between
the control group and treatment groups 1 and 2, respectively, and column 4 (8) reports p-values
from a test of the hypothesis that the two treatment groups are jointly equal to the control group.
All p-values exceed the 10% signi�cance cuto� and for 40 out of 42 coe�cients, we fail to reject
at the 10% level of signi�cance the hypothesis that the treatment group mean equals the control
group mean. We thus conclude that the control and treatment groups in both experiments are well
balanced.
In experiment 1, only 15% of �rms are corporations, 61% use a legal representative and 35%
and 18% respectively have medium or high amounts of third-party information. The experiment 2
sample features a 26% share of corporations, and a 66% share of �rms using a legal representative.
The fact that self-employed below the exemption threshold do not have to pay income tax, and may
be unaware that they are nonetheless required to �le a declaration, could explain the high share
of self-employed compared to corporations in both experiments. Only 6% of �rms in experiment 1
and 5% of �rms in experiment 2 have a second email address on �le. In both experiments, about
50% of �rms are located in the capital city. As for past compliance, only 2% of �rms in experiment
1 made advance payments for the income tax for 2014, 33% �led income tax in 2013, and 5% made
a payment in 2013. Past compliance rates are even lower among �rms in experiment 2, as would be
expected given that these �rms are not covered by any third-party information. The �rms who were
contacted early mostly pertain to experiment 1, representing 12% of the sample, but are perfectly
balanced across control and treatment groups.
Table 3 examines the balance of outcomes of interest�income tax compliance and other com-
pliance outcomes�measured on the day prior to the start of the �rst email experiment (March 3,
2015). The fact that all declarations and payment receipts carry a time-stamp and indicate the
corresponding �scal period allows us to precisely capture compliance at di�erent points in time.
The structure of this table is identical to table 2. We �nd that about 5% of �rms in experiment
1 and 1% of �rms in experiment 2 �led their income tax declaration after the extraction of the
non-�ler list and before the start of the experiment. The share of �rms reporting a positive net
liability and making a payment is below 2% for experiment 1, and close to zero for experiment 2.
Despite not �ling their own tax declaration, 16% of �rms in experiment 1 and 1% in experiment
15
2 presented a third-party declaration about a client or supplier. Compliance with the sales tax is
also non-negligible, with an average number of sales tax declarations over the last twelve months
of .6 in experiment 1 and .24 in experiment 2, despite the fact that only about 15% of these �rms
are liable for the sales tax. As would be expected given the short window between extraction of the
non-�lers list and the experiment start date, hardly any �rms deregistered, deregistered from the
sales tax or switched to the simpli�ed tax regime in this period.
We can reject the hypothesis that the treatment group mean equals the control group mean in
38 out of 40 means tests in Table 3, and the p-values of the test jointly comparing the treatment
groups to the control group exceeds the 10% signi�cance cuto� in all cases. For the two variables for
which we detect a statistically signi�cant di�erence (positive net liability and deregistration, both
in experiment 2), the means are extremely close to zero, so that the result is driven by a handful
of �rms. We thus conclude that the control and treatment groups are well balanced in terms of
the relevant �rm characteristics and outcomes measured prior to the start of the experiment. This
validates a causal interpretation of the treatment e�ects, and allows for straightforward estimations.
4 Results
This section presents the results of our empirical analysis. First, we present the estimation strategy.
Second, we present the results on income tax compliance, other compliance outcomes such as sales
tax compliance and information reporting, and examine persistence of the e�ects in the medium
term. Third, we discuss the heterogeneity of our results and potential mechanisms. Finally, we
conclude with a cost-bene�t analysis.
4.1 Estimation
To estimate treatment e�ects on binary outcomes, such as income tax �ling or making a payment,
we use the probit speci�cation:
Pr(yi = 1|T1i;T2i;Xi) = Φ(α+ β1 · T1i + β2 · T2i + γXi), (1)
where T1i and T2i indicate treatment 1 and 2, respectively, for �rm i; Xi is a vector of covariates;
and Φ is the cumulative distribution function of the standard normal distribution. The parameters
α, β1, and β2, and the parameter vector γ are estimated using maximum likelihood. Our probit
16

estimates are very similar to ordinary least squares (OLS) estimates.
To estimate treatment e�ects on continuous outcomes, such as the payment amount, we use two
speci�cations. We �rst use OLS to estimate the log-linear model
log yi = α+ β1 · T1i + β2 · T2i + γXi + εi, (2)
where yi is payment for �rm i, εi is an error term, and T1i, T2i, and Xi are de�ned as before. Sec-
ond, we use iterated, reweighted least-squares (maximum quasi-likelihood) to estimate the Poisson
pseudo-maximum likelihood (PPML) model:
g{E(yi)} = α+ β1 · T1i + β2 · T2i + γXi, (3)
where g(·) is the natural log function, yi ∼ Poisson, and the other variables are de�ned as before.
PPML has been shown to outperform OLS if the outcome variable has many zeros (Santos Silva
and Tenreyro 2006). Nonetheless, our PPML estimates of the e�ect of treatment on payment are
very similar to OLS estimates.
In all speci�cations, we compute (Huber-White) standard errors that are robust to within-cluster
correlation, as randomization was conducted by clusters of the primary email address.24 For the
probit and PPML speci�cations, we report average partial e�ects of discrete changes from zero to
one for binary independent variables, such as the treatment indicators, and compute the clustered
standard errors using the delta method. In addition to testing the hypotheses that β1 and β2 are
signi�cantly di�erent from zero, we report the p-value from a (Wald) test of the hypothesis that β1
and β2 are equal.
We condition on a set of control variables, which include �rm type (corporation), whether the
�rm has a legal representative, �rm location, amount reported by third-parties, and the �rm's
previous compliance record (i.e. income tax �ling and payment in the previous year). Each of these
controls is de�ned as in the balance tests in Section 3.4 and measured prior to the start of the
experiment.
24The results are also robust to conducting the estimation on the sample of one-�rm clusters only.
17

4.2 Income Tax Compliance
We start by analyzing the impact of the emails on income tax compliance non-parametrically. Figure
2 shows the rate of income tax �ling and payment over time by treatment status, with the start of
the experiment indicated by a vertical line. The left (right) column refers to �rms with (without)
third-party information. While pre-intervention trends in the treatment and control groups were
nearly identical for all outcomes, a positive treatment e�ect on �ling and payment emerged sharply
at the start of the experiment. This e�ect stabilized by about �ve weeks after the experiment
start date, and did not decrease thereafter.25 This con�rms that the emails generated additional
tax payments rather than just bringing forward payments that �rms would have made anyways.
After 15 weeks of the intervention, the �ling rate for information-covered �rms reached 32.5% for
those sent the baseline email, and 34.2% for those sent the email with examples of third-party
information, relative to 11.5% for the control group.26 The di�erence between the two treatment
e�ects is statistically signi�cant at the 10% level. The payment rate was 4.7% for those sent the
baseline email, 5.3% for those sent the email with examples of third-party information, and 1.7%
for the control group, though the di�erence between the two treatment groups is not signi�cant.
For �rms not covered by third-party information, the shape of the �ling and payment response
relative to the control group is similar, with the exception of any signi�cant di�erence between
the two treatments. Emphasizing the use of third-party information, in addition to highlighting
deterrence measures, thus did not enhance compliance among �rms not covered by an information
trail, which suggests that these �rms did not expect the tax authority to possess any third-party
reports about them. After 15 weeks of the intervention, the proportion of treated �rms �ling an
income tax declaration reached 19%, relative to 3.9% for the control group. The rate of payment
among �rms not covered by third-party information was below 1%, as most �rms declare a net
liability of zero, but the payment rate was still signi�cantly higher for the treatment group.
To consider a larger number of outcomes and control for covariates, we report probit, OLS, and
PPML estimates in Tables 4 and 5 for the two sub-experiments. Table 4 presents estimates of the
treatment e�ect at 15 weeks for �rms covered by third-party information. The �rst three columns
report extensive-margin responses on income tax �ling, reporting a positive net liability, and making
25This is true also when considering a longer post-intervention period (results available upon request).26The fact that over 60% of the treatment group do not �le in response to the (strong) enforcement message might
partially be attributable to the fact that not all taxpayers received and opened the email. It is unfortunately notpossible to identify the taxpayers who did not receive or open the email.
18

a payment. We estimate that the baseline email increased the probability of �ling by 21.3 p.p., which
is consistent with Figure 2. The e�ect of the information email, at 23.2 p.p., is signi�cantly greater
than the baseline email. The two emails also increased the probability that a �rm reported a positive
net liability (by about 5 p.p.) and made a positive payment (by about 3.4 p.p.). Note that the
payment rate is lower than the share of �rms reporting a positive liability, as some �rms make
quarterly advance payments or are subject to withholding at amounts that fully cover their liability,
and others under-pay or pay with delay. The fourth and �fth columns show that the emails also
increased the average payment amount, although this is driven by a greater number payers, not
larger payments conditional on making a payment.27 Using PPML, we estimate that the baseline
email increased income tax payments by CRC 8,168 (US$ 15) per taxpayer, on average, while the
information email increased payments by CRC 10,192 (US$ 19).28 The information email had a
larger impact on all outcomes than the baseline email, but the di�erence is statistically signi�cant
at conventional levels only for payment, where we observe the highest average and presumably the
least noise among the dummy variable indicators.
Table 5 shows the analogous results for �rms not covered by third-party information. Recall
that, for these �rms, the baseline treatment omitted any mention of third-party information, and the
information treatment mentioned the general use of third-party information by the tax authority,
without making speci�c reference to the email recipient (see Section 3). The emails increased the
probability of income tax �ling by 15 p.p.; they also increased the probability of reporting a positive
net liability and of making a payment, but the magnitude of the e�ect is small�0.6 p.p.�compared
with the e�ect on �ling. The e�ect on the payment amount is statistically signi�cant but not
economically large. The treatment increased payment by CRC 215 on average (US$ 0.39).
In sum, we �nd that the emails signi�cantly improved income tax compliance by non-�lers.
For �rms covered by third-party information, the e�ects of emails that listed speci�c examples
of information known to the tax authority were generally higher. All treatment e�ects estimated
here equal or exceed those from other communication experiments (Castro and Scartascini 2015;
Del Carpio 2014; Fellner, Sausgruber, and Traxler 2013; Kettle et al. 2016), which suggests that
combining di�erent messages contents that have proved to be impactful individually (deterrence,
27Note that we consider payments made by the taxpayer with her annual declaration, and ignore the quarterlyadvance payments during the year. If a taxpayer is a non-�ler and also has outstanding advance payments, thosewould have to be made with the annual declaration, and are thus considered in our estimation.
28We winsorize payment amounts at the top 0.1% of the unconditional payment distribution to reduce the in�uenceof outliers.
19

use of third-party information, behavioral design) can generate a larger impact overall.
4.3 Other Compliance Outcomes
As the experiment had a strong impact on the targeted compliance outcomes, notably income
tax �ling and payment, it is appropriate to consider also spillovers on other compliance outcomes.
Indeed, taxpayers might perceive the intervention as a general increase in enforcement, and improve
compliance also with other tax �ling and payment obligations. Alternatively, they might perceive the
intervention as pertaining to income tax compliance only, and increase compliance with the targeted
tax but compensate for lost income by reducing compliance with another obligation towards the
government. To shed light at this, we use rich administrative data on �rm's �ling of informative
declarations, sales tax declarations, sales tax payment, deregistration, and switches to the simpli�ed
regime29, all of these representing compliance outcomes which were not directly targeted by the
intervention. We also consider income tax compliance in 2013, which may be positively or negatively
a�ected by the intervention (targeting non-�lers for 2014), as a non-negligible share of �rms �le (or
pay) their taxes with substantial delay (see Brockmeyer and Hernandez (2016) for details), and
80% of non-�lers for 2014 were also non-�lers in 2013. This is to our knowledge the �rst study to
examine the impact of enforcement on such a large variety of compliance measures.
Table 6 shows the treatment impact on the above-mentioned outcomes, for experiment 1 in Panel
A and experiment 2 in Panel B. Columns 1-3 in Panel A show that treated �rms were marginally
more likely to �le an information report (D151) about their supplier, and signi�cantly more likely to
�le an information report about their client.30 With a 4.8 p.p. increase over a control group average
of 12.8%, the e�ect is twice as large for the information treatment as for the baseline treatment, and
the two coe�cients are statistically distinguishable at the 5% con�dence level. The observed impact
can be explained by the fact that, for �rms �ling an income tax declaration, �ling an informative
declaration generates only a small hustle cost, but no monetary cost, and prevents a possible �ne
for non-compliance with the reporting obligation. Consistent with this, 53% of non-�lers that �led
a third-party report have also �led their own income tax declaration. As the emails with additional
third-party information made the existence of third-party reports salient and provided information
29Firms can opt into simpli�ed income or sales tax regimes if they meet certain criteria, such as expenditure oremployment thresholds. To do this, they must submit a modi�cation form to the tax authority.
30We do not consider other information reports, such as the D150 and D153 reports, as those cannot be �led by�rms.
20

about the nature of these reports, it is not surprising that this treatment had a signi�cantly larger
impact on reporting compliance than the baseline treatment. About 25% of the newly generated
information reports concern transactions that were not previously known to the authority while 75%
con�rm transactions that had already been reported by the other transaction partner (the client in
most cases). The impact on information reporting of clients is also present and signi�cant, though
smaller in magnitude, among �rms not covered by third-party information. For both samples, we
con�rm in the bottom panels of Figure 2 that the pre-intervention trends in treatment and control
groups were similar, and the e�ect emerged sharply at the time the intervention started. A targeted
(income tax) enforcement intervention thus led to a signi�cant expansion of the tax authority's
information set for future tax enforcement, of the income tax and other taxes.
Columns 4-6 show that the intervention had no signi�cant impact on sales tax compliance, which
is the most important tax paid by �rms. However, given the small share of �rms (especially among
unincorporated �rms) that are liable for the sales tax, it is di�cult to detect any signi�cant change
in compliance with the sample size at hand.
Columns 7-9 show that the emails increased �rms' likelihood of deregistering with the tax au-
thority. This is consistent with the fact that deregistration generates a hustle cost (visiting the tax
o�ce31), and there are e�ectively no �nes for remaining registered but economically inactive, so
that �rms are unlikely to voluntarily deregister when ceasing activities. For �rms with third-party
information, treatment increased the deregistration rate from 0.9% to about 2%, and coverage by
particularly large amounts of third-party information was reassuringly negatively correlated with
deregistration. For �rms not covered by third-party information, treatment increased the dereg-
istration rate from 1.2% to about 3%. Firms not covered by third-party information were also
marginally more likely to deregister only from the sales tax (rather than from all tax obligations)
or switch to the simpli�ed tax regime which is available to �rms below certain size thresholds in
speci�c sectors (see Section 2), but this concerns less than 0.5% of the sample. The smaller e�ect
on information-covered �rms is consistent with these �rms' reported economic activity in the �scal
year in question (although they could have seized activities during the year).
When considering the �rms that deregistered and those who did not, pooling the two experi-
ments, it appears that the deregistrants were �rms that strive to be compliant on paper, without
31The possibility for online deregistration was abolished as �rms exploited it to register with the aim of obtaininga book of o�cial receipts, only to deregister immediately afterwards, as reported by the tax authority.
21

transferring any revenue to the tax authority. Among deregistrants, 61% �led an income tax decla-
ration for 2014 and 52% did so for 2013, versus 21% and 26%, respectively, for �rms that remained
in the tax register. Yet the mean reported liability was orders of magnitude lower for deregistrants
compared with �rms remaining in the tax register�CRC 826,620 versus CRC 5,100 in 2014, and
CRC 656,409 versus CRC 40,101 in 2013. While some deregistrants continued their business activ-
ities informally (8.2% or 103 �rms were third-party reported as suppliers in 2015), they would have
been unlikely to pay more taxes in the current enforcement environment. It thus appears that the
deregistrations reduced the number of taxpayers to be managed by the administration, but did not
signi�cantly a�ect tax collection.
Finally, columns 10-11 show that the emails improved compliance for the previous tax year, by
signi�cantly increasing the probability of (late) �ling and payment for the previous tax year, 2013.
This is true even though the emails speci�cally mentioned the requirement to �le the 2014 income
tax return. Emails to information-covered �rms increased �rm's likelihood of �ling an income tax
declaration by 2-3 p.p., compared to the control group's average of 35.0%. The impact on �rms no
covered by third-party information was even larger�about 5 p.p. compared to the control group's
average of 18.9%. In both samples, treated �rms were slightly more likely to make a payment for
the income tax in 2013, but the increase was economically small (below 0.5%).
In sum, our analysis of a diverse set of compliance outcomes that could potentially be impacted
by the enforcement intervention detects positive treatment e�ects on compliance with third-party
reporting and past income tax obligations, and a small increase in deregistration rates, mostly
re�ecting the exit of �rms with disproportionally low reported liabilities.
4.4 Persistence of E�ects
Having shown that the treatment had an economically large impact on contemporaneous income tax
compliance and other compliance outcomes, we now examine whether these e�ects persisted over
time without a follow-up communication.32 Table 7 shows the impact on compliance outcomes and
third-party reports in 2015, one year after the treatment. For compliance outcomes (columns 1-3
and 7-9), we pool the two treatments for simplicity, as the coe�cients do not di�er signi�cantly by
treatment. For �rms covered by third-party information, the email messages increased the income
32The tax authority conducts other communication campaigns for the �ling of sales tax and informative declarations,and it is possible that �rms in our experiment were contacted through one of these campaigns, but the targetingwould have been orthogonal to our treatment group assignment.
22

tax �ling rate one year later by 6.5 p.p., over a control group average of 35.1%. The e�ect was
even larger�7.3 p.p. or 46%�for �rms not covered by third-party information, which received
a presumably weaker email message in the treatment year. The emails also had a statistically
signi�cant but economically small e�ect on payment rates one year later: 1.0 p.p. for �rms with
third-party information and 0.2 p.p. for �rms without information. Finally, treated �rms were more
likely to �le informative declarations in 2015, mostly to report a client. For information-covered
�rms, the emails generated a 2.3 p.p. increase in the third-party reporting rate, thus further
expanding the tax authority's enforcement capacity.
Conversely, we do not detect any e�ect of the emails on �rms' propensity to be the subject of
third-party reports in a later year. Columns 4-5 in Table 7 display the e�ect of the two treatments
on �rms' likelihood of being reported by state institutions (D150), private sector clients or suppliers
(D151), or card processing companies (D153) in 2015. Treated �rms were no more or less likely
to be the subject of these reports, even if they received the stronger information email, which
provided them with examples of third-party information held by the tax authority. The result holds
also when pooling the two treatments. Thus, the treatment thus does not seem to have distorted
production networks by encouraging �rms to reduce trade with state agencies or credit/debit card
machine usage, or to change trading practices with other �rms in an e�ort to avoid being covered
by third-party reports.33
Overall, these �ndings suggest that one-time deterrence messages can have a signi�cant and pos-
itive impact on compliance in the medium term, including compliance with information reporting
requirements. The strong medium-term e�ects in our experiment suggest that the email messages
lead �rms to update their beliefs regarding the tax authority's enforcement capacity, i.e. the ca-
pacity to identify and follow up on non-�lers, and that the update was persistent over time, hence
con�rming the messages' credibility.34 The emails thus did not just act as a reminder or �nudge�,
nor as a temporary, yet ultimately empty, enforcement threat.
The positive treatment e�ect in the medium term also sheds some light on the size of potential
real e�ects. By reducing (compliant) �rms' after-tax pro�tability, the treatment might have lowered
33We also examine potential compliance spillovers of treatment on �rms' trading partners, as identi�ed by the D151information reports from clients and suppliers, but do not �nd any spillover e�ects.
34It is possible that the treatment and subsequent consultations with tax o�cers allowed �rms to gain new infor-mation about the tax �ling procedure, which would have reduced the cost of future tax �ling. However, we considerthis mechanism to be less important than the deterrence mechanism, as tax �ling in Costa Rica is very simple, all thenecessary information is available online, and �rms in our sample are tax registered and have thus been in contactwith the tax authority at some point, often through �ling a previous income tax declaration.
23

investment and �rm growth. However, the persistent treatment e�ect on compliance shows that the
(positive) e�ect on income reporting is larger than the (potentially negative) e�ect on true income.35
4.5 Heterogeneity
Although the emails can be sent at a marginal cost of zero, communications campaigns such as the
one analyzed here still generate non-negligible costs to the tax authority (more on cost-e�ectiveness
below) as emails have to be personalized manually or an algorithm needs to be constructed for this
task, and the communications generate information and advice requests from targeted taxpayers to
tax o�cials. O�cials report that responding to these inquiries constitutes the most important cost
of communication campaigns. Given human resource constraints, it is thus important to understand
which taxpayers are most likely to respond to the treatment and target the intervention accordingly.
This section considers heterogeneity in treatment e�ects by coverage of third-party information, and
by other �rm characteristics, distinguishing the two main outcomes of income tax �ling and payment.
4.5.1 By Third-Party Information
It is ex ante ambiguous whether coverage by third-party information or having larger amounts of
third-party information would be associated with larger treatment e�ects. The information could
interact with the intervention to strengthen its e�ect. Alternatively, �rms that are covered by
third-party information may be more likely to comply even without a treatment, and thus less
likely to respond to the intervention. We start by considering heterogeneous treatment e�ects by
information coverage, and then examine heterogeneity by the amount of information within the
sample of information-covered �rms.
To compare treatment e�ects across the two sub-experiments for �rms with and without third-
party information, we focus on the most comparable treatments. These are the baseline email for
�rms covered by third-party information, which emphasized the presence of third-party information
about the �rm in question without providing speci�c examples, and the second email for �rms that
are not covered, which mentioned the general use of third-party information by the authority. The
latter message was thus weaker, but delivered the strongest message on third-party information
that the authority can credibly send to �rms in this sample. While Figure 2 and Tables 4 and 5
35It is also conceivable that the real e�ect is positive, for instance if better tax compliance allows �rms to trade withmore formalized and more productive �rms (though this requires assuming that non-�lers were not pro�t maximizing).
24

show that the percentage point increase in the rate of income tax �ling is greater for �rms covered
by third-party information (21 p.p.) than for �rms not covered (15 p.p.), the proportional e�ect
is greater for �rms not covered by third-party information. Their treatment group �ling rate is
380% greater than the control group, compared with 180% for information-covered �rms. The
same qualitative di�erence between the percentage point increase and the proportional e�ect holds
when considering treatment impact on the rate of payment, the payment amount, and the rate
of deregistration. Only the response in terms of information reporting is proportionally larger for
information-covered �rms. The large proportional e�ects among �rms not covered by a paper trail
are somewhat surprising, but can be explained by the low baseline (and control group) compliance
rates.36 Regardless, policymakers striving to increase revenue should target information-covered
�rms �rst, as their absolute payment response is an order of magnitude larger than the response
among non-covered �rms.
Zooming in on �rms covered by third-party information, Table 8 shows that treatment e�ect
heterogeneity with respect to the extent of information coverage is also complex. The �ling rate
responds less strongly to the treatment for �rms with larger amounts of third-party reported sales
(columns 1-3), but these �rms' payment rate responds more strongly, at least to the information
treatment (5-7). The number of di�erent third-party reports is associated with a larger treatment
e�ect for both outcomes (columns 4 and 8).
To ascertain that the heterogeneity by third-party reported sales is not driven by a particular
cuto� choice, we also report the compliance outcomes by deciles of third-party information in Figure
3. The results are similar when using deciles of the maximum of self-reported sales in year t− 1 (or
the most recent year available) and third-party reported sales in t. The exercise is thus equivalent
to examining treatment e�ects by �rm size as measured in sales.37 We �nd that the treatment
e�ect on �ling is driven by seemingly smaller �rms, with larger �rms being signi�cantly more likely
to declare even when in the control group, whereas the treatment e�ect on payment is driven by
36The fact that baseline compliance is higher among information-covered �rms but the proportional treatmente�ects are larger among �rms not covered by third-party information suggests that enforcement and third-partyinformation are substitutes when it comes to tax compliance at the extensive margin. This contrasts with the �ndingby Almunia and Lopez-Rodriguez (2015) that information trails and monitoring e�ort are complements, althoughthey focus on �rm bunching below revenue thresholds�an intensive-margin response.
37We can also estimate �rm size for �rms without third-party information, taking reported sales from the mostrecent available income tax declaration, but this measure is available only for a subset of �rms and is more noisy, asmany �rms have not �led for several consecutive years. This, combined with the smaller absolute treatment e�ectsin the sample of �rms without third-party information makes it di�cult to examine treatment heterogeneity amongthese �rms.
25
larger �rms. This is consistent with the fact smaller �rms, especially the self-employed, may declare
without making a payment (due to being below the exemption threshold or deducting su�ciently
high advance payments or tax withheld), and large �rms are more likely to incur a positive tax
liability. The intervention thus enhanced compliance along the �rm-size distribution, but derived
its revenue e�ect from larger �rms.38
4.5.2 By Other Firm Characteristics
Other �rm characteristics along which the treatment e�ect may vary include �rm type, as corpora-
tions and the self-employed are taxed under di�erent tax schedules, location in the capital city, and
past compliance record. Table 9 considers heterogeneity along these lines for �rms with third-party
information in Panel A and for �rms without such information in Panel B. Unsurprisingly, given
the lack of an exemption in their tax schedule, the �ling rate of corporations compared to the self-
employed responds less strongly but their payment rate responds more strongly to the treatment
(columns 1 and 6). There is no heterogeneity in treatment e�ect along this line on the likelihood of
�ling by �rms without third-party information (Panel A, column 1). Firm location in the capital
city is associated with a marginally stronger treatment e�ect in only one out of the four estimations
(columns 2 and 7). Past compliance in the form of �ling and payment of the income tax in 2013, and
�ling of sales tax, strongly predicts a larger treatment e�ect, as would be expected. This is the case
for both compliance outcomes and both sub-samples (with the exception of sales tax compliance
which is negatively correlated with the treatment e�ect on �ling among information-covered �rms).
When targeting their intervention, it is thus advisable for the tax authority to take into account a
�rm's degree of third-party information coverage, its �rm type, and its past compliance record.
4.6 Mechanisms
Before concluding our study, it is appropriate to examine the mechanisms of the large treatment
e�ects on tax payment for �rms covered by third-party information. Treatment more than doubled
the rate of payment and approximately doubled the amount of payment, with larger e�ects for the
information treatment. These large e�ects contrast with other studies using third-party information
to enhance compliance on the intensive margin. These studies �nd that �rms respond to an increase
38With the caveat of low precision, we �nd that the e�ect of the treatment on submitting an informative declarationdoes not di�er by �rm size (the likelihood of complying on this margin increases with �rms size for both the treatmentand control group), and the treatment e�ect on deregistration is concentrated among smaller �rms.
26

in third-party reported sales by increasing both their sales and costs, thus minimizing any increase
in reported pro�ts and taxes paid (Carrillo, Pomeranz, and Singhal, 2016 and Slemrod et al. 2015).
The challenge in our study is that treatment both increased the �ling rate and potentially altered
reported liabilities conditional on �ling.
We start by comparing third-party reported sales, self-reported sales, and self-reported costs non-
parametrically, as in Carrillo, Pomeranz, and Singhal (2016). Figure 4 shows that self-reported sales
increase less than one-for-one with third-party reported sales (Panel A), although self-reported sales
are on average about 30% higher than third-party reported sales. It thus does not seem to be the case
that �rms under-estimate third-party reports and match reported sales to an amount lower than true
third-party reports. This result supports the use of examples rather than amounts of third-party
information in the information treatment. However, the average �rm matches declared sales very
closely with declared costs (Panel B). Controlling for covariates, Table 10 shows the impact of the
two treatments on declared sales, costs, and pro�ts, measuring these variables with an indicator for
positive amounts, an indicator for amounts larger than third-party reports, or in logs (in absolute
amounts for pro�ts as these can be negative). The results are tentative, but suggest that the
information treatment generated a signi�cantly larger increase in reported sales than the baseline
treatment (columns 1-3), but only a marginally larger increase in reported costs (columns 4-6).
Firms receiving the information treatment thus increased reported sales by more than other treated
�rms, and did not fully o�set this through cost increases. As a result, the likelihood of reporting
a positive pro�t was signi�cantly higher among �rms receiving the information treatment than
among �rms receiving the baseline treatment (column 7). While this evidence remains suggestive,
it is consistent with the possibility that the information treatment generated an improvement in
�rm reporting behavior conditional on income tax �ling.39
4.7 Cost-Bene�t Analysis
We conclude with a cost-bene�t analysis, considering the cost of the intervention and the increase
in tax revenue it generates. The primary cost to the tax authority is the human resource cost of
sending the personalized emails and responding to taxpayer inquiries. The authority reports that
the sending of the emails was executed in seven and a half days by 32 tax o�cers, paid at about
39Results are similar when conditioning on �ling, with the obvious caveat that the comparison across treatmentsis then no longer experimental.
27
CRC 36,700 a day.40 We assume that each o�cers spent at most an additional �ve days answering
taxpayes' inquiries. This generates a total cost of CRC 14.7 million (US$ 27,000). To draw the most
conservative conclusion possible, we take this cost into account, although other studies implicitly
assume that the opportunity cost of time for the tax o�cers is zero.41
The direct bene�ts are measured by the increase in tax payment from treated �rms. Among
�rms covered by third-party information, the baseline email increased �rms' income tax payments
by CRC 8,168 (US$ 15), on average, 15 weeks after the start of the experiment, while an email that
lists speci�c examples of information known to the tax authority increased payment by CRC 10,192
(US$ 19). The e�ect on payment at 15 weeks was smaller for �rms not covered by third-party
information, for whom the email increases payment by CRC 215 (US$ 0.39). In total, we estimate
that the emails increased income tax revenue by CRC 82.2 million, or US$ 151,000. Of this amount,
CRC 76.9 million came from emails sent to information-covered �rms. Sending the strongest email,
which listed speci�c examples of third-party information, to all information-covered �rms, would
have generated an additional CRC 50.7 million, or US$ 93,000 in revenue. We do not include in
our calculation the impact on income tax payment for prior or future years, as we can detect a
statistically signi�cant e�ect only on the propensity to make a payment for these periods, but do
�nd a statistically signi�cant point estimate for the payment amount increase.
Although the additional revenue generated by the experiment constitutes less than .1% of total
income tax revenue, the intervention was highly cost-e�ective, with a cost-bene�t ratio of about
1:542, and serves the broader purpose of sustaining voluntary compliance by detecting and following
up on non-compliers. As we have shown, the intervention had positive indirect e�ects in terms
of enhancing compliance with information reporting requirements, which facilitate future tax en-
forcement, and in terms of better medium term compliance for treated �rms that update their
beliefs about tax enforcement. These e�ects could potentially generate compliance spillovers on
non-treated �rms.
Beyond revenue considerations, the intervention improves horizontal equity of taxation by en-
hancing compliance among relatively small �rms, and could thus improve tax morale and the per-
40Fixed cost already incurred include the cost of maintaining the taxpayer and third-party reporting database.41We further assume that the administrative costs of �ling for taxpayers are small, which is appropriate given the
simplicity of the tax code and the online �ling system.42It is not necessarily the case that the intervention is less cost-e�ective for �rms without third-party information,
as the latter sample yields a smaller return, but also generates a lower administrative cost in terms of taxpayerinquiries. Unfortunately, breaking down the administrative cost into the cost for each intervention is not possible.
28

ception of fairness of the tax system. In addition, the new information generated through �rms'
self reports and third-party reports give the government a broader view of the economy and hence
a better basis for policy design.
5 Conclusion
This paper has argued that non-�ling among tax registered �rms constitutes an important and
under-researched compliance gap in low income countries, that can be addressed cost-e�ectively.
In Costa Rica, approximately 25% of tax registered �rms do not �le their income tax declaration
in a given year, and this share is similar in other countries in the Latin America region. We
evaluate a nation-wide communication campaign in which the tax authority in Costa Rica requested
non-�ling �rms by email to �le their income tax declaration. The emails featured strong but
credible deterrence messages, integrated behavioral insights and leveraged third-party reports about
taxpayers' business activities. We �nd that the emails tripled the �ling rate and doubled the payment
rate among previous non-�lers�treatment e�ects that are substantially larger than those found in
much of the existing literature, and that further increase when emails speci�cally mention examples
of third-party reported sales. The return on an email was US$ 19 for �rms covered by third-party
information, but only US$ .39 for �rms not covered by third-party information.
We extend the literature on communication interventions to reduce compliance gaps by con-
sidering a large variety of outcomes, all measured through �rm-level administrative tax records.
We show that the emails generated no negative spillovers on sales tax compliance. They slightly
increased the deregistration rate, but they also increased the likelihood of �ling third-party reports
about clients or suppliers, and income tax �ling in the year prior to and following the year of the
intervention. This �nding of a persistent treatment e�ect, which applies to income tax �ling and
payment and the �ling of third-party reports, suggests that the intervention permanently raised
�rms' perceived enforcement probability and hence their compliance level.
Although the intervention increased total tax revenue by less than a fraction of a percent, the
intervention was highly cost-e�ective and can thus be seen as a simple and sustainable way to widen
the tax net. It may also generate positive compliance spillovers in the future, through the increased
availability of third-party reports on �rms' business activities. Whether the tax authority should
allocate human resources to this intervention, or to audits, desk audits or follow-up on late-payers
29

depends of course on the elasticity of revenue to these di�erent enforcement activities (Keen and
Slemrod 2016).
30

References
Almunia, Miguel and David Lopez-Rodriguez. 2015. �Under The Radar: The E�ects of Monitoring
Firms on Tax Compliance.� Unpublished manuscript.
Besley, Timothy and Torsten Persson. 2013. �Taxation and Development.� In Handbook of Public
Economics, vol. 5, edited by Alan J Auerbach, Raj Chetty, Martin Feldstein, and Emmanuel
Saez. Newnes.
Best, Michael Carlos, Anne Brockmeyer, Henrik Jacobsen Kleven, Johannes Spinnewijn, and Mazhar
Waseem. 2015. �Production versus Revenue E�ciency with Limited Tax Capacity: Theory and
Evidence from Pakistan.� Journal of Political Economy 123 (6):1311�1355.
BIT. 2014. �EAST: Four Simple Ways to Apply Behavioral Insights.� London: Behavioural Insights
Team.
���. 2015. �The Behavioural Insights Team Update Report 2013�2015.� London: Behavioural
Insights Team.
Brockmeyer, Anne and Marco Hernandez. 2016. �Taxation, Information, andWithholding: Evidence
from Costa Rica.� Unpublished manuscript.
Bruhn, Miriam and David McKenzie. 2013. �Using Administrative Data to Evaluate Municipal
Reforms: An Evaluation of the Impact of Minas Fácil Expresso.� Journal of Development E�ec-
tiveness 5 (3):319�338.
���. 2014. �Entry Regulation and Formalization of Microenterprises in Developing Countries.�
World Bank Research Observer 29 (2).
Carrillo, Paul, Dina Pomeranz, and Monica Singhal. 2016. �Dodging the Taxman: FirmMisreporting
and Limits to Tax Enforcement.�
Castro, Lucio and Carlos Scartascini. 2015. �Tax Compliance and Enforcement in the Pampas
Evidence from a Field Experiment.� Journal of Economic Behavior & Organization 116:65�82.
CR Ministry of Finance. 2015. URL http://www.hacienda.go.cr/contenido/
12840-detalle-de-los-principales-ingresos-del-gobierno-central.
De Andrade, Gustavo Henrique, Miriam Bruhn, and David McKenzie. 2014. �A Helping Hand or
the Long Arm of the Law? Experimental Evidence on What Governments Can Do to Formalize
Firms.� The World Bank Economic Review, �rst published online October 23, 2014.
de Mel, Suresh, David McKenzie, and Christopher Woodru�. 2013. �The Demand for, and Con-
sequences of, Formalization among Informal Firms in Sri Lanka.� American Economic Journal:
Applied Economics 5 (2):122�50.
Del Carpio, Lucia. 2014. �Are the Neighbors Cheating? Evidence from a Social Norm Experiment
on Property Taxes in Peru.� Unpublished manuscript.
31

Dwenger, Nadja, Henrik Kleven, Imran Rasul, and Johannes Rincke. 2016. �Extrinsic and Intrinsic
Motivations for Tax Compliance: Evidence from a Field Experiment in Germany.� American
Economic Journal: Economic Policy forthcoming.
Fellner, Gerlinde, Rupert Sausgruber, and Christian Traxler. 2013. �Testing Enforcement Strategies
in the Field: Threat, Moral Appeal and Social Information.� Journal of the European Economic
Association 11 (3):634�660.
Gabaix, Xavier and David Laibson. 2005. �Shrouded Attributes, Consumer Myopia, and Information
Suppression in Competitive Markets.� NBER Working Paper No. 11755.
Gordon, Roger and Wei Li. 2009. �Tax Structures in Developing Countries: Many Puzzles and a
Possible Explanation.� Journal of Public Economics 93 (7-8):855�866.
Hallsworth, Michael. 2014. �The Use of Field Experiments to Increase Tax Compliance.� Oxford
Review of Economic Policy 30 (4):658�679.
Hallsworth, Michael, John List, Robert Metcalfe, and Ivo Vlaev. 2014. �The Behavioralist As Tax
Collector: Using Natural Field Experiments to Enhance Tax Compliance.� NBER Working Paper
No. 20007.
Haynes, Laura C, Donald P Green, Rory Gallagher, Peter John, and David J Torgerson. 2013.
�Collection of Delinquent Fines: An Adaptive Randomized Trial to Assess the E�ectiveness of
Alternative Text Messages.� Journal of Policy Analysis and Management 32 (4):718�730.
Keen, Michael and Joel Slemrod. 2016. �Optimal Tax Administration.� Working Paper 22408,
National Bureau of Economic Research. URL http://www.nber.org/papers/w22408.
Kettle, Stewart, Marco Hernandez, Simon Ruda, and Michael Sanders. 2016. �Behavioral Inter-
ventions in Tax Compliance: Evidence from Guatemala.� World Bank Policy Research Working
Paper No. 7690.
Kleven, Henrik Jacobsen, Martin B Knudsen, Claus Thustrup Kreiner, Søren Pedersen, and Em-
manuel Saez. 2011. �Unwilling or unable to cheat? Evidence from a tax audit experiment in
Denmark.� Econometrica 79 (3):651�692.
Kleven, Henrik Jacobsen, Claus Thustrup Kreiner, and Emmanuel Saez. 2015. �Why Can Modern
Governments Tax So Much? An Agency Model of Firms as Fiscal Intermediaries.� Unpublished
manuscript.
McKenzie, David and Yaye Seynabou Sakho. 2010. �Does It Pay Firms to Register for Taxes? The
Impact of Formality on Firm Pro�tability.� Journal of Development Economics 91 (1):15�24.
Naritomi, Joana. 2015. �Consumers as Tax Auditors.� Unpublished manuscript.
Ortega, Daniel and Carlos Scartascini. 2015. �Don't Blame the Messenger: A Field Experiment on
Delivery Methods for Increasing Tax Compliance.� IDB Working Paper.
32

Oviedo, Ana Maria, Susana M. Sanchez, Kathy A. Lindert, and J. Humberto Lopez. 2015. �Costa
Rica's Development: From Good to Better.� Washington, DC: The World Bank.
Perez-Truglia, Ricardo and Ugo Troiano. 2016. �Shaming Tax Delinquents: Evidence from a Field
Experiment in the United States.� Available at SSRN: http://ssrn.com/abstract=2558115.
Pomeranz, Dina. 2015. �No Taxation without Information: Deterrence and Self-Enforcement in the
Value Added Tax.� American Economic Review 105 (8):2539�69.
Santos Silva, JMC and Silvana Tenreyro. 2006. �The Log of Gravity.� The Review of Economics
and Statistics 88 (4):641�658.
Skinner, Jonathan and Joel Slemrod. 1985. �An Economic Perspective on Tax Evasion.� National
Tax Journal 38 (3):345�53.
Slemrod, Joel, Marsha Blumenthal, and Charles Christian. 2001. �Taxpayer Response to an In-
creased Probability of Audit: Evidence from a Controlled Experiment in Minnesota.� Journal of
Public Economics 79 (3):455�483.
Slemrod, Joel, Brett Collins, Je�rey Hoopes, Daniel Reck, and Michael Sebastiani. 2015. �Does
Credit-Card Information Reporting Improve Small-Business Tax Compliance?� NBER Working
Paper No. 21412.
Wenzel, Michael. 2005. �Misperceptions of Social Norms About Tax Compliance: From Theory to
Intervention.� Journal of Economic Psychology 26 (6):862�883.
33

Figure 1: Share of Non-Filers by Firm and Tax Type, 2014
25.2
18.8
11.8 11.7
14.4
18.9
1.9 1.3
05
1015
2025
Perc
ent
Income Tax Income Tax (TPI) Sales Tax Sales Tax (TPI)
CorporationsSelf-Employed
Note: This �gure shows the share of non-�lers for the income tax (�rst four bars) and the sales tax (second four bars),distinguishing corporations (dark bars) and the self-employed (light bars). The bar titles indicate whether the bar refers to thefull sample (red bars), or the sub-sample of �rms covered by at least one type of third party information (reports from other�rms, state institutions, or credit/debit card companies) (blue bars). The estimates are for 2014 and are calculated using theauthority's list of non-�lers (based on all available data) and the database of income tax and sales tax declarations submittedfor 2014.
Table 1: Experiment Timeline
Extraction of non-�lers list (N = 49, 757) February 15
Emails to taxpayers with third-party information (N = 12, 515) March 4�10
No message control groupT1: Baseline email
T2: Information email (mentions amount of largest third-party information report)
Emails to taxpayers without third-party information (N = 37, 242) April 7�23
No message control groupT1: Baseline email
T2: Information email (emphasizes tax authority's use of third-party information)
34

Table 2: Balance of Randomization, Firm Characteristics
Firms with Third-Party Information (Experiment 1) Firms without Third-Party Information (Experiment 2)
(1) (2) (3) (4) (5) (6) (7) (8)
ControlT1:
Baselineemail
T2:Information
T1=T2=0p-value
ControlT1:
Baselineemail
T2:Information
T1=T2=0p-value
Corporation 0.142 -0.003 -0.004 0.893 0.262 0.011 -0.002 0.238(0.006) (0.008) (0.008) (0.004) (0.008) (0.007)
Has legal representative 0.607 -0.002 0.004 0.882 0.659 0.009 -0.001 0.289(0.008) (0.011) (0.012) (0.005) (0.007) (0.007)
Has second email 0.056 0.001 0.003 0.851 0.054 -0.001 0.002 0.547(0.004) (0.005) (0.005) (0.002) (0.003) (0.003)
Located in San José 0.490 -0.002 0.000 0.975 0.488 0.004 0.004 0.821(0.008) (0.011) (0.011) (0.005) (0.008) (0.007)
Was contacted early 0.117 0.006 -0.002 0.543 0.002 0.000 0.001 0.489(0.005) (0.007) (0.007) (0.000) (0.001) (0.001)
TPI > 2.5 million CRC 0.351 -0.003 -0.021* 0.109(0.008) (0.011) (0.011)
TPI > 6 million CRC 0.185 0.008 -0.009 0.193(0.007) (0.010) (0.009)
Made advance payment in 2014 0.023 0.001 0.000 0.892 0.005 0.001 -0.001 0.188(0.002) (0.003) (0.003) (0.001) (0.001) (0.001)
Filed in 2013 0.329 0.007 -0.005 0.517 0.174 -0.010* -0.007 0.131(0.007) (0.010) (0.011) (0.004) (0.005) (0.005)
Reported net liability > 0 in 2013 0.085 0.000 0.006 0.561 0.016 0.001 0.000 0.873(0.004) (0.006) (0.006) (0.001) (0.002) (0.002)
Made payment in 2013 0.053 -0.002 0.000 0.927 0.011 0.000 -0.000 0.941(0.004) (0.005) (0.005) (0.001) (0.001) (0.001)
Was third-party informant in 2013 0.190 -0.007 -0.012 0.417 0.046 -0.000 -0.002 0.834(0.006) (0.009) (0.009) (0.002) (0.003) (0.003)
Observations 4,128 4,260 4,127 12,350 12,516 12,376
Note: The table shows the balance of randomization in terms of �rm characteristics, as measured before the experiment start. The rows correspondto the di�erent variables. Columns 1-4 (5-8) correspond to the sample of �rms with (without) third-party information, i.e. experiment 1 (2). Column1 (5) displays the mean for the control group, columns 2 and 3 (5 and 7) show the mean di�erence between the control group and treatment groups 1and 2 respectively, and column 4 (8) reports p-values from a test of the hypothesis that the two treatment groups are jointly equal to the control group.Robust standard errors clustered by email address are in parentheses. TPI stands for third-party information (third-party reported sales), meaning thesum of sales reported by clients (D151), state institutions (D150) and credit/debit card companies (D153). The cuto�s of 2.5 million and 6 million CRCcorrespond to the priority group designations used by the tax authority. Signi�cance levels are noted as per convention: * p<.10, ** p<.05, *** p<.01.
35

Table 3: Balance of Randomization, Outcomes at Baseline
Firms with Third-Party Information (Experiment 1) Firms without Third-Party Information (Experiment 2)
(1) (2) (3) (4) (5) (6) (7) (8)
ControlT1:
Baselineemail
T2:Information
T1=T2=0p-value
ControlT1:
Baselineemail
T2:Information
T1=T2=0p-value
Filed 0.057 0.004 0.002 0.742 0.013 0.001 0.000 0.934(0.004) (0.005) (0.005) (0.001) (0.001) (0.002)
Had positive net liability 0.017 0.003 0.002 0.513 0.001 0.001** 0.000 0.089(0.002) (0.003) (0.003) (0.000) (0.000) (0.000)
Made payment 0.008 0.003 0.002 0.373 0.000 0.000 0.000 0.377(0.001) (0.002) (0.002) (0.000) (0.000) (0.000)
Log payment 0.086 0.034 0.018 0.348(0.015) (0.024) (0.023)
Was third-party informant 0.164 -0.003 -0.007 0.710 0.012 0.000 0.001 0.761(0.006) (0.008) (0.008) (0.001) (0.001) (0.001)
No. months decl. sales tax 0.619 -0.040 -0.061 0.501 0.243 -0.025 0.004 0.239(0.038) (0.052) (0.052) (0.013) (0.018) (0.019)
No. months paid sales tax 0.126 -0.023 -0.026 0.390 0.015 0.006 0.004 0.260(0.015) (0.020) (0.020) (0.002) (0.004) (0.004)
Sales tax payment 108900.860 -75006.413 -64056.208 0.489 736.743 1416.450 245.104 0.641(62816.239) (64536.416) (65884.055) (207.981) (1728.289) (483.252)
Deregistered 0.004 -0.001 0.000 0.615 0.004 -0.001 -0.001* 0.182(0.001) (0.001) (0.001) (0.001) (0.001) (0.001)
Deregistered (sales tax) 0.001 -0.000 -0.000 0.876 0.001 -0.000 -0.000 0.258(0.000) (0.001) (0.001) (0.000) (0.000) (0.000)
Switched to simpli�ed tax regime 0.000 -0.000 -0.000 0.317(0.000) (0.000) (0.000)
Observations 4,128 4,260 4,127 12,350 12,516 12,376
Note: The table shows the balance of randomization in terms of outcomes, as measured before the experiment start. The rows correspond to the di�erentvariables for �scal year 2014. The number of months that a taxpayer �led and paid sales tax, and the sales tax payment are calculated over July 2013until June 2014. Columns 1-4 (5-8) correspond to the sample of �rms with (without) third-party information, i.e. experiment 1 (2). Column 1 (5)displays the mean for the control group, columns 2 and 3 (5 and 7) show the mean di�erence between the control group and treatment groups 1 and2 respectively, and column 4 (8) reports p-values from a test of the hypothesis that the two treatment groups are jointly equal to the control group.Robust standard errors clustered by email address are in parentheses. Signi�cance levels are noted as per convention: * p<.10, ** p<.05, *** p<.01.
36

Figure 2: Compliance Over Time by Information Coverage and Treatment Group
A: Firms with Third-Party Information B: Firms without Third-Party Information
A1: Filing Rate
11.5
32.5*** 34.2***†
0
10
20
30
40
Perc
ent
-5 5 10 15Start date: 4 MarWeeks
Control Baseline Email Information Email
B1: Filing Rate
3.9
18.8*** 18.7***
0
5
10
15
20
Perc
ent
-10 -5 5 10 15Start date: 7 AprWeeks
Control Baseline Email Information Email
A2: Payment Rate
1.7
4.7***
5.3***
0
2
4
6
Perc
ent
-5 5 10 15Start date: 4 MarWeeks
Control Baseline Email Information Email
B1: Payment Rate
0.13
0.60*** 0.55***
0
.2
.4
.6Pe
rcen
t
-10 -5 5 10 15Start date: 7 AprWeeks
Control Baseline Email Information Email
A3: Third-Party Informant
17.7
20.3***
22.2***†††
14
16
18
20
22
Perc
ent
-5 5 10 15Start date: 4 MarWeeks
Control Baseline Email Information Email
B3: Third-Party Informant
1.29
1.39
1.56*
1
1.2
1.4
1.6
Perc
ent
-10 -5 5 10 15Start date: 7 AprWeeks
Control Baseline Email Information Email
Note: These �gures show the percentage of �rms �ling income tax (row 1), paying income tax (row 2) and �ling a third-party informative declaration(D151) about a client or supplier (row 3), all for �scal year 2014. Column A corresponds to �rms with third-party information and column B correspondsto �rms without third-party information. The horizontal line in each �gure indicates the experiment start date. The black solid line corresponds to thecontrol group and the blue/red dashed/dotted lines correspond to the baseline treatment and information treatment respectively for the two di�erentsubsamples, as explained in experiment design Table 1. The numbers indicate the mean for each outcome and treatment group at 15 weeks after the startof the experiment. Stars indicate a signi�cant di�erence compared to the control group and come from regressions that include controls (as in Table 4,Table 5, and Table 6). Signi�cance levels are noted as per convention: * p<.10, ** p<.05, *** p<.01. Daggers indicate signi�cant di�erences between thetwo treatments.
37

Table 4: Impact on Income Tax Compliance, Firms with Third-Party Information
Probit OLS PPML
(1) (2) (3) (4) (5)
FiledPositive netliability
Positivepayment
Logpayment
Payment
T1: Baseline email 0.213*** 0.046*** 0.031*** 0.340*** 8,167.736***(0.009) (0.005) (0.004) (0.043) (2,394.801)
T2: Information email 0.232***� 0.054*** 0.038*** 0.411*** 10,191.998***(0.009) (0.005) (0.004) (0.044) (2,712.887)
Corporation -0.005 0.033*** 0.007 0.104 6,334.570*(0.015) (0.008) (0.006) (0.099) (3,392.022)
Has legal representative -0.000 -0.002 0.002 0.042 3,364.378(0.008) (0.004) (0.004) (0.038) (2,530.740)
Has second email 0.045** -0.000 0.007 0.169 2,259.939(0.021) (0.008) (0.008) (0.151) (3,425.219)
Located in San José 0.009 -0.003 0.003 0.059 7,366.114***(0.008) (0.004) (0.003) (0.039) (2,202.358)
TPI > 2.5 million CRC 0.065*** 0.052*** 0.032*** 0.294*** 6,911.006***(0.011) (0.006) (0.005) (0.056) (2,639.431)
TPI > 6 million CRC 0.013 0.042*** 0.016*** 0.365*** 14,807.488***(0.014) (0.008) (0.006) (0.093) (3,628.608)
Made advance payment for 2014 0.122*** 0.051*** 0.049*** 1.292*** 6,384.847*(0.030) (0.016) (0.014) (0.304) (3,732.480)
Filed in 2013 0.105*** 0.004 0.005 0.003 -6,565.205(0.010) (0.006) (0.005) (0.051) (5,190.648)
Reported net liability > 0 in 2013 -0.057*** 0.072*** -0.008 -0.216* -9,026.498(0.019) (0.015) (0.008) (0.126) (7,612.882)
Made payment in 2013 0.095*** 0.023* 0.106*** 1.681*** 76,309.211**(0.029) (0.012) (0.026) (0.219) (31,830.381)
Was third-party informant in 2013 0.046*** 0.004 -0.007 -0.075 4,738.215*(0.012) (0.006) (0.005) (0.075) (2,804.348)
Constant -0.143***(0.040)
Control group avg. 0.115 0.0339 0.0172 0.194 5015.8T1=T2 p-value (Wald test) 0.062 0.135 0.145 0.177 0.510Observations 12,515 12,515 12,515 12,515 12,515
Note: This table displays estimates of probit, OLS and PPML estimations as explained in Section 4.1, using the control variables notedin the table rows. The columns display the outcome variables: dummies for whether the �rm �led income tax for 2014, reported apositive net liability and made a payment (considering only �nal payments made with the declaration and not advance payments thatmay have been made earlier), and the (log) payment amount. All outcomes are measured 15 weeks after the start of the experiment.Robust standard errors clustered by email address are in parentheses. Average partial e�ects are reported for probit and PPML. Paymentamounts are winsorized at the top 0.1% to reduce the in�uence of outliers. TPI stands for third-party information (third-party reportedsales), meaning the sum of sales reported by clients (D151), state institutions (D150) and credit/debit card companies (D153). Thecuto�s of 2.5 million and 6 million CRC correspond to the priority group designations used by the tax authority. Signi�cance levelsare noted as per convention: * p<.10, ** p<.05, *** p<.01. Daggers indicate signi�cant di�erences between the two treatments.
38

Table 5: Impact on Income Tax Compliance, Firms without Third-Party Information
Probit OLS PPML
(1) (2) (3) (4) (5)
FiledPositive netliability
Positivepayment
Logpayment
Payment
T1: Baseline email 0.150*** 0.006*** 0.005*** 0.050*** 262.430***(0.004) (0.001) (0.001) (0.008) (59.096)
T2: Information email 0.149*** 0.006*** 0.004*** 0.041*** 166.064***(0.004) (0.001) (0.001) (0.008) (52.392)
Corporation -0.013*** 0.002* 0.002 0.017 177.133**(0.005) (0.001) (0.001) (0.010) (73.143)
Has legal representative -0.000 0.001 -0.000 0.003 103.848**(0.004) (0.001) (0.001) (0.007) (49.538)
Has second email 0.027*** 0.001 0.002 0.033 98.140(0.009) (0.002) (0.002) (0.025) (105.699)
Located in San José -0.002 -0.001 -0.001 -0.011 -60.903(0.004) (0.001) (0.001) (0.007) (50.039)
Made advance payment for 2014 0.075*** 0.014* 0.003 0.153 151.766(0.028) (0.007) (0.004) (0.156) (171.565)
Filed in 2013 0.132*** 0.002* 0.001 0.006 -3.763(0.006) (0.001) (0.001) (0.013) (92.633)
Reported net liability > 0 in 2013 -0.009 0.032*** -0.003 -0.048 -315.752(0.020) (0.012) (0.004) (0.078) (426.717)
Made payment in 2013 0.031 0.006 0.086 0.801*** 13,505.357(0.028) (0.005) (0.082) (0.176) (21,428.248)
Was third-party informant in 2013 0.015* 0.002 0.001 0.016 75.884(0.009) (0.002) (0.002) (0.036) (143.009)
Constant 0.001(0.006)
Control group avg. 0.0393 0.00178 0.00130 0.0142 96.15T1=T2 p-value (Wald test) 0.807 0.617 0.613 0.397 0.160Observations 37,242 37,242 37,242 37,242 37,242
Note: This table displays estimates of probit, OLS and PPML estimations as explained in Section 4.1, using the control variables notedin the table rows. The notes to Table 4 apply.
39

Table 6: Impact on Other Compliance Outcomes
Probit OLS PPML Probit
(1) (2) (3) (4) (5) (6) (7) (8) (9) (10) (11)Presentedinformativedeclaration
Reportedsupplier
Reportedclient
No. monthsdecl. sales
tax
No. monthspaid sales
tax
Sales taxpayment
DeregisteredDeregistered(sales tax)
Switched tosimpli�edregime
Declaredincome taxfor 2013
Paidincome taxfor 2013
A: Firms with Third-Party Information
T1: Baseline email 0.029*** 0.004 0.028*** -0.038 -0.023 -9,902.181 0.011*** 0.000 0.000 0.031***� 0.002(0.008) (0.006) (0.007) (0.050) (0.021) (7,588.325) (0.003) (0.001) (0.000) (0.004) (0.001)
T2: Information email 0.055***��� 0.010* 0.048***�� -0.040 -0.022 -4,894.750 0.011*** -0.000 0.000 0.023*** 0.003*(0.008) (0.006) (0.008) (0.049) (0.020) (8,276.246) (0.003) (0.001) (0.000) (0.004) (0.002)
TPI > 2.5 million CRC 0.087*** 0.024*** 0.080*** -0.060 -0.021 4,616.031 0.003 -0.000 0.000 0.017*** -0.000(0.010) (0.007) (0.009) (0.052) (0.019) (14,514.704) (0.003) (0.001) (0.000) (0.005) (0.002)
TPI > 6 million CRC 0.067*** 0.061*** 0.072*** 0.551*** 0.166*** 25,176.254*** -0.012*** -0.002 -0.001** 0.007 0.006*(0.012) (0.009) (0.011) (0.088) (0.035) (9,631.292) (0.003) (0.001) (0.000) (0.006) (0.003)
Other controls Yes Yes Yes Yes Yes Yes Yes Yes Yes Yes Yes
Control group avg. 0.177 0.0928 0.128 0.637 0.133 29095.0 0.00921 0.00218 0.000242 0.350 0.0572T1=T2 p-value (Wald test) 0.003 0.274 0.013 0.969 0.989 0.461 0.830 0.563 0.975 0.061 0.690Observations 12,515 12,515 12,515 12,515 12,515 12,515 12,515 12,515 12,515 12,515 12,515
B: Firms without Third-Party Information
T: Any email 0.002 0.000 0.002** 0.000 0.006* 24.853 0.020*** 0.001 0.000** 0.049*** 0.001***(0.001) (0.001) (0.001) (0.016) (0.004) (76.896) (0.001) (0.001) (0.000) (0.002) (0.000)
Other controls Yes Yes Yes Yes Yes Yes Yes Yes Yes Yes Yes
Control group avg. 0.0129 0.00939 0.00437 0.255 0.0159 357.5 0.0121 0.00316 0.000162 0.189 0.0109Observations 37,242 37,242 37,242 37,242 37,242 37,242 37,242 37,242 37,242 37,242 37,242
Note: This table displays estimates of probit, OLS and PPML estimations as explained in Section 4.1. Panel A corresponds to �rms with third-party information, using the samecontrols as in Table 4, and Panel B corresponds to �rms without third-party information, using the same controls as in Table 5. The columns display the outcome variables, whichrefer to compliance for �scal year 2014 unless otherwise noted. All outcomes are measured 15 weeks after the start of the experiment. Robust standard errors clustered by emailaddress are in parentheses. Average partial e�ects are reported for probit and PPML. Sales tax payment amounts are winsorized at the top 0.1% to reduce the in�uence of outliers.TPI stands for third-party information (third-party reported sales), meaning the sum of sales reported by clients (D151), state institutions (D150) and credit/debit card companies(D153). The cuto�s of 2.5 million and 6 million CRC correspond to the priority group designations used by the tax authority. Signi�cance levels are noted as per convention: *p<.10, ** p<.05, *** p<.01. Daggers indicate signi�cant di�erences between the two treatments.

Table 7: Medium-Term Impact on Compliance Outcomes and Third-Party Reports in 2015
Firms with Third-Party Information Firms without Third-Party Information
(1) (2) (3) (4) (5) (6) (7) (8) (9)
Filedincome tax
Paidincome tax
Reportedclient orsupplier
Reportedby stateinstitution
Reportedby privateclient orsuppier
Reportedby cardcompany
Filedincome tax
Paidincome tax
Reportedclient orsupplier
T: Any email 0.0649*** 0.00963** 0.0225*** 0.0732*** 0.00216* 0.00639***(0.00893) (0.00417) (0.00716) (0.00419) (0.00118) (0.00219)
T1: Baseline email -0.00290 -0.00927 0.00615(0.00419) (0.0101) (0.00640)
T2: Information email -0.00265 -0.00435 0.000659(0.00423) (0.0103) (0.00634)
TPI > 2.5 million CRC 0.102*** 0.0444*** 0.109*** 0.0320*** 0.0968*** -0.0155**(0.0122) (0.00624) (0.0105) (0.00520) (0.0113) (0.00743)
TPI > 6 million CRC 0.00894 0.0187*** 0.0583*** 0.0217*** 0.0989*** 0.0353***(0.0152) (0.00696) (0.0126) (0.00601) (0.0141) (0.0109)
Control group avg. 0.351 0.0523 0.203 0.0407 0.691 0.0916 0.159 0.0113 0.0398T1=T2 p-value (Wald test) 0.952 0.631 0.393Observations 12,515 12,515 12,515 12,515 12,515 12,515 37,242 37,242 37,242
Note: This table displays estimates of probit estimations, with dummy outcome variables as denoted in the column titles, measured in June 2016. Panel A corresponds to �rmswith third-party information, using the same controls as in Table 4, and Panel B corresponds to �rms without third-party information, using the same controls as in Table 5. Thetreatment groups are pooled into one treatment dummy. The reported coe�cients are average partial e�ects, and robust standard errors clustered by email address are in parentheses.TPI stands for third-party information (third-party reported sales), meaning the sum of sales reported by clients (D151), state institutions (D150) and credit/debit card companies(D153). The cuto�s of 2.5 million and 6 million CRC correspond to the priority group designations used by the tax authority. Signi�cance levels are noted as per convention: *p<.10, ** p<.05, *** p<.01. Daggers indicate signi�cant di�erences between the two treatments.
41

Table 8: Heterogeneity by Third-Party Information
Outcome: Filed Income Tax for 2014 Outcome: Paid Income Tax for 2014
(1) (2) (3) (4) (5) (6) (7) (8)
Abovemedian TPI
TPI > 2.5millionCRC
TPI > 6millionCRC
No. ofD151
reports byclients
Abovemedian TPI
TPI > 2.5millionCRC
TPI > 6millionCRC
No. ofD151
reports byclients
T1: Baseline email 0.244*** 0.242*** 0.234*** 0.159*** 0.025*** 0.022*** 0.027*** 0.023***(0.011) (0.010) (0.009) (0.020) (0.004) (0.003) (0.003) (0.008)
T2: Information email 0.244*** 0.251*** 0.245*** 0.134*** 0.025*** 0.026*** 0.034*** 0.013*(0.011) (0.010) (0.009) (0.019) (0.004) (0.003) (0.004) (0.007)
Control 0.041*** 0.110*** 0.083*** -0.019 -0.011** 0.009 0.012 -0.001(0.012) (0.014) (0.019) (0.013) (0.005) (0.006) (0.010) (0.005)
T1 X Control -0.065*** -0.089*** -0.123*** 0.070*** 0.010 0.025*** 0.020 0.005(0.017) (0.020) (0.026) (0.023) (0.007) (0.010) (0.014) (0.009)
T2 X Control -0.027 -0.059*** -0.082*** 0.120*** 0.025*** 0.033*** 0.020 0.026***(0.018) (0.020) (0.026) (0.023) (0.008) (0.010) (0.015) (0.009)
Control variable avg. 0.500 0.343 0.184 1.451 0.500 0.343 0.184 1.451T1 = T2 p-value (Wald test) 0.992 0.497 0.335 0.260 0.966 0.296 0.117 0.276T1 + T1 X Control = T2 + T2 X Control 0.012 0.041 0.045 0.083 0.069 0.279 0.681 0.058Observations 12,515 12,515 12,515 12,515 12,515 12,515 12,515 12,515
Note: This table displays estimates of OLS estimations, with dummy outcome variables (measured 15 weeks after the experiment start) as indicated in the panel titles, and interactionsbetween the treatment indicators and di�erent control variables, as indicated by the column titles. The rows display the coe�cents on the two treatments, the control, and theinteractions between each treatment and the control. All regressions are for the sample of �rms with third-party information only, and use the same controls as in Table 4. Robuststandard errors clustered by email address are in parentheses. TPI stands for third-party information (third-party reported sales), meaning the sum of sales reported by clients(D151), state institutions (D150) and credit/debit card companies (D153). The cuto�s of 2.5 million and 6 million CRC correspond to the priority group designations used by thetax authority. Signi�cance levels are noted as per convention: * p<.10, ** p<.05, *** p<.01.
42

Table 9: Heterogeneity by Other Firm Characteristics
Outcome: Declared Income Tax for 2014 Outcome: Paid Income Tax for 2014
(1) (2) (3) (4) (5) (6) (7) (8) (9) (10)
CorporationHQ in San
JoséDeclared in
2013Paid in2013
Declaredsales tax
CorporationHQ in San
JoséDeclared in
2013Paid in2013
Declaredsales tax
A: Firms with Third-Party Information
Any message 0.230*** 0.222*** 0.205*** 0.216*** 0.224*** 0.030*** 0.035*** 0.028*** 0.027*** 0.032***(0.007) (0.010) (0.008) (0.007) (0.007) (0.003) (0.004) (0.003) (0.003) (0.003)
Control 0.036* 0.012 0.073*** 0.047 0.039 -0.014 0.005 -0.010* 0.052** -0.038***(0.020) (0.010) (0.013) (0.038) (0.026) (0.010) (0.004) (0.006) (0.023) (0.009)
Any message X control -0.066*** -0.004 0.045*** 0.091** -0.060* 0.031** -0.002 0.019*** 0.126*** 0.030**(0.023) (0.014) (0.016) (0.038) (0.033) (0.012) (0.006) (0.007) (0.029) (0.014)
Control variable avg. 0.140 0.489 0.330 0.0527 0.0637 0.140 0.489 0.330 0.0527 0.0637Observations 12,515 12,515 12,515 12,515 12,515 12,515 12,515 12,515 12,515 12,515
B: Firms without Third-Party Information
Any message 0.147*** 0.143*** 0.129*** 0.148*** 0.148*** 0.004*** 0.005*** 0.004*** 0.004*** 0.004***(0.004) (0.004) (0.003) (0.003) (0.003) (0.001) (0.001) (0.001) (0.001) (0.001)
Control -0.020*** -0.011*** 0.050*** -0.062 0.000 -0.000 -0.001 -0.001 0.030 0.001(0.004) (0.004) (0.007) (0.039) (0.017) (0.001) (0.001) (0.002) (0.018) (0.003)
Any message X control 0.010 0.015** 0.124*** 0.156*** 0.070*** 0.003* -0.000 0.003 0.067*** 0.007(0.007) (0.006) (0.010) (0.040) (0.026) (0.001) (0.001) (0.002) (0.025) (0.006)
Control variable avg. 0.265 0.491 0.168 0.0107 0.0251 0.265 0.491 0.168 0.0107 0.0251Observations 37,242 37,242 37,242 37,242 37,242 37,242 37,242 37,242 37,242 37,242
Note: This table displays estimates of OLS estimations, with dummy outcome variables (measured 15 weeks after the experiment start) as indicated in the panel titles, and interactionsbetween the treatment indicators and di�erent control variables, as indicated by the column titles. Panel A corresponds to �rms with third-party information, using the same controlsas in Table 4, and Panel B corresponds to �rms without third-party information, using the same controls as in Table 5. The rows display the coe�cents on the treatment dummy(pooling the two treatment groups), the control, and the interactions between the treatment and the control. Robust standard errors clustered by email address are in parentheses.Signi�cance levels are noted as per convention: * p<.10, ** p<.05, *** p<.01.
43

Figure 3: Heterogeneity by Third-Party Information
A: Filing
-10
0
10
20
30
40
50Pe
rcen
t
0 20 40 60 80 100Third-Party Reported Sales (%ile)
TreatmentControl
B: Payment
-5
0
5
10
15
20
Perc
ent
0 20 40 60 80 100Third-Party Reported Sales (%ile)
TreatmentControl
Note: This �gure shows the share of non-�lers that �led an income tax declaration (PanelA) and the share that made an income tax payment (Panel B) for 2014 at 15 weeks afterthe start of the experiment, for �rms with third-party information (experiment 1). Theshares are displayed by ventiles of third-party reported sales for Panel A and by decilesfor Panel B. The blue solid line is for the pooled treatment group and the black solid lineis for the control group, with dashed lines representing the 95% con�dence intervals. Forthe 4th and 5th decile in the control group, not one observation made any payment, sothe average payment rate is zero, and so is the standard deviation. Estimates are similarwhen calculated by bins of the maximum of self-reported sales in year t− 1 (or the mostrecent year available) and third-party reported sales in t.
44
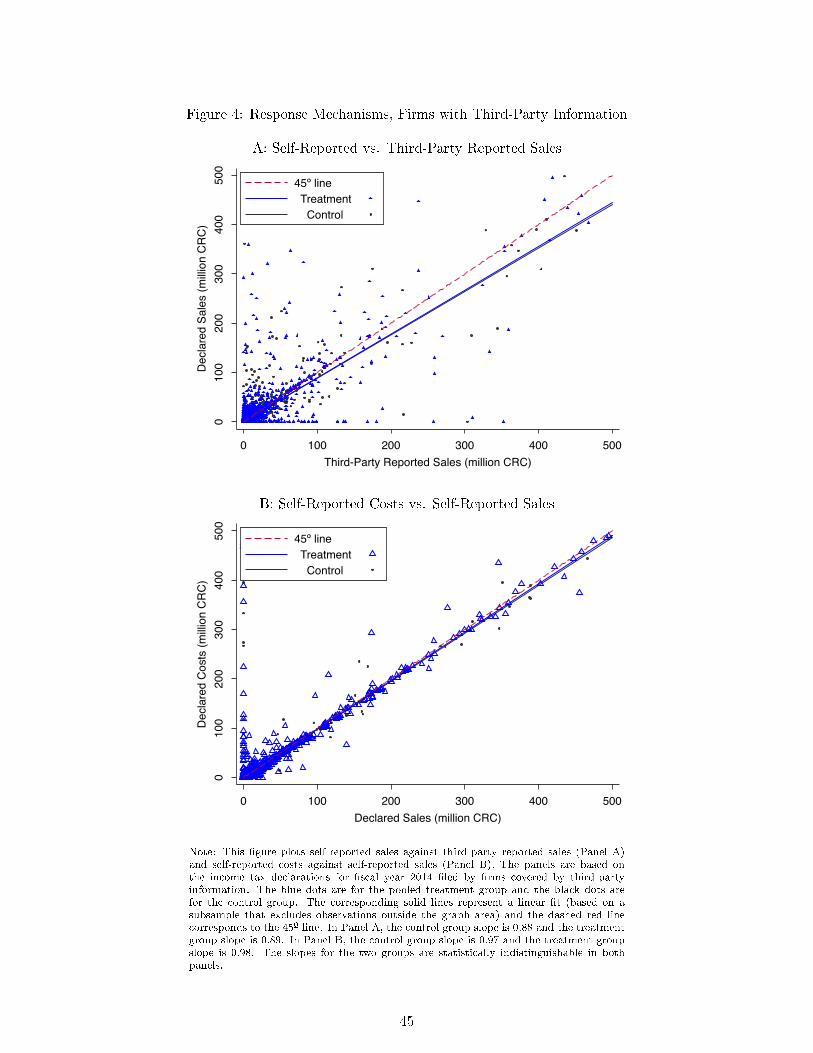
Figure 4: Response Mechanisms, Firms with Third-Party Information
A: Self-Reported vs. Third-Party Reported Sales
010
020
030
040
050
0D
ecla
red
Sale
s (m
illion
CR
C)
0 100 200 300 400 500Third-Party Reported Sales (million CRC)
45º line Treatment Control
B: Self-Reported Costs vs. Self-Reported Sales
010
020
030
040
050
0D
ecla
red
Cos
ts (m
illion
CR
C)
0 100 200 300 400 500Declared Sales (million CRC)
45º line Treatment Control
Note: This �gure plots self-reported sales against third-party reported sales (Panel A)and self-reported costs against self-reported sales (Panel B). The panels are based onthe income tax declarations for �scal year 2014 �led by �rms covered by third-partyinformation. The blue dots are for the pooled treatment group and the black dots arefor the control group. The corresponding solid lines represent a linear �t (based on asubsample that excludes observations outside the graph area) and the dashed red linecorresponds to the 45º line. In Panel A, the control group slope is 0.88 and the treatmentgroup slope is 0.89. In Panel B, the control group slope is 0.97 and the treatment groupslope is 0.98. The slopes for the two groups are statistically indistinguishable in bothpanels.
45

Table 10: Impact on Declared Sales and Costs: Firms with Third-Party Information
Probit OLS Probit OLS Probit OLS
(1) (2) (3) (4) (5) (6) (7) (8)Positivesales
Sales > TPI Log salesPositivecosts
Costs >TPI
Log costsPositivepro�t
Pro�tamount
T1: Baseline email 0.169*** 0.126*** 2.314*** 0.101*** 0.0318*** 1.307*** 0.154*** 179207.9***(0.00915) (0.00857) (0.139) (0.00810) (0.0104) (0.125) (0.00893) (33886.5)
T2: Information email 0.193***�� 0.158***��� 2.607***� 0.116***� 0.0341*** 1.501*** 0.175***�� 175280.3***(0.00929) (0.00885) (0.139) (0.00827) (0.0106) (0.124) (0.00909) (33805.9)
TPI > 2.5 million CRC 0.183*** 0.0919*** 3.022*** 0.228*** 0.0935*** 3.241*** 0.172*** 662066.2***(0.0118) (0.0109) (0.180) (0.0112) (0.0118) (0.167) (0.0115) (37834.5)
TPI > 6 million CRC 0.0891*** 0.00642 2.262*** 0.104*** -0.0160 3.010*** 0.0804*** 717352.7***(0.0148) (0.0129) (0.253) (0.0133) (0.0157) (0.247) (0.0144) (69226.6)
Other controls Yes Yes Yes Yes Yes Yes Yes Yes
Control group avg. 0.205 0.146 3.230 0.177 0.636 2.787 0.183 426815.1T1=T2 p-value (Wald test) 0.025 0.001 0.056 0.082 0.821 0.154 0.037 0.912Observations 12,515 12,515 12,515 12,515 12,515 12,515 12,515 12,515
Note: This table shows estimates from probit and OLS estimations, with dummy outcome variables as indicated by the statements in the columnheadings. Pro�ts are winsorized at the �rst and 99th percentile to reduce the in�uence of outliers. All regressions are for the sample of �rms withthird-party information and include the same controls as in Table 4. Average partial e�ects are reported for probit estimations. Robust standard errorsclustered by email address are in parentheses. TPI stands for third-party information (third-party reported sales), meaning the sum of sales reportedby clients (D151), state institutions (D150) and credit/debit card companies (D153). The cuto�s of 2.5 million and 6 million CRC correspond to thepriority group designations used by the tax authority. Signi�cance levels are noted as per convention: * p<.10, ** p<.05, *** p<.01. Daggers indicatesigni�cant di�erences between the two treatments.
46

Appendix
Figure A1: Email to Firms Covered by Third-Party Information
12""
"
FOR*PAPER*(w/*TPI):*!SUBJECT:!Urgent:!Please!submit!your!tax!return!now!!Attention:!NAME,!!PLEASE*FILE*YOUR*INCOME*TAX*RETURN*IN*THE*NEXT*10*DAYS*!Declare*now*by*visiting:*https://www.haciendadigital.go.cr/tribunet/loginDeclaraciones.jsp*!According! to! our! records,! you! have! not! filed! your! tax! return! (Form!D101).! 8! out! of! 10!Costa!Ricans! have! already! filed! their! 2014! income! tax! return.! You! are! part! of! a! small! minority! of!citizens!who!have!not.!!It!is!a!serious!offense!to!not!file!your!taxes.!!!We!have! thirdUparty! information!confirming! that!you!or!your!client!performed!activities! in!2014!which!require!you!to!pay!taxes.!!!We!have! thirdUparty! information!confirming! that!you!or!your!client!performed!activities! in!2014!which! require! you! to! pay! taxes.! From! thirdUparty! returns! (D150,! D151! and! D153),! we! know!about!your!operations,!for!example:!
•! Revenues*of*at*least*XXX*reported*by*COMPANY,*•! Revenues*from*credit/debit*cards*of*at*least*ZZZ*reported*by*BANK,*•! Sales*or*contracts*with*state*entities*of*at*least*WWW.!
!If!you!do!not!file,!you!could!be!audited!and!your!business!may!be!closed.!Furthermore,!your!name!may!be!published!on!our!website!as!someone!who!did!not!contribute.!!If!you!have!any!questions,!you!can!contact!me!by!PHONE!or!EUMAIL.!I’ll!be!checking!whether!you!respond!to!this!message.!!Sincerely,!!NAME!OF!OFFICIAL!POSITION!"""""""""""
T1:
T2:
Note: Firms in the study received an email with either treatment 1 (T1) or treatment 2 (T2) shown.
47

Figure A2: Email to Firms Not Covered by Third-Party Information
13""
""
FOR*PAPER*(w/o*TPI):*"SUBJECT:!Urgent:!Please!submit!your!tax!return!now!!Attention:!NAME,!!PLEASE*FILE*YOUR*INCOME*TAX*RETURN*IN*THE*NEXT*10*DAYS*!Declare*now*by*visiting:*https://www.haciendadigital.go.cr/tribunet/loginDeclaraciones.jsp*!According! to! our! records,! you! have! not! filed! your! tax! return! (Form!D101).! 8! out! of! 10!Costa!Ricans! have! already! filed! their! 2014! income! tax! return.! You! are! part! of! a! small! minority! of!citizens!who!have!not.!!It!is!a!serious!offense!to!not!file!your!taxes.!!!!!!The!DGT!uses!information!from!thirdUparty!returns!(D150,!D151!and!D153)!to!identify!economic!activity!and!sources!of!income.!!If!you!do!not!file,!you!could!be!audited!and!your!business!may!be!closed.!Furthermore,!your!name!may!be!published!on!our!website!as!someone!who!did!not!contribute.!!If!you!have!any!questions,!you!can!contact!me!by!PHONE!or!EUMAIL.!I!will!be!checking!whether!you!respond!to!this!message.!!Sincerely,!!NAME!OF!OFFICIAL!POSITION!!
T1:
T2:
Note: Firms in the study received an email with either treatment 1 (T1) or treatment 2 (T2) shown.
48

SMS Experiment
In addition to the email experiment presented in this paper, the tax authority implemented a
parallel experiment using SMS reminders. Like the email experiment, the SMS experiment targeted
�rms that registered for income taxes but did not �le. Only �rms that had a cell phone number
but no email address on �le were included in the SMS experiment (N = 30, 844). Firms in the
email experiments did not receive SMS messages. The SMS messages were sent between March
16�26, 2015�around the same time as the email messages. Among the SMS-eligible �rms, 16%
were covered by third-party information, which we control for in our analysis.
One third of SMS-eligible �rms were assigned to a control group, which received no message.
The other �rms were divided between two treatment groups, each �rm receiving one SMS message
limited to 160 characters. Firms assigned to the �rst treatment condition received an SMS message
informing them that if they do not �le, their name may be published on a government website.
This treatment combined public shaming, which has been shown to reduce tax delinquency (Perez-
Truglia and Troiano 2016), with an implicit �call to action,� specifying a consequence if the �rm
does not act:
Treatment 1 (T1):
You have not filed your 2014 income tax return. If you do not file, your
name may be published on our website. Questions XXXX-XXXX extXXX
The second treatment message stated that the tax authority uses third-party information to
identify taxable income. This message did not ask �rms to comply or specify any consequence of
non-compliance:
Treatment 2 (T2):
You have not filed your 2014 income tax return. The tax authority uses
third-party information to identify taxable income. Questions XXXX-XXXX
extXXX
When comparing the treatment e�ects of the two messages, one needs to keep in mind that
the treatments di�er along two dimensions (i.e., public shaming plus implicit call to action, versus
mention of third-party information). For this reason, we emphasize the results of the two email
49

experiments in the paper. While we compare the results of the SMS experiment to the email
experiments, for completeness, it is important to keep in mind that the experiments di�er in terms
of the sample of �rms targeted (sophisticated �rms using email versus unsophisticated �rms, or �rms
that have not updated their records recently), the message content, and the delivery mechanism
(email versus SMS), which has been shown to matter for compliance (Ortega and Scartascini 2015).
Table A1 in this Appendix displays the balance of randomization for the SMS experiment. Table
A2 shows the balance of outcomes measured prior to the start of the experiments. These estimates
are generated by regressing each row variable on a constant and two treatment indicators. Like the
email experiment, the SMS experiment exhibits balance.
Table A3 displays estimates of the e�ect of the SMS messages on income tax compliance mea-
sured at 15 weeks after the start of the experiment. Like the emails, the SMS messages signi�cantly
increase the rate of income tax �ling. However, the absolute and relative increase in the �ling rate is
smaller than the increase from an email. The SMS that threatens public shaming as a consequence
of inaction increases the probability of �ling more than the SMS that mentions the use of third-party
information, and this di�erence is signi�cant. Neither message results in an economically large or
statistically signi�cant increase in average tax payment, and the overall payment rate for this group
(tax-registered �rms that did not have an email address on �le) is below 1%. Table A4 shows other
e�ects of the SMS messages, which also increased prior-year �ling and income tax deregistration, al-
though the e�ects (which are less than 1 p.p.) are again smaller than the corresponding e�ects from
the email experiment. The threat of public shaming increased deregistration signi�cantly relative
to the SMS that mentioned third-party information.
50

Table A1: Balance of Randomization, Firm Characteristics (SMS Experiment)
(1) (2) (3) (4)
Control
T1:Public
shaming SMS
T2:Information
SMS
T1=T2=0p-value
Corporation 0.312 0.011 0.011 0.356(0.006) (0.008) (0.009)
Has second phone 0.174 0.003 0.003 0.819(0.004) (0.006) (0.006)
Located in San José 0.395 -0.004 0.003 0.618(0.006) (0.008) (0.009)
Was contacted early 0.011 -0.001 0.005 0.509(0.001) (0.001) (0.006)
TPI reportee 0.154 -0.001 0.003 0.697(0.004) (0.005) (0.005)
TPI > 2.5 million CRC 0.071 -0.000 0.002 0.743(0.003) (0.004) (0.004)
TPI > 6 million CRC 0.038 0.005* 0.004 0.157(0.002) (0.003) (0.003)
Made advance payment in 2014 0.007 -0.000 0.001 0.656(0.001) (0.001) (0.001)
Filed in 2013 0.161 0.011** 0.005 0.116(0.004) (0.005) (0.005)
Reported net liability > 0 in 2013 0.032 -0.003 -0.000 0.486(0.002) (0.002) (0.002)
Made payment 2013 0.018 -0.002 0.001 0.476(0.001) (0.002) (0.002)
Was third-party informant 2013 0.056 0.003 0.003 0.586(0.002) (0.003) (0.003)
Observations 10,227 10,195 10,420
Note: The table shows the balance of randomization in terms of �rm characteristics, as measured before the ex-periment start. The rows correspond to the di�erent variables. Column 1 displays the mean for the control group,columns 2 and 3 show the mean di�erence between the control group and treatment groups 1 and 2 respectively,and column 4 reports p-values from a test of the hypothesis that the two treatment groups are jointly equal to thecontrol group. Robust standard errors clustered by phone number are in parentheses. TPI stands for third-partyinformation (third-party reported sales), meaning the sum of sales reported by clients (D151), state institutions(D150) and credit/debit card companies (D153). The cuto�s of 2.5 million and 6 million CRC correspond to thepriority group designations used by the tax authority. Signi�cance levels are noted as per convention: * p<.10, **p<.05, *** p<.01.
51

Table A2: Balance of Randomization, Outcomes at Baseline (SMS Experiment)
(1) (2) (3) (4)
Control
T1:Public
shaming SMS
T2:Information
SMS
T1=T2=0p-value
Filed 0.013 -0.000 0.001 0.554(0.001) (0.002) (0.002)
Had positive net liability 0.004 -0.000 0.000 0.650(0.001) (0.001) (0.001)
Made payment 0.001 -0.000 -0.000 0.702(0.000) (0.001) (0.000)
Log payment 0.014 -0.002 -0.004 0.691(0.004) (0.005) (0.005)
Was third-party informant 0.027 -0.001 0.002 0.414(0.002) (0.002) (0.002)
No. months decl. sales tax 0.269 0.037 0.004 0.224(0.016) (0.023) (0.023)
No. months paid sales tax 0.039 0.004 0.005 0.781(0.006) (0.008) (0.008)
Sales tax payment 1113.920 1126.130* 1048.929 0.065(259.200) (579.110) (645.096)
Deregistered 0.003 -0.001 -0.001 0.498(0.001) (0.001) (0.001)
Deregistered (sales tax) 0.001 -0.001 -0.001*** 0.008(0.000) (0.000) (0.000)
Observations 10,227 10,195 10,420
Note: The table shows the balance of randomization in terms of outcomes, as measured before the experimentstart. The rows correspond to the di�erent variables for �scal year 2014. The number of months that ataxpayer �led and paid sales tax, and the sales tax payment are calculated over July 2013 until June 2014.Column 1 displays the mean for the control group, columns 2 and 3 show the mean di�erence between thecontrol group and treatment groups 1 and 2 respectively, and column 4 reports p-values from a test of thehypothesis that the two treatment groups are jointly equal to the control group. Robust standard errorsclustered by phone number are in parentheses. Signi�cance levels are noted as per convention: * p<.10, **p<.05, *** p<.01.
52

Table A3: SMS Impact on Income Tax Compliance
Probit OLS PPML
(1) (2) (3) (4) (5)
FiledPositive netliability
Positivepayment
Logpayment
Payment
T1: Public Shaming SMS 0.031***�� 0.002* 0.002* 0.016 136.070(0.003) (0.001) (0.001) (0.010) (108.186)
T2: Information SMS 0.024*** 0.002 0.000 0.004 99.784(0.003) (0.001) (0.001) (0.010) (103.860)
Corporated -0.018*** 0.001 -0.001 -0.003 100.539(0.003) (0.001) (0.001) (0.010) (114.204)
Has second phone 0.004 0.000 -0.000 -0.004 -45.322(0.004) (0.001) (0.001) (0.012) (111.178)
Located in San José -0.011*** -0.002* -0.000 -0.010 -203.961**(0.003) (0.001) (0.001) (0.009) (84.752)
TPI reportee 0.029*** 0.008*** 0.005*** 0.045** 472.924***(0.005) (0.002) (0.002) (0.019) (158.965)
TPI > 2.5 million CRC 0.030*** 0.010*** 0.004** 0.123** 425.925**(0.009) (0.003) (0.002) (0.054) (204.018)
TPI > 6 million CRC 0.006 0.006*** 0.001 0.172** 238.749(0.007) (0.002) (0.001) (0.081) (154.156)
Made advance payment for 2014 0.061*** 0.012** 0.011** 0.831*** 533.082**(0.019) (0.005) (0.005) (0.245) (271.232)
Filed in 2013 0.084*** 0.005*** 0.004*** 0.027 251.788(0.006) (0.002) (0.001) (0.018) (157.196)
Reported net liability > 0 in 2013 0.004 0.021*** 0.003 0.083 211.891(0.009) (0.006) (0.003) (0.086) (243.252)
Made payment in 2013 0.018 0.002 0.013** 0.711*** 932.340**(0.013) (0.003) (0.006) (0.161) (452.038)
Was third-party informant in 2013 0.003 0.000 -0.001 -0.021 -74.626(0.005) (0.002) (0.001) (0.044) (123.444)
Constant 0.003(0.007)
Control group avg. 0.0363 0.00743 0.00411 0.0435 339.8T1=T2 p-value (Wald test) 0.036 0.745 0.155 0.277 0.747Observations 30,842 30,842 30,842 30,842 30,842
Note: This table displays estimates of probit, OLS and PPML estimations as explained in Section 4.1, using the controlvariables noted in the table rows. The columns display the outcome variables: dummies for whether the �rm �led incometax for 2014, reported a positive net liability and made a payment (considering only �nal payments made with thedeclaration and not advance payments that may have been made earlier), and the (log) payment amount. All outcomesare measured 15 weeks after the start of the experiment. Robust standard errors clustered by phone number are inparentheses. Average partial e�ects are reported for probit and PPML. Payment amounts are winsorized at the top 0.1%to reduce the in�uence of outliers. TPI stands for third-party information (third-party reported sales), meaning the sumof sales reported by clients (D151), state institutions (D150) and credit/debit card companies (D153). The cuto�s of 2.5million and 6 million CRC correspond to the priority group designations used by the tax authority. Signi�cance levelsare noted as per convention: * p<.10, ** p<.05, *** p<.01. Daggers indicate signi�cant di�erences between the twotreatments.
53

Table A4: SMS Impact on Other Compliance Outcomes
Probit OLS PPML Probit
(1) (2) (3) (4) (5) (6) (7) (8) (9) (10) (11)Presentedinformativedeclaration
Reportedsupplier
Reportedclient
No. monthsdecl. sales
tax
No. monthspaid sales
tax
Sales taxpayment
DeregisteredDeregistered(sales tax)
Switched tosimpli�edregime
Filedincome taxfor 2013
Paidincome taxfor 2013
T1: Public shaming SMS 0.001 0.000 0.001 0.027 0.003 426.698 0.007***�� -0.000 -0.000 0.010*** 0.001**(0.002) (0.002) (0.002) (0.023) (0.008) (280.415) (0.002) (0.001) (0.000) (0.002) (0.000)
T2: Information SMS 0.002 0.002 0.000 -0.006 0.002 176.151 0.003** -0.001 -0.001**� 0.007*** 0.000(0.002) (0.002) (0.002) (0.022) (0.008) (258.053) (0.002) (0.001) (0.000) (0.002) (0.000)
TPI reportee 0.049*** 0.022*** 0.031*** -0.005 0.031* 1,370.309*** -0.002 -0.003*** 0.000 0.007** 0.001(0.004) (0.003) (0.003) (0.038) (0.017) (457.876) (0.002) (0.001) (0.000) (0.003) (0.001)
TPI > 2.5 million CRC 0.014*** -0.003 0.018*** 0.168* 0.072* 400.869 -0.005 0.012 0.001 0.021*** 0.001(0.004) (0.003) (0.003) (0.090) (0.044) (431.705) (0.004) (0.012) (0.001) (0.008) (0.001)
TPI > 6 million CRC 0.015*** 0.016*** 0.011*** 0.129 -0.046 183.805 -0.002 -0.002*** -0.000*** 0.000 0.002(0.004) (0.005) (0.003) (0.121) (0.057) (372.037) (0.005) (0.001) (0.000) (0.005) (0.002)
Other controls Yes Yes Yes Yes Yes Yes Yes Yes Yes Yes Yes
Control group avg. 0.0286 0.0155 0.0182 0.276 0.0416 935.9 0.0104 0.00284 0.000587 0.175 0.0184T1=T2 p-value (Wald test) 0.575 0.382 0.684 0.153 0.892 0.399 0.040 0.271 0.076 0.124 0.238Observations 30,842 30,842 30,842 30,842 30,842 30,842 30,842 30,842 30,842 30,842 30,842
Note: This table displays estimates of probit, OLS and PPML estimations using the same controls as in Table A3. The columns display the outcome variables, which refer tocompliance for �scal year 2014 unless otherwise noted. All outcomes are measured 15 weeks after the start of the experiment. Robust standard errors clustered by phone number arein parentheses. Average partial e�ects are reported for probit and PPML. TPI stands for third-party information (third-party reported sales), meaning the sum of sales reported byclients (D151), state institutions (D150) and credit/debit card companies (D153). The cuto�s of 2.5 million and 6 million CRC correspond to the priority group designations used bythe tax authority. Signi�cance levels are noted as per convention: * p<.10, ** p<.05, *** p<.01. Daggers indicate signi�cant di�erences between the two treatments.