Casting a New Light on Museums and Galleries: towards ... · Casting a New Light on Museums and...
326
PhD Thesis Casting a New Light on Museums and Galleries towards modern industry guidelines for lighting in museums and galleries Emrah Baki Ulas
Transcript of Casting a New Light on Museums and Galleries: towards ... · Casting a New Light on Museums and...
PhD Thesis Casting a New Light on Museums and Galleries
towards modern industry guidelines for lighting in museums and galleries
Emrah Baki Ulas
Supervisor Prof. Lawrence Wallen (Head of School of Design / UTS) Author Emrah Baki Ulas
Program PhD (Design) c02001 PhD
with sincere gratitude to
Prof. Lawrence Wallen and Prof. Thea Brejzek in whom I find guidance,
Michael Day in whom I find assurance,
Dr. Ing. Georgios Paisidis in whom I find inspiration,
Dan Mackenzie in whom I find courage,
my brother Umut in whom I find kindness,
my parents Firdevs and Omer in whom I find endless care and devotion,
my family; Mirjam in whom I find love, and Ayla in whom I find meaning.
Special thanks to my friends, to my past and present colleagues at Steensen Varming;
particularly Dan Mackenzie, Chris Arkins, Mike Harrold, Mike Fearnley, Ashleigh Bretherton,
Farah Deba, Simm Steel and Mirjam Roos, to my lighting design students, to fellow colleagues
in the lighting industry, and in many museums and galleries around the world who contributed
to this work in ways they have or have not known, to many museums and galleries and
particularly to Museum of Applied Arts and Sciences Sydney for opening their doors to me for
lighting experiments, to University of Technology Sydney academics and staff, particularly to
Ann Hobson, who gave me invaluable advice and support in the process of this study, to Sinem
Akbay and Mehtap Aktas for giving me their valuable assistance and helping make this study
better, to the participants of lighting experiments, to Bruce Ford, Scott Rosenfeld, Michael Day,
Vicki Humphrey, Dr. Ing. Georgios Paisidis and Mirjam Roos for their reviews and sharing their
valuable opinions,
and to many more whose name I probably should mention here and I have not,
your help made this come together…
Casting a New Light on Museums and Galleries Emrah Baki Ulas
1
Index
Index 1
Certificate of Original Ownership 4
Author’s Declaration 5
Abstract 6
Key Words 9
1. Introduction 10
1.1. Framing Context 10 1.1.1. Objective 10 1.1.2. Central Questions 12
1.2. Practice Context 14
1.3. An Analysis of the Status Quo of Museum and Gallery Lighting 16 1.3.1. Key Documents 16 1.3.1.1 The Museum Environment (Thomson, 1978) 18 1.3.1.2 Light for Art’s Sake (Cuttle, 2007) 23 1.3.1.3 Human Factors in Lighting (Boyce, 2003) 32 1.3.1.4 International Commission on Illumination Technical Report CIE 157:2004 33 1.3.1.5 Guidelines for Selecting Solid-State Lighting for Museums (Getty, 2011) 35 1.3.1.6 A Survey of Various Light Sources for Exhibition Display (Ulas et al. 2010) 35 1.3.1.7 A Practical Guide for Sustainable Climate Control and Lighting in Museums and Galleries (Ulas et al., 2015) 36 1.3.2. Government Legislations in Lighting 38 1.3.3. Technological Shift in Lighting for Museum and Gallery Display 40
2. Light and Visual Acuity in Museums and Galleries 45
2.1. Evaluating the Adequacy of Lighting for Satisfactory Viewing of Exhibition Display 45
2.1.1. The “50 Lux” Rule 47 2.1.2. Lighting and the Object 49 2.1.3. Lighting and the Context 54 2.1.4. Lighting and the Viewer 56 2.1.5. Lighting and Visual Properties 64
2.2. A Framework for an Improved Method to Evaluate the Adequacy of Lighting for Satisfactory Viewing of Exhibition Display 70
Casting a New Light on Museums and Galleries Emrah Baki Ulas
2
2.2.1. Object framework 70 2.2.2. Context framework 71 2.2.3. Viewer framework 71 2.2.4. Lighting framework 72
2.3. Lighting Experiments 73 2.3.1. Objectives 73 2.3.2. Methodology 73 2.3.3. Experiment Set-up 74 2.3.3.1 Time 74 2.3.3.2 Location 74 2.3.3.3 Space 76 2.3.3.4 Furnishing 78 2.3.3.5 Lighting 78 2.3.3.6 Displays 80 2.3.3.7 Questionnaire 81 2.3.3.8 Participants 85 2.3.3.9 Experiment Procedure 85 2.3.4. Display Composition 87 2.3.4.1 Colour Displays 87 2.3.4.2 Detail Displays 95 2.3.5. Lighting Composition 99 2.3.5.1 Lighting Criteria 99 2.3.5.2 Lighting Equipment 99 2.3.5.3 Lighting Layout and Arrangement 108 2.3.5.4 Lighting Levels 109 2.3.5.5 Lighting Aiming and Controls 110 2.3.5.6 Lighting Measurements 111 2.3.6. Participants’ Profile 112 2.3.6.1 Age and Sex 112 2.3.6.2 Occupation 115 2.3.6.3 Eye/Vision Conditions 116 2.3.7. Experiment Design Principles and Ethics 116 2.3.8. Analysis Methodology 116 2.3.8.1 Experiment Variables 116 2.3.8.2 Analysis Levels for Experimental Data 118 2.3.9. Analysis 130 2.3.9.1 Detailed Analysis Results 130
2.4. Interpretation of the Results of the Lighting Experiments 231
2.5. Summary 238
3. Light and Preventive Conservation in Museums and Gallery Exhibition Display 242
3.1. Evaluating the Consequence of Lighting on Preventive Conservation of Exhibits on Display 242
Casting a New Light on Museums and Galleries Emrah Baki Ulas
3
3.1.1. Light as A Cause of Deterioration 244 3.1.2. Susceptibility of Materials to Light-induced Damage 253 3.1.3. The balance between preservation and presentation 266 3.1.4. Light-Emitting Diode and its Photodegradation Potential 270
3.2. A Framework for Evaluating the Consequence of LED Lighting on Preventive Conservation of Exhibits on Display 287
3.3. Summary 299
4. Towards a New Set of Lighting Guidelines for Museums and Galleries 301
4.1. The Need for Improvement 301
4.2. Potential Benefit 303
4.3. The Guide 304
4.4. Conclusion and Outlook 310
Bibliography 313
Biography of the Author 321
Casting a New Light on Museums and Galleries Emrah Baki Ulas
4
Certificate Of Original Authorship
I, Emrah Baki Ulas, declare that this thesis is submitted in fulfilment of the requirements for the award of Doctor of Philosophy, in the Faculty of Design, Architecture and Building at the University of Technology Sydney.
This thesis is wholly my own work unless otherwise referenced or acknowledged. In addition, I certify that all information sources and literature used are indicated in the thesis.
This document has not been submitted for qualifications at any other academic institution.
Signature:
Date: 12/03/2018
Production Note:
Signature removed prior to publication.
Casting a New Light on Museums and Galleries Emrah Baki Ulas
5
Author’s Declaration
Except where stated and referenced, all of the work contained within this PhD thesis
represents the original contribution of the author. Some of the material presented in this thesis
has previously been published by the author in the following publications;
Roos, M. & Ulas, E. 2013, Looking art in a new light- Part A, Papyrus – the Official Publication
of the International Association of Museum Facility Administrators, vol 11, p35-36.
Roos, M. & Ulas, E. 2013, Looking art in a new light- Part B, Papyrus – the Official Publication
of the International Association of Museum Facility Administrators, vol 12, p14-16.
Ulas, E. 2010, Daylighting and UV study for the National Gallery of Australia, Steensen Varming,
Sydney.
Ulas, E. 2010, Daylighting and UV study for the Museum of Contemporary Art, Steensen
Varming, Sydney.
Ulas, E. 2011, Lighting study for the NSW Parliament House, Brett Whiteley Artwork Display,
Steensen Varming, Sydney.
Ulas, E., Crampton, R., Tennant, F. & Bickersteth J. 2015, A Practical Guide for Sustainable Climate
Control and Lighting in Museums and Galleries, Steensen Varming and International Conservation
Services, Sydney.
Ulas, E., Crampton, R., Tennant, F. & Bickersteth J. 2011, Technical Industry Report for
Museums and Galleries, Steensen Varming and International Conservation Services, Sydney.
Casting a New Light on Museums and Galleries Emrah Baki Ulas
6
Abstract
Museums and Galleries are spaces where collections are made available, and where old or new
information, heritage values, cumulative knowledge and experience of individuals and
communities can be shared and cultivated further to advance the society. At the same time,
museums and galleries are also the institutions that preserve and protect the cultural heritage
and keep it safe for the benefit and enjoyment of the future generations. Often these two key
objectives conflict with each other, because exhibiting an object, may cause ageing, damage and
degradation of its materials, and may have a detrimental impact on its integrity, significance or
value. An institution's decision to exhibit an item may mean that its future usable life is
compromised to some degree. It is, therefore, crucial to understand the effect of the
environmental parameters on the exhibited items within the display spaces so that they are
displayed in a manner that minimises the impact on these objects while providing adequate
conditions to optimise the visitor's experience. This requires the design of the spaces, the
sorting of the material and the setting of the environmental parameters to be working hand in
hand with the artistic and curatorial vision.
Lighting is important for the appearance of museum and gallery displays and is a fundamental
element in shaping the visitor's experience of an exhibition. On the other hand, lighting, as an
environmental parameter, is one of the key issues in preventive conservation. It needs to be
used delicately and often sparsely to minimise damage on the objects as light may cause damage
to exhibition materials by causing fading of pigments and may degrade objects over a long
period. This process is called photodegradation. Photodegradation can be defined as the
decomposition of molecules caused by the absorption of energy in the form of photons,
particularly from the ultraviolet and visible parts of the electromagnetic spectrum. As a result
of photodegradation, the material composition breaks up and becomes irreversibly
transformed, i.e. it may be impossible to create or repair the lost information on an exhibition
object through interventive methods. Therefore, the exhibition of a light sensitive object
requires a well-balanced lighting that optimises the visual display quality versus the risk of
damage, such as fading, colour shift or structural deterioration.

Casting a New Light on Museums and Galleries Emrah Baki Ulas
7
In this perspective, the design of lighting for museum and art gallery exhibition display spaces
is a non-prescriptive task which requires numerous considerations. These applications involve
intertwined necessities for the visual satisfaction and well-being of the visitor and the livelihood
of the presented cultural material. The complexities of the visual perception, the care required
for preserving cultural heritage, the environmental performance of the lighting systems and
technologies within the gallery space, and the particular curatorial needs and circumstances of
individual collections necessitate considerable attention to a myriad of comfort and
performance factors. These factors require a holistic evaluation of the cross-related lighting
issues, to address them in a balanced manner.
Subject to the research study here is a factor in the lighting of exhibition spaces that is regarded
with more attention than almost any other; illuminance.
Illuminance is the amount of luminous flux per unit area, i.e. the amount of light falling onto a
surface. While being only one of the numerous lighting performance parameters, illuminance,
is often regarded as the sole means of assessment for the evaluation of satisfactory viewing of
the cultural material and for determining whether a lighting setup satisfies the requirements
for minimising light damage (photodegradation).
It is also important to note here that visual richness (or satisfaction of viewing) is
phenomenological in its nature and is rather a subjective experience that is formed in the
human mind as a result of an interaction of the attributes of a lit environment and its context,
the characteristics of the source of light itself and the many perceptual factors that are
particular to the perceiver. Therefore, considerations of objective reality are not fully sufficient
in explaining visual phenomena, yet alone illuminance (lux) level alone as a sole criterion.
Embarked on the above issues, this research questions the commonly referenced museum and
gallery industry guidelines and practices of designing exhibition lighting strictly by certain lux
values that predetermine the band of adequate lighting environment, by postulating minimum
and maximum illuminance values. This approach needs to be challenged due to two key
reasons: Firstly, illuminance alone, as a metric, does not provide the designer with adequate
information on the quality of the visual environment, neither does it solely provide adequate
information on the impact of the light exposure on the cultural material. To address these, one
needs to consider, amongst many, the spectral composition of the light source, the spatial
Casting a New Light on Museums and Galleries Emrah Baki Ulas
8
distribution and the surface attributes of the illuminated environment and objects. Secondly,
the light sources used in museum and gallery environments are in a rapid changeover from
incandescent-based technologies to semiconductor-based, Light-emitting Diode (LED)
technologies. There are profound differences between these two light sources both regarding
their spectral and spatial characteristics and working principles. Moreover, the light source that
was used to form the basis of most industry guides is the xenon-arc technology, which again
has profound differences with the Light-emitting Diodes. These differences inevitably affect the
lighting composition and may result in very different outcomes regarding the visual results and
the damage potential, even when the measured illuminance levels may be equal.
This research, therefore, examines the relevance of the common industry practices of today,
in order to derive practically applicable outcomes that can improve industry guidelines and
provide information for the museum and gallery sector, on some of the key perceptual aspects
of museum and gallery exhibition display, to contribute to developing more thorough lighting
design criteria for exhibition display environments that support the visitor experience and
contribute to the protection of the cultural material for future generations.
The research suggests an alternative approach to the 50/200 lux rule (Thomson, 1978) and
also proposes a framework to rethink the allowed exposure levels (“Kluxhours/year” values)
for revising the CIE 157:2004 guidelines to better suit the use of Light-emitting Diodes in
museum display lighting applications.
Casting a New Light on Museums and Galleries Emrah Baki Ulas
9
Key Words
Key Words: museum and gallery lighting; exhibition lighting; display lighting; lighting design;
museum environment; art lighting; light-induced fading; photodegradation; light damage; art
conservation; visual acuity; colour recognition; detail recognition; illuminance level; CIE
2004:157; kluxhours/year;
Casting a New Light on Museums and Galleries Emrah Baki Ulas
10
1. Introduction
1.1. Framing Context
Conducted under the PhD Design postgraduate program in the School of Design at the
University of Technology Sydney, this doctoral thesis incorporates both theoretical and
practice-based research.
This research is framed within the discipline of interior and spatial design with a specific focus
on lighting design within museum and gallery exhibition display environments. The research
aims to address the implications of the shift in the lighting technologies in exhibition display
environments, from predominantly incandescent-based technologies to the modern
semiconductor-based, Light-emitting Diode (LED) technologies. These implications pose
themselves in the museum and gallery display context, in both the visual acuity parameters for
the viewers of the cultural material, as well as the preventive conservation requirements for
the preservation of cultural material against light damage; i.e. photodegradation.
While the study situates itself within lighting design, it also has relevance to architectural
aesthetics within museum and gallery environments, curatorial aspects of exhibitions and
preventive conservation requirements for cultural material. The research aims to produce
practically relevant and applicable outcomes that can influence future industry guides and best-
practice methodologies, and contribute to the future of the lighting design solutions for
museums and galleries, archival and cultural institutions and heritage environments alike.
1.1.1. Objective
The primary objective of this research is to generate coherent and relevant practical
information that can advance the lighting guidelines that are currently accepted and applied in
museums and galleries. The research aims to fill an important knowledge and research gap in
Casting a New Light on Museums and Galleries Emrah Baki Ulas
11
relation to the technology-driven shift in museum and gallery lighting; from the traditional,
predominantly Incandescent (Tungsten Halogen) lighting systems to the modern day
semiconductor Light-emitting Diode (LED) lighting technologies. The research addresses the
lighting design aspects directly and indirectly affected by this shift and offers a range of
experimental and mathematical findings that propose a new framework to fill in the gaps in the
current day understanding and update practice methods to address the inherent impact of the
replacement of the traditional sources of light in museum and gallery displays with the new
(LED) technologies, in order to inform and guide the imminent need for newer, more thorough
and more advanced industry best practice guidance in this field.
Widely accepted lighting design best practice guidelines and methodologies that are currently
in use for museums and galleries throughout the world date back several decades. These
guidelines have served an important purpose by raising awareness on the key issues of museum
lighting and by providing an effective and simple framework that relevant professionals can
refer to and thus have been effective in increasing the attention to the use of light to display
museum objects, and also have played a significant role in protecting cultural material that is
sensitive to light damage. These guidelines, however, have long had great degrees of
normalisations, approximations and simplifications which needed addressing in more thorough
approaches. In this respect, these guidelines have been limited in their ability to relate to the
collections true nature and circumstances and have largely only applied blanket-conditions
(often for a conservative, worst-case preventive conservation needs). In the absence of more
sophisticated guidelines, these have been beneficial for conservation practice. In many cases,
however, they also have been excessively limiting; impacting the visitor experience of a museum
or gallery display. Particularly with the arrival of the semiconductor-based technologies they
are often misleading due to being primarily based on Incandescent (Tungsten Halogen)
technologies. They do not represent a clear framework for best practice using LED light
sources. Instead, these guidelines are being applied to LED-based museum and gallery lighting
haphazardly, impacting on the visual acuity, comfort and performance within museums and
galleries as well as potentially causing photodegradation (light-induced fading) to various types
of cultural materials or being unnecessarily conservative to the lighting of others, resulting in
an avoidable situation, whereby relevant costs and efforts can be better managed, and both the
visual aspects of a museum or a gallery display, and the preventive conservation aspects of
cultural material can be improved significantly.
Casting a New Light on Museums and Galleries Emrah Baki Ulas
12
The research seeks to test and verify the correlations between the lighting characteristics of
the new semiconductor-based museum and gallery lighting equipment and the visual acuity, in
exhibition environments; and also identify and outline potential impact of this new technology
on preventive conservation aspects, in comparison to that of traditionally used sources of light
for museums and galleries.
1.1.2. Central Questions
How can the CIE Technical Report 157:2004 guidelines be improved or superseded using
more recent and more detailed industry data, and what are the likely new industry
guidelines?
Can the industry practices on the minimum acceptable levels of illuminance for visual
acuity be reformed with due consideration to other visual parameters, such as the
contrast ratio and the spectral composition of lighting?
Can the acceptable levels of maximum illuminance be altered through the
consideration of different photodegradation potentials within the light spectrum, and
through the elimination of the UV and near-UV band?
What are the appropriate levels of exposure in Kluxhours/year using LEDs instead of
traditional sources of light in museums and galleries?
What is the correlation between the illuminance levels and visual perception in a
museum or gallery exhibition environment?
Does the perception of colours depend on the continuity of the spectral composition
of the light sources, or can it be affected by the variances in the spectral distribution
of the light sources?
Casting a New Light on Museums and Galleries Emrah Baki Ulas
13
How can lighting levels be optimised to enhance the visual quality of exhibition displays
– Is this possible solely through the alteration of the illuminance levels or does it also
require manipulation of spectral content?
How do the LEDs differ from the incandescent-based lighting in lighting museum and
gallery displays?
What is the impact of the use of LED light sources in the museum and gallery lighting
on the visual acuity of the visitors and with respect to conservation of the collections?
What are the correlations between the museum or gallery visitors’ age and their visual
acuity?
What are the correlations between the museum or gallery visitors’ sex and their visual
acuity?
Can the manipulation of the spectral output of the light sources provide more
sustainable outcomes and minimise photodegradation?
Can advanced control technologies provide new opportunities for a tailored approach
to museum lighting which caters for object-specific requirements?
Casting a New Light on Museums and Galleries Emrah Baki Ulas
14
1.2. Practice Context
From their 18th Century beginnings as private collections of the rich, museums and galleries
have shifted closer to the public sphere, becoming more democratic and pluralistic in nature.
Throughout the 20th century, the focus has shifted from being internally focused on collecting
and conserving collections to an external perspective on presenting accessible collections, and
creating places of mass attraction, discourse, attention, and spectacle. Nowadays museums and
galleries, as signature architecture, can become displays and attractors themselves, the success
of which is mainly measured in terms of attendance figures generated tourism and income. In
this context, lighting within the museum and gallery context have become a major topic of
debate for museums and galleries.
The changing and evolving nature of museums and galleries has resulted in a wide spectrum of
the museum typologies over time. The typologies have diversified not only in terms of spatial
context but also in terms of the types of collections, how they are sorted and how they are
exhibited. The collections range from historical manuscripts and ancient objects to organic
specimens and fossils, from Renaissance paintings to contemporary art and digital media. They
are stored or exhibited temporarily or permanently in spaces that range from small to large,
private to publicly owned, with building types of modern or heritage character, with different
intricacies, with varying systems for lighting. As a result, the capital, operational and
maintenance programs of these facilities also present very diverse typologies that serve
different objectives, priorities, organisational structures and processes and aim to appeal to
different groups within communities.
Concurrent to the transformation of museums and galleries, the art and science of lighting; its
technologies, design appreciation and methodologies have also shifted through the years. For
many years before the introduction of Electric Lighting in Museums and Galleries, daylighting
was the primary means of illumination. While the spectral characteristics of daylight have
always been excellent, as the understanding of preventive conservation issues has advanced,
the UV content of daylight has been of concern to protect collections. Also, the dynamic and
ever-changing characteristics of daylight have always made it challenging to use it in museum
and gallery space although it was also those same characteristics that were able to enhance
spaces significantly and provide comfort and enjoyment for the visitor.
Casting a New Light on Museums and Galleries Emrah Baki Ulas
15
With electric lighting becoming more readily available and economically viable, and with the
increasing concerns about the abovementioned issues, the use of daylight became increasingly
excluded from the museum and gallery environment. In most cases where it was still used, it
has been carefully regulated and often kept to merely have a symbolic and supporting value for
the spatial context, rather than being the primary source of lighting for display purposes.Many
museums and galleries of today have strict guidelines on the use of daylight, however carefully
designed use of daylight helps save energy and increases the special quality of the exhibition
spaces.
Following many decades of electric lighting in museums and galleries that mainly utilised
incandescent halogen (and partly discharge) technologies, most museum and gallery guidelines
have been developed based on the applications that utilised these technologies. With the rapid
development of LEDs as modern sources of illumination, these guidelines have to change and
adapt to the characteristics of these new devices. The new ways of lighting in museums and
galleries need to address the changing business models and priorities of museums and galleries.
Besides, in this era of sustainability and minimising energy use, best-practice expectations for
lighting systems, both in museum and gallery sector and outside, are also rapidly evolving. Like
others, museum and gallery facilities are under increasing pressure to reduce their
environmental impact and be run more efficiently, while concurrently aiming to serve the
objective to provide optimum environments for exhibition display and collections care.
Also, to note, the way the communities experience museum and gallery collections has been
transforming, with digital and internet based experience of the collections becoming
increasingly more common. With means such as high definition imagery and point cloud
scanning etc., the boundaries between the reality and the virtual representation of collections
are getting blurred. This also raises the need to reconsider the traditional guidelines in terms
of the way light is used in museum and gallery environment.
Casting a New Light on Museums and Galleries Emrah Baki Ulas
16
1.3. An Analysis of the Status Quo of Museum and Gallery Lighting
The design of the building systems in a museum or gallery display space, and the way these
systems are managed and operated inherently come with a range of conflicting needs and
requirements in aiming to achieve the right environment. These need balancing. A conservator
works to ensure that the articles deteriorate as slowly as possible; exhibition curators and
designers need to display them with the right conceptual integrity and appropriate visual effect
and setting for maximising their interpretive value; the services engineer needs to manage the
operation of the systems in accordance with technical and budgetary constraints to meet stated
requirements. In smaller museums, many of these roles may have to be pooled and looked
after under combined roles by a limited number of individuals, and with limited resources.
While all this happens in the background, the collections need to be looked after and protected
against damage or deterioration. The visitor should be catered for, to view or experience the
exhibits comfortably and clearly. An appropriate balance needs to be reached between these
requirements, cost, and efficient system operation.
The key documents listed in 1.3.1. aim to provide background for the research on the current
state of lighting regulations, recent developments in lighting legislation and lighting technologies
as well as current issues and trends in preventive conservation in museums and galleries.
1.3.1. Key Documents
Current industry guidelines and common practice in museum and gallery lighting are based on
a rather small range of documents. These documents, however, are well-recognised in the
museum industry and often are referred to, for practical lighting applications for museum and
gallery displays.
Linked to the central questions of this research, the following outlines some of the key texts
and critically examines these with respect to their validity today, not only because the
Casting a New Light on Museums and Galleries Emrah Baki Ulas
17
understanding of collections care issues have advanced to a more sophisticated level than how
it is handled in most of these texts, but also since the technologies are different and introduce
new possibilities that will inevitably disrupt the common practices in museum and gallery
lighting.
Some of the documents mentioned below have been important milestones in the development
of the understanding of the key issues that relate to lighting in museums and galleries. They
have shaped the design principles and operation of many of the museum and gallery lighting
applications of today, and they have provided very useful information for many years. At a time
when there was little awareness of conservation-related measures and not sufficient care for
collections, they did serve a great deal to guide museums and galleries to employ basic
strategies to slow the fading of the displayed light-sensitive items. However, the large
approximations and blanket conditions they resulted in promoting, and the gaps in the issues
they have dealt with have not been sufficiently questioned and addressed in the recent years.
Particularly, given that the lighting technologies applied in museum and gallery context have
shifted considerably within the last decade, the reliance on older references have to some
extent become inadequate for applying lighting in museum and gallery spaces.
The field of study has some key reference texts that form the basis of the current industry
guidelines and common practice in the museum and gallery lighting sector. Review of these
texts is handled here, in a “Classic Studies” type of organisation, where these major benchmark
texts are studied and discussed individually, rather than in a chronological or thematic
organisation. While not intending to provide an exhaustive list, here I will briefly review the
following key documents:
The Museum Environment (Thomson, 1978)
Light for Art’s Sake (Cuttle, 2007)
International Commission on Illumination Technical Report CIE 157:2004
Human Factors in Lighting (Boyce, 2003)
Guidelines for Solid State Lighting (Getty, 2011)
A Survey of Various Light Sources for Exhibition Display (Ulas, 2011)
A Practical Guide for Sustainable Climate Control and Lighting in Museums and
Galleries (Ulas et al. , 2014)
Casting a New Light on Museums and Galleries Emrah Baki Ulas
18
1.3.1.1 The Museum Environment (Thomson, 1978)
Garry Thomson’s The Museum Environment is commonly regarded as “the” most significant
text for the environmental considerations for museum and gallery spaces. This document
addresses not only lighting related issues but approaches the issue more holistically. Wider
considerations including humidity and air quality, all of which may have an impact on the
degradation of artworks and artefacts are covered at varying levels of detail. The text has a
particular focus on preventive conservation aspects of museum buildings and systems.
The Museum Environment studies lighting in two parts. While there is no clear delineation in
the way the two parts are segregated; the first part covers a wide range of topics the
fundamentals of photodegradation, the role of different parts of the spectrum in
photodegradation, the law of reciprocity, guidelines on lux levels, the impact of the angle of
incident light, etc. as well as the impact of electronic flash, etc. The second part similarly
includes various topics such as daylighting, measuring of ultraviolet radiation, characteristics of
common light sources, colour rendering and blue wool standards.
Almost the entire lighting content of Thomson's book is relevant to this study; here, however,
I would like to discuss a few key parts since they constitute important parts of what I challenge
in this research.
Before moving on to the particulars, it must be noted that, while “the museum environment”
is a historical reference document which has contributed to the collections care immensely for
more than 3 decades, some of the recommendations included are in need of reconsideration
due to the developments in the understanding of collections care as well as the shift in modern
lighting technologies that will soon become the new norm for exhibition display lighting. While
the physics of preventive conservation remains the same, the different nature of lighting, with
different spectral qualities and different ultraviolet content requires a revised set of guidelines
to be developed.
Casting a New Light on Museums and Galleries Emrah Baki Ulas
19
Collections Care
Damage Caused by Ultraviolet and Visible Radiation
Ultraviolet Radiation and How to Deal with it
Damage versus Wavelength
The commonality between the above three sections is that they deal with the issue of
photodegradation related to ultraviolet radiation and visible light.
As Thomson (1978) rightfully notes, both ultraviolet and visible range of the spectrum can
cause photodegradation, and both should be managed carefully. Thomson points out, like
Cuttle later does in 2007 in Light for Art’s Sake (Cuttle, 2007), that ultraviolet radiation has a
significantly higher damage potential compared to visible spectrum, and that the damaging
potential of electromagnetic radiation significantly reduces from the shorter wavelength
portions of the spectrum towards the longer wavelength end of the spectrum.
Thomson (1978) argues that, while ultraviolet portion of the spectrum is more dangerous, in
an exhibition environment the ultraviolet content is often minimal in comparison to the visible
light that is more plentiful and can cause more significant photodegradation due to its higher
quantity, although the damaging potential for visible portion of the light is less. Thomson also
recommends a maximum ultraviolet content of not more than 75 microwatts/ lumen.
There are two key issues that need to be re-considered with the new lighting technologies of
today:
Firstly, the recommendation of 75 microwatts per lumen is based on the amount of UV that is
typically emitted from an incandescent source. With today’s light sources such as the LEDs,
the amount of ultraviolet band that is emitted is significantly less, and often less than ten
microwatts per lumen. Moreover, modern ultraviolet filters can block the ultraviolet content
extensively with minimal reduction in the visible spectrum. Many museums and galleries have
been adopting new guidelines for ultraviolet exposure, some adopting 25 microwatts per lumen
in their policy, while some even go down to 10 microwatts per lumen. The ultimate aim here
is to eliminate ultraviolet content completely.
Casting a New Light on Museums and Galleries Emrah Baki Ulas
20
Secondly, due to the differences in the spectral composition of a LED or an incandescent light
source, the damaging potential of one source is different to the other (both in terms of the
ultraviolet and visible radiation.). A certain light level achieved using a LED source is most likely
to cause a level of photodegradation that does not match the photodegradation caused using
an incandescent tungsten-halogen source. The difference is studied in detail in Chapter 3.
50 lux - Artificial Light, 200 lux – Daylight and Artificial Light
Thomson (1978) summarises the most effective strategy in reducing light damage to be: to
reduce both illuminance and time of exposure. On the other hand, to assist satisfactory viewing
certain light levels need to be attained within museum and gallery spaces.
As Thomson (1978) summarises, what he refers to as 50/200 lux rule; Recommended
Maximum Illuminances as shown below in Table 1.1 is widely accepted and recommended by
many; including the UK Chartered Institute of Building Services Engineers, French National
Committee of ICOM, ICCROM, the Russian Ministry of Culture and The Canadian
Conservation Institute. Through the years many other bodies have adopted this rule into their
guidelines.
It must be noted that, while the 50/200 lux rule does provide a benchmark level, in an attempt
to provide a balance between the preventive conservation requirements and the visual comfort
and visual performance within the gallery spaces in a simplified way that often works well (but
also often not), in actual fact the level of adequate lighting can vary depending on a wide range
of other factors.
The 50/200 lux rule (also studied later in this document as part of the review of Cuttle’s Light
for Art’s Sake, 2007) is based on two key studies; an American survey of twelve museums in
San Francisco-Oakland area in 1972 and a study by Bartlett School of Architecture in London
undertaken in 1982 (Loe et al.).
Rosenfeld (2017) comments that this rule was created for the benefit of the viewer. He also
added that most exhibits look substantially better when lit under 50 to 75 lux. (There is value
in this comment from an established practitioner who deals with lighting museum displays on
Casting a New Light on Museums and Galleries Emrah Baki Ulas
21
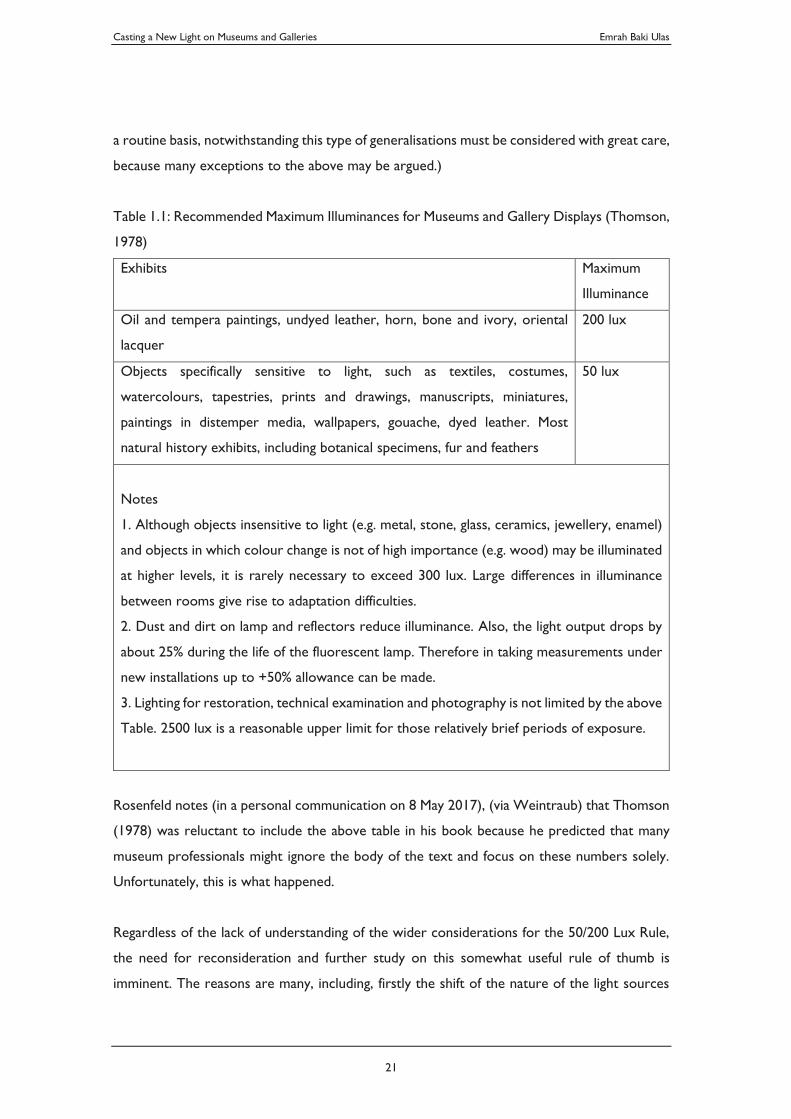
a routine basis, notwithstanding this type of generalisations must be considered with great care,
because many exceptions to the above may be argued.)
Table 1.1: Recommended Maximum Illuminances for Museums and Gallery Displays (Thomson,
1978)
Exhibits Maximum
Illuminance
Oil and tempera paintings, undyed leather, horn, bone and ivory, oriental
lacquer
200 lux
Objects specifically sensitive to light, such as textiles, costumes,
watercolours, tapestries, prints and drawings, manuscripts, miniatures,
paintings in distemper media, wallpapers, gouache, dyed leather. Most
natural history exhibits, including botanical specimens, fur and feathers
50 lux
Notes
1. Although objects insensitive to light (e.g. metal, stone, glass, ceramics, jewellery, enamel)
and objects in which colour change is not of high importance (e.g. wood) may be illuminated
at higher levels, it is rarely necessary to exceed 300 lux. Large differences in illuminance
between rooms give rise to adaptation difficulties.
2. Dust and dirt on lamp and reflectors reduce illuminance. Also, the light output drops by
about 25% during the life of the fluorescent lamp. Therefore in taking measurements under
new installations up to +50% allowance can be made.
3. Lighting for restoration, technical examination and photography is not limited by the above
Table. 2500 lux is a reasonable upper limit for those relatively brief periods of exposure.
Rosenfeld notes (in a personal communication on 8 May 2017), (via Weintraub) that Thomson
(1978) was reluctant to include the above table in his book because he predicted that many
museum professionals might ignore the body of the text and focus on these numbers solely.
Unfortunately, this is what happened.
Regardless of the lack of understanding of the wider considerations for the 50/200 Lux Rule,
the need for reconsideration and further study on this somewhat useful rule of thumb is
imminent. The reasons are many, including, firstly the shift of the nature of the light sources
Casting a New Light on Museums and Galleries Emrah Baki Ulas
22
for museum and gallery lighting, from incandescent-based to LED-based, resulting in a different
spectral composition. Perhaps the two questions that instantly can arise from a different
spectral composition are:
1) As the potential for damage from the new light sources is different, would it not follow
that threshold for the same level of damage would also be different than it was from
the older style light sources?
2) The visual response of the human perceptual system to the new museum light source
is different, therefore would it not follow that the thresholds of visual acuity be
different than what they were before?
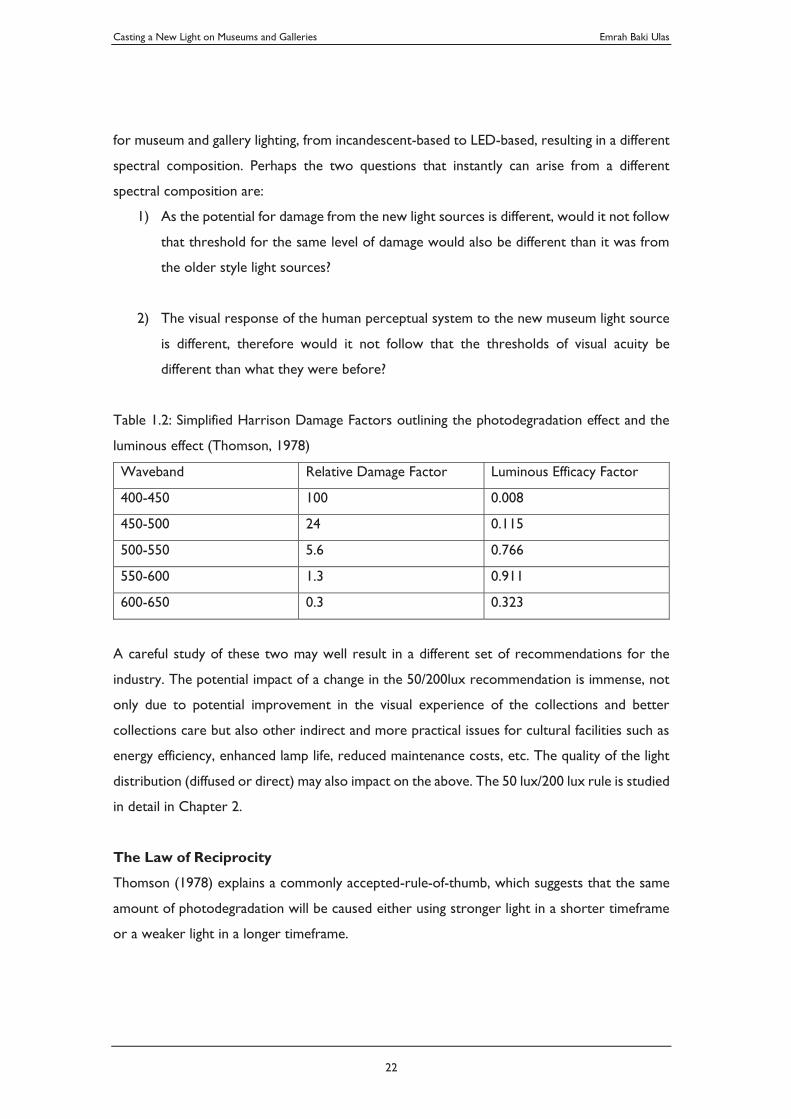
Table 1.2: Simplified Harrison Damage Factors outlining the photodegradation effect and the
luminous effect (Thomson, 1978)
Waveband Relative Damage Factor Luminous Efficacy Factor
400-450 100 0.008
450-500 24 0.115
500-550 5.6 0.766
550-600 1.3 0.911
600-650 0.3 0.323
A careful study of these two may well result in a different set of recommendations for the
industry. The potential impact of a change in the 50/200lux recommendation is immense, not
only due to potential improvement in the visual experience of the collections and better
collections care but also other indirect and more practical issues for cultural facilities such as
energy efficiency, enhanced lamp life, reduced maintenance costs, etc. The quality of the light
distribution (diffused or direct) may also impact on the above. The 50 lux/200 lux rule is studied
in detail in Chapter 2.
The Law of Reciprocity
Thomson (1978) explains a commonly accepted-rule-of-thumb, which suggests that the same
amount of photodegradation will be caused either using stronger light in a shorter timeframe
or a weaker light in a longer timeframe.
Casting a New Light on Museums and Galleries Emrah Baki Ulas
23
Though there have been critics of the law of reciprocity and it is known that it may not hold
at very high or very low levels of light, within the usual range of museum or gallery levels it
holds true.
An important point that Thomson (1978) makes is that the law of reciprocity does not state
that the relationship between the amount of exposure and the photodegradation is linear. In
fact, in most cases, the fading is faster at the beginning and slows down over time.
As Thomson (1978) suggests, to assist the efforts to minimise the lighting exposure, the design
of lighting in exhibitions may include several control mechanisms that may minimise the time
or intensity of exposure, including:
limiting the duration of the exhibition of material
illumination only during operating hours
illumination only during viewing (through sensors or pushbutton etc.)
differing levels of illumination while the visitor is present or not
In closing remarks on future trends, Thomson (1978) makes an interesting point; that the very
basis of a rational approach to preservation is through knowledge of what is changing, how fast
it is changing and why it is changing. It is needless to argue that, as far as the lighting guidelines
in this area are concerned, all of these questions can instantly be answered now and it is time
to move on to a modern set of guidelines on the topic.
1.3.1.2 Light for Art’s Sake (Cuttle, 2007)
In this milestone document, Cuttle describes an artwork as an artefact that has been crafted
to interact with light. The importance of interaction with light could be argued for almost any
object in a cultural collection, whether an artwork or an artefact, a specimen of an endangered
species or a written document of historical significance.
Differences in the techniques of how lighting is applied on an object are as important as the
differences in the materials and how those materials are composed. The visual attributes (also
Casting a New Light on Museums and Galleries Emrah Baki Ulas
24
see Human Factors in Lighting (Boyce, 2003)) of the object is determined not only by its
properties but also through its interaction with light.
Cuttle also points out the importance of a unique combination of skills, to undertake the task
of lighting of cultural collections: For this, not only that the lighting designer requires a sound
knowledge and understanding of the requirements for visual planning of these spaces, the
objects and the media (to have control over the visual attributes to be revealed, enhanced or
subdued), but in addition to this, that the lighting designer also crucially needs to understand
the requirements for the preventive conservation of the objects and know how to address
these with the tools available to them (due to the fact that lighting an object may, in many cases
depending on the nature of the collection, compromise its future usable life). (Cuttle, 2007)
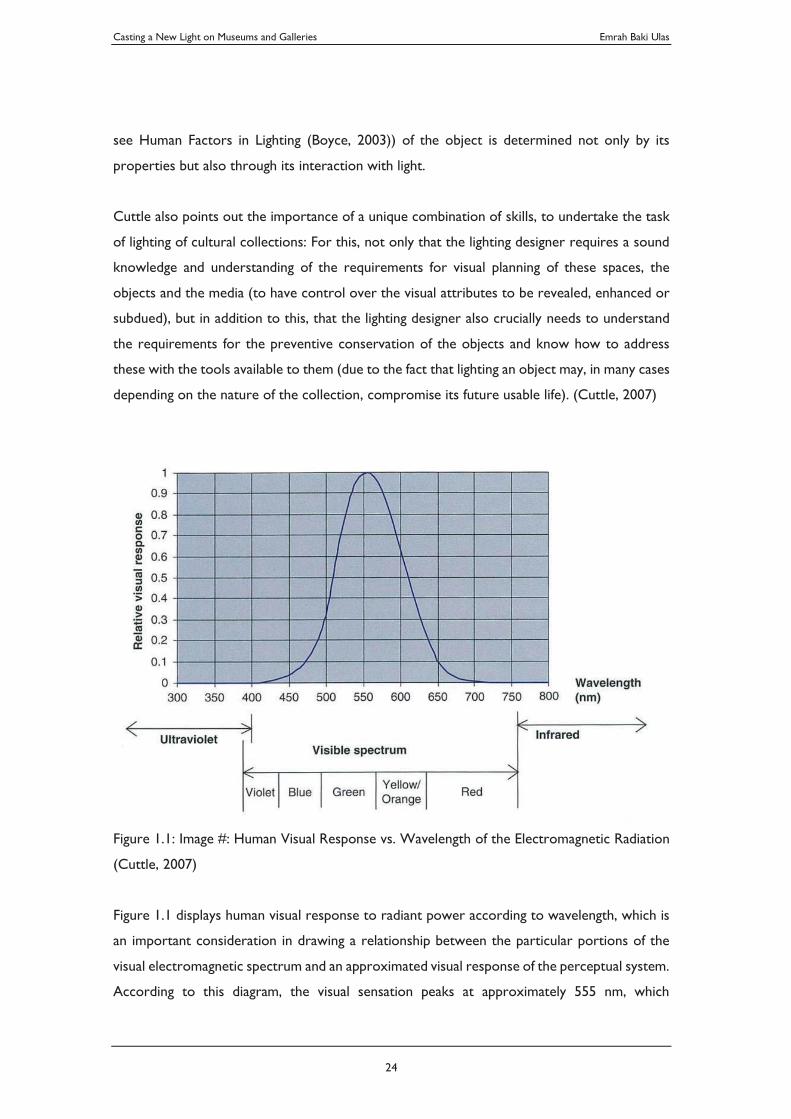
Figure 1.1: Image #: Human Visual Response vs. Wavelength of the Electromagnetic Radiation
(Cuttle, 2007)
Figure 1.1 displays human visual response to radiant power according to wavelength, which is
an important consideration in drawing a relationship between the particular portions of the
visual electromagnetic spectrum and an approximated visual response of the perceptual system.
According to this diagram, the visual sensation peaks at approximately 555 nm, which
Casting a New Light on Museums and Galleries Emrah Baki Ulas
25
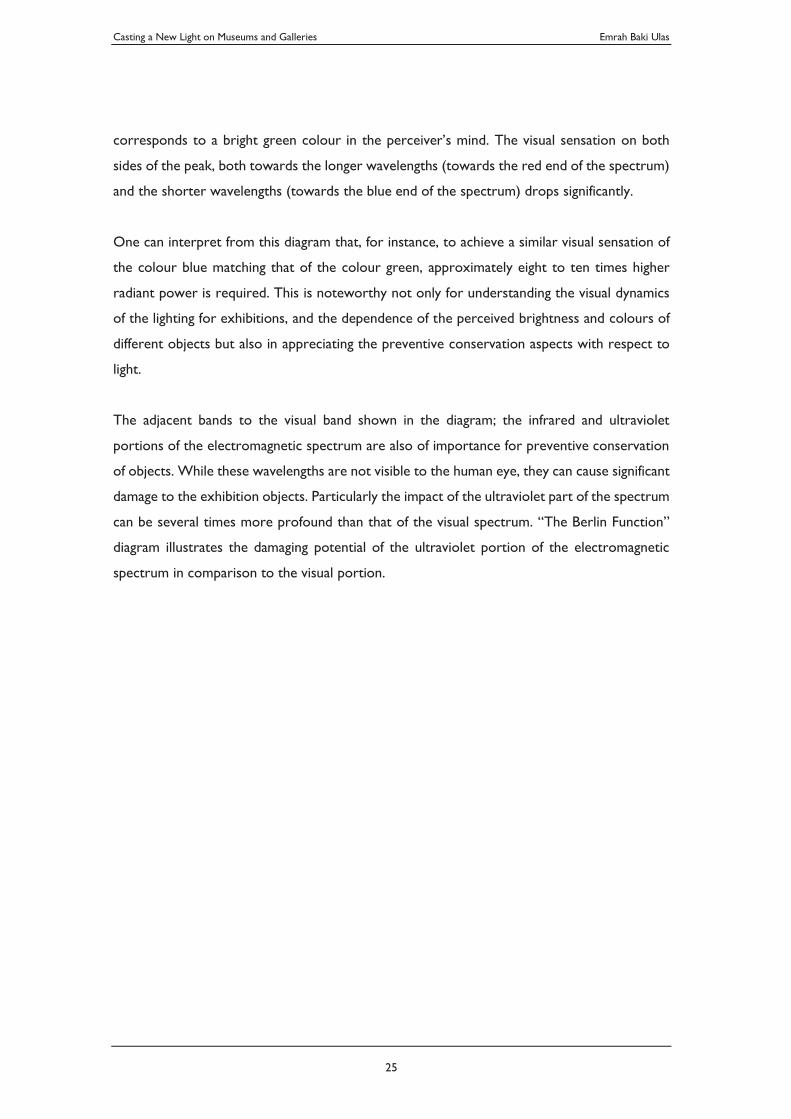
corresponds to a bright green colour in the perceiver’s mind. The visual sensation on both
sides of the peak, both towards the longer wavelengths (towards the red end of the spectrum)
and the shorter wavelengths (towards the blue end of the spectrum) drops significantly.
One can interpret from this diagram that, for instance, to achieve a similar visual sensation of
the colour blue matching that of the colour green, approximately eight to ten times higher
radiant power is required. This is noteworthy not only for understanding the visual dynamics
of the lighting for exhibitions, and the dependence of the perceived brightness and colours of
different objects but also in appreciating the preventive conservation aspects with respect to
light.
The adjacent bands to the visual band shown in the diagram; the infrared and ultraviolet
portions of the electromagnetic spectrum are also of importance for preventive conservation
of objects. While these wavelengths are not visible to the human eye, they can cause significant
damage to the exhibition objects. Particularly the impact of the ultraviolet part of the spectrum
can be several times more profound than that of the visual spectrum. “The Berlin Function”
diagram illustrates the damaging potential of the ultraviolet portion of the electromagnetic
spectrum in comparison to the visual portion.
Casting a New Light on Museums and Galleries Emrah Baki Ulas
26
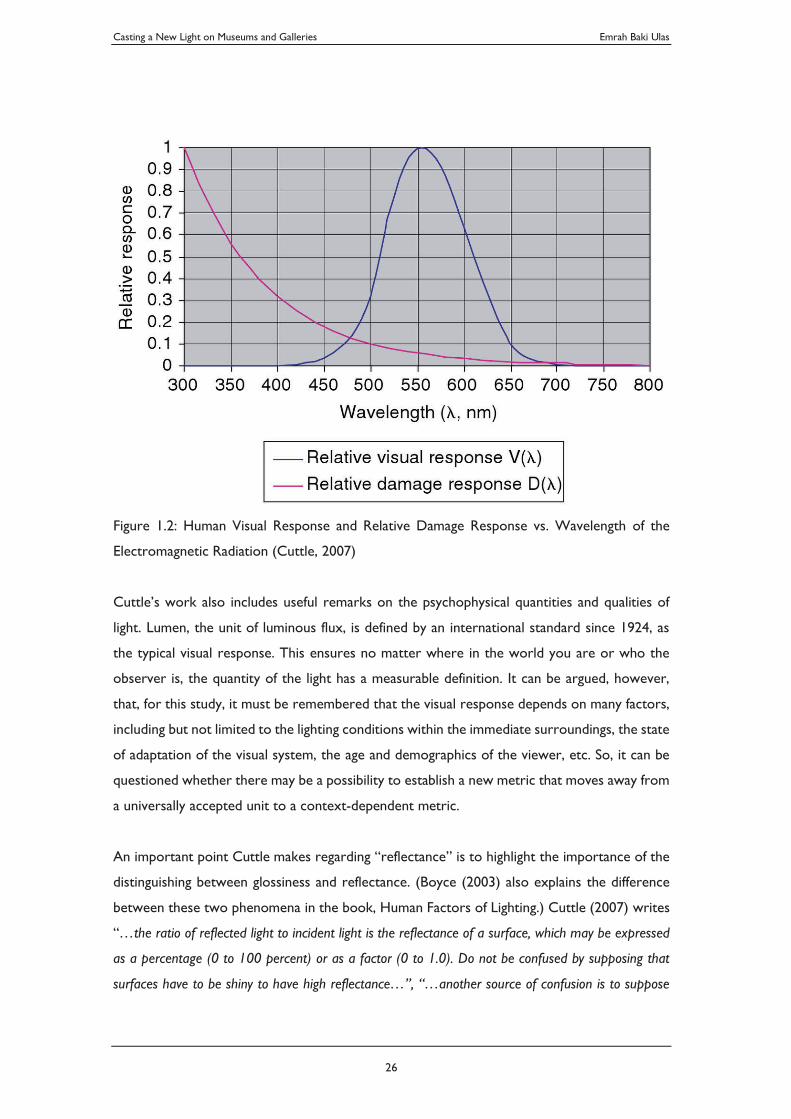
Figure 1.2: Human Visual Response and Relative Damage Response vs. Wavelength of the
Electromagnetic Radiation (Cuttle, 2007)
Cuttle’s work also includes useful remarks on the psychophysical quantities and qualities of
light. Lumen, the unit of luminous flux, is defined by an international standard since 1924, as
the typical visual response. This ensures no matter where in the world you are or who the
observer is, the quantity of the light has a measurable definition. It can be argued, however,
that, for this study, it must be remembered that the visual response depends on many factors,
including but not limited to the lighting conditions within the immediate surroundings, the state
of adaptation of the visual system, the age and demographics of the viewer, etc. So, it can be
questioned whether there may be a possibility to establish a new metric that moves away from
a universally accepted unit to a context-dependent metric.
An important point Cuttle makes regarding “reflectance” is to highlight the importance of the
distinguishing between glossiness and reflectance. (Boyce (2003) also explains the difference
between these two phenomena in the book, Human Factors of Lighting.) Cuttle (2007) writes
“…the ratio of reflected light to incident light is the reflectance of a surface, which may be expressed
as a percentage (0 to 100 percent) or as a factor (0 to 1.0). Do not be confused by supposing that
surfaces have to be shiny to have high reflectance…”, “…another source of confusion is to suppose
Casting a New Light on Museums and Galleries Emrah Baki Ulas
27
that what we assess to be a mid-lightness colour will have a reflectance around 0.5, whereas it is more
likely to be 0.2…”. The values of reflectance and glossiness of both the space and the object
have a significant impact on the visual response as well as the scale of the light-induced damage.
Exitance ( ), has been introduced as a term that makes account of reflected light, transmitted
light or light emitted by luminous material, combining the illuminance ( ) and reflectance ( )
in a simple formula as follows:
(1.1)
A more specialised lighting measurement that deals with the luminous intensity of a lit element
in a specific direction relative to its projected area in that direction, (in candelas per square
metre) is defined as the Luminance (L). Cuttle (2007) also notes that it is common for
luminance to be loosely applied to describing situations that are not viewpoint-specific, in which
it would be more appropriate and simpler to use Exitance. For the purposes of this research,
this is a very valuable remark. It may perhaps be worthwhile considering a fixed vista point in
assessing a viewer's visual response. For example, perhaps the viewpoint of an object, for the
visual assessment can be approximated at a certain distance away from the artwork and
positioned perpendicularly and at the centre.
Under the topic of “human response to light”, Cuttle (2007) discusses several issues that are
critical for exhibition display lighting. Adaptation from lower to higher and from higher to lower
light levels is highlighted as a key strength of the human visual system. Cuttle (2007) says
“human vision operates over a huge range of available light. From clear sky summer sunlight to
moonless starlight we can see our surroundings, albeit with different levels of effectiveness,
and this is a range of ambient light levels of around ten million to one…”
The ability of adaptation in human visual perception is what makes it possible for the museum
or gallery visitor to move into substantially lower levels of illumination comfortably, compared
to exterior light levels. This transition, however, needs to be carefully considered in the design
of the spaces and the exhibitions to ensure that the light levels are carefully managed to assist
the adaptation process adequately and to minimise the loss of the ability to discriminate detail
and colour.
Cuttle (2007) classifies the visual adaptation ranges into three groups; photopic, mesopic and
scotopic. (See Table 1.3).
Casting a New Light on Museums and Galleries Emrah Baki Ulas
28
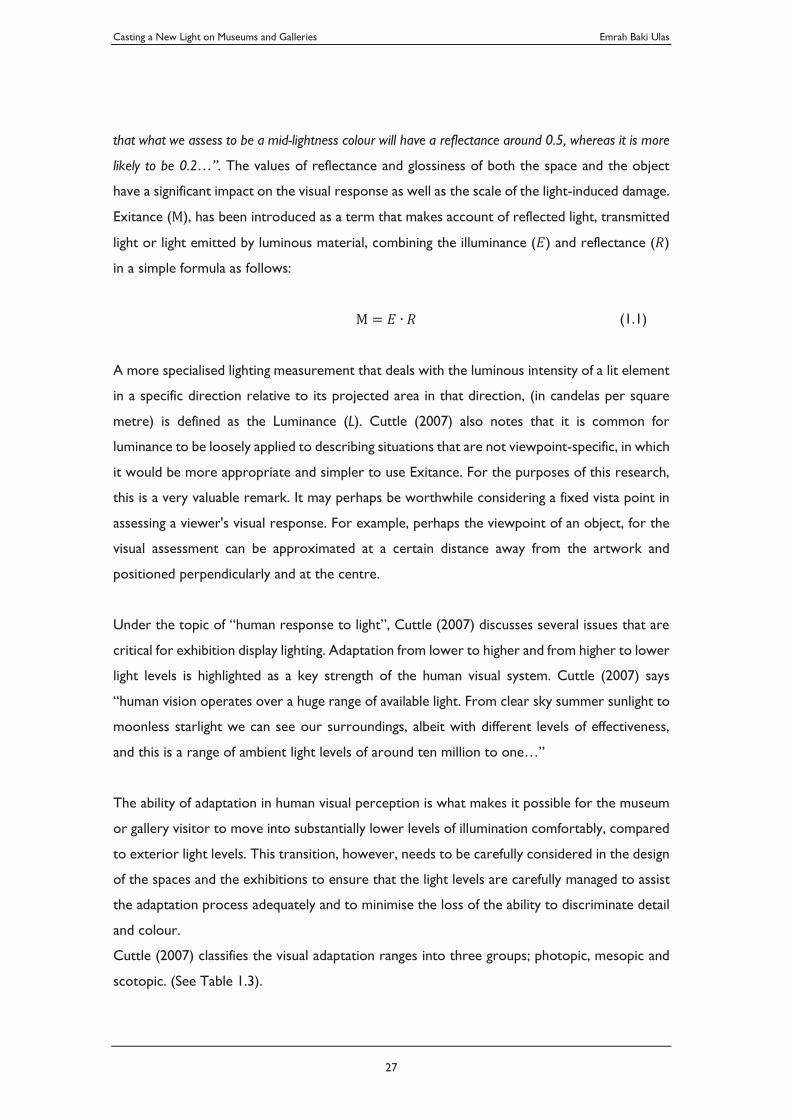
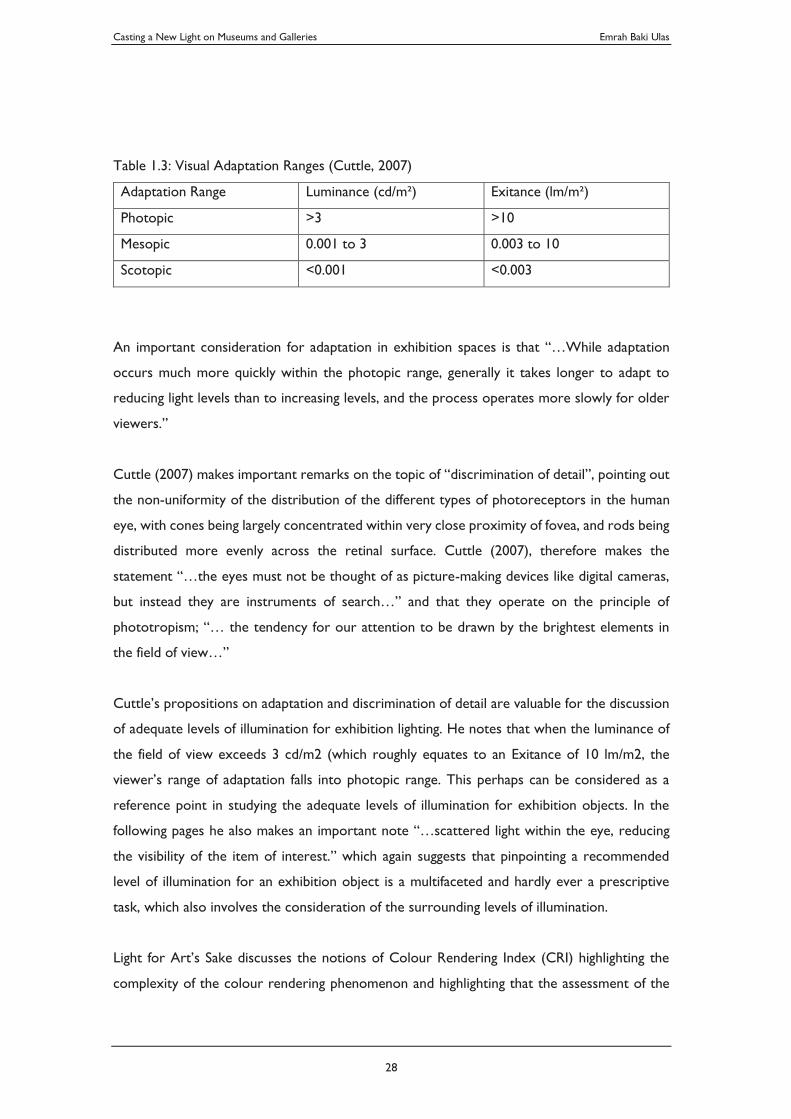
Table 1.3: Visual Adaptation Ranges (Cuttle, 2007)
Adaptation Range Luminance (cd/m²) Exitance (lm/m²)
Photopic >3 >10
Mesopic 0.001 to 3 0.003 to 10
Scotopic <0.001 <0.003
An important consideration for adaptation in exhibition spaces is that “…While adaptation
occurs much more quickly within the photopic range, generally it takes longer to adapt to
reducing light levels than to increasing levels, and the process operates more slowly for older
viewers.”
Cuttle (2007) makes important remarks on the topic of “discrimination of detail”, pointing out
the non-uniformity of the distribution of the different types of photoreceptors in the human
eye, with cones being largely concentrated within very close proximity of fovea, and rods being
distributed more evenly across the retinal surface. Cuttle (2007), therefore makes the
statement “…the eyes must not be thought of as picture-making devices like digital cameras,
but instead they are instruments of search…” and that they operate on the principle of
phototropism; “… the tendency for our attention to be drawn by the brightest elements in
the field of view…”
Cuttle’s propositions on adaptation and discrimination of detail are valuable for the discussion
of adequate levels of illumination for exhibition lighting. He notes that when the luminance of
the field of view exceeds 3 cd/m2 (which roughly equates to an Exitance of 10 lm/m2, the
viewer’s range of adaptation falls into photopic range. This perhaps can be considered as a
reference point in studying the adequate levels of illumination for exhibition objects. In the
following pages he also makes an important note “…scattered light within the eye, reducing
the visibility of the item of interest.” which again suggests that pinpointing a recommended
level of illumination for an exhibition object is a multifaceted and hardly ever a prescriptive
task, which also involves the consideration of the surrounding levels of illumination.
Light for Art’s Sake discusses the notions of Colour Rendering Index (CRI) highlighting the
complexity of the colour rendering phenomenon and highlighting that the assessment of the
Casting a New Light on Museums and Galleries Emrah Baki Ulas
29
rendering properties of a light source requires more sophisticated analysis. It also explains
Correlated Colour Temperature (CCT).
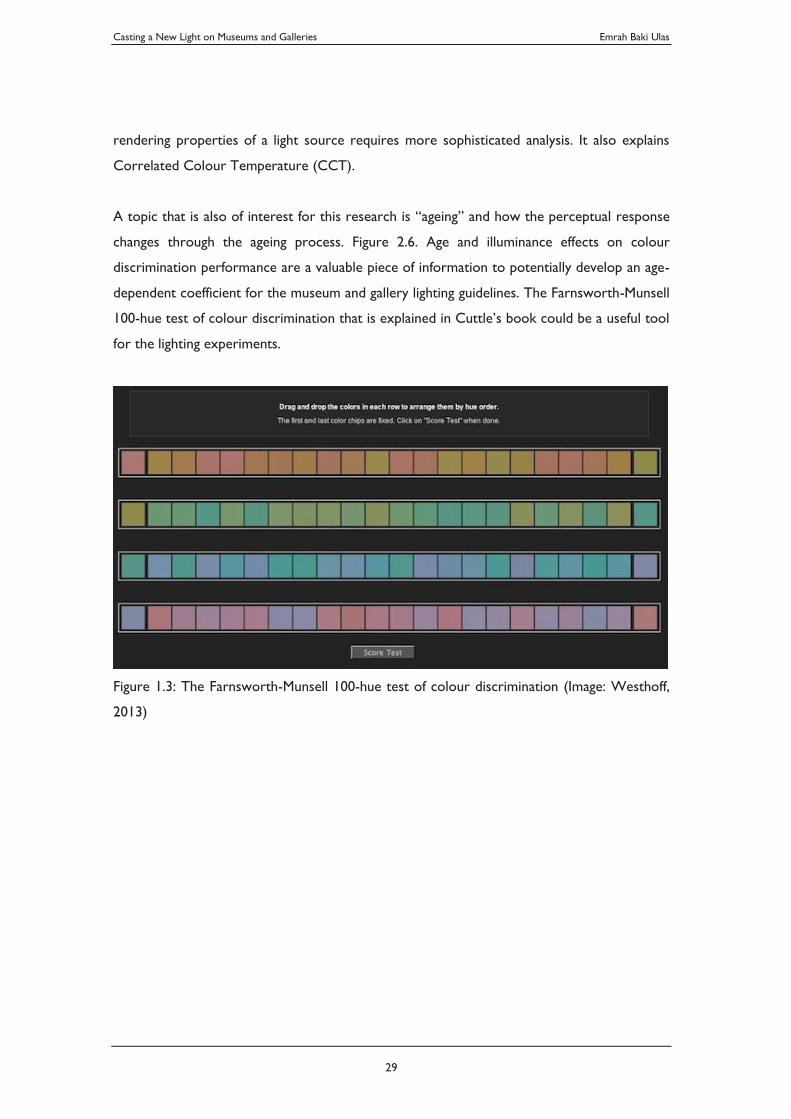
A topic that is also of interest for this research is “ageing” and how the perceptual response
changes through the ageing process. Figure 2.6. Age and illuminance effects on colour
discrimination performance are a valuable piece of information to potentially develop an age-
dependent coefficient for the museum and gallery lighting guidelines. The Farnsworth-Munsell
100-hue test of colour discrimination that is explained in Cuttle’s book could be a useful tool
for the lighting experiments.
Figure 1.3: The Farnsworth-Munsell 100-hue test of colour discrimination (Image: Westhoff,
2013)
Casting a New Light on Museums and Galleries Emrah Baki Ulas
30
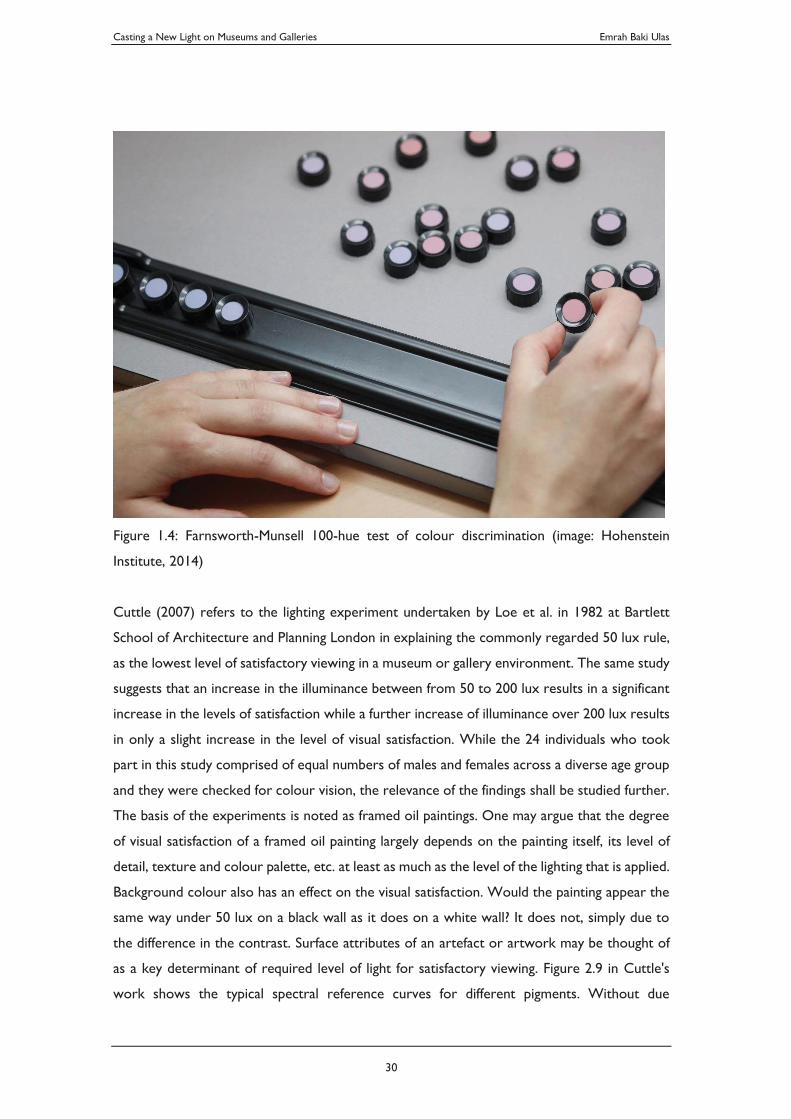
Figure 1.4: Farnsworth-Munsell 100-hue test of colour discrimination (image: Hohenstein
Institute, 2014)
Cuttle (2007) refers to the lighting experiment undertaken by Loe et al. in 1982 at Bartlett
School of Architecture and Planning London in explaining the commonly regarded 50 lux rule,
as the lowest level of satisfactory viewing in a museum or gallery environment. The same study
suggests that an increase in the illuminance between from 50 to 200 lux results in a significant
increase in the levels of satisfaction while a further increase of illuminance over 200 lux results
in only a slight increase in the level of visual satisfaction. While the 24 individuals who took
part in this study comprised of equal numbers of males and females across a diverse age group
and they were checked for colour vision, the relevance of the findings shall be studied further.
The basis of the experiments is noted as framed oil paintings. One may argue that the degree
of visual satisfaction of a framed oil painting largely depends on the painting itself, its level of
detail, texture and colour palette, etc. at least as much as the level of the lighting that is applied.
Background colour also has an effect on the visual satisfaction. Would the painting appear the
same way under 50 lux on a black wall as it does on a white wall? It does not, simply due to
the difference in the contrast. Surface attributes of an artefact or artwork may be thought of
as a key determinant of required level of light for satisfactory viewing. Figure 2.9 in Cuttle's
work shows the typical spectral reference curves for different pigments. Without due
Casting a New Light on Museums and Galleries Emrah Baki Ulas
31
reference to such colour spectrum response, a blanket lux level rule does not give an accurate
indication of required light for satisfactory viewing. For example when the same 50 lux is
applied on a blue surface vs. on a white surface, the absorbed and the reflected amount of light,
hence the level of visual response would be very different, resulting in two different levels of
visual satisfaction at the same light level. In addition to the differences in spectral response, the
direct vs. diffused reflection from a surface; i.e. its degree of glossiness would also impact on
the required level of light.
In conclusion, Cuttle’s text, Light for Art’s Sake explains the main principles of museum and
gallery lighting effectively, forming a key milestone document, encourages questioning of the
currently applied industry guidelines and standards and presents some important information
that would be of assistance in designing my research experiments.
Casting a New Light on Museums and Galleries Emrah Baki Ulas
32
1.3.1.3 Human Factors in Lighting (Boyce, 2003)
Human Factors in Lighting is a comprehensive text on a wide range of topics related to lighting.
For this research, the section on the perceptual constancies and the modes of appearance are
of particular interest.
This is due to the reasons of why and how lighting, in dialogue with the material can determine
the modes of appearance, therefore can assist in supporting or breaking perceptual constancies
depending on the design intent.
As Boyce (2003) also points out, light has a fundamental role in determining the perceived
visual attributes of objects, through the change of mode of appearance. The key visual
attributes; brightness, lightness, transparency, glossiness, hue and saturation are all determined
through the way lighting interacts with a material, its intensity, its incident angle, colour,
position, etc.
Boyce (2003) explains perceptual constancies as fundamental attributes of objects that are
maintained constant by the human perceptual system, although the lighting conditions may
change within a wide range. Boyce classifies these into four groups: Lightness constancy, colour
constancy, size constancy and shape constancy.
What is of particular interest in a museum or gallery environment lighting situation is the
opportunity to break the perceptual constancies, to enhance the experience of the visitor. The
use of differing intensity and colour spectrum compositions of light can assist in enhancing
certain visual attributes against others. Such considerations are often seen as part of curatorial
or artistic concerns and are seldom addressed in the determination of adequate lighting
conditions for museum or gallery lighting. The question here is whether the guidelines on
50/200 lux rule and other common practice such as the annual exposure limits can benefit
from the inclusion of wider considerations concerning the visual attributes of artefacts and
artworks.
Casting a New Light on Museums and Galleries Emrah Baki Ulas
33
1.3.1.4 International Commission on Illumination Technical Report CIE 157:2004
Established in 1913, International Commission on Illumination (Commission Internationale de
L'éclairage) abbreviated as CIE, is an internationally recognised body in the field of lighting and
optics. CIE’s technical report 157:2004 Control of damage to museum objects by optical
radiation is the organisation’s latest guiding document on the topic of museum and gallery
lighting and includes a range of information that is relevant to this research.
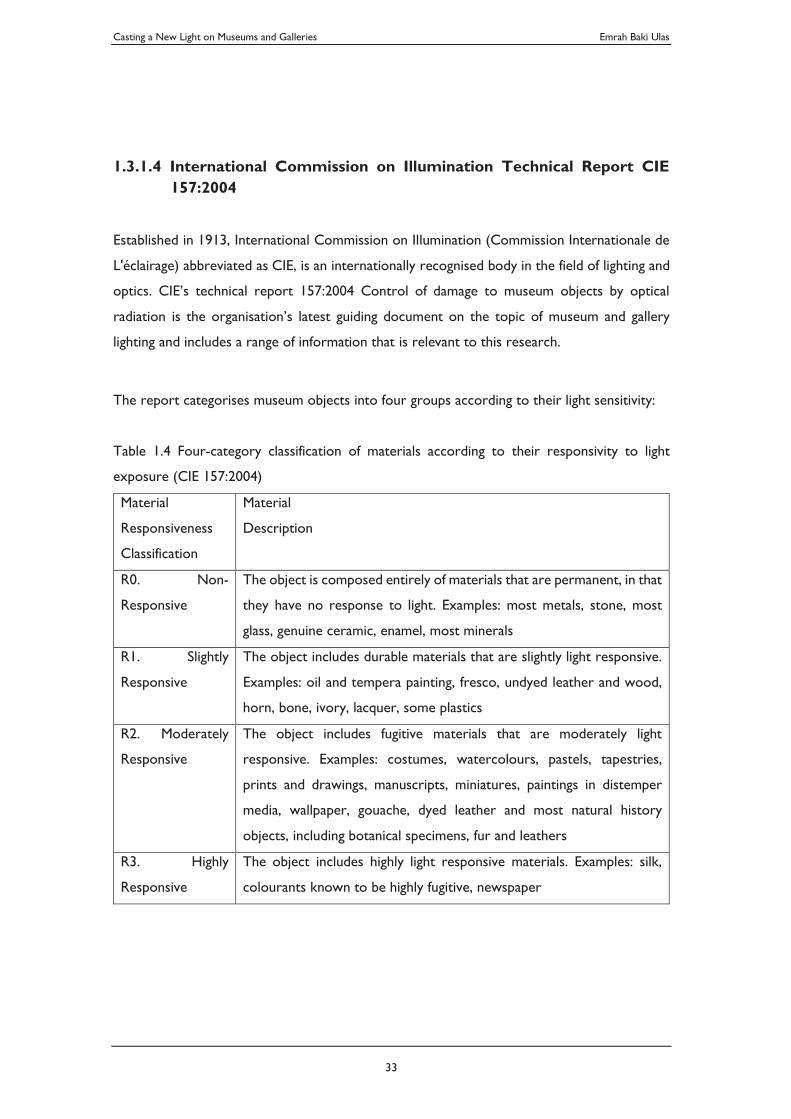
The report categorises museum objects into four groups according to their light sensitivity:
Table 1.4 Four-category classification of materials according to their responsivity to light
exposure (CIE 157:2004)
Material
Responsiveness
Classification
Material
Description
R0. Non-
Responsive
The object is composed entirely of materials that are permanent, in that
they have no response to light. Examples: most metals, stone, most
glass, genuine ceramic, enamel, most minerals
R1. Slightly
Responsive
The object includes durable materials that are slightly light responsive.
Examples: oil and tempera painting, fresco, undyed leather and wood,
horn, bone, ivory, lacquer, some plastics
R2. Moderately
Responsive
The object includes fugitive materials that are moderately light
responsive. Examples: costumes, watercolours, pastels, tapestries,
prints and drawings, manuscripts, miniatures, paintings in distemper
media, wallpaper, gouache, dyed leather and most natural history
objects, including botanical specimens, fur and leathers
R3. Highly
Responsive
The object includes highly light responsive materials. Examples: silk,
colourants known to be highly fugitive, newspaper
Casting a New Light on Museums and Galleries Emrah Baki Ulas
34
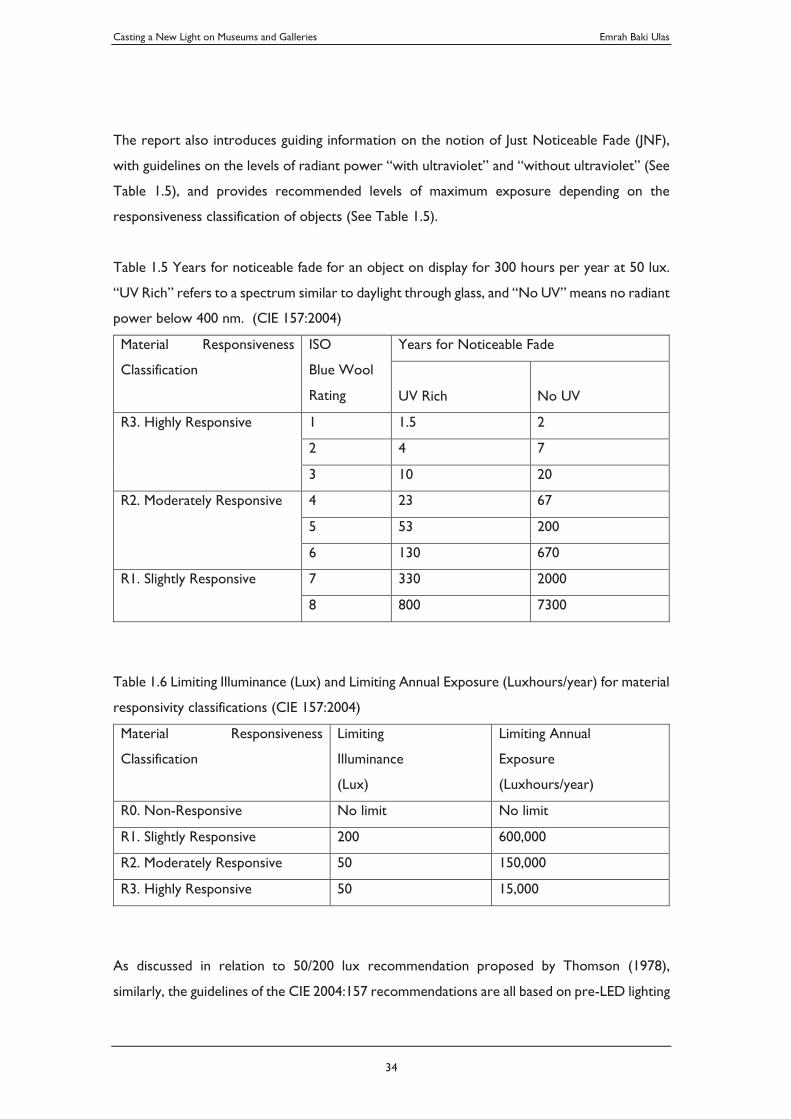
The report also introduces guiding information on the notion of Just Noticeable Fade (JNF),
with guidelines on the levels of radiant power “with ultraviolet” and “without ultraviolet” (See
Table 1.5), and provides recommended levels of maximum exposure depending on the
responsiveness classification of objects (See Table 1.5).
Table 1.5 Years for noticeable fade for an object on display for 300 hours per year at 50 lux.
“UV Rich” refers to a spectrum similar to daylight through glass, and “No UV” means no radiant
power below 400 nm. (CIE 157:2004)
Material Responsiveness
Classification
ISO
Blue Wool
Rating
Years for Noticeable Fade
UV Rich
No UV
R3. Highly Responsive 1 1.5 2
2 4 7
3 10 20
R2. Moderately Responsive 4 23 67
5 53 200
6 130 670
R1. Slightly Responsive 7 330 2000
8 800 7300
Table 1.6 Limiting Illuminance (Lux) and Limiting Annual Exposure (Luxhours/year) for material
responsivity classifications (CIE 157:2004)
Material Responsiveness
Classification
Limiting
Illuminance
(Lux)
Limiting Annual
Exposure
(Luxhours/year)
R0. Non-Responsive No limit No limit
R1. Slightly Responsive 200 600,000
R2. Moderately Responsive 50 150,000
R3. Highly Responsive 50 15,000
As discussed in relation to 50/200 lux recommendation proposed by Thomson (1978),
similarly, the guidelines of the CIE 2004:157 recommendations are all based on pre-LED lighting
Casting a New Light on Museums and Galleries Emrah Baki Ulas
35
technologies. While the ISO ratings and the categorisation of materials may remain the same,
it will not be unreasonable to expect changes to the guidance on the recommended levels of
exposure, again due to the fact that the spectral power distribution of Light-emitting Diodes
are different than the reference sources (such as Xenon Arc lamps) which have been used in
the studies that led to the current guidelines.
1.3.1.5 Guidelines for Selecting Solid-State Lighting for Museums (Getty, 2011)
A collaborative study between the Getty Institute and the Canadian Conservation Institute was
published in May 2011. This document remains as one of the latest significant studies in the
field globally. The study provides the museum and gallery sector with information on the
fundamentals of Light-Emitting Diode (LED) Lighting systems, as well as providing guidance on
the key aspects while choosing LEDs for museum and gallery lighting applications. While
important to include in the review of relevant literature because it addresses some topics that
have not previously been as extensively and coherently communicated to museum and gallery
industry, it may be argued that the article is aimed at museum and gallery professionals who
have limited knowledge or experience with the lighting systems. The amount of new
information in this document that has not been covered by the previously mentioned key
sources is therefore limited. It must also be noted that in the six years from this publication to
the present day Light-emitting Diodes have changed considerably.
1.3.1.6 A Survey of Various Light Sources for Exhibition Display (Ulas et al. 2010)
As part of a museum lighting workshop series in 2010 and 2011, Steensen Varming lighting
designers Emrah Baki Ulas and Mirjam Roos undertook a series of lighting surveys at the Art
Gallery of New South Wales, the Australian Museum and the Australian War Memorial. The
survey setup consisted of six identically printed displays of a manipulated Paul Klee painting
with numerous saturated and unsaturated colour patterns. Each print was individually
illuminated under a different source of light. All the six different light sources were concealed
from the viewers. A total of eighty-eight subjects, all professionals in museum and gallery
Casting a New Light on Museums and Galleries Emrah Baki Ulas
36
sector, were given a randomised list of the lights that are used in the setup and requested to
match the type of the light source with the relevant display they illuminated. The average
number of correct matches was almost as low as would be the case if subjects were asked to
guess randomly. The subjects were also requested to indicate their preference in terms of the
visual quality of the displays, which showed no trends or patterns of consensus on continuous
spectrum light sources being able to produce perceptually preferred results (Ulas et al., Casting
new Light on Your Collection Seminar Series, 2010-2011). This demonstrated that not only it
was difficult, even for museum professionals, to discriminate between the light effects and
marry these effects to particular types of lights, but also contrary to common assumption;
there was evidence that a satisfactory viewing experience did not necessitate a continuous
pattern in the spectral distribution of light output.
1.3.1.7 A Practical Guide for Sustainable Climate Control and Lighting in Museums and Galleries (Ulas et al., 2015)
This document, commissioned by the Australian Government and published in 2015 mainly
tackles the major issues of energy efficiency and sustainability issues in museums and galleries.
The document provides a guide for museums and galleries for ways to reduce their operating
expenses and carbon footprint and improve their long-term sustainability by using appropriate
technologies, products and systems. It also covers key background information on the museum
environment including how damage is caused, and the consequences of a poor environment
on collections and on the visitor experience, discusses the design considerations in selecting
both an appropriate climate control and lighting systems with specific focus on sustainable
outcomes, detailing the relative merits and cost aspects of a wide range of solutions that can
be considered when seeking to resolve or improve climate control and lighting issues.
The significance of this document in the context of this research is in that it advocates an
approach to the design and operation of building systems that adopts a tailored methodology
rather than conservative blanket methods to climate control and lighting. This way, rather than
treating an entire museum space uniformly and adjusting the environmental conditions to levels
that cater to the most vulnerable part of the collection, evidence-based risk management,
through better analysis and understanding of the items to be displayed and the characteristics
of building envelope and systems is promoted. This is in line with the key aim of the document
Casting a New Light on Museums and Galleries Emrah Baki Ulas
37
to better manage the energy aspects and address “sustainability” objectives of museums and
galleries.
The document recommends a four-stage process as follows:
1) Understanding the sensitivities and vulnerabilities of the collection, i.e. its susceptibility
to damage by poor environmental conditions.
2) Establishment of the environmental requirements for the collection arising from point
1, which may be varied.
3) Understanding the capacity of the building, climate control and lighting systems to
deliver the required environment.
4) Engaging in dialogue with all interested parties to agree on an optimum outcome which
takes into account the above points
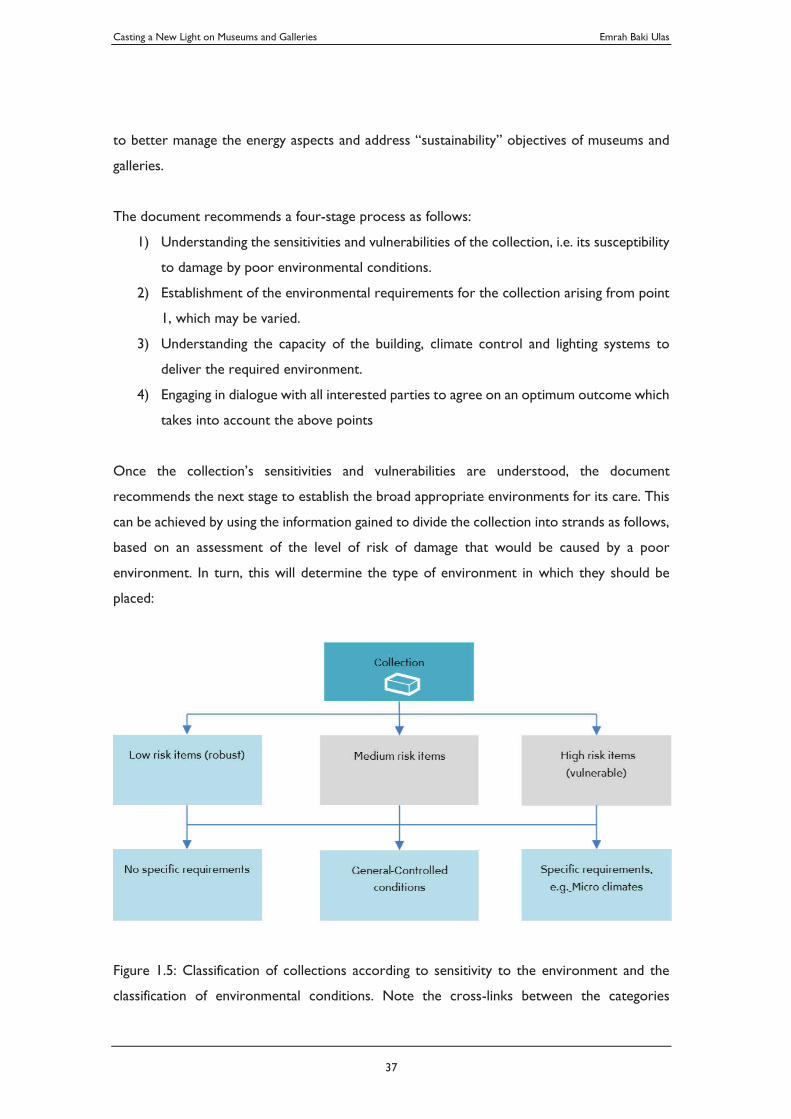
Once the collection’s sensitivities and vulnerabilities are understood, the document
recommends the next stage to establish the broad appropriate environments for its care. This
can be achieved by using the information gained to divide the collection into strands as follows,
based on an assessment of the level of risk of damage that would be caused by a poor
environment. In turn, this will determine the type of environment in which they should be
placed:
Figure 1.5: Classification of collections according to sensitivity to the environment and the
classification of environmental conditions. Note the cross-links between the categories
Casting a New Light on Museums and Galleries Emrah Baki Ulas
38
illustrating that environmental sensitivity is not the sole determinant for the determination of
the environmental conditions. (Ulas et al., 2015)
The significance of this type of categorisation of environmental conditions for museum spaces
is that, the sensitivity of a museum items do not solely dictate the level of control within where
it is kept or displayed, regardless of their risk category, some items may still be deemed as
requiring no specific environmental conditions, generally controlled or highly controlled
environments. The significance of the relevant collection items is, then a key factor in the
decision process, also for the display layout in relation to the narrative (See 3.1.3).
1.3.2. Government Legislations in Lighting
Within the last decade, several governments have regulated the lighting sector; setting
minimum standards for the luminous efficacy of light sources and setting maximum allowable
lighting power density for spatial typologies. Having specific lighting needs that often require
high power densities and can often only be catered by sources that compromise luminous
efficacy for higher spectral quality, the museum and gallery lighting sector is bound to be
affected by these regulations significantly. As a result of this and the global push for reducing
the energy demand of museums and galleries, best practice expectations for exhibition display
are evolving, and appropriate display lighting conditions for cultural collections and exhibitions
continue to be a major topic of discussion on an international level. Most of these discussions
revolve around the legislation regarding the phasing out of the inefficient incandescent light
sources, which have a significant impact on the museum and gallery facilities which traditionally
have made use of this lighting technology. This concerns not only the technical aspect of
systems and spaces both also the politics of space and the meanings of culture. This is,
therefore, a pressing issue.
Most government actions on the issue of lighting are driven by energy savings aspects, and are
triggered by the developments in lighting technologies within the last decade; these
developments shifted the focus of key lighting manufacturers into areas of research and product
development, which resulted in a change in the business interests as well as manufacturing
trends. It is predicted that the use of incandescent lighting is likely to shrink significantly within
the next decade, and even virtually disappear in some countries including Australia. Since most
Casting a New Light on Museums and Galleries Emrah Baki Ulas
39
museum and gallery lighting being primarily based on the incandescent lighting technology
(Steensen Varming, 2011), as far as museum and gallery sector is concerned, the phasing-out
of the inefficient light sources is perhaps the most significant legislation to date in history, in
the field of lighting.
Government legislations on the phase-out of the incandescent light sources have been widely
criticized by different groups and organisations for the extra costs imposed on the public by
government dicta, as well as for the light characteristics of the available alternative technologies
that do not match certain qualities of the incandescent lamps such as the continuous colour
spectrum, smooth dimming and colour shift when dimming, which can be preferable for certain
applications. There are also environmental concerns over the potential for mercury pollution
and contamination, particularly since the compact fluorescent (CFL) type lamps that have been
commonly proposed as replacement contain toxic mercury, and the amount of regulation and
guidance on the appropriate forms of disposal and recycling are very limited.
The Australian Government proposed the regulation in 2007, which came into effect in 2009
under the name "Minimum Energy Performance Standards (MEPS)". The legislation includes
sale and import restrictions on certain lamp types. The legislation continues today in a staged
manner, gradually removing inefficient light sources from the market.
Whether the legislation has forced the industry in a certain direction or not is debatable.
However, it is important to note that, despite the concerns on the new lighting legislation,
alternative lighting technologies have recently reached a stage where the basis for most
criticism is now hardly relevant. The quality of the light from sources such as the LEDs today
can provide seamless, if not superior outcomes compared to incandescent lamps. This brings
up a unique opportunity to revisit the traditional practices and provide more than a utilitarian
response.
Casting a New Light on Museums and Galleries Emrah Baki Ulas
40
1.3.3. Technological Shift in Lighting for Museum and Gallery Display
This research focuses on the Light-Emitting diodes as the modern day alternative sources for
museum and gallery exhibition lighting. However, it is worthwhile canvassing a wider range of
alternative technologies that have been used in replacing the incandescent lighting technology
within the last decade.
Three technologies can be described as being practically available options currently in the
lighting market for museums and galleries. These provide good quality lighting with significantly
less operational energy compared to the incandescent sources. These are high-pressure
discharge sources (lamps such as the metal halide and white SON), low-pressure discharge
sources (fluorescent lamps and compact fluorescent lamps), and Light-emitting Diodes (LEDs).
Although each has distinct characteristics and qualities that differ, all of these technologies offer
certain advantages.
High colour rendering versions of the high-pressure discharge lamps have been developed
within the last few years. These sources offer crisp white light and superior illumination
characteristics suitable for certain types of display lighting applications while being energy
efficient. An advantage of these sources is that they can generate very high intensities of light
in small point source. Also, being a point source, they can be effectively controlled via optical
means to achieve different effects. It must be taken into account, however, that these types of
lamps are not practically dimmable through electronic means and their extended re-strike time
makes them impractical for certain uses within an exhibition context.
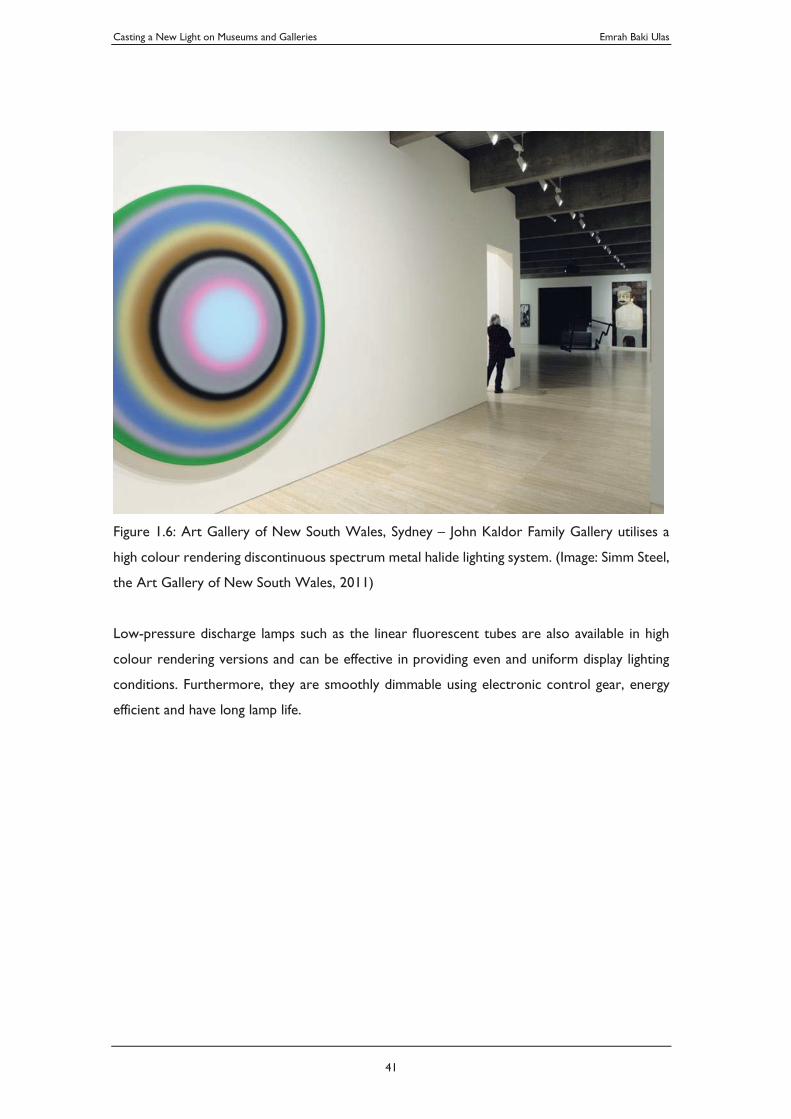
Casting a New Light on Museums and Galleries Emrah Baki Ulas
41
Figure 1.6: Art Gallery of New South Wales, Sydney – John Kaldor Family Gallery utilises a
high colour rendering discontinuous spectrum metal halide lighting system. (Image: Simm Steel,
the Art Gallery of New South Wales, 2011)
Low-pressure discharge lamps such as the linear fluorescent tubes are also available in high
colour rendering versions and can be effective in providing even and uniform display lighting
conditions. Furthermore, they are smoothly dimmable using electronic control gear, energy
efficient and have long lamp life.
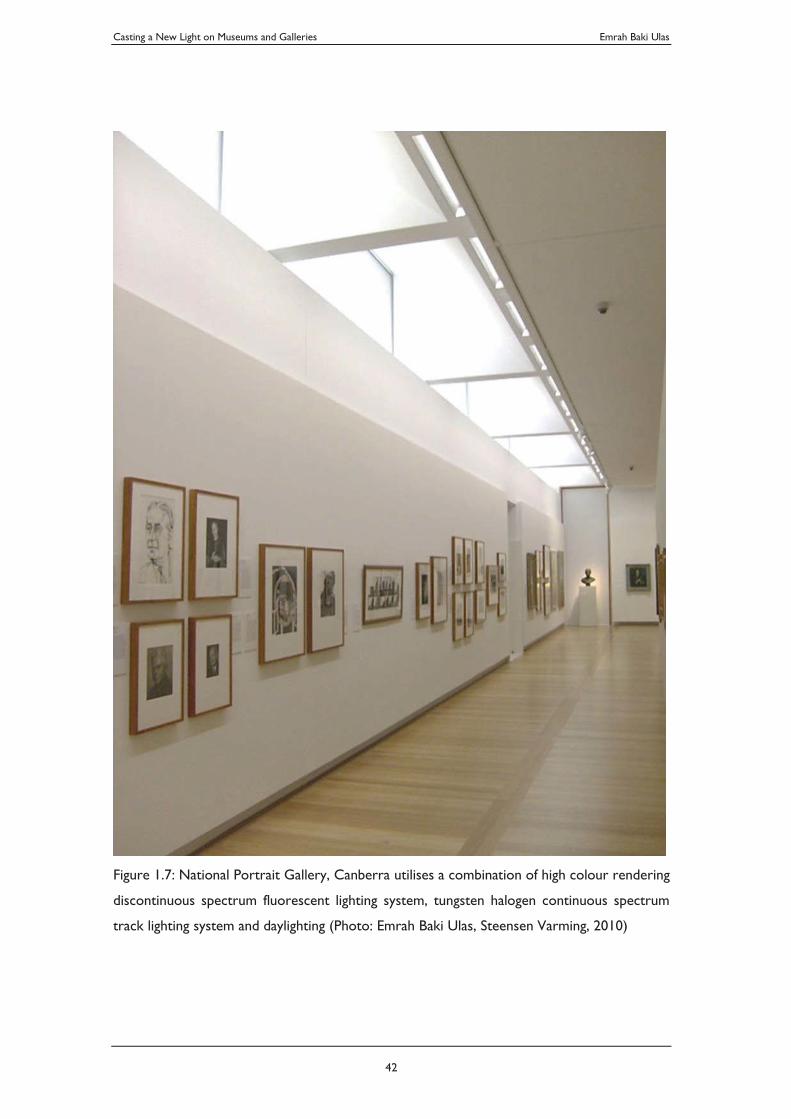
Casting a New Light on Museums and Galleries Emrah Baki Ulas
42
Figure 1.7: National Portrait Gallery, Canberra utilises a combination of high colour rendering
discontinuous spectrum fluorescent lighting system, tungsten halogen continuous spectrum
track lighting system and daylighting (Photo: Emrah Baki Ulas, Steensen Varming, 2010)
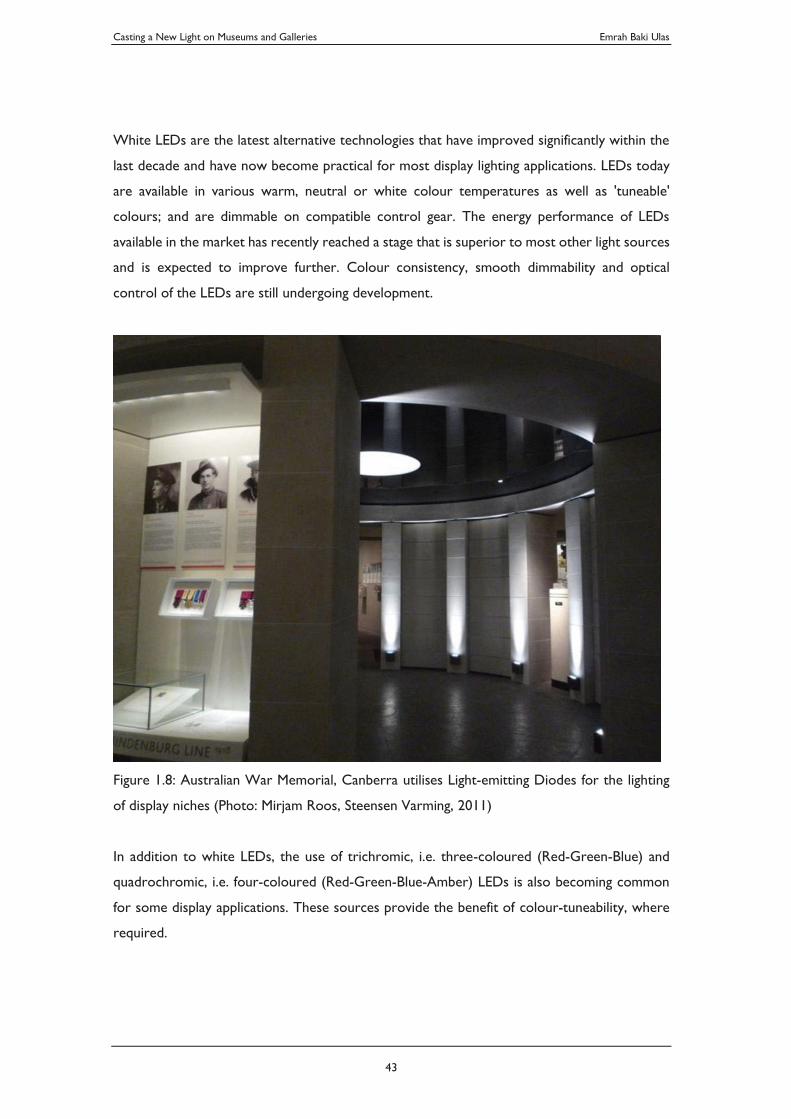
Casting a New Light on Museums and Galleries Emrah Baki Ulas
43
White LEDs are the latest alternative technologies that have improved significantly within the
last decade and have now become practical for most display lighting applications. LEDs today
are available in various warm, neutral or white colour temperatures as well as 'tuneable'
colours; and are dimmable on compatible control gear. The energy performance of LEDs
available in the market has recently reached a stage that is superior to most other light sources
and is expected to improve further. Colour consistency, smooth dimmability and optical
control of the LEDs are still undergoing development.
Figure 1.8: Australian War Memorial, Canberra utilises Light-emitting Diodes for the lighting
of display niches (Photo: Mirjam Roos, Steensen Varming, 2011)
In addition to white LEDs, the use of trichromic, i.e. three-coloured (Red-Green-Blue) and
quadrochromic, i.e. four-coloured (Red-Green-Blue-Amber) LEDs is also becoming common
for some display applications. These sources provide the benefit of colour-tuneability, where
required.
Casting a New Light on Museums and Galleries Emrah Baki Ulas
44
Organic Light-Emitting Diode is another upcoming technology. There has been significant
interest and development in OLEDs in the recent years. While the practical uses of these
sources are still limited to decorative effects and low brightness applications for screens,
mobile devices, etc. It is predicted that they will become common in the architectural lighting
market in the future.
Each of the light sources mentioned above has a considerably different spectral composition of
wavelengths in their light output, therefore provide varying visual results in exhibition
environments. The future potential of LED technology in replacing all other lighting
technologies within a foreseeable future is however beyond all others mentioned and is
apparent from many indicators, including the latest lighting industry publications, trade shows
that showcase the latest product developments as well as the increasing economic share of the
LEDs in the lighting market.
Having reviewed the academic and practice context of museum lighting and set out the
objectives of the research, in the next two chapters I will study two critical aspects in relation
to the use of light in museums and galleries. Chapter 2 will deal with the visitor experience, in
particular discussing and evaluating visual acuity in detail. This will include a range of
experiments. Chapter 3 will discuss and evaluate the issues relating to collections care and will
include a range of mathematical derivations towards forming a proposed new outline for
conservation guidelines for lighting in museums.
Casting a New Light on Museums and Galleries Emrah Baki Ulas
45
2. Light and Visual Acuity in Museums and Galleries
This chapter deals predominantly with the visitor experience. It discusses the role that lighting
plays in a museum display context in shaping the viewer’s experience. It embarks on the topic
providing an evaluation of what constitutes the foundations of adequate lighting for satisfactory
viewing conditions in section 2.1. Later, in section 2.2 the question of adequacy is further
articulated in a framework that considers the object, its context, the viewer and the lighting
conditions. Section 2.3 is the experimental component where the proposed framework is put
to test. The following sections; 2.4 and 2.5 provide a detailed evaluation of the results of the
experiment and summarises the outcomes. Issues relating to lighting and collections care will
later be discussed in further detail in Chapter 3.
2.1. Evaluating the Adequacy of Lighting for Satisfactory Viewing of Exhibition Display
Light renders the spaces and contexts, reveals or hides spatial elements, guides and aids in
orientation or specific visual tasks, and sets the overall atmosphere and the mood. In a museum
or gallery display context, in addition to the above, it is also a crucial element in providing the
conditions for satisfactory viewing of collections on display. It is a determinant factor both for
examination and for the enjoyment of collections. Light sets the visual context and the
character of a collection display, determines the degree of drama, changes the balance of what
is revealed and what remains unseen, what is accentuated and what is subdued; renders or
hides colours and details, conveys essential information about the collection.
Since light is the means that carries visual information and creates visual stimuli in the human
perceptual system, it is a key factor in determining the visual attributes. It is possible, by altering
lighting conditions, to change the type and range of perceived colours and details of items on
Casting a New Light on Museums and Galleries Emrah Baki Ulas
46
display. Therefore the “choice” of light in a museum or gallery environment is a major decision
in shaping both the spatial and architectural context as well as how the visitor will experience
the displayed collection.
For the above reason, the design of lighting in a museum or gallery environment requires due
consideration and careful study of a wide range of technical, environmental, curatorial and
artistic aspects which often may have conflicting requirements and need to be balanced against
one another. With this lighting seldom is a prescripted task and often requires a complex and
tailored decision-making process. On the other hand, a common base for best practice is
essential in order to make this complex task more accessible and practically manageable for
day-to-day operation of many museums and galleries; especially those who may not have
appropriately qualified museum lighting experts available to them or simply may not be able to
or willing to devote the required resources to study and analyse these complex issues to
address lighting of collections on a case by case, item by item, space by space or circumstance
by circumstance basis.
A challenge in generating such common-base best practice guidance is to simplify a complex
matter into a practical and easy-to-use tool. It is essential for such tools to be universally
understandable, measurable and relevant for a myriad of different types of collection items
despite their differences. Another challenge is in balancing the “visual” requirements for
satisfactory viewing conditions, against requirements for preventive conservation of collections
(also see 3.1). Preventive conservation guidance in lighting essentially aims to limit both the
level of light exposure and the duration of exposure to minimise photodegradation (light-
induced damage) to collections; especially to the types of items that are more sensitive to light.
Metaphorically, one can argue that those items that are classified to be more vulnerable to light
damage also ( and without generalisation) often tend to be the types of items that may benefit
most from higher levels of lighting for display and presentation purposes, due to their delicacy
of the materials, paint dyes, already degraded composition etc. In this sense, the largely
conflicting requirements of lighting for visual acuity and preventive conservation becomes even
more apparent. Added to the above, since these two issues are often looked after by different
professionals (one often being exhibition designers or lighting designers, and the other the
conservator), the need for an easy-to-understand guideline, for ease of communication
becomes obvious.
Casting a New Light on Museums and Galleries Emrah Baki Ulas
47
2.1.1. The “50 Lux” Rule
The earlier part of this thesis canvasses a range of background that has largely been accepted
by museums and galleries around the world as key reference documents in this field,
recommending technical rules to follow for the lighting of museum and gallery collections (See
1.3.1). Two of these documents are worth discussing further in this section; The Museum
Environment (1978) by Garry Thomson and the International Commission on Illumination Technical
Report CIE 157:2004.
As noted earlier in the document (see 1.3.1), Thomson (1978) suggests that the law of
reciprocity (of the level of exposure and duration exposure) applies to the process of light-
induced damage and suggests that to reduce both illuminance and time of exposure are
effective strategies in reducing light-induced damage. The task of protecting a sensitive
collection item against light-induced damage is, therefore, simply put to keep it in darkness or
under as dim light conditions as possible for as long as possible.
To tackle the challenge of preserving collection items on display against light-induced damage,
as practically as possible and in an easy-to-understand and easy-to-measure method, Thomson
(1978) summarises, what he refers to as 50/200 lux rule, as per Table 1.1; Recommended
Maximum Illuminances is widely accepted and recommended internationally by many
professional bodies that have published professional best-practice guidelines about this topic.
It must be noted that, while the 50/200 lux rule does provide a benchmark level, in an attempt
to provide a balance between the preventive conservation requirements vs. the visual comfort
and performance within gallery spaces, the actual level and duration of exposure of lighting that
may be adequate both for preventive conservation perspective and from a collection display
visual acuity perspective can be drastically different than the blanket conditions that this rule
suggests (Ford et al., 2011). Ford et al. (2011) have undertaken a study of methods by which
microfading experiments were undertaken at The National Museum of Australia and the results
of light-induced fading were compared to those that follow the current museum guidelines to
demonstrate the discrepancies of the current guidelines and the potential benefits to the
collection care and museum economics in few examples.
Casting a New Light on Museums and Galleries Emrah Baki Ulas
48
As discussed concerning 50/200 lux recommendation put forward by Thomson (1978),
similarly, the guidelines of the CIE 157:2004 recommendations are all based on pre-LED lighting
technologies. Whilst, the ISO Blue Wool classification ratings and the categorisation of
materials based on accelerated sunlight exposure may remain similar, it will not be
unreasonable to expect changes to the guidance on the recommended levels of exposure, again
due to the fact that the spectral power distribution of LEDs are different than the reference
sources which have previously been used in the studies that led to the current guidelines.
I will leave the topic of preventive conservation aside since that will be discussed in detail in
the next chapter. For this chapter of the thesis, the key topic of concern is the widely accepted
industry rule of thumb that suggests 50 Lux be the minimum recommended level of illumination
for satisfactory viewing conditions for museums and gallery display (CIE 157:2004). This
common rule of thumb addresses only a fraction of a very complex issue, it is highly
problematic, and often can lead to undesirable lighting conditions for museum display. Hence,
it is in need of imminent revision.
Fundamentally, it is important to note that the answer to the question of “adequate lighting for
satisfactory viewing” is a highly complex one. While often dependent on the level of
illuminance, it also is dependent on numerous other important factors that are dependent on
the object that is on display, the display space as well as the viewer’s biological, psychological
and perceptual circumstances. As satisfactory viewing is a highly subjective matter, what lighting
conditions are adequate and what lighting conditions are not, is also a subjective matter.
Criteria in determining these conditions require an approach that considers all the complex
factors that would play a role. Some of these factors are inherent to the individual who views
the display. The age of the viewer, for instance, is an important factor to consider, as the ability
of the human visual system in seeing colours and details reduces by age. Before discussing
various factors in a more holistic manner, let us first study this “50 lux rule” in detail, as it will
soon become apparent that this currently used metric of illuminance alone is far from being
sufficient for a complete assessment of what constitutes minimum adequate lighting
requirements for satisfactory viewing.
In order to evaluate the various factors that play a role in determining the adequacy of lighting
for Satisfactory Viewing of Museum Display, and suggest a more thorough and accurate
method, let us delve into a detailed analysis of some of the key considerations for the object
Casting a New Light on Museums and Galleries Emrah Baki Ulas
49
(the article on display), the context in which this object is displayed, the viewer (typically being
the museum or gallery visitor) and the light. It is foreseen that such quest has the potential to
help form a much-improved appreciation for addressing the question of museum and gallery
display lighting. It is also certain that an improved metric or method while providing a vastly
advanced guide, would not be all-encompassing and the need for thoughtful and thorough
design analysis on a case by case basis remains. We must also appreciate the fact that the
interdependencies between the elements that are separately discussed below are indeed
intertwined and that the rationale for the methodology of the analysis below is based on
pragmatic grounds, despite having certain limitations and generalisations.
2.1.2. Lighting and the Object
Let’s start with dismantling the “50 Lux” Rule, to better analyse its basis:
[lux] is the SI unit of measurement for illuminance. As a photometric term, illuminance is
described to be the total portion of luminous flux that is incident on a surface, per unit area.
Luminous flux is a measure of the perceived power of light radiation, i.e. perceived energy of
light radiation per unit time, based on the luminosity function (see Figure 2.1). The SI
measurement unit for luminous flux is [lumen]. Mathematically, for illuminance, Lux can be
described as lumen/m2.
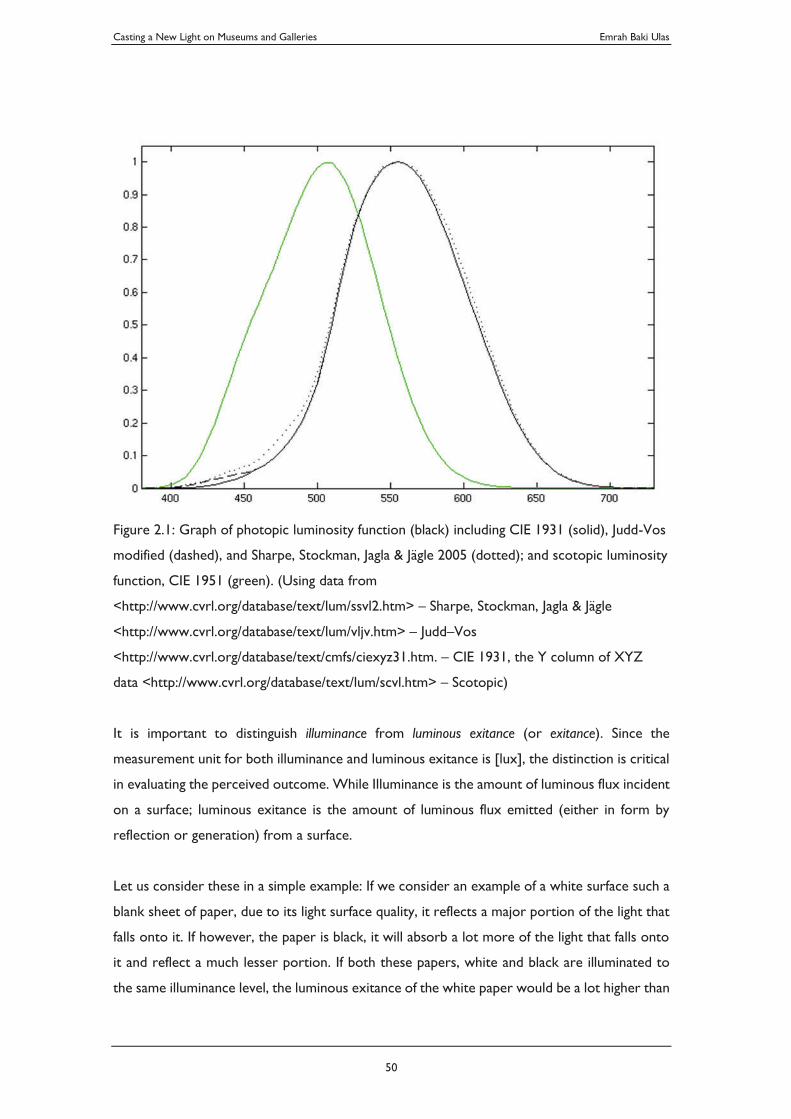
Casting a New Light on Museums and Galleries Emrah Baki Ulas
50
Figure 2.1: Graph of photopic luminosity function (black) including CIE 1931 (solid), Judd-Vos
modified (dashed), and Sharpe, Stockman, Jagla & Jägle 2005 (dotted); and scotopic luminosity
function, CIE 1951 (green). (Using data from
<http://www.cvrl.org/database/text/lum/ssvl2.htm> – Sharpe, Stockman, Jagla & Jägle
<http://www.cvrl.org/database/text/lum/vljv.htm> – Judd–Vos
<http://www.cvrl.org/database/text/cmfs/ciexyz31.htm. – CIE 1931, the Y column of XYZ
data <http://www.cvrl.org/database/text/lum/scvl.htm> – Scotopic)
It is important to distinguish illuminance from luminous exitance (or exitance). Since the
measurement unit for both illuminance and luminous exitance is [lux], the distinction is critical
in evaluating the perceived outcome. While Illuminance is the amount of luminous flux incident
on a surface; luminous exitance is the amount of luminous flux emitted (either in form by
reflection or generation) from a surface.
Let us consider these in a simple example: If we consider an example of a white surface such a
blank sheet of paper, due to its light surface quality, it reflects a major portion of the light that
falls onto it. If however, the paper is black, it will absorb a lot more of the light that falls onto
it and reflect a much lesser portion. If both these papers, white and black are illuminated to
the same illuminance level, the luminous exitance of the white paper would be a lot higher than
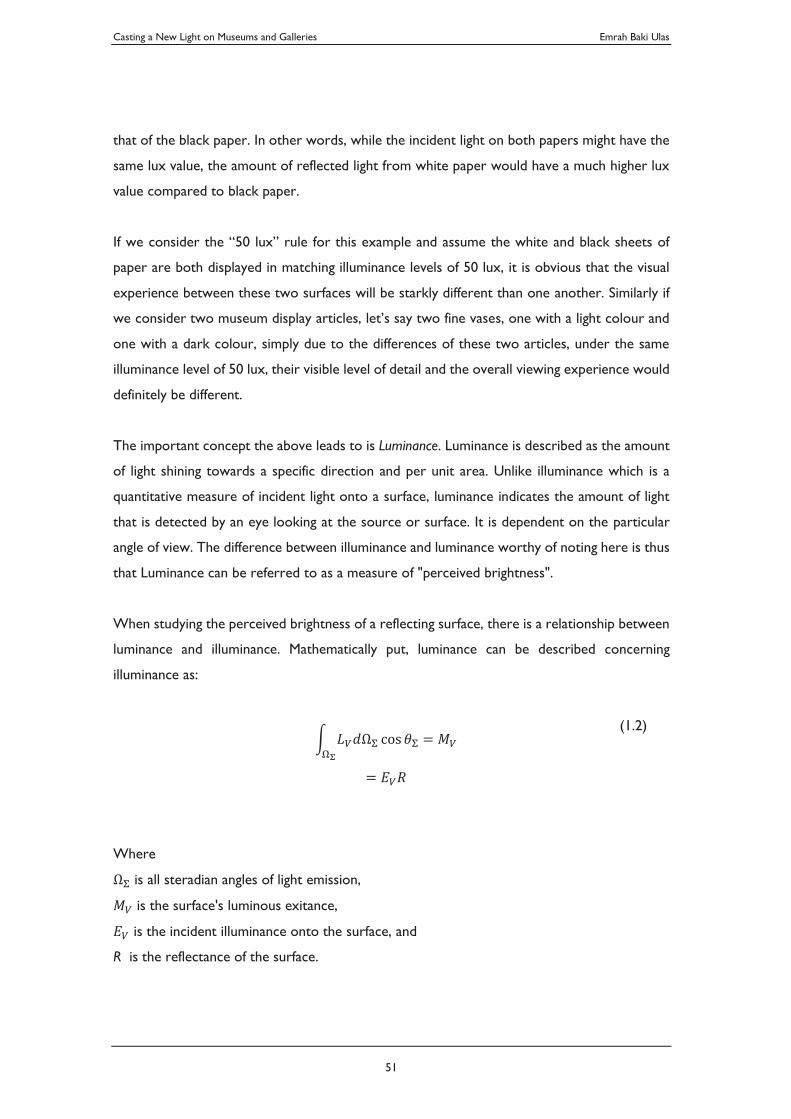
Casting a New Light on Museums and Galleries Emrah Baki Ulas
51
that of the black paper. In other words, while the incident light on both papers might have the
same lux value, the amount of reflected light from white paper would have a much higher lux
value compared to black paper.
If we consider the “50 lux” rule for this example and assume the white and black sheets of
paper are both displayed in matching illuminance levels of 50 lux, it is obvious that the visual
experience between these two surfaces will be starkly different than one another. Similarly if
we consider two museum display articles, let’s say two fine vases, one with a light colour and
one with a dark colour, simply due to the differences of these two articles, under the same
illuminance level of 50 lux, their visible level of detail and the overall viewing experience would
definitely be different.
The important concept the above leads to is Luminance. Luminance is described as the amount
of light shining towards a specific direction and per unit area. Unlike illuminance which is a
quantitative measure of incident light onto a surface, luminance indicates the amount of light
that is detected by an eye looking at the source or surface. It is dependent on the particular
angle of view. The difference between illuminance and luminance worthy of noting here is thus
that Luminance can be referred to as a measure of "perceived brightness".
When studying the perceived brightness of a reflecting surface, there is a relationship between
luminance and illuminance. Mathematically put, luminance can be described concerning
illuminance as:
(1.2)
Where
is all steradian angles of light emission,
is the surface's luminous exitance,
is the incident illuminance onto the surface, and
R is the reflectance of the surface.
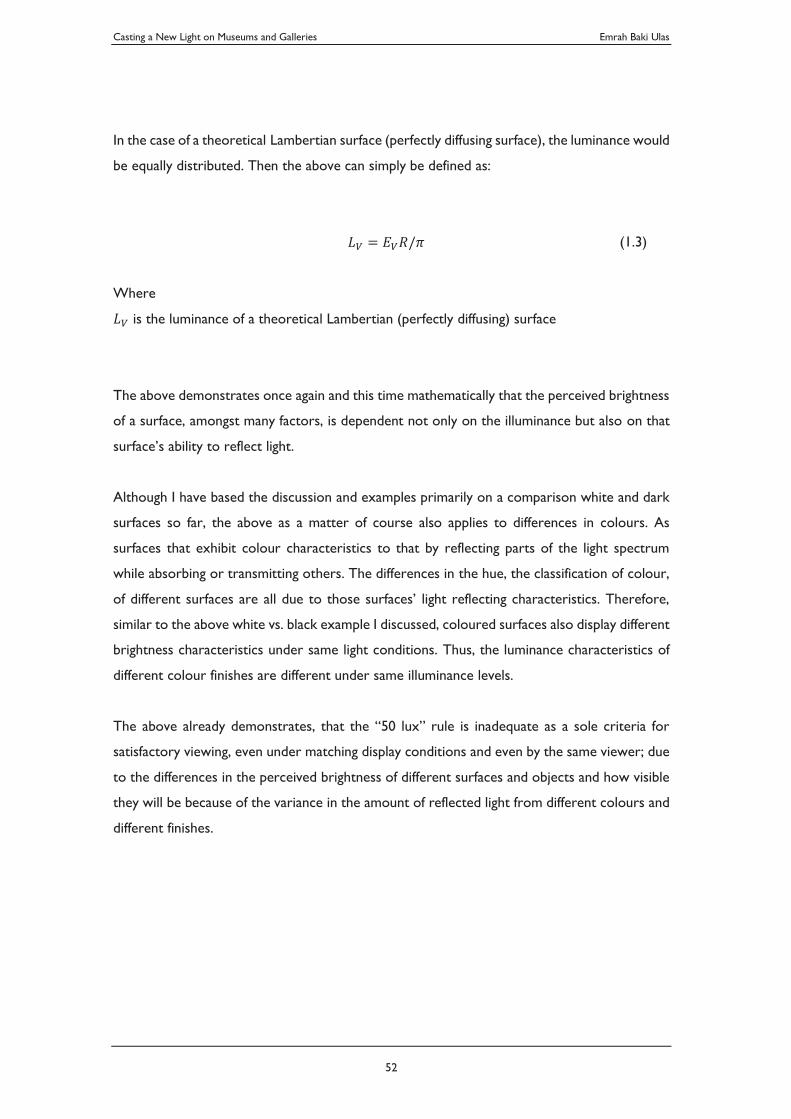
Casting a New Light on Museums and Galleries Emrah Baki Ulas
52
In the case of a theoretical Lambertian surface (perfectly diffusing surface), the luminance would
be equally distributed. Then the above can simply be defined as:
(1.3)
Where
is the luminance of a theoretical Lambertian (perfectly diffusing) surface
The above demonstrates once again and this time mathematically that the perceived brightness
of a surface, amongst many factors, is dependent not only on the illuminance but also on that
surface’s ability to reflect light.
Although I have based the discussion and examples primarily on a comparison white and dark
surfaces so far, the above as a matter of course also applies to differences in colours. As
surfaces that exhibit colour characteristics to that by reflecting parts of the light spectrum
while absorbing or transmitting others. The differences in the hue, the classification of colour,
of different surfaces are all due to those surfaces’ light reflecting characteristics. Therefore,
similar to the above white vs. black example I discussed, coloured surfaces also display different
brightness characteristics under same light conditions. Thus, the luminance characteristics of
different colour finishes are different under same illuminance levels.
The above already demonstrates, that the “50 lux” rule is inadequate as a sole criteria for
satisfactory viewing, even under matching display conditions and even by the same viewer; due
to the differences in the perceived brightness of different surfaces and objects and how visible
they will be because of the variance in the amount of reflected light from different colours and
different finishes.
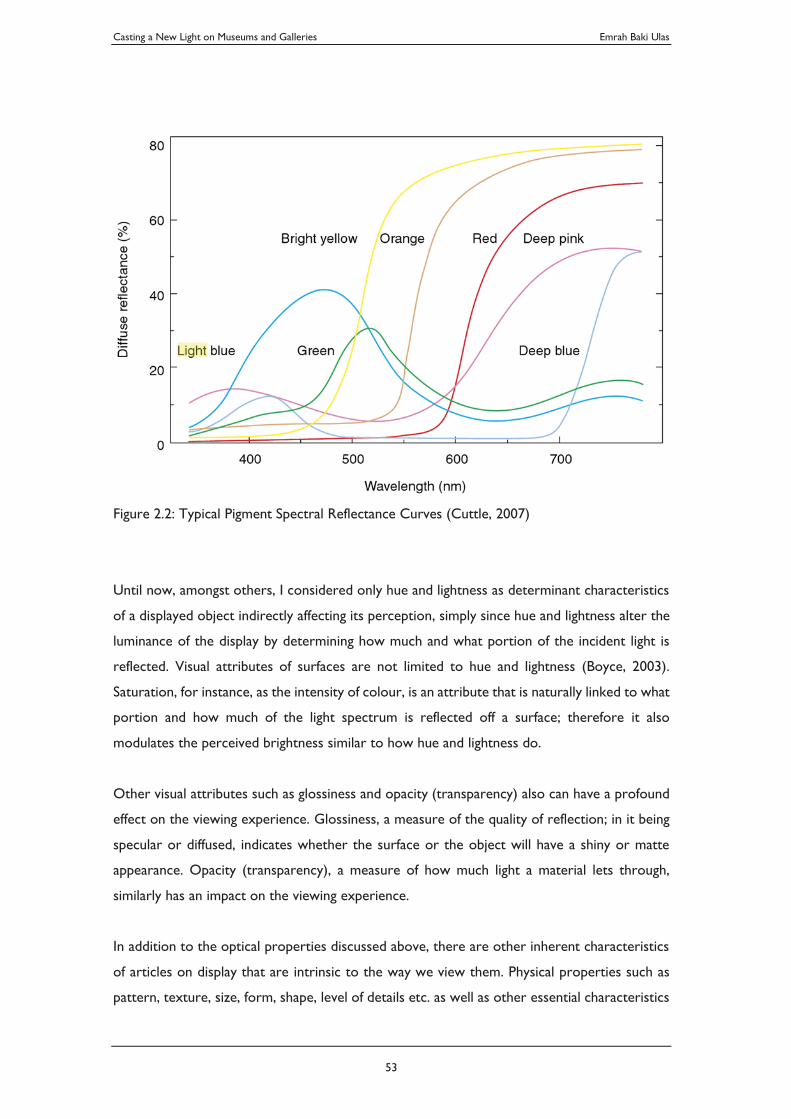
Casting a New Light on Museums and Galleries Emrah Baki Ulas
53
Figure 2.2: Typical Pigment Spectral Reflectance Curves (Cuttle, 2007)
Until now, amongst others, I considered only hue and lightness as determinant characteristics
of a displayed object indirectly affecting its perception, simply since hue and lightness alter the
luminance of the display by determining how much and what portion of the incident light is
reflected. Visual attributes of surfaces are not limited to hue and lightness (Boyce, 2003).
Saturation, for instance, as the intensity of colour, is an attribute that is naturally linked to what
portion and how much of the light spectrum is reflected off a surface; therefore it also
modulates the perceived brightness similar to how hue and lightness do.
Other visual attributes such as glossiness and opacity (transparency) also can have a profound
effect on the viewing experience. Glossiness, a measure of the quality of reflection; in it being
specular or diffused, indicates whether the surface or the object will have a shiny or matte
appearance. Opacity (transparency), a measure of how much light a material lets through,
similarly has an impact on the viewing experience.
In addition to the optical properties discussed above, there are other inherent characteristics
of articles on display that are intrinsic to the way we view them. Physical properties such as
pattern, texture, size, form, shape, level of details etc. as well as other essential characteristics

Casting a New Light on Museums and Galleries Emrah Baki Ulas
54
of displays, such as their heritage and cultural value, their age, their condition, artistic or
documentary importance etc. all have deep impact on what one would describe a viewing
experience to be satisfactory. All these may require different lighting conditions; not only in
terms of illuminance, but also in terms of other quantitative and qualitative aspects, such as
spectral composition, correlated colour temperature, colour rendering characteristics as well
as beam distribution, whether light is being emitted from a point source, linear or a diffused
source, whether light is being delivered to the display directly or indirectly (by bouncing off a
surface), etc.
2.1.3. Lighting and the Context
Discussing the object related issues, I have considered the displayed article in isolation. I
discussed the effect of its optical properties and other distinctive characteristics on the way it
would be perceived. I discussed a range of factors that influence the dialogue of the display
article and light. I substantiated the reasoning why illuminance alone cannot be a sufficient
metric to assess the adequacy of lighting for satisfactory viewing.
Here, in context, I will look at the spatial realm; the background where a display object is
situated in and will question how it may also play a value on the visual perception of the object,
and how this may relate to lighting conditions. The perception of a visual stimulus in any
environment is interdependent on other visual stimuli within that environment (Boyce, 2003).
Visual perception of any display article, therefore, is formed within the environment it is
exhibited. If an object is displayed in two different environments, its visual perception may shift,
marginally or radically. In this sense, similar to the discussion on the object itself and its
characteristics, the object’s relationship with its context and how it is situated amongst other
visual elements also entails several different considerations that are important in considering
lighting conditions for viewing. One major consideration is contrast.
Contrast makes an object distinguishable via the difference in luminance (perceived brightness)
or its colour against a background or a different object. Contrast is essential to human visual
perception as our vision can operate under very large variations of luminance levels and our
visual perception is shaped by contrast rather than absolute cd/m values of luminance.
Casting a New Light on Museums and Galleries Emrah Baki Ulas
55
Like luminance, colour variations between background and object may result in very different
visual sensations of the same object.
As an example, let’s consider displaying a white object against a white background or against a
black background. As expected, when displayed under the same illuminance level, the
appearance of the object on one background will differ drastically compared to the other. The
same is true for coloured backgrounds. If an object is displayed against a particular colour in
the background, the apparent colour of the object will shift away from the background colour,
i.e. the contrasting colour tones of the object (compared to the background ) gets enhanced.
To explain with an example, let’s say we display a white object in front of a red background.
The apparent colour tone of the object against the red background tends to shift to green
tones. (Green is the complementary colour of red.) Similarly, if the object is displayed in front
of a blue background, its apparent colour tone shifts towards yellow. (Yellow is the
complimentary colour of blue.) Even when the luminance of two colours within a field of view
is kept the same; i.e. even when the absolute cd/m values are equal, the chromaticity
differences cause what is commonly described as colour contrast.
To appreciate the wider factors of context on the required lighting conditions, we also need
to recognise that the proximity of the displayed article to the viewer and its position within
the space. Also, whether the displayed article is housed within a display case or not, and from
what angles it is visible are all issues that would have an impact on what would be considered
as adequate lighting for that particular article to be viewed. For instance, the closer an object
is situated to a viewer, the less light may be required to illuminate it adequately. These are also
challenging to address in a simple guide, due to the very variant nature of museum and gallery
display scenarios.
The context, setting the visual conditions, the narrative and relationship between the display
object and the viewer, is highly influential in determining the right lighting conditions. As a final
remark on the relationship between the object and context, we must note that this relationship
is two-fold; in that, as the context has an impact on the perception of the object, the object
also has an impact on the perception of the context. I will leave the discussion on the context
here, and move on and only briefly cover what constitutes the most complex part of the
discussion on lighting for satisfactory viewing; the viewer.
Casting a New Light on Museums and Galleries Emrah Baki Ulas
56
2.1.4. Lighting and the Viewer
As noted in the beginning of this section, the viewing experience of a museum display is a highly
subjective matter. Therefore, it is not a straightforward task to pinpoint the lighting conditions
that would result in a satisfactory outcome. The object itself and its interdependencies with its
context, as explained above are crucial to understanding in formulating the right lighting
conditions. Ultimately, however, the lighting conditions are adequate only if they facilitate a
connection between the viewer and the displayed article, communicate information or meaning
and assist the viewer form an intelligent or emotional response.
As the light that travels from the object and the context to the human visual system, it carries
sensory input. The visual system firstly transforms this input into basic information such as
recognisable patterns or objects. This information is then further processed to form more
sophisticated levels of perception and lead to deeper meaning.
Human perception has a phenomenal nature, and the mechanisms and variables that affect the
above process are complex and unique to each individual. Perception is always guided by
personal circumstances, expectations, interests, knowledge, background, experience,
motivation, culture, values, beliefs, etc. Perceptual constancies and perceptual grouping play
important roles.
A thoughtfully designed museum lighting solution can play on the above mechanisms and create
a unique viewing experience. Measuring the adequacy or success of lighting conditions in this
sense, however, presents multiple challenges, as the parameters are too many and too specific
to each case.
For the purpose of finding an improved and universal method and criteria for evaluating lighting
conditions for viewing in a museum environment, we need to focus on shared issues that relate
to viewers collectively. For this, I will leave aside the above mentioned psychological and mental
processes and tackle the question from a more physiological perspective. While this approach
also has a degree of approximation, it provides a good basis to address some of the key issues
for the task at hand.
Casting a New Light on Museums and Galleries Emrah Baki Ulas
57
Below, let’s investigate some of the key universal parameters that affect the viewer’s visual
experience directly.
Firstly, the human eye is very versatile in adapting to and operating at a wide range of dark to
bright levels of light. The difference between the minimum and maximum levels of luminance
that the human eye can sense is in the order of billions (Jackson, et al. 1999); from luminance
values that are far less than a dimly moonlit night, all the way to luminance values that far
exceed those on bright sunlit summer days. To function under such wide range of lighting
conditions, the eye employs a range of mechanisms. One is a pupillary reflex, the mechanism
by which the pupil opens and closes to adjust the amount of light that reaches the surface
retina. The photoreceptors in the human eye; rods and cones are also very sensitive to the
changes in the ambient light levels and adjust their sensitivity through processes that we call
light adaptation and dark adaptation. While the pupillary reflex is a quick response and is
instrumental in light adaptation, and dark adaptation, the changes in the photochemical
composition of rods and cones on the retinal surface is responsible for a more significant part
of this process (Kalloniatis and Luu, 2007). Through dark adaptation and light adaptation, the
human eye can re-define the threshold of darkness and can detect a contrast of up to about
1,000 to 1. It must be noted, however, that the eye needs time to reach its full ability in
darkness or brightly lit conditions.
Dark adaptation may take up to 30 minutes. During this process, the sensitivity of the eye to
luminance levels increases profoundly. With dark adaptation, another phenomenon takes place
by which the colour perception of the viewer changes. This phenomenon is called Purkinje
Effect, whereby the sensitivity of the visual system shift towards the blue end of the light
spectrum (Purkinje, 1825).
For the study of lighting for museum display, it is critical to understand whether we should
consider the Purkinje effect and its implications of a shift in colour perception in forming a new
method of assessment. It needs to be established, if and how much the Purkinje Effect may
impact on colour perception in a museum context, and if necessary, how it can be built into
the new method.
Reviewing relevant literature we find that dark adaptation to luminance values lower than 0.034
cd/m² results in conditions that are so dim that the cones do not operate and the vision is
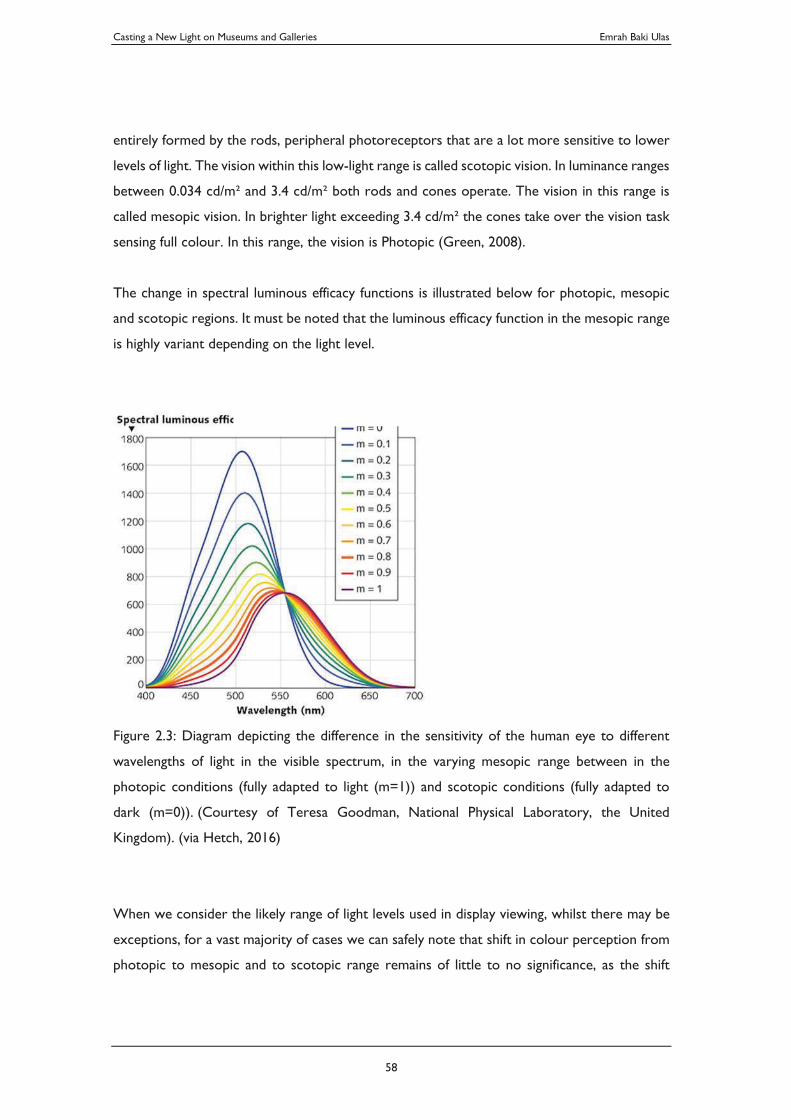
Casting a New Light on Museums and Galleries Emrah Baki Ulas
58
entirely formed by the rods, peripheral photoreceptors that are a lot more sensitive to lower
levels of light. The vision within this low-light range is called scotopic vision. In luminance ranges
between 0.034 cd/m² and 3.4 cd/m² both rods and cones operate. The vision in this range is
called mesopic vision. In brighter light exceeding 3.4 cd/m² the cones take over the vision task
sensing full colour. In this range, the vision is Photopic (Green, 2008).
The change in spectral luminous efficacy functions is illustrated below for photopic, mesopic
and scotopic regions. It must be noted that the luminous efficacy function in the mesopic range
is highly variant depending on the light level.
Figure 2.3: Diagram depicting the difference in the sensitivity of the human eye to different
wavelengths of light in the visible spectrum, in the varying mesopic range between in the
photopic conditions (fully adapted to light (m=1)) and scotopic conditions (fully adapted to
dark (m=0)). (Courtesy of Teresa Goodman, National Physical Laboratory, the United
Kingdom). (via Hetch, 2016)
When we consider the likely range of light levels used in display viewing, whilst there may be
exceptions, for a vast majority of cases we can safely note that shift in colour perception from
photopic to mesopic and to scotopic range remains of little to no significance, as the shift
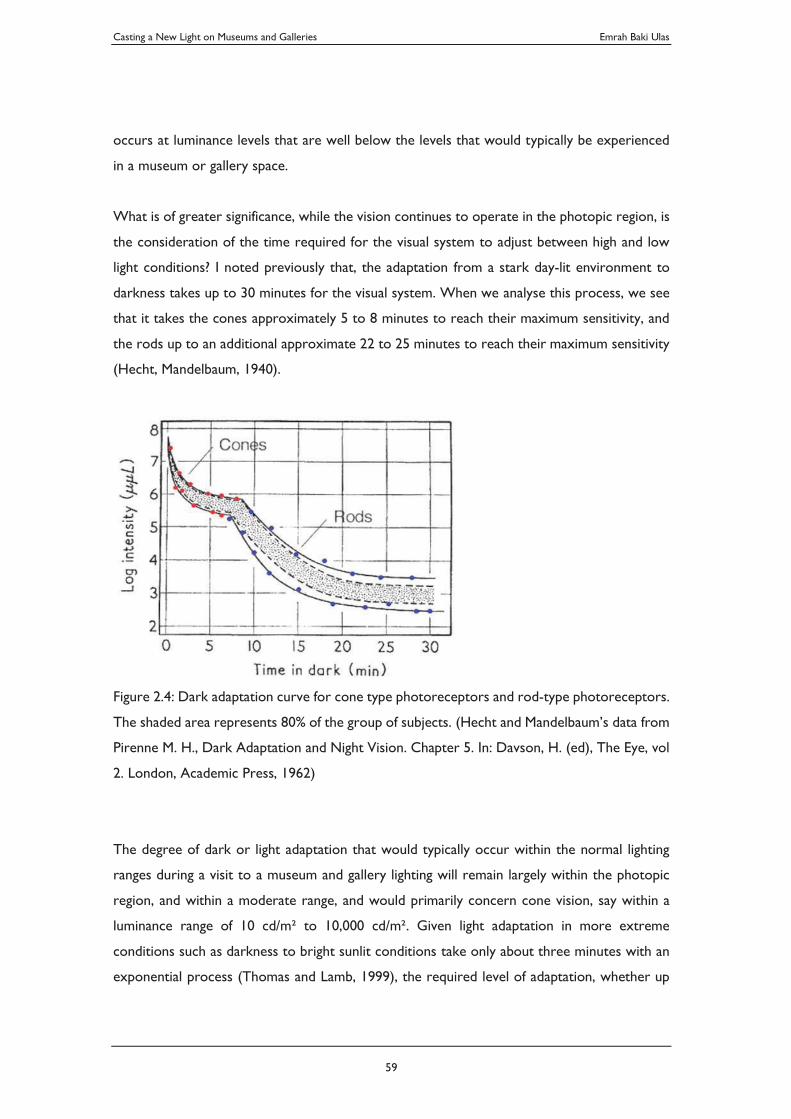
Casting a New Light on Museums and Galleries Emrah Baki Ulas
59
occurs at luminance levels that are well below the levels that would typically be experienced
in a museum or gallery space.
What is of greater significance, while the vision continues to operate in the photopic region, is
the consideration of the time required for the visual system to adjust between high and low
light conditions? I noted previously that, the adaptation from a stark day-lit environment to
darkness takes up to 30 minutes for the visual system. When we analyse this process, we see
that it takes the cones approximately 5 to 8 minutes to reach their maximum sensitivity, and
the rods up to an additional approximate 22 to 25 minutes to reach their maximum sensitivity
(Hecht, Mandelbaum, 1940).
Figure 2.4: Dark adaptation curve for cone type photoreceptors and rod-type photoreceptors.
The shaded area represents 80% of the group of subjects. (Hecht and Mandelbaum’s data from
Pirenne M. H., Dark Adaptation and Night Vision. Chapter 5. In: Davson, H. (ed), The Eye, vol
2. London, Academic Press, 1962)
The degree of dark or light adaptation that would typically occur within the normal lighting
ranges during a visit to a museum and gallery lighting will remain largely within the photopic
region, and within a moderate range, and would primarily concern cone vision, say within a
luminance range of 10 cd/m² to 10,000 cd/m². Given light adaptation in more extreme
conditions such as darkness to bright sunlit conditions take only about three minutes with an
exponential process (Thomas and Lamb, 1999), the required level of adaptation, whether up
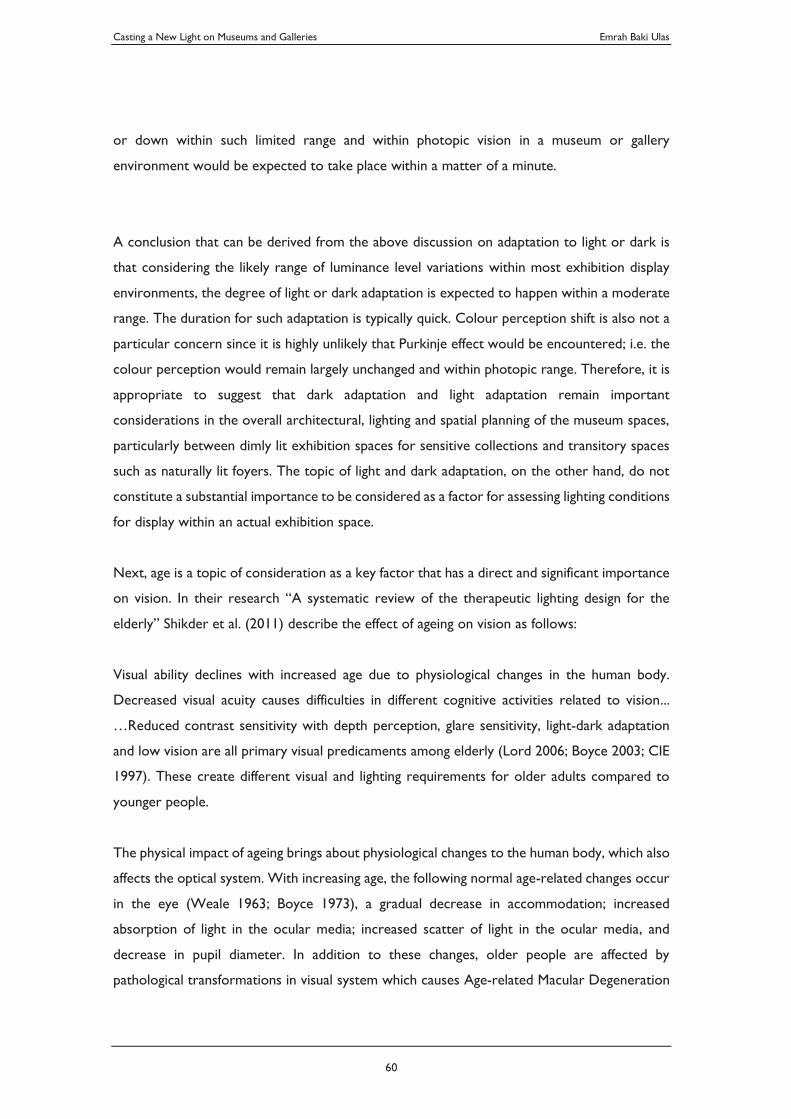
Casting a New Light on Museums and Galleries Emrah Baki Ulas
60
or down within such limited range and within photopic vision in a museum or gallery
environment would be expected to take place within a matter of a minute.
A conclusion that can be derived from the above discussion on adaptation to light or dark is
that considering the likely range of luminance level variations within most exhibition display
environments, the degree of light or dark adaptation is expected to happen within a moderate
range. The duration for such adaptation is typically quick. Colour perception shift is also not a
particular concern since it is highly unlikely that Purkinje effect would be encountered; i.e. the
colour perception would remain largely unchanged and within photopic range. Therefore, it is
appropriate to suggest that dark adaptation and light adaptation remain important
considerations in the overall architectural, lighting and spatial planning of the museum spaces,
particularly between dimly lit exhibition spaces for sensitive collections and transitory spaces
such as naturally lit foyers. The topic of light and dark adaptation, on the other hand, do not
constitute a substantial importance to be considered as a factor for assessing lighting conditions
for display within an actual exhibition space.
Next, age is a topic of consideration as a key factor that has a direct and significant importance
on vision. In their research “A systematic review of the therapeutic lighting design for the
elderly” Shikder et al. (2011) describe the effect of ageing on vision as follows:
Visual ability declines with increased age due to physiological changes in the human body.
Decreased visual acuity causes difficulties in different cognitive activities related to vision...
…Reduced contrast sensitivity with depth perception, glare sensitivity, light-dark adaptation
and low vision are all primary visual predicaments among elderly (Lord 2006; Boyce 2003; CIE
1997). These create different visual and lighting requirements for older adults compared to
younger people.
The physical impact of ageing brings about physiological changes to the human body, which also
affects the optical system. With increasing age, the following normal age-related changes occur
in the eye (Weale 1963; Boyce 1973), a gradual decrease in accommodation; increased
absorption of light in the ocular media; increased scatter of light in the ocular media, and
decrease in pupil diameter. In addition to these changes, older people are affected by
pathological transformations in visual system which causes Age-related Macular Degeneration
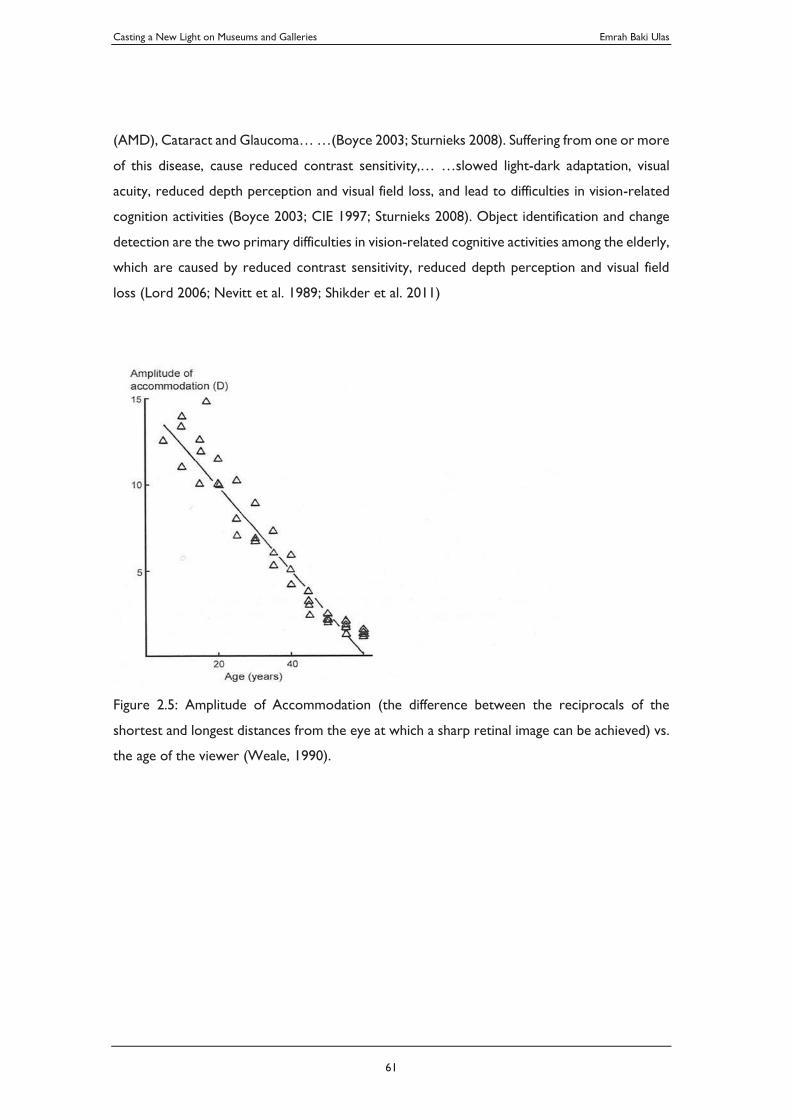
Casting a New Light on Museums and Galleries Emrah Baki Ulas
61
(AMD), Cataract and Glaucoma… …(Boyce 2003; Sturnieks 2008). Suffering from one or more
of this disease, cause reduced contrast sensitivity,… …slowed light-dark adaptation, visual
acuity, reduced depth perception and visual field loss, and lead to difficulties in vision-related
cognition activities (Boyce 2003; CIE 1997; Sturnieks 2008). Object identification and change
detection are the two primary difficulties in vision-related cognitive activities among the elderly,
which are caused by reduced contrast sensitivity, reduced depth perception and visual field
loss (Lord 2006; Nevitt et al. 1989; Shikder et al. 2011)
Figure 2.5: Amplitude of Accommodation (the difference between the reciprocals of the
shortest and longest distances from the eye at which a sharp retinal image can be achieved) vs.
the age of the viewer (Weale, 1990).
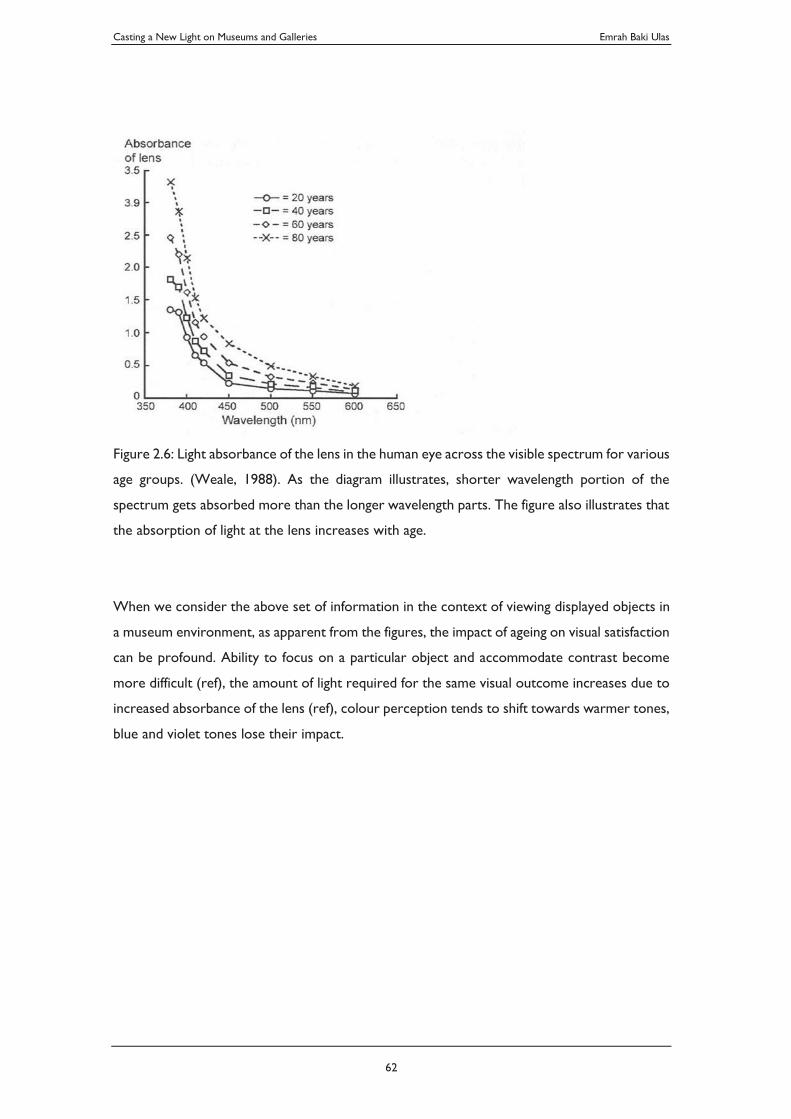
Casting a New Light on Museums and Galleries Emrah Baki Ulas
62
Figure 2.6: Light absorbance of the lens in the human eye across the visible spectrum for various
age groups. (Weale, 1988). As the diagram illustrates, shorter wavelength portion of the
spectrum gets absorbed more than the longer wavelength parts. The figure also illustrates that
the absorption of light at the lens increases with age.
When we consider the above set of information in the context of viewing displayed objects in
a museum environment, as apparent from the figures, the impact of ageing on visual satisfaction
can be profound. Ability to focus on a particular object and accommodate contrast become
more difficult (ref), the amount of light required for the same visual outcome increases due to
increased absorbance of the lens (ref), colour perception tends to shift towards warmer tones,
blue and violet tones lose their impact.
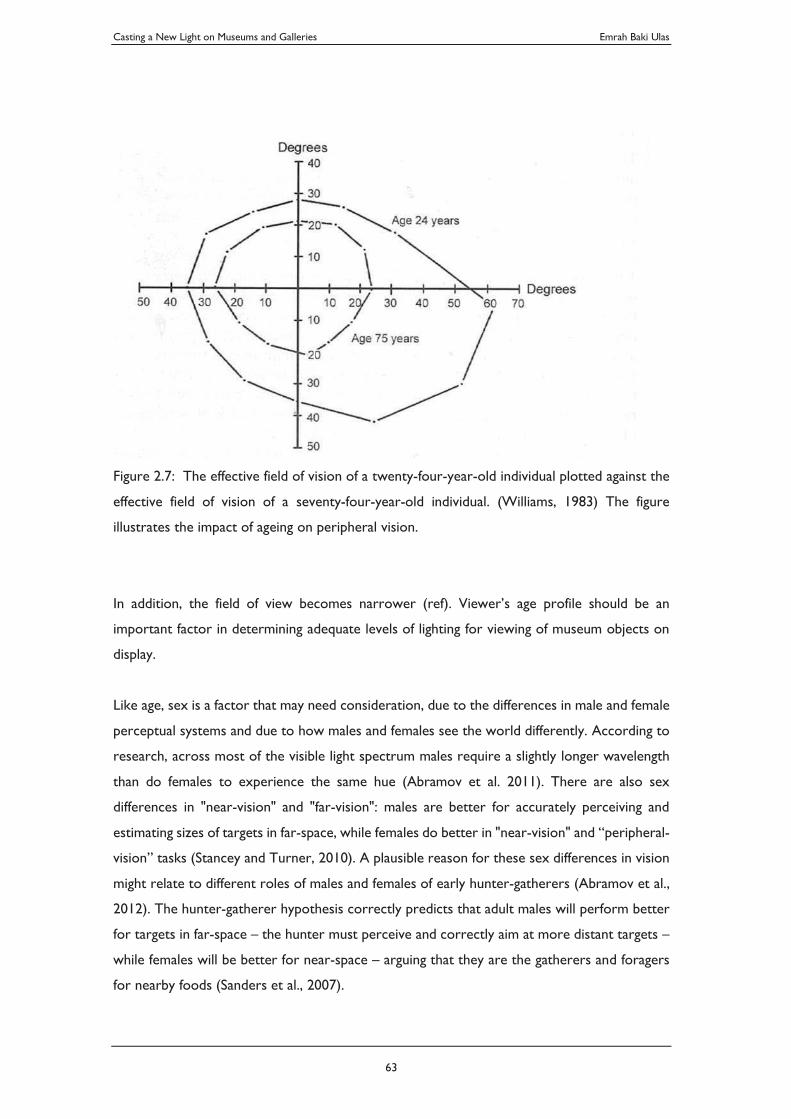
Casting a New Light on Museums and Galleries Emrah Baki Ulas
63
Figure 2.7: The effective field of vision of a twenty-four-year-old individual plotted against the
effective field of vision of a seventy-four-year-old individual. (Williams, 1983) The figure
illustrates the impact of ageing on peripheral vision.
In addition, the field of view becomes narrower (ref). Viewer’s age profile should be an
important factor in determining adequate levels of lighting for viewing of museum objects on
display.
Like age, sex is a factor that may need consideration, due to the differences in male and female
perceptual systems and due to how males and females see the world differently. According to
research, across most of the visible light spectrum males require a slightly longer wavelength
than do females to experience the same hue (Abramov et al. 2011). There are also sex
differences in "near-vision" and "far-vision": males are better for accurately perceiving and
estimating sizes of targets in far-space, while females do better in "near-vision" and “peripheral-
vision” tasks (Stancey and Turner, 2010). A plausible reason for these sex differences in vision
might relate to different roles of males and females of early hunter-gatherers (Abramov et al.,
2012). The hunter-gatherer hypothesis correctly predicts that adult males will perform better
for targets in far-space – the hunter must perceive and correctly aim at more distant targets –
while females will be better for near-space – arguing that they are the gatherers and foragers
for nearby foods (Sanders et al., 2007).
Casting a New Light on Museums and Galleries Emrah Baki Ulas
64
Although the above may suggest that the lighting conditions that would be considered ideal for
different sexes would vary concerning spectral composition as well as illuminance, the practical
relevance of catering for these differences present challenges. I shall further test the
correlations of sex and colour perception as well as sex and detail perception to determine
whether a seeming trend will be detected and if so, to formulate how such trend may be
practical to build into a new method for evaluation of lighting for exhibition display.
2.1.5. Lighting and Visual Properties
In the previous sections, I have discussed the reasons why evaluating the adequacy of lighting
for visual satisfaction only based on illuminance (and especially using the 50 lux rule) needs to
be fundamentally rethought. I discussed the object-based, context-based and viewer-based
issues towards considering a new and alternative framework instead.
In this complex task, like the variables that originate from the object, the context, and the
viewer, the lighting itself also has various factors to take into account. It is worthwhile to
consider these here with a focus on their impact on the visual properties of display objects.
We can sort these lighting factors under two categories; spectral and spatial.
As a prelude to the consideration of spectral and spatial considerations in this context, it must
be noted that the 50lux rule dates back to 1972 (Thomson, 1978), a time when the dominant
source for the museum and gallery lighting was the incandescent lamp. Modern time museum
and gallery lighting systems are in a state of the rapid shift to the Light-emitting Diode as the
new source of light in the museum environment. Incandescent light sources and Light-emitting
Diodes exhibit fundamental differences in both spectral and spatial qualities and a consideration
of the outdated metric, even solely on this basis is much needed.
Spectral composition of lighting is the overarching factor that determines the visual quality and
the visual properties of a display. Depending on the spectral composition a displayed object’s
colour appearance may shift to warmer or cooler tones, it may appear dim or brighter, certain
hues on its surface may appear subdued, while others may appear enhanced. By altering spectral
composition of a light source, the perception of an object or its context can be modified
Casting a New Light on Museums and Galleries Emrah Baki Ulas
65
considerably. A common best practice in the museum and gallery lighting practice is the use of
sources that cover a broad range of the visible light spectra (IESNA, 2011). Typically,
continuous-spectrum light sources (such as natural light, tungsten incandescent sources and
good quality Light-emitting Diodes) are considered to be more suitable for display lighting in
museums and galleries as their light output does comprise of the whole range of wavelengths
within the light spectra. It must be noted, however, that there are stark differences between
continuous-spectrum sources also. For instance, longer wavelengths of the visible spectrum
are more dominant in the light output of incandescent sources such as tungsten halogen lights
(CIE, 2006), most Light-emitting Diode sources tend to have a slight hump in the short
wavelengths and follow a bell-curve pattern across medium and longer bands (Erco, 2016).
Daylight, as a reference source (E.g. Reference illuminant D65 (CIE 1960 UCS)) on the other
hand has a much more balanced light output (CIE, 1960). It must also be noted, that in the case
of natural light, the light is often admitted into a museum or gallery space filtering through
glazing and/or various daylight control and manipulation devices. In some cases, ultraviolet
filters or diffusers are being applied. All these layers that natural light passes through do alter
its spectral composition. So, the natural light that is experienced in one space may be very
different than the natural light experienced in another space. Another important character that
is unique to natural light is that its spectral composition constantly shifts. Not only that it is
different and unique to every different location in the world at any time, but also within the
same location its composition continuously changes with time; through each day and each
season, depending on the sun’s position in the sky and depending on the meteorological
phenomena such as scattering due to variations in cloud cover, temperature, humidity,
pollution, etc. Despite discontinuous spectrum lights (e.g. High Pressure Discharge Metal
Halide, Linear Fluorescent or White SON) are not as widely used for museum and gallery
display lighting as continuous spectrum lights (e.g. incandescent/ tungsten halogen, or Light-
Emitting Diodes), there are several examples of these having been applied in leading museums
and galleries around the world. Research also has shown that there are some circumstances in
which discontinuous spectrum lights may provide more favourable display conditions (Roos
and Ulas, 2011) compared to more common, continuous spectrum lights.
The measurement of spectral composition and a comparison between different sources require
sophisticated tools. Also, such analysis often entails a certain level of professional competence.
The task of spectral analysis is often undertaken in lighting laboratories by equipment
manufacturers and are published by equipment manufacturers.
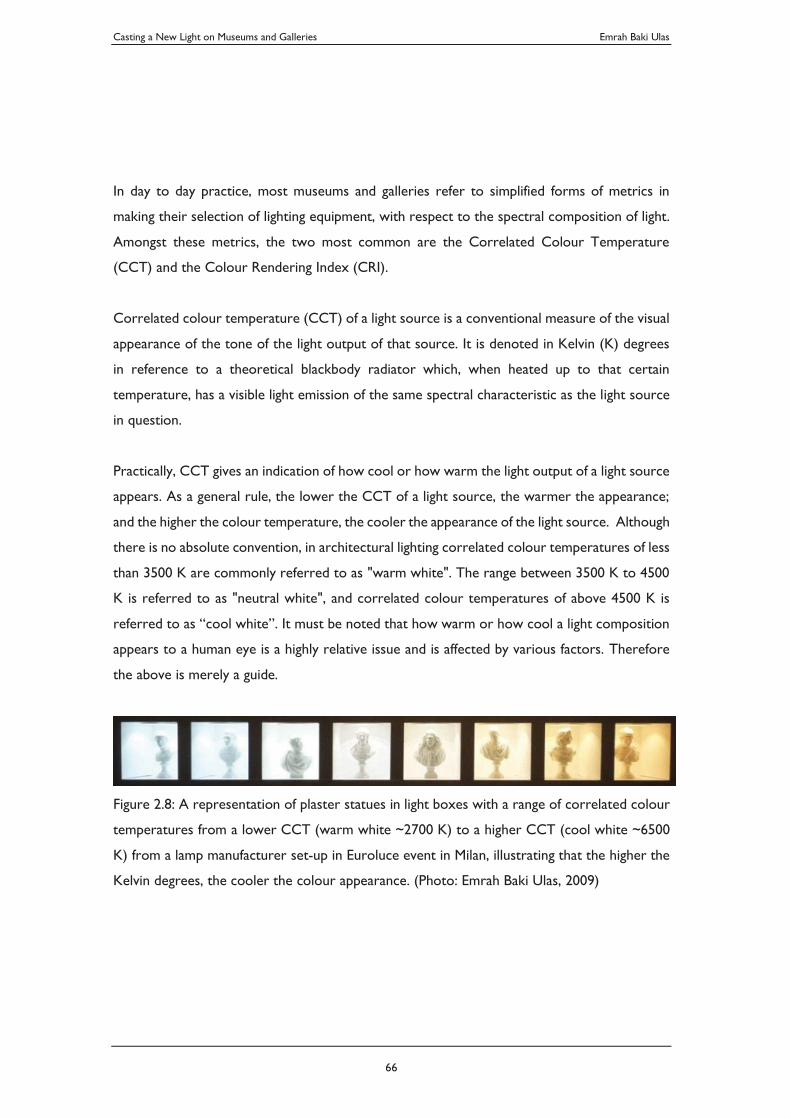
Casting a New Light on Museums and Galleries Emrah Baki Ulas
66
In day to day practice, most museums and galleries refer to simplified forms of metrics in
making their selection of lighting equipment, with respect to the spectral composition of light.
Amongst these metrics, the two most common are the Correlated Colour Temperature
(CCT) and the Colour Rendering Index (CRI).
Correlated colour temperature (CCT) of a light source is a conventional measure of the visual
appearance of the tone of the light output of that source. It is denoted in Kelvin (K) degrees
in reference to a theoretical blackbody radiator which, when heated up to that certain
temperature, has a visible light emission of the same spectral characteristic as the light source
in question.
Practically, CCT gives an indication of how cool or how warm the light output of a light source
appears. As a general rule, the lower the CCT of a light source, the warmer the appearance;
and the higher the colour temperature, the cooler the appearance of the light source. Although
there is no absolute convention, in architectural lighting correlated colour temperatures of less
than 3500 K are commonly referred to as "warm white". The range between 3500 K to 4500
K is referred to as "neutral white", and correlated colour temperatures of above 4500 K is
referred to as “cool white”. It must be noted that how warm or how cool a light composition
appears to a human eye is a highly relative issue and is affected by various factors. Therefore
the above is merely a guide.
Figure 2.8: A representation of plaster statues in light boxes with a range of correlated colour
temperatures from a lower CCT (warm white ~2700 K) to a higher CCT (cool white ~6500
K) from a lamp manufacturer set-up in Euroluce event in Milan, illustrating that the higher the
Kelvin degrees, the cooler the colour appearance. (Photo: Emrah Baki Ulas, 2009)
Casting a New Light on Museums and Galleries Emrah Baki Ulas
67
Incandescent tungsten halogen light sources, which used to be a dominant source of light in
museums and galleries, have warm white colour temperatures typically ranging between 2700-
3200 K unless manipulated using a filter to appear warmer or cooler. A unique aspect of
incandescent sources is that as the light source is dimmed, colour temperature shifts and tends
to get warmer. This natural characteristic, while preferable in many lighting applications, has
been regarded as disadvantageous in most museum and gallery lighting applications since
reduced lighting intensity often also result in a considerable shift in the lighting tone and quality.
Dimming also reduces the luminous efficacy of the light source significantly. Some museum and
gallery lighting designers (particularly in the Americas) use mechanical means of dimming (such
as meshing or neutral density filtering). Modern technologies such as Light-Emitting Diodes
(LEDs), which have become the new standard for lighting museums and galleries, eliminate this
issue by providing options that achieve dimmability without a shift in the colour temperature
unless it is specifically desired.
Correlated colour temperature can be used as a guide for understanding and communicating
the colour appearance of the light, it, however, does not reveal definite and holistic information
on spectral qualities. As a result, sources of the same correlated colour temperature may
render objects differently.
Correlated colour temperature can be measured using advanced light-meters. However, these
devices may not be available in every institution. Typically, equipment manufacturers undertake
such measurements and provide information on CCT in their product literature.
Colour Rendering Index (CRI) is a metric that indicates how well a light source reveals
(renders) the colours on a surface in comparison to other light sources. CRI of a light source
is denoted as a number between 0 and 100. CRI is useful in specifying a benchmark in colour
quality if it is used within its limitations. Originally, CRI was developed to compare continuous
spectrum sources whose CRI's were above 90.
Technically, CRI can only be compared to sources that have the same correlated colour
temperatures. As a general rule "the higher, the better"; light sources with high to excellent
CRI's (90-100) are considered suitable for use in museum and gallery lighting. It must be noted
that it is possible to have different sources with the same CRI, but which render colours
differently. This is due to the nature of the measurements of CRI, which is based on a range of
Casting a New Light on Museums and Galleries Emrah Baki Ulas
68
sample colours. The measurement of CRI is a complex task and is normally undertaken by
equipment manufacturers in lighting laboratories, and the information is provided in product
literature.
There are methods of assessing colour rendering qualities of light sources other than the CRI.
Recently, the adequacy of CRI as a reliable colour rendering metric has been widely discussed,
and other colour rendering metrics such as the Colour Quality Scale (CQS) (Davis and Ohno,
2006) and Gamut Area Index (GAI) (Rea and Freyssinier, 2008) have been proposed as
alternative means to assess colour rendering.
The focus of the criticism on Colour Rendering Index is the inaccuracies of assessing light
quality. In formulating Colour Rendering Index, the Method of Measuring and Specifying Colour
Rendering Properties of Light Sources (CIE, 1995) specifies a range of test colour samples (TCS)
are taken from an early edition of the Munsell Atlas. The first eight samples, a subset of the
eighteen proposed in Nickerson (1960), are relatively low saturated colours and are evenly
distributed over the complete range of hues. These eight samples are employed to calculate
the general colour rendering index. The last six samples provide supplementary information
about the colour rendering properties of the light source; the first four for high saturation, and
the last two as representatives of well-known objects. According to Davis (2011), these colours
do not adequately span the range of normal object colours. Some light sources that can
accurately render colours of low saturation perform poorly with highly saturated colours.
These aspects make CRI misleading for some applications, including museum and gallery
exhibition lighting. An alternative measurement method for CRI uses 14 colour samples
amongst which a new metric called Colour Quality Scale (CQS) has been developed by the
National Institute of Standards and Technology (Davis, 2011).
Amongst the alternative colour rendering metrics, the recent method TM 30-15 by the
Illumination Engineering Society (IES, 2015) encompasses a range of metrics comprehensively
and holds the potential to be a more holistic and reliable colour rendering metric for future
use. The main difference that sets TM 30-15 apart from the other common colour quality
metrics is that it tackles the challenging task of accurately quantifying the colour rendition
characteristics of a light source, considering the different aspects of colour rendition; colour
fidelity, colour discrimination, and colour preference.
Casting a New Light on Museums and Galleries Emrah Baki Ulas
69
The method that the IES TM 30-15 employs for evaluating light source colour rendition is an
objective and statistical approach, quantifying the colour fidelity, and by proving a gamut
correlation, i.e. increase or decrease in the saturation with respect to a reference source.
These are indicated in two metrics; the fidelity index (Rf) and the gamut index (Rg). By
generating a colour vector graphic, the IES TM 30-15 method also provides and an easy to
interpret visual representation average hue and saturation shifts, and which assists in a better
interpretation of the fidelity index and gamut index values. (IES, 2015).
While colour rendering metrics and correlated colour temperature provide useful quick
references to assess the colour appearance and richness of a light source, they can be
misleading. A more thorough analysis of the colour quality of a light source is possible through
the evaluation of the composition of its light output across the overall spectrum since it is
possible to compare the performance of the light sources in the entire visible range of the
electromagnetic spectrum. This, however, is a more advanced task and may require specific
expertise in lighting, which most museums and galleries do not possess.
Typically the spectral power distribution diagram of a light source shows all wavelengths within
the light emitted from a source. It is also useful in assessing the relative damage potential of
that light source. This is because different wavelengths of emission have different damage
potential.
The impact of lighting in determining the visual properties of an exhibition display is of course
not limited to spectral considerations, but also spatial considerations. The way light is
distributed within a space; whether being delivered onto an object directly or whether
bouncing off a surface or being transmitted through an optical accessory or device would also
determine its directionality and intensity, ultimately having an influence on the perception of
the displayed object.
In developing a new framework for an improved method to evaluate the adequacy of lighting
for satisfactory viewing of exhibition display, as a solid alternative to the 50 lux rule and its
deficiencies, the intertwined relationships between the object, the context, the viewer and the
light needs to be carefully considered in order to generate a balanced, easy-to-use but also
sufficiently sophisticated tool that will offer benefits to museums and galleries.
Casting a New Light on Museums and Galleries Emrah Baki Ulas
70
2.2. A Framework for an Improved Method to Evaluate the Adequacy of Lighting for Satisfactory Viewing of Exhibition Display
In questioning the relevance of 50 lux rule as a sole method, I have examined the breadth of
the many considerations that relate to the topic. It is the intent a new method should address
as many of the shortcomings of the 50 lux rule as possible, without becoming overly
complicated and impractical to use by museum professionals, conservators, exhibition and
lighting designers and technicians.
In this section the main focus of the study is to consider the relevance, the benefit and the
practicality of various variables in forming a basis for an improved method of evaluation for the
adequacy of lighting for satisfactory viewing and I discuss how these can be measured with a
reasonable accuracy to eventually lead to and contribute to a new set of lighting guidelines for
museum and gallery displays. To do this, I will follow the same structured approach as I did in
the previous section, approaching the task in an accessible manner. For practicality, the method
will seek to continue using the same metric (illuminance), however, will aim to correlate it to
the object, the context, the viewer and the light in a cross-referenced way.
It is pre-empted that the task requires an undertaking of carefully designed experiments that
test the perceptual relationships to pinpoint certain perceptual thresholds with the aim to
define the minimum requirements for satisfactory viewing conditions. These experiments
require certain variables to be kept constant, to successfully reveal the interdependencies
between others. Below I address the framework for the new method.
2.2.1. Object framework
Illuminance thresholds for recognition of colour and recognition of detail are key pieces of
information that the method seeks for the object. All other variables are kept constant.
Casting a New Light on Museums and Galleries Emrah Baki Ulas
71
Accurate detection of colour information across the entire colour spectrum is considered a
key requirement for satisfactory viewing. The criteria that are determined as being suitable for
colour intelligibility is the detection of saturation differences within the same hue, and for
different hues across the spectrum. The logic is fundamentally similar to the Farnsworth-
Munsell 100 Hue Colour Vision Test (Farnsworth, 1943) that is used for determining the
degree of colour blindness, however, the methodology and assessment procedure has
significant departures.
Similarly to the approach with colour, accurate detection of detail information is considered a
key requirement for satisfactory viewing. The criteria that are determined for detail
intelligibility is the ability to accurately read Sloan letters in accordance with the letter
specifications, arrangement and viewing distances of the Snellen Visual Acuity test procedure
(Snellen, 1862).
2.2.2. Context framework
Perception of the object changes depending on its degree of contrast with the background.
Correlation between the background tone and colour intelligibility is important for the new
method. Colour intelligibility of the samples displayed against the light background as well as
samples displayed against a dark background is compared to test perceptual trends and
tendencies on the impact of the contrast between the object and the background. All other
variables are kept constant or controlled.
2.2.3. Viewer framework
Where possible, the awareness of the typical viewer’s age and sex helps design a lighting
condition that suits their particular physiological and perceptual conditions to enhance their
visual experience of the displays. All other viewer variables are kept or considered constant
(or controlled to remain constant).
Casting a New Light on Museums and Galleries Emrah Baki Ulas
72
2.2.4. Lighting framework
As discussed in section 2.1, different lighting scenarios are likely to result in different perceptual
results. Illuminance is kept as the independent variable to test the 50 lux rule for the differing
object, context, and viewer conditions and correct it or expand it to cover different
combinations of conditions more accurately. All other lighting conditions are kept or
considered constant or controlled.
Casting a New Light on Museums and Galleries Emrah Baki Ulas
73
2.3. Lighting Experiments
With the above framework, to test the abovementioned cross-correlations, I set up a series
of lighting experiments. This is an essential method for testing and verification of the
hypothesis, that an approach based on the commonly practiced 50 lux rule possesses a range
of problems and that an improved method is needed to evaluate the Adequacy of Lighting for
Satisfactory Viewing of Exhibition Display, to replace the 50 lux rule.
2.3.1. Objectives
The main objective of the lighting experiments is to form a basis to improve the currently used
exhibition lighting guidelines, by testing the correlations between object-based, context-based,
viewer-based and lighting-based factors that may impact on the satisfactory viewing of museum
and gallery displays. The experiment aims to identify trends between different factors and
produce evidence to inform new guidance that will fill in the gaps that the currently used
blanket conditions of 50 lux rule does not satisfactorily address.
2.3.2. Methodology
The main methodology for the lighting experiments is based on applied statistics on human
research. The study employs a primarily quantitative approach and uses the statistical study as
the main method of analysis.
The experiments entail viewing of a series of randomised colour and detail samples displayed
in an actual museum environment and on varying contextual backgrounds by the museum and
design professionals and under different illuminance conditions. Perceptual responses are
collected via a quantitative questionnaire for quantitative analysis to identify correlations
between lighting levels and other parameters.
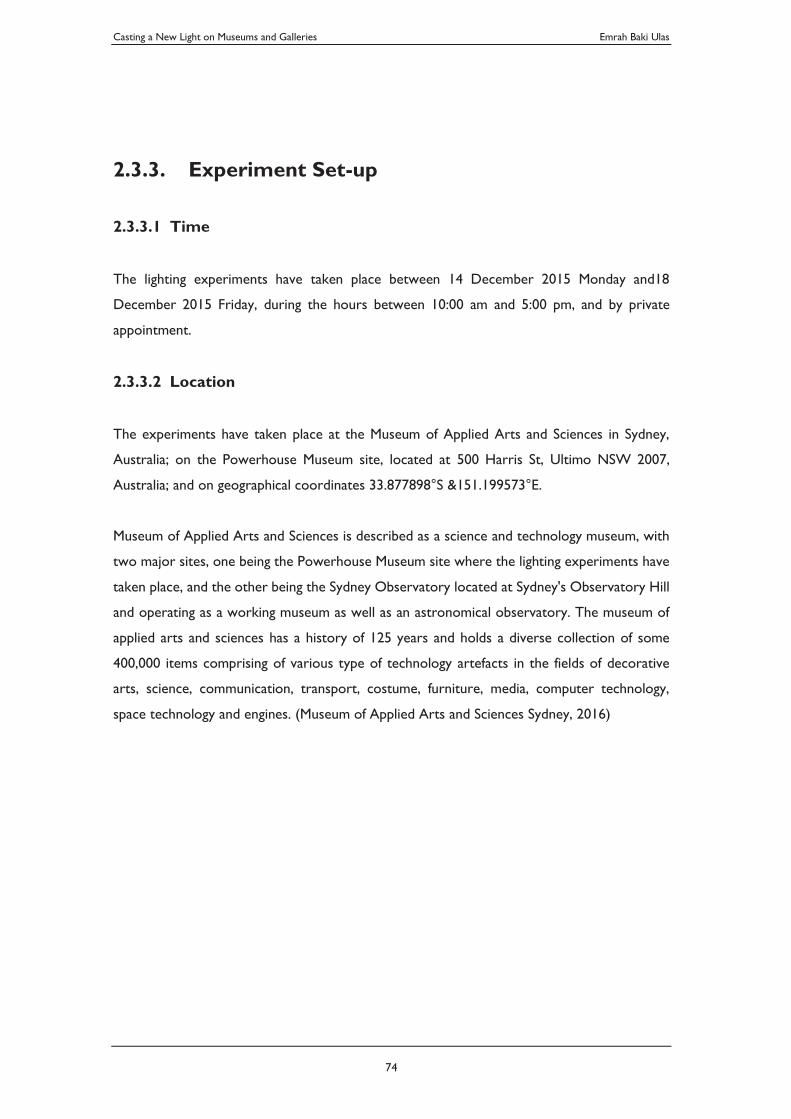
Casting a New Light on Museums and Galleries Emrah Baki Ulas
74
2.3.3. Experiment Set-up
2.3.3.1 Time
The lighting experiments have taken place between 14 December 2015 Monday and18
December 2015 Friday, during the hours between 10:00 am and 5:00 pm, and by private
appointment.
2.3.3.2 Location
The experiments have taken place at the Museum of Applied Arts and Sciences in Sydney,
Australia; on the Powerhouse Museum site, located at 500 Harris St, Ultimo NSW 2007,
Australia; and on geographical coordinates 33.877898°S &151.199573°E.
Museum of Applied Arts and Sciences is described as a science and technology museum, with
two major sites, one being the Powerhouse Museum site where the lighting experiments have
taken place, and the other being the Sydney Observatory located at Sydney's Observatory Hill
and operating as a working museum as well as an astronomical observatory. The museum of
applied arts and sciences has a history of 125 years and holds a diverse collection of some
400,000 items comprising of various type of technology artefacts in the fields of decorative
arts, science, communication, transport, costume, furniture, media, computer technology,
space technology and engines. (Museum of Applied Arts and Sciences Sydney, 2016)
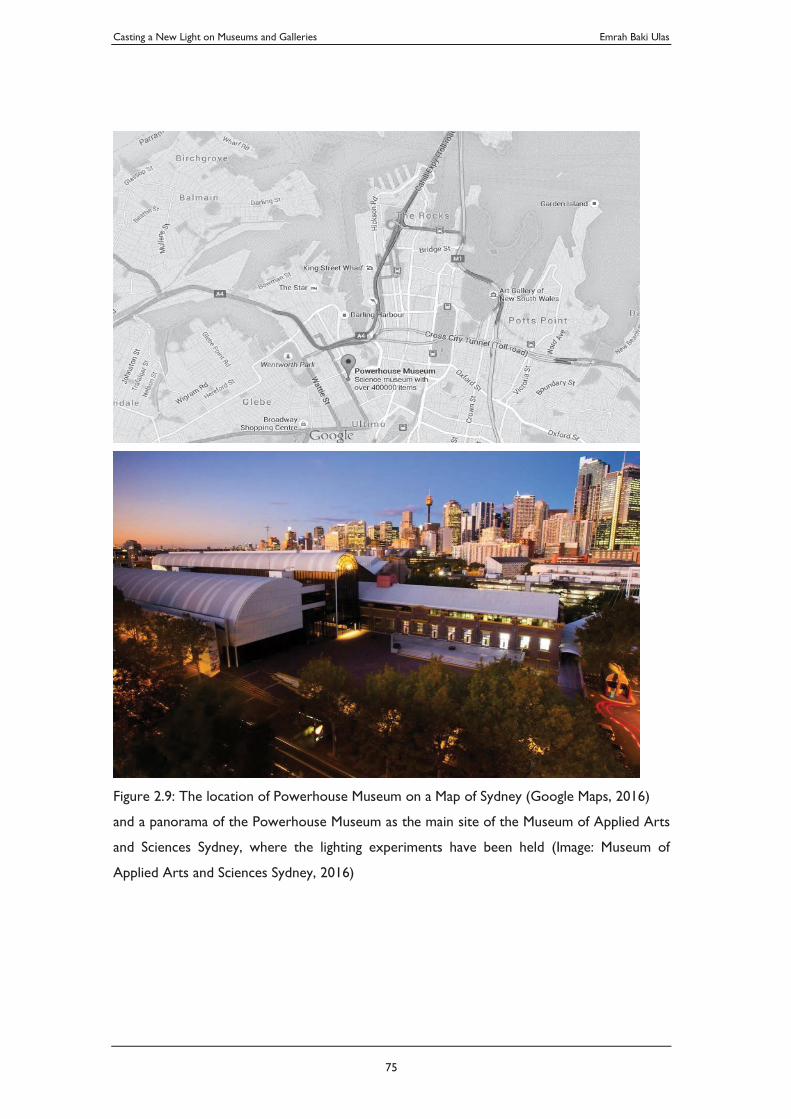
Casting a New Light on Museums and Galleries Emrah Baki Ulas
75
Figure 2.9: The location of Powerhouse Museum on a Map of Sydney (Google Maps, 2016)
and a panorama of the Powerhouse Museum as the main site of the Museum of Applied Arts
and Sciences Sydney, where the lighting experiments have been held (Image: Museum of
Applied Arts and Sciences Sydney, 2016)
Casting a New Light on Museums and Galleries Emrah Baki Ulas
76
2.3.3.3 Space
The space where the lighting experiments have taken place is Studio A located on Level 2 and
within the museum's learning and discovery centre. The studio is a simple, generic and
rectangular shaped room of approximately 50m² area, with internal dimensions of
approximately 6 meters by 8.5 meters and a ceiling height of approximately 2.85 meters.
The space is surrounded by solid, rendered and matte white painted concrete walls on three
sides and tinted black glazing on one side. The floor is a dark carpet with subtle and random-
like colour patterns, the ceiling consists of black grid ceiling. Entrance to the space is via glass
doors that are part of the glazing on one wall.
The studio is situated in a row, with two other adjacent similar spaces that open into a large
foyer. The room is set in deeply within this foyer and distant from the shaded exterior openings
due to its position and the tinted glazing that separates it from other spaces it receives negligible
natural light from the exteriors and also negligible light from the foyer.
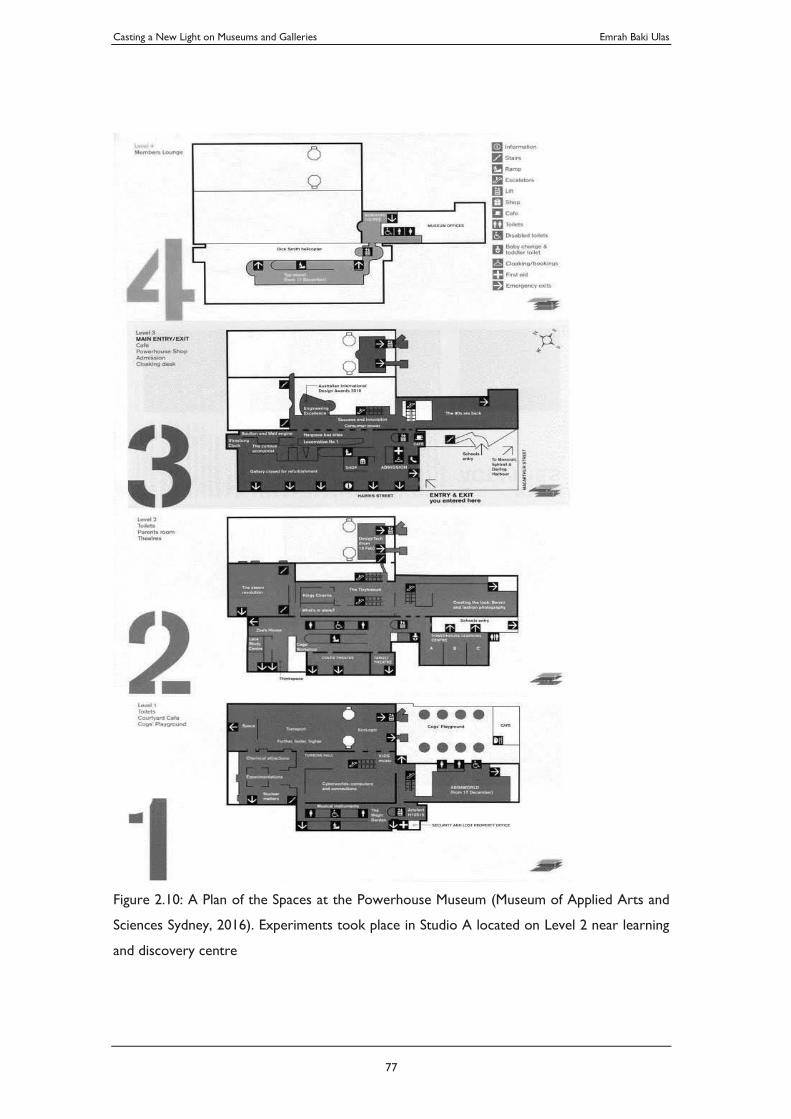
Casting a New Light on Museums and Galleries Emrah Baki Ulas
77
Figure 2.10: A Plan of the Spaces at the Powerhouse Museum (Museum of Applied Arts and
Sciences Sydney, 2016). Experiments took place in Studio A located on Level 2 near learning
and discovery centre
Casting a New Light on Museums and Galleries Emrah Baki Ulas
78
2.3.3.4 Furnishing
Space within the studio is utilised primarily as an open plan gallery space, with minimal
furnishing. Included within the space is only a desk on the corner where the questionnaire
papers and pens are organised and kept, as well as a series of chairs near studio entrance for
the participants to sit, adjust and rest during the introduction to the experiment and while the
experiment instructions are being communicated to them. The duration, while the participants
are seated is also used as the course of time for their visual adaptation to the ambient light
levels within the space. All furniture is kept distant from the experiment displays so as to
minimise their spatial impact within the room.
2.3.3.5 Lighting
This section provides a brief summary of the lighting systems and arrangement within the space.
Detailed description and technical details of the lighting equipment and set-up is covered as
part of the dedicated section (see 2.3.5 Lighting Composition).
Lighting within the studio consists of two separate systems. One, which is the existing, original
system within the room and the other that has been installed specifically for lighting
experiments.
As noted, the original lighting system within the space has been kept off and not been utilised
during the experiments. For information, this system consists of recessed fluorescent light
fittings with a twin arrangement of fluorescent tubes that have a length of approximately 1,200
mm and a diameter of approximately 26mm. These tubes are widely known as T8 (T26)
fluorescent lamps. The luminaires as enclosed and the lamps have been concealed with a
frosted opal acrylic diffuser. When these lights are off, they have no significant impact on the
overall visual environment within the space. Further specifications and optical characteristics
of this lighting system are not included in this document as the system has not been used and
does not constitute particular importance for lighting experiments.
The system that has been used for the lighting experiments is a track based lighting system
with an L-shaped layout that is surface mounted underneath the grid ceiling structure. The
track system consists of a three-circuit surface mounted black track that extends along the
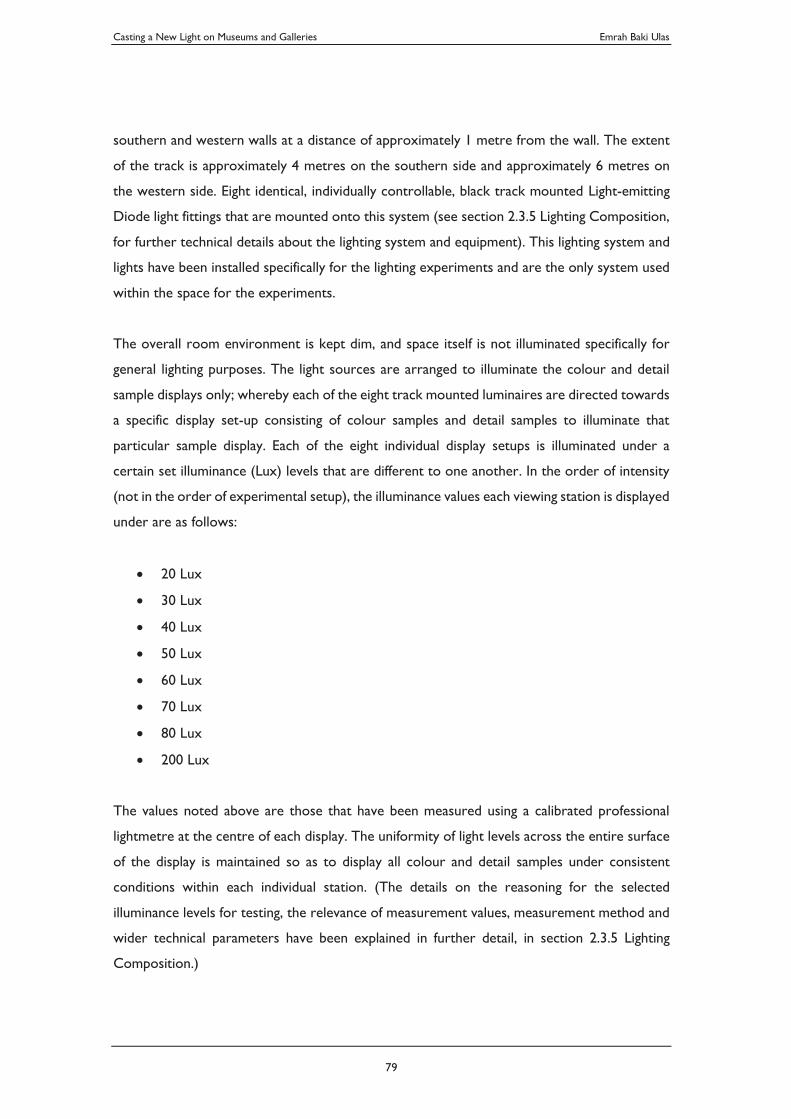
Casting a New Light on Museums and Galleries Emrah Baki Ulas
79
southern and western walls at a distance of approximately 1 metre from the wall. The extent
of the track is approximately 4 metres on the southern side and approximately 6 metres on
the western side. Eight identical, individually controllable, black track mounted Light-emitting
Diode light fittings that are mounted onto this system (see section 2.3.5 Lighting Composition,
for further technical details about the lighting system and equipment). This lighting system and
lights have been installed specifically for the lighting experiments and are the only system used
within the space for the experiments.
The overall room environment is kept dim, and space itself is not illuminated specifically for
general lighting purposes. The light sources are arranged to illuminate the colour and detail
sample displays only; whereby each of the eight track mounted luminaires are directed towards
a specific display set-up consisting of colour samples and detail samples to illuminate that
particular sample display. Each of the eight individual display setups is illuminated under a
certain set illuminance (Lux) levels that are different to one another. In the order of intensity
(not in the order of experimental setup), the illuminance values each viewing station is displayed
under are as follows:
20 Lux
30 Lux
40 Lux
50 Lux
60 Lux
70 Lux
80 Lux
200 Lux
The values noted above are those that have been measured using a calibrated professional
lightmetre at the centre of each display. The uniformity of light levels across the entire surface
of the display is maintained so as to display all colour and detail samples under consistent
conditions within each individual station. (The details on the reasoning for the selected
illuminance levels for testing, the relevance of measurement values, measurement method and
wider technical parameters have been explained in further detail, in section 2.3.5 Lighting
Composition.)
Casting a New Light on Museums and Galleries Emrah Baki Ulas
80
The arrangement, positioning and the angle of incidence of light (as further explained in detail
in section 2.3.5 Lighting Composition) follows a typical arrangement for the display of wall hung
displays in most museum and gallery environments. The ambient light for circulation and
orientation purposes is provided by the light bouncing off and getting reflected off the wall
surfaces and from light displays. To avoid any interference on the effect of the display lighting,
no dedicated ambient lights have been used.
2.3.3.6 Displays
This section provides a brief summary of the display compositions and arrangement within the
space. Detailed description and specific details of the displays is covered as part of the
dedicated section (see 2.3.4 Display Composition).
The experimental displays consist of eight individual stations each of which has been illuminated
using identical light sources, however, having been adjusted to receive different incident
illuminance levels. Each of these eight stations is composed of a wall-hung arrangement of
displays of colour samples and detail samples that are organised in a randomised manner. The
overall dimensions of each display sat within a rectangular area of approximately 0.42 metres
by 0.35 metres and positioned approximately at an eye height of 1.65 meters. Samples that are
used for the Colour Intelligibility test takes up the majority of the surface area of each of these
displays (approximately 89%), while samples that are used for detail intelligibility takes up only
a small portion (approximately 11%).
Each of the colour intelligibility test display is composed of 16 Munsell Colour System colour
samples. The samples are selected as eight groups of two-sample pairs. All samples have the
same dimensions. Each pair has an identical hue between the two samples. However, the
samples are different with one step difference in the saturation value only. Out of the eight
groups of pairs; two pairs have red tones, two pairs have yellow tones, two pairs have green
tones, and two pairs have blue tones. Of each of the two pairs of the same tone, the difference
is that they are the selected as the closest hues to one another within that colour tone. Of
each matching groups of pairs of the same colour tone, one is displayed on a white (light)
background, and the other is displayed on a black (dark) background. Each experiment
participant views a set of a total of 128 Munsell colour system’s colour atlas samples that have
been used for all colour displays combined. A complete list of the exact sample codes, their
Casting a New Light on Museums and Galleries Emrah Baki Ulas
81
randomised order, and positioning including images of each viewing station is included in
section 2.3.4 Display Composition.
The detail intelligibility test setup is composed of a row of 10 Sloan letters in accordance with
the letter specifications, spacing, arrangement and viewing distances and ratios as described in
the Snellen Visual Acuity test procedure (Snellen, 1862). Letters are black printed on white
matte paper. The total number of printed letters each participant views as part of the test is
80 (eighty). Each of the eight stations uses the same ten-letter sample set. However, these are
arranged in a random order and follow a different sequence in each station. A complete list of
the exact letters, their randomised order, and positioning including images of each viewing
station is included in section 2.3.4 Display Composition. The intent with using the Snellen Visual
Acuity test procedure is to test the effect of light levels for the subject to maintain normal
vision. This method was chosen as a universal procedure because it provides a relatively robust
results eliminating a number of possible interference factors to detail recognition. For instance:
recognising letters is a task that is potentially less dependent on a range of subjective variants
compared to recognising words with meaning, or using actual figurative objects such as
artworks, collections or other ordinary objects. Using a universally accepted and practiced
procedure for testing detail recognition also can provide benefit beyond the scope of this
research and can inform other studies where relevant.
2.3.3.7 Questionnaire
As noted in Section 2.3.2 Methodology, the experiment uses the statistical study as the main
method of analysis, whereby each participant fills out an experiment questionnaire.
Each questionnaire is printed greyscale on a standard white A4 (ISO 216) paper. The
questionnaire consists of three parts as follows:
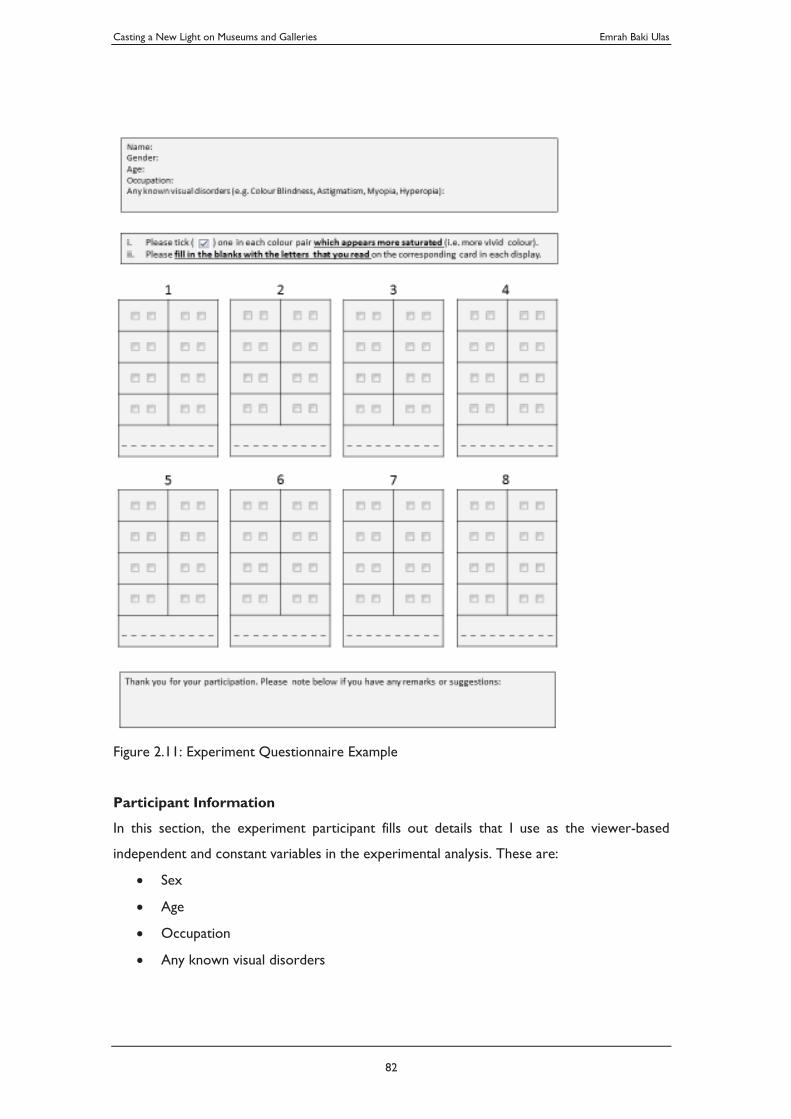
Casting a New Light on Museums and Galleries Emrah Baki Ulas
82
Figure 2.11: Experiment Questionnaire Example
Participant Information
In this section, the experiment participant fills out details that I use as the viewer-based
independent and constant variables in the experimental analysis. These are:
Sex
Age
Occupation
Any known visual disorders
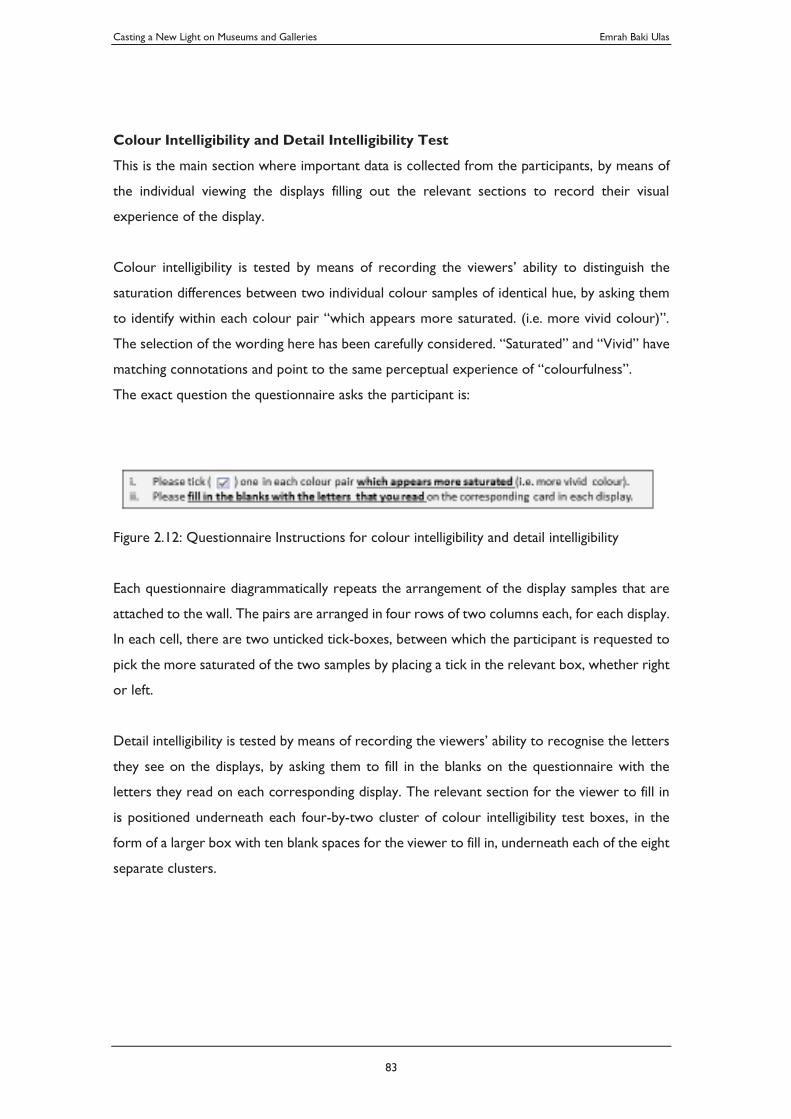
Casting a New Light on Museums and Galleries Emrah Baki Ulas
83
Colour Intelligibility and Detail Intelligibility Test
This is the main section where important data is collected from the participants, by means of
the individual viewing the displays filling out the relevant sections to record their visual
experience of the display.
Colour intelligibility is tested by means of recording the viewers’ ability to distinguish the
saturation differences between two individual colour samples of identical hue, by asking them
to identify within each colour pair “which appears more saturated. (i.e. more vivid colour)”.
The selection of the wording here has been carefully considered. “Saturated” and “Vivid” have
matching connotations and point to the same perceptual experience of “colourfulness”.
The exact question the questionnaire asks the participant is:
Figure 2.12: Questionnaire Instructions for colour intelligibility and detail intelligibility
Each questionnaire diagrammatically repeats the arrangement of the display samples that are
attached to the wall. The pairs are arranged in four rows of two columns each, for each display.
In each cell, there are two unticked tick-boxes, between which the participant is requested to
pick the more saturated of the two samples by placing a tick in the relevant box, whether right
or left.
Detail intelligibility is tested by means of recording the viewers’ ability to recognise the letters
they see on the displays, by asking them to fill in the blanks on the questionnaire with the
letters they read on each corresponding display. The relevant section for the viewer to fill in
is positioned underneath each four-by-two cluster of colour intelligibility test boxes, in the
form of a larger box with ten blank spaces for the viewer to fill in, underneath each of the eight
separate clusters.
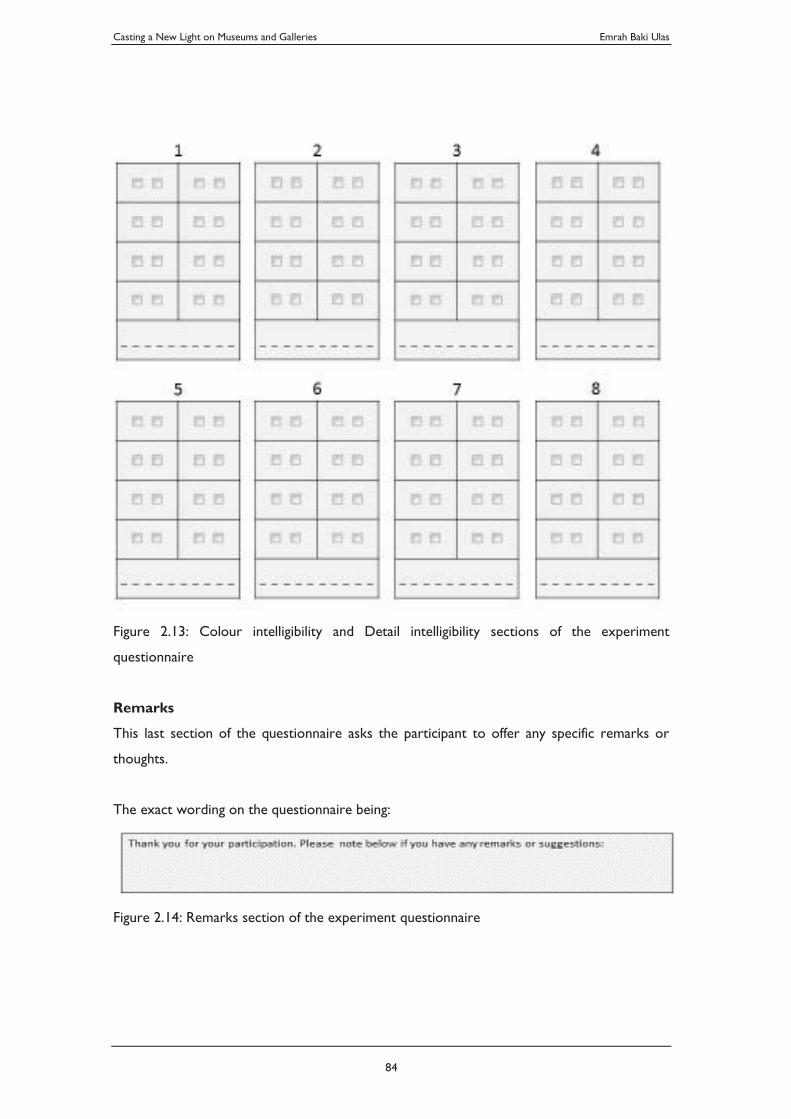
Casting a New Light on Museums and Galleries Emrah Baki Ulas
84
Figure 2.13: Colour intelligibility and Detail intelligibility sections of the experiment
questionnaire
Remarks
This last section of the questionnaire asks the participant to offer any specific remarks or
thoughts.
The exact wording on the questionnaire being:
Figure 2.14: Remarks section of the experiment questionnaire
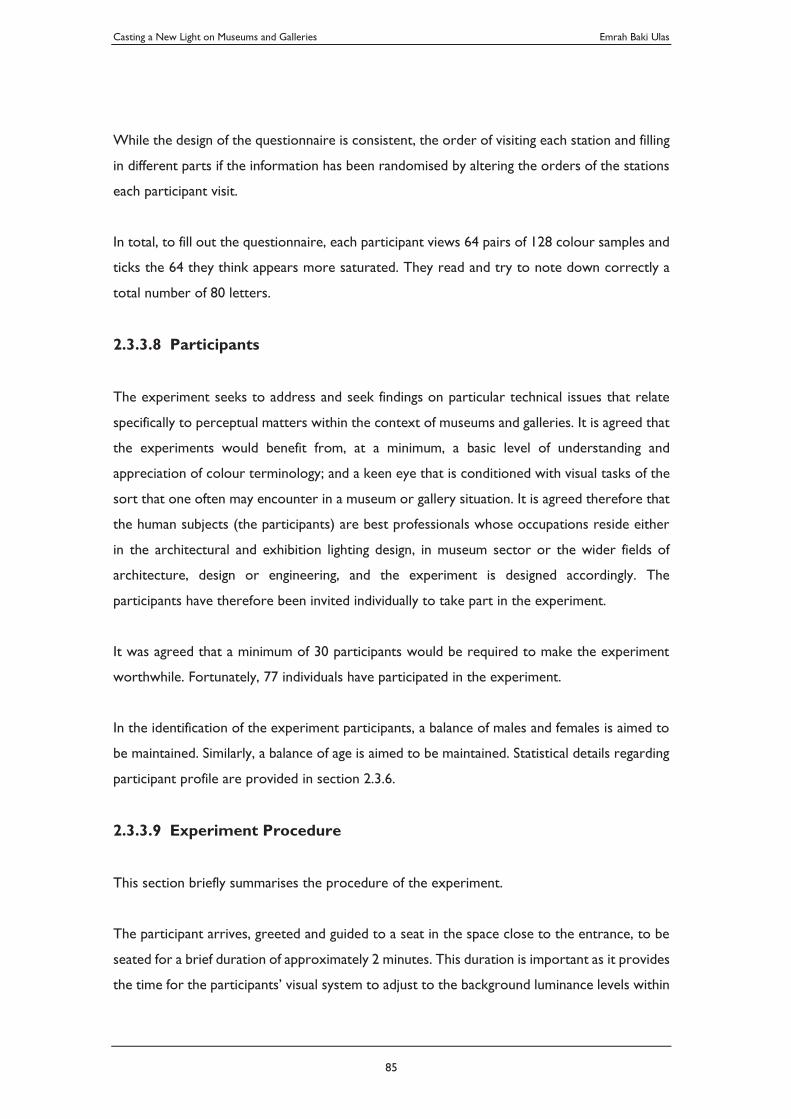
Casting a New Light on Museums and Galleries Emrah Baki Ulas
85
While the design of the questionnaire is consistent, the order of visiting each station and filling
in different parts if the information has been randomised by altering the orders of the stations
each participant visit.
In total, to fill out the questionnaire, each participant views 64 pairs of 128 colour samples and
ticks the 64 they think appears more saturated. They read and try to note down correctly a
total number of 80 letters.
2.3.3.8 Participants
The experiment seeks to address and seek findings on particular technical issues that relate
specifically to perceptual matters within the context of museums and galleries. It is agreed that
the experiments would benefit from, at a minimum, a basic level of understanding and
appreciation of colour terminology; and a keen eye that is conditioned with visual tasks of the
sort that one often may encounter in a museum or gallery situation. It is agreed therefore that
the human subjects (the participants) are best professionals whose occupations reside either
in the architectural and exhibition lighting design, in museum sector or the wider fields of
architecture, design or engineering, and the experiment is designed accordingly. The
participants have therefore been invited individually to take part in the experiment.
It was agreed that a minimum of 30 participants would be required to make the experiment
worthwhile. Fortunately, 77 individuals have participated in the experiment.
In the identification of the experiment participants, a balance of males and females is aimed to
be maintained. Similarly, a balance of age is aimed to be maintained. Statistical details regarding
participant profile are provided in section 2.3.6.
2.3.3.9 Experiment Procedure
This section briefly summarises the procedure of the experiment.
The participant arrives, greeted and guided to a seat in the space close to the entrance, to be
seated for a brief duration of approximately 2 minutes. This duration is important as it provides
the time for the participants’ visual system to adjust to the background luminance levels within
Casting a New Light on Museums and Galleries Emrah Baki Ulas
86
the space. During this adaptation period, the experimenter hands out the questionnaire and a
pen, and explains the experiment process and provides instructions as to how to fill out the
form. The participant firstly fills in the firstly the participant profiling details while still seated
on the chair (sex, age, any known visual disorders), then stands up and proceeds to the display
stations. Each display station is marked with a number on the floor, at the exact position where
the participant needs to stand and view the colour and detail samples. In addition to the
numbers that indicate the display stations, the distance and position the participant views each
display is kept consistent for every display station and marked across the room with a tape on
the floor. Each participant visits eight display stations in the order requested on the
questionnaire. The order of the stations each participant visits is different from others, as their
order on the questionnaires is randomised. (E.g. while one participant might visit the stations
in the order of 2-3-6-5-1-8-4-7, the other might view them in the order of 8-2-5-1-4-3-7-6
depending on the order given to them on their particular questionnaire.) The participant stands
in front of each display and fills out the particular section for that display on the spot, by ticking
the box that corresponds to the more saturated colour of the two in each of the eight hue
pairs in each station, and by filling in the letters they view. The experimenter stays in the room
at his desk and observes the participant to ensure they are following the randomised order as
per their questionnaire and to ensure they view the displays at the correct point. Once the
participant completes all eight stations, they hand in the questionnaire to the experimenter.
The experimenter undertakes a quick check on the spot to ascertain that the form is filled
correctly and as instructed and the required details have been included. The participant is
offered to ask if they have any questions and the answer is provided. The experiment sees the
participant to the exit and the participant leaves.
All experiments have been carried out with the personal instruction and supervision of the
author in person, as well as a research assistant, and under conditions that are kept as
homogeneous as possible, and as described above. Under no circumstances, more than 8
participants have been accepted to the experiment space at one time, and under no
circumstances, two or more participants have viewed the same display station concurrently.
Also, there has been no interaction between the participants during the experiments. The
average duration for participants completing the entire experiments from the time they arrive
in the studio has typically estimated to have taken 10 to 12 minutes.
Casting a New Light on Museums and Galleries Emrah Baki Ulas
87
2.3.4. Display Composition
2.3.4.1 Colour Displays
Colour displays and experimentation technique uses an approach similar to the Farnsworth-
Munsell 100 Hue Colour Vision Test (Farnsworth, 1943) in that the method is based on the
subject's visually distinguishing between samples colour qualities on a comparative basis. While
the Farnsworth-Munsell test is mainly based on hue comparisons, my test had separated hues
and focussed on the detection of saturation differences between near colour samples with
matching hue and lightness.
Originally invented in the early 1900s by A. H. Munsell and developed further into the 1940s,
Munsell Colour System categorises colours on three axes; hue (the classification of colour),
saturation (the intensity of colour) and value (lightness of colour ranging from black to white).
Although other colour systems existed with a three-axis approach to the categorisation of
colours at the time, Munsell proposed his colour system, according to Kuehni (2002) A.H.
Munsell's version was unique in that he was able to organise the aforementioned three
perceptual dimensions into an independently measurable atlas. With this unique aspect, as
referred to by Cuttle (2003) and by Landa (2005), Munsell Colour System provides a well-
founded basis for subjective colour measurements and experimentation in colourimetry, visual
acuity and the determination of visual disorders such as colour blindness (Farnsworth, 1943)
and widely referenced for studies similar to ours, where recognition and intelligibility of chroma
is the paramount.
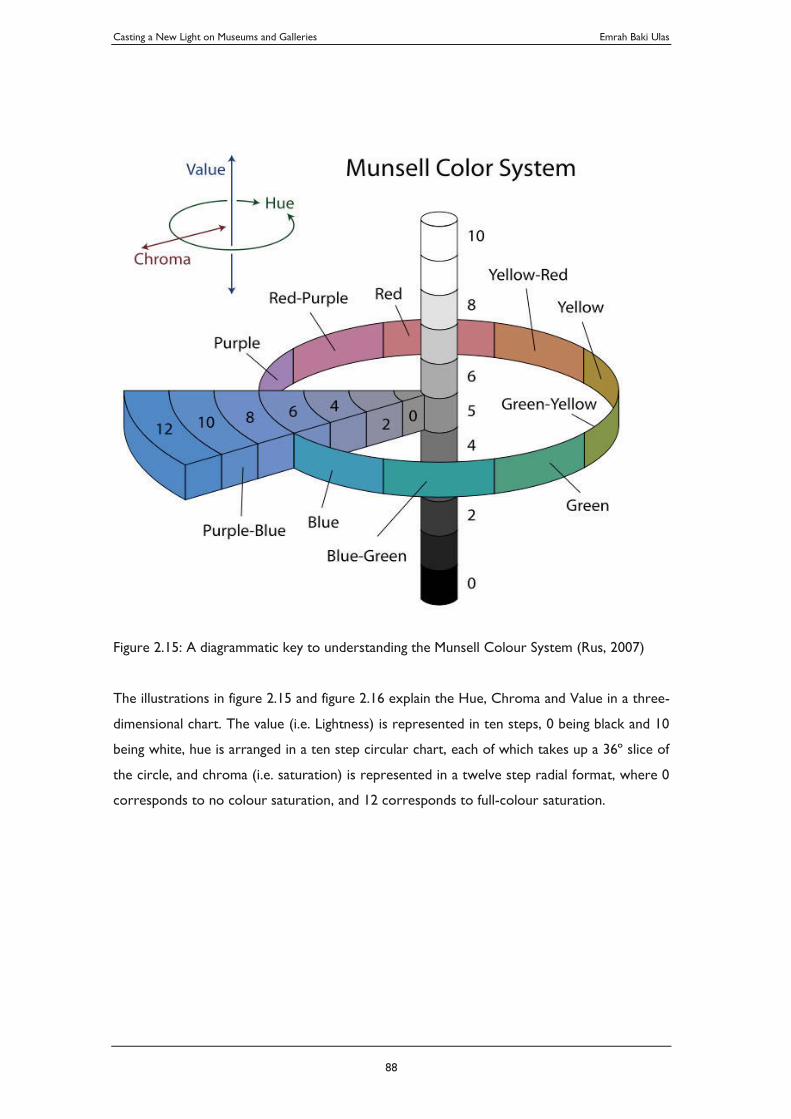
Casting a New Light on Museums and Galleries Emrah Baki Ulas
88
Figure 2.15: A diagrammatic key to understanding the Munsell Colour System (Rus, 2007)
The illustrations in figure 2.15 and figure 2.16 explain the Hue, Chroma and Value in a three-
dimensional chart. The value (i.e. Lightness) is represented in ten steps, 0 being black and 10
being white, hue is arranged in a ten step circular chart, each of which takes up a 36º slice of
the circle, and chroma (i.e. saturation) is represented in a twelve step radial format, where 0
corresponds to no colour saturation, and 12 corresponds to full-colour saturation.
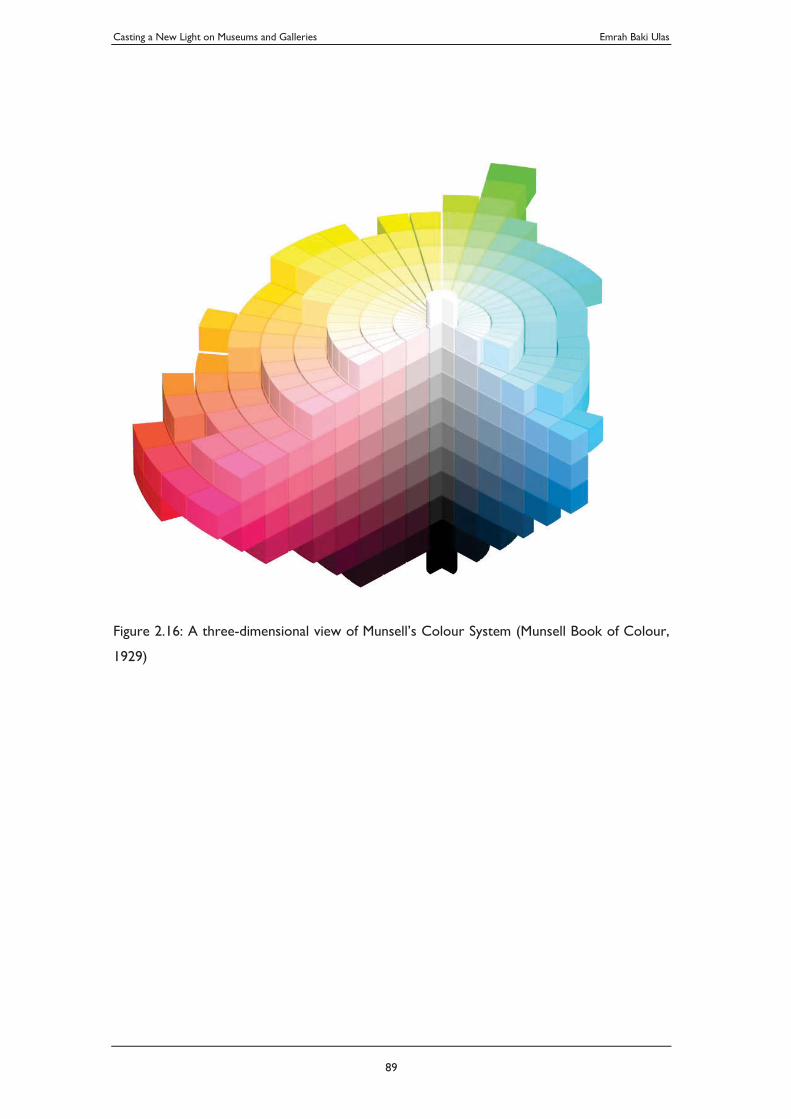
Casting a New Light on Museums and Galleries Emrah Baki Ulas
89
Figure 2.16: A three-dimensional view of Munsell’s Colour System (Munsell Book of Colour,
1929)
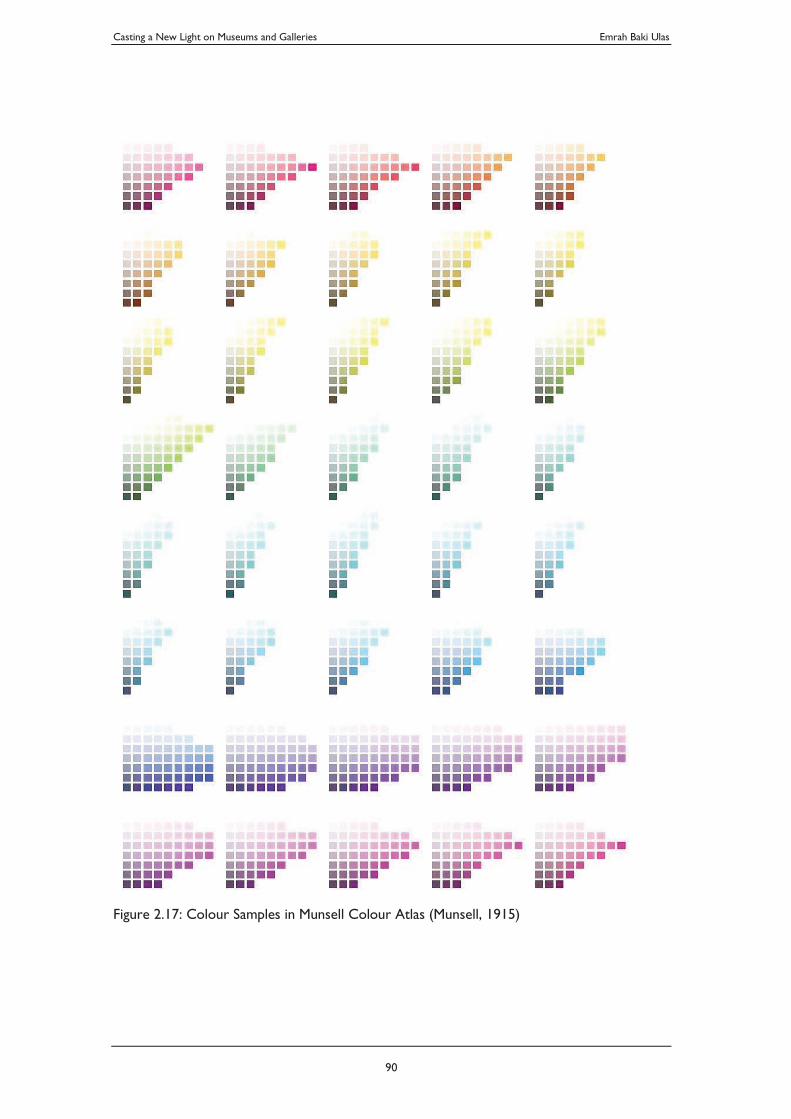
Casting a New Light on Museums and Galleries Emrah Baki Ulas
90
Figure 2.17: Colour Samples in Munsell Colour Atlas (Munsell, 1915)
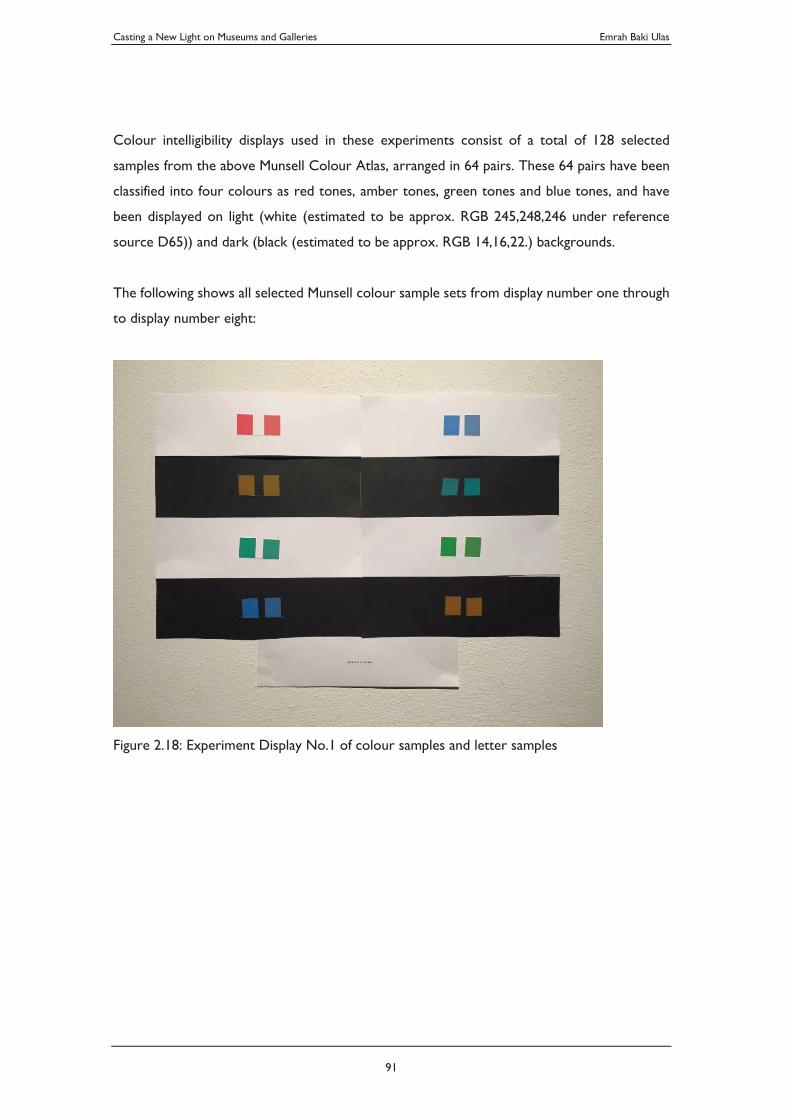
Casting a New Light on Museums and Galleries Emrah Baki Ulas
91
Colour intelligibility displays used in these experiments consist of a total of 128 selected
samples from the above Munsell Colour Atlas, arranged in 64 pairs. These 64 pairs have been
classified into four colours as red tones, amber tones, green tones and blue tones, and have
been displayed on light (white (estimated to be approx. RGB 245,248,246 under reference
source D65)) and dark (black (estimated to be approx. RGB 14,16,22.) backgrounds.
The following shows all selected Munsell colour sample sets from display number one through
to display number eight:
Figure 2.18: Experiment Display No.1 of colour samples and letter samples
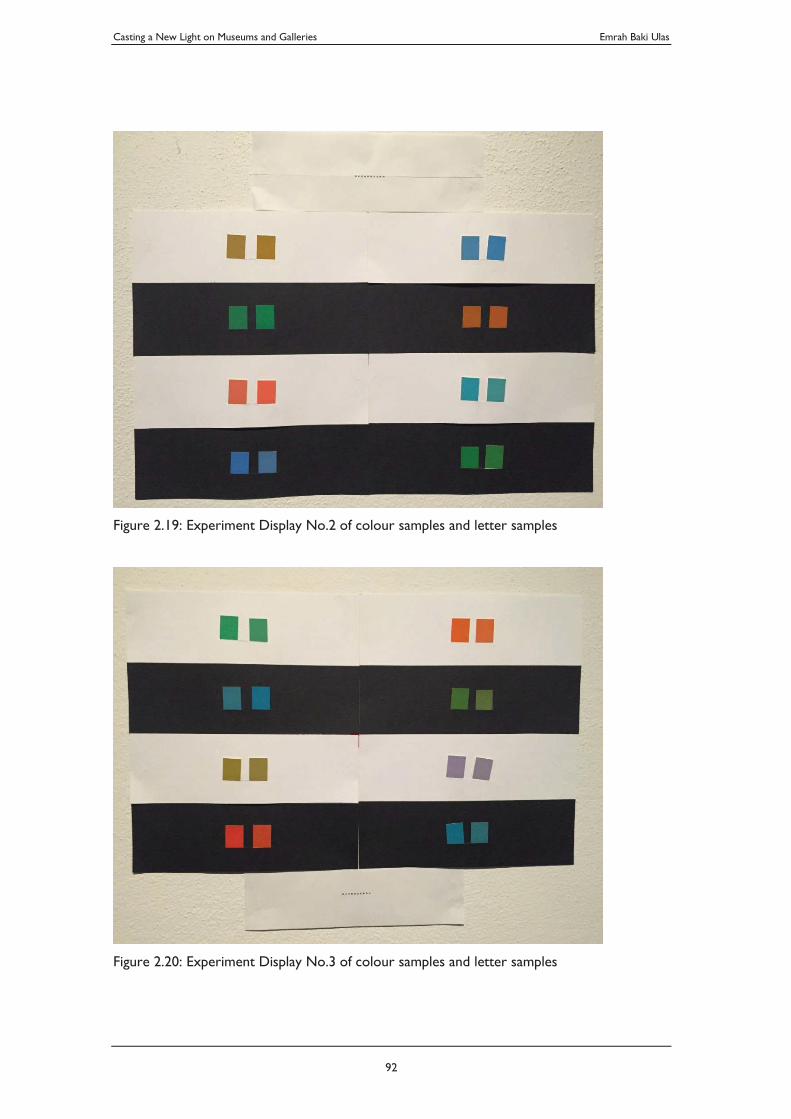
Casting a New Light on Museums and Galleries Emrah Baki Ulas
92
Figure 2.19: Experiment Display No.2 of colour samples and letter samples
Figure 2.20: Experiment Display No.3 of colour samples and letter samples
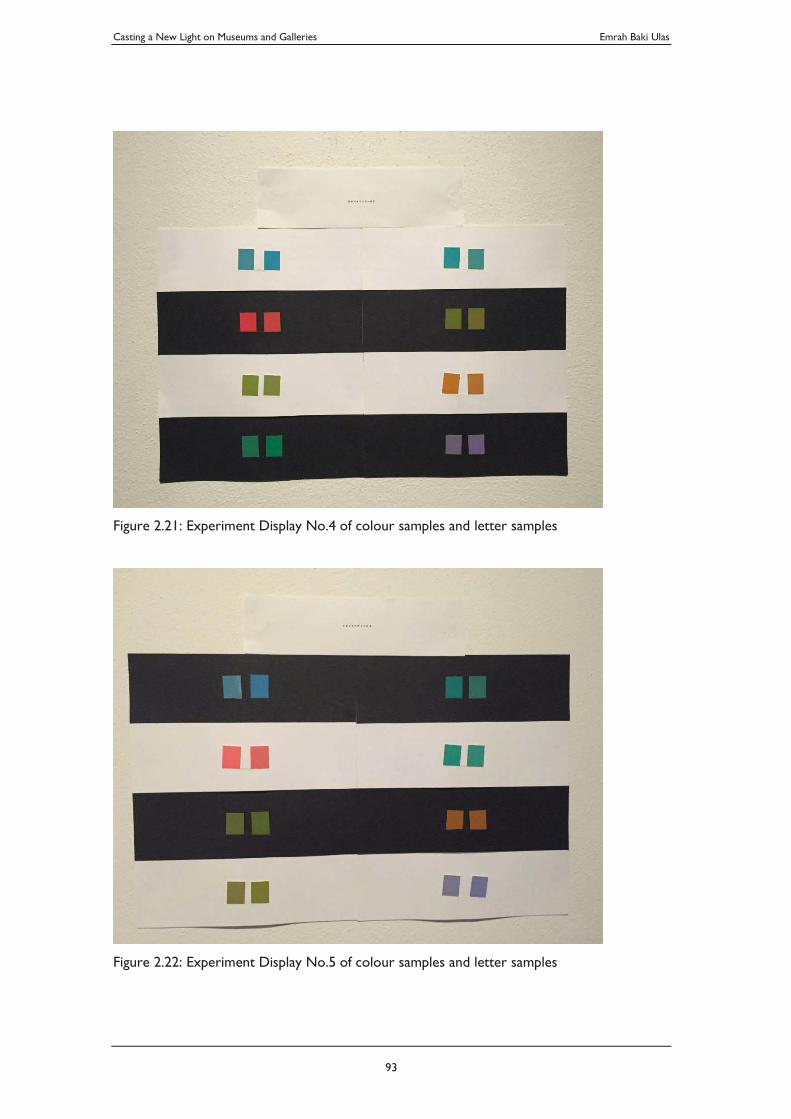
Casting a New Light on Museums and Galleries Emrah Baki Ulas
93
Figure 2.21: Experiment Display No.4 of colour samples and letter samples
Figure 2.22: Experiment Display No.5 of colour samples and letter samples
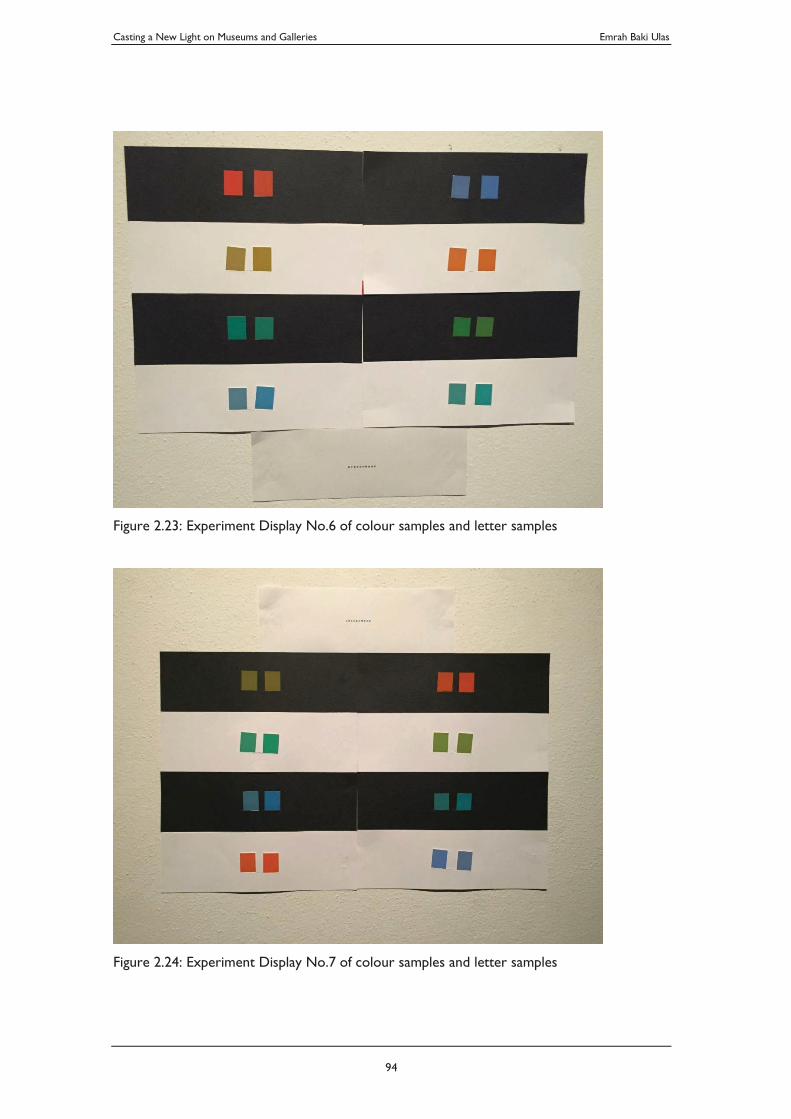
Casting a New Light on Museums and Galleries Emrah Baki Ulas
94
Figure 2.23: Experiment Display No.6 of colour samples and letter samples
Figure 2.24: Experiment Display No.7 of colour samples and letter samples
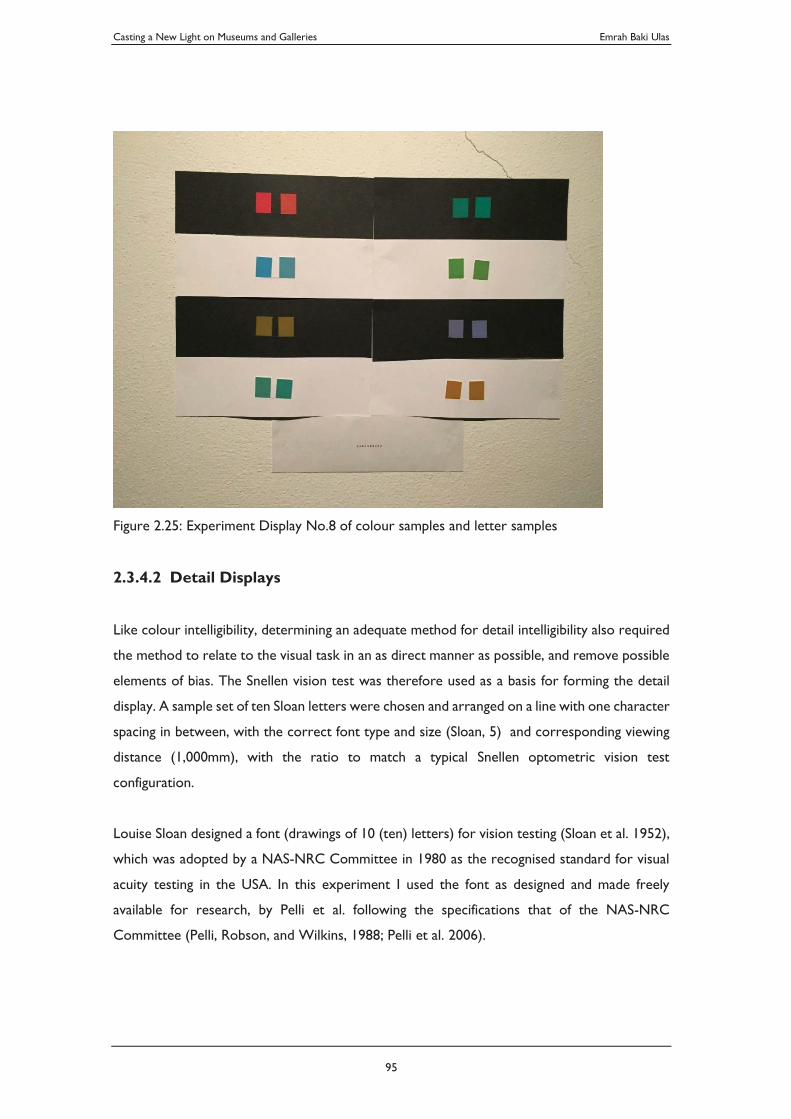
Casting a New Light on Museums and Galleries Emrah Baki Ulas
95
Figure 2.25: Experiment Display No.8 of colour samples and letter samples
2.3.4.2 Detail Displays
Like colour intelligibility, determining an adequate method for detail intelligibility also required
the method to relate to the visual task in an as direct manner as possible, and remove possible
elements of bias. The Snellen vision test was therefore used as a basis for forming the detail
display. A sample set of ten Sloan letters were chosen and arranged on a line with one character
spacing in between, with the correct font type and size (Sloan, 5) and corresponding viewing
distance (1,000mm), with the ratio to match a typical Snellen optometric vision test
configuration.
Louise Sloan designed a font (drawings of 10 (ten) letters) for vision testing (Sloan et al. 1952),
which was adopted by a NAS-NRC Committee in 1980 as the recognised standard for visual
acuity testing in the USA. In this experiment I used the font as designed and made freely
available for research, by Pelli et al. following the specifications that of the NAS-NRC
Committee (Pelli, Robson, and Wilkins, 1988; Pelli et al. 2006).
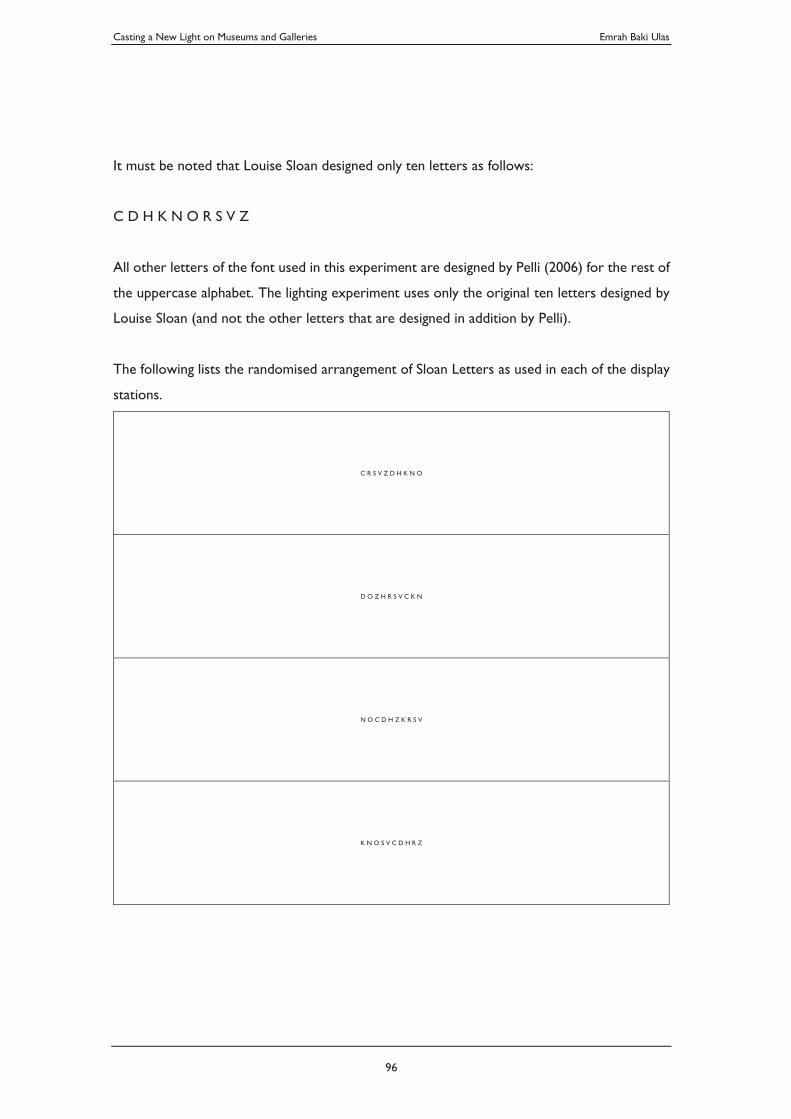
Casting a New Light on Museums and Galleries Emrah Baki Ulas
96
It must be noted that Louise Sloan designed only ten letters as follows:
C D H K N O R S V Z
All other letters of the font used in this experiment are designed by Pelli (2006) for the rest of
the uppercase alphabet. The lighting experiment uses only the original ten letters designed by
Louise Sloan (and not the other letters that are designed in addition by Pelli).
The following lists the randomised arrangement of Sloan Letters as used in each of the display
stations.
C R S V Z D H K N O
D O Z H R S V C K N
N O C D H Z K R S V
K N O S V C D H R Z
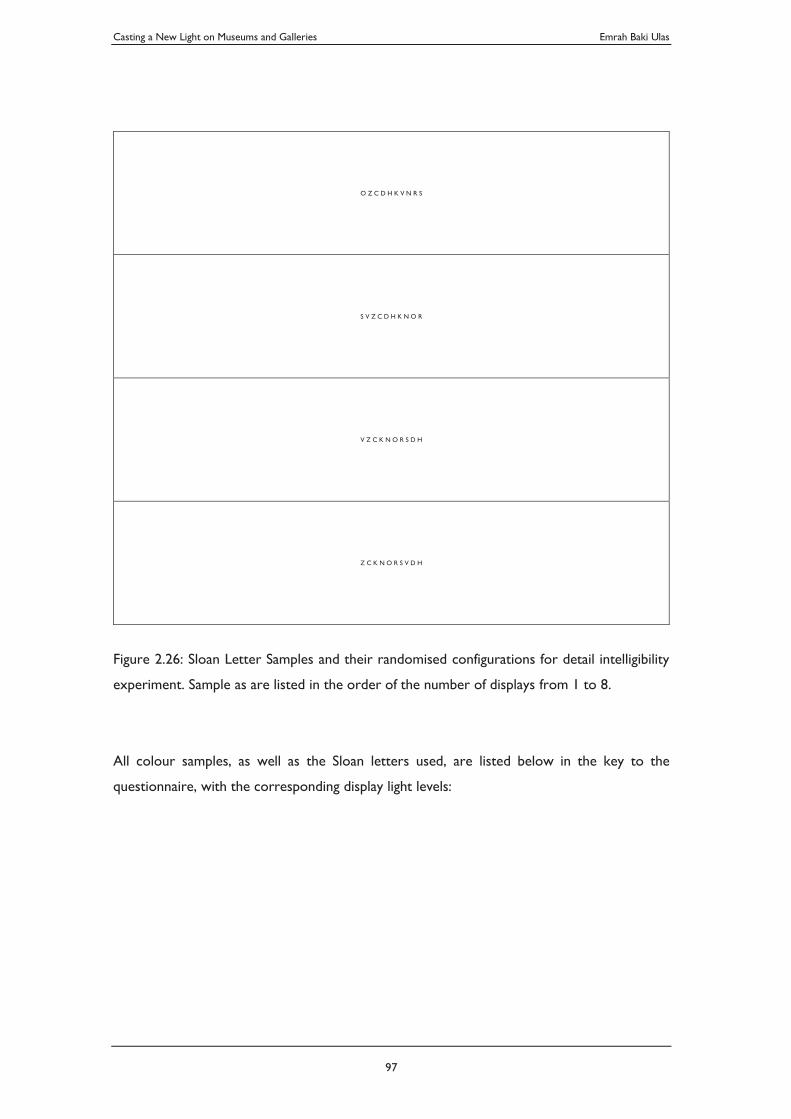
Casting a New Light on Museums and Galleries Emrah Baki Ulas
97
O Z C D H K V N R S
S V Z C D H K N O R
V Z C K N O R S D H
Z C K N O R S V D H
Figure 2.26: Sloan Letter Samples and their randomised configurations for detail intelligibility
experiment. Sample as are listed in the order of the number of displays from 1 to 8.
All colour samples, as well as the Sloan letters used, are listed below in the key to the
questionnaire, with the corresponding display light levels:
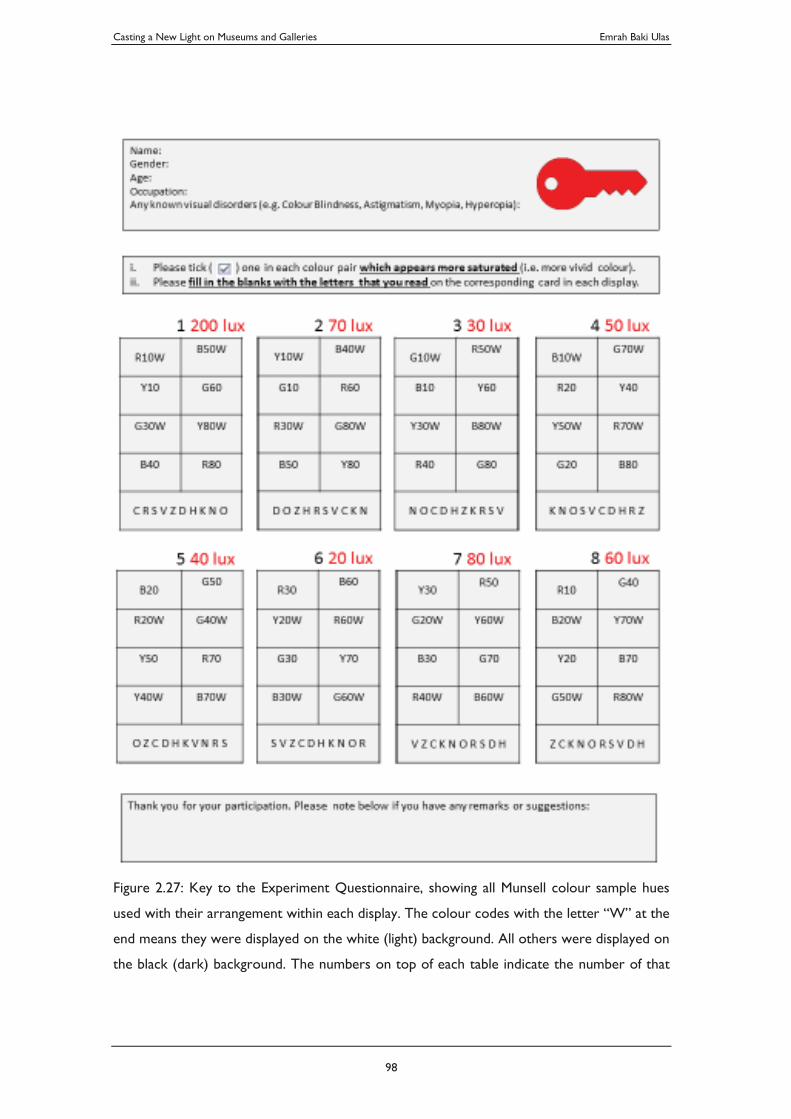
Casting a New Light on Museums and Galleries Emrah Baki Ulas
98
Figure 2.27: Key to the Experiment Questionnaire, showing all Munsell colour sample hues
used with their arrangement within each display. The colour codes with the letter “W” at the
end means they were displayed on the white (light) background. All others were displayed on
the black (dark) background. The numbers on top of each table indicate the number of that
Casting a New Light on Museums and Galleries Emrah Baki Ulas
99
particular display station and the illuminance level noted in red, next to the display station
number indicate the level of light applied to that particular display station.
2.3.5. Lighting Composition
2.3.5.1 Lighting Criteria
Common best practice requires lighting equipment that is to be used for museum or gallery
exhibition display to have excellent colour rendering capabilities, adequate colour temperature,
colour consistency, low light-induced damage potential, luminous efficacy and optical precision
as well as reliable, functional life and lumen maintenance.
Equipment to be used for a museum exhibition display, therefore, needs to adhere to strict
criteria. Such criteria have been applied to the equipment selected for the light experiments,
to ensure the experiment conditions are as representative of modern best practice museum
lighting conditions as possible, particularly regarding the spectral and spatial characteristics.
2.3.5.2 Lighting Equipment
All eight display stations have been illuminated with identical lighting equipment, mounted on
the same track infrastructure. The specifications of the Lighting Track and Lighting Equipment
are as follows:
Casting a New Light on Museums and Galleries Emrah Baki Ulas
100
Lighting Tracks
Description Surface mounted Black Three Circuit Lighting Track
(Standard length 3m, Cut to suit)
Model Lighting Track - Surface Mounted Black Three Circuit
Catalogue No. 78363.000
Manufacturer Erco
Supplier Erco
Light Source n/a
Finish Black
Dimensions W: 33.5 mm x H 35 mm x L approx. 10,000 mm total
(Layout L-Shaped 4,000 mm + 6,000 m)
Accessories Complete with live end, couplers, L-connectors and end
cap.
Notes Installed underneath the ceiling grid structure, approx.
1,000 mm set back from the wall.
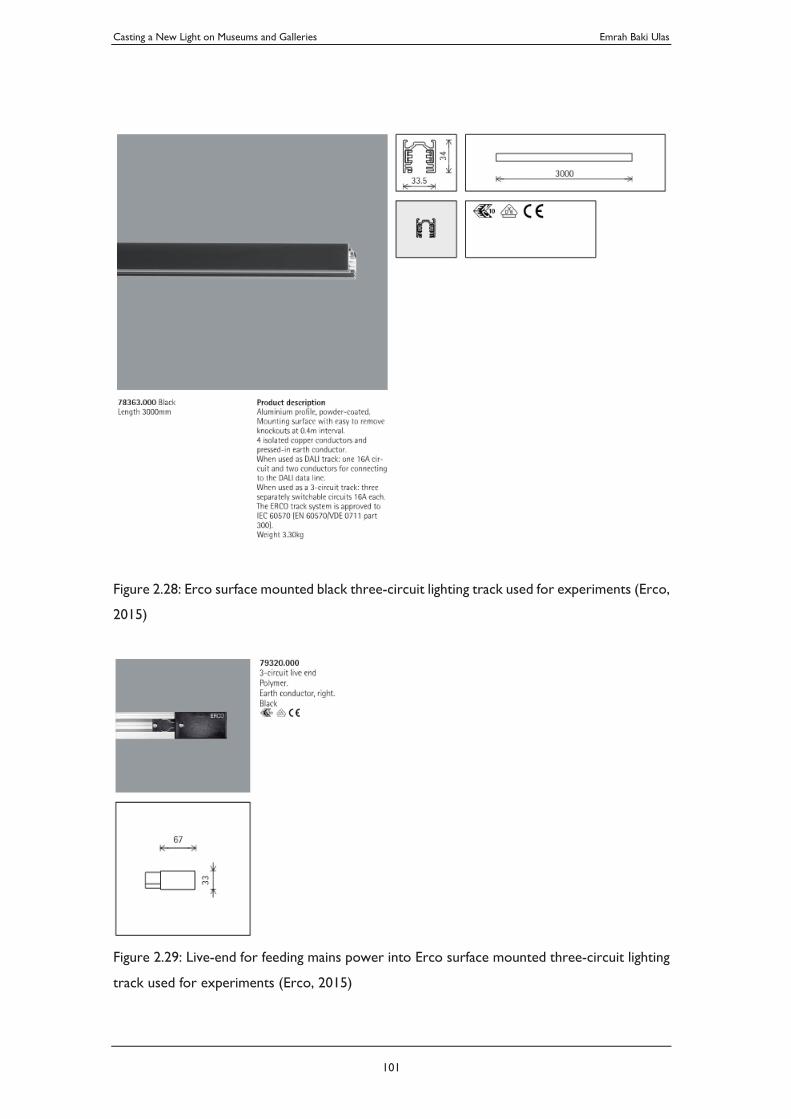
Casting a New Light on Museums and Galleries Emrah Baki Ulas
101
Figure 2.28: Erco surface mounted black three-circuit lighting track used for experiments (Erco,
2015)
Figure 2.29: Live-end for feeding mains power into Erco surface mounted three-circuit lighting
track used for experiments (Erco, 2015)
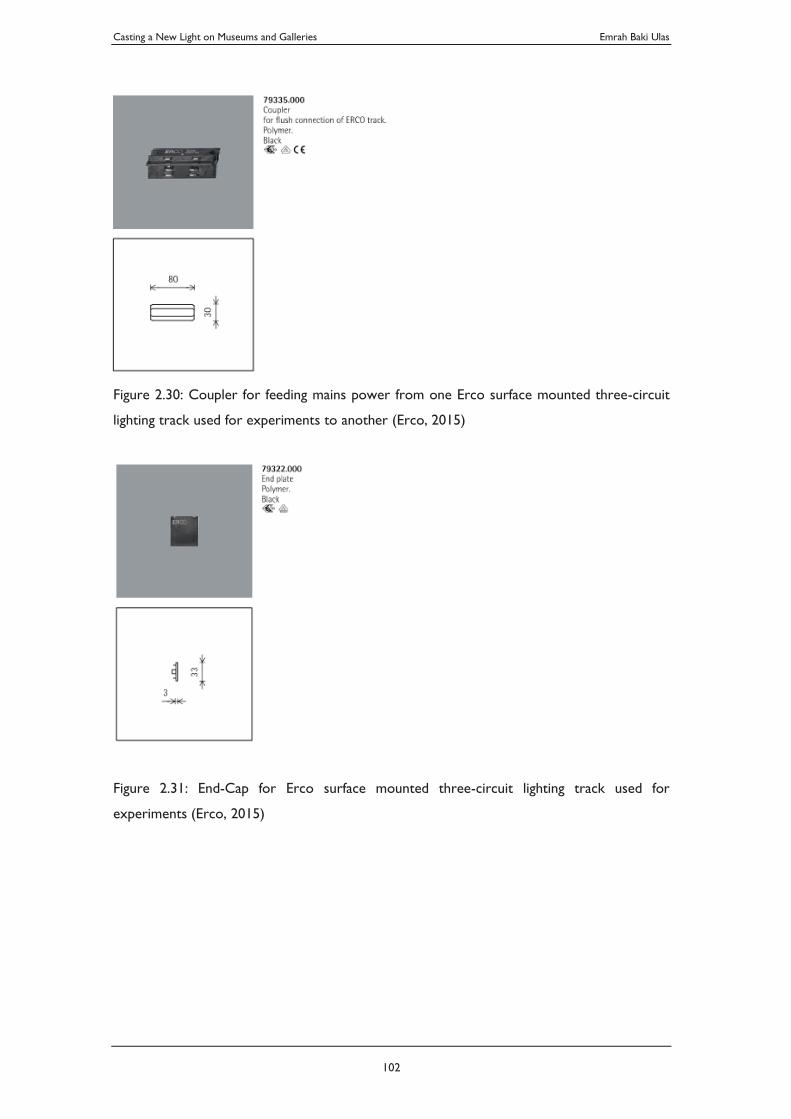
Casting a New Light on Museums and Galleries Emrah Baki Ulas
102
Figure 2.30: Coupler for feeding mains power from one Erco surface mounted three-circuit
lighting track used for experiments to another (Erco, 2015)
Figure 2.31: End-Cap for Erco surface mounted three-circuit lighting track used for
experiments (Erco, 2015)
Casting a New Light on Museums and Galleries Emrah Baki Ulas
103
Luminaires
Description Track-mounted Black LED Luminaire
Model Parscan for Lighting Track
Catalogue No. 71651.000
Manufacturer Erco
Supplier Erco
Light Source Light-Emitting Diode, 12 W, 3000K, Spot Optic
Finish Black
Dimensions W: 33.5 mm x H 35 mm x L approx. 10,000 mm total
(Layout L-Shaped 4,000 mm + 6,000 m)
Accessories Complete with live end, couplers, L-connectors and end
cap.
Notes Installed underneath the ceiling grid structure, approx.
1,000 mm set back from the wall.
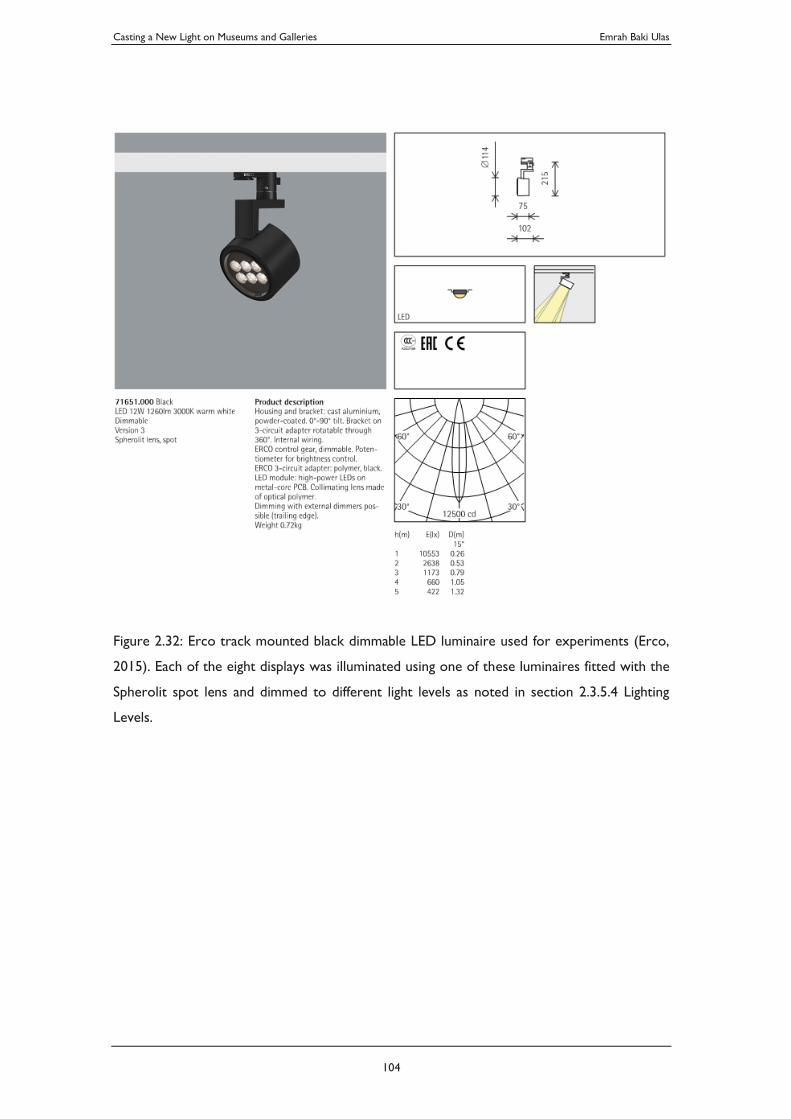
Casting a New Light on Museums and Galleries Emrah Baki Ulas
104
Figure 2.32: Erco track mounted black dimmable LED luminaire used for experiments (Erco,
2015). Each of the eight displays was illuminated using one of these luminaires fitted with the
Spherolit spot lens and dimmed to different light levels as noted in section 2.3.5.4 Lighting
Levels.
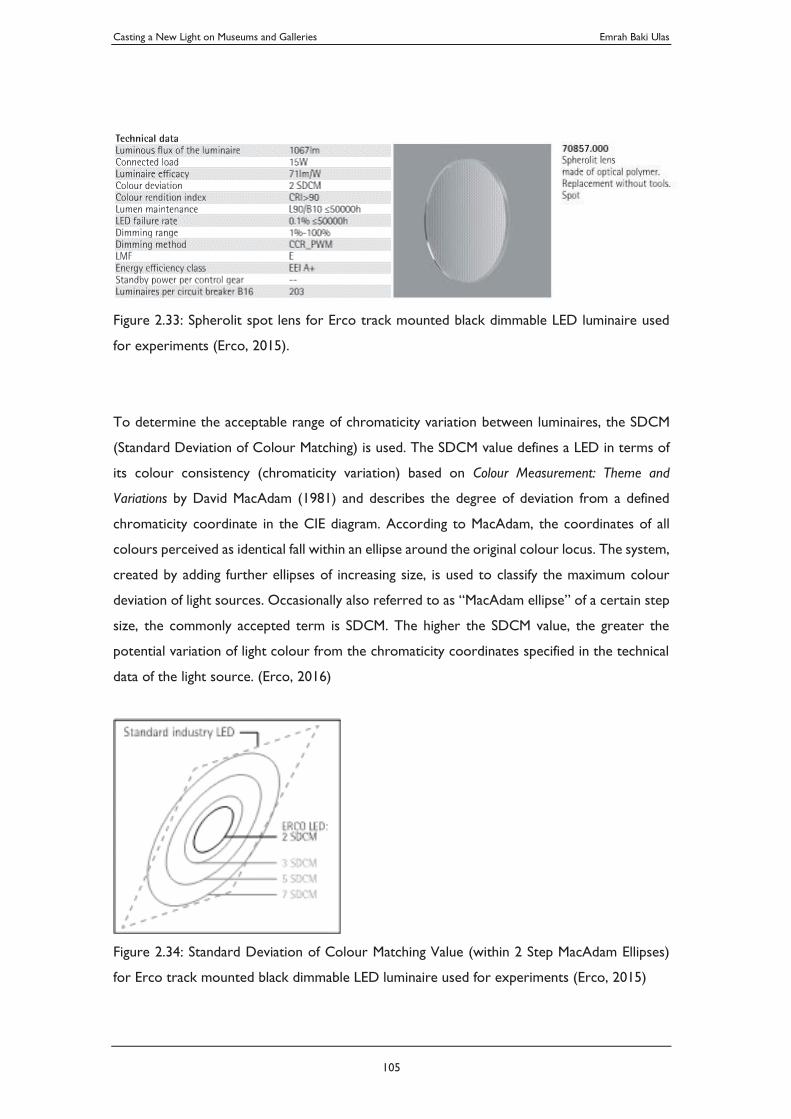
Casting a New Light on Museums and Galleries Emrah Baki Ulas
105
Figure 2.33: Spherolit spot lens for Erco track mounted black dimmable LED luminaire used
for experiments (Erco, 2015).
To determine the acceptable range of chromaticity variation between luminaires, the SDCM
(Standard Deviation of Colour Matching) is used. The SDCM value defines a LED in terms of
its colour consistency (chromaticity variation) based on Colour Measurement: Theme and
Variations by David MacAdam (1981) and describes the degree of deviation from a defined
chromaticity coordinate in the CIE diagram. According to MacAdam, the coordinates of all
colours perceived as identical fall within an ellipse around the original colour locus. The system,
created by adding further ellipses of increasing size, is used to classify the maximum colour
deviation of light sources. Occasionally also referred to as “MacAdam ellipse” of a certain step
size, the commonly accepted term is SDCM. The higher the SDCM value, the greater the
potential variation of light colour from the chromaticity coordinates specified in the technical
data of the light source. (Erco, 2016)
Figure 2.34: Standard Deviation of Colour Matching Value (within 2 Step MacAdam Ellipses)
for Erco track mounted black dimmable LED luminaire used for experiments (Erco, 2015)
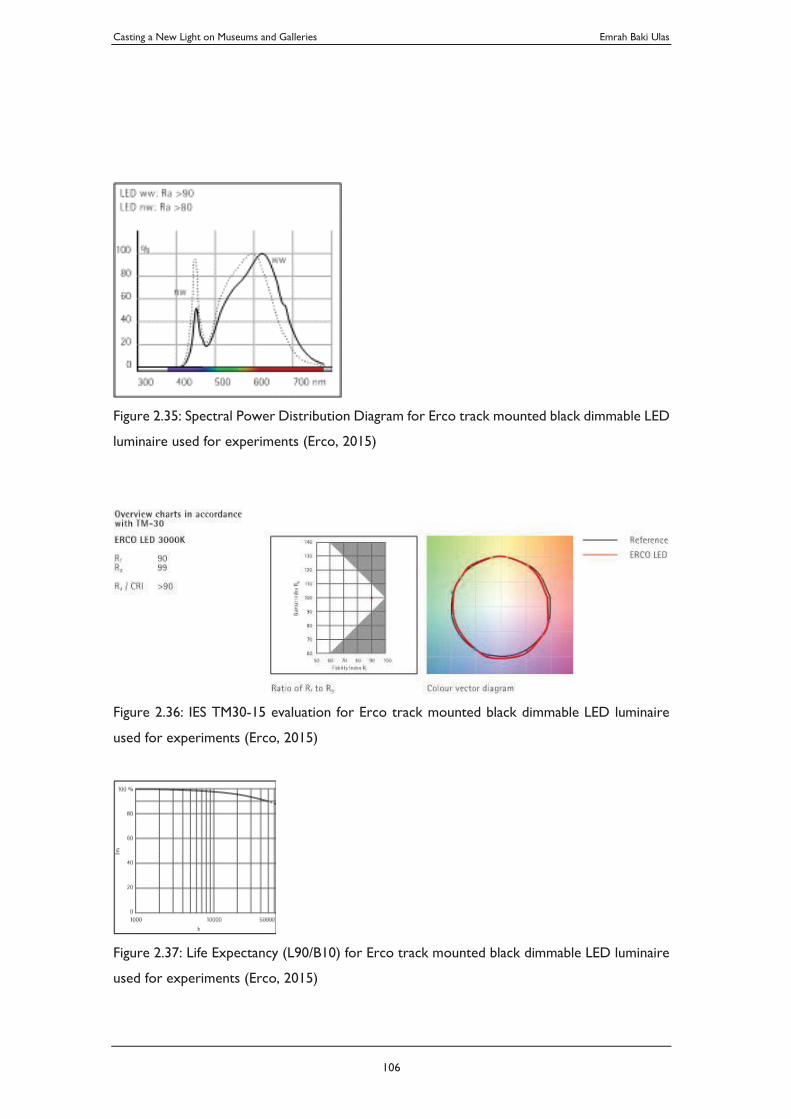
Casting a New Light on Museums and Galleries Emrah Baki Ulas
106
Figure 2.35: Spectral Power Distribution Diagram for Erco track mounted black dimmable LED
luminaire used for experiments (Erco, 2015)
Figure 2.36: IES TM30-15 evaluation for Erco track mounted black dimmable LED luminaire
used for experiments (Erco, 2015)
Figure 2.37: Life Expectancy (L90/B10) for Erco track mounted black dimmable LED luminaire
used for experiments (Erco, 2015)
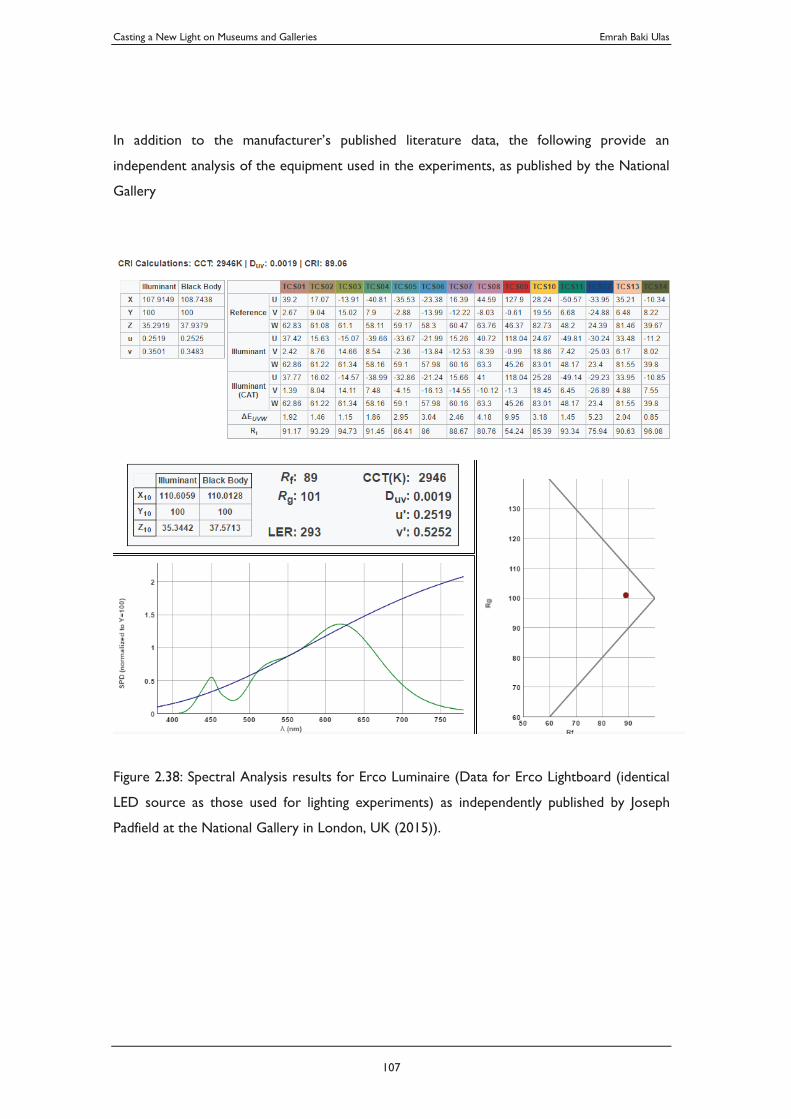
Casting a New Light on Museums and Galleries Emrah Baki Ulas
107
In addition to the manufacturer’s published literature data, the following provide an
independent analysis of the equipment used in the experiments, as published by the National
Gallery
Figure 2.38: Spectral Analysis results for Erco Luminaire (Data for Erco Lightboard (identical
LED source as those used for lighting experiments) as independently published by Joseph
Padfield at the National Gallery in London, UK (2015)).
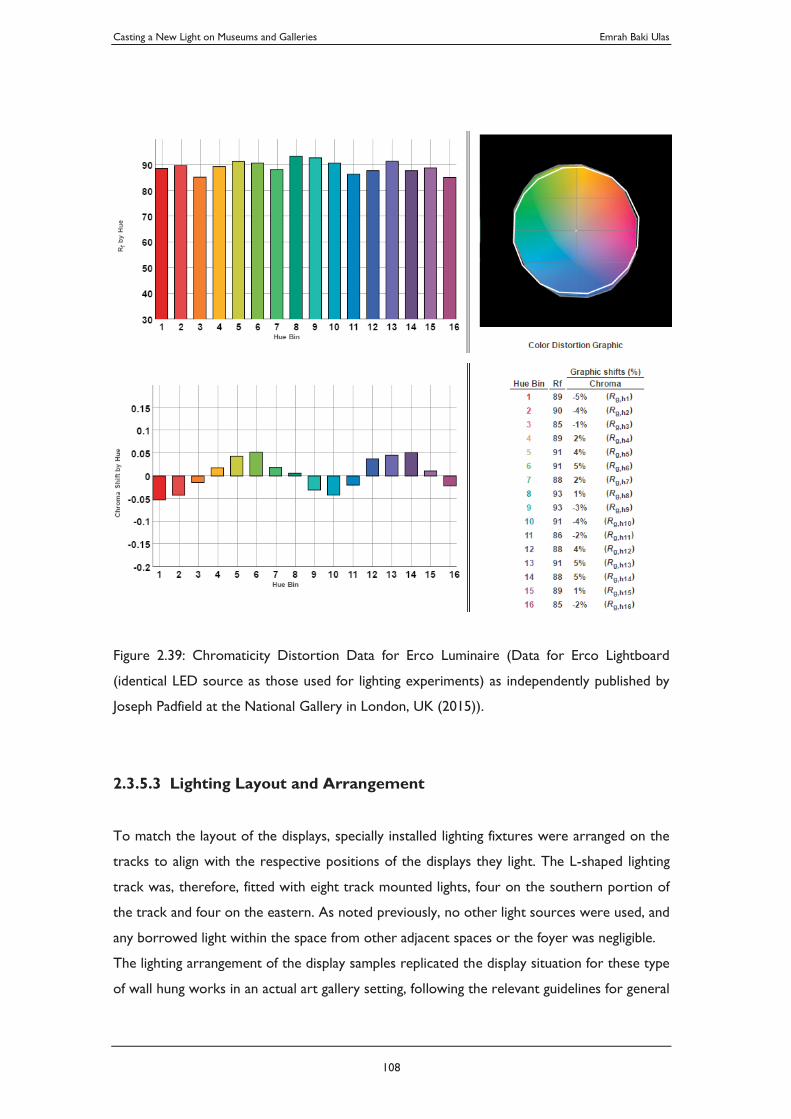
Casting a New Light on Museums and Galleries Emrah Baki Ulas
108
Figure 2.39: Chromaticity Distortion Data for Erco Luminaire (Data for Erco Lightboard
(identical LED source as those used for lighting experiments) as independently published by
Joseph Padfield at the National Gallery in London, UK (2015)).
2.3.5.3 Lighting Layout and Arrangement
To match the layout of the displays, specially installed lighting fixtures were arranged on the
tracks to align with the respective positions of the displays they light. The L-shaped lighting
track was, therefore, fitted with eight track mounted lights, four on the southern portion of
the track and four on the eastern. As noted previously, no other light sources were used, and
any borrowed light within the space from other adjacent spaces or the foyer was negligible.
The lighting arrangement of the display samples replicated the display situation for these type
of wall hung works in an actual art gallery setting, following the relevant guidelines for general
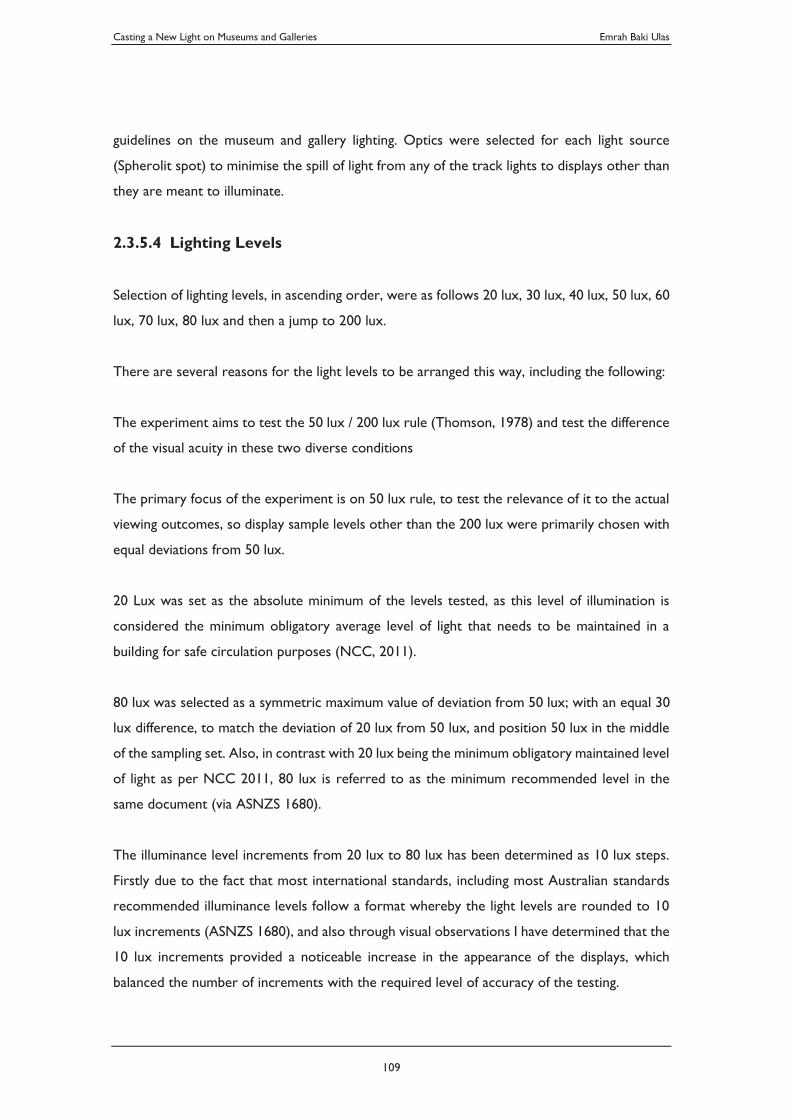
Casting a New Light on Museums and Galleries Emrah Baki Ulas
109
guidelines on the museum and gallery lighting. Optics were selected for each light source
(Spherolit spot) to minimise the spill of light from any of the track lights to displays other than
they are meant to illuminate.
2.3.5.4 Lighting Levels
Selection of lighting levels, in ascending order, were as follows 20 lux, 30 lux, 40 lux, 50 lux, 60
lux, 70 lux, 80 lux and then a jump to 200 lux.
There are several reasons for the light levels to be arranged this way, including the following:
The experiment aims to test the 50 lux / 200 lux rule (Thomson, 1978) and test the difference
of the visual acuity in these two diverse conditions
The primary focus of the experiment is on 50 lux rule, to test the relevance of it to the actual
viewing outcomes, so display sample levels other than the 200 lux were primarily chosen with
equal deviations from 50 lux.
20 Lux was set as the absolute minimum of the levels tested, as this level of illumination is
considered the minimum obligatory average level of light that needs to be maintained in a
building for safe circulation purposes (NCC, 2011).
80 lux was selected as a symmetric maximum value of deviation from 50 lux; with an equal 30
lux difference, to match the deviation of 20 lux from 50 lux, and position 50 lux in the middle
of the sampling set. Also, in contrast with 20 lux being the minimum obligatory maintained level
of light as per NCC 2011, 80 lux is referred to as the minimum recommended level in the
same document (via ASNZS 1680).
The illuminance level increments from 20 lux to 80 lux has been determined as 10 lux steps.
Firstly due to the fact that most international standards, including most Australian standards
recommended illuminance levels follow a format whereby the light levels are rounded to 10
lux increments (ASNZS 1680), and also through visual observations I have determined that the
10 lux increments provided a noticeable increase in the appearance of the displays, which
balanced the number of increments with the required level of accuracy of the testing.
Casting a New Light on Museums and Galleries Emrah Baki Ulas
110
To avoid the experiment bias that may result from the viewing of the works in incremental
manner starting from the lowest to highest illuminance level or vice versa, I have employed an
approach whereby the display station light levels were randomised, so the viewers are not
hinted in which level they are supposed to have a better visual acuity (which could result due
to them adjusting their self-expectations for lower and higher degrees of illumination), i.e.
instead of following an incremented or decremented order in the arrangement of display
stations; I have followed an approach whereby the light levels were randomly assigned as
follows;
1: 200Lux
2: 70 Lux
3: 30 Lux
4: 50 Lux
5: 20 Lux
6: 40 Lux
7: 80 Lux
8: 60 Lux
In addition to this, the order each individual viewed different stations were also randomised by
giving them different survey forms in which the viewing order of the stations was arranged
differently.
2.3.5.5 Lighting Aiming and Controls
Track Light fixtures were individually installed on the track with due measurements to be
within a maximum of ±50mm of the original axis of the vertical centre of the corresponding
displays. The rotation angle of each of the track lights was checked to ensure they maintained
a perpendicular alignment to the display walls and were within a maximum of ±3º of the
perpendicular axis with respect to the vertical centre of each of the wall displays. With this
aiming, the entire surface of each of the display was uniformly and illuminated with a deviation
of not more than ±5% difference in illuminance levels between the centre and the edges of
each of the wall displays.
Casting a New Light on Museums and Galleries Emrah Baki Ulas
111
Electrically, lighting was controlled with a set and forget methodology, whereby each track light
fitting was equipped with an on-board dimming knob. Each of the track lights was manually
adjusted to the above-mentioned levels with the assistance of a calibrated high-quality light
metre (a Cosine and colour corrected, CNS 5119 Class I light metre (Extech Instruments,
EA33 Easyview with Memory) (See 2.3.5.6 Lighting measurements). Once the adjustments were
made, lights were not switched on or off during or between experiments and were kept on to
maintain consistent conditions.
2.3.5.6 Lighting Measurements
As noted in 2.3.5.5 lighting aiming and controls, each track light fixture was manually adjusted
to predetermined illuminance levels via the on-board dimming knobs. This adjustment was
undertaken with the light metre (Extech Instruments, EA33 Easyview with Memory) with its
light sensor being positioned in the centre of the display surface with a tolerance of not more
than ±10mm off the centre of the display surface. The illuminance levels noted in section 2.3.5.4
lighting levels are those that were measured at the centre of each of the wall displays, through
this procedure. To manage the spill light from any of the lights to the neighbouring displays,
the procedure was repeated three rounds to fine tune the lights to accurate levels, within a
precision of ±0.5 lux of the determined illuminance level value.
Since the experiments were repeated over a number of days, the illuminance levels were
checked on a daily basis, to ensure the lighting conditions remained unchanged during the
experimentation process. The alignment and position of the lighting and the general visual
arrangement were visually inspected on a daily basis to ensure consistency in the different days
the tests were undertaken.
Another important concern was the shift in the correlated colour temperature of the emitted
light due to dimming. Although the visual inspection of the lighting setup did not demonstrate
any noticeable differences in the colour tone of the lights, and although it is known most good
quality Light-emitting Diodes do not suffer from this in contrast with other light sources such
as incandescent lamps (that tend to shift in their correlated colour temperature along the
Planckian Locus (CIE, 1931), to lower Kelvin degrees, i.e. towards warmer (reddish) tones, due
to the change in the composition of their light output), it was considered as an important
aspect that needed to be checked. The later tests using a Cosine and colour corrected, CNS
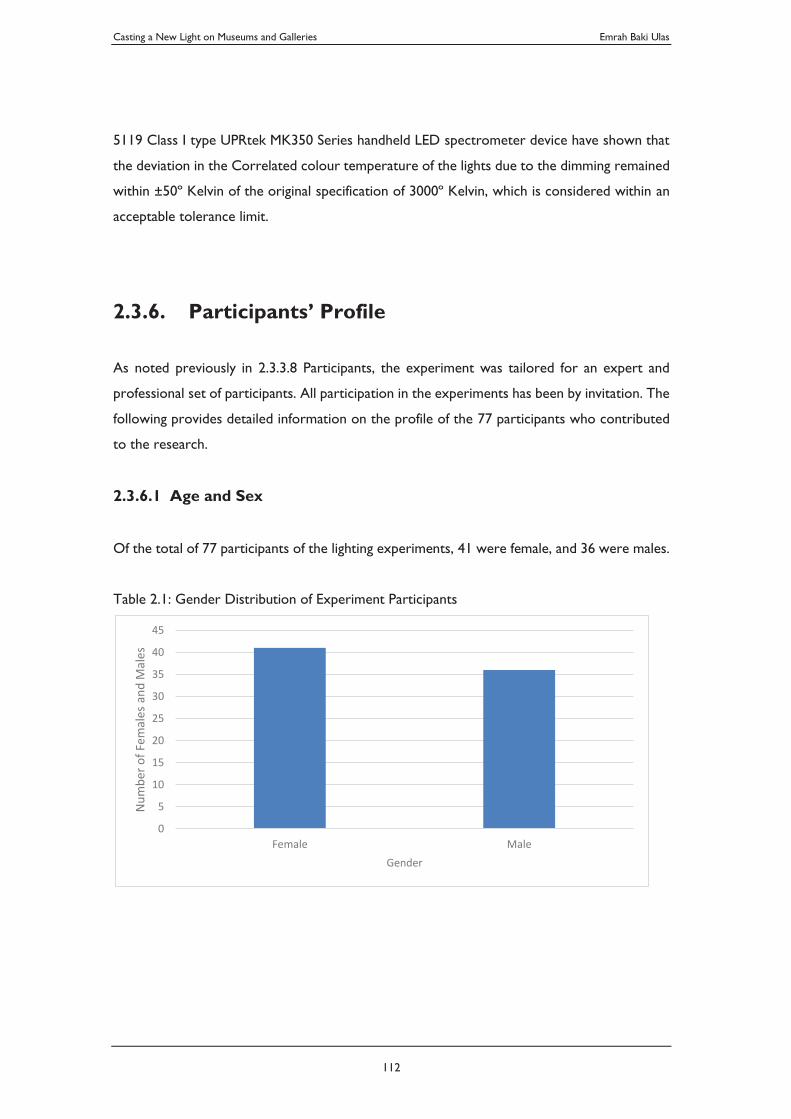
Casting a New Light on Museums and Galleries Emrah Baki Ulas
112
5119 Class I type UPRtek MK350 Series handheld LED spectrometer device have shown that
the deviation in the Correlated colour temperature of the lights due to the dimming remained
within ±50º Kelvin of the original specification of 3000º Kelvin, which is considered within an
acceptable tolerance limit.
2.3.6. Participants’ Profile
As noted previously in 2.3.3.8 Participants, the experiment was tailored for an expert and
professional set of participants. All participation in the experiments has been by invitation. The
following provides detailed information on the profile of the 77 participants who contributed
to the research.
2.3.6.1 Age and Sex
Of the total of 77 participants of the lighting experiments, 41 were female, and 36 were males.
Table 2.1: Gender Distribution of Experiment Participants
0
5
10
15
20
25
30
35
40
45
Female Male
Num
ber o
f Fem
ales
and
Mal
es
Gender
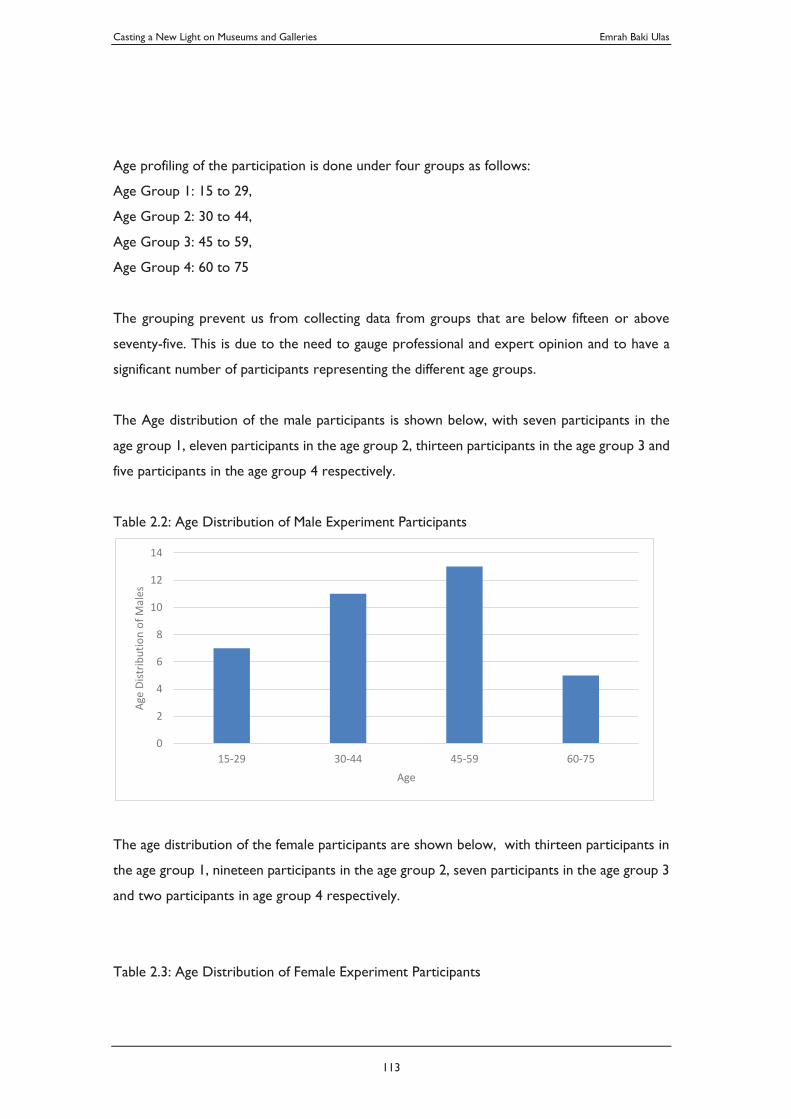
Casting a New Light on Museums and Galleries Emrah Baki Ulas
113
Age profiling of the participation is done under four groups as follows:
Age Group 1: 15 to 29,
Age Group 2: 30 to 44,
Age Group 3: 45 to 59,
Age Group 4: 60 to 75
The grouping prevent us from collecting data from groups that are below fifteen or above
seventy-five. This is due to the need to gauge professional and expert opinion and to have a
significant number of participants representing the different age groups.
The Age distribution of the male participants is shown below, with seven participants in the
age group 1, eleven participants in the age group 2, thirteen participants in the age group 3 and
five participants in the age group 4 respectively.
Table 2.2: Age Distribution of Male Experiment Participants
The age distribution of the female participants are shown below, with thirteen participants in
the age group 1, nineteen participants in the age group 2, seven participants in the age group 3
and two participants in age group 4 respectively.
Table 2.3: Age Distribution of Female Experiment Participants
0
2
4
6
8
10
12
14
15-29 30-44 45-59 60-75
Age
Dist
ribut
ion
of M
ales
Age
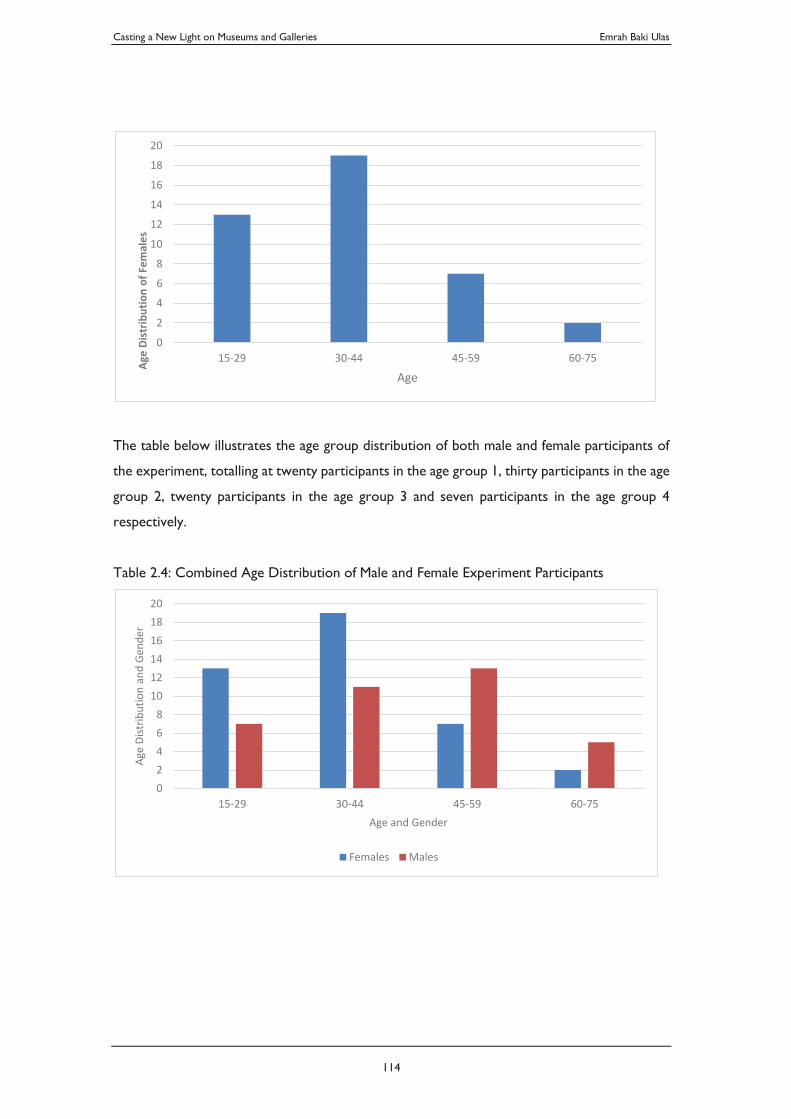
Casting a New Light on Museums and Galleries Emrah Baki Ulas
114
The table below illustrates the age group distribution of both male and female participants of
the experiment, totalling at twenty participants in the age group 1, thirty participants in the age
group 2, twenty participants in the age group 3 and seven participants in the age group 4
respectively.
Table 2.4: Combined Age Distribution of Male and Female Experiment Participants
02468
101214161820
15-29 30-44 45-59 60-75Age
Dist
ribut
ion
of Fe
mal
es
Age
02468
101214161820
15-29 30-44 45-59 60-75
Age
Dist
ribut
ion
and
Gend
er
Age and Gender
Females Males
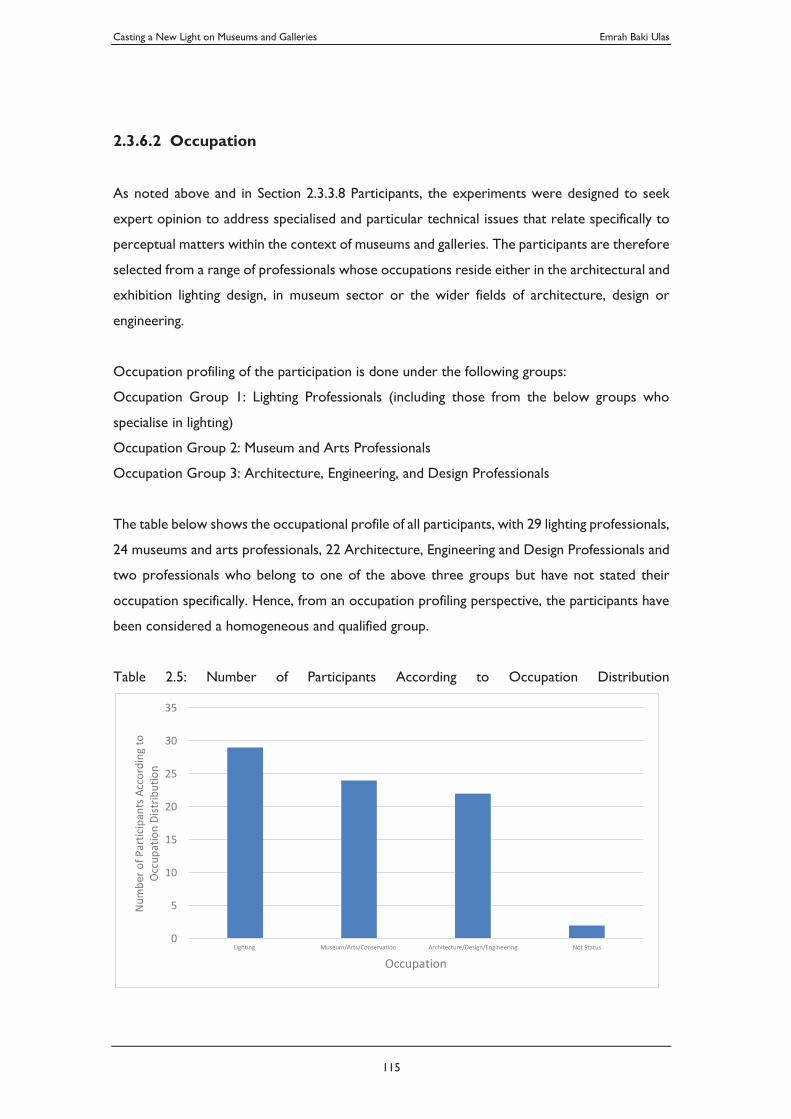
Casting a New Light on Museums and Galleries Emrah Baki Ulas
115
2.3.6.2 Occupation
As noted above and in Section 2.3.3.8 Participants, the experiments were designed to seek
expert opinion to address specialised and particular technical issues that relate specifically to
perceptual matters within the context of museums and galleries. The participants are therefore
selected from a range of professionals whose occupations reside either in the architectural and
exhibition lighting design, in museum sector or the wider fields of architecture, design or
engineering.
Occupation profiling of the participation is done under the following groups:
Occupation Group 1: Lighting Professionals (including those from the below groups who
specialise in lighting)
Occupation Group 2: Museum and Arts Professionals
Occupation Group 3: Architecture, Engineering, and Design Professionals
The table below shows the occupational profile of all participants, with 29 lighting professionals,
24 museums and arts professionals, 22 Architecture, Engineering and Design Professionals and
two professionals who belong to one of the above three groups but have not stated their
occupation specifically. Hence, from an occupation profiling perspective, the participants have
been considered a homogeneous and qualified group.
Table 2.5: Number of Participants According to Occupation Distribution
0
5
10
15
20
25
30
35
Lighting Museum/Arts/Conservation Architecture/Design/Engineering Not Status
Num
ber o
f Par
ticip
ants
Acc
ordi
ng to
O
ccup
atio
n Di
strib
utio
n
Occupation
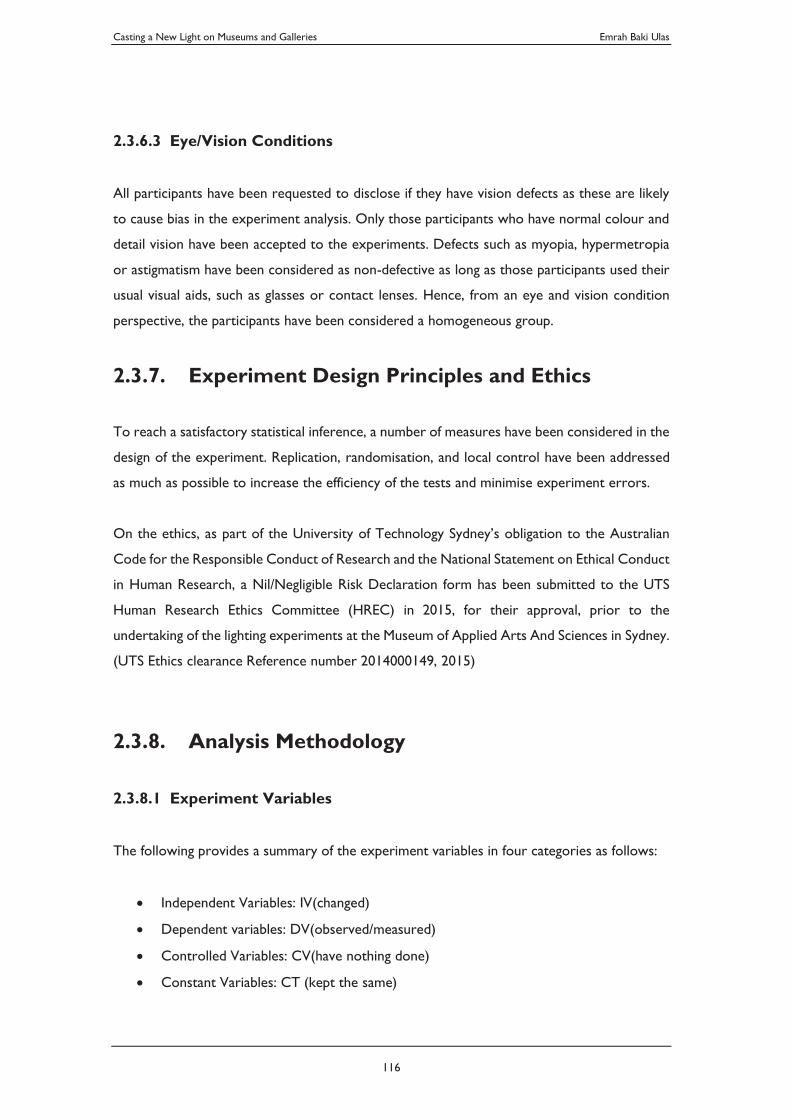
Casting a New Light on Museums and Galleries Emrah Baki Ulas
116
2.3.6.3 Eye/Vision Conditions
All participants have been requested to disclose if they have vision defects as these are likely
to cause bias in the experiment analysis. Only those participants who have normal colour and
detail vision have been accepted to the experiments. Defects such as myopia, hypermetropia
or astigmatism have been considered as non-defective as long as those participants used their
usual visual aids, such as glasses or contact lenses. Hence, from an eye and vision condition
perspective, the participants have been considered a homogeneous group.
2.3.7. Experiment Design Principles and Ethics
To reach a satisfactory statistical inference, a number of measures have been considered in the
design of the experiment. Replication, randomisation, and local control have been addressed
as much as possible to increase the efficiency of the tests and minimise experiment errors.
On the ethics, as part of the University of Technology Sydney’s obligation to the Australian
Code for the Responsible Conduct of Research and the National Statement on Ethical Conduct
in Human Research, a Nil/Negligible Risk Declaration form has been submitted to the UTS
Human Research Ethics Committee (HREC) in 2015, for their approval, prior to the
undertaking of the lighting experiments at the Museum of Applied Arts And Sciences in Sydney.
(UTS Ethics clearance Reference number 2014000149, 2015)
2.3.8. Analysis Methodology
2.3.8.1 Experiment Variables
The following provides a summary of the experiment variables in four categories as follows:
Independent Variables: IV(changed)
Dependent variables: DV(observed/measured)
Controlled Variables: CV(have nothing done)
Constant Variables: CT (kept the same)
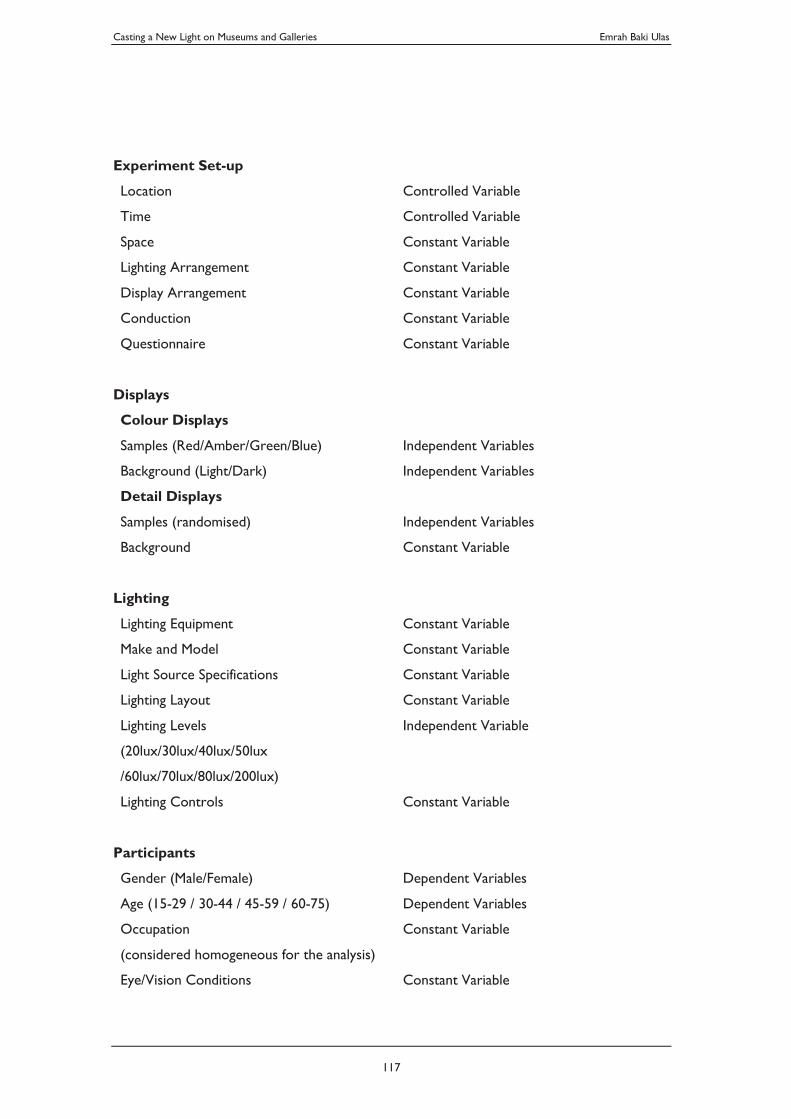
Casting a New Light on Museums and Galleries Emrah Baki Ulas
117
Experiment Set-up
Location Controlled Variable
Time Controlled Variable
Space Constant Variable
Lighting Arrangement Constant Variable
Display Arrangement Constant Variable
Conduction Constant Variable
Questionnaire Constant Variable
Displays
Colour Displays
Samples (Red/Amber/Green/Blue) Independent Variables
Background (Light/Dark) Independent Variables
Detail Displays
Samples (randomised) Independent Variables
Background Constant Variable
Lighting
Lighting Equipment Constant Variable
Make and Model Constant Variable
Light Source Specifications Constant Variable
Lighting Layout Constant Variable
Lighting Levels
(20lux/30lux/40lux/50lux
/60lux/70lux/80lux/200lux)
Independent Variable
Lighting Controls Constant Variable
Participants
Gender (Male/Female) Dependent Variables
Age (15-29 / 30-44 / 45-59 / 60-75) Dependent Variables
Occupation
(considered homogeneous for the analysis)
Constant Variable
Eye/Vision Conditions Constant Variable
Casting a New Light on Museums and Galleries Emrah Baki Ulas
118
(considered homogeneous for the analysis)
Other (Spatial, Time-bound, Physiologic and
Psychologic)
Controlled Variables
2.3.8.2 Analysis Levels for Experimental Data
Detailed analysis of experiment results have encompassed the following, categorised for colour
recognition and outlining the number of correct identification of colours versus the variation
in the levels of illumination (20 to 200 lux), resulting in a total of 185 graphic representations
of data collected:
For Red Tones:
Identification of Red Colour Tones on Light Background by Females in Age Group 15-
29
Identification of Red Colour Tones on Light Background by Females in Age Group 30-
44
Identification of Red Colour Tones on Light Background by Females in Age Group 45-
59
Identification of Red Colour Tones on Light Background by Females in Age Group 75
Identification of Red Colour Tones on Dark Background by Females in Age Group 15-
29
Identification of Red Colour Tones on Dark Background by Females in Age Group 30-
44
Identification of Red Colour Tones on Dark Background by Females in Age Group 45-
59
Identification of Red Colour Tones on Dark Background by Females in Age Group 60-
75
Identification of Red Colour Tones on Light Background by Males in Age Group 15-29
Identification of Red Colour Tones on Light Background by Males in Age Group 30-44
Identification of Red Colour Tones on Light Background by Males in Age Group 45-59
Identification of Red Colour Tones on Light Background by Males in Age Group 60-75
Casting a New Light on Museums and Galleries Emrah Baki Ulas
119
Identification of Red Colour Tones on Dark Background by Males in Age Group 15-
29
Identification of Red Colour Tones on Dark Background by Males in Age Group 30-
44
Identification of Red Colour Tones on Dark Background by Males in Age Group 45-
59
Identification of Red Colour Tones on Dark Background by Males in Age Group 60-
75
Identification of Red Colour Tones on Light Background by Females and Males in Age
Group 15-29
Identification of Red Colour Tones on Light Background by Females and Males in Age
Group 30-44
Identification of Red Colour Tones on Light Background by Females and Males in Age
Group 45-59
Identification of Red Colour Tones on Light Background by Females and Males in Age
Group 60-75
Identification of Red Colour Tones on Dark Background by Females and Males in Age
Group 15-29
Identification of Red Colour Tones on Dark Background by Females and Males in Age
Group 30-44
Identification of Red Colour Tones on Dark Background by Females and Males in Age
Group 45-59
Identification of Red Colour Tones on Dark Background by Females and Males in Age
Group 60-75
Identification of Red Colour Tones on Light Background by Females in All Age Groups
Identification of Red Colour Tones on Dark Background by Females in All Age Groups
Identification of Red Colour Tones on Light Background by Males in All Age Groups
Identification of Red Colour Tones on Dark Background by Males in All Age Groups
Identification of Red Colour Tones on Light Background by Females and Males in All
Age Groups
Identification of Red Colour Tones on Dark Background by Females and Males in All
Age Groups
Casting a New Light on Museums and Galleries Emrah Baki Ulas
120
Identification of Red Colour Tones on Light and Dark Background by Females in All
Age Groups
Identification of Red Colour Tones on Light and Dark Background by Males in All Age
Groups
Identification of Red Colour Tones on Light and Dark Background by Females and
Males in Age Group 15-29
Identification of Red Colour Tones on Light and Dark Background by Females and
Males in Age Group 30-44
Identification of Red Colour Tones on Light and Dark Background by Females and
Males in Age Group 45-59
Identification of Red Colour Tones on Light and Dark Background by Females and
Males in Age Group 60-75
Identification of Red Colour Tones on Light and Dark Background by Females and
Males in All Age Groups
For Amber Tones:
Identification of Amber Colour Tones on Light Background by Females in Age Group
15-29
Identification of Amber Colour Tones on Light Background by Females in Age Group
30-44
Identification of Amber Colour Tones on Light Background by Females in Age Group
45-59
Identification of Amber Colour Tones on Light Background by Females in Age Group
60-75
Identification of Amber Colour Tones on Dark Background by Females in Age Group
15-29
Identification of Amber Colour Tones on Dark Background by Females in Age Group
30-44
Identification of Amber Colour Tones on Dark Background by Females in Age Group
45-59
Identification of Amber Colour Tones on Dark Background by Females in Age Group
60-75

Casting a New Light on Museums and Galleries Emrah Baki Ulas
121
Identification of Amber Colour Tones on Light Background by Males in Age Group 15-
29
Identification of Amber Colour Tones on Light Background by Males in Age Group 30-
44
Identification of Amber Colour Tones on Light Background by Males in Age Group 45-
59
Identification of Amber Colour Tones on Light Background by Males in Age Group 60-
75
Identification of Amber Colour Tones on Dark Background by Males in Age Group
15-29
Identification of Amber Colour Tones on Dark Background by Males in Age Group
30-44
Identification of Amber Colour Tones on Dark Background by Males in Age Group
45-59
Identification of Amber Colour Tones on Dark Background by Males in Age Group
60-75
Identification of Amber Colour Tones on Light Background by Females and Males in
Age Group 15-29
Identification of Amber Colour Tones on Light Background by Females and Males in
Age Group 30-44
Identification of Amber Colour Tones on Light Background by Females and Males in
Age Group 45-59
Identification of Amber Colour Tones on Light Background by Females and Males in
Age Group 60-75
Identification of Amber Colour Tones on Dark Background by Females and Males in
Age Group 15-29
Identification of Amber Colour Tones on Dark Background by Females and Males in
Age Group 30-44
Identification of Amber Colour Tones on Dark Background by Females and Males in
Age Group 45-59
Identification of Amber Colour Tones on Dark Background by Females and Males in
Age Group 60-75
Casting a New Light on Museums and Galleries Emrah Baki Ulas
122
Identification of Amber Colour Tones on Light Background by Females in All Age
Groups
Identification of Amber Colour Tones on Dark Background by Females in All Age
Groups
Identification of Amber Colour Tones on Light Background by Males in All Age Groups
Identification of Amber Colour Tones on Dark Background by Males in All Age Groups
Identification of Amber Colour Tones on Light Background by Females and Males in
All Age Groups
Identification of Amber Colour Tones on Dark Background by Females and Males in
All Age Groups
Identification of Amber Colour Tones on Light and Dark Background by Females in All
Age Groups
Identification of Amber Colour Tones on Light and Dark Background by Males in All
Age Groups
Identification of Amber Colour Tones on Light and Dark Background by Females and
Males in Age Group 15-29
Identification of Amber Colour Tones on Light and Dark Background by Females and
Males in Age Group 30-44
Identification of Amber Colour Tones on Light and Dark Background by Females and
Males in Age Group 45-59
Identification of Amber Colour Tones on Light and Dark Background by Females and
Males in Age Group 60-75
Identification of Amber Colour Tones on Light and Dark Background by Females and
Males in All Age Groups
For Green Tones:
Identification of Green Colour Tones on Light Background by Females in Age Group
15-29
Identification of Green Colour Tones on Light Background by Females in Age Group
30-44
Identification of Green Colour Tones on Light Background by Females in Age Group
45-59
Casting a New Light on Museums and Galleries Emrah Baki Ulas
123
Identification of Green Colour Tones on Light Background by Females in Age Group
60-75
Identification of Green Colour Tones on Dark Background by Females in Age Group
15-29
Identification of Green Colour Tones on Dark Background by Females in Age Group
30-44
Identification of Green Colour Tones on Dark Background by Females in Age Group
45-59
Identification of Green Colour Tones on Dark Background by Females in Age Group
60-75
Identification of Green Colour Tones on Light Background by Males in Age Group 15-
29
Identification of Green Colour Tones on Light Background by Males in Age Group 30-
44
Identification of Green Colour Tones on Light Background by Males in Age Group 45-
59
Identification of Green Colour Tones on Light Background by Males in Age Group 60-
75
Identification of Green Colour Tones on Dark Background by Males in Age Group 15-
29
Identification of Green Colour Tones on Dark Background by Males in Age Group 30-
44
Identification of Green Colour Tones on Dark Background by Males in Age Group 45-
59
Identification of Green Colour Tones on Dark Background by Males in Age Group 60-
75
Identification of Green Colour Tones on Light Background by Females and Males in
Age Group 15-29
Identification of Green Colour Tones on Light Background by Females and Males in
Age Group 30-44
Identification of Green Colour Tones on Light Background by Females and Males in
Age Group 45-59
Casting a New Light on Museums and Galleries Emrah Baki Ulas
124
Identification of Green Colour Tones on Light Background by Females and Males in
Age Group 60-75
Identification of Green Colour Tones on Dark Background by Females and Males in
Age Group 15-29
Identification of Green Colour Tones on Dark Background by Females and Males in
Age Group 30-44
Identification of Green Colour Tones on Dark Background by Females and Males in
Age Group 45-59
Identification of Green Colour Tones on Dark Background by Females and Males in
Age Group 60-75
Identification of Green Colour Tones on Light Background by Females in All Age
Groups
Identification of Green Colour Tones on Dark Background by Females in All Age
Groups
Identification of Green Colour Tones on Light Background by Males in All Age Groups
Identification of Green Colour Tones on Dark Background by Males in All Age Groups
Identification of Green Colour Tones on Light Background by Females and Males in All
Age Groups
Identification of Green Colour Tones on Dark Background by Females and Males in
All Age Groups
Identification of Green Colour Tones on Light and Dark Background by Females in All
Age Groups
Identification of Green Colour Tones on Light and Dark Background by Males in All
Age Groups
Identification of Green Colour Tones on Light and Dark Background by Females and
Males in Age Group 15-29
Identification of Green Colour Tones on Light and Dark Background by Females and
Males in Age Group 30-44
Identification of Green Colour Tones on Light and Dark Background by Females and
Males in Age Group 45-59
Identification of Green Colour Tones on Light and Dark Background by Females and
Males in Age Group 60-75
Casting a New Light on Museums and Galleries Emrah Baki Ulas
125
Identification of Green Colour Tones on Light and Dark Background by Females and
Males in All Age Groups
For Blue Tones:
Identification of Blue Colour Tones on Light Background by Females in Age Group 15-
29
Identification of Blue Colour Tones on Light Background by Females in Age Group 30-
44
Identification of Blue Colour Tones on Light Background by Females in Age Group 45-
59
Identification of Blue Colour Tones on Light Background by Females in Age Group 60-
75
Identification of Blue Colour Tones on Dark Background by Females in Age Group 15-
29
Identification of Blue Colour Tones on Dark Background by Females in Age Group 30-
44
Identification of Blue Colour Tones on Dark Background by Females in Age Group 45-
59
Identification of Blue Colour Tones on Dark Background by Females in Age Group 60-
75
Identification of Blue Colour Tones on Light Background by Males in Age Group 15-
29
Identification of Blue Colour Tones on Light Background by Males in Age Group 30-
44
Identification of Blue Colour Tones on Light Background by Males in Age Group 45-
59
Identification of Blue Colour Tones on Light Background by Males in Age Group 60-
75
Identification of Blue Colour Tones on Dark Background by Males in Age Group 15-
29
Identification of Blue Colour Tones on Dark Background by Males in Age Group 30-
44
Casting a New Light on Museums and Galleries Emrah Baki Ulas
126
Identification of Blue Colour Tones on Dark Background by Males in Age Group 45-
59
Identification of Blue Colour Tones on Dark Background by Males in Age Group 60-
75
Identification of Blue Colour Tones on Light Background by Females and Males in Age
Group 15-29
Identification of Blue Colour Tones on Light Background by Females and Males in Age
Group 30-44
Identification of Blue Colour Tones on Light Background by Females and Males in Age
Group 45-59
Identification of Blue Colour Tones on Light Background by Females and Males in Age
Group 60-75
Identification of Blue Colour Tones on Dark Background by Females and Males in Age
Group 15-29
Identification of Blue Colour Tones on Dark Background by Females and Males in Age
Group 30-44
Identification of Blue Colour Tones on Dark Background by Females and Males in Age
Group 45-59
Identification of Blue Colour Tones on Dark Background by Females and Males in Age
Group 60-75
Identification of Blue Colour Tones on Light Background by Females in All Age Groups
Identification of Blue Colour Tones on Dark Background by Females in All Age Groups
Identification of Blue Colour Tones on Light Background by Males in All Age Groups
Identification of Blue Colour Tones on Dark Background by Males in All Age Groups
Identification of Blue Colour Tones on Light Background by Females and Males in All
Age Groups
Identification of Blue Colour Tones on Dark Background by Females and Males in All
Age Groups
Identification of Blue Colour Tones on Light and Dark Background by Females in All
Age Groups
Identification of Blue Colour Tones on Light and Dark Background by Males in All Age
Groups
Casting a New Light on Museums and Galleries Emrah Baki Ulas
127
Identification of Blue Colour Tones on Light and Dark Background by Females and
Males in Age Group 15-29
Identification of Blue Colour Tones on Light and Dark Background by Females and
Males in Age Group 30-44
Identification of Blue Colour Tones on Light and Dark Background by Females and
Males in Age Group 45-59
Identification of Blue Colour Tones on Light and Dark Background by Females and
Males in Age Group 60-75
Identification of Blue Colour Tones on Light and Dark Background by Females and
Males in All Age Groups
For All Tones Combined:
Identification of All Colour Tones on Light Background by Females in Age Group 15-
29
Identification of All Colour Tones on Light Background by Females in Age Group 30-
44
Identification of All Colour Tones on Light Background by Females in Age Group 45-
59
Identification of All Colour Tones on Light Background by Females in Age Group 60-
75
Identification of All Colour Tones on Dark Background by Females in Age Group 15-
29
Identification of All Colour Tones on Dark Background by Females in Age Group 30-
44
Identification of All Colour Tones on Dark Background by Females in Age Group 45-
59
Identification of All Colour Tones on Dark Background by Females in Age Group 60-
75
Identification of All Colour Tones on Light Background by Males in Age Group 15-29
Identification of All Colour Tones on Light Background by Males in Age Group 30-44
Identification of All Colour Tones on Light Background by Males in Age Group 45-59
Identification of All Colour Tones on Light Background by Males in Age Group 60-75
Identification of All Colour Tones on Dark Background by Males in Age Group 15-29
Casting a New Light on Museums and Galleries Emrah Baki Ulas
128
Identification of All Colour Tones on Dark Background by Males in Age Group 30-44
Identification of All Colour Tones on Dark Background by Males in Age Group 45-59
Identification of All Colour Tones on Dark Background by Males in Age Group 60-75
Identification of All Colour Tones on Light Background by Females and Males in Age
Group 15-29
Identification of All Colour Tones on Light Background by Females and Males in Age
Group 30-44
Identification of All Colour Tones on Light Background by Females and Males in Age
Group 45-59
Identification of All Colour Tones on Light Background by Females and Males in Age
Group 60-75
Identification of All Colour Tones on Dark Background by Females and Males in Age
Group 15-29
Identification of All Colour Tones on Dark Background by Females and Males in Age
Group 30-44
Identification of All Colour Tones on Dark Background by Females and Males in Age
Group 45-59
Identification of All Colour Tones on Dark Background by Females and Males in Age
Group 60-75
Identification of All Colour Tones on Light Background by Females in All Age Groups
Identification of All Colour Tones on Dark Background by Females in All Age Groups
Identification of All Colour Tones on Light Background by Males in All Age Groups
Identification of All Colour Tones on Dark Background by Males in All Age Groups
Identification of All Colour Tones on Light Background by Females and Males in All
Age Groups
Identification of All Colour Tones on Dark Background by Females and Males in All
Age Groups
Identification of All Colour Tones on Light and Dark Background by Females in All Age
Groups
Identification of All Colour Tones on Light and Dark Background by Males in All Age
Groups
Identification of All Colour Tones on Light and Dark Background by Females and Males
in Age Group 15-29
Casting a New Light on Museums and Galleries Emrah Baki Ulas
129
Identification of All Colour Tones on Light and Dark Background by Females and Males
in Age Group 30-44
Identification of All Colour Tones on Light and Dark Background by Females and Males
in Age Group 45-59
Identification of All Colour Tones on Light and Dark Background by Females and Males
in Age Group 60-75
Identification of All Colour Tones on Light and Dark Background by Females and Males
in All Age Groups
Similarly, for detail recognition experiment results were analysed based on gender and age
groups and according to the correct identification of Sloan letters versus the variation in the
levels of illumination (20 to 200 lux), resulting in a total of 15 graphic representations of data
collected as follows:
Identification of Sloan Letters by Females in Age Group 15-29
Identification of Sloan Letters by Females in Age Group 30-44
Identification of Sloan Letters by Females in Age Group 45-59
Identification of Sloan Letters by Females in Age Group 60-75
Identification of Sloan Letters by Females in All Age Groups
Identification of Sloan Letters by Males in Age Group 15-29
Identification of Sloan Letters by Males in Age Group 30-44
Identification of Sloan Letters by Males in Age Group 45-59
Identification of Sloan Letters by Males in Age Group 60-75
Identification of Sloan Letters by Females in All Age Groups
Identification of Sloan Letters by Females and Males in Age Group 15-29
Identification of Sloan Letters by Females and Males in Age Group 30-44
Identification of Sloan Letters by Females and Males in Age Group 45-59
Identification of Sloan Letters by Females and Males in Age Group 60-75
Identification of Sloan Letters by Females and Males in All Age Groups
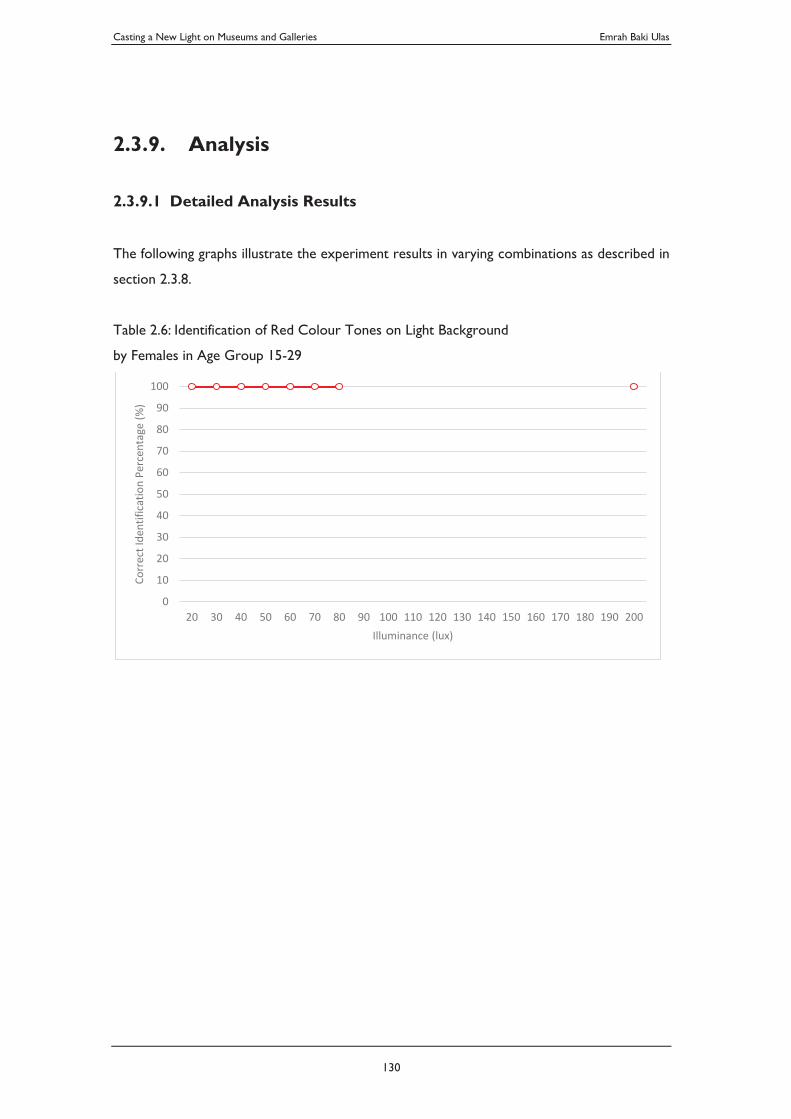
Casting a New Light on Museums and Galleries Emrah Baki Ulas
130
2.3.9. Analysis
2.3.9.1 Detailed Analysis Results
The following graphs illustrate the experiment results in varying combinations as described in
section 2.3.8.
Table 2.6: Identification of Red Colour Tones on Light Background
by Females in Age Group 15-29
0
10
20
30
40
50
60
70
80
90
100
20 30 40 50 60 70 80 90 100 110 120 130 140 150 160 170 180 190 200
Corr
ect I
dent
ifica
tion
Perc
enta
ge (%
)
Illuminance (lux)
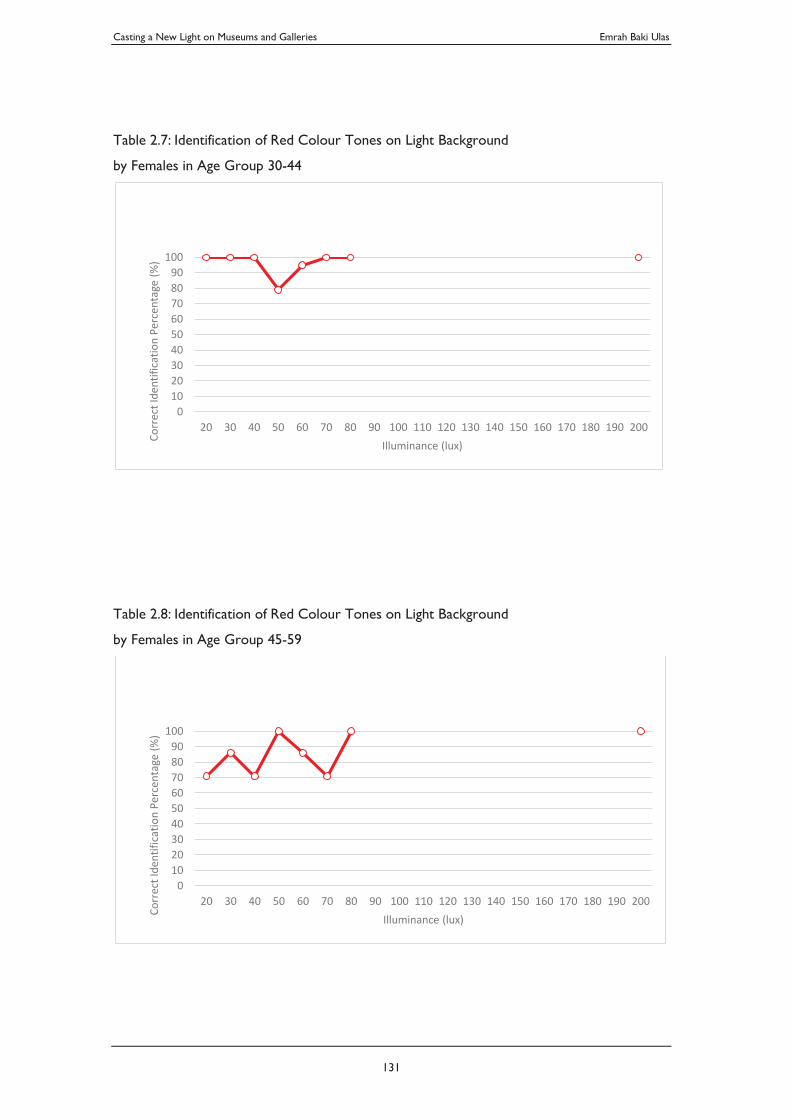
Casting a New Light on Museums and Galleries Emrah Baki Ulas
131
Table 2.7: Identification of Red Colour Tones on Light Background
by Females in Age Group 30-44
Table 2.8: Identification of Red Colour Tones on Light Background
by Females in Age Group 45-59
0102030405060708090
100
20 30 40 50 60 70 80 90 100 110 120 130 140 150 160 170 180 190 200
Corr
ect I
dent
ifica
tion
Perc
enta
ge (%
)
Illuminance (lux)
0102030405060708090
100
20 30 40 50 60 70 80 90 100 110 120 130 140 150 160 170 180 190 200
Corr
ect I
dent
ifica
tion
Perc
enta
ge (%
)
Illuminance (lux)
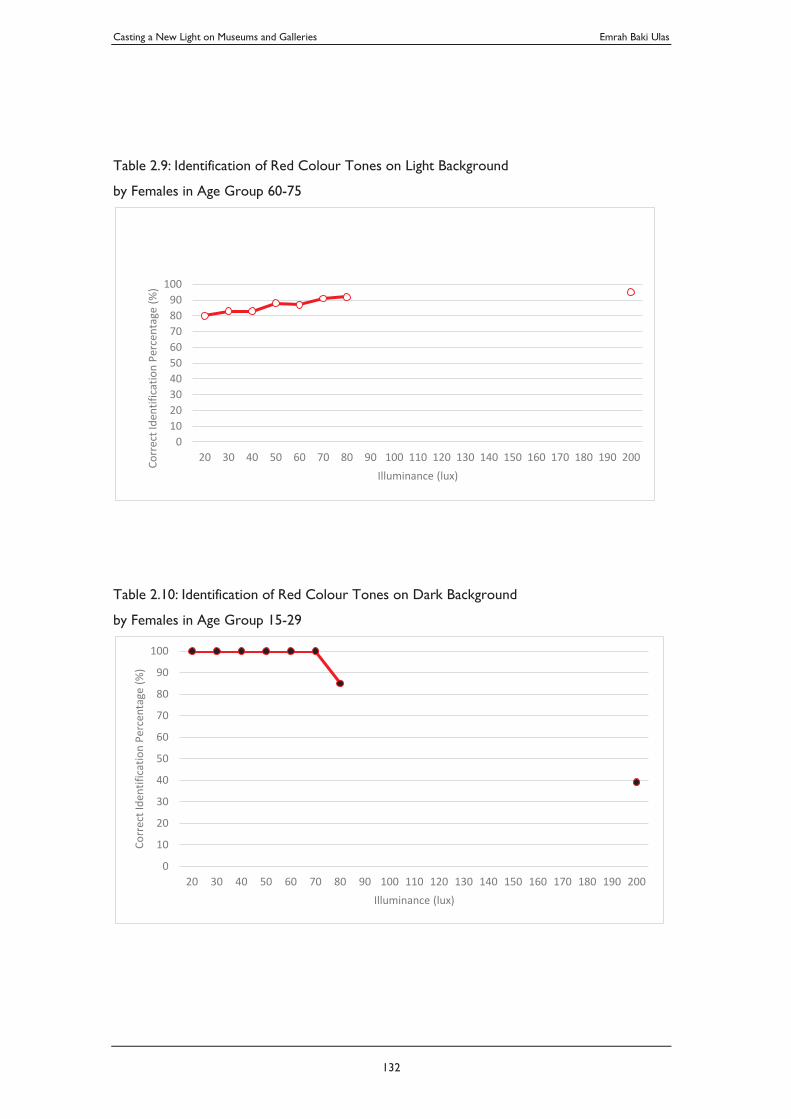
Casting a New Light on Museums and Galleries Emrah Baki Ulas
132
Table 2.9: Identification of Red Colour Tones on Light Background
by Females in Age Group 60-75
Table 2.10: Identification of Red Colour Tones on Dark Background
by Females in Age Group 15-29
0102030405060708090
100
20 30 40 50 60 70 80 90 100 110 120 130 140 150 160 170 180 190 200Corr
ect I
dent
ifica
tion
Perc
enta
ge (%
)
Illuminance (lux)
0
10
20
30
40
50
60
70
80
90
100
20 30 40 50 60 70 80 90 100 110 120 130 140 150 160 170 180 190 200
Corr
ect I
dent
ifica
tion
Perc
enta
ge (%
)
Illuminance (lux)
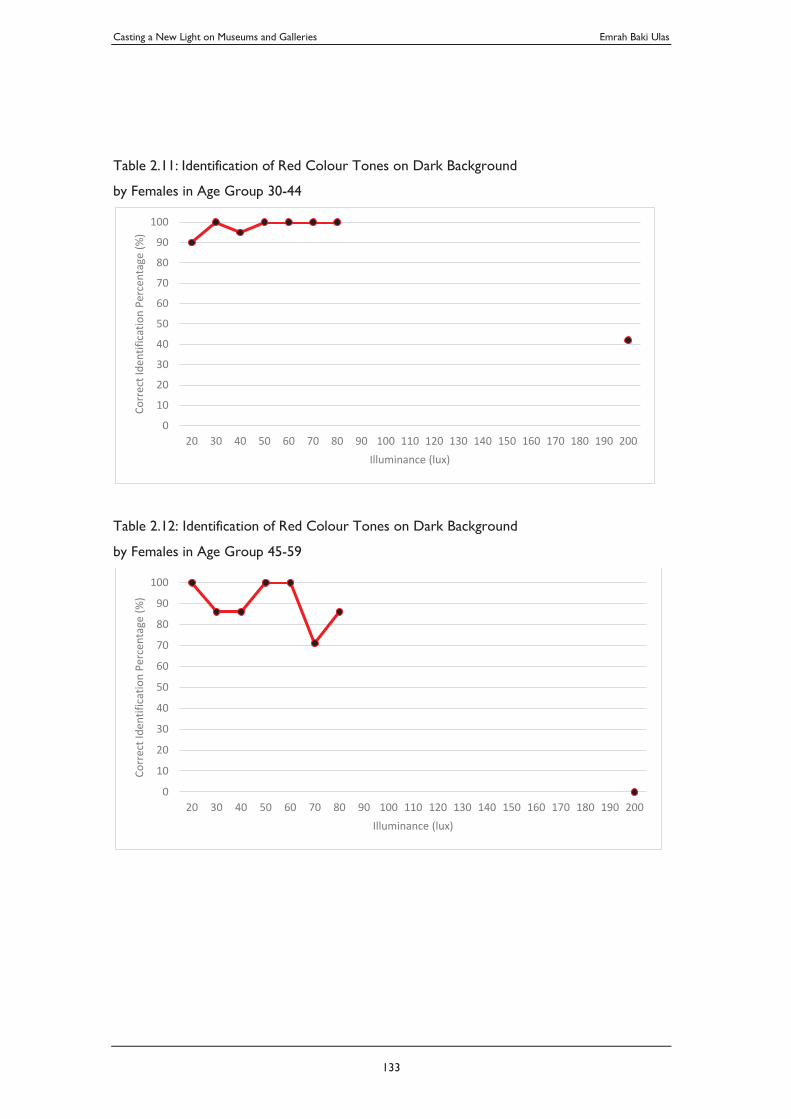
Casting a New Light on Museums and Galleries Emrah Baki Ulas
133
Table 2.11: Identification of Red Colour Tones on Dark Background
by Females in Age Group 30-44
Table 2.12: Identification of Red Colour Tones on Dark Background
by Females in Age Group 45-59
0
10
20
30
40
50
60
70
80
90
100
20 30 40 50 60 70 80 90 100 110 120 130 140 150 160 170 180 190 200
Corr
ect I
dent
ifica
tion
Perc
enta
ge (%
)
Illuminance (lux)
0
10
20
30
40
50
60
70
80
90
100
20 30 40 50 60 70 80 90 100 110 120 130 140 150 160 170 180 190 200
Corr
ect I
dent
ifica
tion
Perc
enta
ge (%
)
Illuminance (lux)
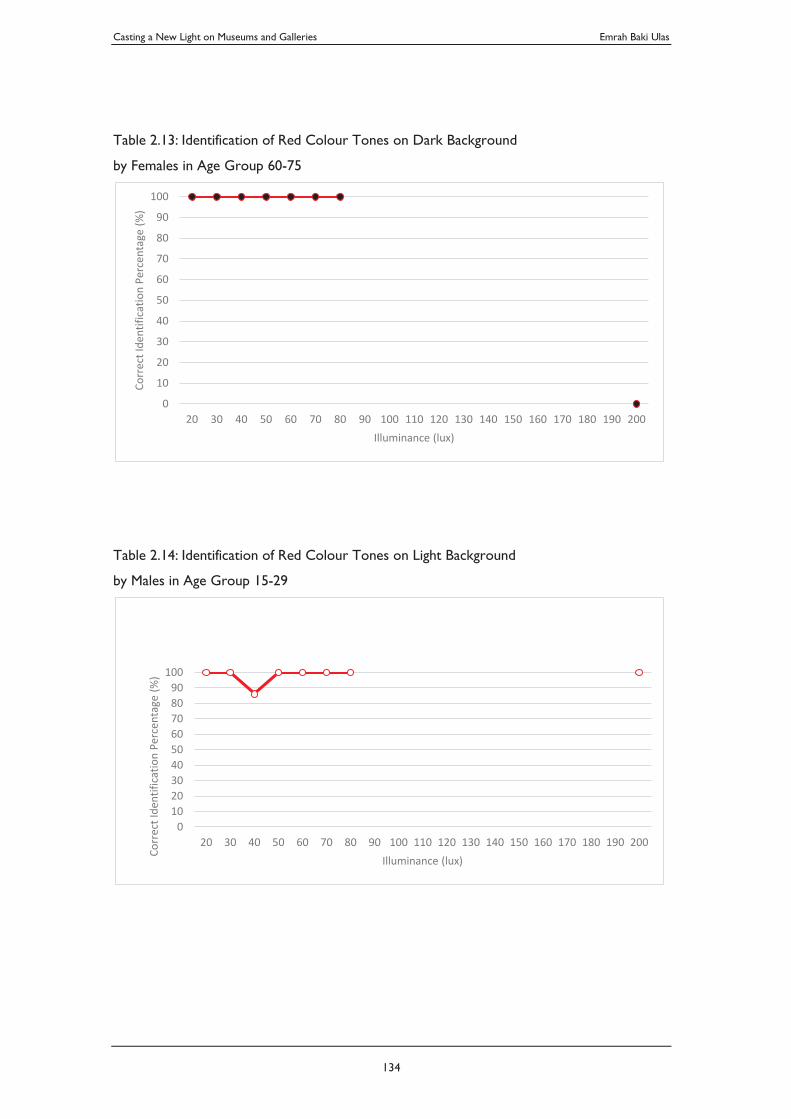
Casting a New Light on Museums and Galleries Emrah Baki Ulas
134
Table 2.13: Identification of Red Colour Tones on Dark Background
by Females in Age Group 60-75
Table 2.14: Identification of Red Colour Tones on Light Background
by Males in Age Group 15-29
0
10
20
30
40
50
60
70
80
90
100
20 30 40 50 60 70 80 90 100 110 120 130 140 150 160 170 180 190 200
Corr
ect I
dent
ifica
tion
Perc
enta
ge (%
)
Illuminance (lux)
0102030405060708090
100
20 30 40 50 60 70 80 90 100 110 120 130 140 150 160 170 180 190 200
Corr
ect I
dent
ifica
tion
Perc
enta
ge (%
)
Illuminance (lux)
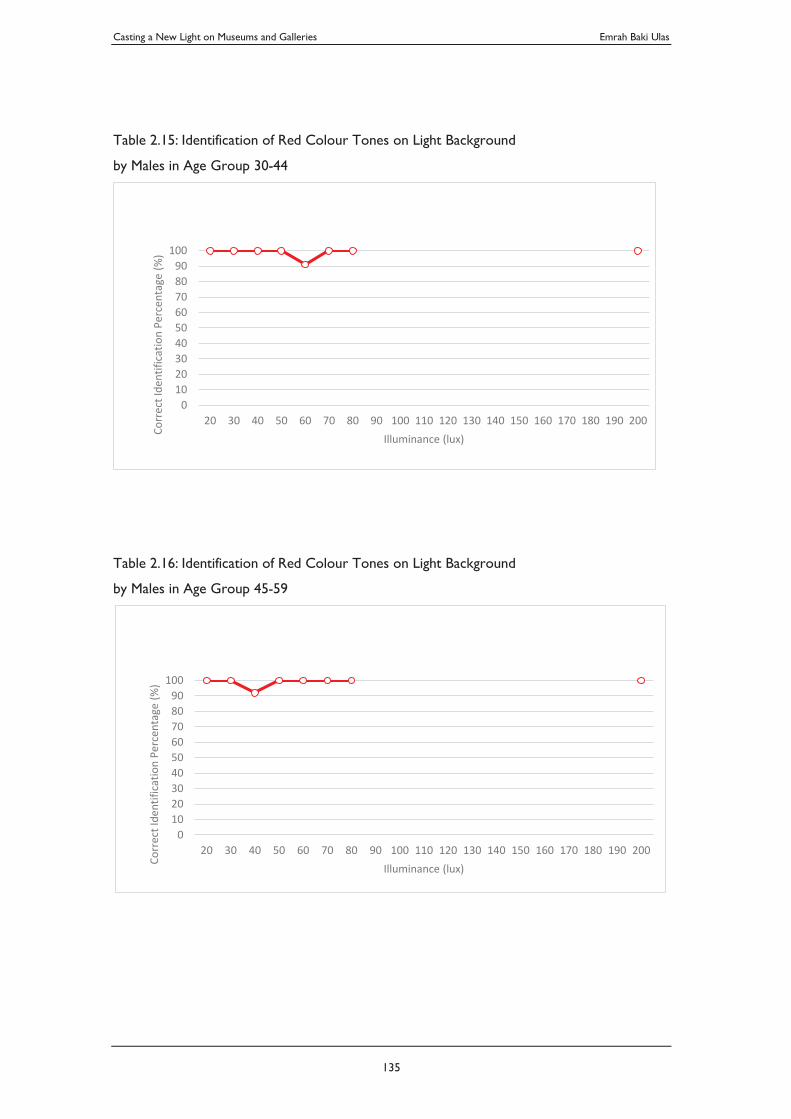
Casting a New Light on Museums and Galleries Emrah Baki Ulas
135
Table 2.15: Identification of Red Colour Tones on Light Background
by Males in Age Group 30-44
Table 2.16: Identification of Red Colour Tones on Light Background
by Males in Age Group 45-59
0102030405060708090
100
20 30 40 50 60 70 80 90 100 110 120 130 140 150 160 170 180 190 200
Corr
ect I
dent
ifica
tion
Perc
enta
ge (%
)
Illuminance (lux)
0102030405060708090
100
20 30 40 50 60 70 80 90 100 110 120 130 140 150 160 170 180 190 200
Corr
ect I
dent
ifica
tion
Perc
enta
ge (%
)
Illuminance (lux)
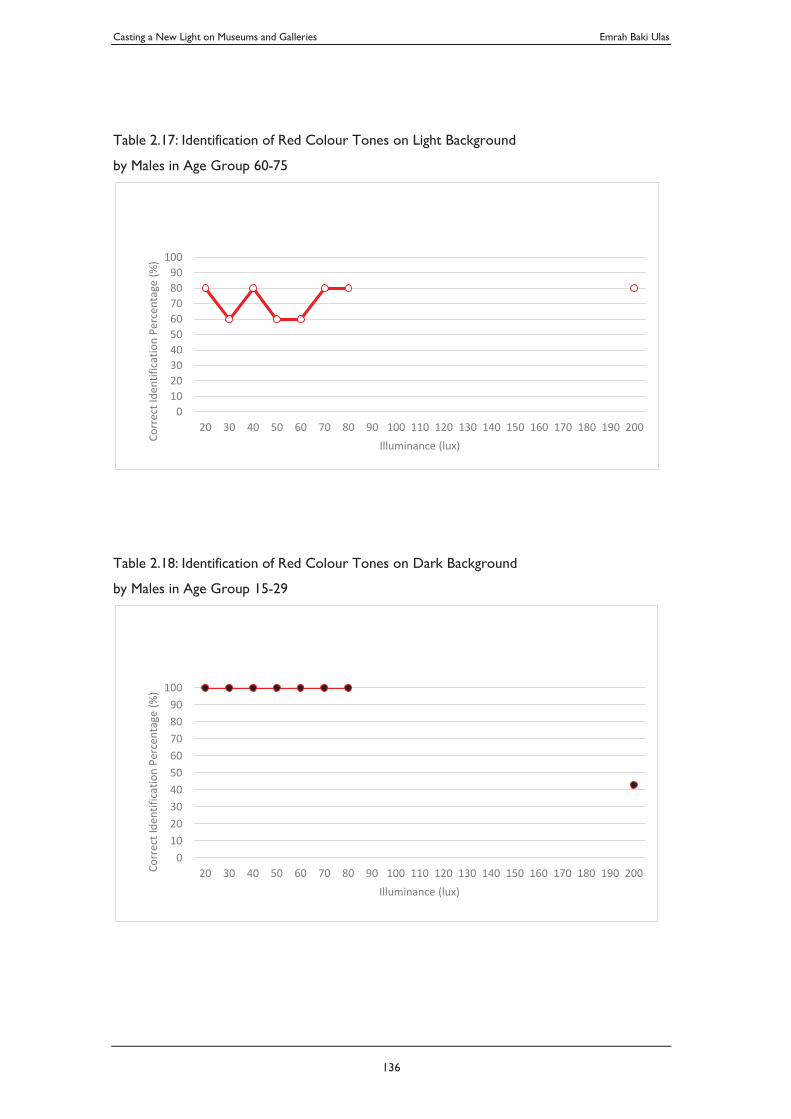
Casting a New Light on Museums and Galleries Emrah Baki Ulas
136
Table 2.17: Identification of Red Colour Tones on Light Background
by Males in Age Group 60-75
Table 2.18: Identification of Red Colour Tones on Dark Background
by Males in Age Group 15-29
0102030405060708090
100
20 30 40 50 60 70 80 90 100 110 120 130 140 150 160 170 180 190 200
Corr
ect I
dent
ifica
tion
Perc
enta
ge (%
)
Illuminance (lux)
0102030405060708090
100
20 30 40 50 60 70 80 90 100 110 120 130 140 150 160 170 180 190 200Corr
ect I
dent
ifica
tion
Perc
enta
ge (%
)
Illuminance (lux)
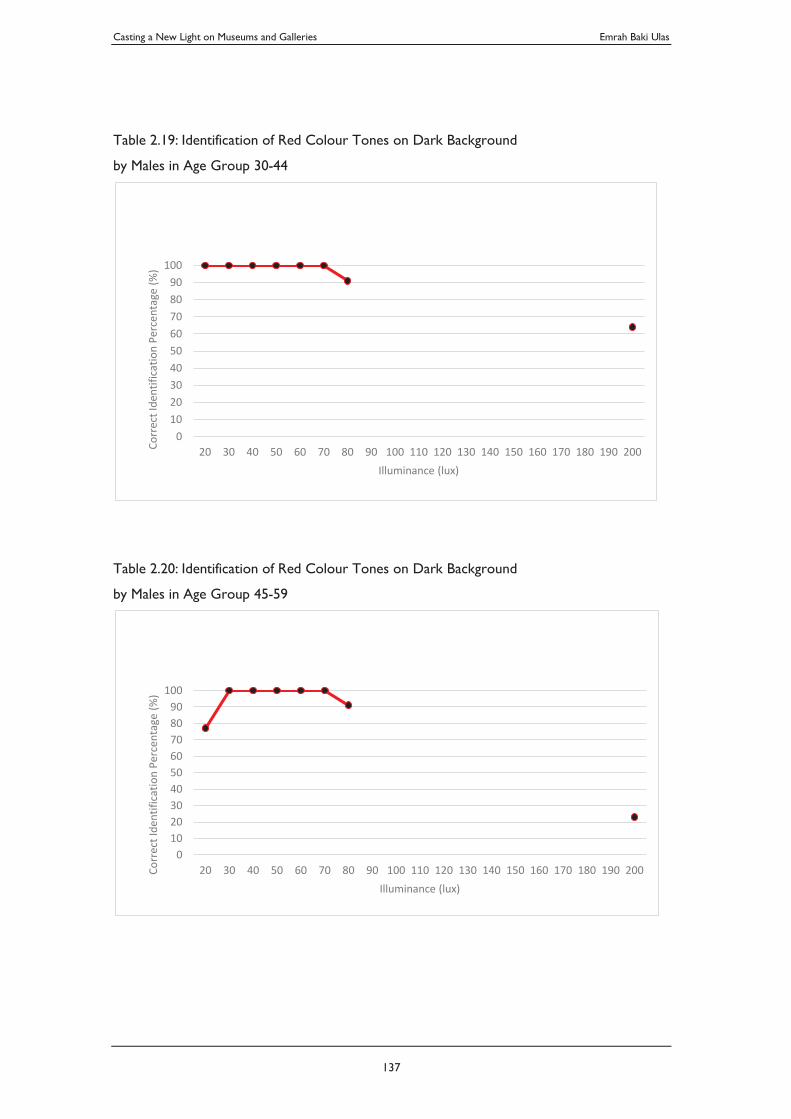
Casting a New Light on Museums and Galleries Emrah Baki Ulas
137
Table 2.19: Identification of Red Colour Tones on Dark Background
by Males in Age Group 30-44
Table 2.20: Identification of Red Colour Tones on Dark Background
by Males in Age Group 45-59
0102030405060708090
100
20 30 40 50 60 70 80 90 100 110 120 130 140 150 160 170 180 190 200Corr
ect I
dent
ifica
tion
Perc
enta
ge (%
)
Illuminance (lux)
0102030405060708090
100
20 30 40 50 60 70 80 90 100 110 120 130 140 150 160 170 180 190 200Corr
ect I
dent
ifica
tion
Perc
enta
ge (%
)
Illuminance (lux)
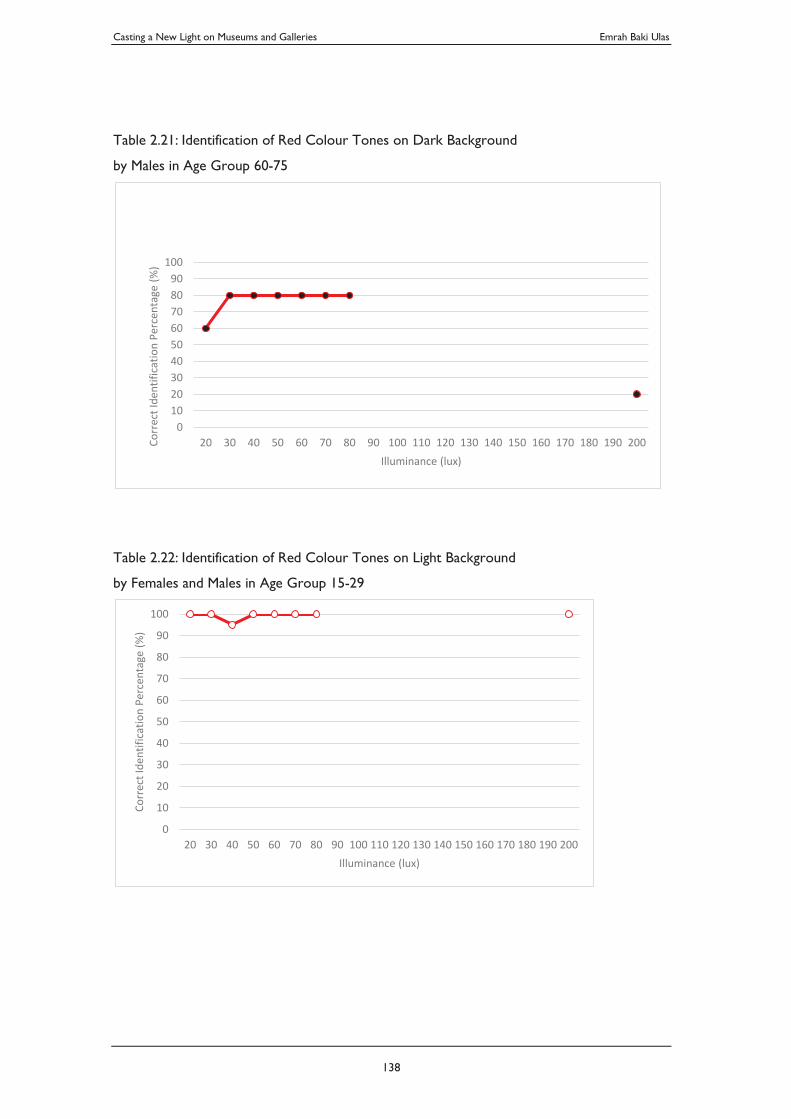
Casting a New Light on Museums and Galleries Emrah Baki Ulas
138
Table 2.21: Identification of Red Colour Tones on Dark Background
by Males in Age Group 60-75
Table 2.22: Identification of Red Colour Tones on Light Background
by Females and Males in Age Group 15-29
0102030405060708090
100
20 30 40 50 60 70 80 90 100 110 120 130 140 150 160 170 180 190 200Corr
ect I
dent
ifica
tion
Perc
enta
ge (%
)
Illuminance (lux)
0
10
20
30
40
50
60
70
80
90
100
20 30 40 50 60 70 80 90 100 110 120 130 140 150 160 170 180 190 200
Corr
ect I
dent
ifica
tion
Perc
enta
ge (%
)
Illuminance (lux)
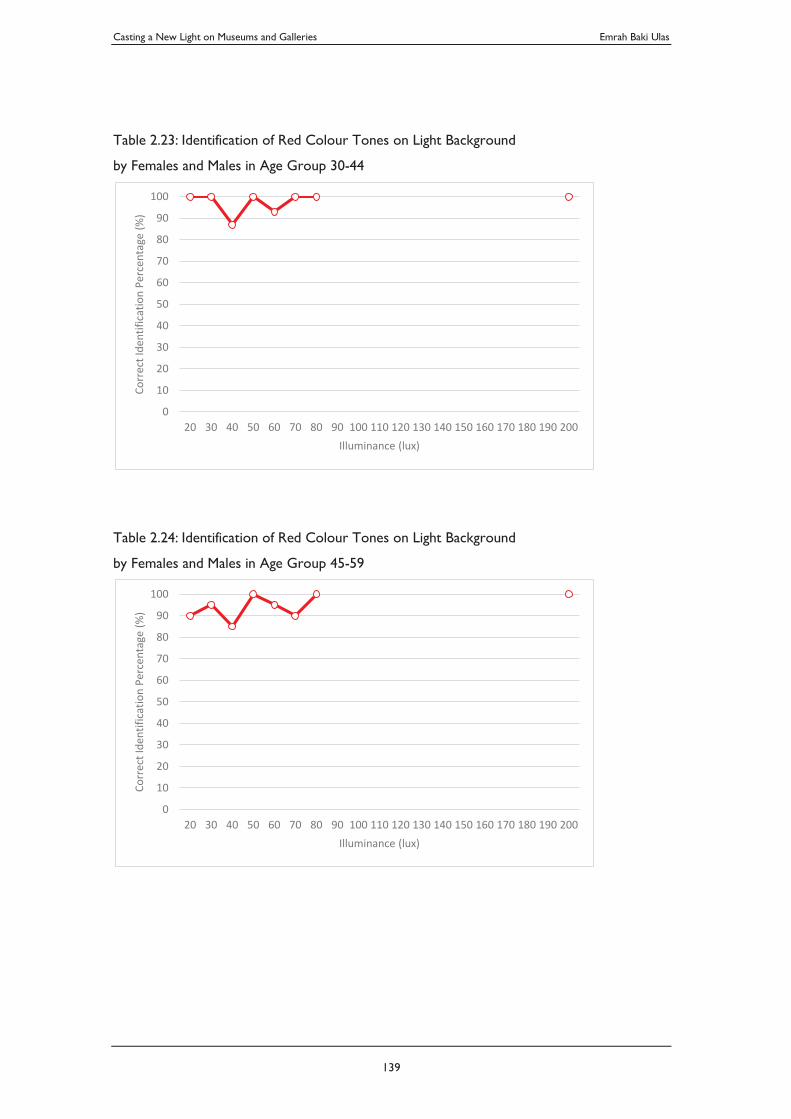
Casting a New Light on Museums and Galleries Emrah Baki Ulas
139
Table 2.23: Identification of Red Colour Tones on Light Background
by Females and Males in Age Group 30-44
Table 2.24: Identification of Red Colour Tones on Light Background
by Females and Males in Age Group 45-59
0
10
20
30
40
50
60
70
80
90
100
20 30 40 50 60 70 80 90 100 110 120 130 140 150 160 170 180 190 200
Corr
ect I
dent
ifica
tion
Perc
enta
ge (%
)
Illuminance (lux)
0
10
20
30
40
50
60
70
80
90
100
20 30 40 50 60 70 80 90 100 110 120 130 140 150 160 170 180 190 200
Corr
ect I
dent
ifica
tion
Perc
enta
ge (%
)
Illuminance (lux)
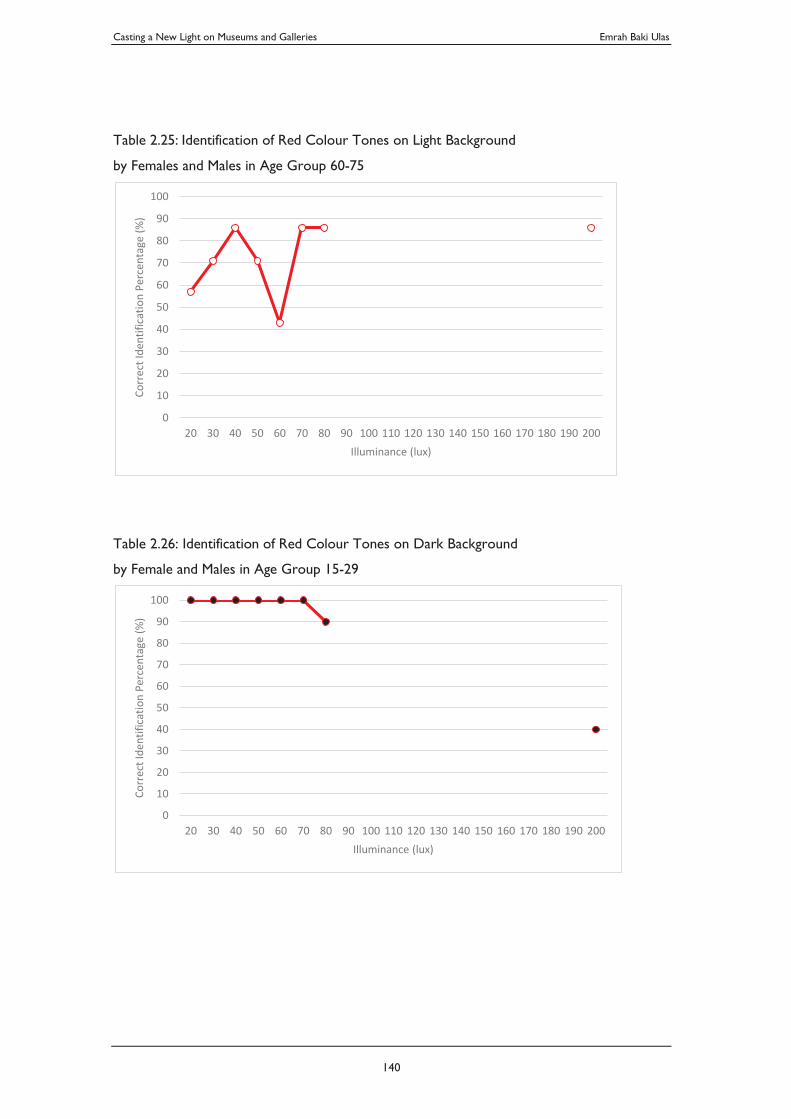
Casting a New Light on Museums and Galleries Emrah Baki Ulas
140
Table 2.25: Identification of Red Colour Tones on Light Background
by Females and Males in Age Group 60-75
Table 2.26: Identification of Red Colour Tones on Dark Background
by Female and Males in Age Group 15-29
0
10
20
30
40
50
60
70
80
90
100
20 30 40 50 60 70 80 90 100 110 120 130 140 150 160 170 180 190 200
Corr
ect I
dent
ifica
tion
Perc
enta
ge (%
)
Illuminance (lux)
0
10
20
30
40
50
60
70
80
90
100
20 30 40 50 60 70 80 90 100 110 120 130 140 150 160 170 180 190 200
Corr
ect I
dent
ifica
tion
Perc
enta
ge (%
)
Illuminance (lux)
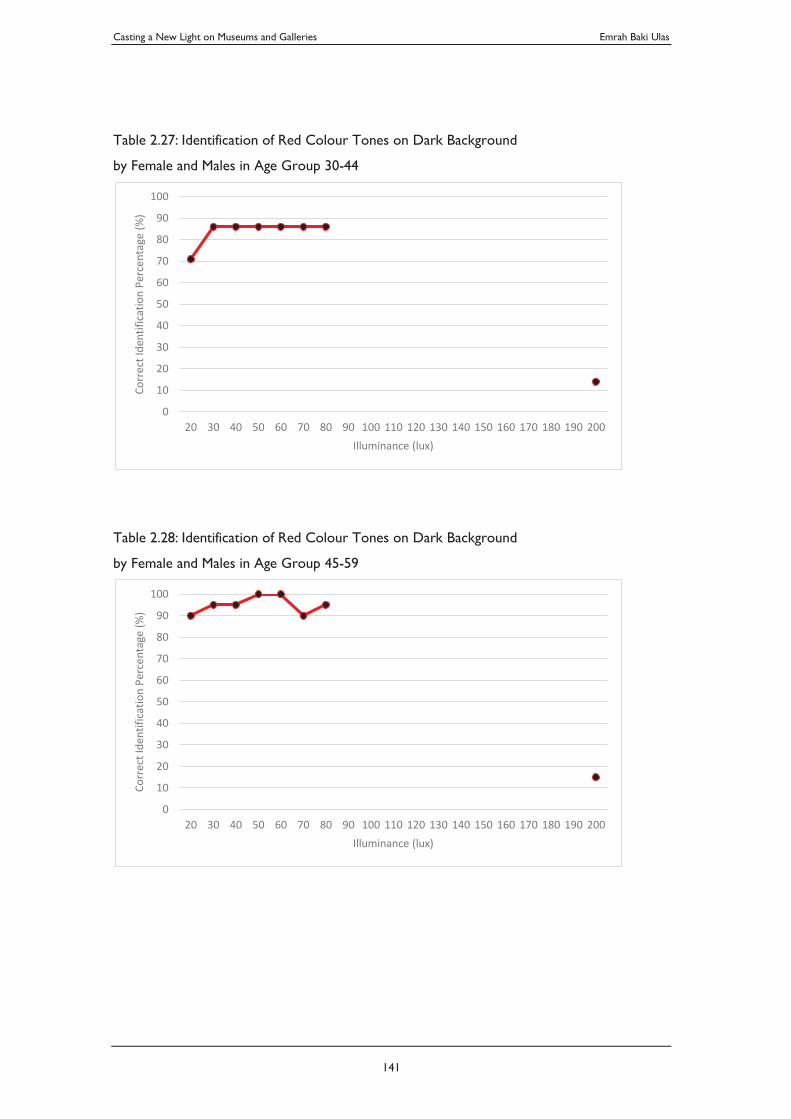
Casting a New Light on Museums and Galleries Emrah Baki Ulas
141
Table 2.27: Identification of Red Colour Tones on Dark Background
by Female and Males in Age Group 30-44
Table 2.28: Identification of Red Colour Tones on Dark Background
by Female and Males in Age Group 45-59
0
10
20
30
40
50
60
70
80
90
100
20 30 40 50 60 70 80 90 100 110 120 130 140 150 160 170 180 190 200
Corr
ect I
dent
ifica
tion
Perc
enta
ge (%
)
Illuminance (lux)
0
10
20
30
40
50
60
70
80
90
100
20 30 40 50 60 70 80 90 100 110 120 130 140 150 160 170 180 190 200
Corr
ect I
dent
ifica
tion
Perc
enta
ge (%
)
Illuminance (lux)
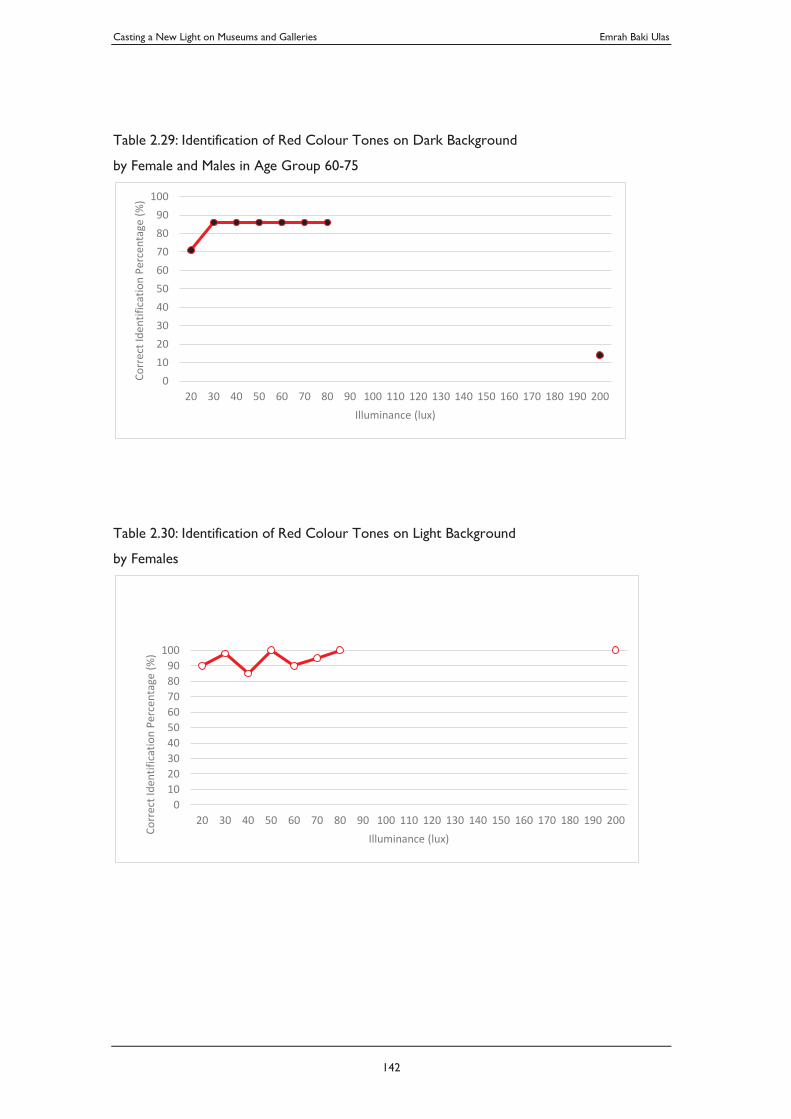
Casting a New Light on Museums and Galleries Emrah Baki Ulas
142
Table 2.29: Identification of Red Colour Tones on Dark Background
by Female and Males in Age Group 60-75
Table 2.30: Identification of Red Colour Tones on Light Background
by Females
0102030405060708090
100
20 30 40 50 60 70 80 90 100 110 120 130 140 150 160 170 180 190 200
Corr
ect I
dent
ifica
tion
Perc
enta
ge (%
)
Illuminance (lux)
0102030405060708090
100
20 30 40 50 60 70 80 90 100 110 120 130 140 150 160 170 180 190 200
Corr
ect I
dent
ifica
tion
Perc
enta
ge (%
)
Illuminance (lux)
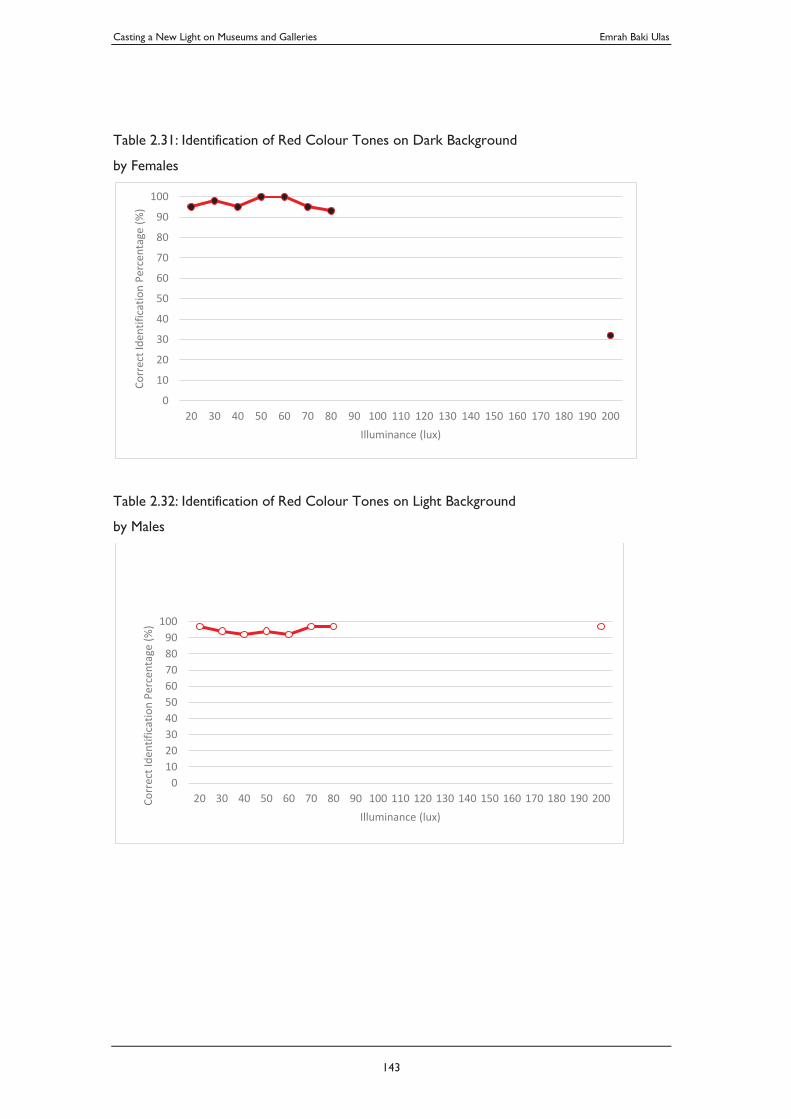
Casting a New Light on Museums and Galleries Emrah Baki Ulas
143
Table 2.31: Identification of Red Colour Tones on Dark Background
by Females
Table 2.32: Identification of Red Colour Tones on Light Background
by Males
0
10
20
30
40
50
60
70
80
90
100
20 30 40 50 60 70 80 90 100 110 120 130 140 150 160 170 180 190 200
Corr
ect I
dent
ifica
tion
Perc
enta
ge (%
)
Illuminance (lux)
0102030405060708090
100
20 30 40 50 60 70 80 90 100 110 120 130 140 150 160 170 180 190 200Corr
ect I
dent
ifica
tion
Perc
enta
ge (%
)
Illuminance (lux)
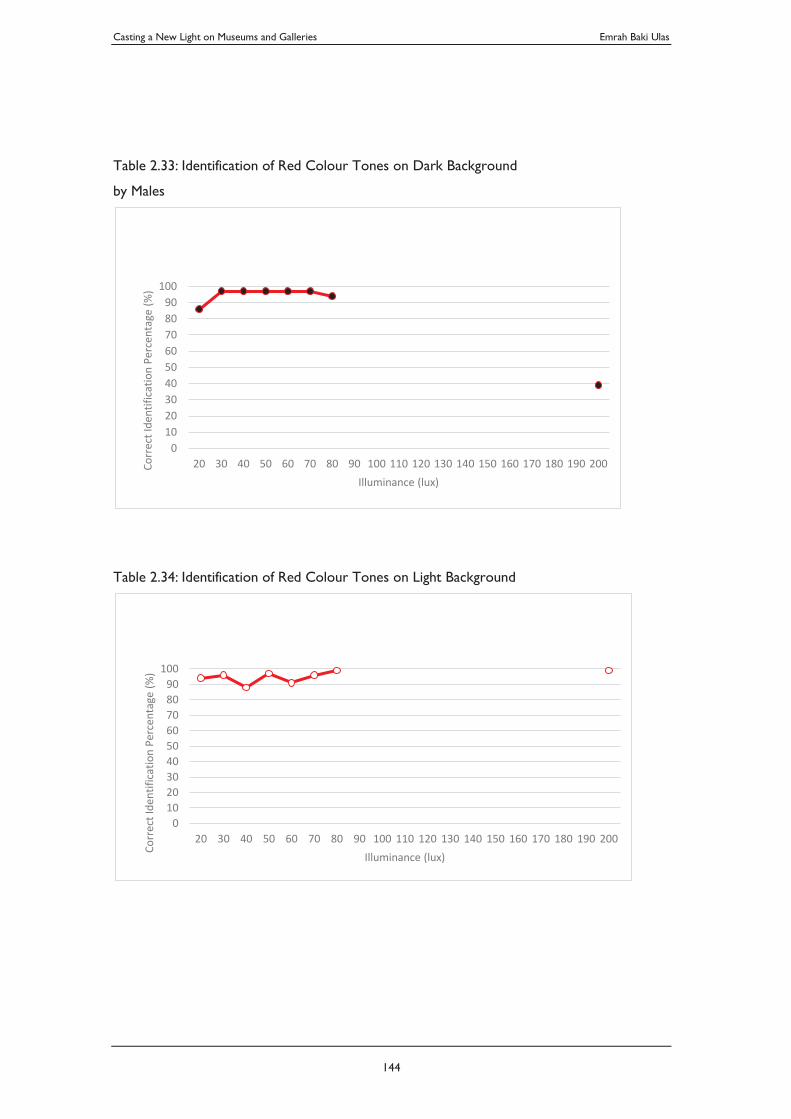
Casting a New Light on Museums and Galleries Emrah Baki Ulas
144
Table 2.33: Identification of Red Colour Tones on Dark Background
by Males
Table 2.34: Identification of Red Colour Tones on Light Background
0102030405060708090
100
20 30 40 50 60 70 80 90 100 110 120 130 140 150 160 170 180 190 200Corr
ect I
dent
ifica
tion
Perc
enta
ge (%
)
Illuminance (lux)
0102030405060708090
100
20 30 40 50 60 70 80 90 100 110 120 130 140 150 160 170 180 190 200
Corr
ect I
dent
ifica
tion
Perc
enta
ge (%
)
Illuminance (lux)
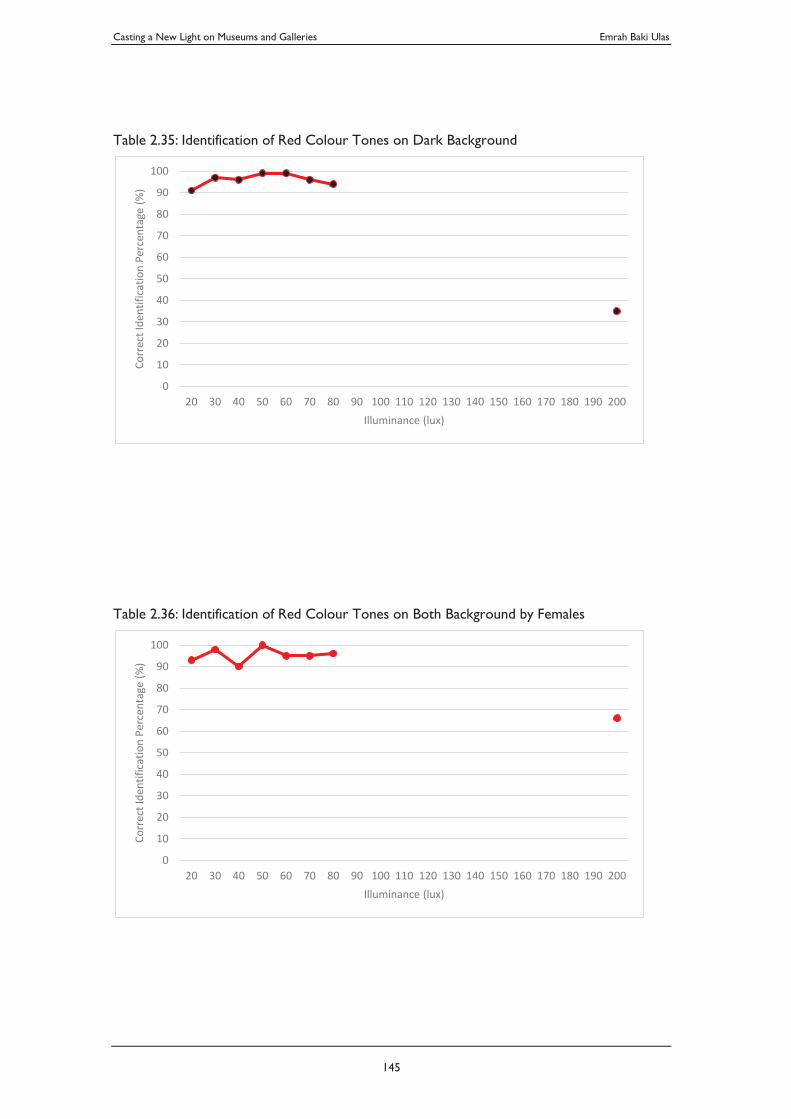
Casting a New Light on Museums and Galleries Emrah Baki Ulas
145
Table 2.35: Identification of Red Colour Tones on Dark Background
Table 2.36: Identification of Red Colour Tones on Both Background by Females
0
10
20
30
40
50
60
70
80
90
100
20 30 40 50 60 70 80 90 100 110 120 130 140 150 160 170 180 190 200
Corr
ect I
dent
ifica
tion
Perc
enta
ge (%
)
Illuminance (lux)
0
10
20
30
40
50
60
70
80
90
100
20 30 40 50 60 70 80 90 100 110 120 130 140 150 160 170 180 190 200
Corr
ect I
dent
ifica
tion
Perc
enta
ge (%
)
Illuminance (lux)
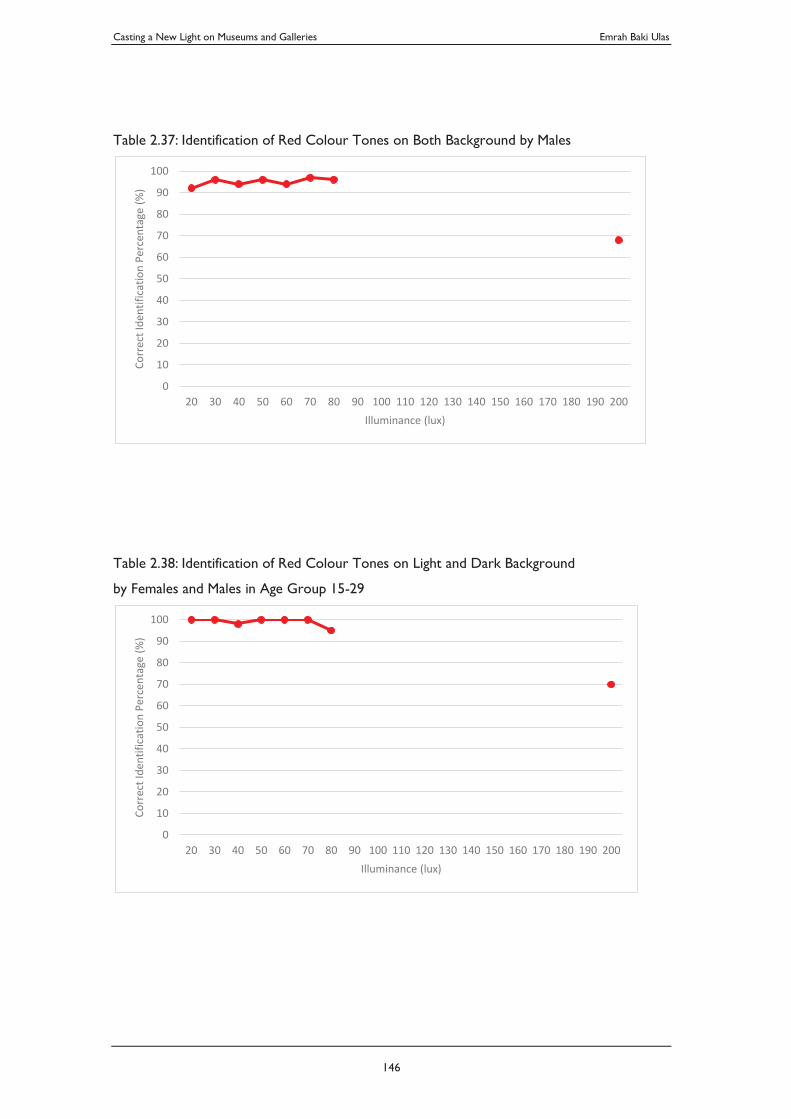
Casting a New Light on Museums and Galleries Emrah Baki Ulas
146
Table 2.37: Identification of Red Colour Tones on Both Background by Males
Table 2.38: Identification of Red Colour Tones on Light and Dark Background
by Females and Males in Age Group 15-29
0
10
20
30
40
50
60
70
80
90
100
20 30 40 50 60 70 80 90 100 110 120 130 140 150 160 170 180 190 200
Corr
ect I
dent
ifica
tion
Perc
enta
ge (%
)
Illuminance (lux)
0
10
20
30
40
50
60
70
80
90
100
20 30 40 50 60 70 80 90 100 110 120 130 140 150 160 170 180 190 200
Corr
ect I
dent
ifica
tion
Perc
enta
ge (%
)
Illuminance (lux)
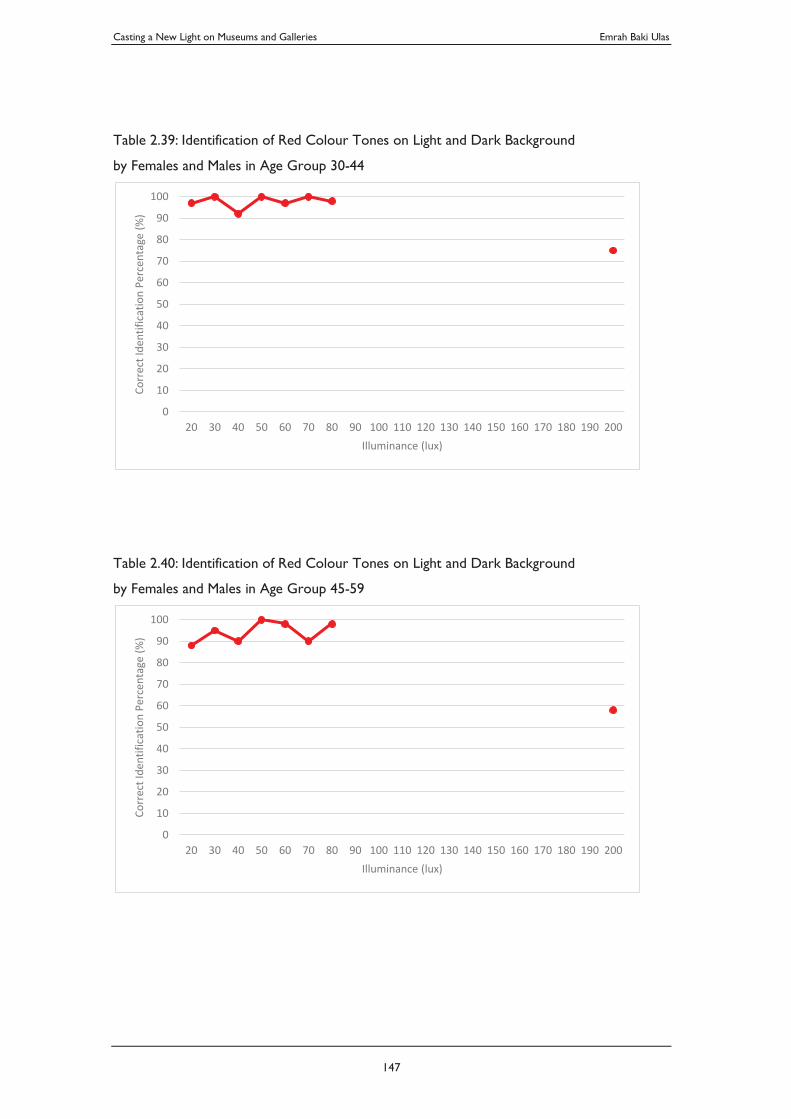
Casting a New Light on Museums and Galleries Emrah Baki Ulas
147
Table 2.39: Identification of Red Colour Tones on Light and Dark Background
by Females and Males in Age Group 30-44
Table 2.40: Identification of Red Colour Tones on Light and Dark Background
by Females and Males in Age Group 45-59
0
10
20
30
40
50
60
70
80
90
100
20 30 40 50 60 70 80 90 100 110 120 130 140 150 160 170 180 190 200
Corr
ect I
dent
ifica
tion
Perc
enta
ge (%
)
Illuminance (lux)
0
10
20
30
40
50
60
70
80
90
100
20 30 40 50 60 70 80 90 100 110 120 130 140 150 160 170 180 190 200
Corr
ect I
dent
ifica
tion
Perc
enta
ge (%
)
Illuminance (lux)
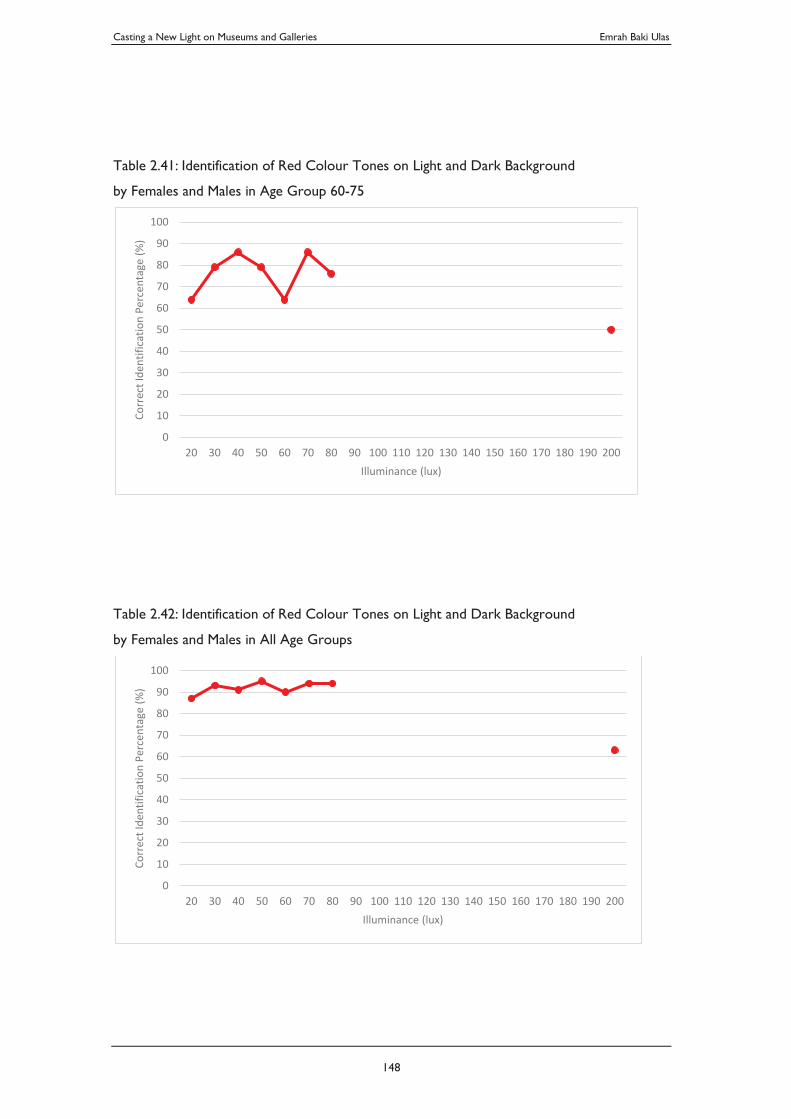
Casting a New Light on Museums and Galleries Emrah Baki Ulas
148
Table 2.41: Identification of Red Colour Tones on Light and Dark Background
by Females and Males in Age Group 60-75
Table 2.42: Identification of Red Colour Tones on Light and Dark Background
by Females and Males in All Age Groups
0
10
20
30
40
50
60
70
80
90
100
20 30 40 50 60 70 80 90 100 110 120 130 140 150 160 170 180 190 200
Corr
ect I
dent
ifica
tion
Perc
enta
ge (%
)
Illuminance (lux)
0
10
20
30
40
50
60
70
80
90
100
20 30 40 50 60 70 80 90 100 110 120 130 140 150 160 170 180 190 200
Corr
ect I
dent
ifica
tion
Perc
enta
ge (%
)
Illuminance (lux)
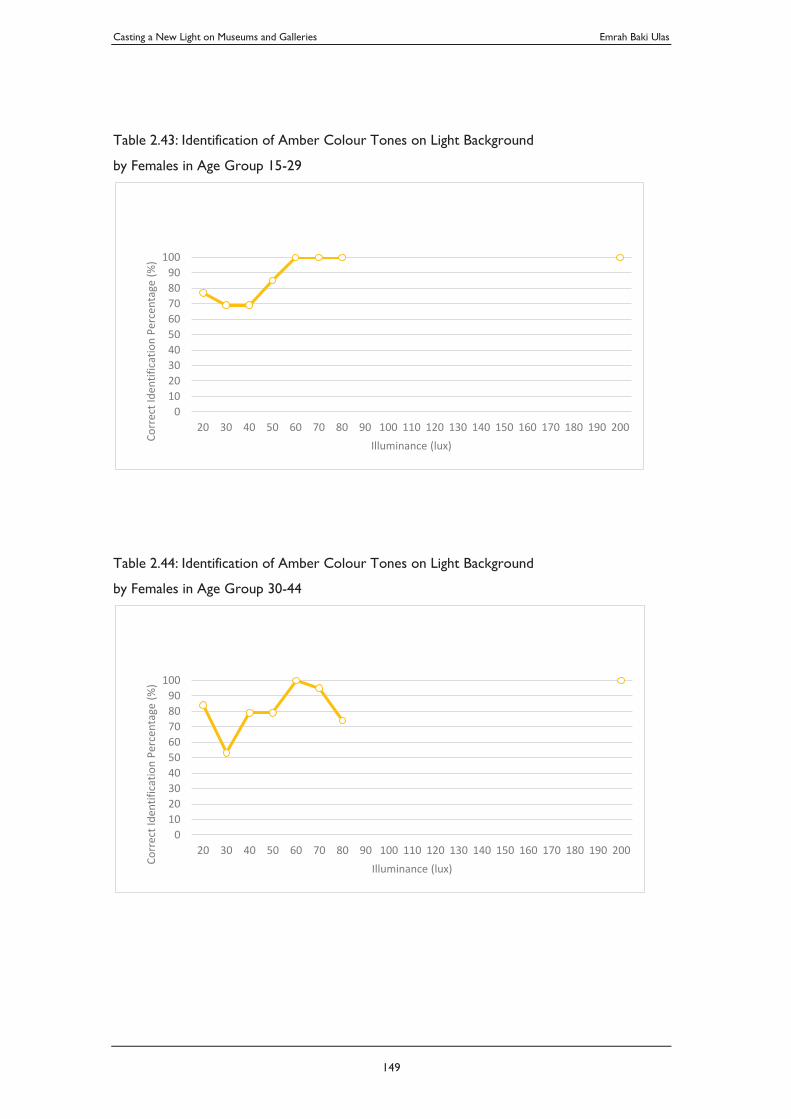
Casting a New Light on Museums and Galleries Emrah Baki Ulas
149
Table 2.43: Identification of Amber Colour Tones on Light Background
by Females in Age Group 15-29
Table 2.44: Identification of Amber Colour Tones on Light Background
by Females in Age Group 30-44
0102030405060708090
100
20 30 40 50 60 70 80 90 100 110 120 130 140 150 160 170 180 190 200
Corr
ect I
dent
ifica
tion
Perc
enta
ge (%
)
Illuminance (lux)
0102030405060708090
100
20 30 40 50 60 70 80 90 100 110 120 130 140 150 160 170 180 190 200
Corr
ect I
dent
ifica
tion
Perc
enta
ge (%
)
Illuminance (lux)
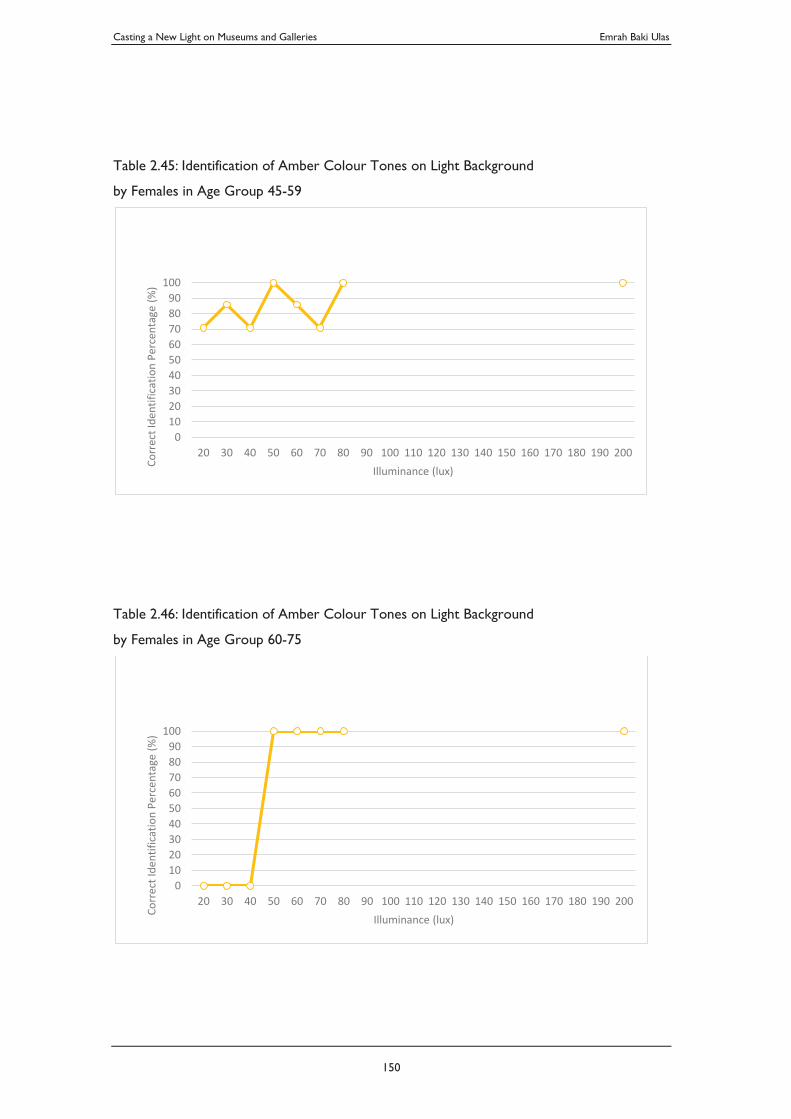
Casting a New Light on Museums and Galleries Emrah Baki Ulas
150
Table 2.45: Identification of Amber Colour Tones on Light Background
by Females in Age Group 45-59
Table 2.46: Identification of Amber Colour Tones on Light Background
by Females in Age Group 60-75
0102030405060708090
100
20 30 40 50 60 70 80 90 100 110 120 130 140 150 160 170 180 190 200
Corr
ect I
dent
ifica
tion
Perc
enta
ge (%
)
Illuminance (lux)
0102030405060708090
100
20 30 40 50 60 70 80 90 100 110 120 130 140 150 160 170 180 190 200
Corr
ect I
dent
ifica
tion
Perc
enta
ge (%
)
Illuminance (lux)
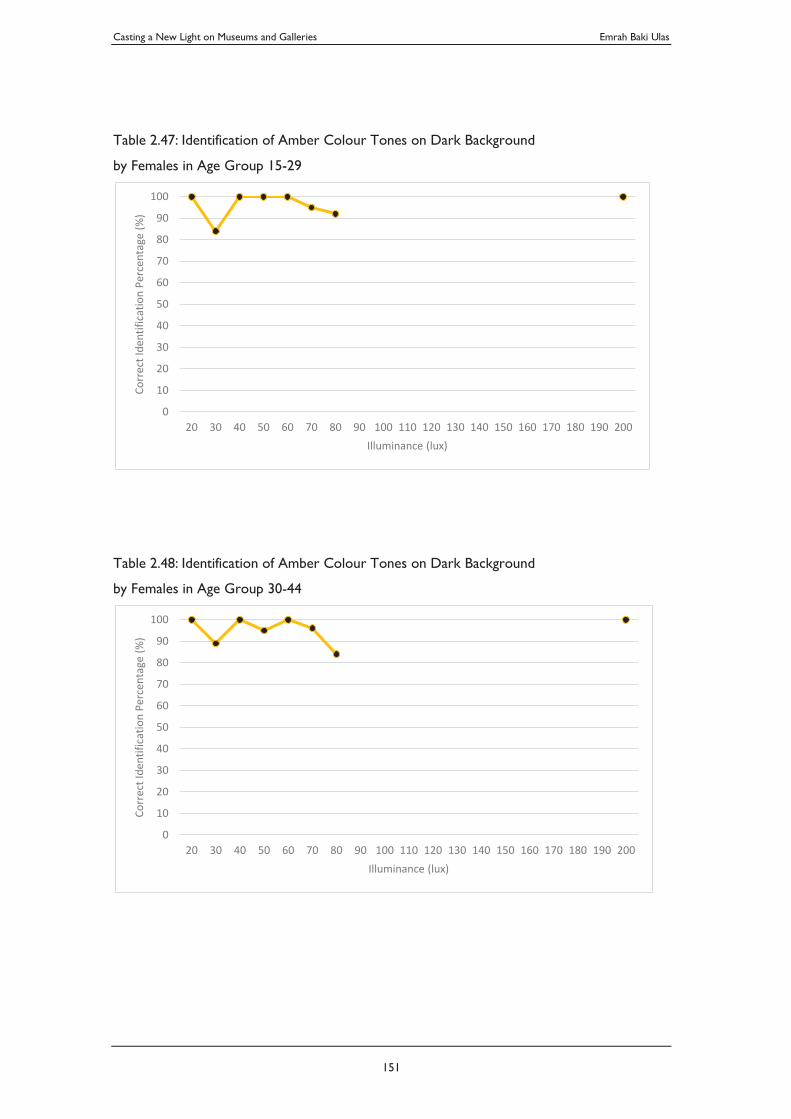
Casting a New Light on Museums and Galleries Emrah Baki Ulas
151
Table 2.47: Identification of Amber Colour Tones on Dark Background
by Females in Age Group 15-29
Table 2.48: Identification of Amber Colour Tones on Dark Background
by Females in Age Group 30-44
0
10
20
30
40
50
60
70
80
90
100
20 30 40 50 60 70 80 90 100 110 120 130 140 150 160 170 180 190 200
Corr
ect I
dent
ifica
tion
Perc
enta
ge (%
)
Illuminance (lux)
0
10
20
30
40
50
60
70
80
90
100
20 30 40 50 60 70 80 90 100 110 120 130 140 150 160 170 180 190 200
Corr
ect I
dent
ifica
tion
Perc
enta
ge (%
)
Illuminance (lux)
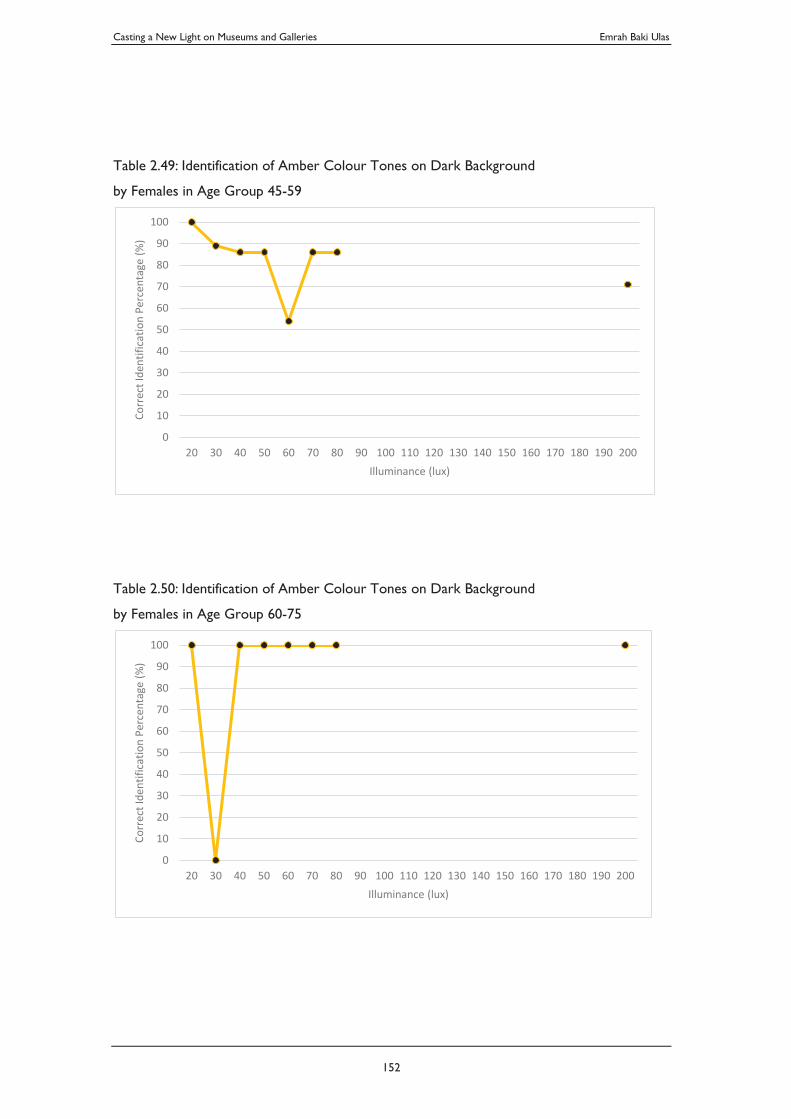
Casting a New Light on Museums and Galleries Emrah Baki Ulas
152
Table 2.49: Identification of Amber Colour Tones on Dark Background
by Females in Age Group 45-59
Table 2.50: Identification of Amber Colour Tones on Dark Background
by Females in Age Group 60-75
0
10
20
30
40
50
60
70
80
90
100
20 30 40 50 60 70 80 90 100 110 120 130 140 150 160 170 180 190 200
Corr
ect I
dent
ifica
tion
Perc
enta
ge (%
)
Illuminance (lux)
0
10
20
30
40
50
60
70
80
90
100
20 30 40 50 60 70 80 90 100 110 120 130 140 150 160 170 180 190 200
Corr
ect I
dent
ifica
tion
Perc
enta
ge (%
)
Illuminance (lux)
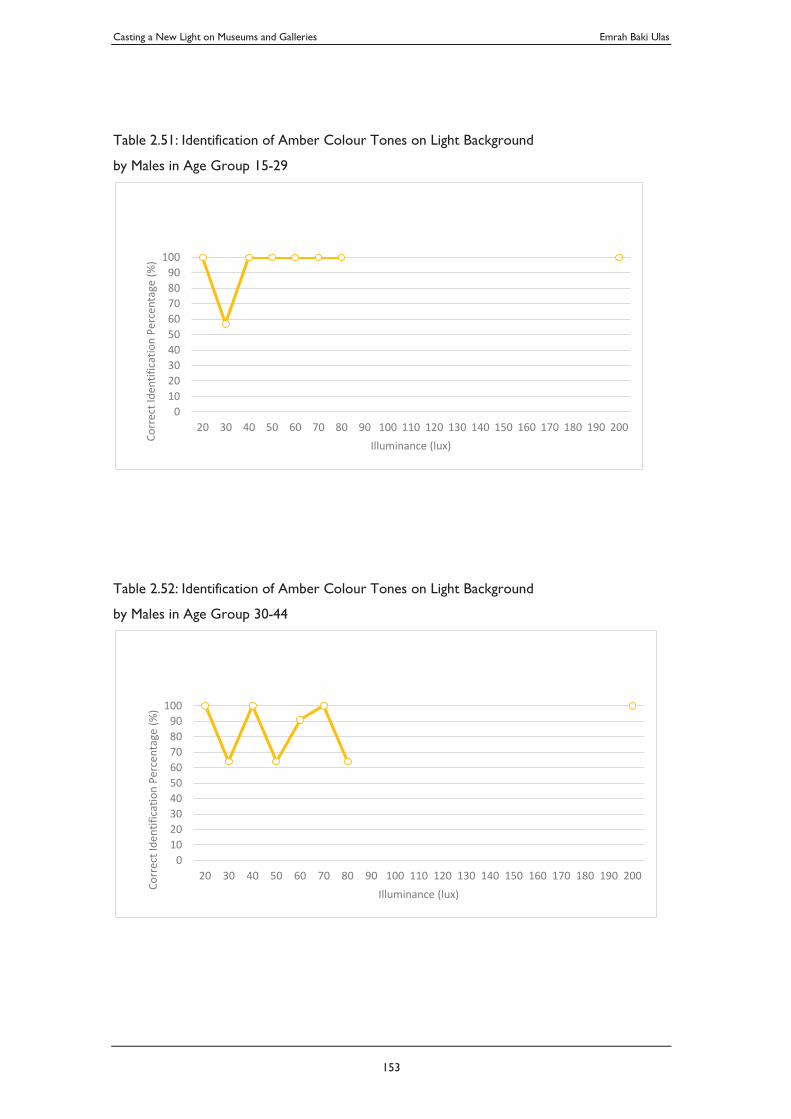
Casting a New Light on Museums and Galleries Emrah Baki Ulas
153
Table 2.51: Identification of Amber Colour Tones on Light Background
by Males in Age Group 15-29
Table 2.52: Identification of Amber Colour Tones on Light Background
by Males in Age Group 30-44
0102030405060708090
100
20 30 40 50 60 70 80 90 100 110 120 130 140 150 160 170 180 190 200
Corr
ect I
dent
ifica
tion
Perc
enta
ge (%
)
Illuminance (lux)
0102030405060708090
100
20 30 40 50 60 70 80 90 100 110 120 130 140 150 160 170 180 190 200
Corr
ect I
dent
ifica
tion
Perc
enta
ge (%
)
Illuminance (lux)
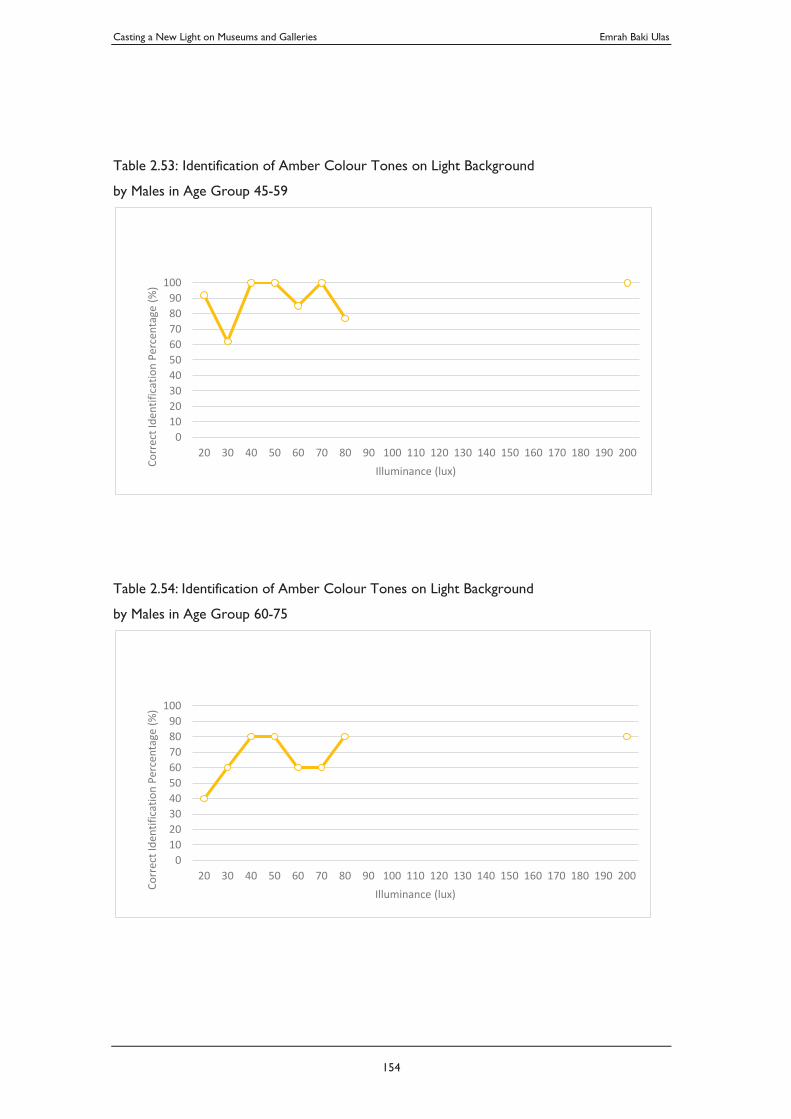
Casting a New Light on Museums and Galleries Emrah Baki Ulas
154
Table 2.53: Identification of Amber Colour Tones on Light Background
by Males in Age Group 45-59
Table 2.54: Identification of Amber Colour Tones on Light Background
by Males in Age Group 60-75
0102030405060708090
100
20 30 40 50 60 70 80 90 100 110 120 130 140 150 160 170 180 190 200
Corr
ect I
dent
ifica
tion
Perc
enta
ge (%
)
Illuminance (lux)
0102030405060708090
100
20 30 40 50 60 70 80 90 100 110 120 130 140 150 160 170 180 190 200
Corr
ect I
dent
ifica
tion
Perc
enta
ge (%
)
Illuminance (lux)
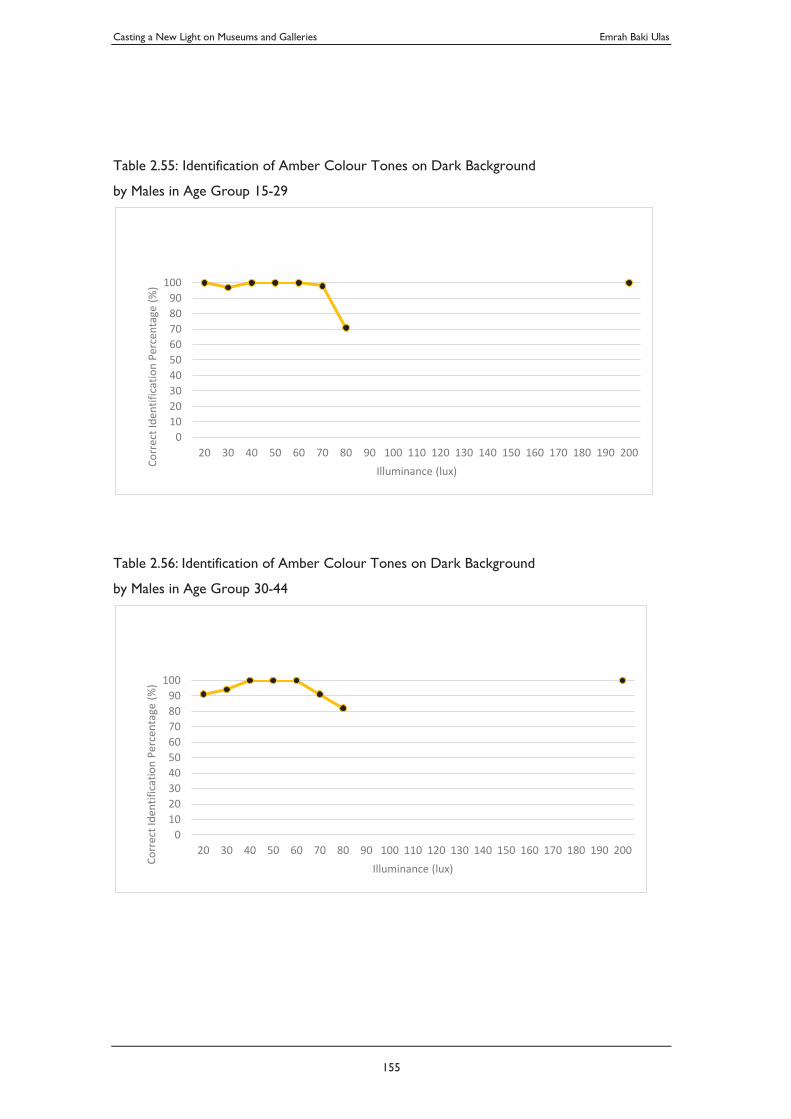
Casting a New Light on Museums and Galleries Emrah Baki Ulas
155
Table 2.55: Identification of Amber Colour Tones on Dark Background
by Males in Age Group 15-29
Table 2.56: Identification of Amber Colour Tones on Dark Background
by Males in Age Group 30-44
0102030405060708090
100
20 30 40 50 60 70 80 90 100 110 120 130 140 150 160 170 180 190 200
Corr
ect I
dent
ifica
tion
Perc
enta
ge (%
)
Illuminance (lux)
0102030405060708090
100
20 30 40 50 60 70 80 90 100 110 120 130 140 150 160 170 180 190 200
Corr
ect I
dent
ifica
tion
Perc
enta
ge (%
)
Illuminance (lux)
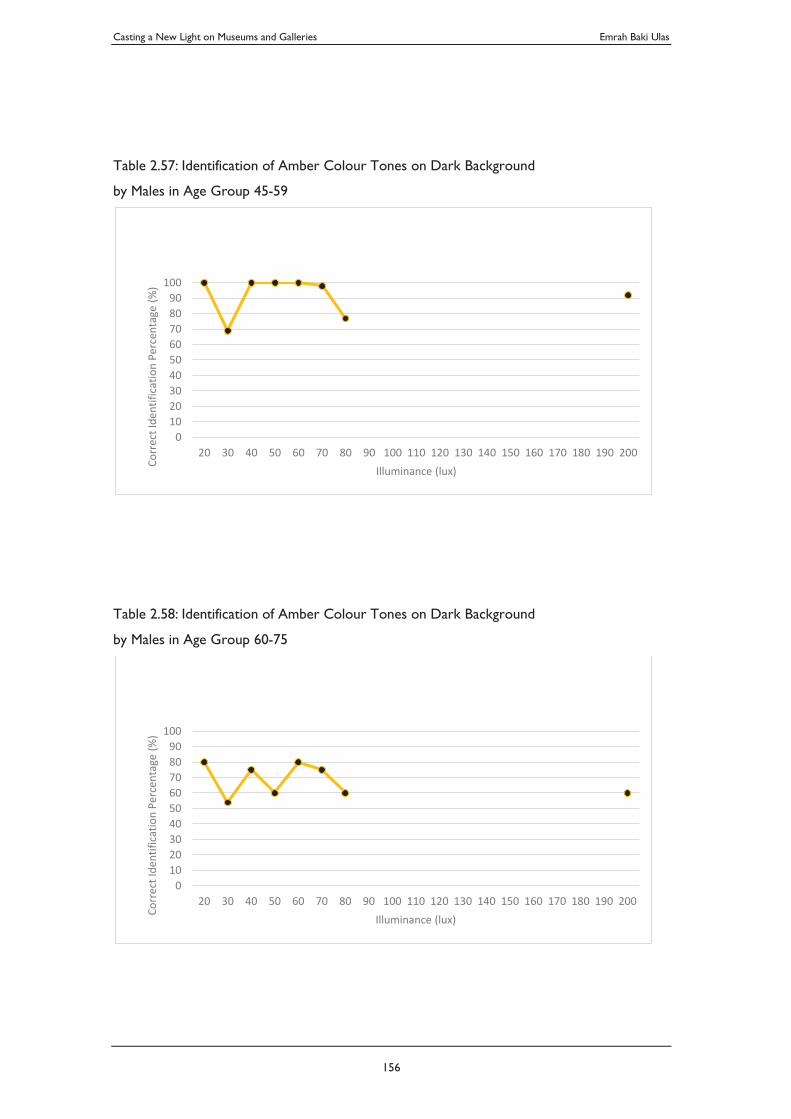
Casting a New Light on Museums and Galleries Emrah Baki Ulas
156
Table 2.57: Identification of Amber Colour Tones on Dark Background
by Males in Age Group 45-59
Table 2.58: Identification of Amber Colour Tones on Dark Background
by Males in Age Group 60-75
0102030405060708090
100
20 30 40 50 60 70 80 90 100 110 120 130 140 150 160 170 180 190 200
Corr
ect I
dent
ifica
tion
Perc
enta
ge (%
)
Illuminance (lux)
0102030405060708090
100
20 30 40 50 60 70 80 90 100 110 120 130 140 150 160 170 180 190 200
Corr
ect I
dent
ifica
tion
Perc
enta
ge (%
)
Illuminance (lux)
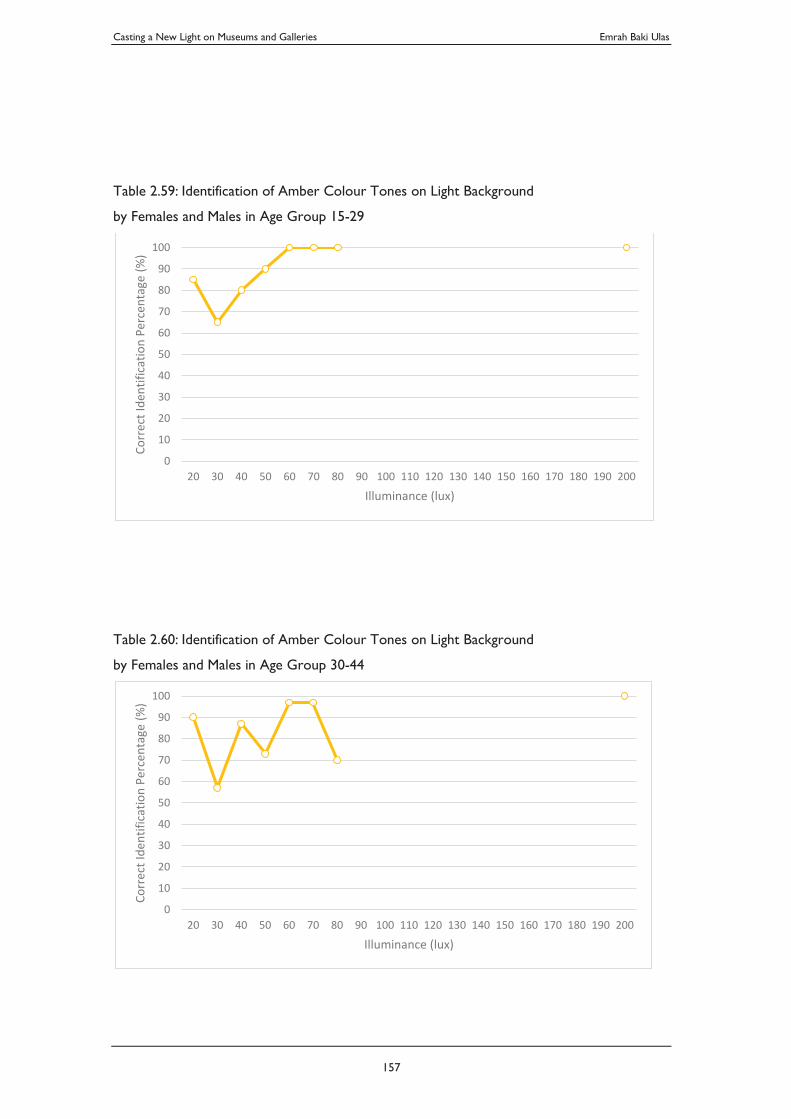
Casting a New Light on Museums and Galleries Emrah Baki Ulas
157
Table 2.59: Identification of Amber Colour Tones on Light Background
by Females and Males in Age Group 15-29
Table 2.60: Identification of Amber Colour Tones on Light Background
by Females and Males in Age Group 30-44
0
10
20
30
40
50
60
70
80
90
100
20 30 40 50 60 70 80 90 100 110 120 130 140 150 160 170 180 190 200
Corr
ect I
dent
ifica
tion
Perc
enta
ge (%
)
Illuminance (lux)
0
10
20
30
40
50
60
70
80
90
100
20 30 40 50 60 70 80 90 100 110 120 130 140 150 160 170 180 190 200
Corr
ect I
dent
ifica
tion
Perc
enta
ge (%
)
Illuminance (lux)
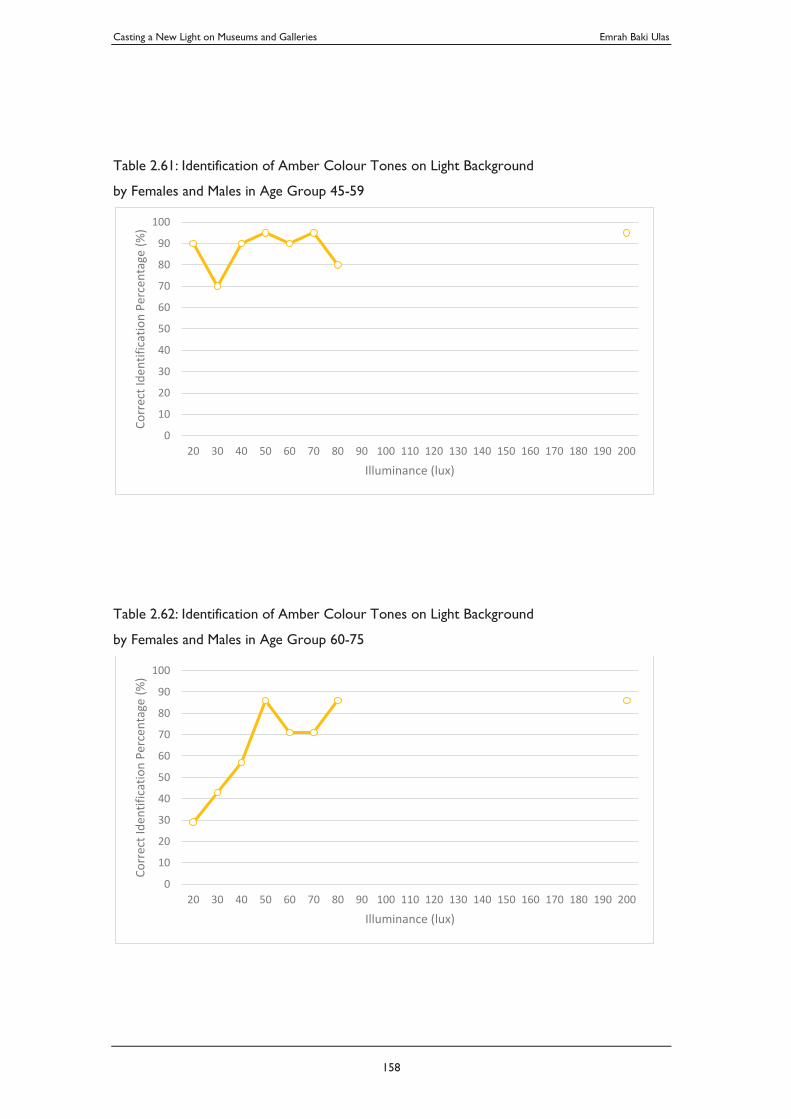
Casting a New Light on Museums and Galleries Emrah Baki Ulas
158
Table 2.61: Identification of Amber Colour Tones on Light Background
by Females and Males in Age Group 45-59
Table 2.62: Identification of Amber Colour Tones on Light Background
by Females and Males in Age Group 60-75
0
10
20
30
40
50
60
70
80
90
100
20 30 40 50 60 70 80 90 100 110 120 130 140 150 160 170 180 190 200
Corr
ect I
dent
ifica
tion
Perc
enta
ge (%
)
Illuminance (lux)
0
10
20
30
40
50
60
70
80
90
100
20 30 40 50 60 70 80 90 100 110 120 130 140 150 160 170 180 190 200
Corr
ect I
dent
ifica
tion
Perc
enta
ge (%
)
Illuminance (lux)
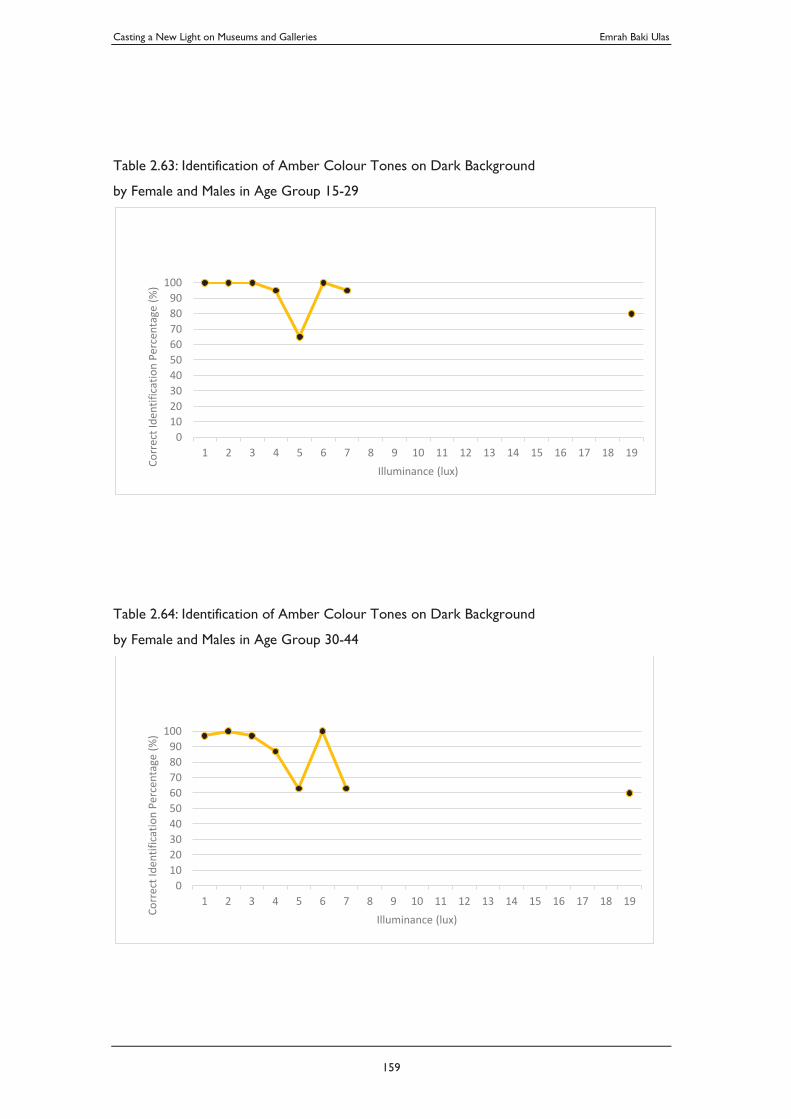
Casting a New Light on Museums and Galleries Emrah Baki Ulas
159
Table 2.63: Identification of Amber Colour Tones on Dark Background
by Female and Males in Age Group 15-29
Table 2.64: Identification of Amber Colour Tones on Dark Background
by Female and Males in Age Group 30-44
0102030405060708090
100
1 2 3 4 5 6 7 8 9 10 11 12 13 14 15 16 17 18 19
Corr
ect I
dent
ifica
tion
Perc
enta
ge (%
)
Illuminance (lux)
0102030405060708090
100
1 2 3 4 5 6 7 8 9 10 11 12 13 14 15 16 17 18 19
Corr
ect I
dent
ifica
tion
Perc
enta
ge (%
)
Illuminance (lux)
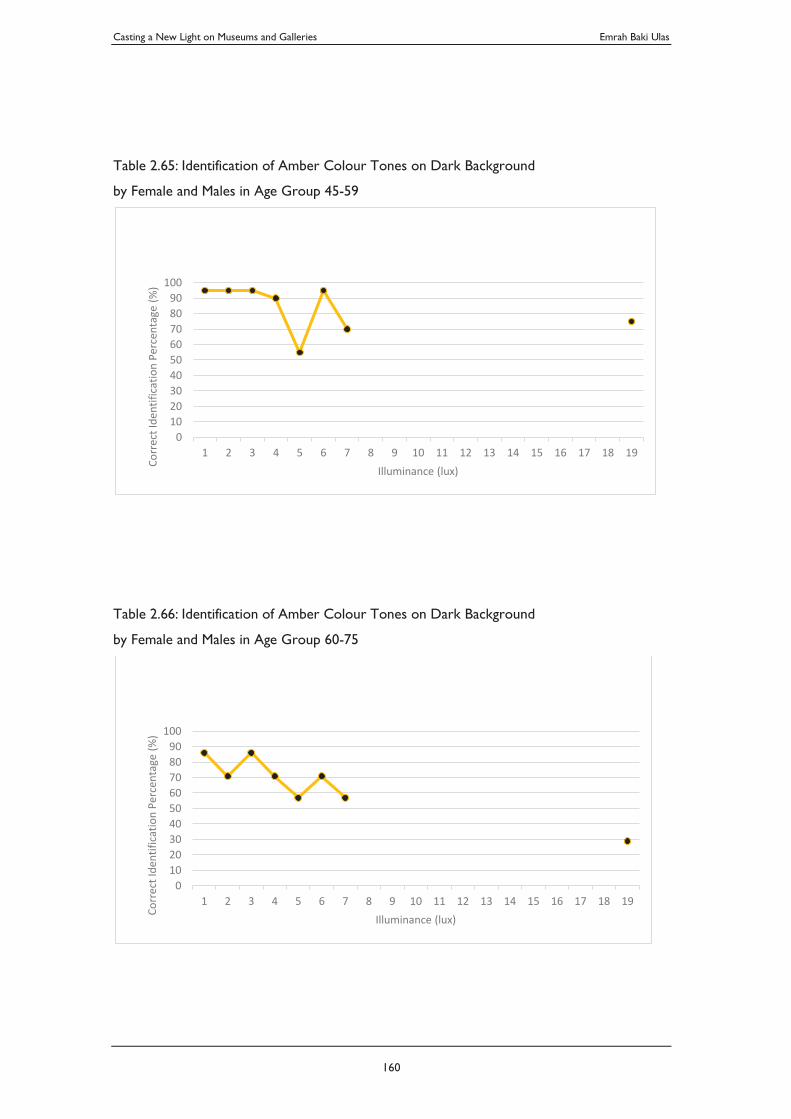
Casting a New Light on Museums and Galleries Emrah Baki Ulas
160
Table 2.65: Identification of Amber Colour Tones on Dark Background
by Female and Males in Age Group 45-59
Table 2.66: Identification of Amber Colour Tones on Dark Background
by Female and Males in Age Group 60-75
0102030405060708090
100
1 2 3 4 5 6 7 8 9 10 11 12 13 14 15 16 17 18 19
Corr
ect I
dent
ifica
tion
Perc
enta
ge (%
)
Illuminance (lux)
0102030405060708090
100
1 2 3 4 5 6 7 8 9 10 11 12 13 14 15 16 17 18 19
Corr
ect I
dent
ifica
tion
Perc
enta
ge (%
)
Illuminance (lux)
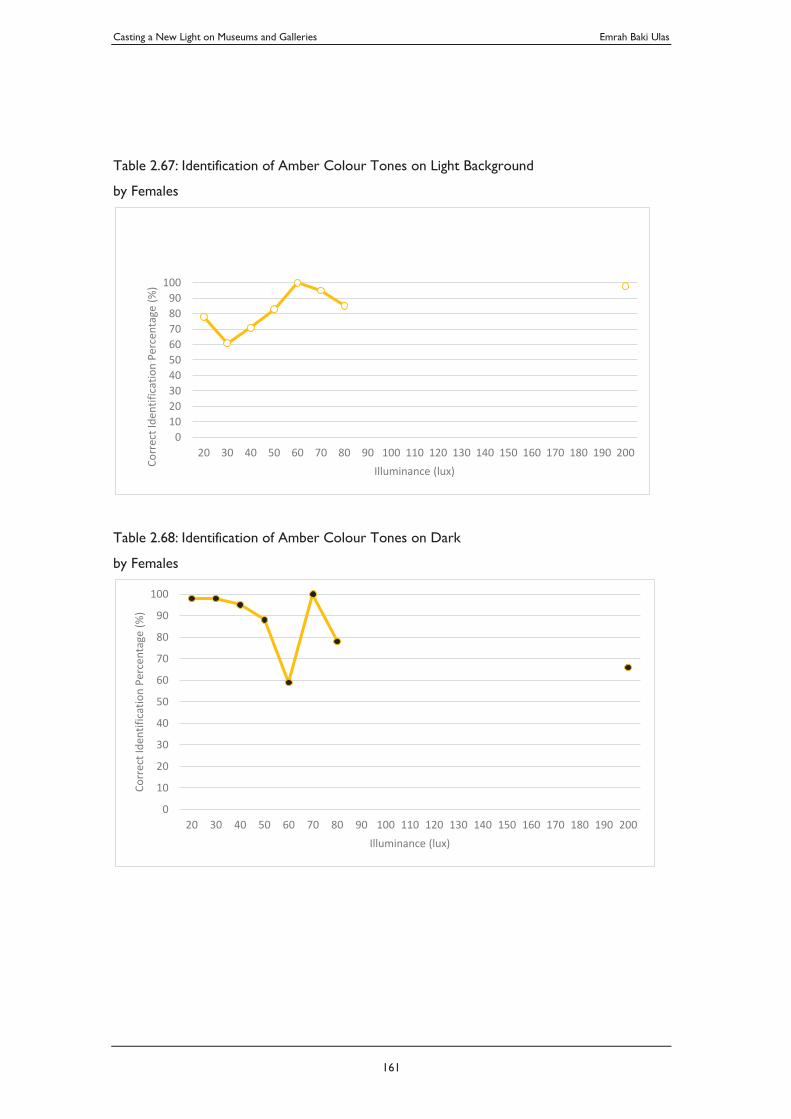
Casting a New Light on Museums and Galleries Emrah Baki Ulas
161
Table 2.67: Identification of Amber Colour Tones on Light Background
by Females
Table 2.68: Identification of Amber Colour Tones on Dark
by Females
0102030405060708090
100
20 30 40 50 60 70 80 90 100 110 120 130 140 150 160 170 180 190 200
Corr
ect I
dent
ifica
tion
Perc
enta
ge (%
)
Illuminance (lux)
0
10
20
30
40
50
60
70
80
90
100
20 30 40 50 60 70 80 90 100 110 120 130 140 150 160 170 180 190 200
Corr
ect I
dent
ifica
tion
Perc
enta
ge (%
)
Illuminance (lux)
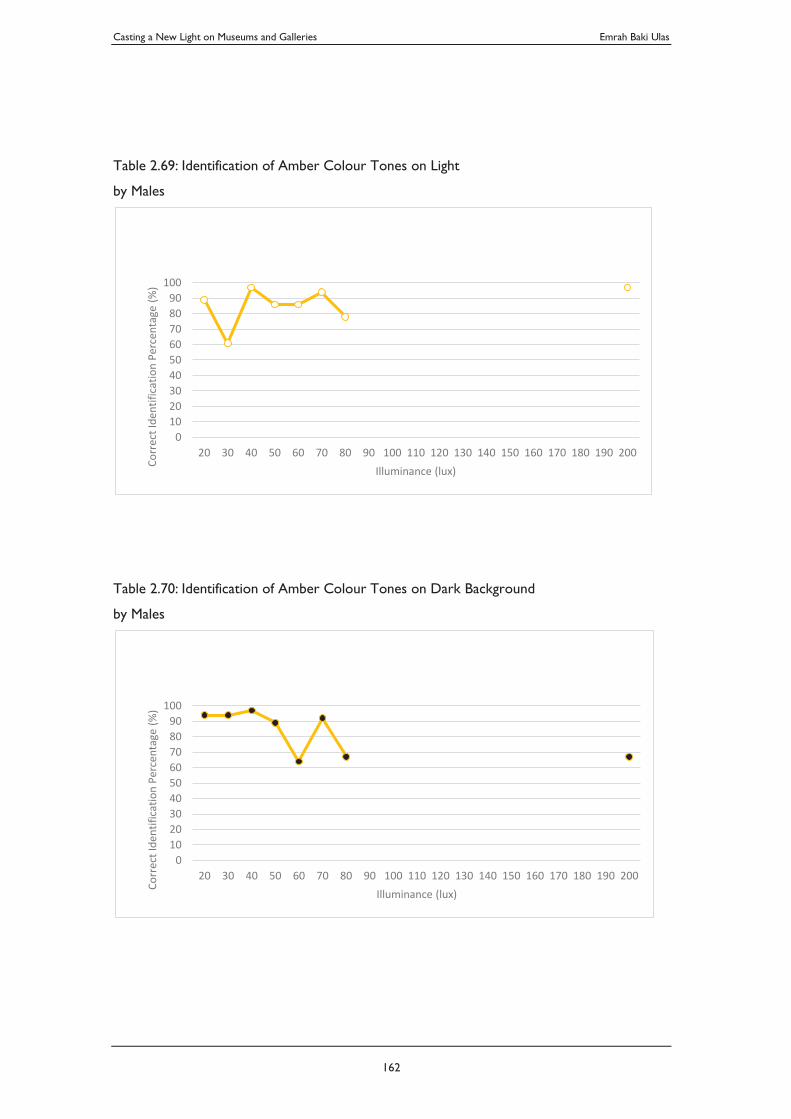
Casting a New Light on Museums and Galleries Emrah Baki Ulas
162
Table 2.69: Identification of Amber Colour Tones on Light
by Males
Table 2.70: Identification of Amber Colour Tones on Dark Background
by Males
0102030405060708090
100
20 30 40 50 60 70 80 90 100 110 120 130 140 150 160 170 180 190 200
Corr
ect I
dent
ifica
tion
Perc
enta
ge (%
)
Illuminance (lux)
0102030405060708090
100
20 30 40 50 60 70 80 90 100 110 120 130 140 150 160 170 180 190 200
Corr
ect I
dent
ifica
tion
Perc
enta
ge (%
)
Illuminance (lux)
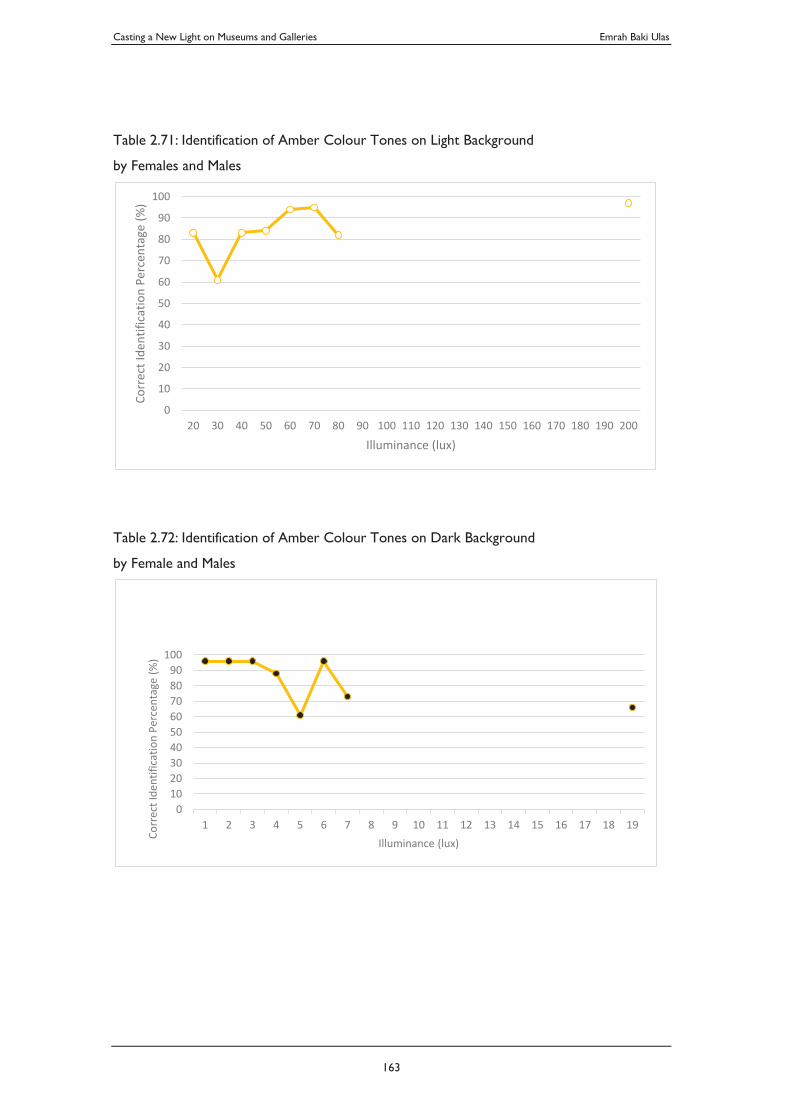
Casting a New Light on Museums and Galleries Emrah Baki Ulas
163
Table 2.71: Identification of Amber Colour Tones on Light Background
by Females and Males
Table 2.72: Identification of Amber Colour Tones on Dark Background
by Female and Males
0
10
20
30
40
50
60
70
80
90
100
20 30 40 50 60 70 80 90 100 110 120 130 140 150 160 170 180 190 200
Corr
ect I
dent
ifica
tion
Perc
enta
ge (%
)
Illuminance (lux)
0102030405060708090
100
1 2 3 4 5 6 7 8 9 10 11 12 13 14 15 16 17 18 19
Corr
ect I
dent
ifica
tion
Perc
enta
ge (%
)
Illuminance (lux)
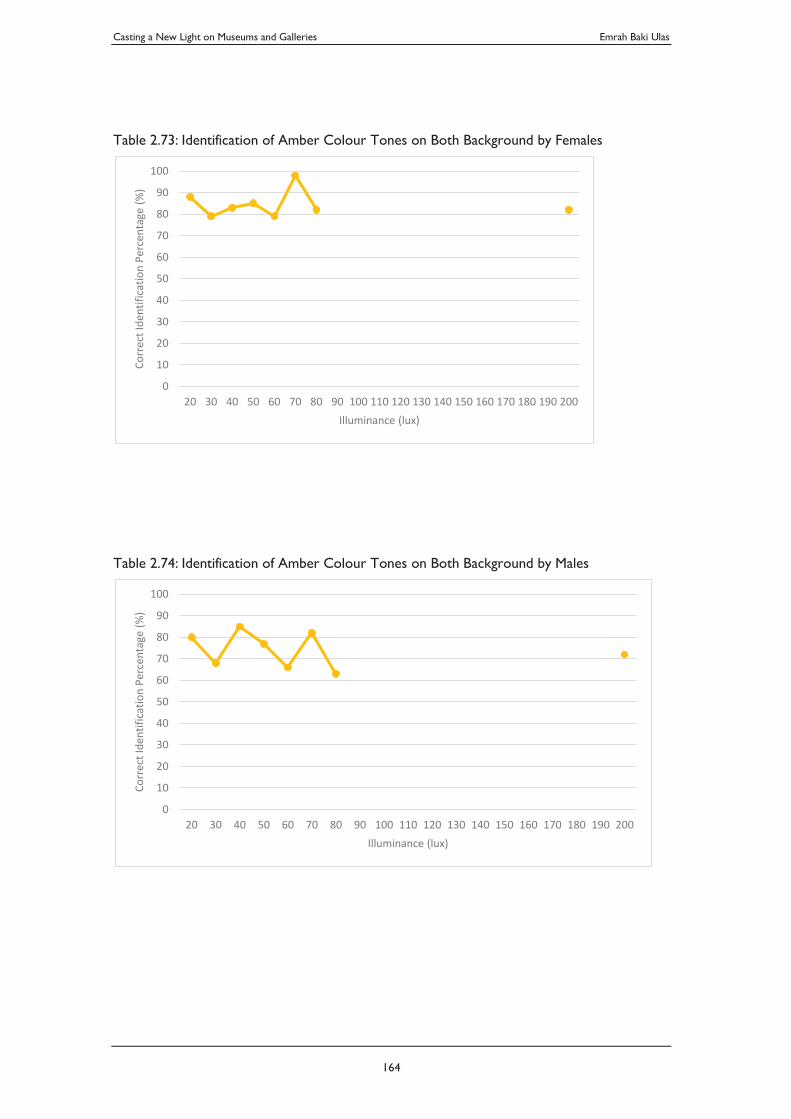
Casting a New Light on Museums and Galleries Emrah Baki Ulas
164
Table 2.73: Identification of Amber Colour Tones on Both Background by Females
Table 2.74: Identification of Amber Colour Tones on Both Background by Males
0
10
20
30
40
50
60
70
80
90
100
20 30 40 50 60 70 80 90 100 110 120 130 140 150 160 170 180 190 200
Corr
ect I
dent
ifica
tion
Perc
enta
ge (%
)
Illuminance (lux)
0
10
20
30
40
50
60
70
80
90
100
20 30 40 50 60 70 80 90 100 110 120 130 140 150 160 170 180 190 200
Corr
ect I
dent
ifica
tion
Perc
enta
ge (%
)
Illuminance (lux)
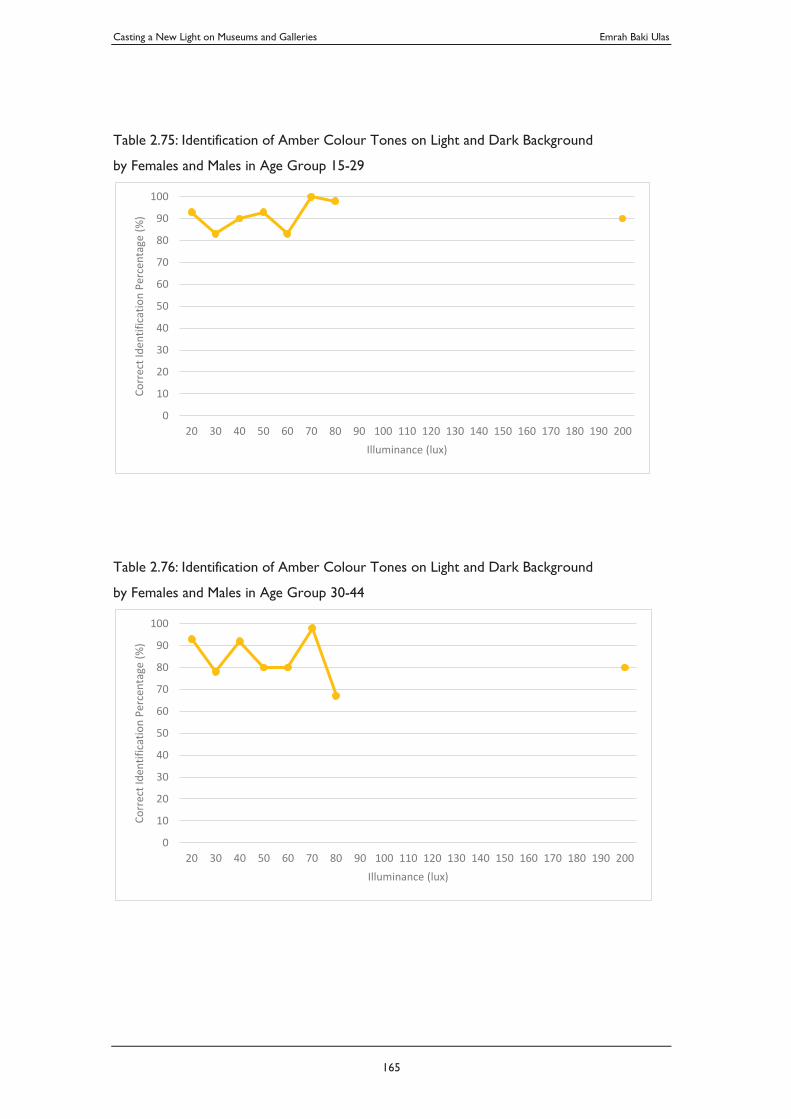
Casting a New Light on Museums and Galleries Emrah Baki Ulas
165
Table 2.75: Identification of Amber Colour Tones on Light and Dark Background
by Females and Males in Age Group 15-29
Table 2.76: Identification of Amber Colour Tones on Light and Dark Background
by Females and Males in Age Group 30-44
0
10
20
30
40
50
60
70
80
90
100
20 30 40 50 60 70 80 90 100 110 120 130 140 150 160 170 180 190 200
Corr
ect I
dent
ifica
tion
Perc
enta
ge (%
)
Illuminance (lux)
0
10
20
30
40
50
60
70
80
90
100
20 30 40 50 60 70 80 90 100 110 120 130 140 150 160 170 180 190 200
Corr
ect I
dent
ifica
tion
Perc
enta
ge (%
)
Illuminance (lux)
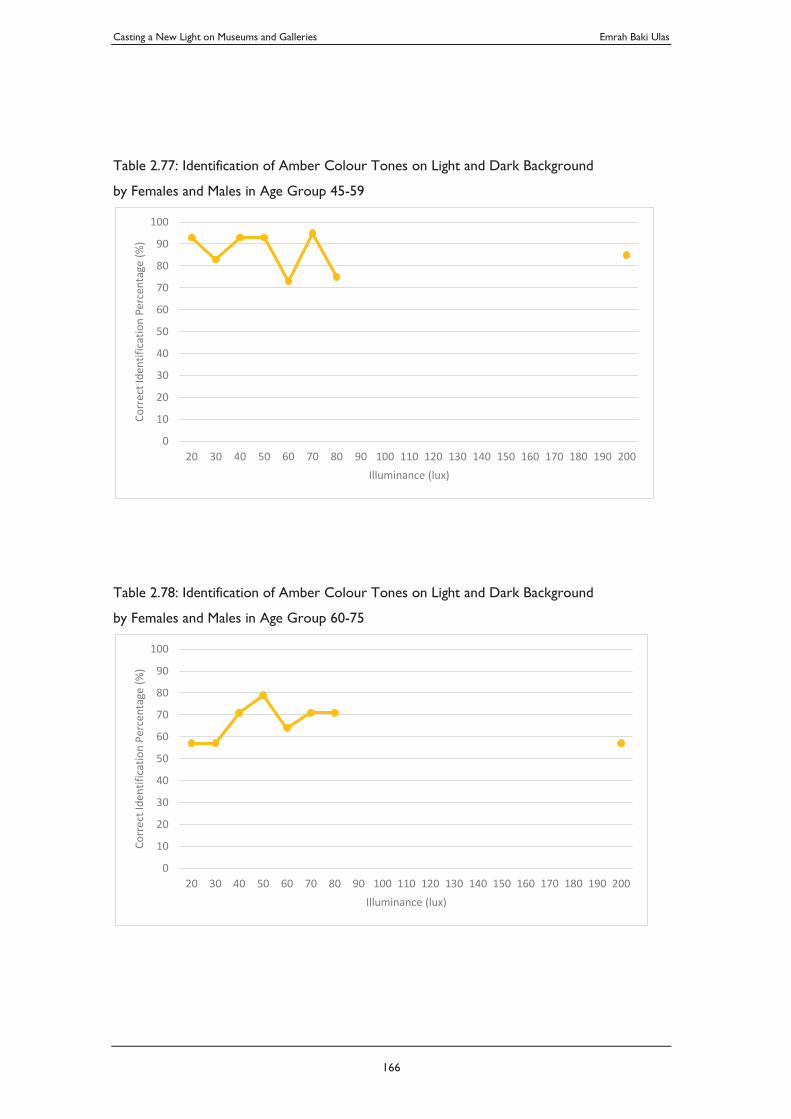
Casting a New Light on Museums and Galleries Emrah Baki Ulas
166
Table 2.77: Identification of Amber Colour Tones on Light and Dark Background
by Females and Males in Age Group 45-59
Table 2.78: Identification of Amber Colour Tones on Light and Dark Background
by Females and Males in Age Group 60-75
0
10
20
30
40
50
60
70
80
90
100
20 30 40 50 60 70 80 90 100 110 120 130 140 150 160 170 180 190 200
Corr
ect I
dent
ifica
tion
Perc
enta
ge (%
)
Illuminance (lux)
0
10
20
30
40
50
60
70
80
90
100
20 30 40 50 60 70 80 90 100 110 120 130 140 150 160 170 180 190 200
Corr
ect I
dent
ifica
tion
Perc
enta
ge (%
)
Illuminance (lux)
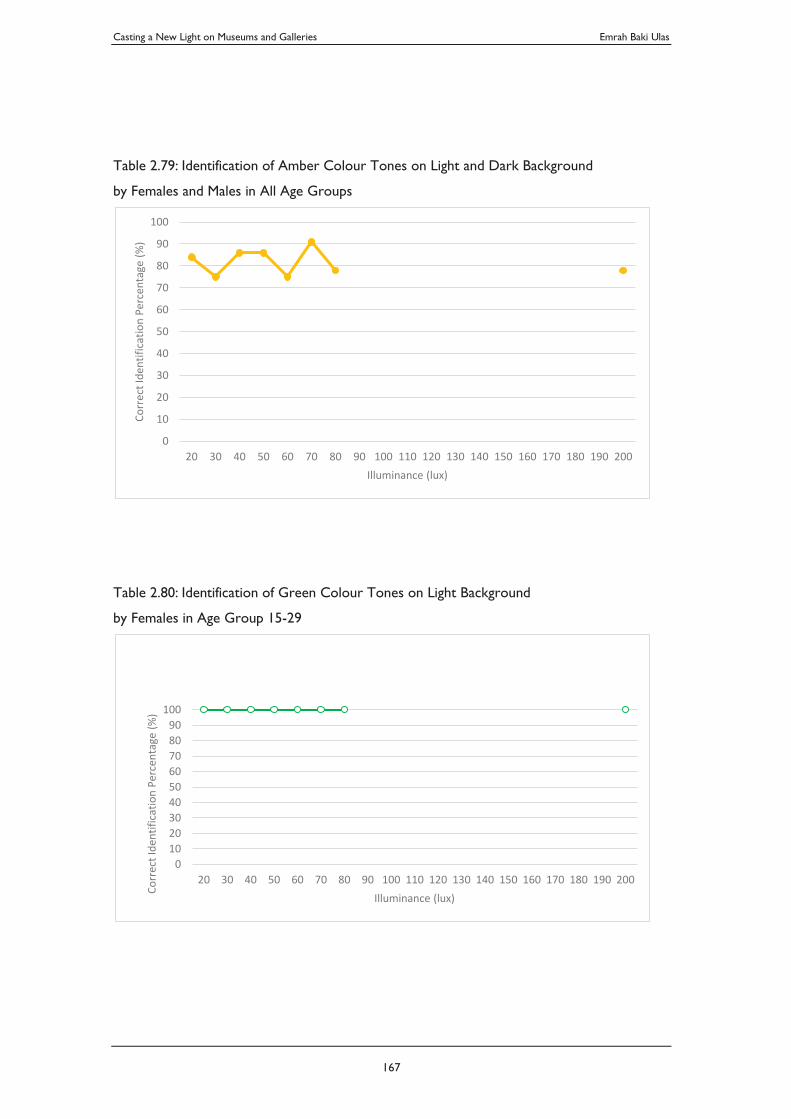
Casting a New Light on Museums and Galleries Emrah Baki Ulas
167
Table 2.79: Identification of Amber Colour Tones on Light and Dark Background
by Females and Males in All Age Groups
Table 2.80: Identification of Green Colour Tones on Light Background
by Females in Age Group 15-29
0
10
20
30
40
50
60
70
80
90
100
20 30 40 50 60 70 80 90 100 110 120 130 140 150 160 170 180 190 200
Corr
ect I
dent
ifica
tion
Perc
enta
ge (%
)
Illuminance (lux)
0102030405060708090
100
20 30 40 50 60 70 80 90 100 110 120 130 140 150 160 170 180 190 200
Corr
ect I
dent
ifica
tion
Perc
enta
ge (%
)
Illuminance (lux)
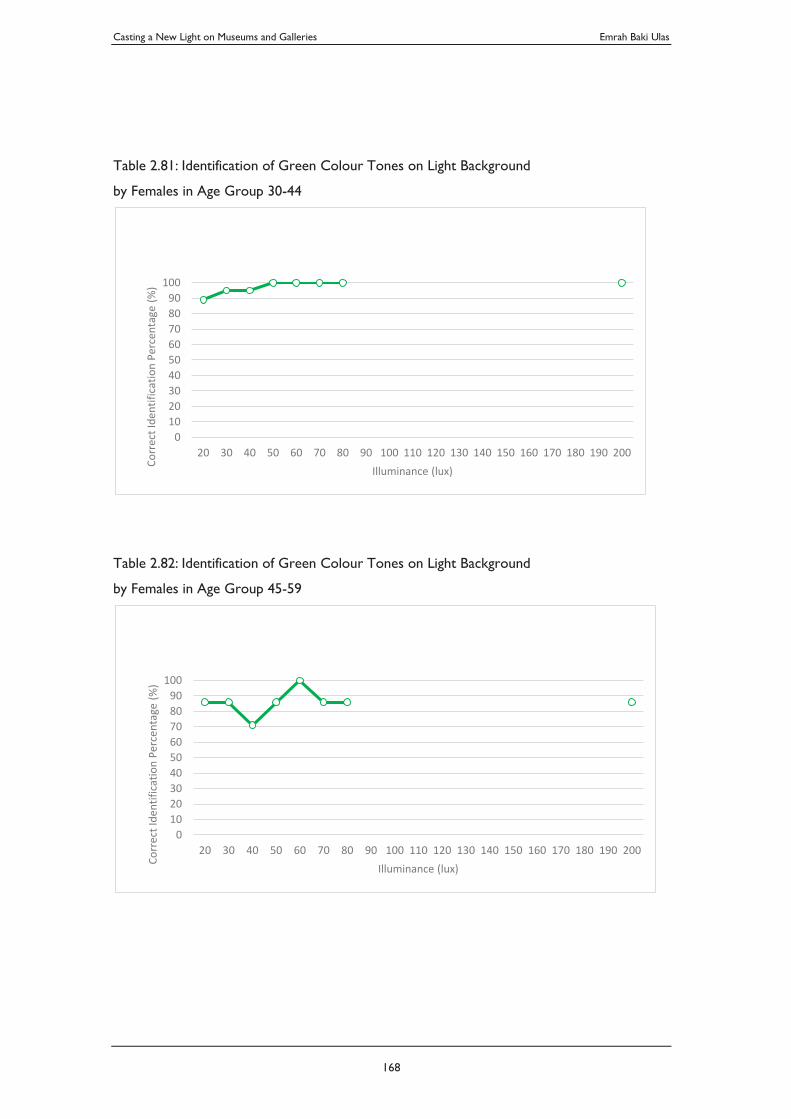
Casting a New Light on Museums and Galleries Emrah Baki Ulas
168
Table 2.81: Identification of Green Colour Tones on Light Background
by Females in Age Group 30-44
Table 2.82: Identification of Green Colour Tones on Light Background
by Females in Age Group 45-59
0102030405060708090
100
20 30 40 50 60 70 80 90 100 110 120 130 140 150 160 170 180 190 200
Corr
ect I
dent
ifica
tion
Perc
enta
ge (%
)
Illuminance (lux)
0102030405060708090
100
20 30 40 50 60 70 80 90 100 110 120 130 140 150 160 170 180 190 200
Corr
ect I
dent
ifica
tion
Perc
enta
ge (%
)
Illuminance (lux)
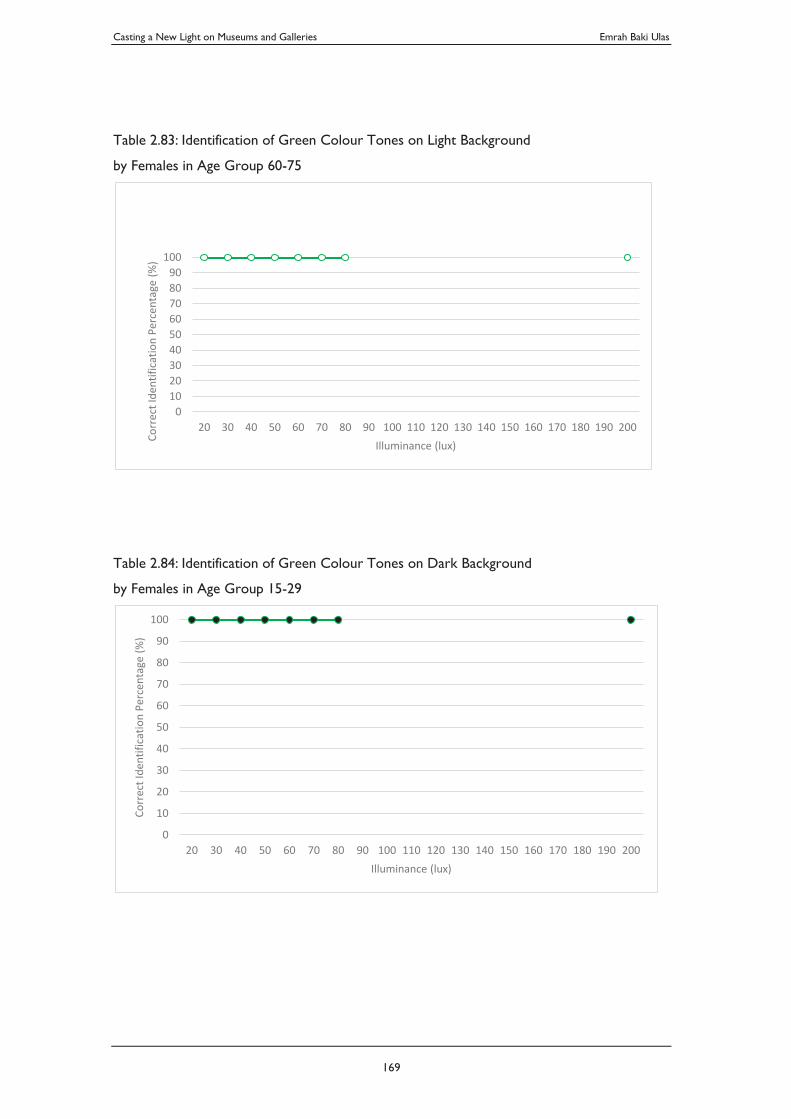
Casting a New Light on Museums and Galleries Emrah Baki Ulas
169
Table 2.83: Identification of Green Colour Tones on Light Background
by Females in Age Group 60-75
Table 2.84: Identification of Green Colour Tones on Dark Background
by Females in Age Group 15-29
0102030405060708090
100
20 30 40 50 60 70 80 90 100 110 120 130 140 150 160 170 180 190 200
Corr
ect I
dent
ifica
tion
Perc
enta
ge (%
)
Illuminance (lux)
0
10
20
30
40
50
60
70
80
90
100
20 30 40 50 60 70 80 90 100 110 120 130 140 150 160 170 180 190 200
Corr
ect I
dent
ifica
tion
Perc
enta
ge (%
)
Illuminance (lux)
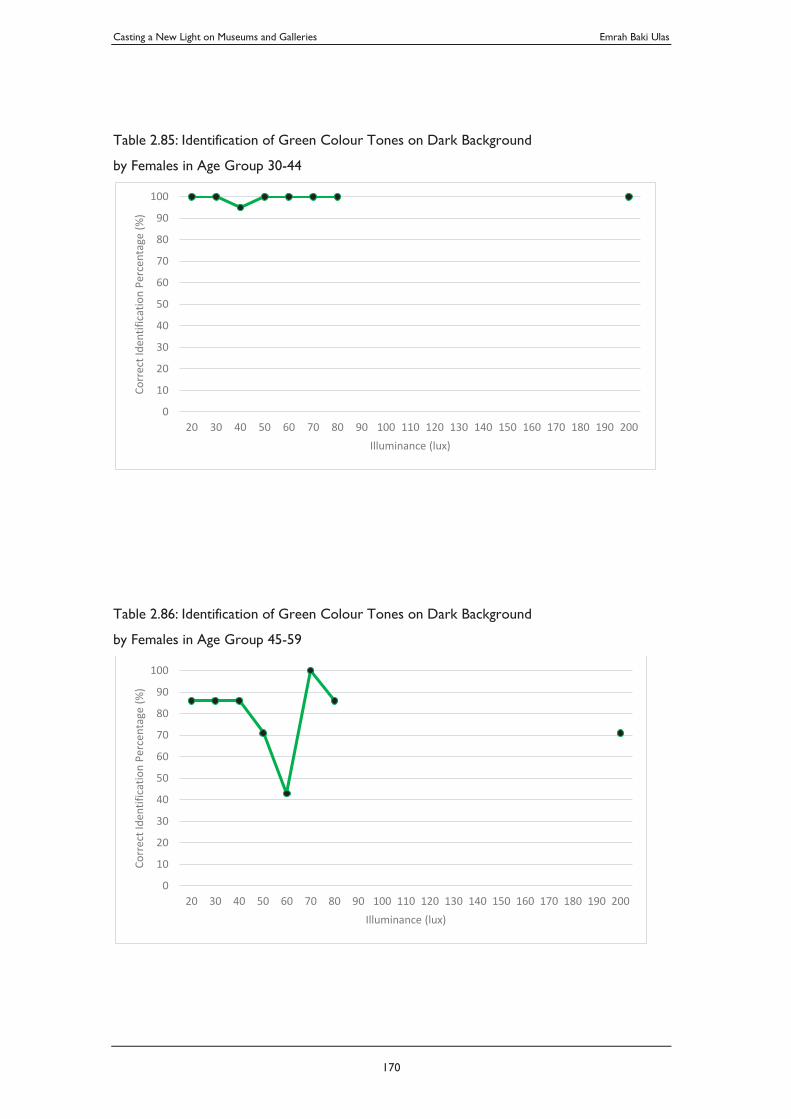
Casting a New Light on Museums and Galleries Emrah Baki Ulas
170
Table 2.85: Identification of Green Colour Tones on Dark Background
by Females in Age Group 30-44
Table 2.86: Identification of Green Colour Tones on Dark Background
by Females in Age Group 45-59
0
10
20
30
40
50
60
70
80
90
100
20 30 40 50 60 70 80 90 100 110 120 130 140 150 160 170 180 190 200
Corr
ect I
dent
ifica
tion
Perc
enta
ge (%
)
Illuminance (lux)
0
10
20
30
40
50
60
70
80
90
100
20 30 40 50 60 70 80 90 100 110 120 130 140 150 160 170 180 190 200
Corr
ect I
dent
ifica
tion
Perc
enta
ge (%
)
Illuminance (lux)
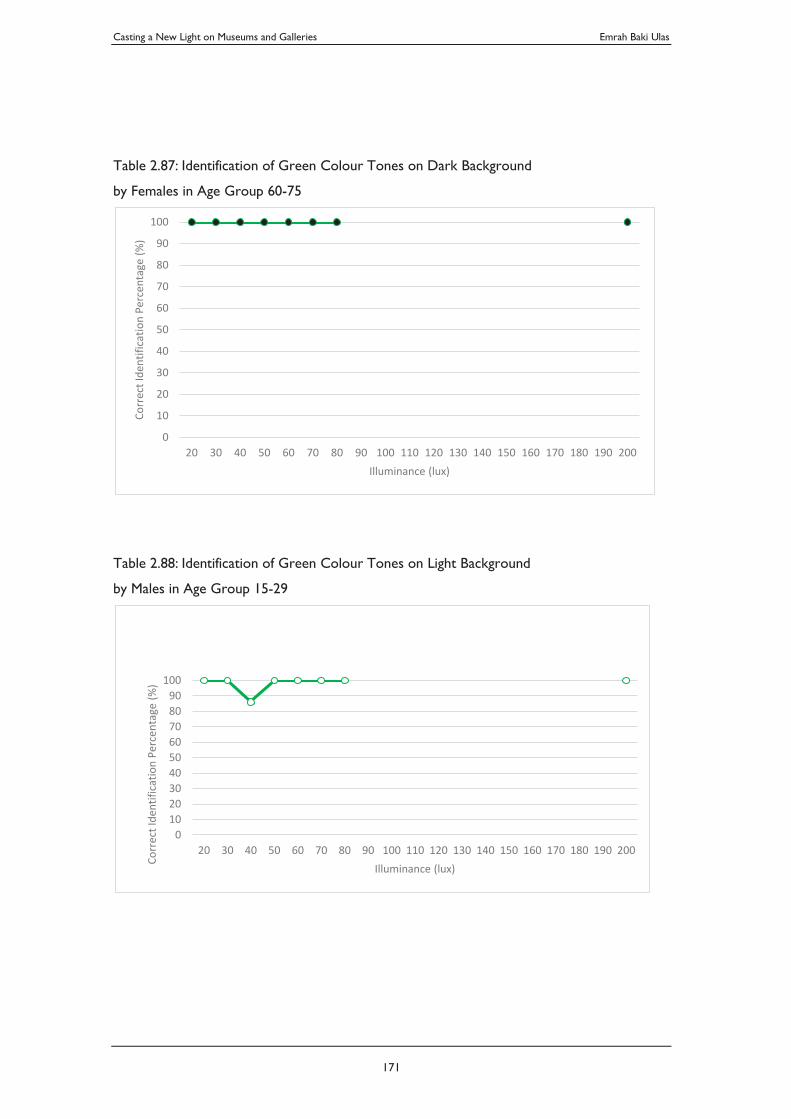
Casting a New Light on Museums and Galleries Emrah Baki Ulas
171
Table 2.87: Identification of Green Colour Tones on Dark Background
by Females in Age Group 60-75
Table 2.88: Identification of Green Colour Tones on Light Background
by Males in Age Group 15-29
0
10
20
30
40
50
60
70
80
90
100
20 30 40 50 60 70 80 90 100 110 120 130 140 150 160 170 180 190 200
Corr
ect I
dent
ifica
tion
Perc
enta
ge (%
)
Illuminance (lux)
0102030405060708090
100
20 30 40 50 60 70 80 90 100 110 120 130 140 150 160 170 180 190 200
Corr
ect I
dent
ifica
tion
Perc
enta
ge (%
)
Illuminance (lux)
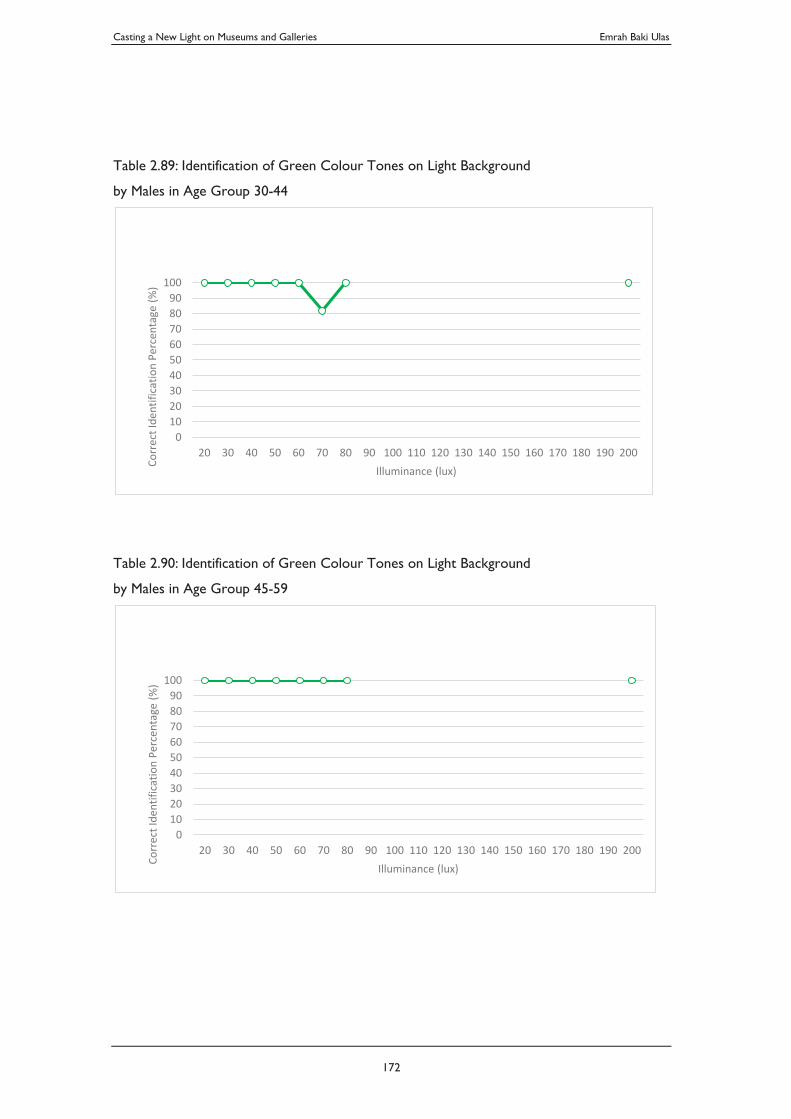
Casting a New Light on Museums and Galleries Emrah Baki Ulas
172
Table 2.89: Identification of Green Colour Tones on Light Background
by Males in Age Group 30-44
Table 2.90: Identification of Green Colour Tones on Light Background
by Males in Age Group 45-59
0102030405060708090
100
20 30 40 50 60 70 80 90 100 110 120 130 140 150 160 170 180 190 200
Corr
ect I
dent
ifica
tion
Perc
enta
ge (%
)
Illuminance (lux)
0102030405060708090
100
20 30 40 50 60 70 80 90 100 110 120 130 140 150 160 170 180 190 200
Corr
ect I
dent
ifica
tion
Perc
enta
ge (%
)
Illuminance (lux)
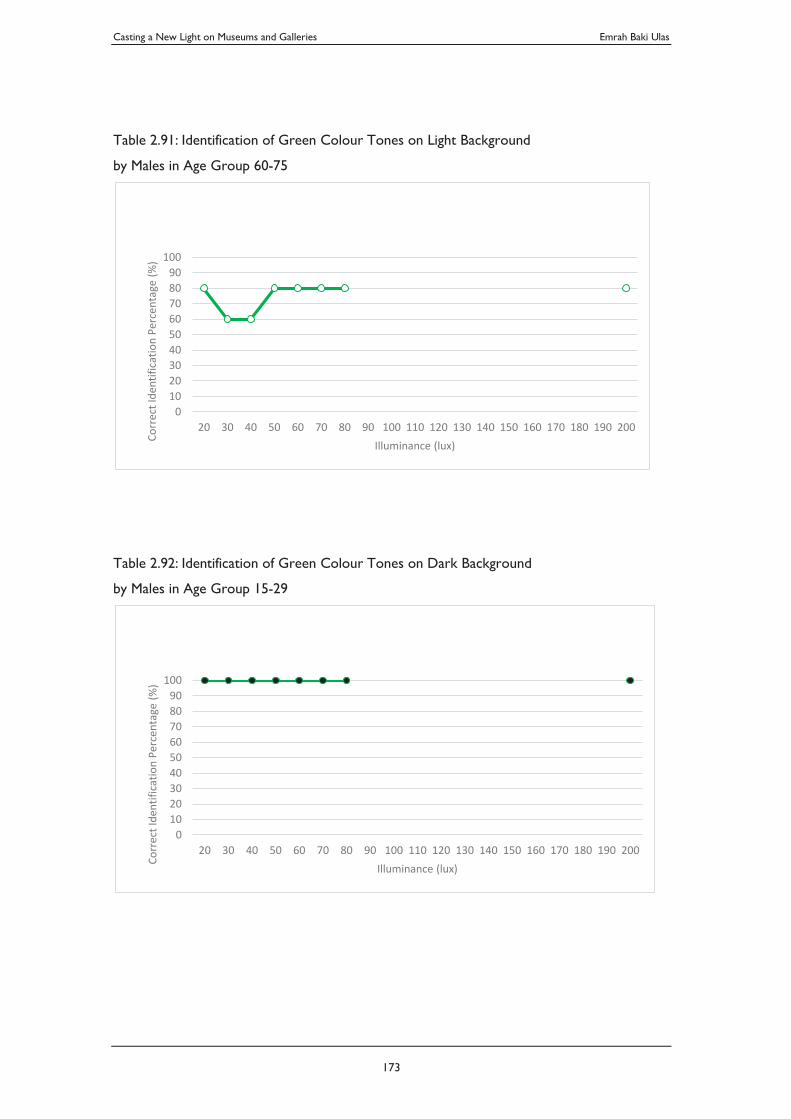
Casting a New Light on Museums and Galleries Emrah Baki Ulas
173
Table 2.91: Identification of Green Colour Tones on Light Background
by Males in Age Group 60-75
Table 2.92: Identification of Green Colour Tones on Dark Background
by Males in Age Group 15-29
0102030405060708090
100
20 30 40 50 60 70 80 90 100 110 120 130 140 150 160 170 180 190 200
Corr
ect I
dent
ifica
tion
Perc
enta
ge (%
)
Illuminance (lux)
0102030405060708090
100
20 30 40 50 60 70 80 90 100 110 120 130 140 150 160 170 180 190 200
Corr
ect I
dent
ifica
tion
Perc
enta
ge (%
)
Illuminance (lux)
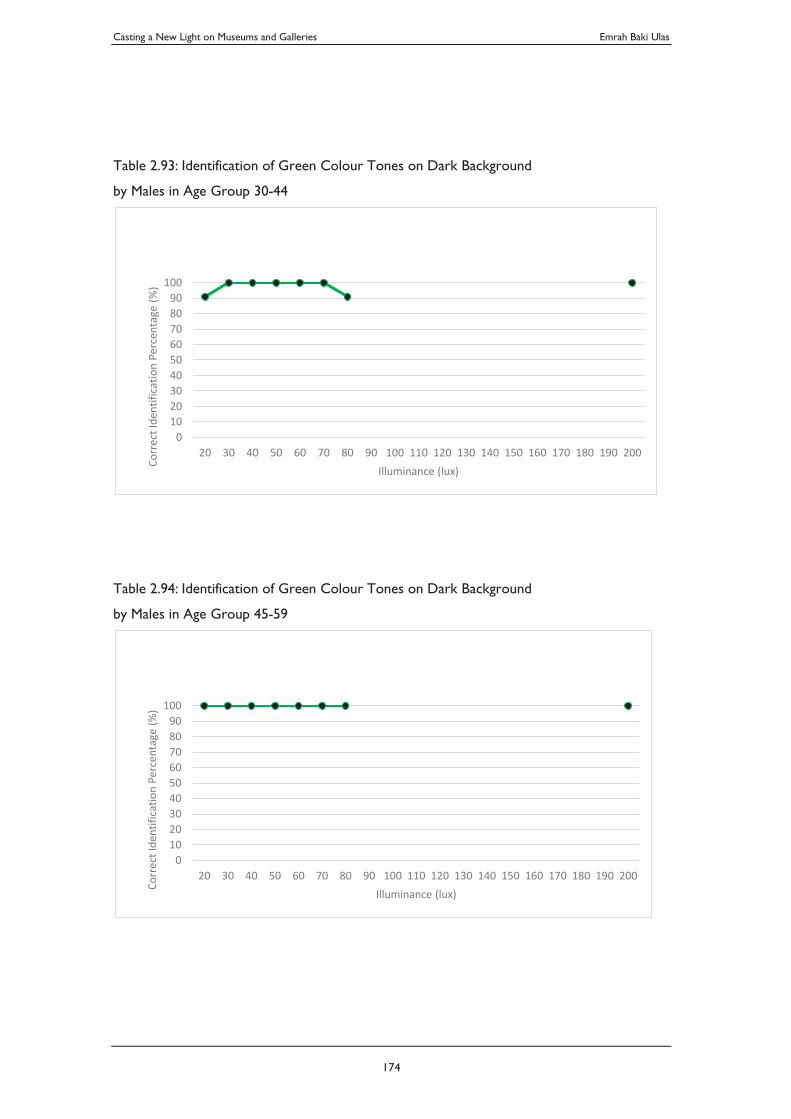
Casting a New Light on Museums and Galleries Emrah Baki Ulas
174
Table 2.93: Identification of Green Colour Tones on Dark Background
by Males in Age Group 30-44
Table 2.94: Identification of Green Colour Tones on Dark Background
by Males in Age Group 45-59
0102030405060708090
100
20 30 40 50 60 70 80 90 100 110 120 130 140 150 160 170 180 190 200
Corr
ect I
dent
ifica
tion
Perc
enta
ge (%
)
Illuminance (lux)
0102030405060708090
100
20 30 40 50 60 70 80 90 100 110 120 130 140 150 160 170 180 190 200
Corr
ect I
dent
ifica
tion
Perc
enta
ge (%
)
Illuminance (lux)
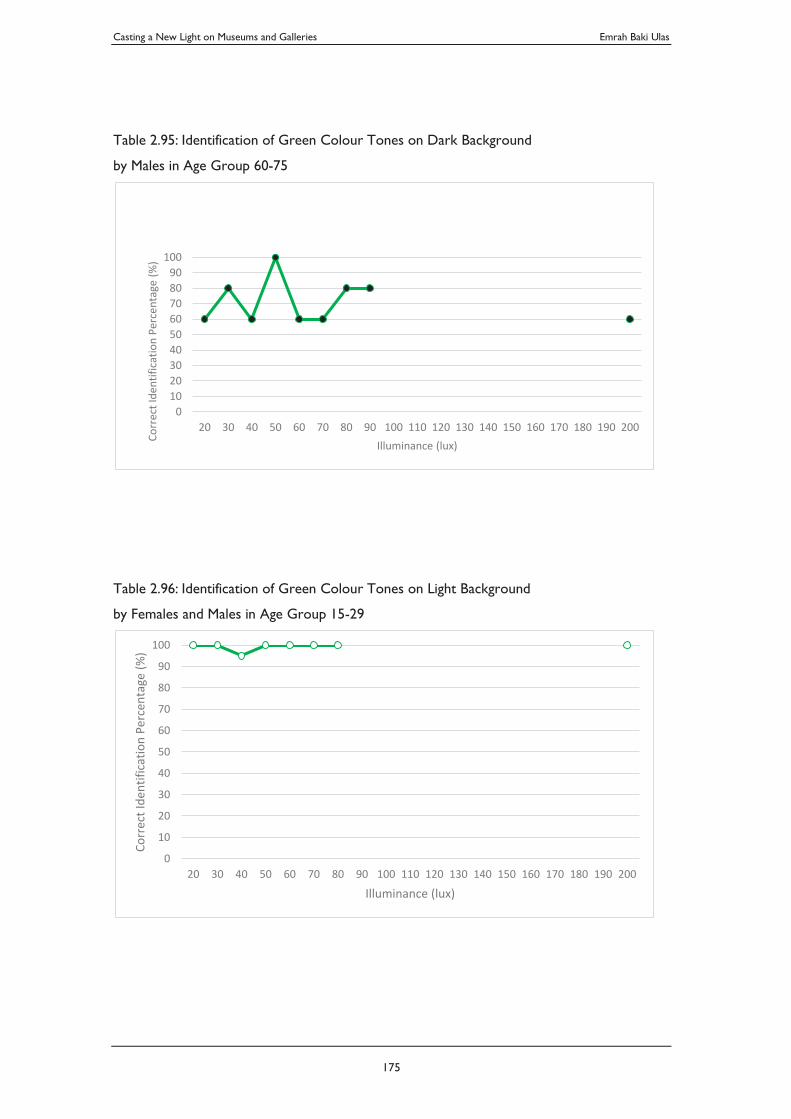
Casting a New Light on Museums and Galleries Emrah Baki Ulas
175
Table 2.95: Identification of Green Colour Tones on Dark Background
by Males in Age Group 60-75
Table 2.96: Identification of Green Colour Tones on Light Background
by Females and Males in Age Group 15-29
0102030405060708090
100
20 30 40 50 60 70 80 90 100 110 120 130 140 150 160 170 180 190 200
Corr
ect I
dent
ifica
tion
Perc
enta
ge (%
)
Illuminance (lux)
0
10
20
30
40
50
60
70
80
90
100
20 30 40 50 60 70 80 90 100 110 120 130 140 150 160 170 180 190 200
Corr
ect I
dent
ifica
tion
Perc
enta
ge (%
)
Illuminance (lux)
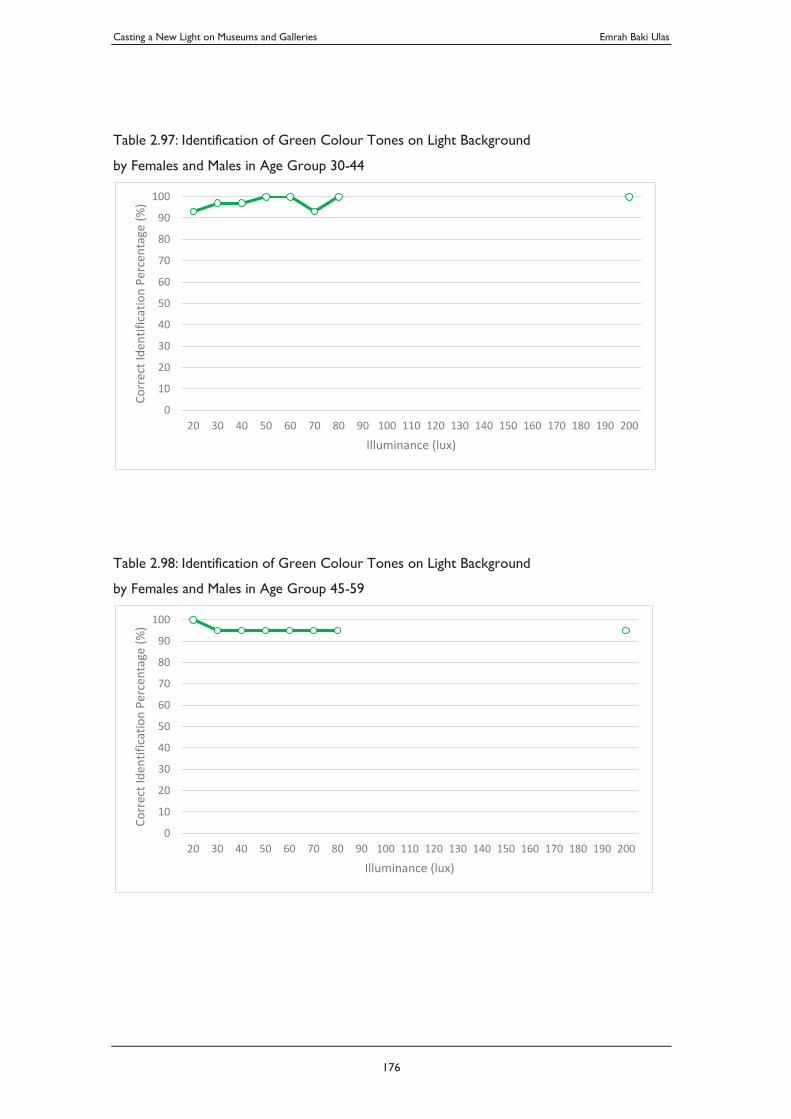
Casting a New Light on Museums and Galleries Emrah Baki Ulas
176
Table 2.97: Identification of Green Colour Tones on Light Background
by Females and Males in Age Group 30-44
Table 2.98: Identification of Green Colour Tones on Light Background
by Females and Males in Age Group 45-59
0
10
20
30
40
50
60
70
80
90
100
20 30 40 50 60 70 80 90 100 110 120 130 140 150 160 170 180 190 200
Corr
ect I
dent
ifica
tion
Perc
enta
ge (%
)
Illuminance (lux)
0
10
20
30
40
50
60
70
80
90
100
20 30 40 50 60 70 80 90 100 110 120 130 140 150 160 170 180 190 200
Corr
ect I
dent
ifica
tion
Perc
enta
ge (%
)
Illuminance (lux)
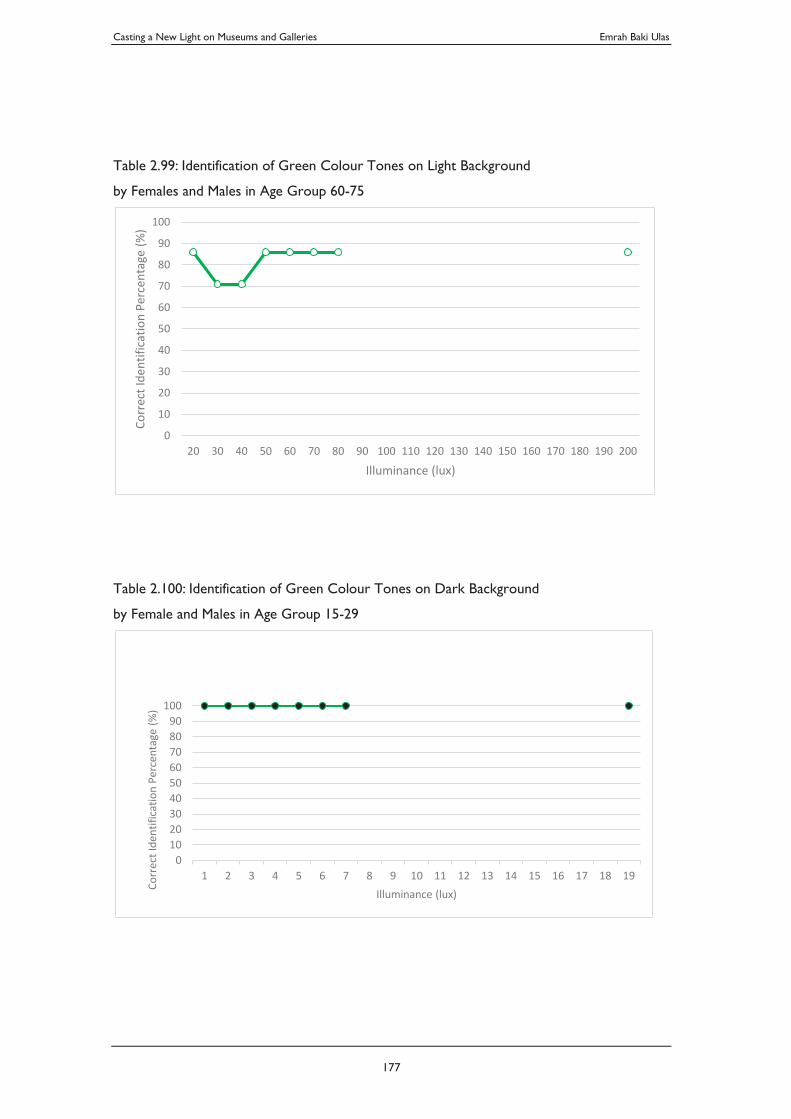
Casting a New Light on Museums and Galleries Emrah Baki Ulas
177
Table 2.99: Identification of Green Colour Tones on Light Background
by Females and Males in Age Group 60-75
Table 2.100: Identification of Green Colour Tones on Dark Background
by Female and Males in Age Group 15-29
0
10
20
30
40
50
60
70
80
90
100
20 30 40 50 60 70 80 90 100 110 120 130 140 150 160 170 180 190 200
Corr
ect I
dent
ifica
tion
Perc
enta
ge (%
)
Illuminance (lux)
0102030405060708090
100
1 2 3 4 5 6 7 8 9 10 11 12 13 14 15 16 17 18 19
Corr
ect I
dent
ifica
tion
Perc
enta
ge (%
)
Illuminance (lux)
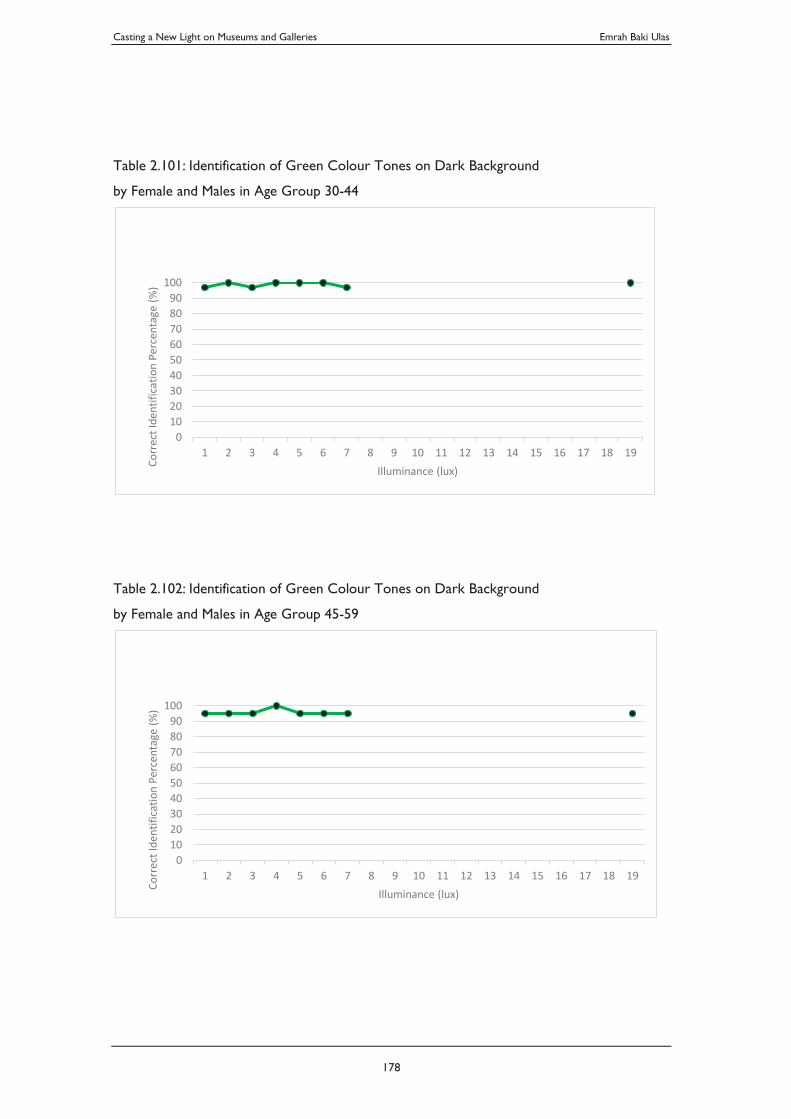
Casting a New Light on Museums and Galleries Emrah Baki Ulas
178
Table 2.101: Identification of Green Colour Tones on Dark Background
by Female and Males in Age Group 30-44
Table 2.102: Identification of Green Colour Tones on Dark Background
by Female and Males in Age Group 45-59
0102030405060708090
100
1 2 3 4 5 6 7 8 9 10 11 12 13 14 15 16 17 18 19
Corr
ect I
dent
ifica
tion
Perc
enta
ge (%
)
Illuminance (lux)
0102030405060708090
100
1 2 3 4 5 6 7 8 9 10 11 12 13 14 15 16 17 18 19
Corr
ect I
dent
ifica
tion
Perc
enta
ge (%
)
Illuminance (lux)
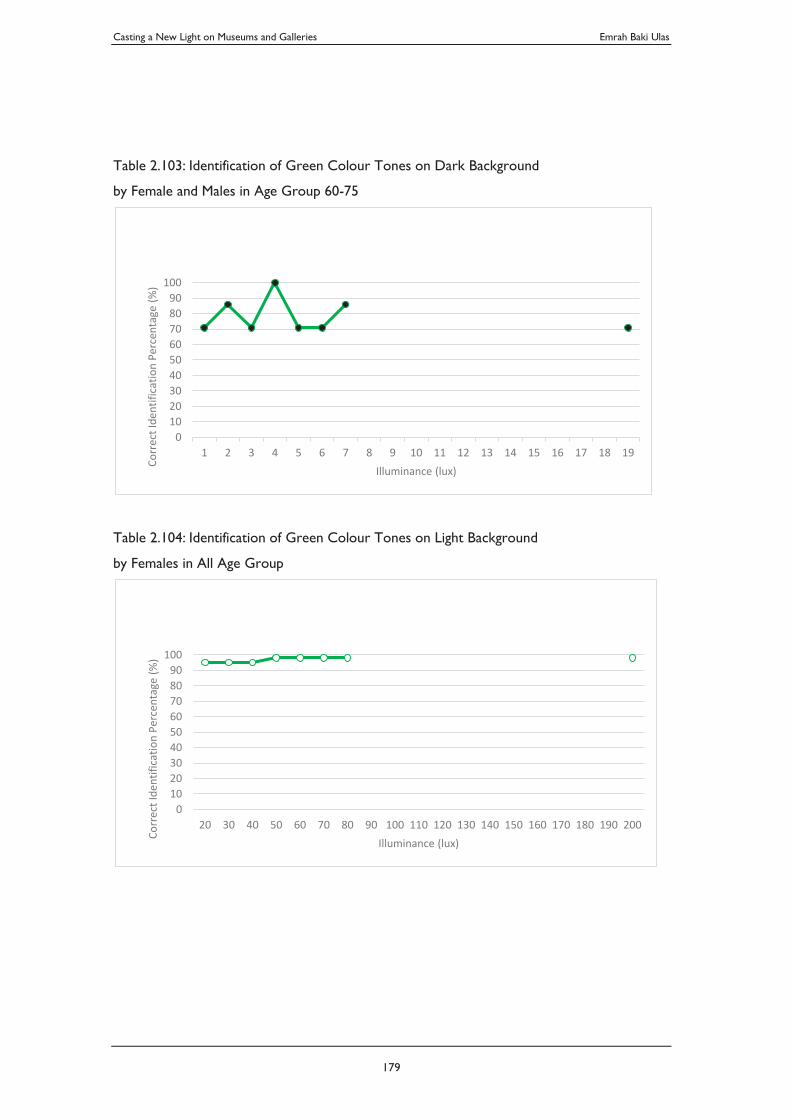
Casting a New Light on Museums and Galleries Emrah Baki Ulas
179
Table 2.103: Identification of Green Colour Tones on Dark Background
by Female and Males in Age Group 60-75
Table 2.104: Identification of Green Colour Tones on Light Background
by Females in All Age Group
0102030405060708090
100
1 2 3 4 5 6 7 8 9 10 11 12 13 14 15 16 17 18 19
Corr
ect I
dent
ifica
tion
Perc
enta
ge (%
)
Illuminance (lux)
0102030405060708090
100
20 30 40 50 60 70 80 90 100 110 120 130 140 150 160 170 180 190 200
Corr
ect I
dent
ifica
tion
Perc
enta
ge (%
)
Illuminance (lux)
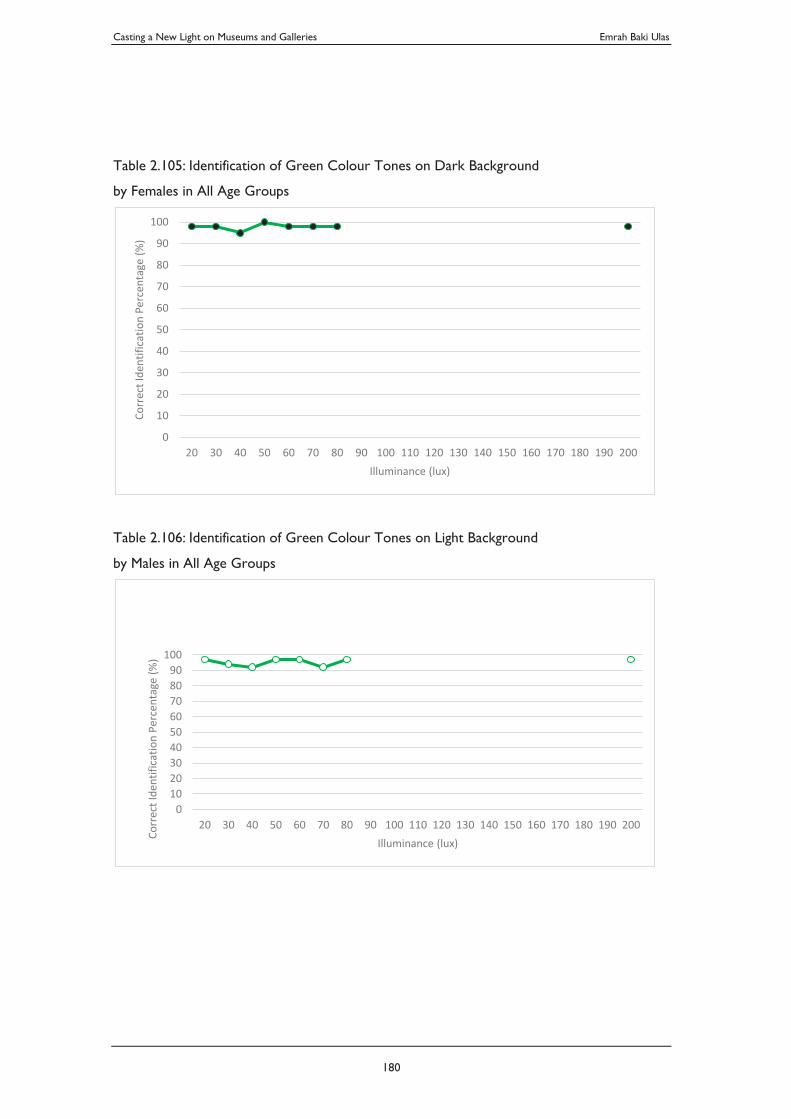
Casting a New Light on Museums and Galleries Emrah Baki Ulas
180
Table 2.105: Identification of Green Colour Tones on Dark Background
by Females in All Age Groups
Table 2.106: Identification of Green Colour Tones on Light Background
by Males in All Age Groups
0
10
20
30
40
50
60
70
80
90
100
20 30 40 50 60 70 80 90 100 110 120 130 140 150 160 170 180 190 200
Corr
ect I
dent
ifica
tion
Perc
enta
ge (%
)
Illuminance (lux)
0102030405060708090
100
20 30 40 50 60 70 80 90 100 110 120 130 140 150 160 170 180 190 200
Corr
ect I
dent
ifica
tion
Perc
enta
ge (%
)
Illuminance (lux)
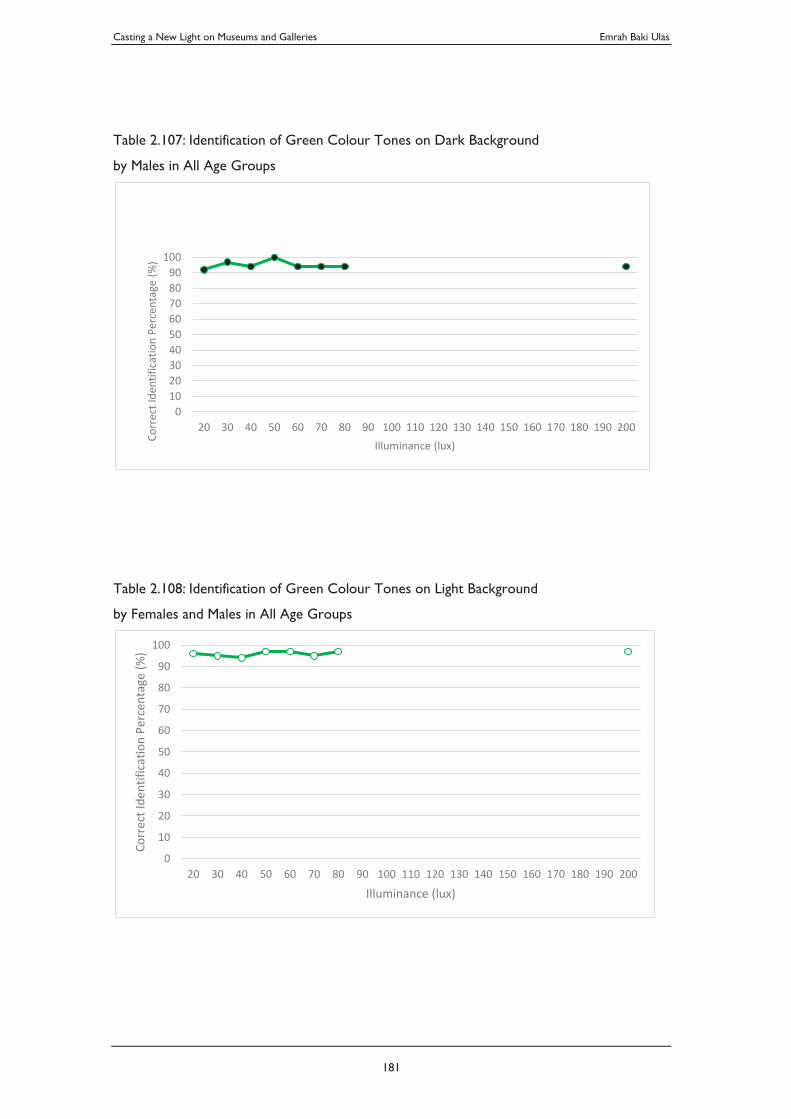
Casting a New Light on Museums and Galleries Emrah Baki Ulas
181
Table 2.107: Identification of Green Colour Tones on Dark Background
by Males in All Age Groups
Table 2.108: Identification of Green Colour Tones on Light Background
by Females and Males in All Age Groups
0102030405060708090
100
20 30 40 50 60 70 80 90 100 110 120 130 140 150 160 170 180 190 200
Corr
ect I
dent
ifica
tion
Perc
enta
ge (%
)
Illuminance (lux)
0
10
20
30
40
50
60
70
80
90
100
20 30 40 50 60 70 80 90 100 110 120 130 140 150 160 170 180 190 200
Corr
ect I
dent
ifica
tion
Perc
enta
ge (%
)
Illuminance (lux)
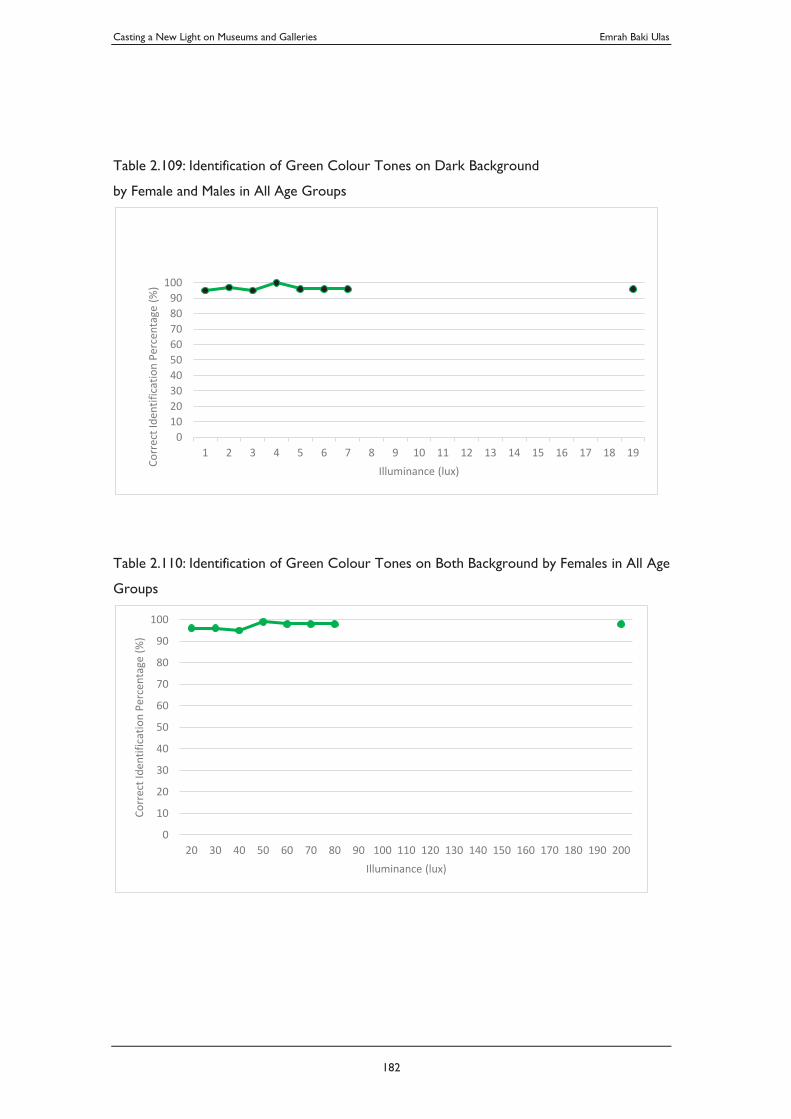
Casting a New Light on Museums and Galleries Emrah Baki Ulas
182
Table 2.109: Identification of Green Colour Tones on Dark Background
by Female and Males in All Age Groups
Table 2.110: Identification of Green Colour Tones on Both Background by Females in All Age
Groups
0102030405060708090
100
1 2 3 4 5 6 7 8 9 10 11 12 13 14 15 16 17 18 19
Corr
ect I
dent
ifica
tion
Perc
enta
ge (%
)
Illuminance (lux)
0
10
20
30
40
50
60
70
80
90
100
20 30 40 50 60 70 80 90 100 110 120 130 140 150 160 170 180 190 200
Corr
ect I
dent
ifica
tion
Perc
enta
ge (%
)
Illuminance (lux)
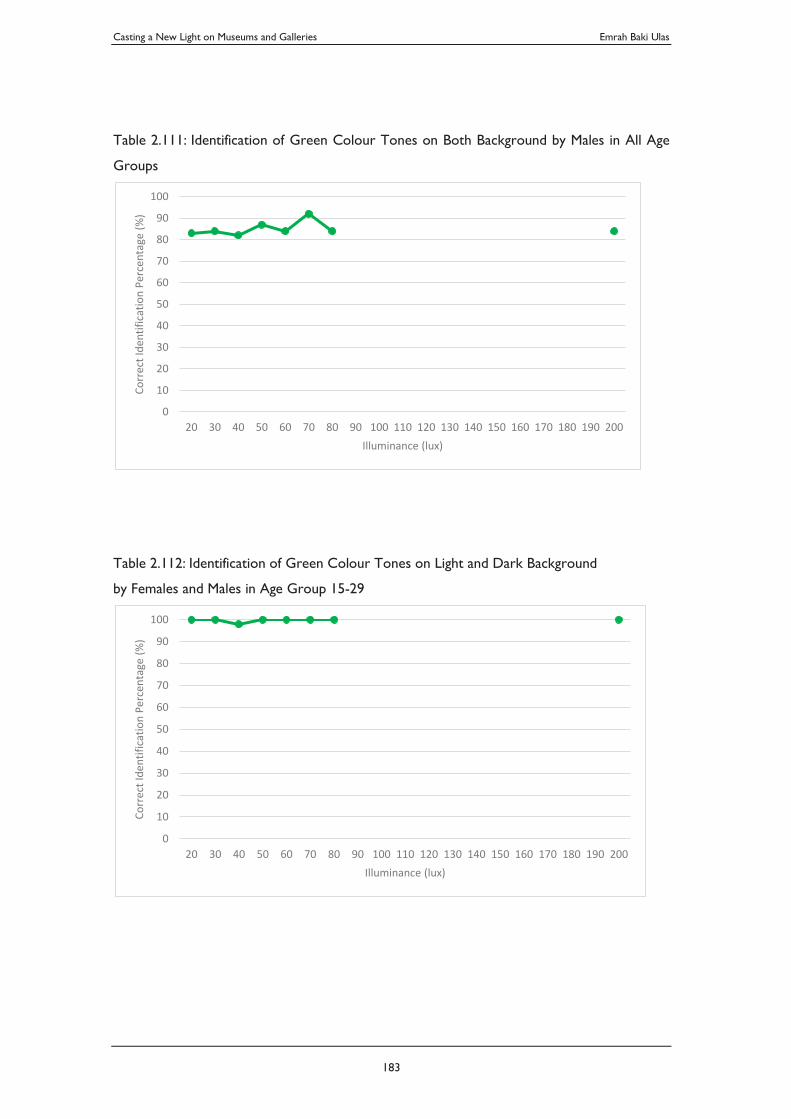
Casting a New Light on Museums and Galleries Emrah Baki Ulas
183
Table 2.111: Identification of Green Colour Tones on Both Background by Males in All Age
Groups
Table 2.112: Identification of Green Colour Tones on Light and Dark Background
by Females and Males in Age Group 15-29
0
10
20
30
40
50
60
70
80
90
100
20 30 40 50 60 70 80 90 100 110 120 130 140 150 160 170 180 190 200
Corr
ect I
dent
ifica
tion
Perc
enta
ge (%
)
Illuminance (lux)
0
10
20
30
40
50
60
70
80
90
100
20 30 40 50 60 70 80 90 100 110 120 130 140 150 160 170 180 190 200
Corr
ect I
dent
ifica
tion
Perc
enta
ge (%
)
Illuminance (lux)
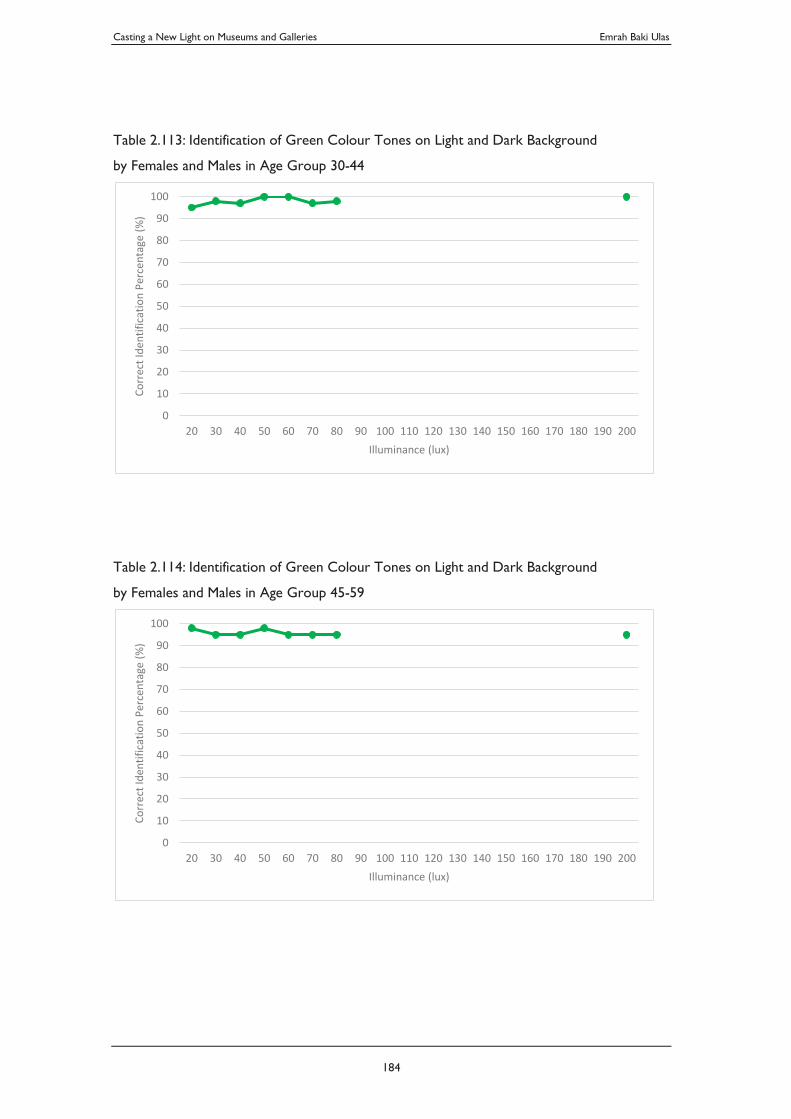
Casting a New Light on Museums and Galleries Emrah Baki Ulas
184
Table 2.113: Identification of Green Colour Tones on Light and Dark Background
by Females and Males in Age Group 30-44
Table 2.114: Identification of Green Colour Tones on Light and Dark Background
by Females and Males in Age Group 45-59
0
10
20
30
40
50
60
70
80
90
100
20 30 40 50 60 70 80 90 100 110 120 130 140 150 160 170 180 190 200
Corr
ect I
dent
ifica
tion
Perc
enta
ge (%
)
Illuminance (lux)
0
10
20
30
40
50
60
70
80
90
100
20 30 40 50 60 70 80 90 100 110 120 130 140 150 160 170 180 190 200
Corr
ect I
dent
ifica
tion
Perc
enta
ge (%
)
Illuminance (lux)
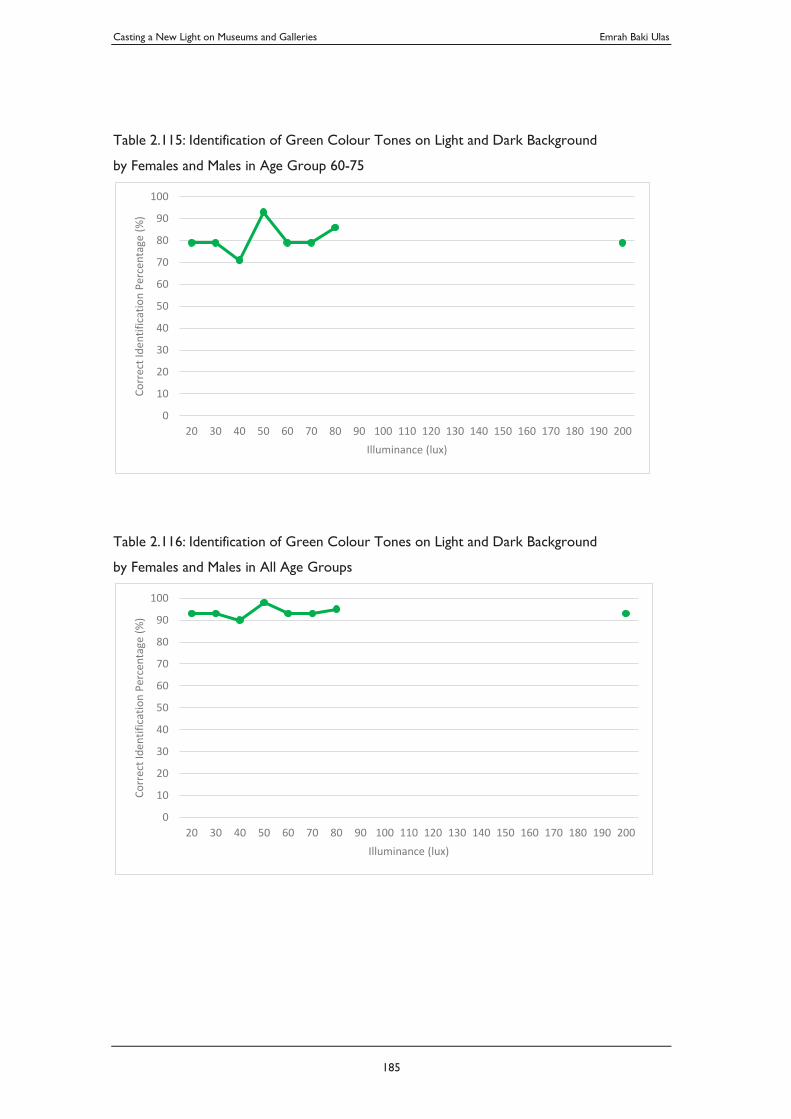
Casting a New Light on Museums and Galleries Emrah Baki Ulas
185
Table 2.115: Identification of Green Colour Tones on Light and Dark Background
by Females and Males in Age Group 60-75
Table 2.116: Identification of Green Colour Tones on Light and Dark Background
by Females and Males in All Age Groups
0
10
20
30
40
50
60
70
80
90
100
20 30 40 50 60 70 80 90 100 110 120 130 140 150 160 170 180 190 200
Corr
ect I
dent
ifica
tion
Perc
enta
ge (%
)
Illuminance (lux)
0
10
20
30
40
50
60
70
80
90
100
20 30 40 50 60 70 80 90 100 110 120 130 140 150 160 170 180 190 200
Corr
ect I
dent
ifica
tion
Perc
enta
ge (%
)
Illuminance (lux)
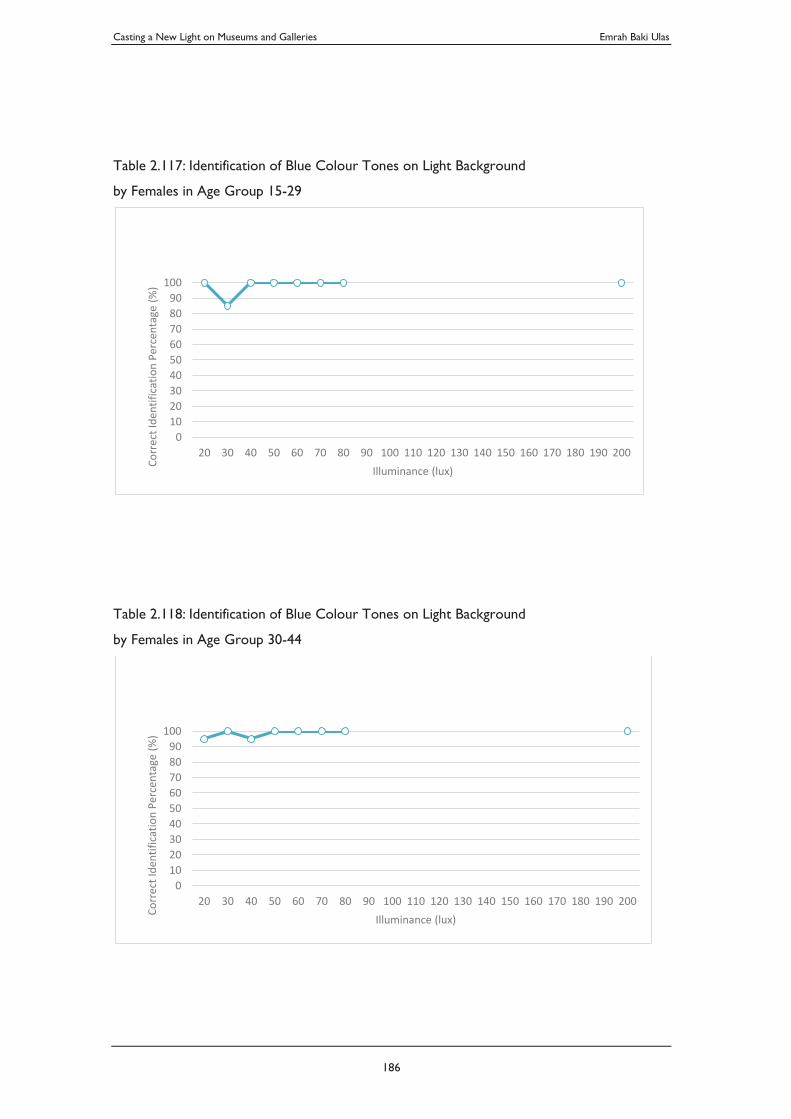
Casting a New Light on Museums and Galleries Emrah Baki Ulas
186
Table 2.117: Identification of Blue Colour Tones on Light Background
by Females in Age Group 15-29
Table 2.118: Identification of Blue Colour Tones on Light Background
by Females in Age Group 30-44
0102030405060708090
100
20 30 40 50 60 70 80 90 100 110 120 130 140 150 160 170 180 190 200
Corr
ect I
dent
ifica
tion
Perc
enta
ge (%
)
Illuminance (lux)
0102030405060708090
100
20 30 40 50 60 70 80 90 100 110 120 130 140 150 160 170 180 190 200
Corr
ect I
dent
ifica
tion
Perc
enta
ge (%
)
Illuminance (lux)
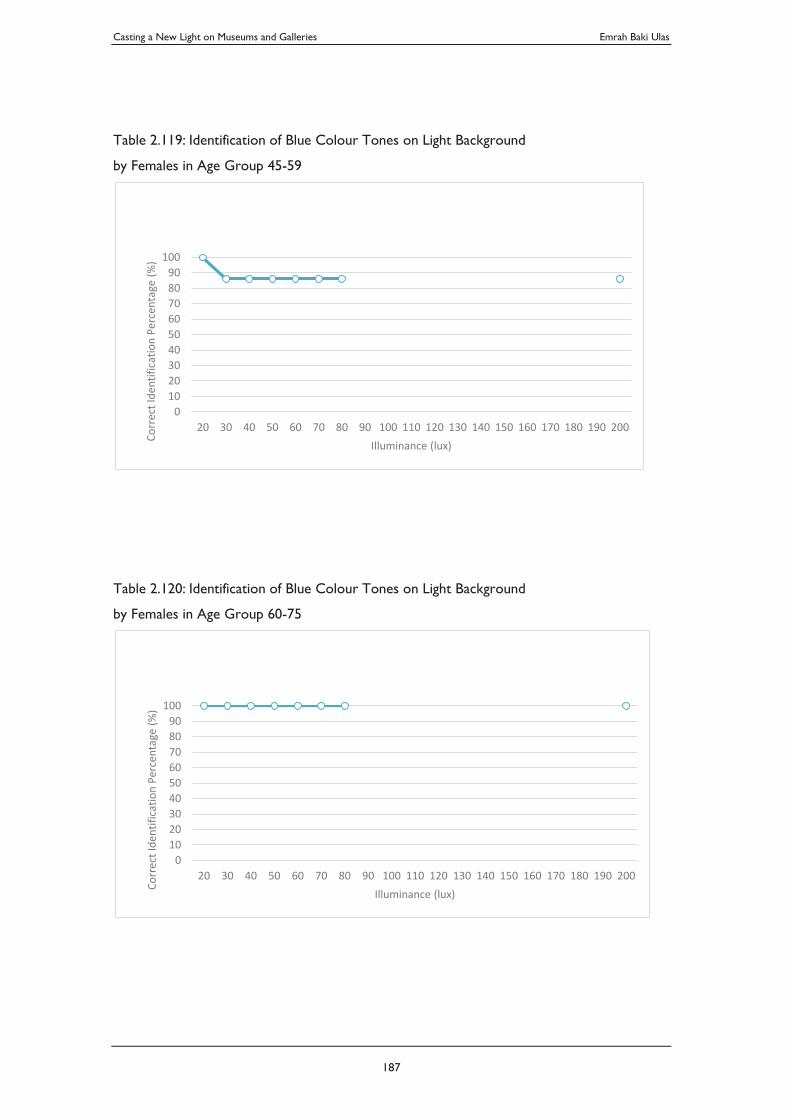
Casting a New Light on Museums and Galleries Emrah Baki Ulas
187
Table 2.119: Identification of Blue Colour Tones on Light Background
by Females in Age Group 45-59
Table 2.120: Identification of Blue Colour Tones on Light Background
by Females in Age Group 60-75
0102030405060708090
100
20 30 40 50 60 70 80 90 100 110 120 130 140 150 160 170 180 190 200
Corr
ect I
dent
ifica
tion
Perc
enta
ge (%
)
Illuminance (lux)
0102030405060708090
100
20 30 40 50 60 70 80 90 100 110 120 130 140 150 160 170 180 190 200
Corr
ect I
dent
ifica
tion
Perc
enta
ge (%
)
Illuminance (lux)
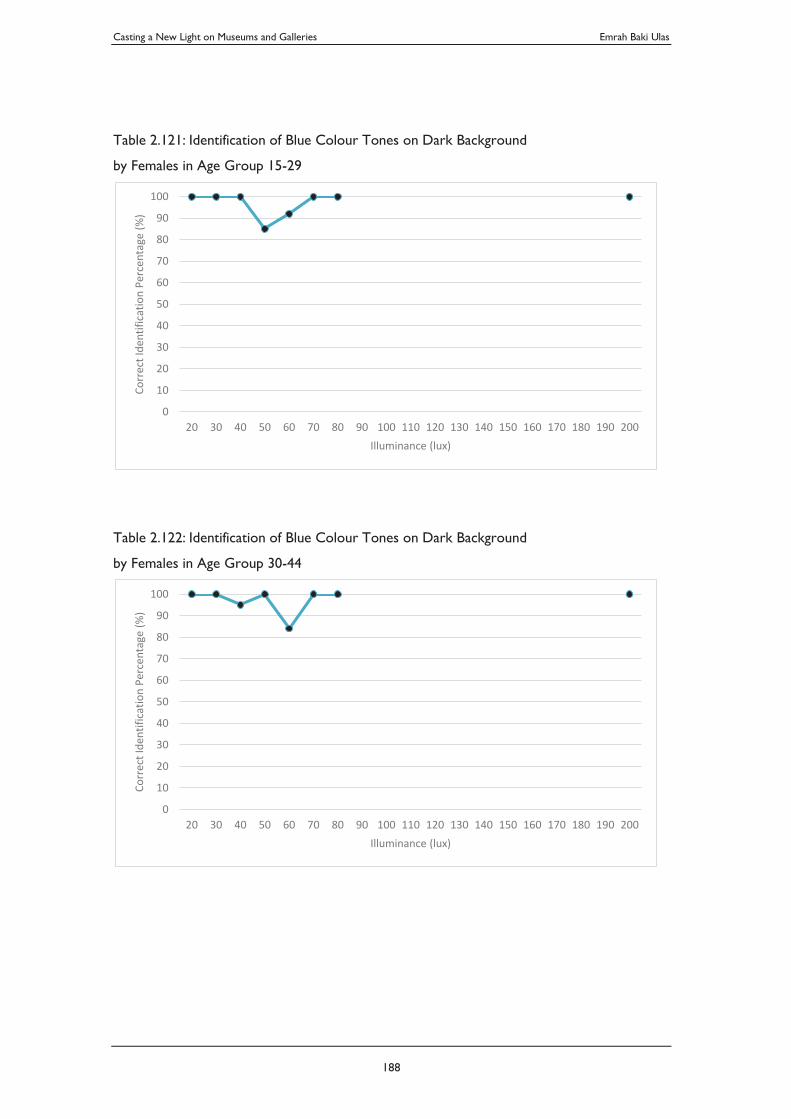
Casting a New Light on Museums and Galleries Emrah Baki Ulas
188
Table 2.121: Identification of Blue Colour Tones on Dark Background
by Females in Age Group 15-29
Table 2.122: Identification of Blue Colour Tones on Dark Background
by Females in Age Group 30-44
0
10
20
30
40
50
60
70
80
90
100
20 30 40 50 60 70 80 90 100 110 120 130 140 150 160 170 180 190 200
Corr
ect I
dent
ifica
tion
Perc
enta
ge (%
)
Illuminance (lux)
0
10
20
30
40
50
60
70
80
90
100
20 30 40 50 60 70 80 90 100 110 120 130 140 150 160 170 180 190 200
Corr
ect I
dent
ifica
tion
Perc
enta
ge (%
)
Illuminance (lux)
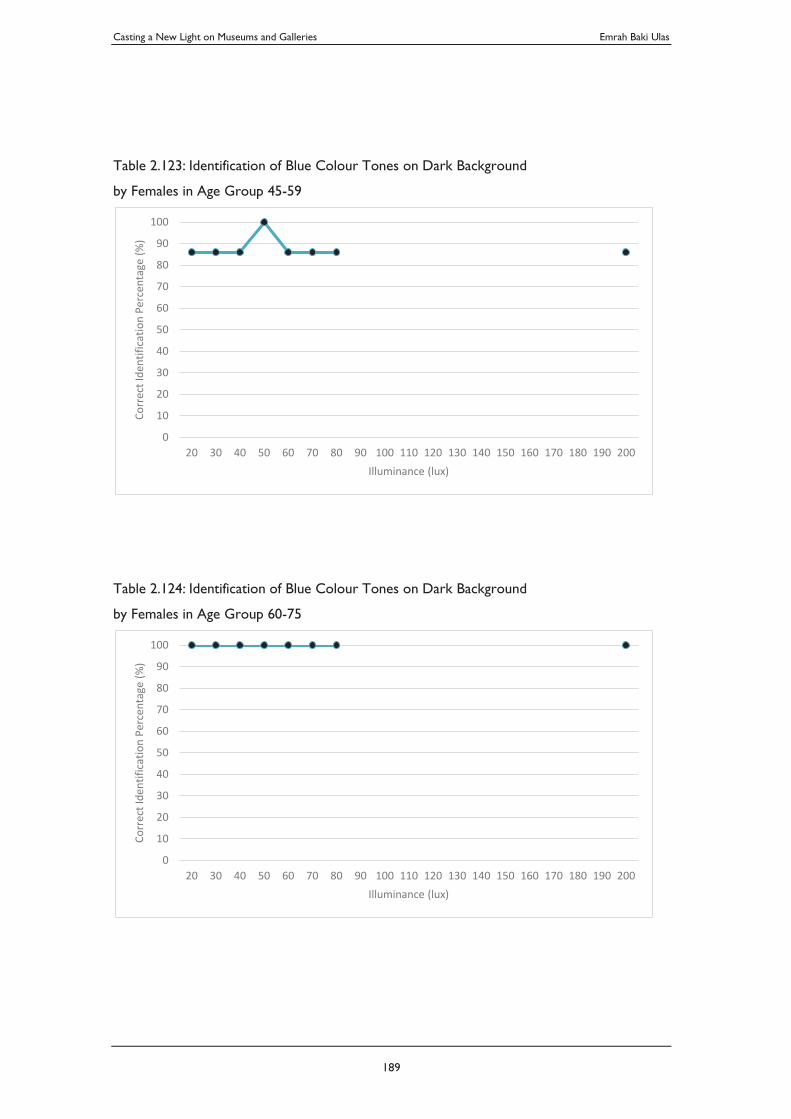
Casting a New Light on Museums and Galleries Emrah Baki Ulas
189
Table 2.123: Identification of Blue Colour Tones on Dark Background
by Females in Age Group 45-59
Table 2.124: Identification of Blue Colour Tones on Dark Background
by Females in Age Group 60-75
0
10
20
30
40
50
60
70
80
90
100
20 30 40 50 60 70 80 90 100 110 120 130 140 150 160 170 180 190 200
Corr
ect I
dent
ifica
tion
Perc
enta
ge (%
)
Illuminance (lux)
0
10
20
30
40
50
60
70
80
90
100
20 30 40 50 60 70 80 90 100 110 120 130 140 150 160 170 180 190 200
Corr
ect I
dent
ifica
tion
Perc
enta
ge (%
)
Illuminance (lux)
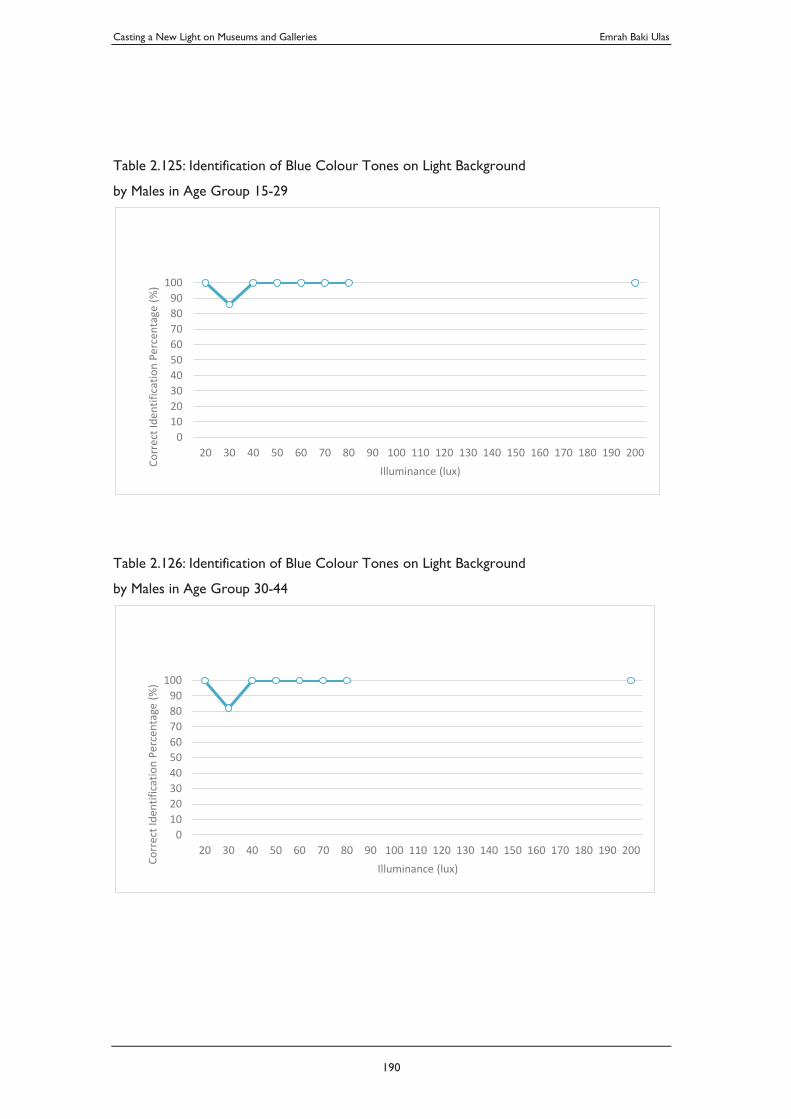
Casting a New Light on Museums and Galleries Emrah Baki Ulas
190
Table 2.125: Identification of Blue Colour Tones on Light Background
by Males in Age Group 15-29
Table 2.126: Identification of Blue Colour Tones on Light Background
by Males in Age Group 30-44
0102030405060708090
100
20 30 40 50 60 70 80 90 100 110 120 130 140 150 160 170 180 190 200
Corr
ect I
dent
ifica
tion
Perc
enta
ge (%
)
Illuminance (lux)
0102030405060708090
100
20 30 40 50 60 70 80 90 100 110 120 130 140 150 160 170 180 190 200
Corr
ect I
dent
ifica
tion
Perc
enta
ge (%
)
Illuminance (lux)
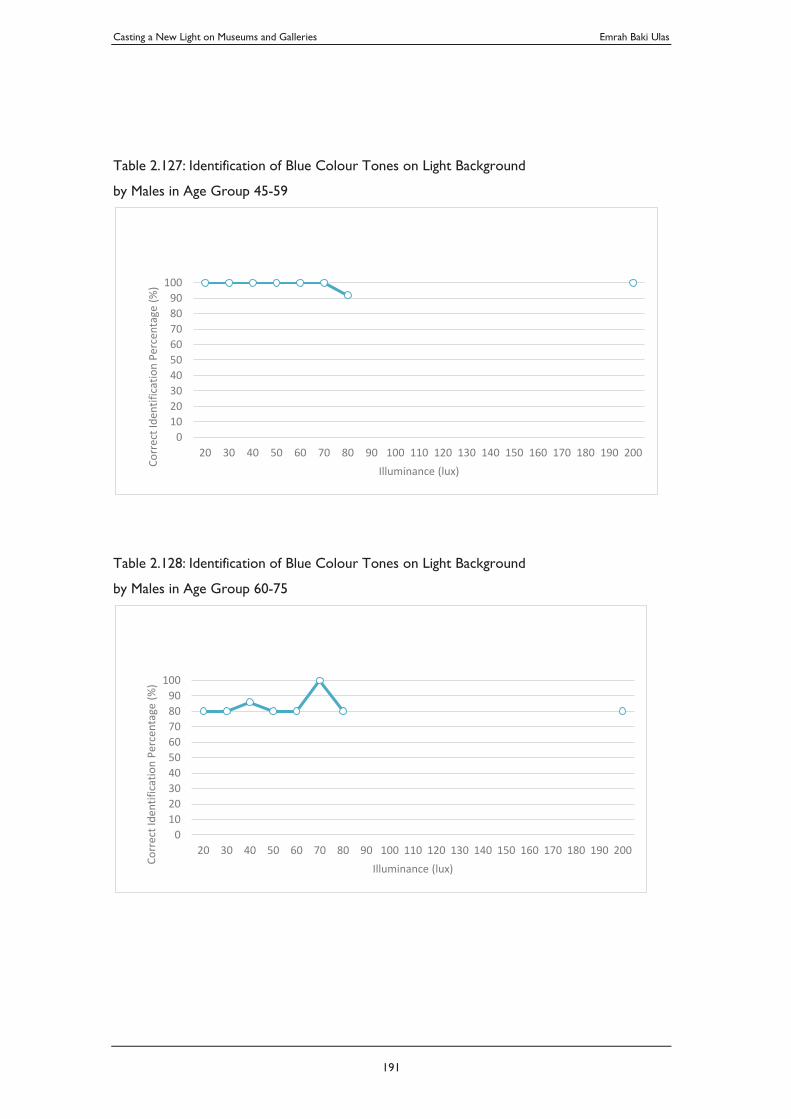
Casting a New Light on Museums and Galleries Emrah Baki Ulas
191
Table 2.127: Identification of Blue Colour Tones on Light Background
by Males in Age Group 45-59
Table 2.128: Identification of Blue Colour Tones on Light Background
by Males in Age Group 60-75
0102030405060708090
100
20 30 40 50 60 70 80 90 100 110 120 130 140 150 160 170 180 190 200
Corr
ect I
dent
ifica
tion
Perc
enta
ge (%
)
Illuminance (lux)
0102030405060708090
100
20 30 40 50 60 70 80 90 100 110 120 130 140 150 160 170 180 190 200
Corr
ect I
dent
ifica
tion
Perc
enta
ge (%
)
Illuminance (lux)
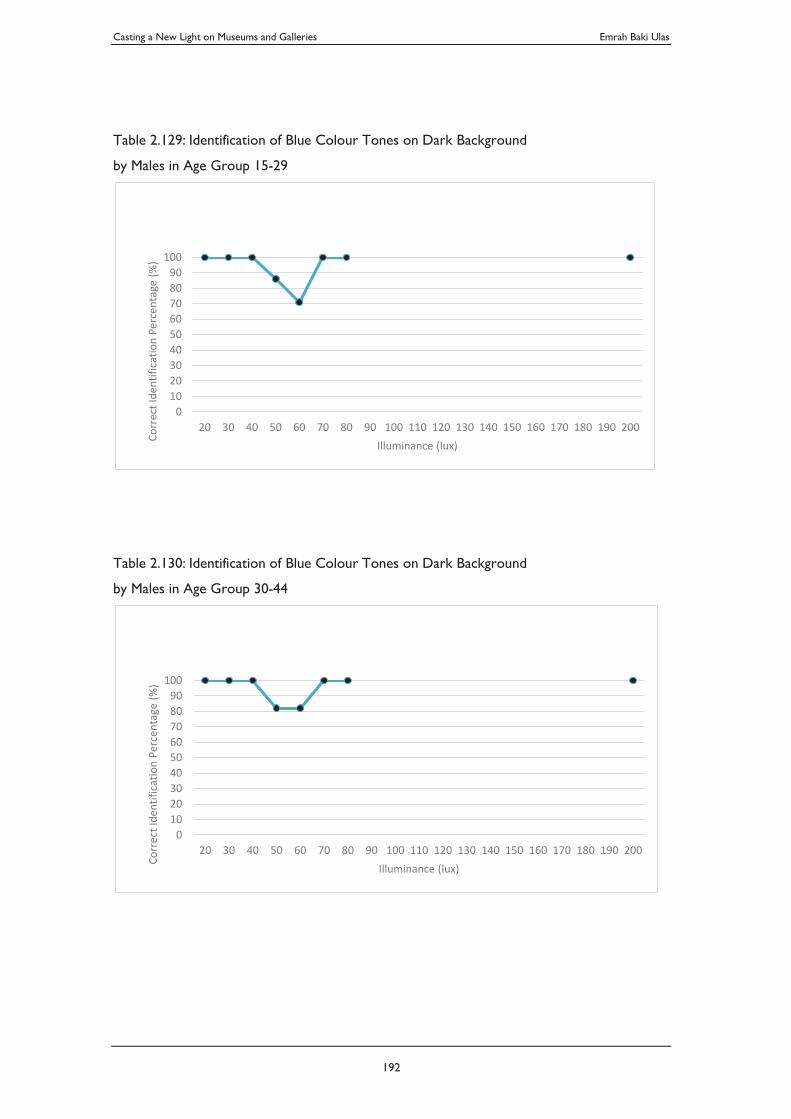
Casting a New Light on Museums and Galleries Emrah Baki Ulas
192
Table 2.129: Identification of Blue Colour Tones on Dark Background
by Males in Age Group 15-29
Table 2.130: Identification of Blue Colour Tones on Dark Background
by Males in Age Group 30-44
0102030405060708090
100
20 30 40 50 60 70 80 90 100 110 120 130 140 150 160 170 180 190 200
Corr
ect I
dent
ifica
tion
Perc
enta
ge (%
)
Illuminance (lux)
0102030405060708090
100
20 30 40 50 60 70 80 90 100 110 120 130 140 150 160 170 180 190 200
Corr
ect I
dent
ifica
tion
Perc
enta
ge (%
)
Illuminance (lux)
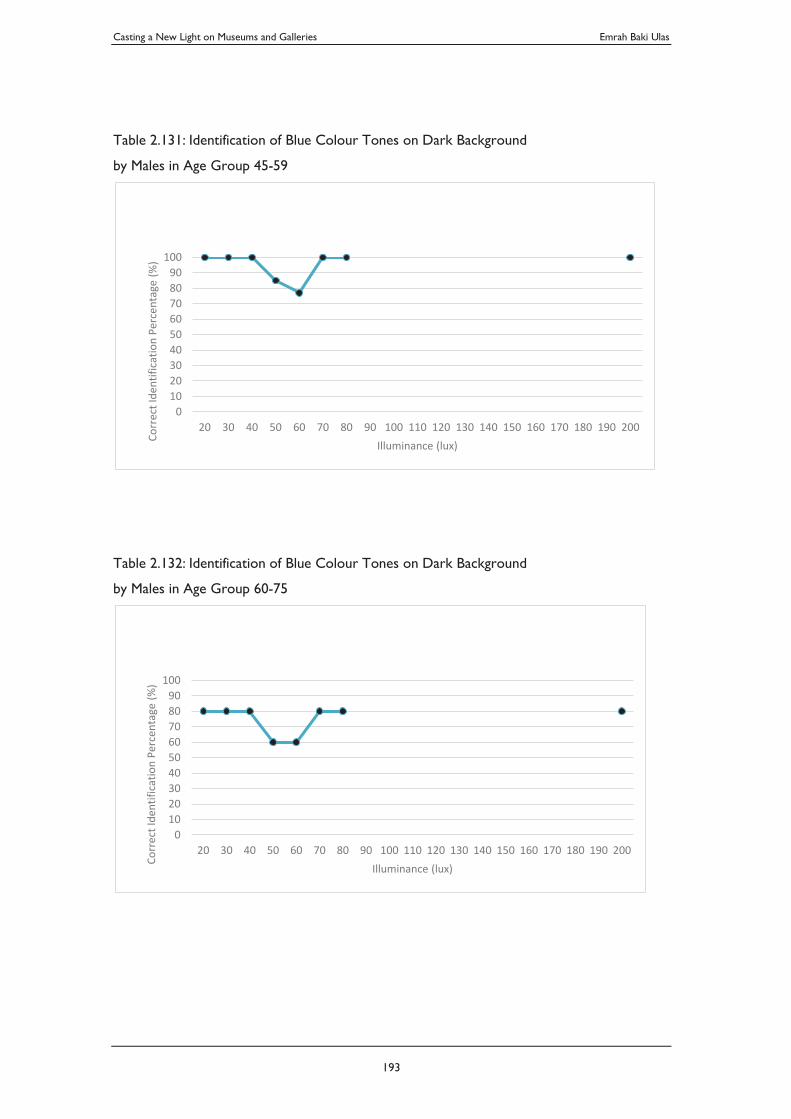
Casting a New Light on Museums and Galleries Emrah Baki Ulas
193
Table 2.131: Identification of Blue Colour Tones on Dark Background
by Males in Age Group 45-59
Table 2.132: Identification of Blue Colour Tones on Dark Background
by Males in Age Group 60-75
0102030405060708090
100
20 30 40 50 60 70 80 90 100 110 120 130 140 150 160 170 180 190 200
Corr
ect I
dent
ifica
tion
Perc
enta
ge (%
)
Illuminance (lux)
0102030405060708090
100
20 30 40 50 60 70 80 90 100 110 120 130 140 150 160 170 180 190 200
Corr
ect I
dent
ifica
tion
Perc
enta
ge (%
)
Illuminance (lux)
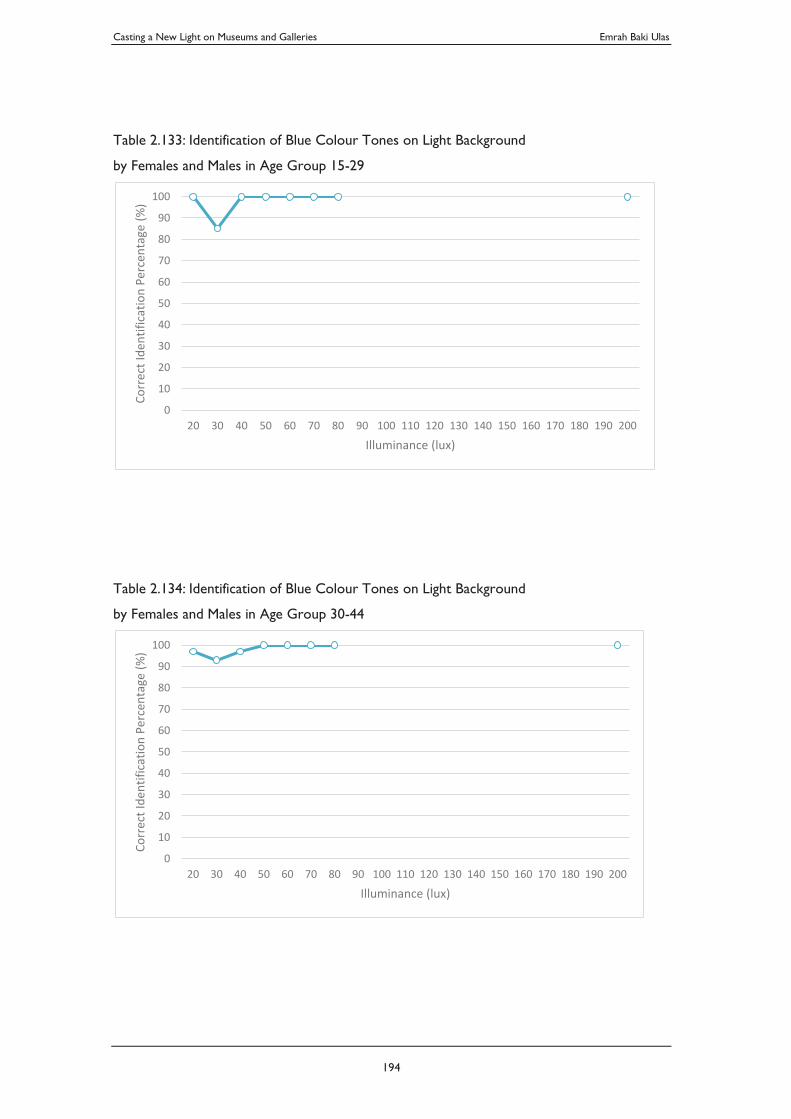
Casting a New Light on Museums and Galleries Emrah Baki Ulas
194
Table 2.133: Identification of Blue Colour Tones on Light Background
by Females and Males in Age Group 15-29
Table 2.134: Identification of Blue Colour Tones on Light Background
by Females and Males in Age Group 30-44
0
10
20
30
40
50
60
70
80
90
100
20 30 40 50 60 70 80 90 100 110 120 130 140 150 160 170 180 190 200
Corr
ect I
dent
ifica
tion
Perc
enta
ge (%
)
Illuminance (lux)
0
10
20
30
40
50
60
70
80
90
100
20 30 40 50 60 70 80 90 100 110 120 130 140 150 160 170 180 190 200
Corr
ect I
dent
ifica
tion
Perc
enta
ge (%
)
Illuminance (lux)
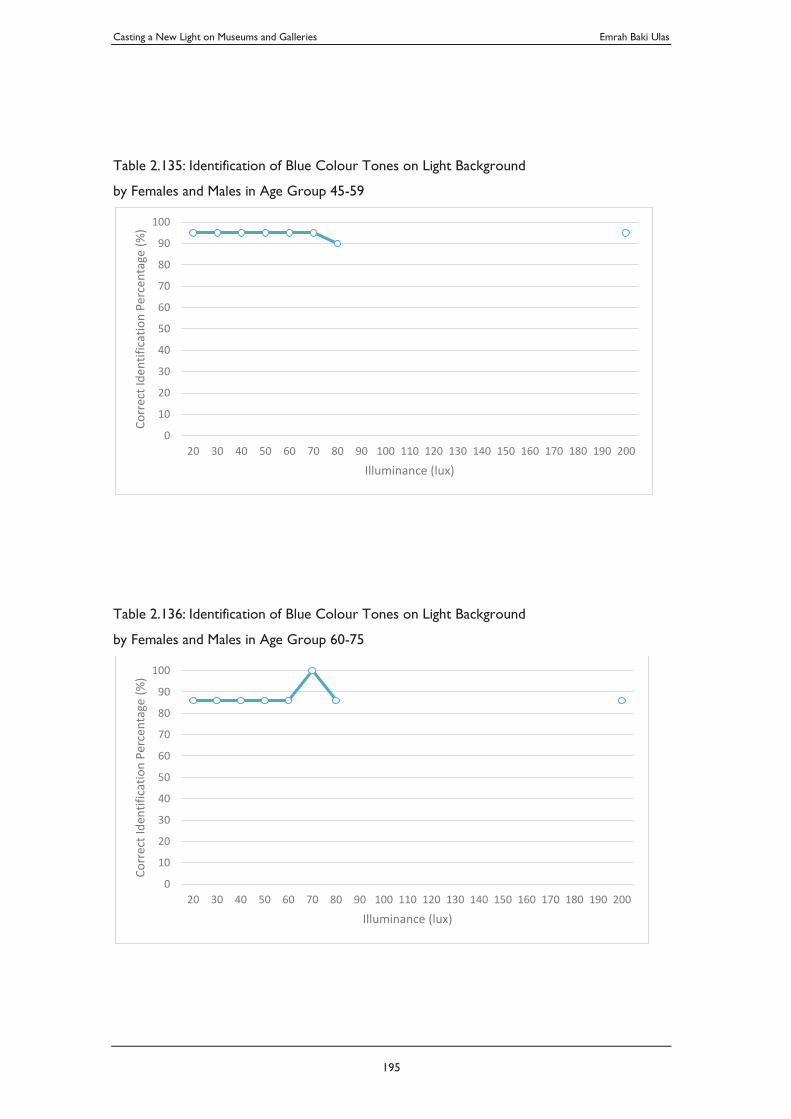
Casting a New Light on Museums and Galleries Emrah Baki Ulas
195
Table 2.135: Identification of Blue Colour Tones on Light Background
by Females and Males in Age Group 45-59
Table 2.136: Identification of Blue Colour Tones on Light Background
by Females and Males in Age Group 60-75
0
10
20
30
40
50
60
70
80
90
100
20 30 40 50 60 70 80 90 100 110 120 130 140 150 160 170 180 190 200
Corr
ect I
dent
ifica
tion
Perc
enta
ge (%
)
Illuminance (lux)
0
10
20
30
40
50
60
70
80
90
100
20 30 40 50 60 70 80 90 100 110 120 130 140 150 160 170 180 190 200
Corr
ect I
dent
ifica
tion
Perc
enta
ge (%
)
Illuminance (lux)
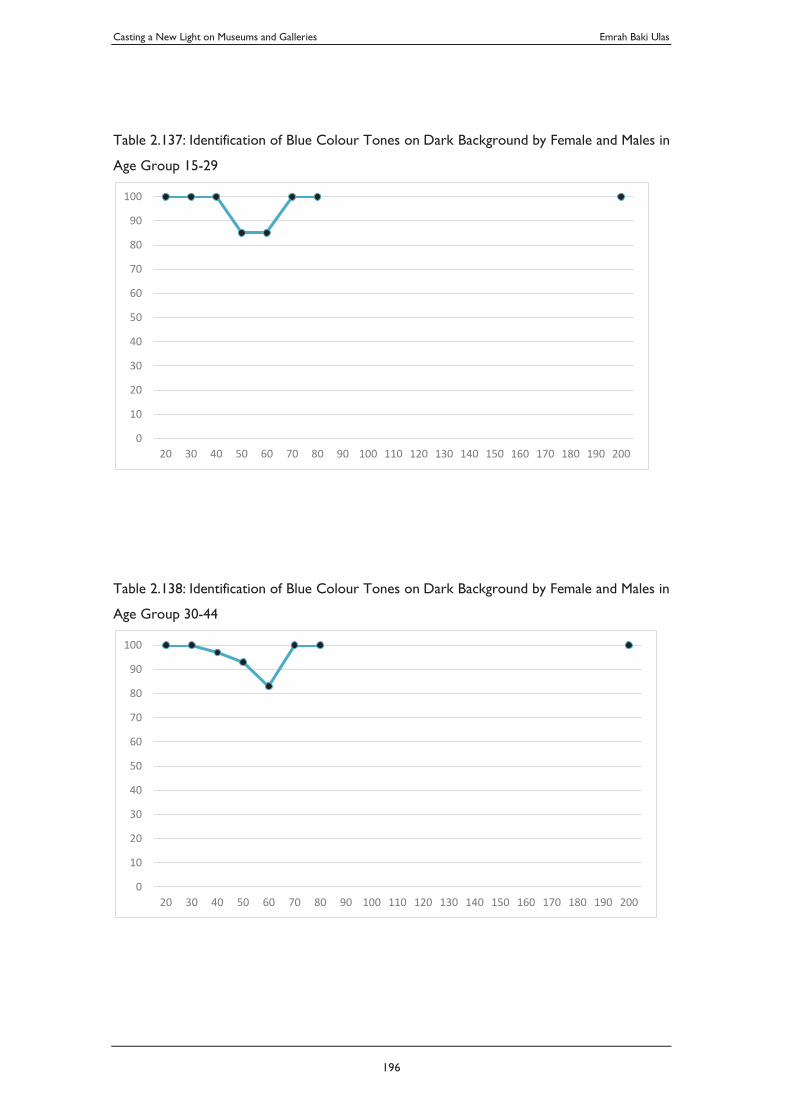
Casting a New Light on Museums and Galleries Emrah Baki Ulas
196
Table 2.137: Identification of Blue Colour Tones on Dark Background by Female and Males in
Age Group 15-29
Table 2.138: Identification of Blue Colour Tones on Dark Background by Female and Males in
Age Group 30-44
0
10
20
30
40
50
60
70
80
90
100
20 30 40 50 60 70 80 90 100 110 120 130 140 150 160 170 180 190 200
0
10
20
30
40
50
60
70
80
90
100
20 30 40 50 60 70 80 90 100 110 120 130 140 150 160 170 180 190 200
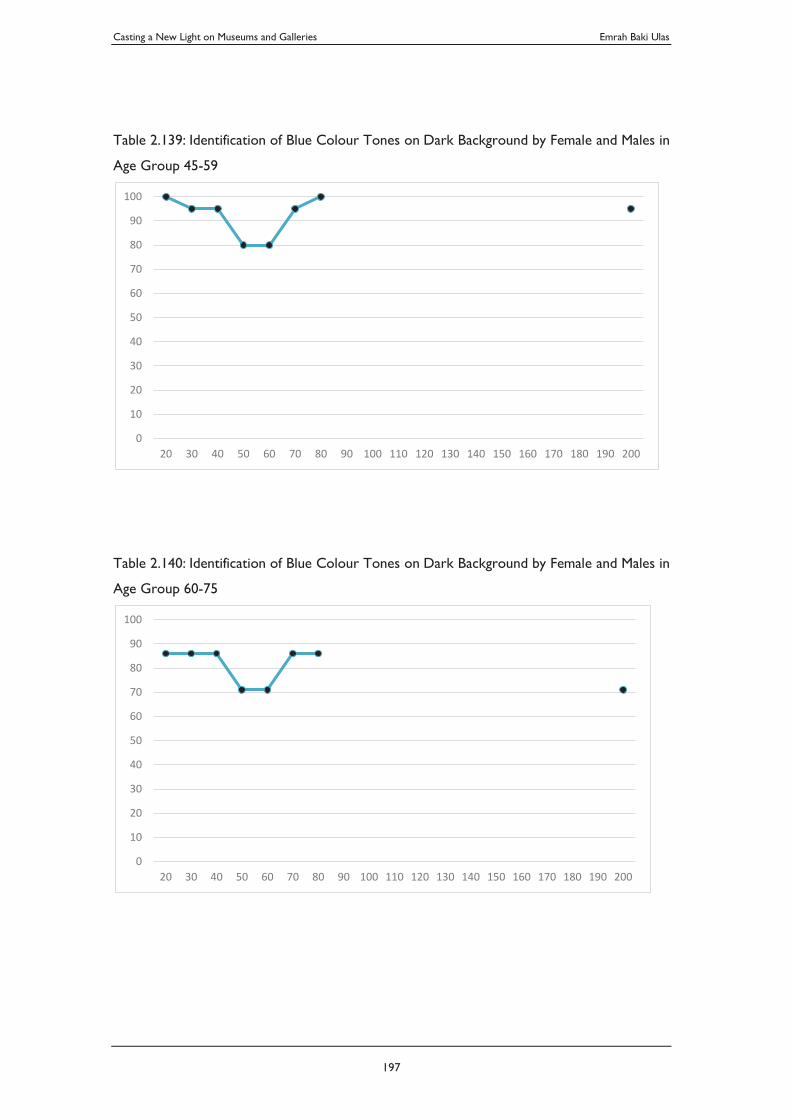
Casting a New Light on Museums and Galleries Emrah Baki Ulas
197
Table 2.139: Identification of Blue Colour Tones on Dark Background by Female and Males in
Age Group 45-59
Table 2.140: Identification of Blue Colour Tones on Dark Background by Female and Males in
Age Group 60-75
0
10
20
30
40
50
60
70
80
90
100
20 30 40 50 60 70 80 90 100 110 120 130 140 150 160 170 180 190 200
0
10
20
30
40
50
60
70
80
90
100
20 30 40 50 60 70 80 90 100 110 120 130 140 150 160 170 180 190 200
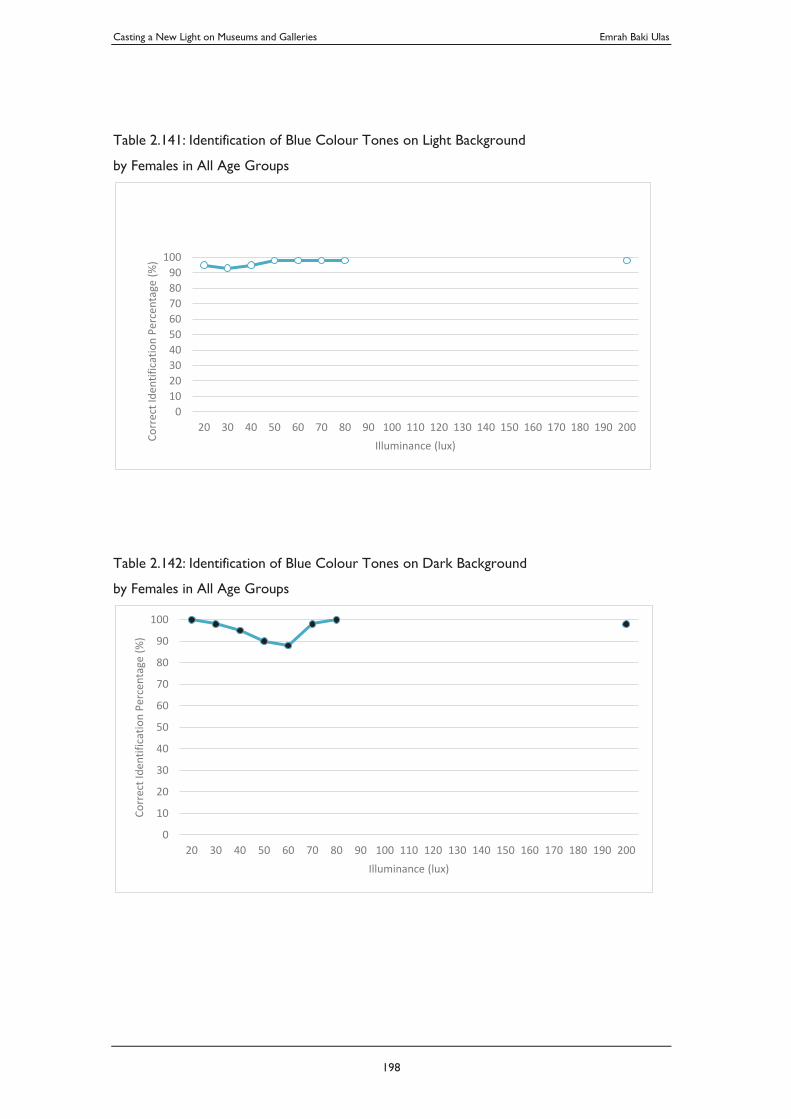
Casting a New Light on Museums and Galleries Emrah Baki Ulas
198
Table 2.141: Identification of Blue Colour Tones on Light Background
by Females in All Age Groups
Table 2.142: Identification of Blue Colour Tones on Dark Background
by Females in All Age Groups
0102030405060708090
100
20 30 40 50 60 70 80 90 100 110 120 130 140 150 160 170 180 190 200
Corr
ect I
dent
ifica
tion
Perc
enta
ge (%
)
Illuminance (lux)
0
10
20
30
40
50
60
70
80
90
100
20 30 40 50 60 70 80 90 100 110 120 130 140 150 160 170 180 190 200
Corr
ect I
dent
ifica
tion
Perc
enta
ge (%
)
Illuminance (lux)
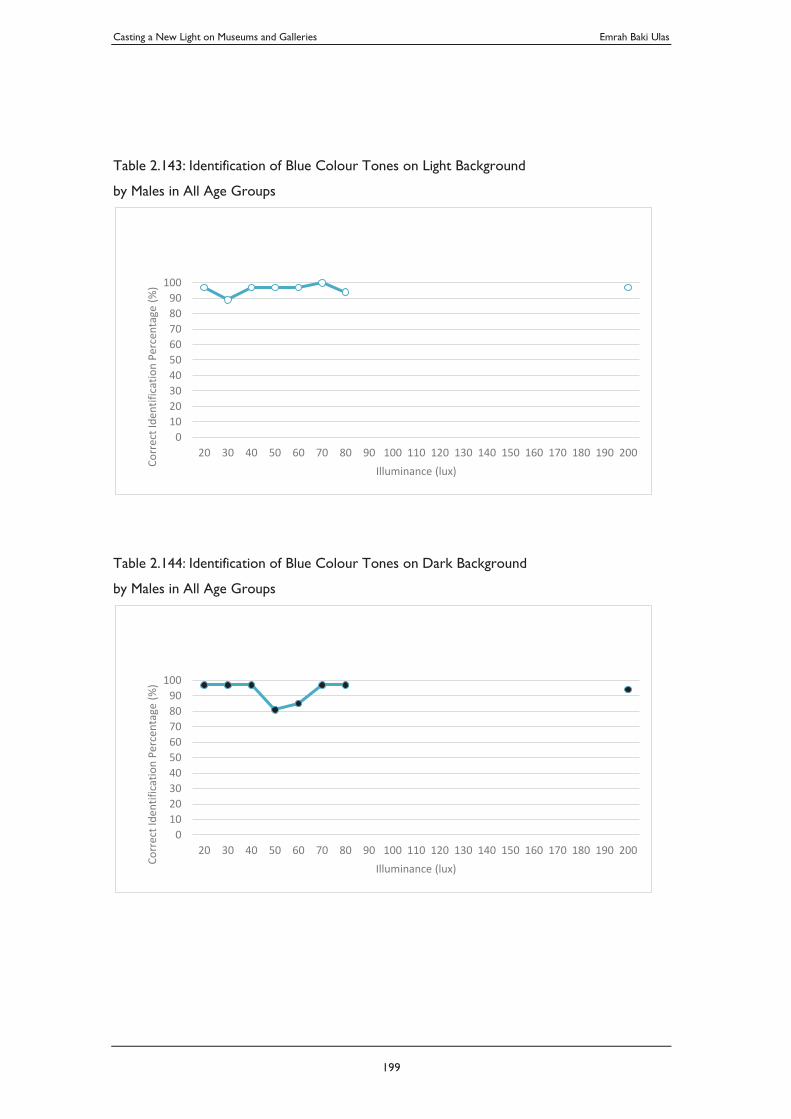
Casting a New Light on Museums and Galleries Emrah Baki Ulas
199
Table 2.143: Identification of Blue Colour Tones on Light Background
by Males in All Age Groups
Table 2.144: Identification of Blue Colour Tones on Dark Background
by Males in All Age Groups
0102030405060708090
100
20 30 40 50 60 70 80 90 100 110 120 130 140 150 160 170 180 190 200
Corr
ect I
dent
ifica
tion
Perc
enta
ge (%
)
Illuminance (lux)
0102030405060708090
100
20 30 40 50 60 70 80 90 100 110 120 130 140 150 160 170 180 190 200
Corr
ect I
dent
ifica
tion
Perc
enta
ge (%
)
Illuminance (lux)
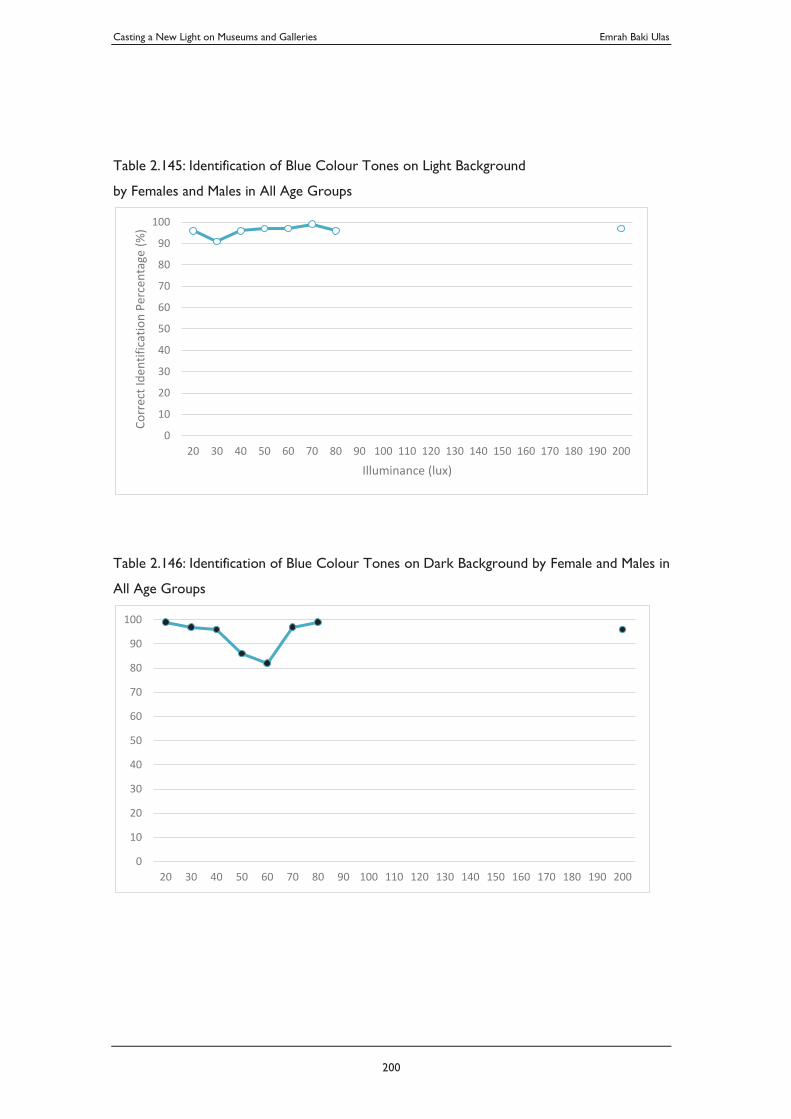
Casting a New Light on Museums and Galleries Emrah Baki Ulas
200
Table 2.145: Identification of Blue Colour Tones on Light Background
by Females and Males in All Age Groups
Table 2.146: Identification of Blue Colour Tones on Dark Background by Female and Males in
All Age Groups
0
10
20
30
40
50
60
70
80
90
100
20 30 40 50 60 70 80 90 100 110 120 130 140 150 160 170 180 190 200
Corr
ect I
dent
ifica
tion
Perc
enta
ge (%
)
Illuminance (lux)
0
10
20
30
40
50
60
70
80
90
100
20 30 40 50 60 70 80 90 100 110 120 130 140 150 160 170 180 190 200
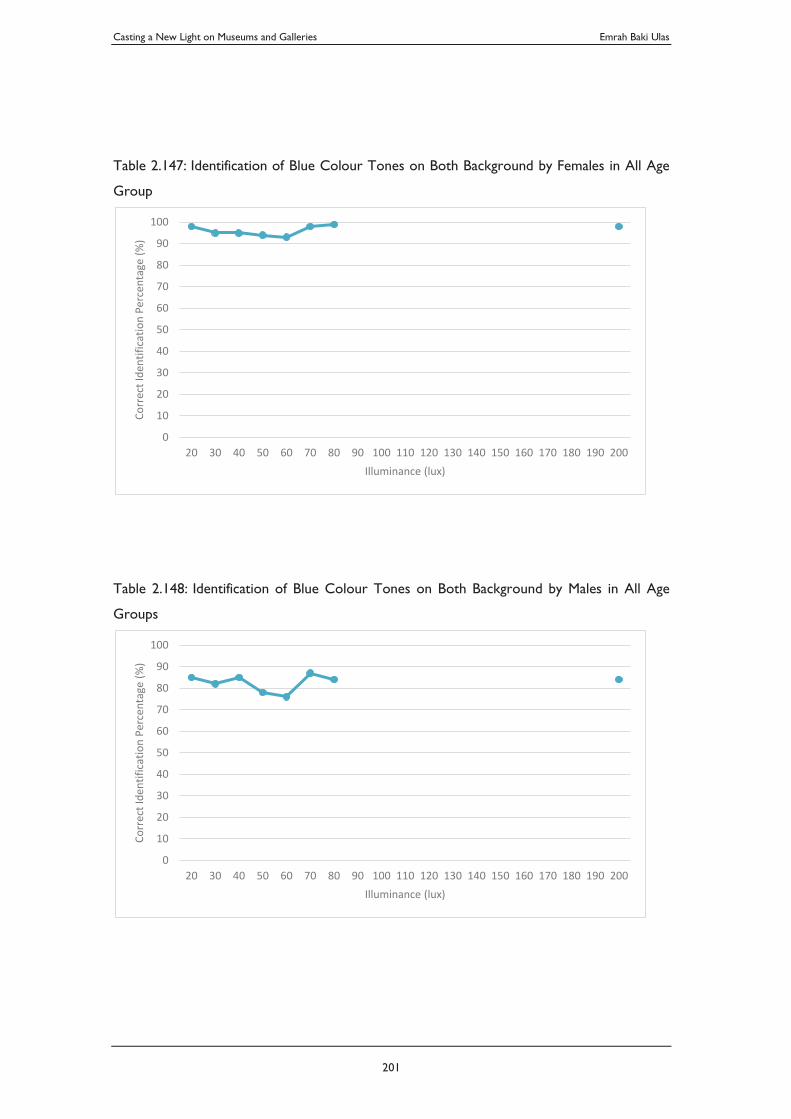
Casting a New Light on Museums and Galleries Emrah Baki Ulas
201
Table 2.147: Identification of Blue Colour Tones on Both Background by Females in All Age
Group
Table 2.148: Identification of Blue Colour Tones on Both Background by Males in All Age
Groups
0
10
20
30
40
50
60
70
80
90
100
20 30 40 50 60 70 80 90 100 110 120 130 140 150 160 170 180 190 200
Corr
ect I
dent
ifica
tion
Perc
enta
ge (%
)
Illuminance (lux)
0
10
20
30
40
50
60
70
80
90
100
20 30 40 50 60 70 80 90 100 110 120 130 140 150 160 170 180 190 200
Corr
ect I
dent
ifica
tion
Perc
enta
ge (%
)
Illuminance (lux)
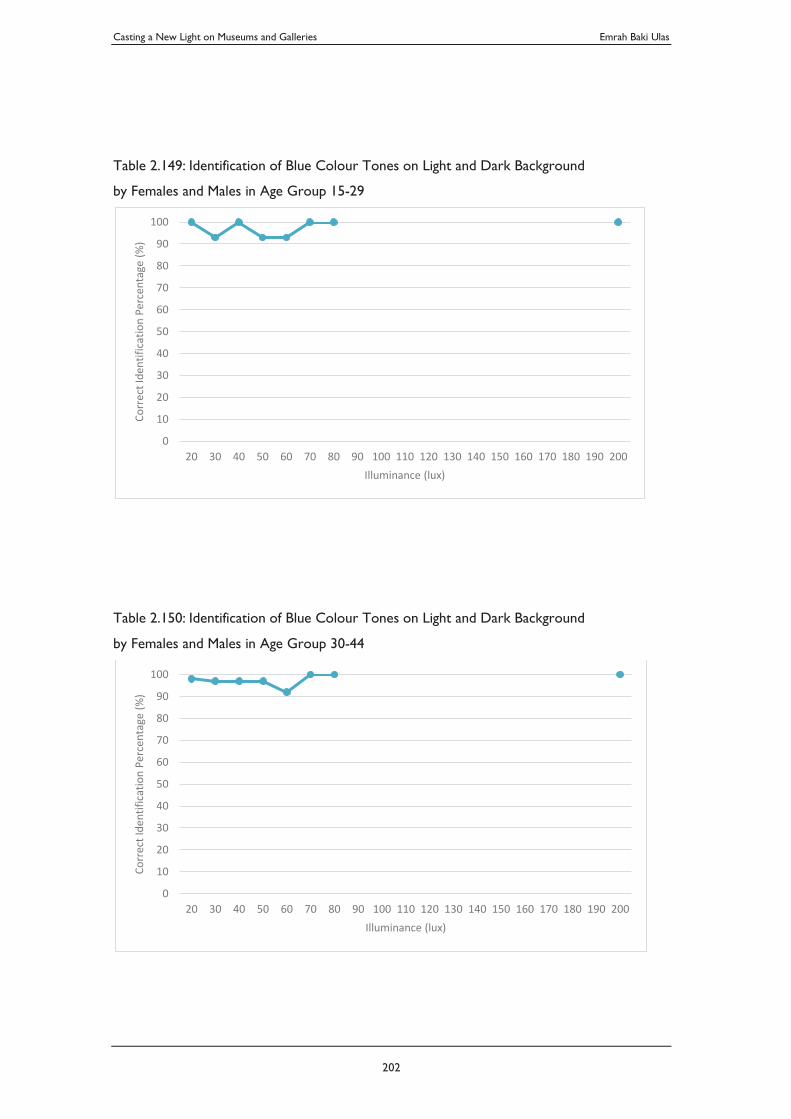
Casting a New Light on Museums and Galleries Emrah Baki Ulas
202
Table 2.149: Identification of Blue Colour Tones on Light and Dark Background
by Females and Males in Age Group 15-29
Table 2.150: Identification of Blue Colour Tones on Light and Dark Background
by Females and Males in Age Group 30-44
0
10
20
30
40
50
60
70
80
90
100
20 30 40 50 60 70 80 90 100 110 120 130 140 150 160 170 180 190 200
Corr
ect I
dent
ifica
tion
Perc
enta
ge (%
)
Illuminance (lux)
0
10
20
30
40
50
60
70
80
90
100
20 30 40 50 60 70 80 90 100 110 120 130 140 150 160 170 180 190 200
Corr
ect I
dent
ifica
tion
Perc
enta
ge (%
)
Illuminance (lux)
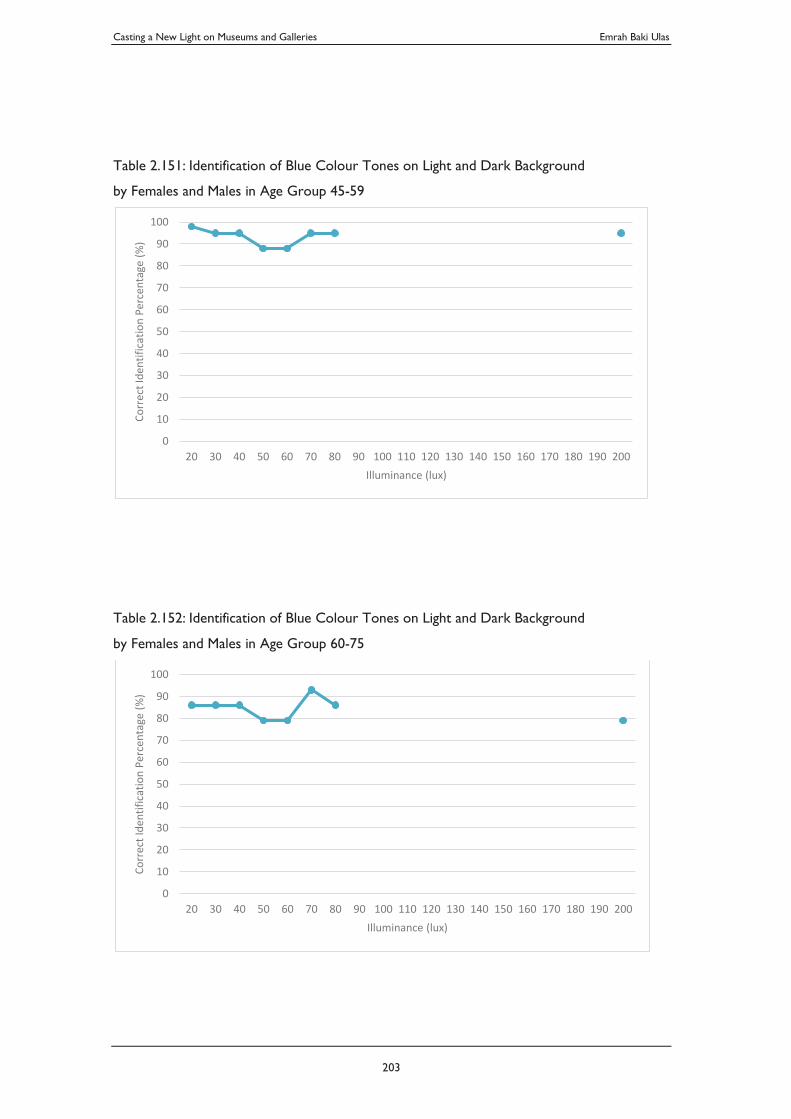
Casting a New Light on Museums and Galleries Emrah Baki Ulas
203
Table 2.151: Identification of Blue Colour Tones on Light and Dark Background
by Females and Males in Age Group 45-59
Table 2.152: Identification of Blue Colour Tones on Light and Dark Background
by Females and Males in Age Group 60-75
0
10
20
30
40
50
60
70
80
90
100
20 30 40 50 60 70 80 90 100 110 120 130 140 150 160 170 180 190 200
Corr
ect I
dent
ifica
tion
Perc
enta
ge (%
)
Illuminance (lux)
0
10
20
30
40
50
60
70
80
90
100
20 30 40 50 60 70 80 90 100 110 120 130 140 150 160 170 180 190 200
Corr
ect I
dent
ifica
tion
Perc
enta
ge (%
)
Illuminance (lux)
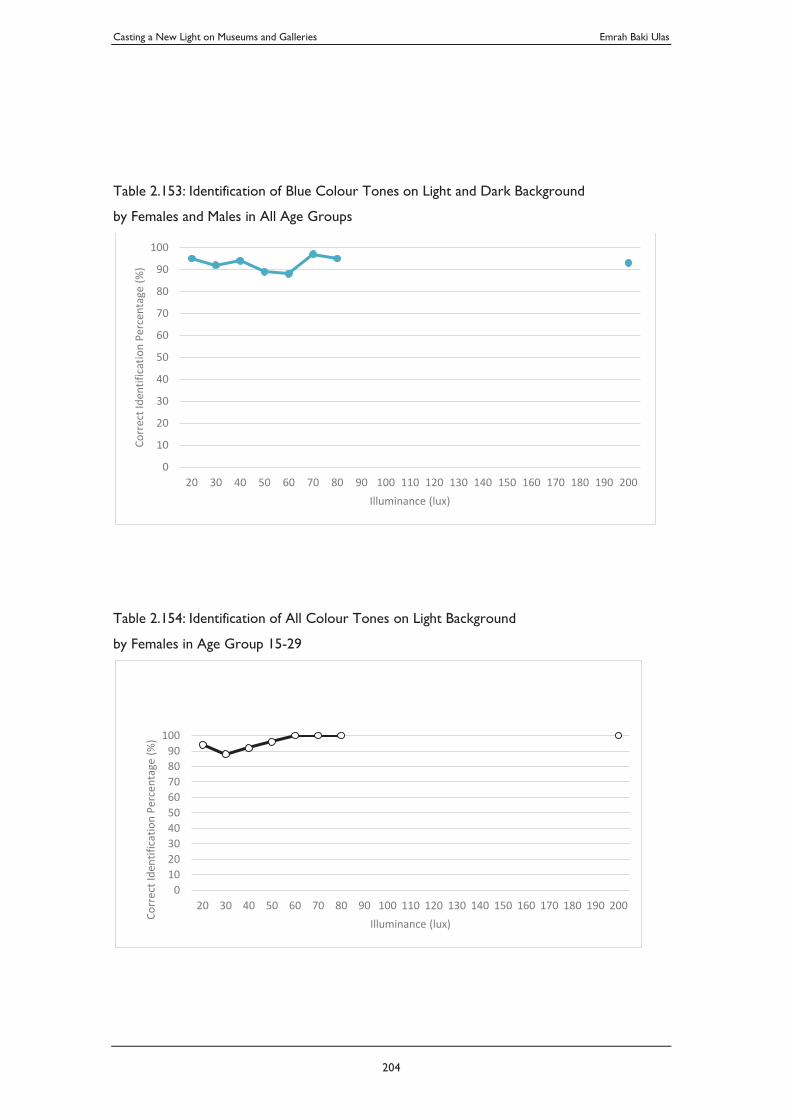
Casting a New Light on Museums and Galleries Emrah Baki Ulas
204
Table 2.153: Identification of Blue Colour Tones on Light and Dark Background
by Females and Males in All Age Groups
Table 2.154: Identification of All Colour Tones on Light Background
by Females in Age Group 15-29
0
10
20
30
40
50
60
70
80
90
100
20 30 40 50 60 70 80 90 100 110 120 130 140 150 160 170 180 190 200
Corr
ect I
dent
ifica
tion
Perc
enta
ge (%
)
Illuminance (lux)
0102030405060708090
100
20 30 40 50 60 70 80 90 100 110 120 130 140 150 160 170 180 190 200
Corr
ect I
dent
ifica
tion
Perc
enta
ge (%
)
Illuminance (lux)
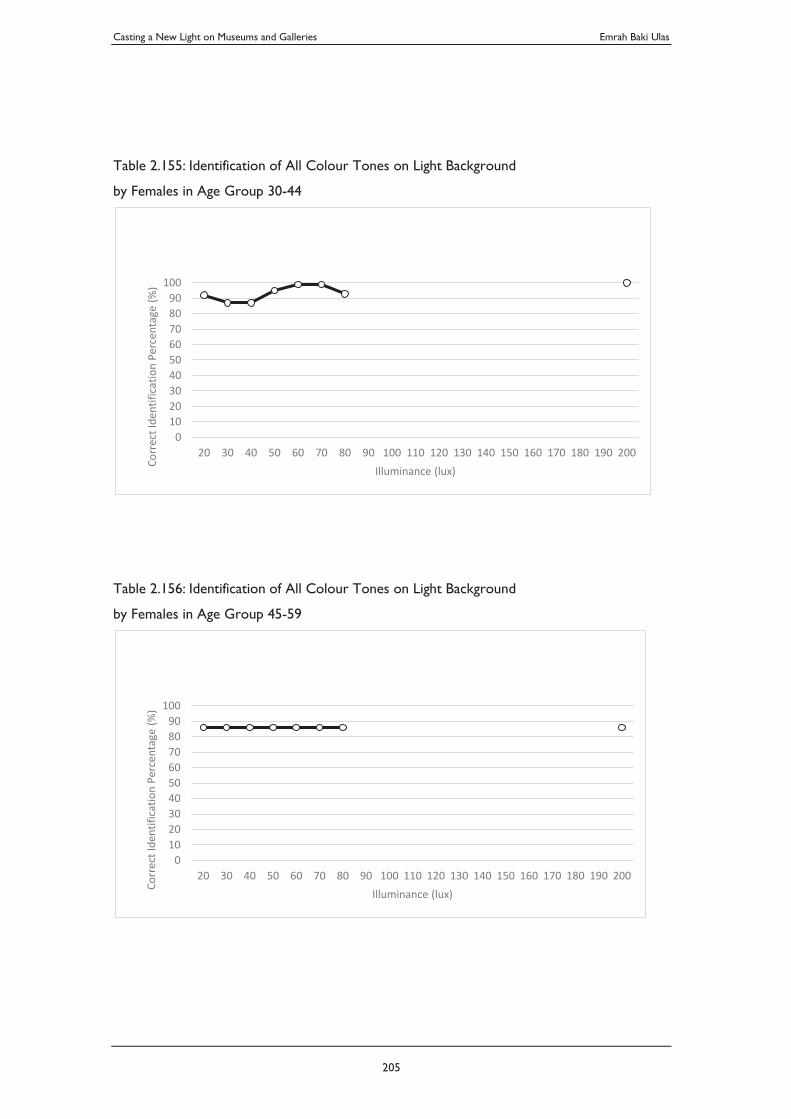
Casting a New Light on Museums and Galleries Emrah Baki Ulas
205
Table 2.155: Identification of All Colour Tones on Light Background
by Females in Age Group 30-44
Table 2.156: Identification of All Colour Tones on Light Background
by Females in Age Group 45-59
0102030405060708090
100
20 30 40 50 60 70 80 90 100 110 120 130 140 150 160 170 180 190 200
Corr
ect I
dent
ifica
tion
Perc
enta
ge (%
)
Illuminance (lux)
0102030405060708090
100
20 30 40 50 60 70 80 90 100 110 120 130 140 150 160 170 180 190 200
Corr
ect I
dent
ifica
tion
Perc
enta
ge (%
)
Illuminance (lux)

Casting a New Light on Museums and Galleries Emrah Baki Ulas
206
Table 2.157: Identification of All Colour Tones on Light Background
by Females in Age Group 60-75
Table 2.158: Identification of All Colour Tones on Dark Background
by Females in Age Group 15-29
0102030405060708090
100
20 30 40 50 60 70 80 90 100 110 120 130 140 150 160 170 180 190 200
Corr
ect I
dent
ifica
tion
Perc
enta
ge (%
)
Illuminance (lux)
0
10
20
30
40
50
60
70
80
90
100
20 30 40 50 60 70 80 90 100 110 120 130 140 150 160 170 180 190 200
Corr
ect I
dent
ifica
tion
Perc
enta
ge (%
)
Illuminance (lux)
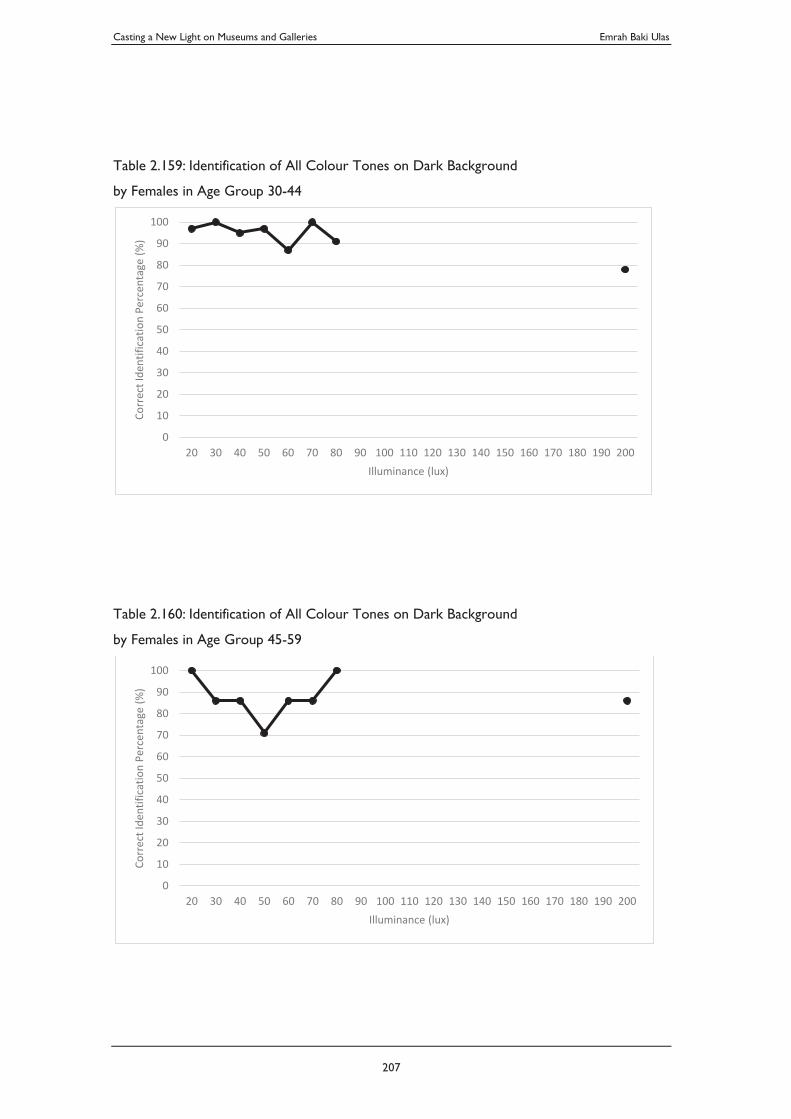
Casting a New Light on Museums and Galleries Emrah Baki Ulas
207
Table 2.159: Identification of All Colour Tones on Dark Background
by Females in Age Group 30-44
Table 2.160: Identification of All Colour Tones on Dark Background
by Females in Age Group 45-59
0
10
20
30
40
50
60
70
80
90
100
20 30 40 50 60 70 80 90 100 110 120 130 140 150 160 170 180 190 200
Corr
ect I
dent
ifica
tion
Perc
enta
ge (%
)
Illuminance (lux)
0
10
20
30
40
50
60
70
80
90
100
20 30 40 50 60 70 80 90 100 110 120 130 140 150 160 170 180 190 200
Corr
ect I
dent
ifica
tion
Perc
enta
ge (%
)
Illuminance (lux)
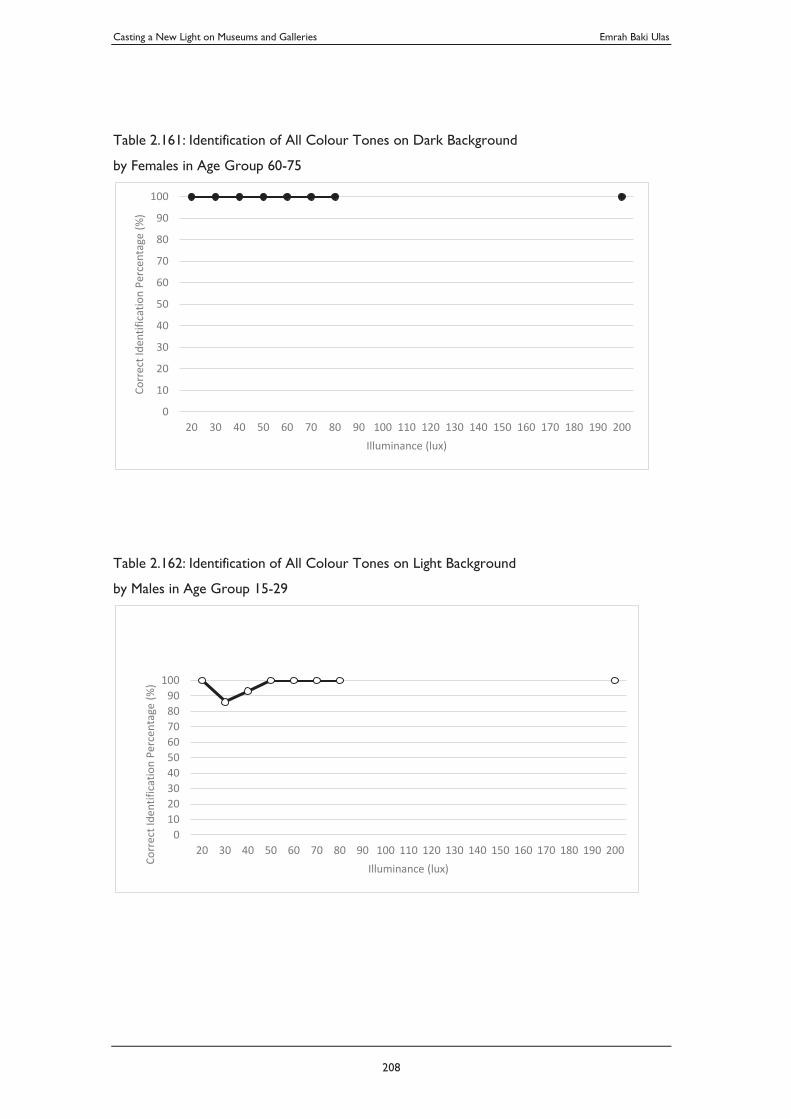
Casting a New Light on Museums and Galleries Emrah Baki Ulas
208
Table 2.161: Identification of All Colour Tones on Dark Background
by Females in Age Group 60-75
Table 2.162: Identification of All Colour Tones on Light Background
by Males in Age Group 15-29
0
10
20
30
40
50
60
70
80
90
100
20 30 40 50 60 70 80 90 100 110 120 130 140 150 160 170 180 190 200
Corr
ect I
dent
ifica
tion
Perc
enta
ge (%
)
Illuminance (lux)
0102030405060708090
100
20 30 40 50 60 70 80 90 100 110 120 130 140 150 160 170 180 190 200
Corr
ect I
dent
ifica
tion
Perc
enta
ge (%
)
Illuminance (lux)
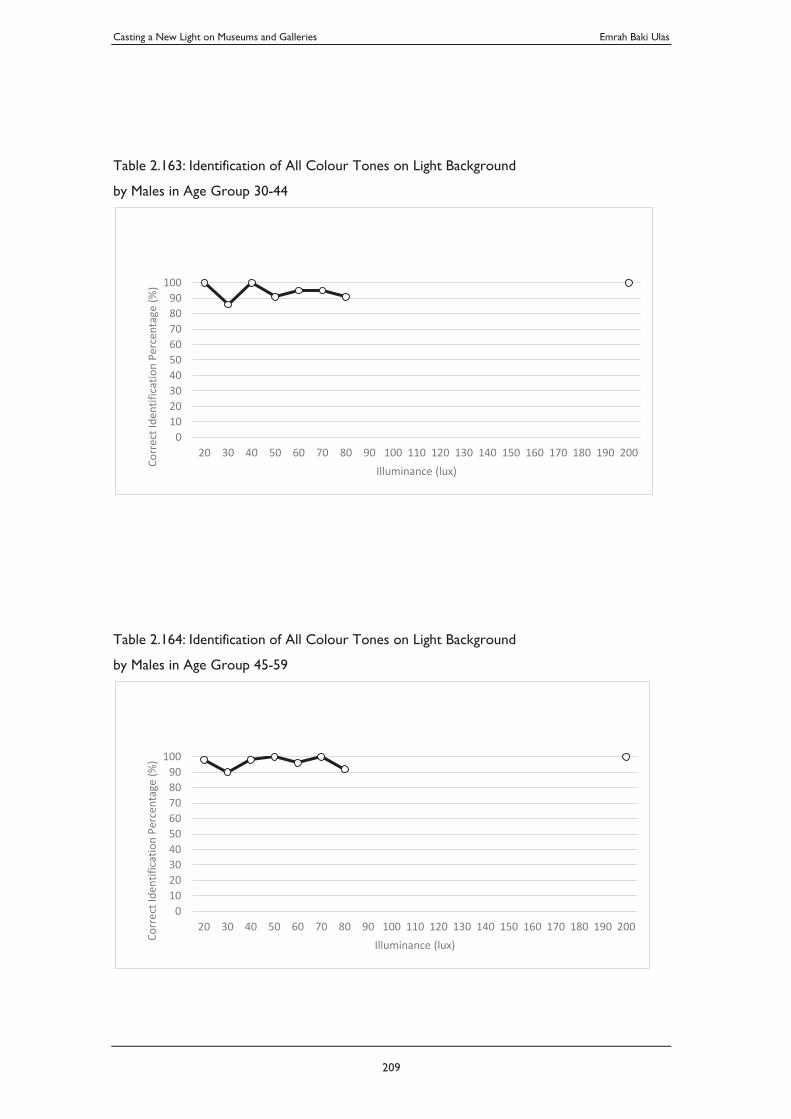
Casting a New Light on Museums and Galleries Emrah Baki Ulas
209
Table 2.163: Identification of All Colour Tones on Light Background
by Males in Age Group 30-44
Table 2.164: Identification of All Colour Tones on Light Background
by Males in Age Group 45-59
0102030405060708090
100
20 30 40 50 60 70 80 90 100 110 120 130 140 150 160 170 180 190 200
Corr
ect I
dent
ifica
tion
Perc
enta
ge (%
)
Illuminance (lux)
0102030405060708090
100
20 30 40 50 60 70 80 90 100 110 120 130 140 150 160 170 180 190 200
Corr
ect I
dent
ifica
tion
Perc
enta
ge (%
)
Illuminance (lux)
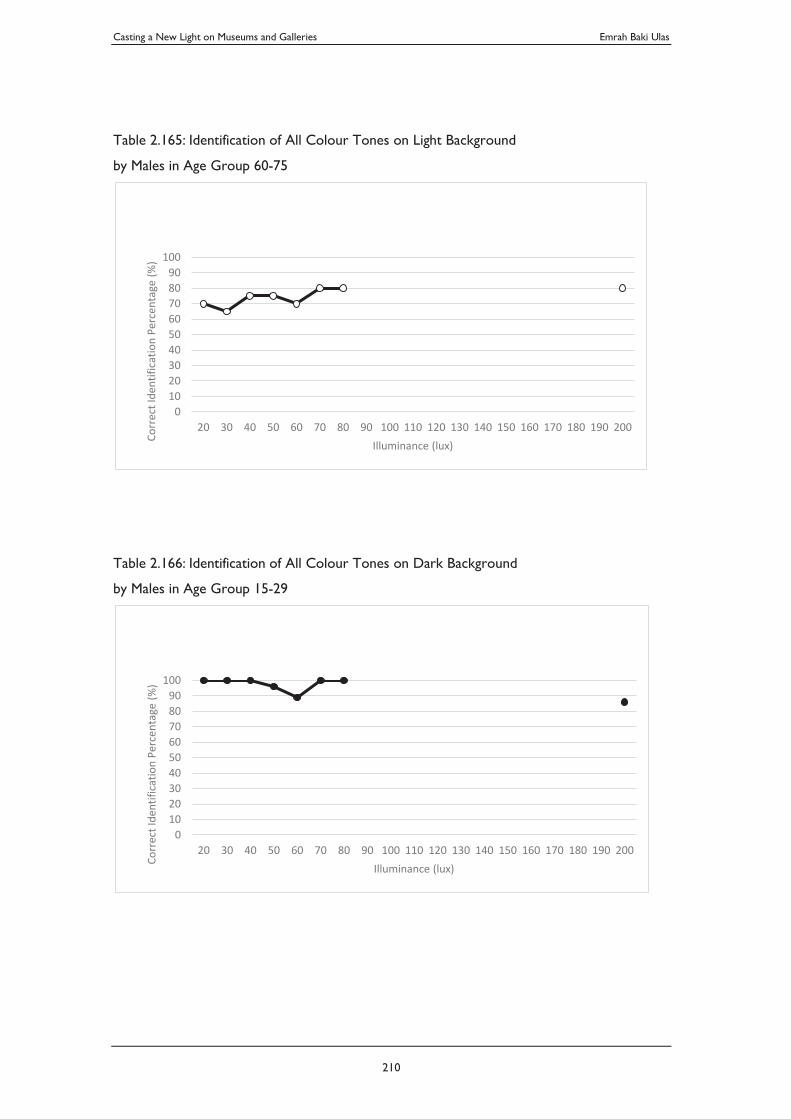
Casting a New Light on Museums and Galleries Emrah Baki Ulas
210
Table 2.165: Identification of All Colour Tones on Light Background
by Males in Age Group 60-75
Table 2.166: Identification of All Colour Tones on Dark Background
by Males in Age Group 15-29
0102030405060708090
100
20 30 40 50 60 70 80 90 100 110 120 130 140 150 160 170 180 190 200
Corr
ect I
dent
ifica
tion
Perc
enta
ge (%
)
Illuminance (lux)
0102030405060708090
100
20 30 40 50 60 70 80 90 100 110 120 130 140 150 160 170 180 190 200
Corr
ect I
dent
ifica
tion
Perc
enta
ge (%
)
Illuminance (lux)
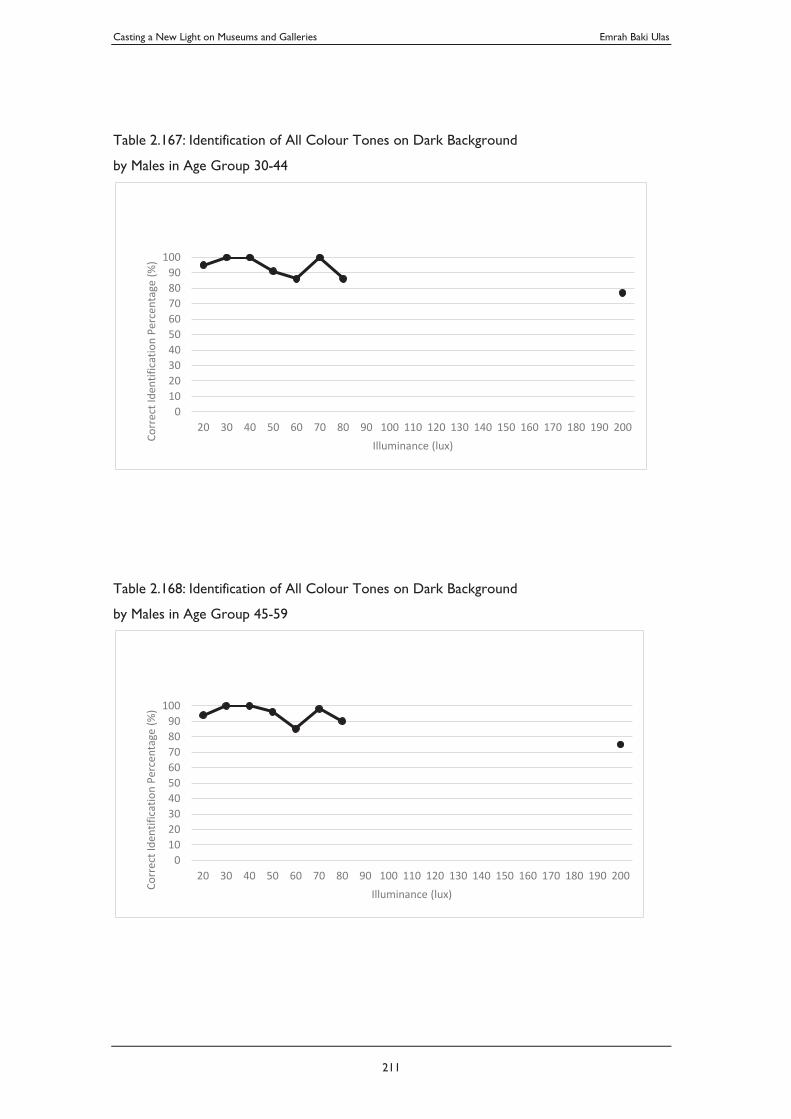
Casting a New Light on Museums and Galleries Emrah Baki Ulas
211
Table 2.167: Identification of All Colour Tones on Dark Background
by Males in Age Group 30-44
Table 2.168: Identification of All Colour Tones on Dark Background
by Males in Age Group 45-59
0102030405060708090
100
20 30 40 50 60 70 80 90 100 110 120 130 140 150 160 170 180 190 200
Corr
ect I
dent
ifica
tion
Perc
enta
ge (%
)
Illuminance (lux)
0102030405060708090
100
20 30 40 50 60 70 80 90 100 110 120 130 140 150 160 170 180 190 200
Corr
ect I
dent
ifica
tion
Perc
enta
ge (%
)
Illuminance (lux)
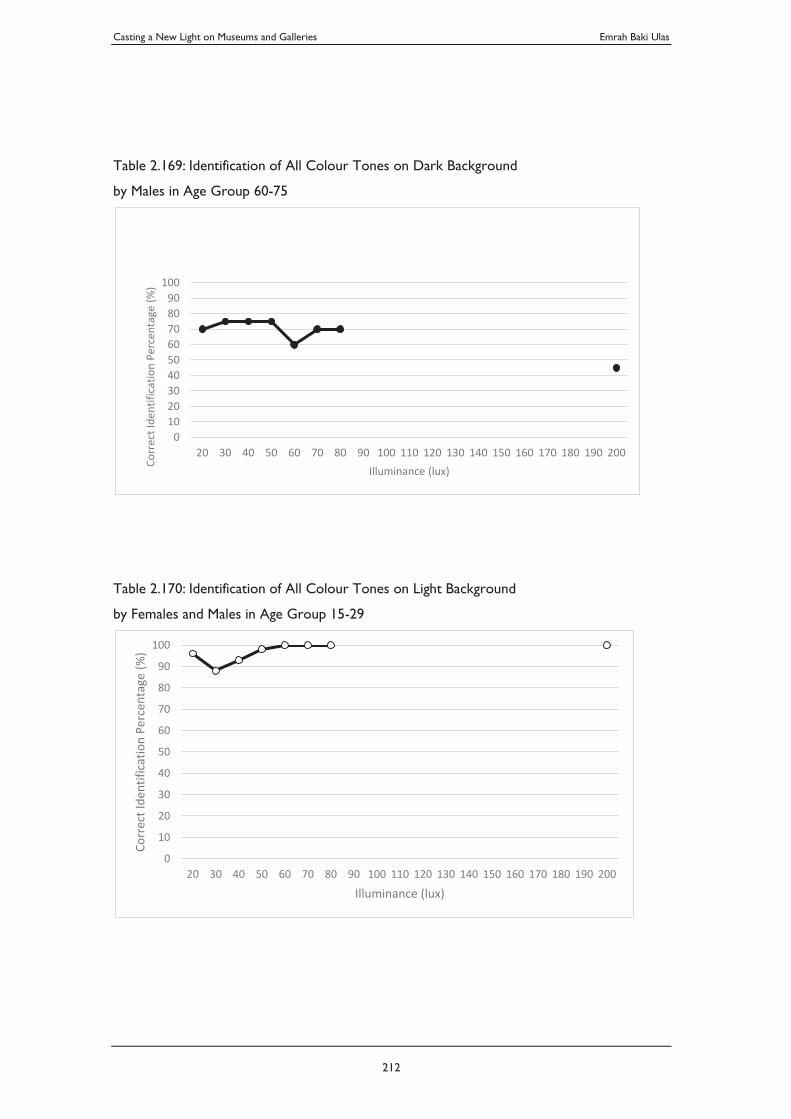
Casting a New Light on Museums and Galleries Emrah Baki Ulas
212
Table 2.169: Identification of All Colour Tones on Dark Background
by Males in Age Group 60-75
Table 2.170: Identification of All Colour Tones on Light Background
by Females and Males in Age Group 15-29
0102030405060708090
100
20 30 40 50 60 70 80 90 100 110 120 130 140 150 160 170 180 190 200
Corr
ect I
dent
ifica
tion
Perc
enta
ge (%
)
Illuminance (lux)
0
10
20
30
40
50
60
70
80
90
100
20 30 40 50 60 70 80 90 100 110 120 130 140 150 160 170 180 190 200
Corr
ect I
dent
ifica
tion
Perc
enta
ge (%
)
Illuminance (lux)
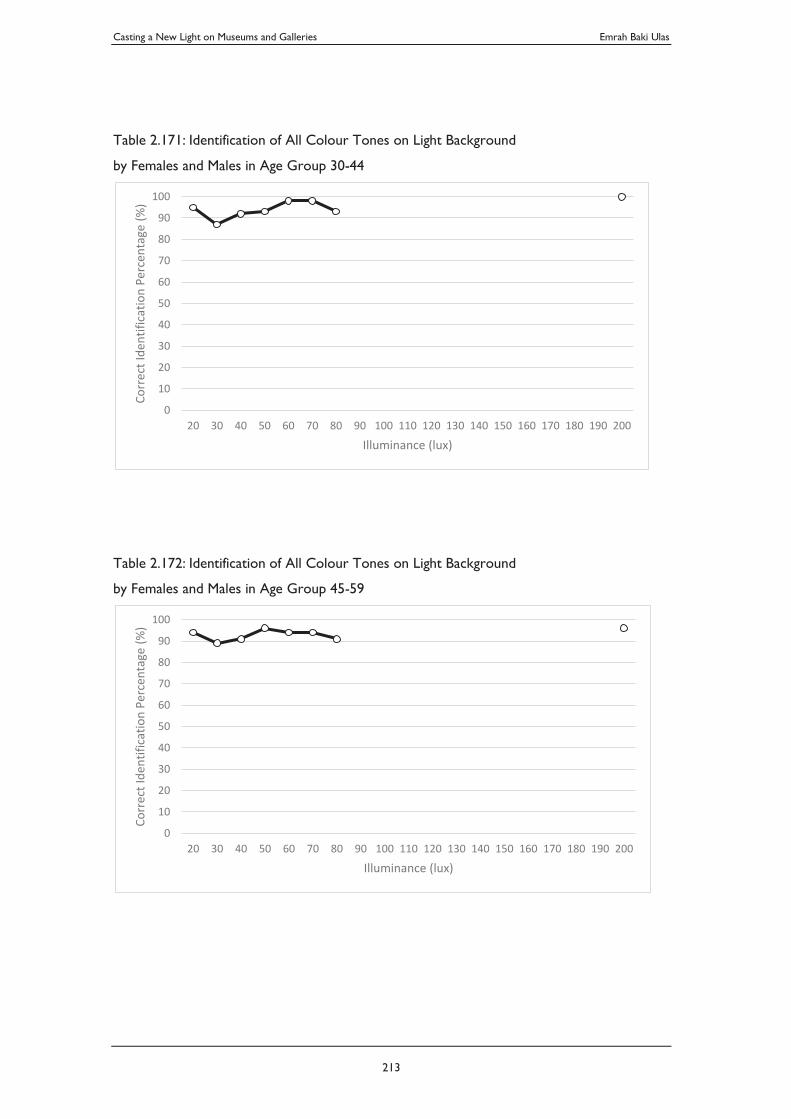
Casting a New Light on Museums and Galleries Emrah Baki Ulas
213
Table 2.171: Identification of All Colour Tones on Light Background
by Females and Males in Age Group 30-44
Table 2.172: Identification of All Colour Tones on Light Background
by Females and Males in Age Group 45-59
0
10
20
30
40
50
60
70
80
90
100
20 30 40 50 60 70 80 90 100 110 120 130 140 150 160 170 180 190 200
Corr
ect I
dent
ifica
tion
Perc
enta
ge (%
)
Illuminance (lux)
0
10
20
30
40
50
60
70
80
90
100
20 30 40 50 60 70 80 90 100 110 120 130 140 150 160 170 180 190 200
Corr
ect I
dent
ifica
tion
Perc
enta
ge (%
)
Illuminance (lux)
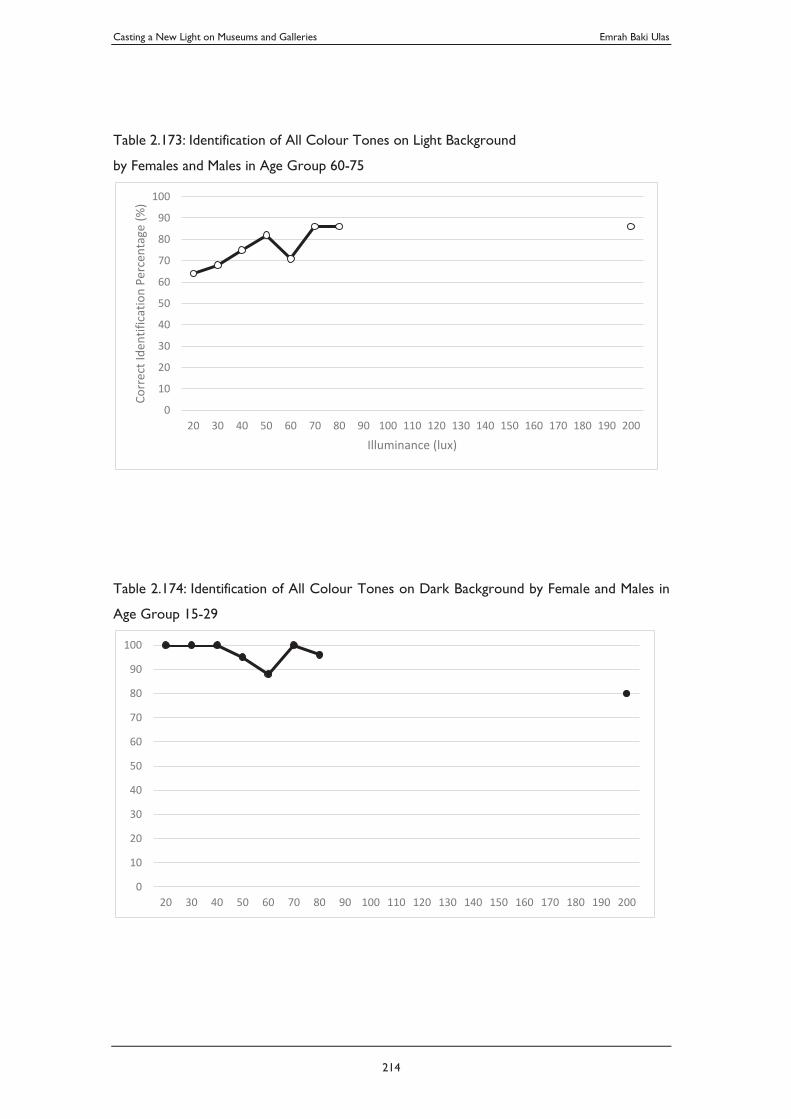
Casting a New Light on Museums and Galleries Emrah Baki Ulas
214
Table 2.173: Identification of All Colour Tones on Light Background
by Females and Males in Age Group 60-75
Table 2.174: Identification of All Colour Tones on Dark Background by Female and Males in
Age Group 15-29
0
10
20
30
40
50
60
70
80
90
100
20 30 40 50 60 70 80 90 100 110 120 130 140 150 160 170 180 190 200
Corr
ect I
dent
ifica
tion
Perc
enta
ge (%
)
Illuminance (lux)
0
10
20
30
40
50
60
70
80
90
100
20 30 40 50 60 70 80 90 100 110 120 130 140 150 160 170 180 190 200
Casting a New Light on Museums and Galleries Emrah Baki Ulas
215
Table 2.175: Identification of All Colour Tones on Dark Background by Female and Males in
Age Group 30-44
Table 2.176: Identification of All Colour Tones on Dark Background by Female and Males in
Age Group 45-59
0
10
20
30
40
50
60
70
80
90
100
20 30 40 50 60 70 80 90 100 110 120 130 140 150 160 170 180 190 200
0
10
20
30
40
50
60
70
80
90
100
20 30 40 50 60 70 80 90 100 110 120 130 140 150 160 170 180 190 200
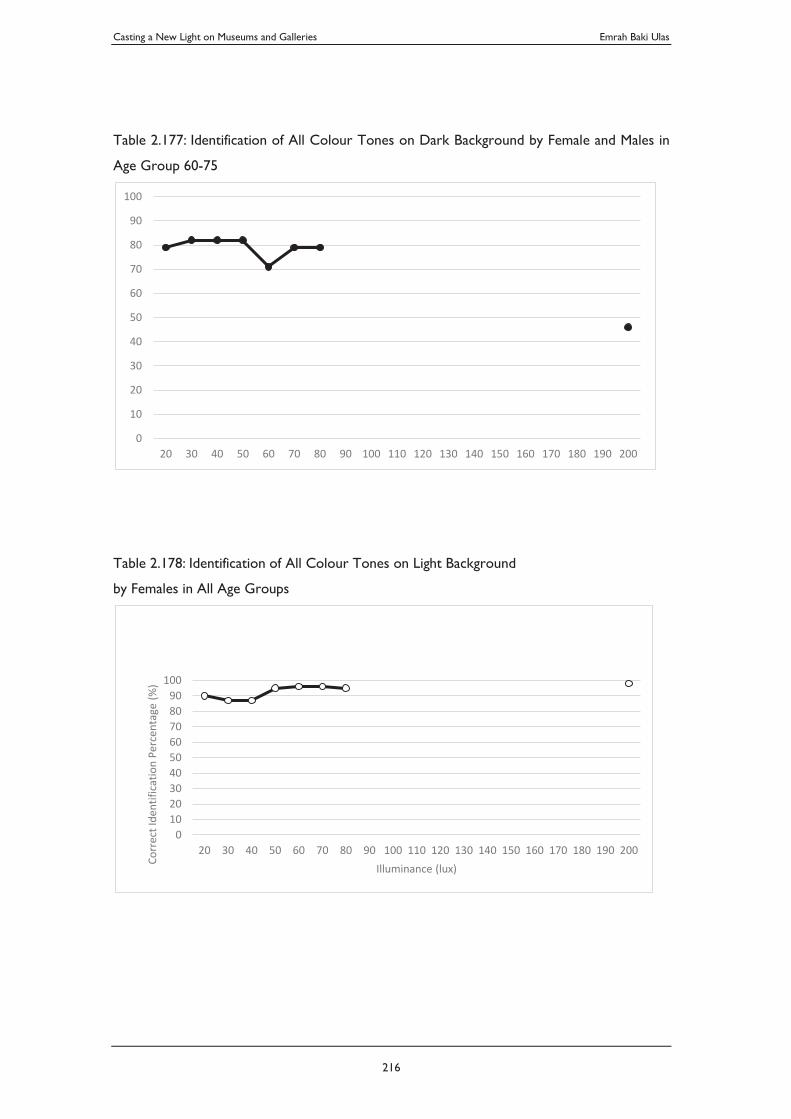
Casting a New Light on Museums and Galleries Emrah Baki Ulas
216
Table 2.177: Identification of All Colour Tones on Dark Background by Female and Males in
Age Group 60-75
Table 2.178: Identification of All Colour Tones on Light Background
by Females in All Age Groups
0
10
20
30
40
50
60
70
80
90
100
20 30 40 50 60 70 80 90 100 110 120 130 140 150 160 170 180 190 200
0102030405060708090
100
20 30 40 50 60 70 80 90 100 110 120 130 140 150 160 170 180 190 200
Corr
ect I
dent
ifica
tion
Perc
enta
ge (%
)
Illuminance (lux)
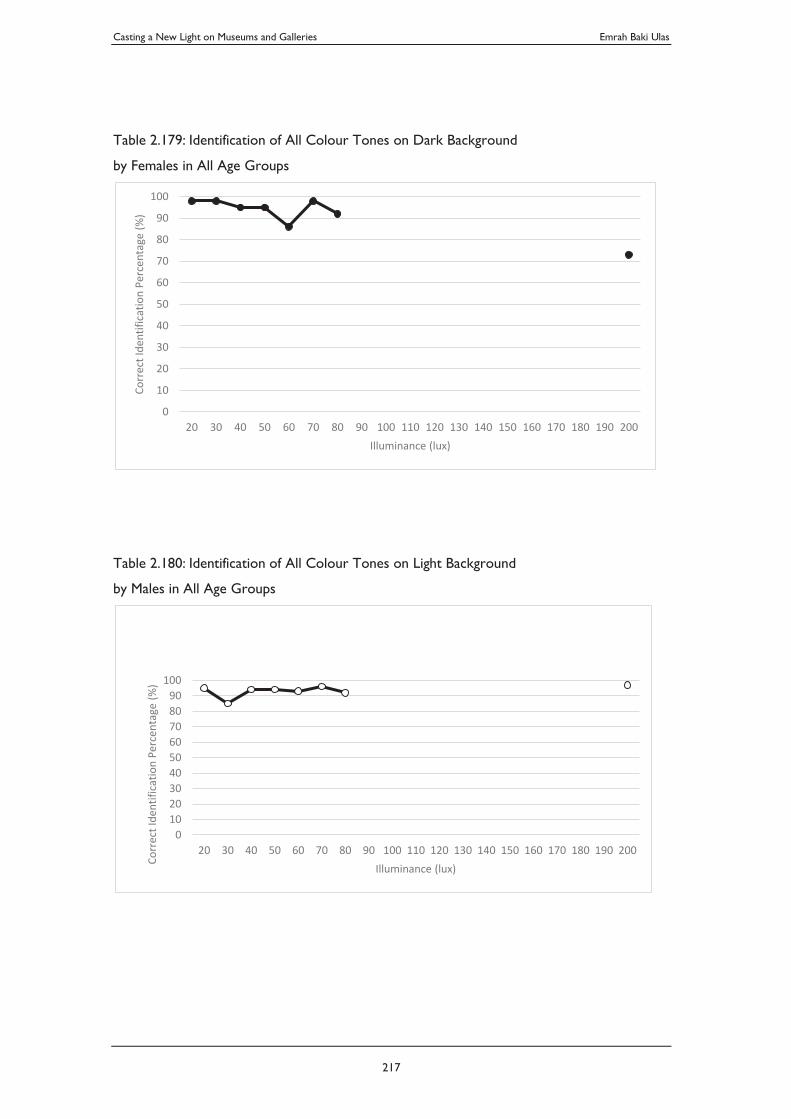
Casting a New Light on Museums and Galleries Emrah Baki Ulas
217
Table 2.179: Identification of All Colour Tones on Dark Background
by Females in All Age Groups
Table 2.180: Identification of All Colour Tones on Light Background
by Males in All Age Groups
0
10
20
30
40
50
60
70
80
90
100
20 30 40 50 60 70 80 90 100 110 120 130 140 150 160 170 180 190 200
Corr
ect I
dent
ifica
tion
Perc
enta
ge (%
)
Illuminance (lux)
0102030405060708090
100
20 30 40 50 60 70 80 90 100 110 120 130 140 150 160 170 180 190 200
Corr
ect I
dent
ifica
tion
Perc
enta
ge (%
)
Illuminance (lux)
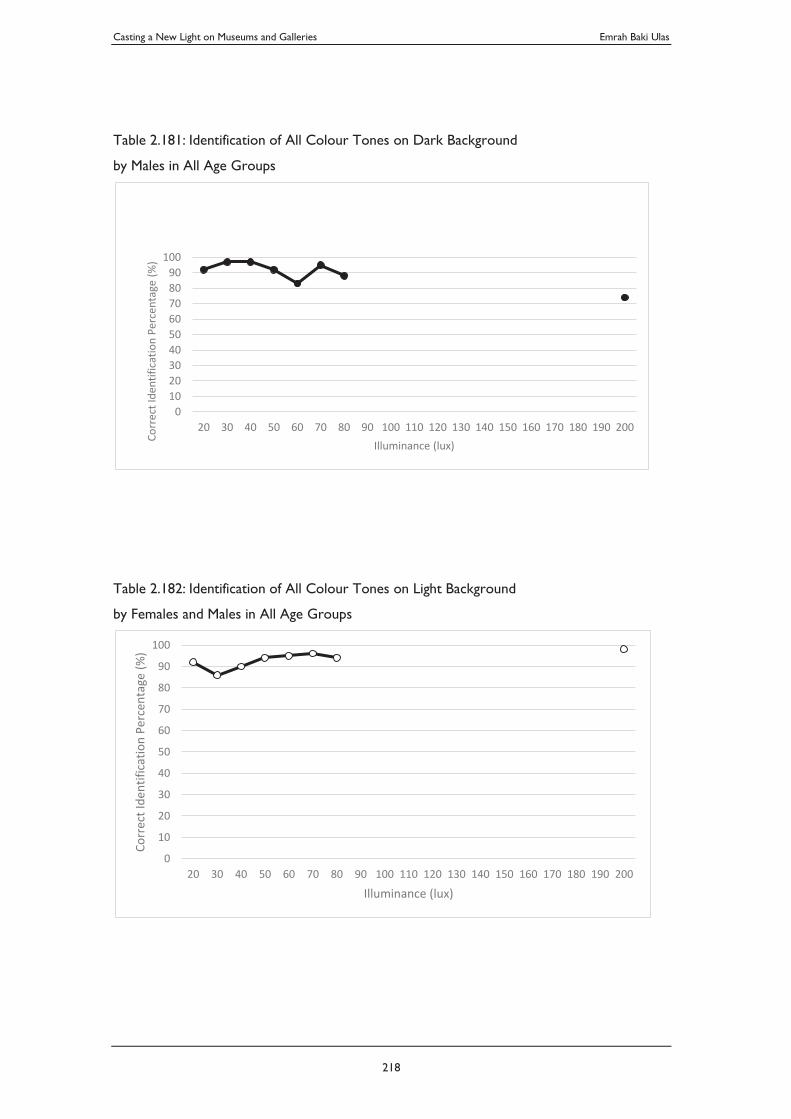
Casting a New Light on Museums and Galleries Emrah Baki Ulas
218
Table 2.181: Identification of All Colour Tones on Dark Background
by Males in All Age Groups
Table 2.182: Identification of All Colour Tones on Light Background
by Females and Males in All Age Groups
0102030405060708090
100
20 30 40 50 60 70 80 90 100 110 120 130 140 150 160 170 180 190 200
Corr
ect I
dent
ifica
tion
Perc
enta
ge (%
)
Illuminance (lux)
0
10
20
30
40
50
60
70
80
90
100
20 30 40 50 60 70 80 90 100 110 120 130 140 150 160 170 180 190 200
Corr
ect I
dent
ifica
tion
Perc
enta
ge (%
)
Illuminance (lux)
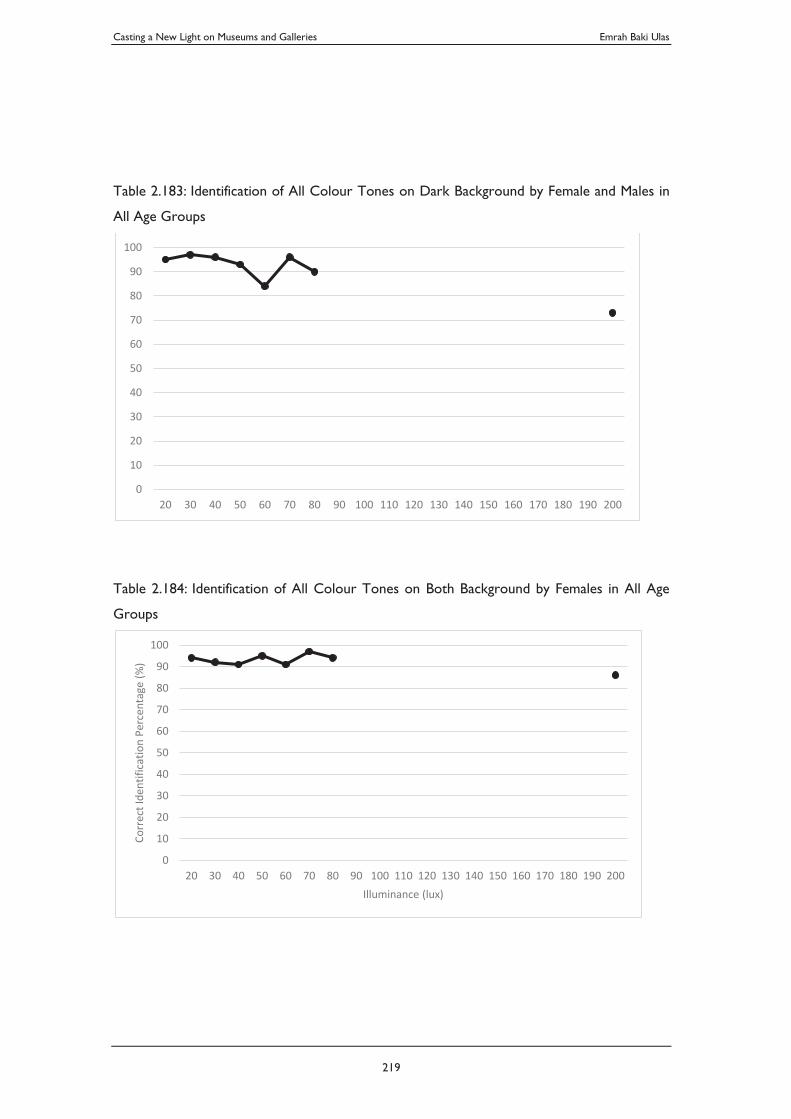
Casting a New Light on Museums and Galleries Emrah Baki Ulas
219
Table 2.183: Identification of All Colour Tones on Dark Background by Female and Males in
All Age Groups
Table 2.184: Identification of All Colour Tones on Both Background by Females in All Age
Groups
0
10
20
30
40
50
60
70
80
90
100
20 30 40 50 60 70 80 90 100 110 120 130 140 150 160 170 180 190 200
0
10
20
30
40
50
60
70
80
90
100
20 30 40 50 60 70 80 90 100 110 120 130 140 150 160 170 180 190 200
Corr
ect I
dent
ifica
tion
Perc
enta
ge (%
)
Illuminance (lux)
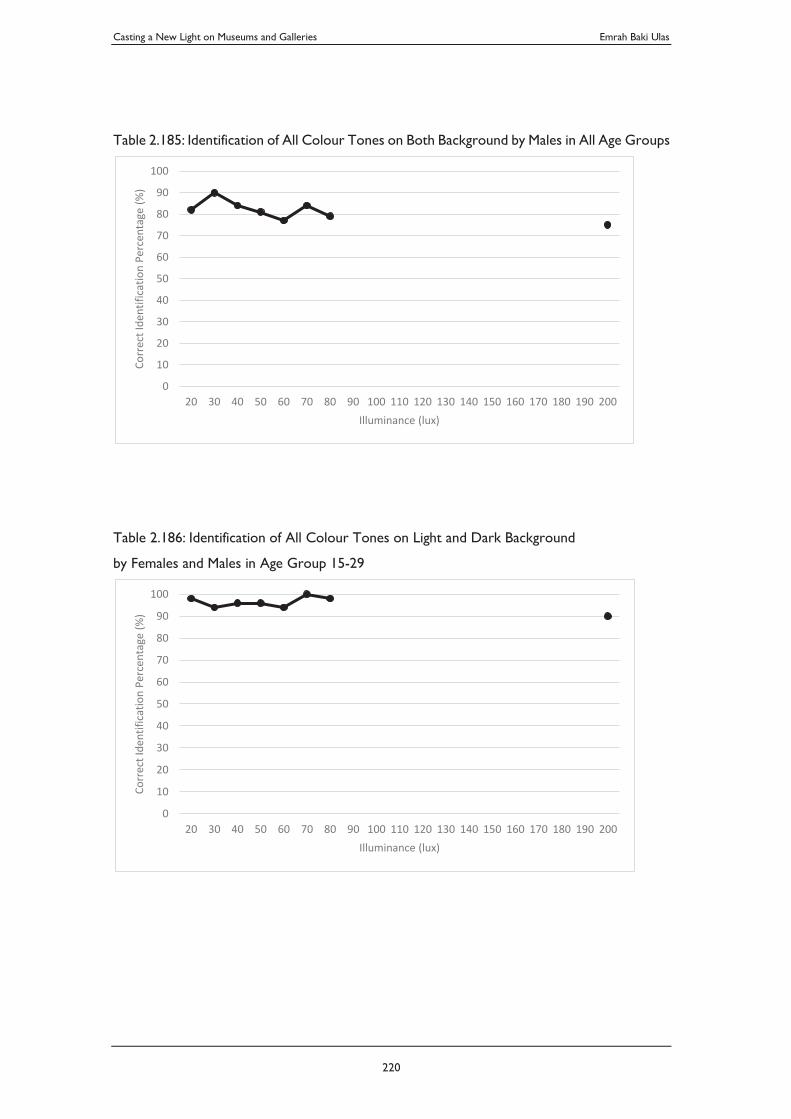
Casting a New Light on Museums and Galleries Emrah Baki Ulas
220
Table 2.185: Identification of All Colour Tones on Both Background by Males in All Age Groups
Table 2.186: Identification of All Colour Tones on Light and Dark Background
by Females and Males in Age Group 15-29
0
10
20
30
40
50
60
70
80
90
100
20 30 40 50 60 70 80 90 100 110 120 130 140 150 160 170 180 190 200
Corr
ect I
dent
ifica
tion
Perc
enta
ge (%
)
Illuminance (lux)
0
10
20
30
40
50
60
70
80
90
100
20 30 40 50 60 70 80 90 100 110 120 130 140 150 160 170 180 190 200
Corr
ect I
dent
ifica
tion
Perc
enta
ge (%
)
Illuminance (lux)
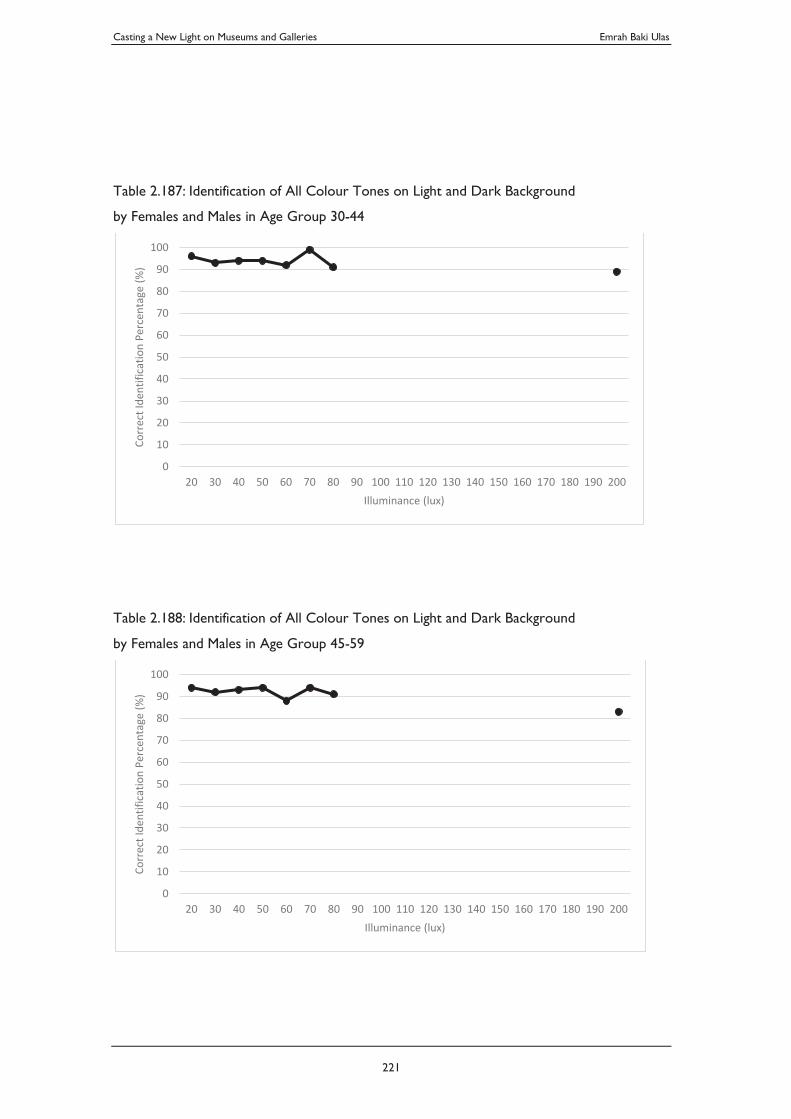
Casting a New Light on Museums and Galleries Emrah Baki Ulas
221
Table 2.187: Identification of All Colour Tones on Light and Dark Background
by Females and Males in Age Group 30-44
Table 2.188: Identification of All Colour Tones on Light and Dark Background
by Females and Males in Age Group 45-59
0
10
20
30
40
50
60
70
80
90
100
20 30 40 50 60 70 80 90 100 110 120 130 140 150 160 170 180 190 200
Corr
ect I
dent
ifica
tion
Perc
enta
ge (%
)
Illuminance (lux)
0
10
20
30
40
50
60
70
80
90
100
20 30 40 50 60 70 80 90 100 110 120 130 140 150 160 170 180 190 200
Corr
ect I
dent
ifica
tion
Perc
enta
ge (%
)
Illuminance (lux)
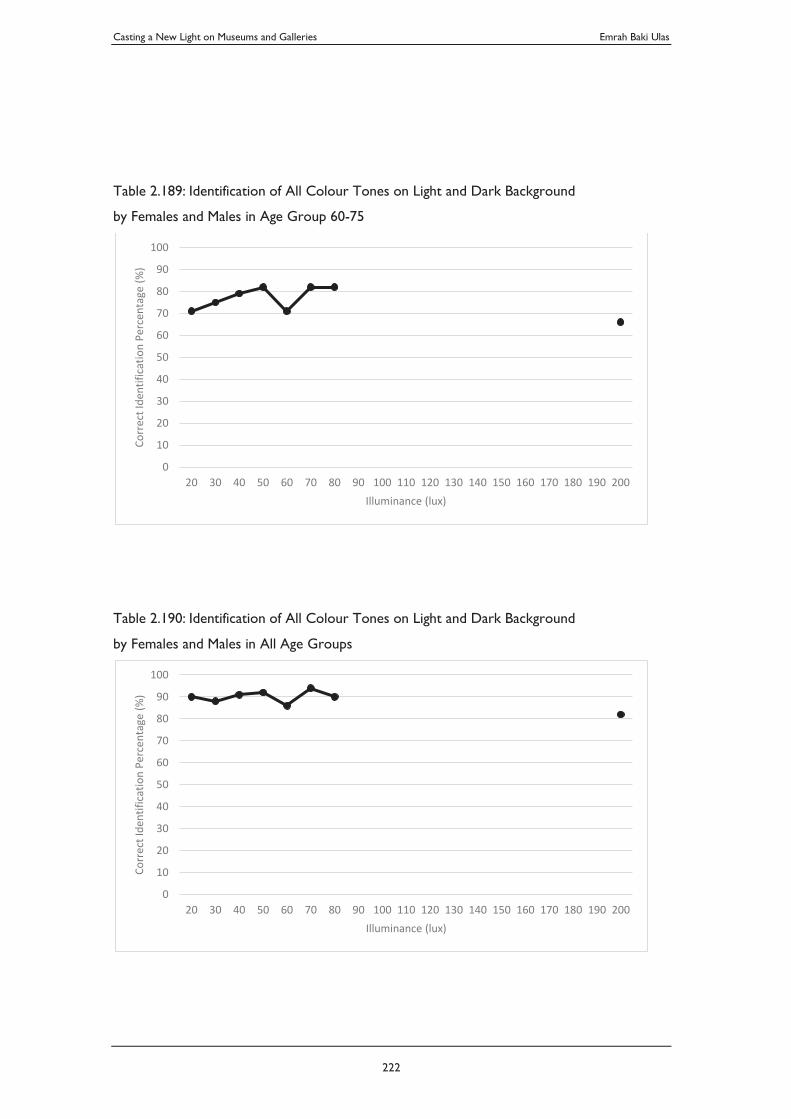
Casting a New Light on Museums and Galleries Emrah Baki Ulas
222
Table 2.189: Identification of All Colour Tones on Light and Dark Background
by Females and Males in Age Group 60-75
Table 2.190: Identification of All Colour Tones on Light and Dark Background
by Females and Males in All Age Groups
0
10
20
30
40
50
60
70
80
90
100
20 30 40 50 60 70 80 90 100 110 120 130 140 150 160 170 180 190 200
Corr
ect I
dent
ifica
tion
Perc
enta
ge (%
)
Illuminance (lux)
0
10
20
30
40
50
60
70
80
90
100
20 30 40 50 60 70 80 90 100 110 120 130 140 150 160 170 180 190 200
Corr
ect I
dent
ifica
tion
Perc
enta
ge (%
)
Illuminance (lux)
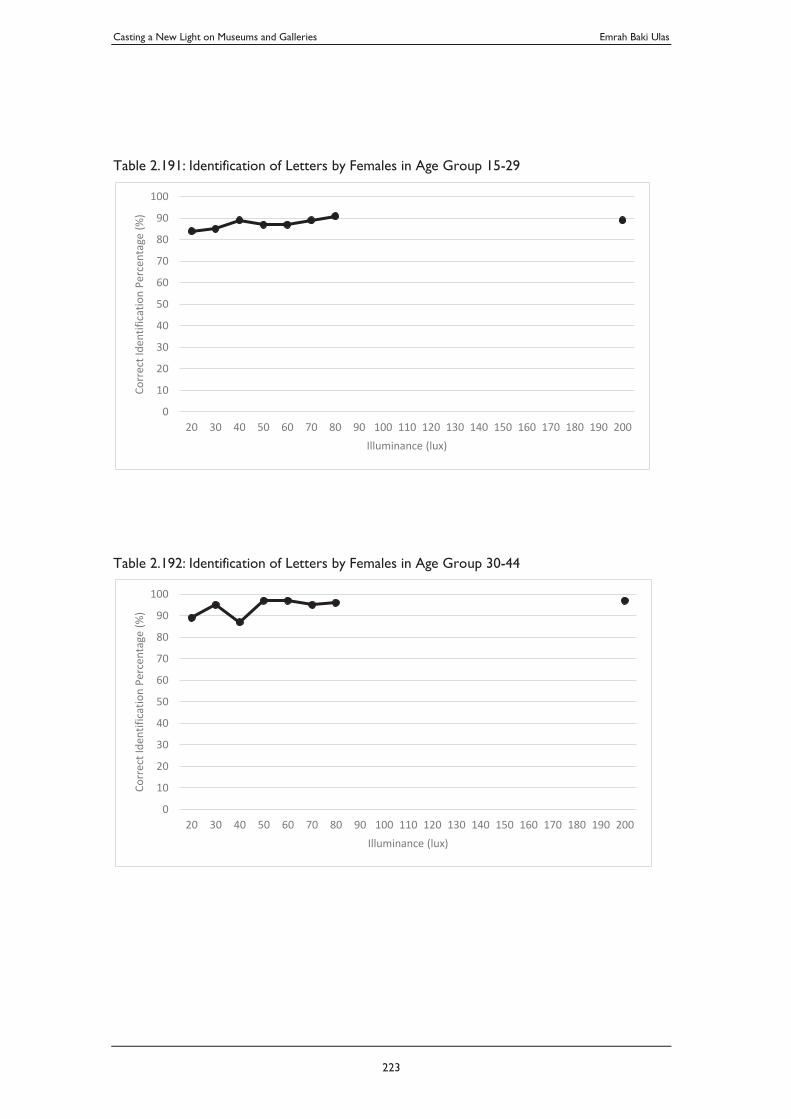
Casting a New Light on Museums and Galleries Emrah Baki Ulas
223
Table 2.191: Identification of Letters by Females in Age Group 15-29
Table 2.192: Identification of Letters by Females in Age Group 30-44
0
10
20
30
40
50
60
70
80
90
100
20 30 40 50 60 70 80 90 100 110 120 130 140 150 160 170 180 190 200
Corr
ect I
dent
ifica
tion
Perc
enta
ge (%
)
Illuminance (lux)
0
10
20
30
40
50
60
70
80
90
100
20 30 40 50 60 70 80 90 100 110 120 130 140 150 160 170 180 190 200
Corr
ect I
dent
ifica
tion
Perc
enta
ge (%
)
Illuminance (lux)
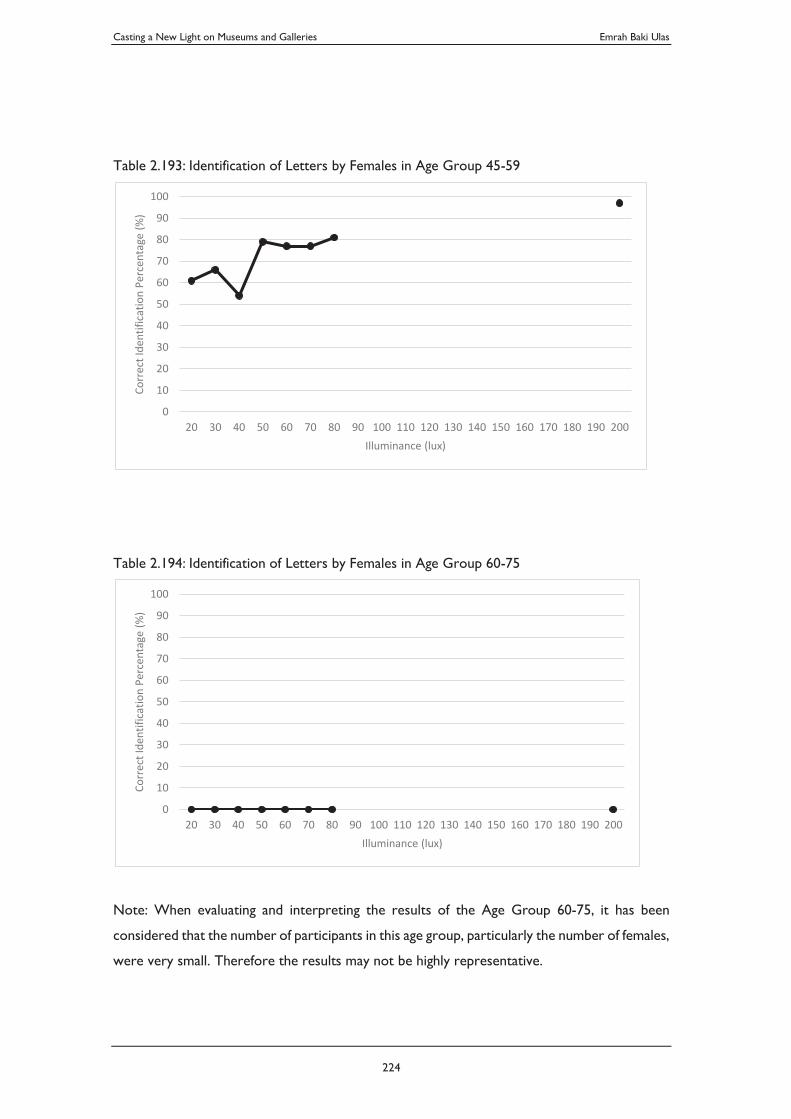
Casting a New Light on Museums and Galleries Emrah Baki Ulas
224
Table 2.193: Identification of Letters by Females in Age Group 45-59
Table 2.194: Identification of Letters by Females in Age Group 60-75
Note: When evaluating and interpreting the results of the Age Group 60-75, it has been
considered that the number of participants in this age group, particularly the number of females,
were very small. Therefore the results may not be highly representative.
0
10
20
30
40
50
60
70
80
90
100
20 30 40 50 60 70 80 90 100 110 120 130 140 150 160 170 180 190 200
Corr
ect I
dent
ifica
tion
Perc
enta
ge (%
)
Illuminance (lux)
0
10
20
30
40
50
60
70
80
90
100
20 30 40 50 60 70 80 90 100 110 120 130 140 150 160 170 180 190 200
Corr
ect I
dent
ifica
tion
Perc
enta
ge (%
)
Illuminance (lux)
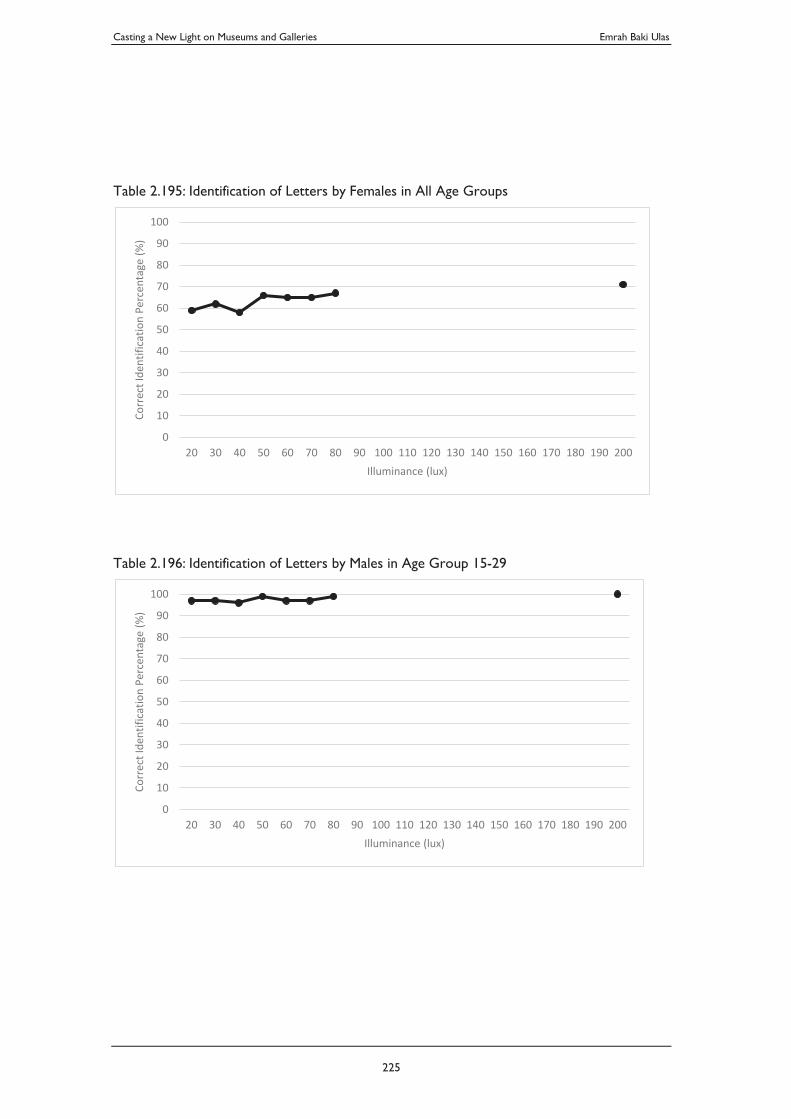
Casting a New Light on Museums and Galleries Emrah Baki Ulas
225
Table 2.195: Identification of Letters by Females in All Age Groups
Table 2.196: Identification of Letters by Males in Age Group 15-29
0
10
20
30
40
50
60
70
80
90
100
20 30 40 50 60 70 80 90 100 110 120 130 140 150 160 170 180 190 200
Corr
ect I
dent
ifica
tion
Perc
enta
ge (%
)
Illuminance (lux)
0
10
20
30
40
50
60
70
80
90
100
20 30 40 50 60 70 80 90 100 110 120 130 140 150 160 170 180 190 200
Corr
ect I
dent
ifica
tion
Perc
enta
ge (%
)
Illuminance (lux)
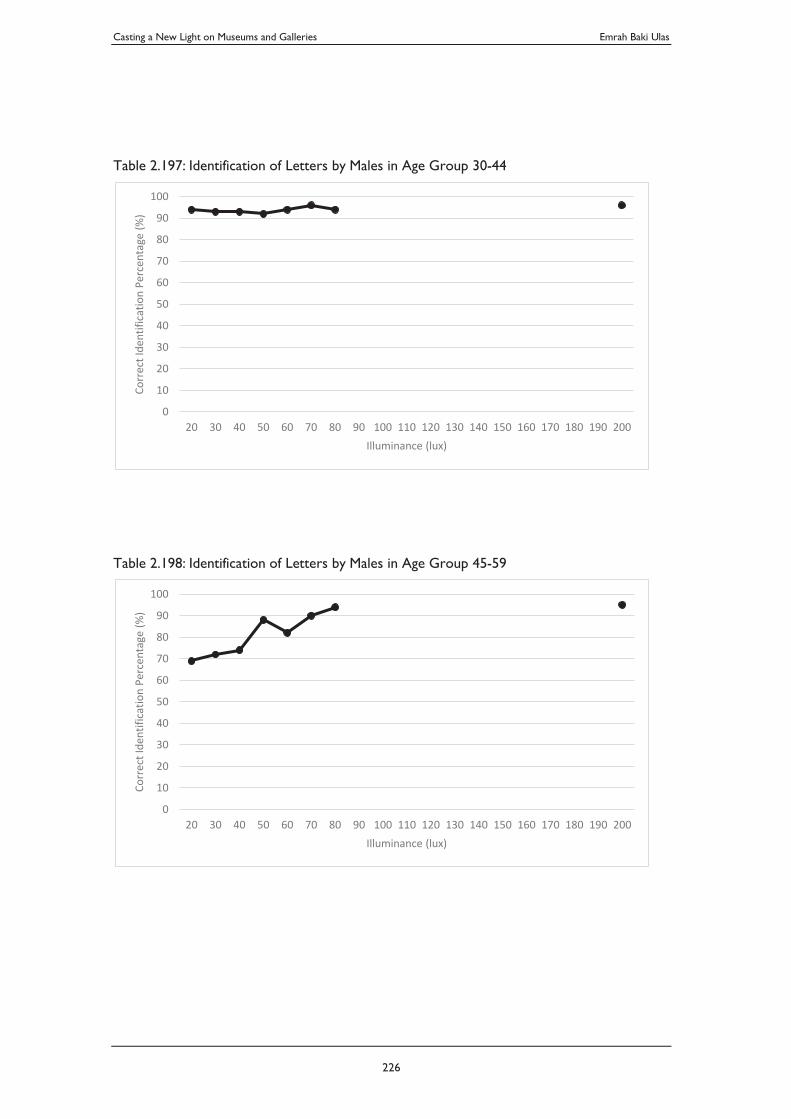
Casting a New Light on Museums and Galleries Emrah Baki Ulas
226
Table 2.197: Identification of Letters by Males in Age Group 30-44
Table 2.198: Identification of Letters by Males in Age Group 45-59
0
10
20
30
40
50
60
70
80
90
100
20 30 40 50 60 70 80 90 100 110 120 130 140 150 160 170 180 190 200
Corr
ect I
dent
ifica
tion
Perc
enta
ge (%
)
Illuminance (lux)
0
10
20
30
40
50
60
70
80
90
100
20 30 40 50 60 70 80 90 100 110 120 130 140 150 160 170 180 190 200
Corr
ect I
dent
ifica
tion
Perc
enta
ge (%
)
Illuminance (lux)
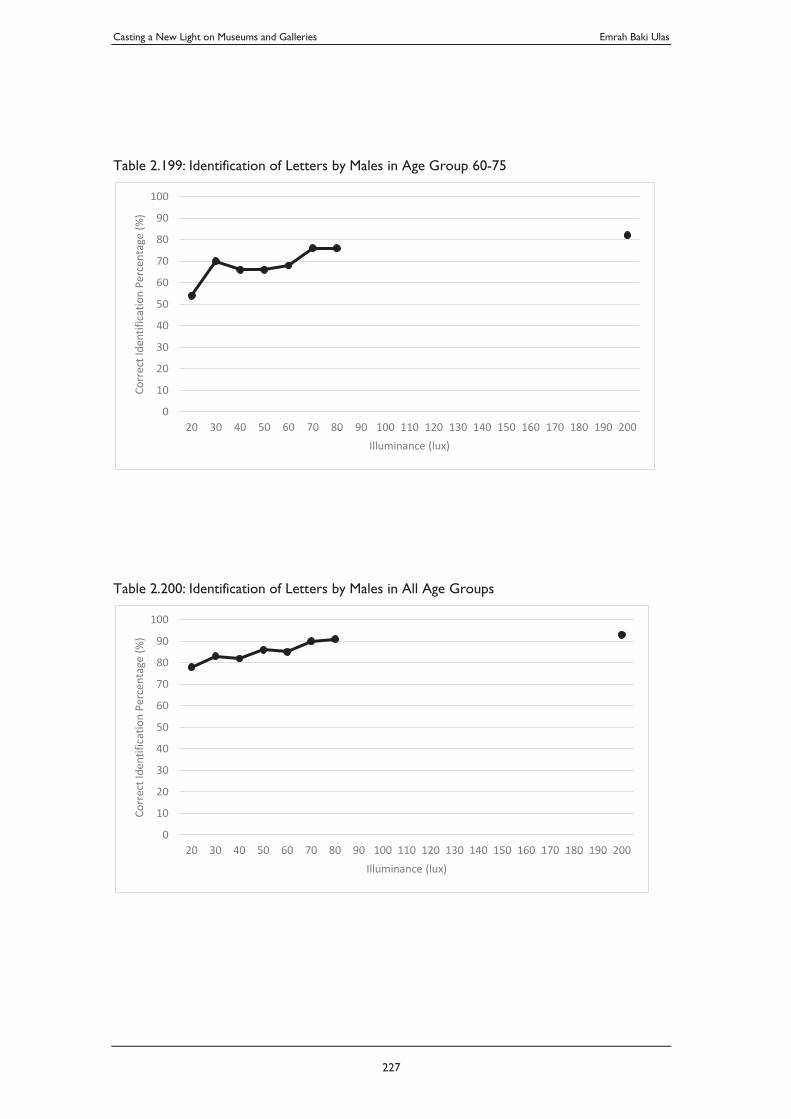
Casting a New Light on Museums and Galleries Emrah Baki Ulas
227
Table 2.199: Identification of Letters by Males in Age Group 60-75
Table 2.200: Identification of Letters by Males in All Age Groups
0
10
20
30
40
50
60
70
80
90
100
20 30 40 50 60 70 80 90 100 110 120 130 140 150 160 170 180 190 200
Corr
ect I
dent
ifica
tion
Perc
enta
ge (%
)
Illuminance (lux)
0
10
20
30
40
50
60
70
80
90
100
20 30 40 50 60 70 80 90 100 110 120 130 140 150 160 170 180 190 200
Corr
ect I
dent
ifica
tion
Perc
enta
ge (%
)
Illuminance (lux)
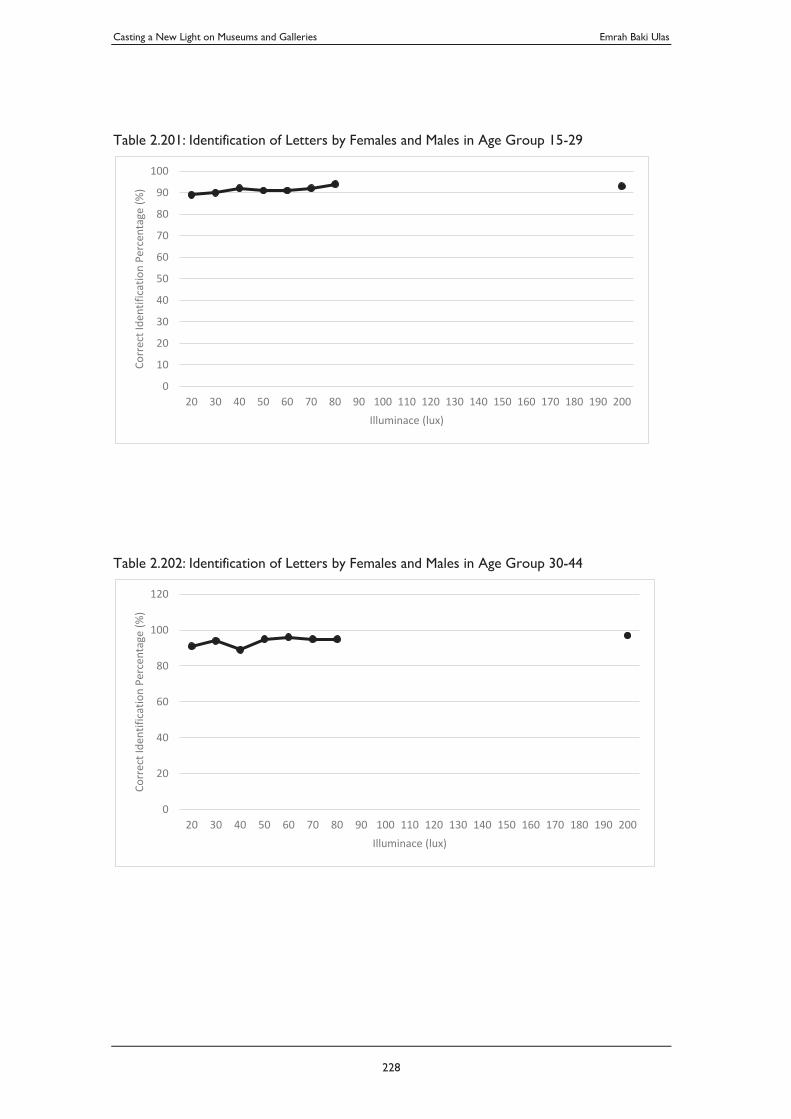
Casting a New Light on Museums and Galleries Emrah Baki Ulas
228
Table 2.201: Identification of Letters by Females and Males in Age Group 15-29
Table 2.202: Identification of Letters by Females and Males in Age Group 30-44
0
10
20
30
40
50
60
70
80
90
100
20 30 40 50 60 70 80 90 100 110 120 130 140 150 160 170 180 190 200
Corr
ect I
dent
ifica
tion
Perc
enta
ge (%
)
Illuminace (lux)
0
20
40
60
80
100
120
20 30 40 50 60 70 80 90 100 110 120 130 140 150 160 170 180 190 200
Corr
ect I
dent
ifica
tion
Perc
enta
ge (%
)
Illuminace (lux)
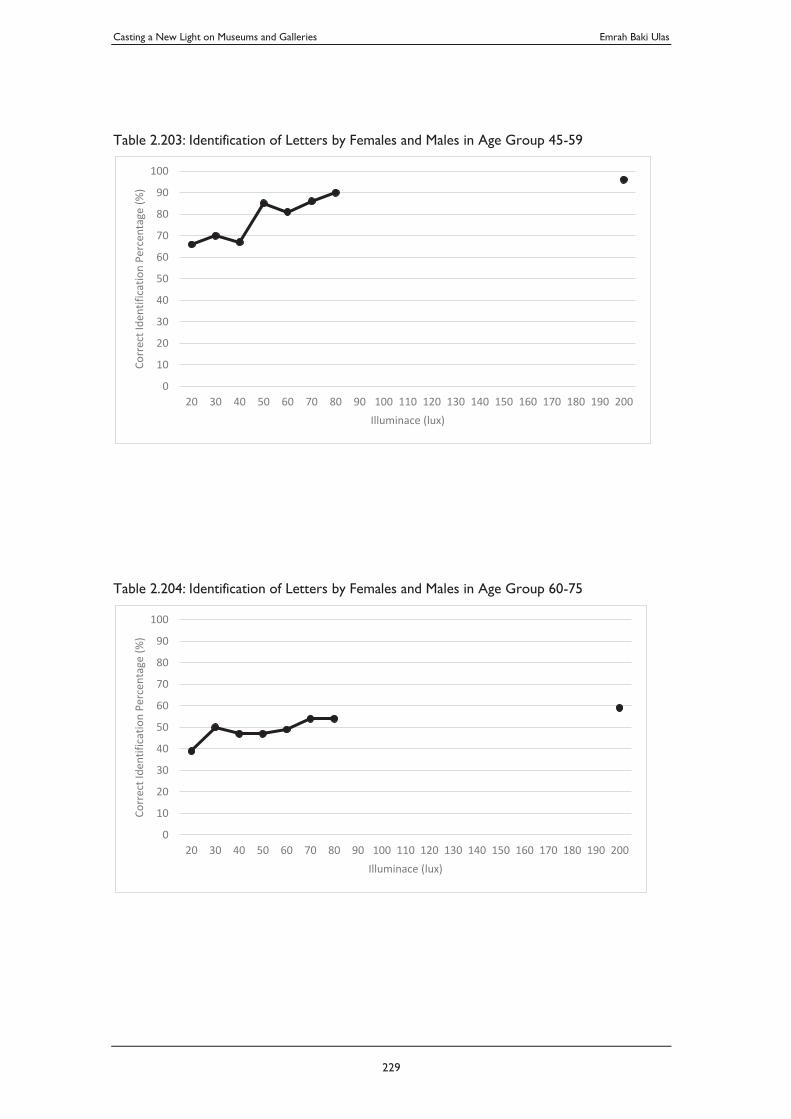
Casting a New Light on Museums and Galleries Emrah Baki Ulas
229
Table 2.203: Identification of Letters by Females and Males in Age Group 45-59
Table 2.204: Identification of Letters by Females and Males in Age Group 60-75
0
10
20
30
40
50
60
70
80
90
100
20 30 40 50 60 70 80 90 100 110 120 130 140 150 160 170 180 190 200
Corr
ect I
dent
ifica
tion
Perc
enta
ge (%
)
Illuminace (lux)
0
10
20
30
40
50
60
70
80
90
100
20 30 40 50 60 70 80 90 100 110 120 130 140 150 160 170 180 190 200
Corr
ect I
dent
ifica
tion
Perc
enta
ge (%
)
Illuminace (lux)
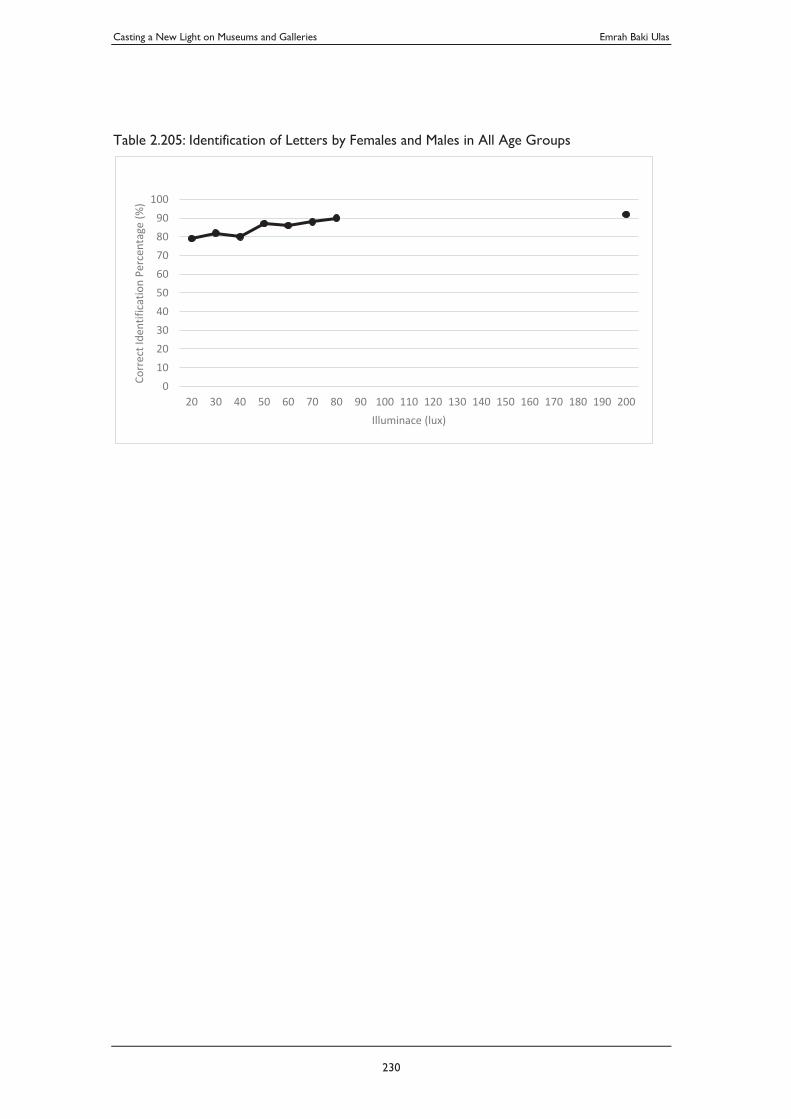
Casting a New Light on Museums and Galleries Emrah Baki Ulas
230
Table 2.205: Identification of Letters by Females and Males in All Age Groups
0102030405060708090
100
20 30 40 50 60 70 80 90 100 110 120 130 140 150 160 170 180 190 200
Corr
ect I
dent
ifica
tion
Perc
enta
ge (%
)
Illuminace (lux)
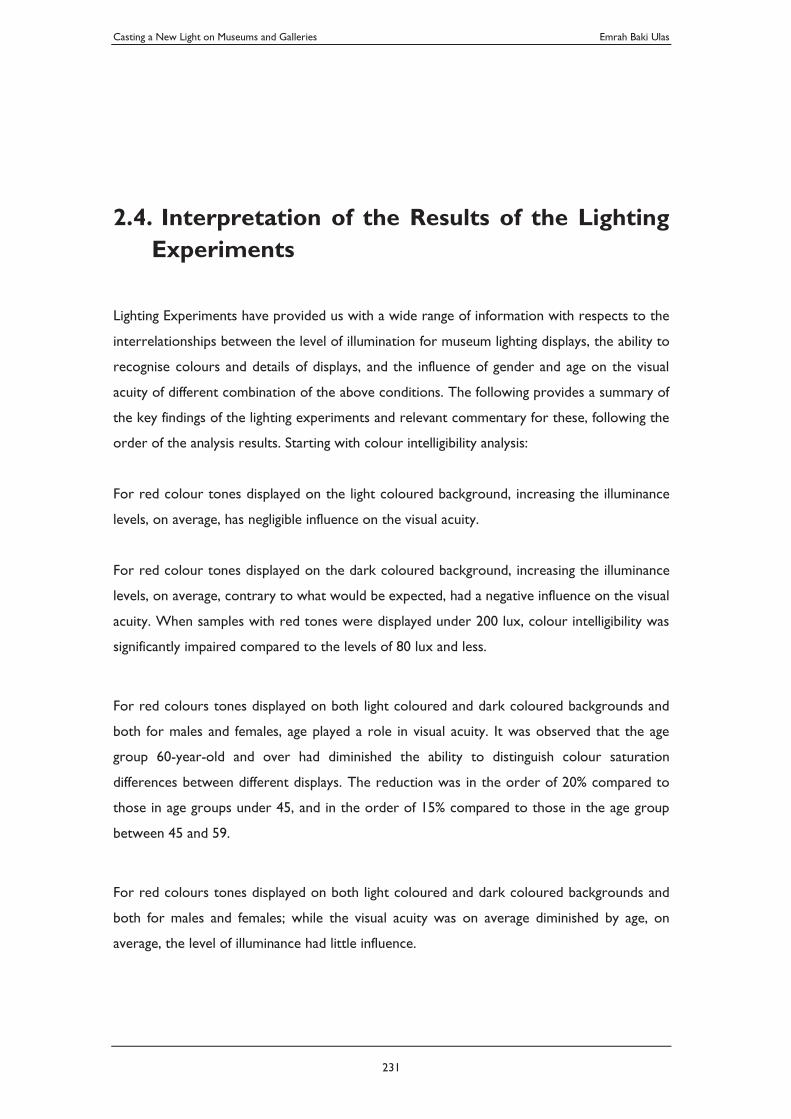
Casting a New Light on Museums and Galleries Emrah Baki Ulas
231
2.4. Interpretation of the Results of the Lighting Experiments
Lighting Experiments have provided us with a wide range of information with respects to the
interrelationships between the level of illumination for museum lighting displays, the ability to
recognise colours and details of displays, and the influence of gender and age on the visual
acuity of different combination of the above conditions. The following provides a summary of
the key findings of the lighting experiments and relevant commentary for these, following the
order of the analysis results. Starting with colour intelligibility analysis:
For red colour tones displayed on the light coloured background, increasing the illuminance
levels, on average, has negligible influence on the visual acuity.
For red colour tones displayed on the dark coloured background, increasing the illuminance
levels, on average, contrary to what would be expected, had a negative influence on the visual
acuity. When samples with red tones were displayed under 200 lux, colour intelligibility was
significantly impaired compared to the levels of 80 lux and less.
For red colours tones displayed on both light coloured and dark coloured backgrounds and
both for males and females, age played a role in visual acuity. It was observed that the age
group 60-year-old and over had diminished the ability to distinguish colour saturation
differences between different displays. The reduction was in the order of 20% compared to
those in age groups under 45, and in the order of 15% compared to those in the age group
between 45 and 59.
For red colours tones displayed on both light coloured and dark coloured backgrounds and
both for males and females; while the visual acuity was on average diminished by age, on
average, the level of illuminance had little influence.
Casting a New Light on Museums and Galleries Emrah Baki Ulas
232
For red colour tones displayed, for lower light levels, colour intelligibility for samples viewed
on a dark background was slightly better than those displayed on a light background (approx.
5% better for light levels between 30 and 80 lux). For higher levels, the colour intelligibility of
the samples on the light background was significantly better than those on the dark background.
For Red colour tones displayed, the difference between the average results of colour
intelligibility for males and females was negligible.
For amber colour tones displayed on the light coloured background, increasing the illuminance
levels, on average, has a small positive influence on the visual acuity.
For amber colour tones displayed on the dark coloured background, increasing the illuminance
levels, on average, contrary to what would be expected, had a small negative influence on the
visual acuity. When samples with amber tones were displayed under 200 lux, colour
intelligibility was significantly impaired compared to the levels of 50 lux and less.
For amber colours tones displayed on both light coloured and dark coloured backgrounds and
both for males and females, age played a role in visual acuity. It was observed that the age
group 60-year-old and over had diminished the ability to distinguish colour saturation
differences between different displays. The reduction was in the order of 25% compared to
those in age groups under 30, and in the order of 20% compared to those in the age group
between 30 and 59.
For amber colours tones displayed on both light coloured and dark coloured backgrounds and
both for males and females; while the visual acuity was on average diminished by age, on
average, the level of illuminance had little influence.
For amber colour tones displayed, for lower light levels, colour intelligibility for samples viewed
on the dark background was better than those displayed on the light background (approx. 15%
better for light levels between 30 and 50 lux). For higher levels, the colour intelligibility of the
samples on the light background was significantly better than those on the dark background.
Casting a New Light on Museums and Galleries Emrah Baki Ulas
233
For amber colour tones displayed, the difference between the average results of colour
intelligibility for males and females was approximately 10%. Females were approximately 10%
more likely to distinguish amber colour saturation differences successfully compared to males.
While general trends were observed, the deviation of results at different light levels between
the results with amber colours was higher compared to reds tones, resulting in more fuzzy
results. Red colours, in general, followed more consistent trends.
On the overall, the colour intelligibility of Green tones on display was approximately 5% better
than the colour intelligibility of the red tones, and approximately 10% better than the colour
intelligibility of the amber colour tones.
For green colour tones displayed on the light coloured background, increasing the illuminance
levels, on average, has negligible influence on the visual acuity.
Similar to the trend in the light coloured background, for green colour tones displayed on the
dark coloured background increasing the illuminance levels, on average, also has negligible
influence on the visual acuity. This is contrary to the trend identified in longer wavelengths
(Red and Amber tones). When samples with green tones were displayed under 200 lux, colour
intelligibility remained very close to the results under the levels of 20 lux.
For green colours tones displayed on both light coloured and dark coloured backgrounds and
both for males and females, age played a role in visual acuity. It was observed that the age
group 60-year-old and over had diminished the ability to distinguish colour saturation
differences between different displays. For this age group while the colour intelligibility of the
green tones was significantly better compared to the colour intelligibility of the red or amber
tones, within the green tones the reduction was in the order of 20% compared to those in age
groups under 30, and in the order of 15% compared to those in the age group between 30 and
59.
For green colour tones displayed on both light coloured and dark coloured backgrounds and
both for males and females; while the visual acuity was on average diminished by age, on
average, the level of illuminance had little influence.
Casting a New Light on Museums and Galleries Emrah Baki Ulas
234
For green colour tones displayed, the tone of the background did not seem to make a significant
difference on colour intelligibility.
For green colour tones displayed, the difference between the average results of colour
intelligibility for males and females was more than 10%. Females were approximately 10% or
more likely to distinguish green colour saturation differences successfully compared to males.
On the overall, the colour intelligibility of blue tones on display was the highest amongst all
colour tones. It was only slightly better than the colour intelligibility of the green tones,
approximately 5% better than the colour intelligibility of the red tones, and approximately 10%
better than the colour intelligibility of the amber colour tones.
For blue colour tones displayed on the light coloured background, increasing the illuminance
levels, on average, has negligible influence on the visual acuity.
Similar to the trend in the light coloured background, for blue colour tones displayed on the
dark coloured background, increasing the illuminance levels, on average, also has negligible
influence on the visual acuity. This is in alignment with the trend in mid-wavelengths (green
tones). And is contrary to the trend identified in longer wavelengths (Red and Amber tones).
When samples with blue tones were displayed under 200 lux, colour intelligibility remained
very close to the results under the levels of 20 lux.
For blue colours tones displayed on both light coloured and dark coloured backgrounds and
both for males and females, age played a role in visual acuity. It was observed that the age-
based differences in visual acuity were the least significant in blue colour tones. The age group
60-year-old and over had diminished the ability to distinguish colour saturation differences
between different displays. The reduction was in the order of 10% compared to those in age
groups under 59.
For blue colours tones displayed on both light coloured and dark coloured backgrounds and
both for males and females; while the visual acuity was on average diminished by age, on
average, the level of illuminance had little influence.
Casting a New Light on Museums and Galleries Emrah Baki Ulas
235
For blue colour tones displayed, for lower light levels, colour intelligibility for samples viewed
on the dark background was slightly better than those displayed on the light background
(approx. 5% better for light levels between 30 and 80 lux). For higher levels, the colour
intelligibility of the samples on the light background was significantly better than those on the
dark background.
For blue colour tones displayed, the difference between the average results of colour
intelligibility for males and females was more than 10%. Females were approximately 10% or
more likely to distinguish green colour saturation differences successfully compared to males.
This was consistent with the sex-based evaluation of the results with the colour intelligibility
of amber, green and blue tones.
When all results of colour intelligibility were considered;
On the overall, the ability to distinguish differences in colour saturation appeared to increase
as the colours shifted from red colours to amber, green and blue colours. There was a more
significant jump from the red to amber tones and from amber tones to greens, and only a slight
improvement from green tones to blue tones.
Colour tones that reflect longer wavelengths better than shorter wavelengths seem to offer
better distinguishability of saturation differences at lower levels of illumination, whereas, for
those that reflect mid or shorter wavelengths better, changes in illuminance levels made little
difference.
For all colours tones displayed on both light coloured and dark coloured backgrounds and both
for males and females, age played a role in visual acuity. It was observed that the age-based
differences in visual acuity presented themselves most profoundly in the age group 60-year-old
causing diminished ability to distinguish colour saturation differences between different
displays. The reduction was in the order of 10% to 20% depending on the colour tone. It was
also noted that, on average, age made little to no difference to colour intelligibility between
the under the 30s and those who are in the age group 30 to 44.
Casting a New Light on Museums and Galleries Emrah Baki Ulas
236
For all colours, on average, the level of illuminance had little influence on colour intelligibility.
However when the analysis was considered separately for lighter and darker background. It
was observed that for displays on light backgrounds colour intelligibility increased by
approximately 10% from 20 lux to 200 lux; less than 1% improvement for every 10 lux increase.
In contrasts, for displays on dark backgrounds colour intelligibility decreased by approximately
20% from 20 lux to 200 lux; less than 2% improvement for every 10 lux reduction.
With exceptions, under low light levels (Below 80 Lux), colour intelligibility for colour samples
viewed on the dark background was better than those displayed on the light background. Under
higher levels (80 and above), the colour intelligibility of the samples on the light background
was better than those displayed on the dark background.
Considering all results; Females were approximately 10% or more likely to distinguish colour
saturation differences successfully compared to males.
For detail intelligibility experiments:
On the overall, the ability to recognise details (by way of correct identification of the Sloan
Letters) has increased with the increasing levels of illumination. However, the differences in
the improvement were very highly dependent on age. For participants under the age of 30,
increasing the light levels from 20 lux to 200 lux made only a negligible 3% difference, for the
age group between 30 and 44, the difference remained at approximately 7% only. For age
groups over 45, however, the ability to recognise detail was more dependent on the level of
illumination with approximately 20% improvement in detail recognition between 20 lux and
200 lux. For all age groups, the improvements followed a relatively consistent direct correlation
whereby detail recognition improved by increasing level of illumination.
Another age based finding on detail intelligibility experiments were that the detail recognition
for ages up to 44 followed a consistent pattern, having very high degree of detail intelligibility
under test conditions. For the age group of 45-59, the results were approximately 10% less
successful under matching conditions. For the age group of over 60, the results were
approximately 40% less successful under matching conditions.
Casting a New Light on Museums and Galleries Emrah Baki Ulas
237
Considering all results, males were approximately 30% more likely to successfully recognise
detail differences (identify Sloan letters) compared to females.
On average, increasing illuminance levels on the displays increased the detail intelligibility only
slightly. An average improvement of 12% was observed for an increase of illuminance level
from 20 lux to 200 lux; less than 1% improvement for every 10 lux increase.
Casting a New Light on Museums and Galleries Emrah Baki Ulas
238
2.5. Summary
Lighting experiments undertaken under this research have provided us with findings that
indicate correlations between visual acuity, levels of illumination, object characteristics (colour)
and context characteristics (background tone). The findings also draw attention to age-based
and sex-based differences in visual acuity, for both colour recognition and detail recognition.
The following summarise the key points:
The experiments have confirmed the impact of ageing on both colour intelligibility and detail
intelligibility. It is observed that increasing levels of illumination can help lessen this impairment.
Viewing display samples under higher levels of illumination, increased the abilities of aged
individuals in recognising colour saturation differences as well as recognising details. While
both abilities tend to reduce by increasing age, it is evident that the ability to recognise and
distinguish colours get affected less than the ability to distinguish fine details. Likewise, while
both abilities can be assisted using higher levels of illumination. The support that higher levels
of illumination provide for colour recognition follows a different pattern compared to detail
recognition. E.g. a certain amount of increase in the level of illuminance can increase the
individual’s colour recognition ability much more than their detail recognition ability. I.e. In
general to improve detail intelligibility for the ageing much higher levels of illumination is
required compared to the levels that would improve colour intelligibility. Below charts
illustrate the difference between these two, by way of showing the trend lines for required
adjustments to the levels of illuminances based on the age of the viewer.
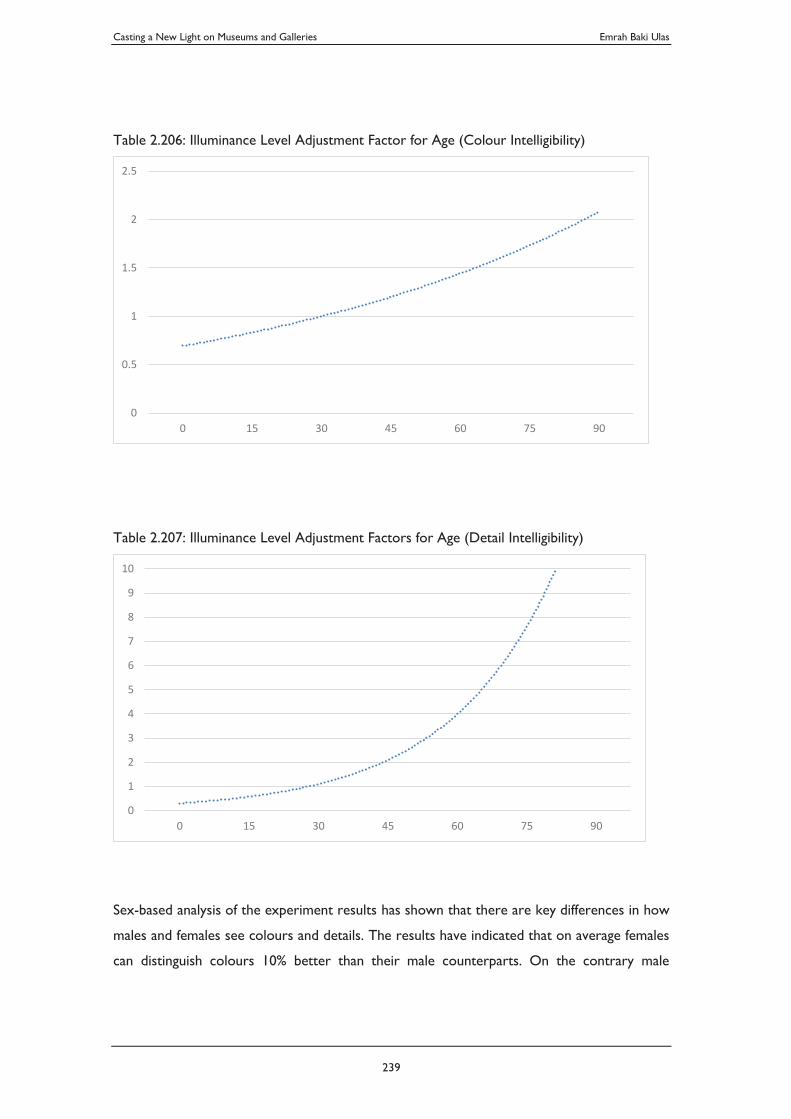
Casting a New Light on Museums and Galleries Emrah Baki Ulas
239
Table 2.206: Illuminance Level Adjustment Factor for Age (Colour Intelligibility)
Table 2.207: Illuminance Level Adjustment Factors for Age (Detail Intelligibility)
Sex-based analysis of the experiment results has shown that there are key differences in how
males and females see colours and details. The results have indicated that on average females
can distinguish colours 10% better than their male counterparts. On the contrary male
0
0.5
1
1.5
2
2.5
0 15 30 45 60 75 90
0
1
2
3
4
5
6
7
8
9
10
0 15 30 45 60 75 90
Casting a New Light on Museums and Galleries Emrah Baki Ulas
240
participants had a higher degree of ability to distinguish details (by approximately 30%) under
the same conditions.
Lighting may be used as a means to balance the age-based and sex-based factors that may affect
colour intelligibility and detail intelligibility. E.g. by adjusting levels of lighter a certain museum
exhibition may be made better presented for an aged group of visitors, or can be adjusted to
suit a group of male or female visitors, to enhance the displays in a way that supports their
specific needs for visual acuity. These sorts of interventions would require drastic changes to
the levels of illumination and can practically only be applied on a temporary and short-term
basis for a specific circumstance whereby the visitor profile is relatively consistent. When it
comes to addressing visual acuity for a typical museum or gallery display scenario, the visitor
profile is often highly varied and the above a level of control is often not the possible.
When we look at a mix of population of different ages and sexes, a key finding of this research
is how little the level of illumination affects colour intelligibility or detail intelligibility. As noted
in the detailed analysis, on average, between 20 and 200 lux, every 10 lux increase can improve
detail intelligibility by a minute amount of less than 1%. Similarly, on average, the impact of the
change of illuminance levels on colour intelligibility is also small. These findings question the
notion of minimum acceptable level of the illuminance of 50 lux. Since, the findings indicate no
significant difference between the levels of illumination of 50 lux and say 40, 30 or 20 lux for
detail recognition or colour recognition.
A finding that is noteworthy is regarding the difference of colour recognition on light
background versus dark background. As noted above, when we look at the average, we see
the influence of changing levels of illumination makes almost no impact on the results. However,
when they are analysed based on the tone of the background, it becomes apparent that,
although still relatively small, the lightness of the background has an inversely proportional
relationship with the level of illuminance, with respect to colour intelligibility. On a light
background, colour intelligibility tends to improve slightly (by less than 1% per every 10 lux) as
the light levels elevate. On a dark background, on the other hand, colour intelligibility tends to
reduce (by less than 2% per every 10 lux) as the light levels elevate. This suggests that the same
item can be displayed with similar colour recognition, on a dark background and under lower
levels of illumination, as it would be displayed on a light background but under higher levels of
illumination.
Casting a New Light on Museums and Galleries Emrah Baki Ulas
241
In summary, based on the above findings, it is suggested that the 50 lux rule is replaced by an
approach that drops the minimum acceptable level of illuminance to 20 lux for adult viewers
with normal vision (taking the age of 30 years as the benchmark) and gives the museum
professionals the ability to alter levels of light using adjustment factors, to suit the visitor profile
best. This can be done by using the adjustment factors to increase the levels of minimum
requirement for aged visitors. E.g. if there is a specific time when a museum display will be
visited by a predominantly aged group, the illumination levels can be increased for that
occasion, to serve the visual needs of these visitors better, but then reverted back to the
original scheme with lower levels of light, in order to protect the objects against light-induced
damage. Further studies on the effect of background luminance and contrast can help develop
an adjustment factor that can establish a better understanding of the correlations between the
levels of illumination and background luminance. Similarly, the studies to establish a scale of
complexity of detail, and to develop an adjustment factor (e.g. to increase light levels to
enhance displays with complex visual tasks and enhance the visitors’ visual acuity) can advance
the practical application of lighting towards attaining better visual conditions for museum and
gallery displays. With these, the minimum recommended level of illumination for a museum
display is no more considered a fixed, constant figure, but one that is adjustable with due
consideration to the visitor profile, the context, and the object.
Casting a New Light on Museums and Galleries Emrah Baki Ulas
242
3. Light and Preventive Conservation in Museums and Gallery Exhibition Display
When a Museum or a Gallery presents cultural material by placing it on an exhibition display,
they contribute to the society in many ways, by making that material accessible for the general
public, for researchers, scholars or any other specific group of viewers. In this respect, the
availability of cultural material for inspection, observation, study or pure enjoyment is a key
element in the cultural fabric of a society and has worth. A museum’s or a gallery’s role in the
society, however, is not only limited to presenting or sharing cultural material in the present
day. The responsibility extends to tomorrow; looking after and preserving cultural material as
much as possible so that, where relevant, they remain as accessible and beneficial to the future
societies also.
3.1. Evaluating the Consequence of Lighting on Preventive Conservation of Exhibits on Display
The conflicts that arise in serving the two fundamental objectives for a museum or a gallery to
serve its target audience; the presentation and the preservation; are a result of the nature of
the cultural materials themselves as well as the effect of the environmental conditions of the
exhibition display context on these materials.
In this sense, a decision to place a cultural object on an exhibition display at a certain point in
time may influence its future availability to a varying degree. The concern that presentation of
an object in a museum exhibition display may put it at risk makes it essential to appreciate and
pay close attention to the mechanisms that result in the decay, degradation or transformation
processes for the materials, to minimise the occurrence of these. To understand these
Casting a New Light on Museums and Galleries Emrah Baki Ulas
243
processes one needs to analyse the nature of materials and the effect of the environmental
parameters on these materials.
In chapter one, I discussed that the museum display environment might pose various types of
risks to cultural material ranging from deliberate human factors such as theft or vandalism.
These risks can be physical, biologically or chemically driven and can damage materials in many
ways resulting in an irreversible situation. Even when the displayed items are safeguarded well
against more apparent risks, materials can be transformed due to the environmental conditions
within the display space, including the temperature, humidity, pollutants as well as lighting. In
this chapter I focus more closely on the effect of lighting on the materials that are on exhibition
display in a museum or gallery environment, to understand, analyse, assess and develop a new
framework to prevent light-induced damage to cultural material in museum and gallery display
environments. Firstly, I look into the mechanisms of how light-induced damage
(photodegradation) occurs; its cause, the circumstances, and conditions whereby it happens,
its process and impact. I then study the ways we measure and quantify light-induced damage;
how we categorise the extent of light-induced damage, how we determine acceptable and
unacceptable degrees of damage, how we classify materials according to their potential to be
affected by light-induced damage (as not all materials get affected from light in the same way),
how we regulate how the materials should be classified, handled and displayed as far as their
relationship with light is concerned. Thirdly, I discuss the composition of light in terms of its
potential to cause light-induced damage; the correlations between different wavelengths within
the spectrum and their relative damage potential, the impact of the UV portion of the emitted
energy from a light source compared to the visible portion and the infrared portion of its
output, and how different light sources cause different degrees of light-induced damage, due to
the composition of their output spectrum being different than one another. I then proceed to
evaluate the impact of Light-emitting Diodes in causing light-induced damage to materials in
comparison to incandescent sources and propose a framework to form more tailored
preventive conservation guidelines for lighting accordingly.
Casting a New Light on Museums and Galleries Emrah Baki Ulas
244
3.1.1. Light as A Cause of Deterioration
In his 2004 Article for Canadian Conservation Institute, Stefan Michalski (2013) eloquently and
simply summarises the dilemma of lighting in a museum display environment as follows:
We need light to see collections, but light damages some objects. Concerning risk management trade-
offs, we must make a decision that minimises the loss of value due to poor visual access and the loss
of value due to permanent damage. Regarding ethics and visual access, we must balance the rights of
our own generation with the rights of all future generations. Regarding practical reality, we must
generalise across a multitude of such decisions because objects differ in both their sensitivity to light
and their visibility. Also, display spaces in many museums depend on highly variable and poorly
controlled lighting. This section examines the components of these decisions and offers some summary
guidelines. However, the painful dilemma never disappears — seeing collections well today, and seeing
them "well" in the future (Michalski, 2013).
Light-induced damage is often generalised as being limited to "fading". While fading is a visually
distinctive and recognisable form of light-induced damage, there is more to it. Light can cause
materials to lose their colour properties but also can cause them to fall apart and decompose
both chemically and physically. The degree of potential damage depends on the type of
materials. Some materials such as silk, paper, feathers or other delicate organic structures,
some types of dyes and fabrics can be very susceptible and can easily be affected by light; while
other materials such as metals and rocks can be very resilient to light-induced damage.
Many resources discuss light-induced damage considering not only the portion of the
electromagnetic spectrum between the wavelengths of 380 and 700 nanometres; that is visible
to human eye, but also the neighbouring portions of ultraviolet band and the infrared band, as
most light sources radiate some degrees of ultraviolet and infrared radiation while illuminating
objects.
Damage caused by either visible portion of light, the ultraviolet band or the infrared radiation
can reduce the readability, have an impact on the aesthetics, structure and physical integrity;
hence the appreciation of the cultural material and may lessen access to the information
Casting a New Light on Museums and Galleries Emrah Baki Ulas
245
contained within the object. Such damage is a cumulative and irreversible process, in that the
damage is a continuous process for as long as the object is subject to light exposure and the
damage caused cannot revert to its original state (Conn, 2012). It has even been noted that
some processes once started will continue even when the object is no longer exposed to light
(e.g. autocatalytic deterioration of newspaper in storage after light exposure). In this respect,
it might be worth noting that the role of the museum can often be to preserve cultural material
even from where it originated in situ. Museums and galleries also tour cultural objects which
is an added complication.
Let’s now refer again to Michalski in how he clarifies the distinction between these bands of
the electromagnetic spectrum; to explain an issue that is often misunderstood in museum
practice:
In the museum business, one often hears the expression "the light contains ultraviolet and infrared."
This is incorrect and will lead to unnecessary confusion in practical discussions of museum lighting.
Light, by definition, is the band of radiation to which our eye is sensitive. Ultraviolet radiation (UV) and
infrared radiation (IR) are not visible. They are the bands of radiation on either side of the visible band
(ultra means beyond, infra means below). Informally, the term radiation is dropped. We usually speak
of ultraviolet and infrared, or simply of UV and IR. Ultraviolet and infrared are not necessary for seeing
(except in rare cases of UV fluorescent colours); therefore, they are not part of the dilemma between
seeing and damaging, they are simply damaging.
It is correct, however, to state that some light sources emit ultraviolet and infrared, or that museum
lighting may cause UV and IR deterioration
The different types of damage typical of UV, light, and IR result from their different photon energies.
The photochemistry that underlies much of the disintegration of materials and production of yellow by-
products typical of UV exposure requires energies greater than about 3 eV, whereas the photochemistry
typical of colourant fading, as well as the operation of our retina, occurs in a range between about 2
eV and 3 eV. We are fated, in fact, to see in the same band as that which causes sensitive colourants
to fade, given the related photochemical phenomena. Infrared photons are not energetic enough to
initiate any of the forms of photochemistry driven by UV or light, so their effect is simply a heating of
the surfaces that absorb them (Michalski, 2013).
Casting a New Light on Museums and Galleries Emrah Baki Ulas
246
As Michalski (2013) explains, in practice, the effect of the infrared portion of the radiation is
not considered as light-induced damage (photodegradation) as the phenomena of damage in
the instance of exposure to infrared radiation, different to the exposure to ultraviolet or visible
radiation, is not of the same photochemical nature. The damage caused by infrared radiation is
often referred to as thermal ageing.
Cuttle (2003) also makes a distinction between two forms of light-induced damage;
photochemical reactions and radiant heating effect, the former having a greater potential to
cause damage to cultural material in a context of museum display.
Since the photon energy levels of infrared band radiation are too low to overcome the bonding
force of the molecules of all but the most sensitive materials, their impact often occurs by the
absorption of the heat by the materials (Cuttle, 2003). If not managed, infrared radiation may
cause temperature increase on the surface of the material. It also alters the moisture balance
and can cause physical expansion all of which may deform the materials physical and visual
integrity and degrade it over time. Typically, thermal ageing is prevented by controlling climatic
conditions of temperature and humidity and keeping them relatively stable within the exhibition
display space, to prevent alterations to the material. Thermal ageing is not dealt with further
in this research. When I discuss light-induced damage from this point, I consider the
photochemical effects of ultraviolet and visible bands of the electromagnetic spectrum and not
the infrared band.
Critical to understanding light-induced damage is to study the photochemistry of the process
in how it occurs. The change in the composition of materials due to exposure to visible light
or ultraviolet radiation is described as photodegradation. Photodegradation is a process
whereby the object is transformed through hydrolysis and oxidation. In this respect
photodegradation practically occurs not only solely due to exposure to light but also exposure
to air. When photons are absorbed by the molecules that act as colourants, the characteristics
of these molecules may change from a stable state to an excited state. Excited molecules are
very volatile and unstable. As the molecules go from excited state back to a stable state, the
oxygen compounds in the atmosphere go into a chemical reaction with these colourant
molecules resulting in oxygenic bi-products. These bi-products are very reactive and may alter
the composition of the colourant molecules resulting in loss of colour destroying the
colourants (Kumar, 2017) (After Schindler, 2004).
Casting a New Light on Museums and Galleries Emrah Baki Ulas
247
Simmler (2011) explains the process of photodegradation from a chemical point of view, with
the following:
Many organic chemicals are thermodynamically unstable in the presence of oxygen. However, their
rate of spontaneous oxidation is slow at room temperature. In the language of physical chemistry, such
reactions are kinetically limited. This kinetic stability allows the accumulation of complex environmental
structures in the environment. Upon the absorption of light, triplet oxygen converts to singlet oxygen, a
highly reactive form of the gas, which effects spin-allowed oxidations. In the atmosphere, the organic
compounds are degraded by hydroxyl radicals, which are produced from water and ozone.
Photochemical reactions are initiated by the absorption of a photon, typically in the wavelength range
290-700 nm (at the surface of the Earth). The energy of an absorbed photon is transferred to electrons
in the molecule and briefly changes their configuration (i.e., promotes the molecule from a ground state
to an excited state). The excited state represents what is essentially a new molecule. Often excited
state molecules are not kinetically stable in the presence of O2 or H2O and can spontaneously
decompose (oxidise or hydrolyse). Sometimes molecules decompose to produce high energy, unstable
fragments that can react with other molecules around them. The two processes are collectively referred
to as direct photolysis or indirect photolysis (Simmler, 2011).
As far as cultural material in a museum display context is concerned, the above means changing
the visual properties of the displayed museum items and involves alterations to their properties
such as (and most commonly) their colours, forms, textures or structures. For example inks,
dyes and pigments may lose their colour saturation or their hues may shift; physical changes
happen, for example, mechanical strength can be weakened, glossy materials may become
matte, textured surfaces may even out.
As noted previously, Photodegradation is an irreversible process, whereby the change is
permanent, and it is impossible for the material to revert to its original state or for interventive
methods to revert to the lost information other than to repair through methods that copy,
imitate, simulate or interpret the lost details in a synthetic way.
I have previously discussed that photodegradation usually is a process that occurs over a long
period that may extend to several years, decades or even centuries (There are, of course,
exceptions to this, depending on the materials involved. E.g. Newspaper can see rapid change.
Casting a New Light on Museums and Galleries Emrah Baki Ulas
248
Likewise, fluorescent felt tip inks also change rapidly). I have also discussed that it is cumulative,
in other words, it builds up over time as a factor of the rate of exposure and the duration of
exposure. This is regarded in the terminology as “the law of reciprocity”.
Also known as the Bunsen-Roscoe Law; the law of reciprocity dates back to 1862, discovered
by the German physicist Robert Wilhelm Eberhard Bunsen (1811–99) and the British chemist
Henry Enfield Roscoe (1833–1915), this law states that when all other conditions are kept
constant, the exposure time needed to give a certain photographic effect is inversely
proportional to the intensity of the light radiation.
According to this principle, for a light susceptible museum object on display, the effect of
photodegradation that would be observed due to exposure to an intense radiation for a short
timeframe will be equivalent to the effect that would be observed due to a weaker radiation
for a longer timeframe (Thomson, 1978). In other words, what matters in assessing and
managing the effects of photodegradation in the museum world is the total exposure. The total
exposure is simply a multiplication of the illuminance and the duration. To explain with an
example; according to this principle, exposure to a level of the illuminance of 1,000 lux for 100
hours would result in the same degree of damage as exposure to 100 lux for 1,000 hours or
say 10 lux for 10,000 hrs, etc. Mathematically put, the law of reciprocity states that:
(3.1)
Where
is the dose (exposure) [luxhours],
is the incident illuminance on the material [lux], and
is the duration of exposure [hours]
Michalski (1996) states that the impact of photodegradation is cumulative and follows a simple
additive manner, and again according to Michalski (1996) studies have upheld this principle as
applied to light-sensitive materials, notably that conducted by Saunders and Kirby of the
Casting a New Light on Museums and Galleries Emrah Baki Ulas
249
National Gallery of London, it must be noted that the law of reciprocity has been proven to
not hold in numerous circumstances and several scientists have argued its validity.
The law of reciprocity does not hold at extremely high and extremely low light intensities
when reciprocity failure is said to occur (Thewlis, 1962). Druzik (2012) states that applying
preventive conservation related predictions based on accelerated light damage is considered
risky due to the likelihood that rate of colour fading may not be the same as for longer duration
exposures at a lower level of illuminance. He argues that the fading behaviour of materials at
differing levels of illuminance are dissimilar. Similarly, Blackwell (2002) has discussed that the
effects of light damage on highly sensitive materials would vary depending on whether the level
of illuminance is high or low, therefore, questioning the validity of the law of reciprocity. Martin,
Chin, and Nguyen (2003) have undertaken a range of Reciprocity law experiments in polymeric
photodegradation at the NIST whereby they have critically reviewed results of a range of
materials under high radiant flux, laboratory-based experiments. Their findings indicate there
are complications to a universal acceptance of accelerated light fading conditions as being truly
and accurately representative of slower rate light fading conditions (Martin et al. 2003).
It must be noted, also, that the law of reciprocity does not suggest that the effect of damage is
directly correlated to the exposure. I.e. halving the total exposure does not mean halving the
damage, or vice versa doubling the exposure does not mean doubling the damage caused. It
has been established that the rate of deterioration reduces gradually and with time. The same
exposure causes a higher degree of fading on an object early on during its usable life than it
would at a later stage (Thomson, 1978).
Worthwhile mentioning here is the work of Schwarzschild (1900); whereby he has studied the
deviations from the law of reciprocity. Although Schwarzschild has developed this principle in
an attempt to explain astronomical observations of low-intensity reciprocity failure, it has
direct relevance to the topic of photodegradation. Schwarzschild’s law can be applied to the
law of reciprocity in the context here, somewhat explaining that the photodegradation effects
due to light exposure is not directly proportional and reduces over time. Mathematically,
Schwarzschild has formulated this by applying a factor (which is referred to as Schwarzschild’s
constant) to the law of reciprocity whereby:
Casting a New Light on Museums and Galleries Emrah Baki Ulas
250
(3.2)
Where
is the dose (exposure) according to Schwarzschild [luxhours],
is the incident illuminance on the material [lux],
is the duration of exposure [hours], and
is Schwarzschild’s Constant
Schwarzschild’s original value for was 0.86. Martin et al. (2004) question this value being of
relevance or benefit. Clark (2007) also suggests that a constant value for is elusive and that
the necessity for more advanced and relevant mathematical explanation is still required.
Where = 1 When the law of reciprocity mathematically matches in its form originally
suggested and referred to by Bunsen-Roscoe (1862), for values under = 1, the formula above
explains how the effects of photodegradation reduce through time and do not follow the same
trend.
I will further discuss the law of reciprocity in the next section (See 3.1.2) and the way it is
applied in practice in how the current day museum lighting conservation guidelines are
formulated.
Here, let’s turn our focus to a key question: Do different wavelengths of radiation affect
materials in the same way or differently? In other words, is the degree of damage dependent
on the wavelength of radiation or is it the same across the ultraviolet and visible portions of
the electromagnetic spectrum?
Wavelength is indeed an important factor in light-induced damage. Shorter wavelength (higher
frequency) portions of the spectrum contain higher levels of energy that can alter the molecular
structure of materials easier than the longer wavelength (lower frequency) portions.
Figure 3.1 illustrates the relationship between the damaging potential and the wavelength of
radiation (The Berlin Function) (Cuttle, 2007), and the relationship between visual response
and the wavelength of radiation. The exponentially reclining curve in red illustrates how the
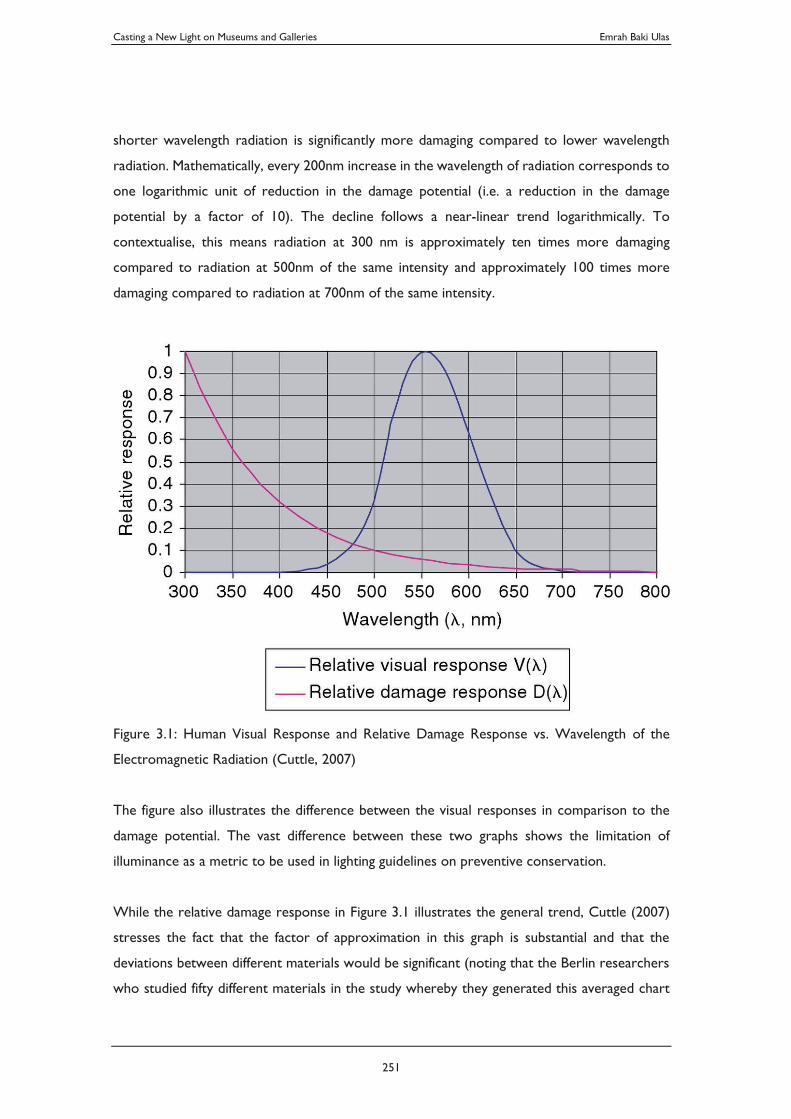
Casting a New Light on Museums and Galleries Emrah Baki Ulas
251
shorter wavelength radiation is significantly more damaging compared to lower wavelength
radiation. Mathematically, every 200nm increase in the wavelength of radiation corresponds to
one logarithmic unit of reduction in the damage potential (i.e. a reduction in the damage
potential by a factor of 10). The decline follows a near-linear trend logarithmically. To
contextualise, this means radiation at 300 nm is approximately ten times more damaging
compared to radiation at 500nm of the same intensity and approximately 100 times more
damaging compared to radiation at 700nm of the same intensity.
Figure 3.1: Human Visual Response and Relative Damage Response vs. Wavelength of the
Electromagnetic Radiation (Cuttle, 2007)
The figure also illustrates the difference between the visual responses in comparison to the
damage potential. The vast difference between these two graphs shows the limitation of
illuminance as a metric to be used in lighting guidelines on preventive conservation.
While the relative damage response in Figure 3.1 illustrates the general trend, Cuttle (2007)
stresses the fact that the factor of approximation in this graph is substantial and that the
deviations between different materials would be significant (noting that the Berlin researchers
who studied fifty different materials in the study whereby they generated this averaged chart
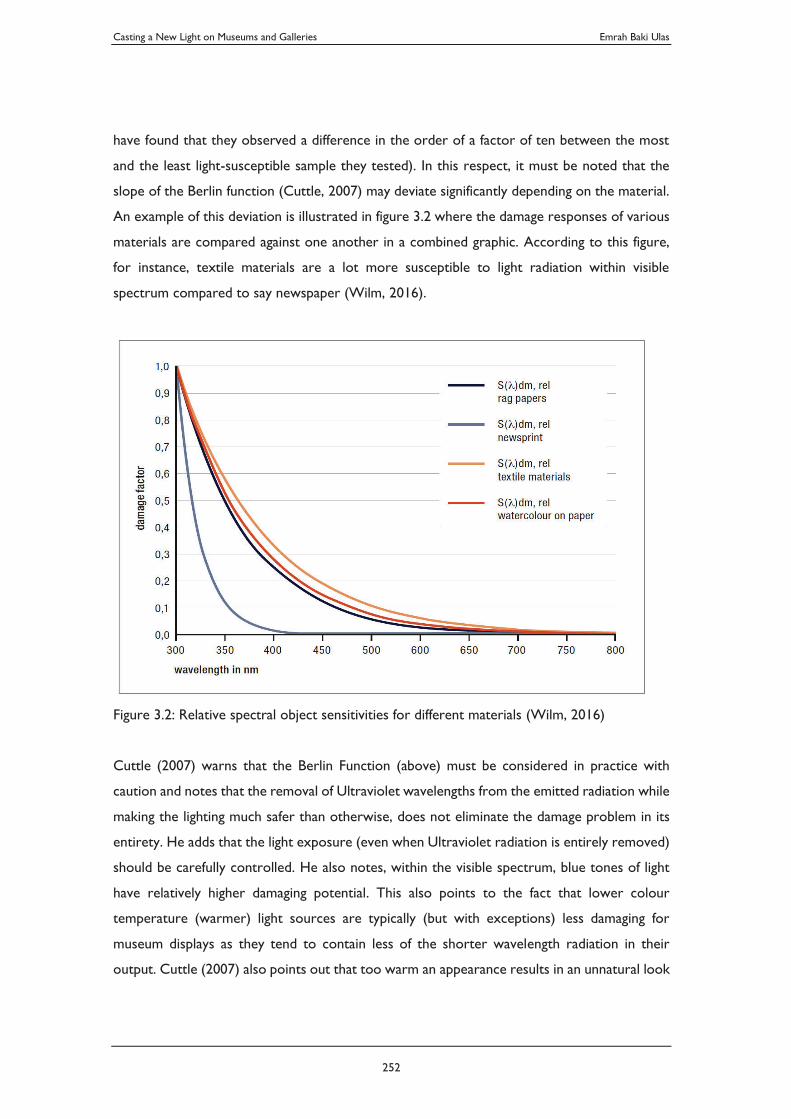
Casting a New Light on Museums and Galleries Emrah Baki Ulas
252
have found that they observed a difference in the order of a factor of ten between the most
and the least light-susceptible sample they tested). In this respect, it must be noted that the
slope of the Berlin function (Cuttle, 2007) may deviate significantly depending on the material.
An example of this deviation is illustrated in figure 3.2 where the damage responses of various
materials are compared against one another in a combined graphic. According to this figure,
for instance, textile materials are a lot more susceptible to light radiation within visible
spectrum compared to say newspaper (Wilm, 2016).
Figure 3.2: Relative spectral object sensitivities for different materials (Wilm, 2016)
Cuttle (2007) warns that the Berlin Function (above) must be considered in practice with
caution and notes that the removal of Ultraviolet wavelengths from the emitted radiation while
making the lighting much safer than otherwise, does not eliminate the damage problem in its
entirety. He adds that the light exposure (even when Ultraviolet radiation is entirely removed)
should be carefully controlled. He also notes, within the visible spectrum, blue tones of light
have relatively higher damaging potential. This also points to the fact that lower colour
temperature (warmer) light sources are typically (but with exceptions) less damaging for
museum displays as they tend to contain less of the shorter wavelength radiation in their
output. Cuttle (2007) also points out that too warm an appearance results in an unnatural look
Casting a New Light on Museums and Galleries Emrah Baki Ulas
253
and may be visually undesired although it may be favourable from a conservation point of view.
(Cuttle, 2007)
To conclude this section, it must be clear that in the context of a museum or gallery display,
light-induced damage to display items must be minimised. A simplified and balanced approach
is required to adequately address the complex nature of photochemical reactions that result
in light-induced damage while making it relatable, practical, effective and feasible for museum
professionals to apply. Since different portions of the electromagnetic spectrum have different
damaging potentials, it is apparent that the modern and future sources of illumination for
museum displays that have different spectral properties compared to the older (primarily
incandescent) sources, the guidelines used in the past need to be adjusted to suit the spectral
properties of the new lighting systems more effectively.
3.1.2. Susceptibility of Materials to Light-induced Damage
The preservation quality of an environment is best judged in terms of relative risks and benefits
to the materials in the space. Decay occurs through different mechanisms; chemical, mechanical
and biological. Conditions that bring benefits for one decay mechanism may bring increased
risk with another. For example, extreme dryness may eliminate corrosion risk in metals, but
for some objects, such as vellum-bound books, dryness presents a high risk of shrinkage and
brittleness. The right balance of risk and benefit needs to be found across all materials in the
display environment, whether general or a micro-environment for specific materials.
To know how to care for a display item, the crucial first step is to understand the different
material types within it, as this will dictate the conditions to achieve and the environmental
risks to avoid. Broadly speaking inorganic material (i.e. objects not made from living matter,
such as stone and metal) are more robust and cope better with exposure to environmental
extremes than organic material (i.e. objects made from living matter, such as furniture and
textiles). Many objects are composite and are made from more than one material (e.g. ivory
buttons on an Asian textile) in which case the most sensitive or vulnerable material present
may be the key one to consider.
Casting a New Light on Museums and Galleries Emrah Baki Ulas
254
This section deals with understanding how light-induced damage is measured and how the
differences between different types of materials and their susceptibility to light-induced damage
are classified and rated.
The ability of a colourant material, like a pigment or a dye, to resist light-induced damage is
described as lightfastness. It is by measuring the degree of lightfastness of a material that the
potential impact of light exposure on it is estimated. Through the measurement of lightfastness,
materials’ nature in terms of their susceptibility under museum display conditions can be better
understood, materials can be classified and be better protected against photodegradation.
Measurement of lightfastness is undertaken through procedures whereby a material sample is
exposed to prolonged radiation of natural light or very high intensities of artificial light for a
certain duration, and then comparing it with a sample that has not been exposed to light, under
a reference source. The degree of contrast resulting from the fading of the sample that is
exposed to light is then scaled against a standard to define its lightfastness. Materials that resist
well against light-induced damage are said to be lightfast. Testing procedures for lightfastness
are explained below:
The most common methods used in lightfastness tests are the ISO Blue Wool Scale described
by the ISO 105-B01:2014 Colour fastness to light: Daylight, the ISO 105-B02 Colour fastness
to artificial light: Xenon Arc fading lamp test, the ASTM D4303 - 10(2016) Standard Test
Methods for Lightfastness of Colourants Used in Artists' Materials and the ASTM D5383 - 16
Standard Practice for Visual Determination of the Lightfastness of Art Materials by Artists and
Art Technologists.
The main difference between the Blue Wool scale and the ASTM scale is that the lightfastness
score is rated differently. In ISO Blue Wool scale it is measured on a scale of 1 to 8, where I
is very poor and where 8 is excellent lightfastness. The ASTM scale, however, measures
lightfastness in an opposite manner and between I-V, where I mean excellent lightfastness and
equivalent to roughly 7 or 8 in Blue Wool scale; and V means very poor lightfastness and
equivalent to Blue Wool scale rating 1 (MacEvoy, 2015).
I have noted above that the typical procedure for a lightfastness test is to expose the samples
to abnormally intense light radiation since the effects of fading or discolouration can more
Casting a New Light on Museums and Galleries Emrah Baki Ulas
255
easily be determined this way. Typically samples are tested by exposure to direct sunlight. With
sunlight, the problem is often the challenge to measure the exact amount of exposure that a
sample gets exposed to.
ISO Blue Wool standard provides a way to undertake such test in a comparative manner. This
standard has a scale that is used for pigment lightfastness testing as outlined by the international
standard ISO 105-B and is the most common method used by museum conservators and
scientists to measure the cumulative impacts of light for museum and gallery exhibition display
of cultural materials. A typical ISO Blue Wool Testing card consists of eight strips of wool
mounted adjacent to each other. Each strip of wool has a colour of a particular reference blue
dye that fades after exposure to a certain (known) amount of light. The reference wool strips
on the ISO Blue Wool testing card are pre-selected and organised so that, for each, the time
required for the effects of light-induced fading to be visible is 2 to 3 times of the adjacent
reference. For instance, the lightest susceptible one of the strips, blue wool reference 1, would
start to show visible signs of fading within a matter of three hours to seventy-two hours; blue
wool reference 3 for instance would start to show visible signs of fading in a matter of five to
15 days; more resilient reference 6 would show visible signs of fading within six to sixteen
weeks; while for the most lightfast reference, the reference 8, it would take approximately six
to fifteen months for the signs of fading to appear (MacEvoy, 2015).
When the test is undertaken under natural daylight, the actual time it takes, as a matter of
course, depends on several factors such as the meteorological conditions, latitude, altitude,
temperature and humidity, etc.
It must also be noted that under these accelerated testing conditions often have high intensities
of light, also resulting in high temperatures on the surface of the material, hence possibly
causing a further acceleration of the photodegradation of the material.
Due to the unpredictable nature of natural light, the challenge of managing the build-up of heat
on the material surface, as well as the dependence of the test outcomes on many other factors,
lightfastness testing is also commonly undertaken using artificial light (commonly Xenon Arc
lamps which are able to produce high levels of brightness). This method allows the testing to
be done under more controlled and standardised conditions, having the advantage of repetition
under matching or near-matching conditions, unlike the unpredictable day-lit conditions.
Casting a New Light on Museums and Galleries Emrah Baki Ulas
256
Therefore this testing method can have higher levels of precision and accuracy and be more
reliable compared to testing under natural light conditions. Another advantage of testing with
artificial light is that the conditions of actual lighting of the museum artworks can be simulated
in a more realistic model by blocking and unblocking the source of light in a pattern, or cycling
it, so that can provide a dosage of exposure that can mimic the lighter and darker durations
which would normally be experienced in a museum or gallery building on a daily basis as the
spaces opens to viewing and illuminated part of the day, and closed (and in partial or entire
darkness) for the rest of the day. This provides a testing scenario that is more representative
of the light exposure a certain artwork is likely to receive in a normal museum or gallery
context. The testing apparatus with the Xenon Arc lamp often is adjusted to match the effect
of sunlight as closely as possible. This method can provide quicker results, and reduce the
build-up of heat and avoid the increase of temperature compared to testing under natural light
(MacEvoy, 2015).
The procedure of the blue wool lightfastness testing requires the samples of the pigment or
dyes to be exposed to the same level of light alongside the reference blue wool strips. Part of
the pigment samples and reference strips are covered to not receive any light (alternatively
matching samples of both the pigments and the reference blue wool strips are kept in a dark
environment. Both the pigment samples and the reference blue wool strips that have been
exposed to light are regularly observed against those that are not exposed to light. The rate
of discolouration of the sample pigments is rated against the rate of discolouration of the
reference blue wool strips, to determine how lightfast the pigments are.
The table below provides a summary of the eight lightfastness levels of pigments in the ISO
Blue Wool scale as well as comparing these to the five lightfastness levels in the ASTM scale.
The table also introduces the concept of “Just Noticeable Fade”, which I discuss next.
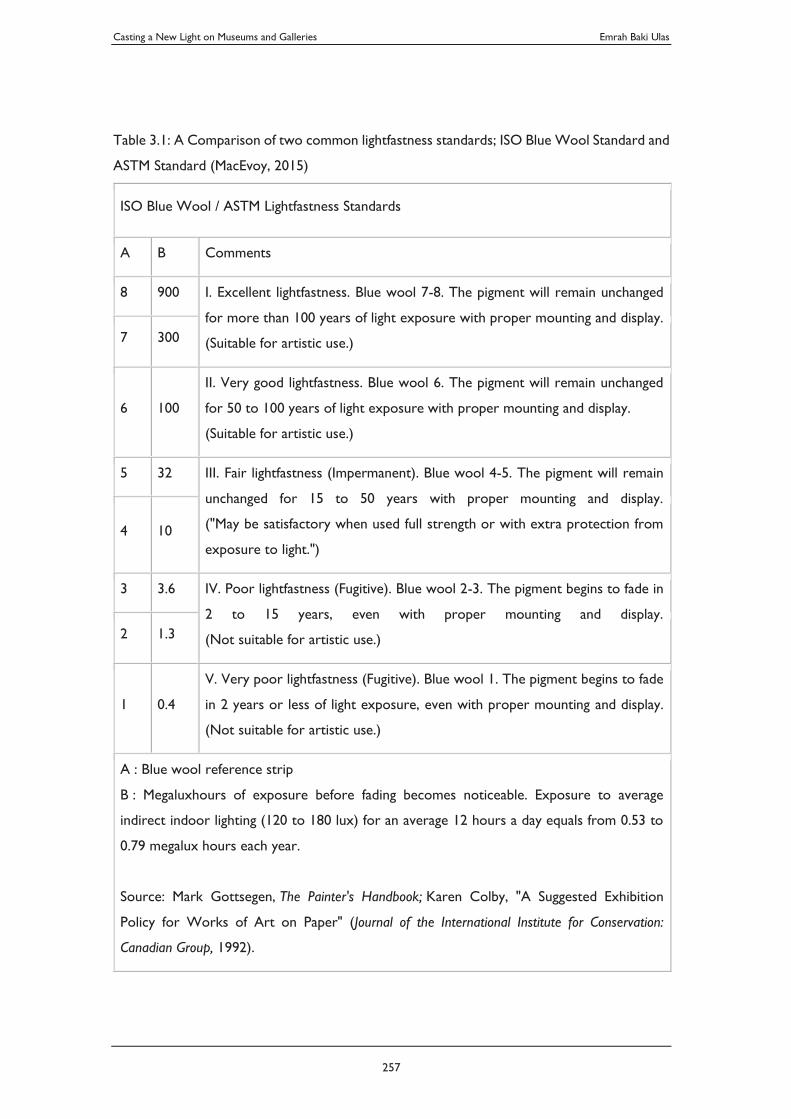
Casting a New Light on Museums and Galleries Emrah Baki Ulas
257
Table 3.1: A Comparison of two common lightfastness standards; ISO Blue Wool Standard and
ASTM Standard (MacEvoy, 2015)
ISO Blue Wool / ASTM Lightfastness Standards
A B Comments
8 900 I. Excellent lightfastness. Blue wool 7-8. The pigment will remain unchanged
for more than 100 years of light exposure with proper mounting and display.
(Suitable for artistic use.) 7 300
6 100
II. Very good lightfastness. Blue wool 6. The pigment will remain unchanged
for 50 to 100 years of light exposure with proper mounting and display.
(Suitable for artistic use.)
5 32 III. Fair lightfastness (Impermanent). Blue wool 4-5. The pigment will remain
unchanged for 15 to 50 years with proper mounting and display.
("May be satisfactory when used full strength or with extra protection from
exposure to light.") 4 10
3 3.6 IV. Poor lightfastness (Fugitive). Blue wool 2-3. The pigment begins to fade in
2 to 15 years, even with proper mounting and display.
(Not suitable for artistic use.) 2 1.3
1 0.4
V. Very poor lightfastness (Fugitive). Blue wool 1. The pigment begins to fade
in 2 years or less of light exposure, even with proper mounting and display.
(Not suitable for artistic use.)
A : Blue wool reference strip
B : Megaluxhours of exposure before fading becomes noticeable. Exposure to average
indirect indoor lighting (120 to 180 lux) for an average 12 hours a day equals from 0.53 to
0.79 megalux hours each year.
Source: Mark Gottsegen, The Painter's Handbook; Karen Colby, "A Suggested Exhibition
Policy for Works of Art on Paper" (Journal of the International Institute for Conservation:
Canadian Group, 1992).
Casting a New Light on Museums and Galleries Emrah Baki Ulas
258
In light of the lightfastness tests and the knowledge that they offer to museums and galleries to
take care of their collections, the question of what the acceptable rate of fading should be is
one that has been considered for many years by museums and galleries (and is further discussed
in section #.#). The rate is commonly expressed in terms of the total exposure that the
material would remain exposed to until a level of fading described as “just noticeable fade”
occurs (Stoner and Rushfield, 2012). The policy of a museum or a gallery in terms of the
duration they would find acceptable for each Just Noticeable Fade is of key concern since such
policy dictates the possible scenarios of how that particular item may be displayed. Here, I
leave the discussion on how such policy may be formed to a later chapter (Chapter 4) and
study some scenarios of what such a policy may mean in terms of the duration of display and
the lighting conditions. As an example, the current guidelines applied by the National Museum
of Australia’s is a modified version of the guidelines formed by the Victoria and Albert
Museum’s lighting policy for their collections, in which cumulative exposure limits are set to
limit the photodegradation to a minimum of 50 years per just noticeable fades (Derbyshire and
Ashley-Smith 1999; Ashley-Smith et al. 2002). The International Commission on Illumination
(CIE) adopted a similar approach in CIE157-2004 (CIE, 2004; Ford, Smith, 2012)
Let’s assume an institution, similar to the Victoria and Albert Museum, or to the National
Museum of Australia, has a policy of a minimum of 50 years per Just Noticeable Fade. I.e. this
institution’s policy states that the total exposure (in terms of luxhours) that a display item gets
exposed to, must not exceed the level (as per Table 3.3) (Colby, 1992) for a Just Noticeable
Fade to occur.
For the sake of example; let’s consider a highly light sensitive museum item, which could be
classified under ISO Blue Wool Category 1. If this item is being considered for display under a
policy of 50 years per Just Noticeable Fade, it means for the entire duration of every 50 years,
the total amount of light exposure for this particular item must not exceed 0.4 Megaluxhours.
If we average this value to the total amount of exposure allowed per year, it mathematically is
described as follows:
Since
(3.3)
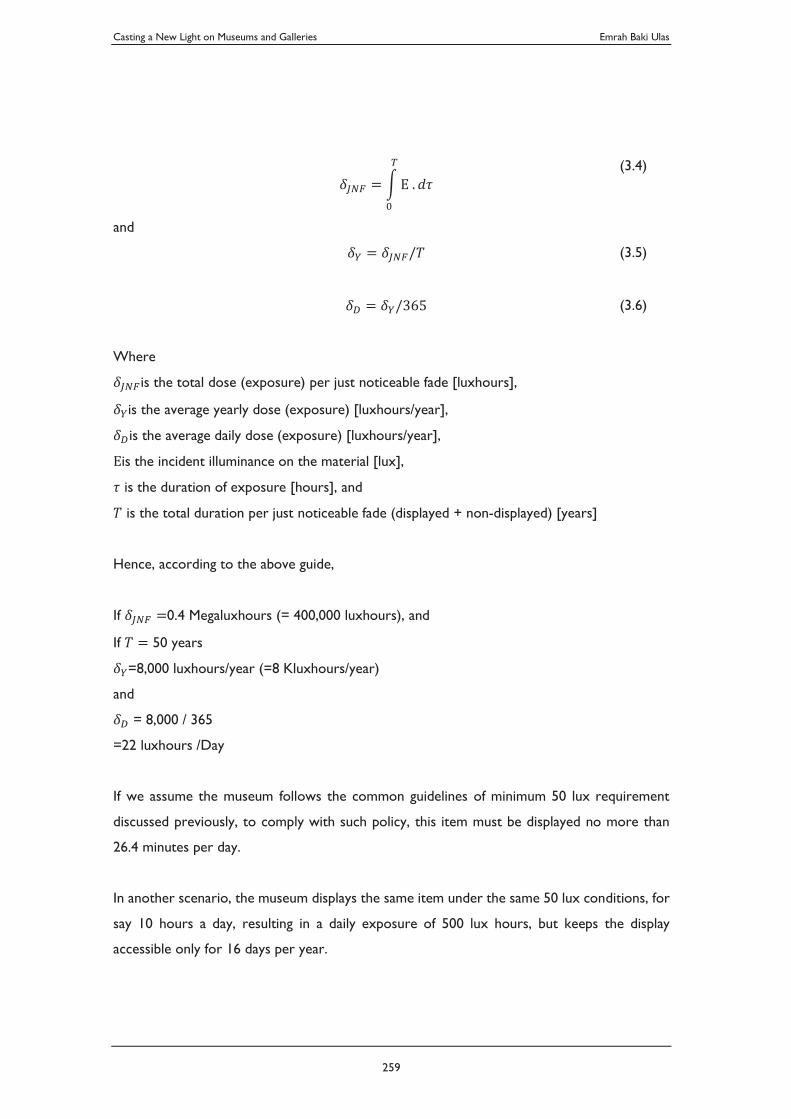
Casting a New Light on Museums and Galleries Emrah Baki Ulas
259
(3.4)
and
(3.5)
(3.6)
Where
is the total dose (exposure) per just noticeable fade [luxhours],
is the average yearly dose (exposure) [luxhours/year],
is the average daily dose (exposure) [luxhours/year],
is the incident illuminance on the material [lux],
is the duration of exposure [hours], and
is the total duration per just noticeable fade (displayed + non-displayed) [years]
Hence, according to the above guide,
If 0.4 Megaluxhours (= 400,000 luxhours), and
If 50 years
=8,000 luxhours/year (=8 Kluxhours/year)
and
= 8,000 / 365
=22 luxhours /Day
If we assume the museum follows the common guidelines of minimum 50 lux requirement
discussed previously, to comply with such policy, this item must be displayed no more than
26.4 minutes per day.
In another scenario, the museum displays the same item under the same 50 lux conditions, for
say 10 hours a day, resulting in a daily exposure of 500 lux hours, but keeps the display
accessible only for 16 days per year.
Casting a New Light on Museums and Galleries Emrah Baki Ulas
260
Another possible scenario is that the museum displays the item for 10 hours a day for a
continuous duration of 800 days (approximately two years and two months), and then takes it
off display for 47 years and ten months, every 50 years.
The scenarios are countless and may be altered by changing both the duration of exposure and
the light levels that the item is displayed under.
As discussed previously, it must also be noted again, that it is expected that the light damage
caused under these distinct scenarios, in reality, may indeed be dissimilar. The above example
presents again, the shortcoming of the law of reciprocity in modelling the effects of light-
induced damage.
Let’s now consider, under the same policy, an ISO Blue Wool Category 8 item, one which is
in the most resilient category; and see how its display duration requirements compare to in
terms of the stringent the display durations for an ISO Blue Wool Category 1 item is in
comparison.
For this display article, it would take 900 Megaluxhours to receive the level of exposure that
would cause one Just Noticeable Fade. If this item is being considered for display under a policy
of 50 years per Just Noticeable Fade, it means for the entire duration of every 50 years, the
total amount of light exposure for this particular item must not exceed 900 Megaluxhours. If
we average this value to the total amount of exposure allowed per year, it is:
Hence, this time,
If 900 Megaluxhours (= 900,000,000 luxhours), and
If 50 years
=18,000,000 luxhours/year (=18,000 Kluxhours/year)
And
= 18,000,000 / 365
=49,300 luxhours / Day (=49.3 Kluxhours/year)
Casting a New Light on Museums and Galleries Emrah Baki Ulas
261
This corresponds to a light exposure allowance at a massive scale in comparison to the ISO
Blue Wool Category 1 item. If instead of 50 lux, if we assume the museum displays the
Category 8 item under lighting that is four times more intense, 200 lux, and even if the item is
illuminated for the entire day, every day, it would yield just 4,800 Lux hours / Day; less than
10 percent of what the policy would allow. I.e. it would take more than 500 years under these
conditions to cause one Just Noticeable Fade on this item, instead of 50 years.
In another scenario, the museum displays the same item say 10 hours a day and never take the
item off display for the whole of 50 years; they would still be able to raise the light levels on
this item to the order of 5,000 Lux.
Again, the scenarios are countless and may be altered by changing both the duration of
exposure and the light levels that the item is displayed under, but in the case of Category 8
item, virtually no preventive conservation measure is required against photodegradation, and
the policy would likely be satisfied in many parts of the world with moderate natural light
conditions, even if the item is displayed under much higher levels of natural light and
continuously.
The two examples discussed above demonstrate how diverse the nature of materials can be;
in this case a vast 2,250 times more resilience between the two items.
Some problems have been noted regarding the limitations, lack of precision and lack of accuracy
of the ISO Blue Wool testing methods. One particular issue is that of when testing the response
of pigments for lightfastness, the medium in which the pigment is used makes a significant
difference in its ability to resist light-induced damage. For instance, pigments used in an oil base
tends to be more lightfast compared to pigments that are used in watercolours. While the
blanket approach of the ISO Blue Wool testing method provides a level of indication on the
nature of materials, it would not be unreasonable to assume that the variation of the
lightfastness of pigments in actual applications can be vast. A way to get around this problem
is to use a method that can test lightfastness of actual museum items and give a more exact
indication of the lightfastness of the items.
Casting a New Light on Museums and Galleries Emrah Baki Ulas
262
In this context, while, it does not eliminate the issues of the traditional testing methods, a more
modern method that forms an alternative that is worth discussing here is the method of
“Microfadeometry”, first identified in 1994 by Paul Whitmore (Ford et al., 2011).
In microfadeometry, a very small but intense beam of light is used in a very small spot on the
surface of cultural material, to cause accelerated light damage and analyse the colour response
of the surface to assess the nature of that particular article more specifically in terms of its
response to light-induced damage (Canadian Conservation Institute, 2014). The device that is
used in this procedure is called a microfade tester.
Similar to traditional methods of ISO Blue Wool Testing using artificial light sources, microfade
testers use Xenon Arc lamps as the source of light. In this method, however, the light is
concentrated using a small optical fibre that casts a luminous flux of approximately 1 lumen
onto a tiny spot on the surface of the tested article, with a diameter of 300 to 400 μm for a
duration of 10 minutes (Hoyo-Melendez, 2012).This corresponds to an approximate
illuminance on the of 14,285 lux, and an approximate total exposure of 2,380 Klux hours
replicating the impact of several years of exposure (depending on the classification of the item)
in normal museum and gallery display. The colour response of the surface is observed using a
second fibre that acts as a sensor.
Microfadeometry makes it possible to obtain more precise information on particular parts of
museum items, giving the conservators the opportunity to understand the nature of materials
in a method that provides vastly more specific information. This is particularly useful for high
value and high sensitivity items, certain parts of which are of specific interest or concern from
a preventive conservation perspective. Microfadeometry has been adopted by an increasing
number of museums around the world.
As mentioned, like traditional methods of lightfastness testing, microfadeometry also has
limitations and shortcomings including concerns associated with diffusion-limited photo-
oxidation reaction rates, dehydration and heating of the sample, the variability of using and
measuring ISO Blue Wool Standards (Hoyo-Melendez, 2012),variation in spectral power
distribution between lamps used in object display and the lamp used in accelerated light ageing,
the small sampling area, the required number of sample, the length of fading time and the
potential interaction of individual chemical components of the object tested (Lerwill, 2011).
Casting a New Light on Museums and Galleries Emrah Baki Ulas
263
All in all, microfadeometry as an alternative lightfastness testing method is subject to the same
uncertainties as for the other accelerated testing methods. These include the issues arising
from the use of the law of reciprocity, the differences between the spectral composition of the
Xenon Arc source and the sources normally used in museum lighting, and the fact that the
alterations in the spectrum response are interpreted as differences in hue, saturation or
lightness. As the traditional ISO Blue Wool testing techniques, microfadeometry also suffers
from the non-standard behaviour of ISO Blue Wool references. A major benefit of this
technique, however, is in its ability to provide detailed information about the photodegradation
resistance of actual museum items to be assessed in a short timeframe and without having to
identify materials or the data related to the prior cumulative and historic damage. It is predicted
that the techniques overestimate the rate of photodegradation because the Xenon Arc source
has a higher spectral content in the shorter region in comparison to the conventional museum
and gallery lights. Also, like the traditional methods, microfadeometry also has a conservative
bias due to the projections being based on linear trends of fading. As discussed previously, in
reality, light-induced fading will follow an exponential trend, slowing down through time.
Hence, microfadeometry, as other methods of lightfastness that entails accelerated exposure,
are best considered as indicative, rather than being predictive in their nature (Ford and Smith,
2011).
When I studied key documents in Chapter 1 (see 1.3), I briefly reviewed the CIE’s technical
report 157:2004; Control of Damage to Museum Objects by Optical Radiation. This is an important
document that is globally used and forms the basis that many museums and galleries around
the world follow in forming their own policies for collections care. It must be noted that the
CIE’s recommended levels of exposure vary from those of Colby’s (1992). I will refer to the
numbers specified in the CIE Technical Report 157:2004 in formulating a set of proposed
recommendations for the application of Light-Emitting Diodes for museum and gallery displays.
These are illustrated, once again for the reader’s convenience, as below:
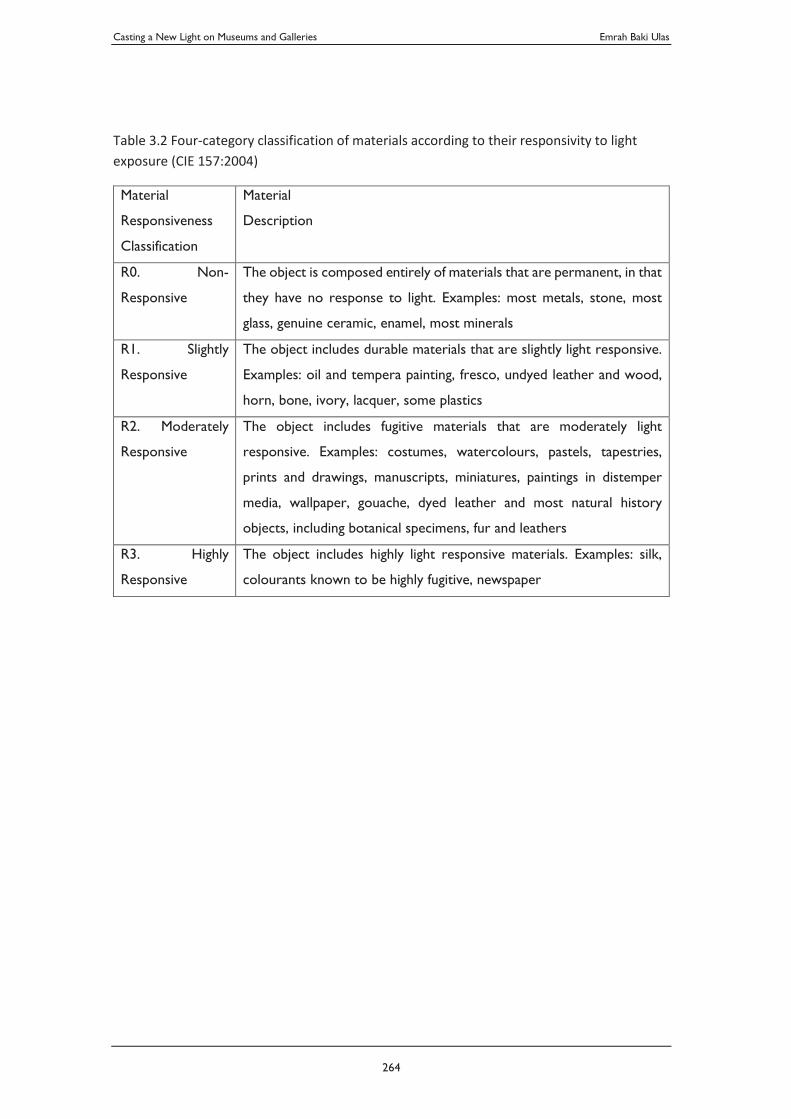
Casting a New Light on Museums and Galleries Emrah Baki Ulas
264
Table 3.2 Four-category classification of materials according to their responsivity to light exposure (CIE 157:2004)
Material
Responsiveness
Classification
Material
Description
R0. Non-
Responsive
The object is composed entirely of materials that are permanent, in that
they have no response to light. Examples: most metals, stone, most
glass, genuine ceramic, enamel, most minerals
R1. Slightly
Responsive
The object includes durable materials that are slightly light responsive.
Examples: oil and tempera painting, fresco, undyed leather and wood,
horn, bone, ivory, lacquer, some plastics
R2. Moderately
Responsive
The object includes fugitive materials that are moderately light
responsive. Examples: costumes, watercolours, pastels, tapestries,
prints and drawings, manuscripts, miniatures, paintings in distemper
media, wallpaper, gouache, dyed leather and most natural history
objects, including botanical specimens, fur and leathers
R3. Highly
Responsive
The object includes highly light responsive materials. Examples: silk,
colourants known to be highly fugitive, newspaper
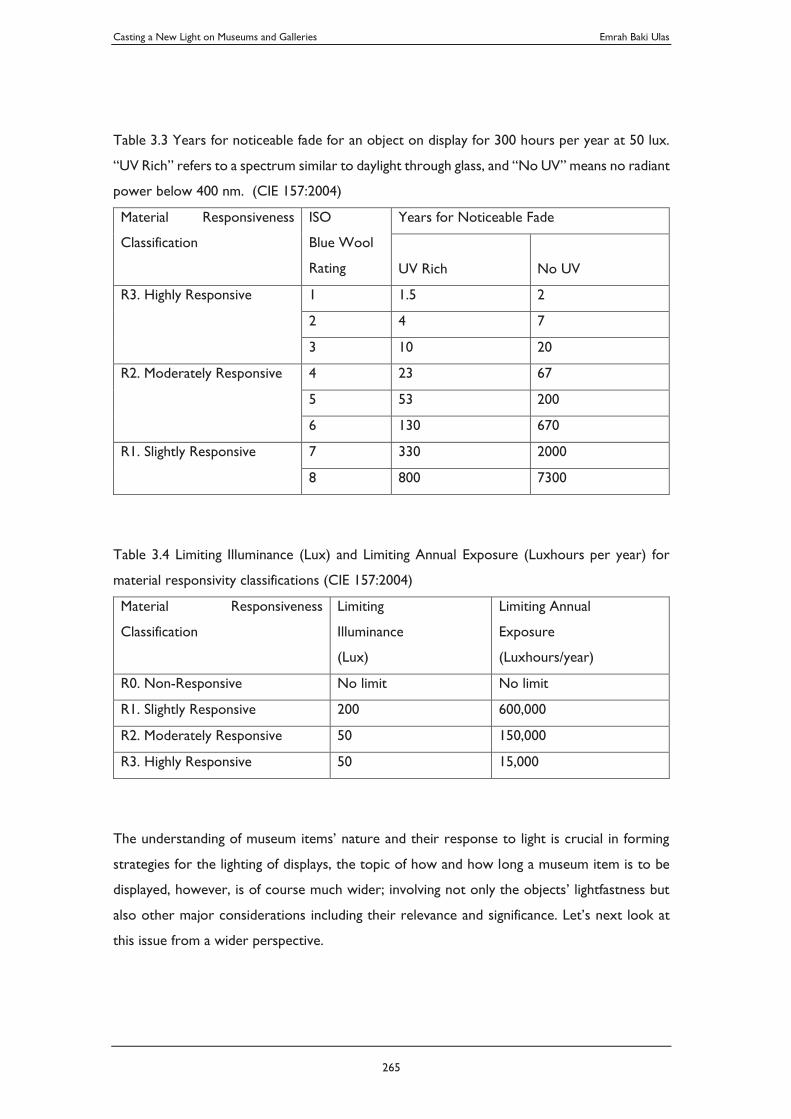
Casting a New Light on Museums and Galleries Emrah Baki Ulas
265
Table 3.3 Years for noticeable fade for an object on display for 300 hours per year at 50 lux.
“UV Rich” refers to a spectrum similar to daylight through glass, and “No UV” means no radiant
power below 400 nm. (CIE 157:2004)
Material Responsiveness
Classification
ISO
Blue Wool
Rating
Years for Noticeable Fade
UV Rich
No UV
R3. Highly Responsive 1 1.5 2
2 4 7
3 10 20
R2. Moderately Responsive 4 23 67
5 53 200
6 130 670
R1. Slightly Responsive 7 330 2000
8 800 7300
Table 3.4 Limiting Illuminance (Lux) and Limiting Annual Exposure (Luxhours per year) for
material responsivity classifications (CIE 157:2004)
Material Responsiveness
Classification
Limiting
Illuminance
(Lux)
Limiting Annual
Exposure
(Luxhours/year)
R0. Non-Responsive No limit No limit
R1. Slightly Responsive 200 600,000
R2. Moderately Responsive 50 150,000
R3. Highly Responsive 50 15,000
The understanding of museum items’ nature and their response to light is crucial in forming
strategies for the lighting of displays, the topic of how and how long a museum item is to be
displayed, however, is of course much wider; involving not only the objects’ lightfastness but
also other major considerations including their relevance and significance. Let’s next look at
this issue from a wider perspective.
Casting a New Light on Museums and Galleries Emrah Baki Ulas
266
3.1.3. The balance between preservation and presentation
Lightfastness Tests provide museums and galleries with a better and deeper understanding of
materials in terms of their resilience to light damage, and bring up a major question: What is
the acceptable rate of decay and photodegradation? While the question is simple, the answer
is a very complex one and carries a significant responsibility. Not only that this issue has an
impact on the day to day operation of a museum, its logistics, resources, staffing, costs etc. but
also a level of responsibility of how much access to grant to current societies for them to be
able to benefit from the item vs. how much to preserve and keep for the future of the cultural
material in question. It requires judgements on issues that often maybe unforeseeable such as
the trends in the future relevance and significance of the articles etc.
Amongst the limited published studies in this regard, Reuss et al. (2005), Ford et. al. (2011)
have found that the level of efforts and costs involved in rotating display items and replacing
objects, particularly in the more sensitive categories was unsustainable, raising the question
that public access to objects was perhaps unnecessarily restricted and that they were often lit
to unreasonably low levels. According to Ford et al. (2011), these issues arose primarily from
the shortage of information on the rate of photodegradation for specific items, and the absence
of well-structured methodologies for the assessment of the frequency and the duration of the
display of a museum item and the relative impact of light exposure at different stages.
Also, the categorisation of items based on ISO Blue Wool scale and associated calculations
assume that all museum articles are in constant demand to be displayed. Furthermore, within
any specific ISO Blue Wool category, the actual range of sensitivity amongst the items may vary
greatly. This range spans more than an order of magnitude due to the absence of specific data
on the rate of photodegradation and the unpredictability of photodegradation even for well-
known pigments (even in cases when they can be identified). Because the recommended levels
of light exposure are based on an averaged scenario for each category, it is given that some
objects could by definition tolerate longer durations of display or higher levels of illumination
without being affected by light-induced damage to a greater extent. On the other hand, there
would be other items that would, under the same exposure recommendation be damaged by
light exceedingly. Ford et al. (2009) suggest that an overwhelming majority of items in a
Casting a New Light on Museums and Galleries Emrah Baki Ulas
267
museum’s collection would not likely be in continuous demand for being displayed, so when
they actually are displayed, it may be acceptable that the display can be for longer durations
(Ford and Smith, 2009) or at levels that may exceed the standard approach.
It must be noted that the above approach (which might be open for debate) has been a basis
for Microfadeometry experiments undertaken by Ford et al. (2009) at the National Museum
of Australia during 2009 and 2010, which provided detailed information about a wide range of
items from the museums’ collection. An examination of the outcomes of microfading tests on
some two hundred items across the collection that would previously have been limited to two
or five years display (assumed per every 50 years considering the policy of National Museum
of Australia on the acceptable rate of each Just Noticeable Fade) has shown that exhibition
duration recommendations were found overly conservative for 50%, meaning half of the items
could actually be displayed for longer or under higher levels of illumination. Findings on 40% of
the items aligned with the existing collection care strategy. While 10% of the items required
more stringent display durations or reduction of levels of illumination (Ford and Smith 2010).
Ford et al. (2011) notes that microfading experiments have increased the ability of the National
Museum of Australia to make decisions in a more informed manner and helped manage the
risk of light-induced damage with more confidence and more economically. It is noted that, the
outcomes of the microfading tests demonstrate that, while for many of the items in the
collection blanket approaches based on testing typical examples are rational, for some
categories the deviation that the microfading results show that the use of generalised exposure
requirements, particularly for distinct elements of items that are composed of different colours
or materials, involves a high level of risk. Ford et al. (2011) states:
An evaluation of the likely exhibition demand for an object using a common significance assessment
methodology will serve as a filter that allows objects likely to be only intermittently displayed to be
exhibited for longer. The dual approach both encourages and provides the necessary information for
the Museum to more selectively direct its finite resources to the protection of its most important, most
often displayed and least lightfast objects.
In addition to the consideration of light sensitivity, National Museum of Australia’s approach
noted above raises the importance of the complex question of “significance” as another key
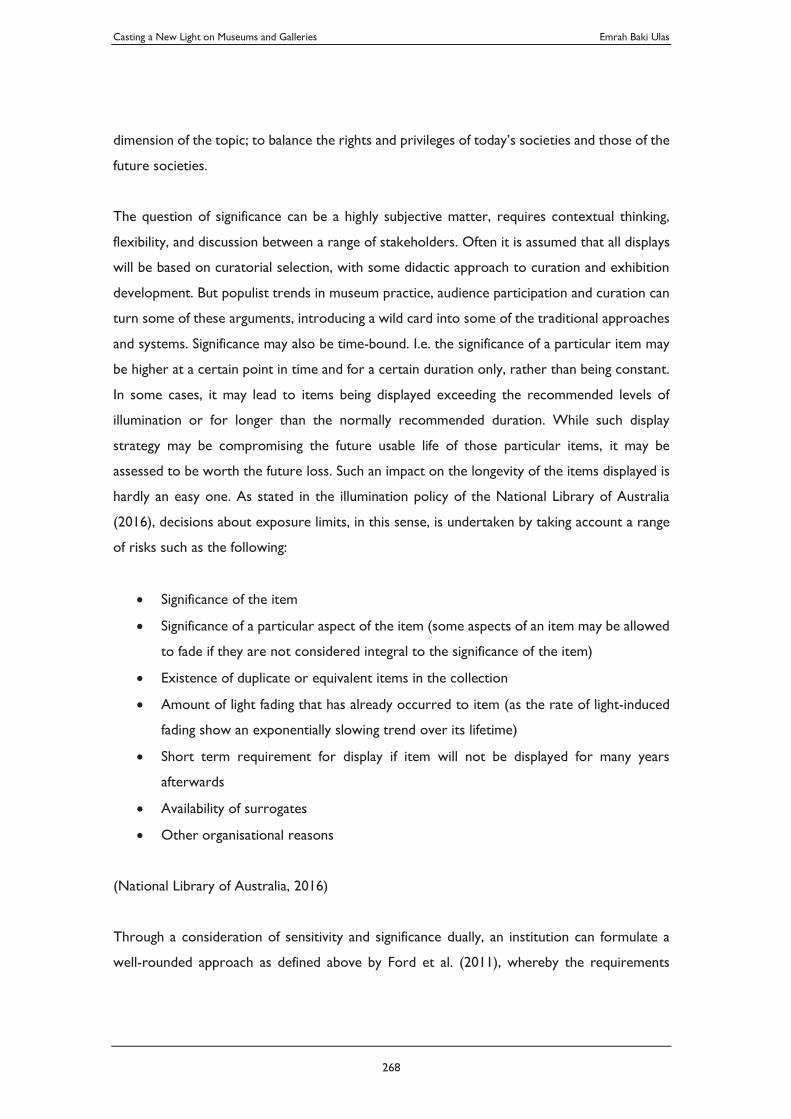
Casting a New Light on Museums and Galleries Emrah Baki Ulas
268
dimension of the topic; to balance the rights and privileges of today’s societies and those of the
future societies.
The question of significance can be a highly subjective matter, requires contextual thinking,
flexibility, and discussion between a range of stakeholders. Often it is assumed that all displays
will be based on curatorial selection, with some didactic approach to curation and exhibition
development. But populist trends in museum practice, audience participation and curation can
turn some of these arguments, introducing a wild card into some of the traditional approaches
and systems. Significance may also be time-bound. I.e. the significance of a particular item may
be higher at a certain point in time and for a certain duration only, rather than being constant.
In some cases, it may lead to items being displayed exceeding the recommended levels of
illumination or for longer than the normally recommended duration. While such display
strategy may be compromising the future usable life of those particular items, it may be
assessed to be worth the future loss. Such an impact on the longevity of the items displayed is
hardly an easy one. As stated in the illumination policy of the National Library of Australia
(2016), decisions about exposure limits, in this sense, is undertaken by taking account a range
of risks such as the following:
Significance of the item
Significance of a particular aspect of the item (some aspects of an item may be allowed
to fade if they are not considered integral to the significance of the item)
Existence of duplicate or equivalent items in the collection
Amount of light fading that has already occurred to item (as the rate of light-induced
fading show an exponentially slowing trend over its lifetime)
Short term requirement for display if item will not be displayed for many years
afterwards
Availability of surrogates
Other organisational reasons
(National Library of Australia, 2016)
Through a consideration of sensitivity and significance dually, an institution can formulate a
well-rounded approach as defined above by Ford et al. (2011), whereby the requirements
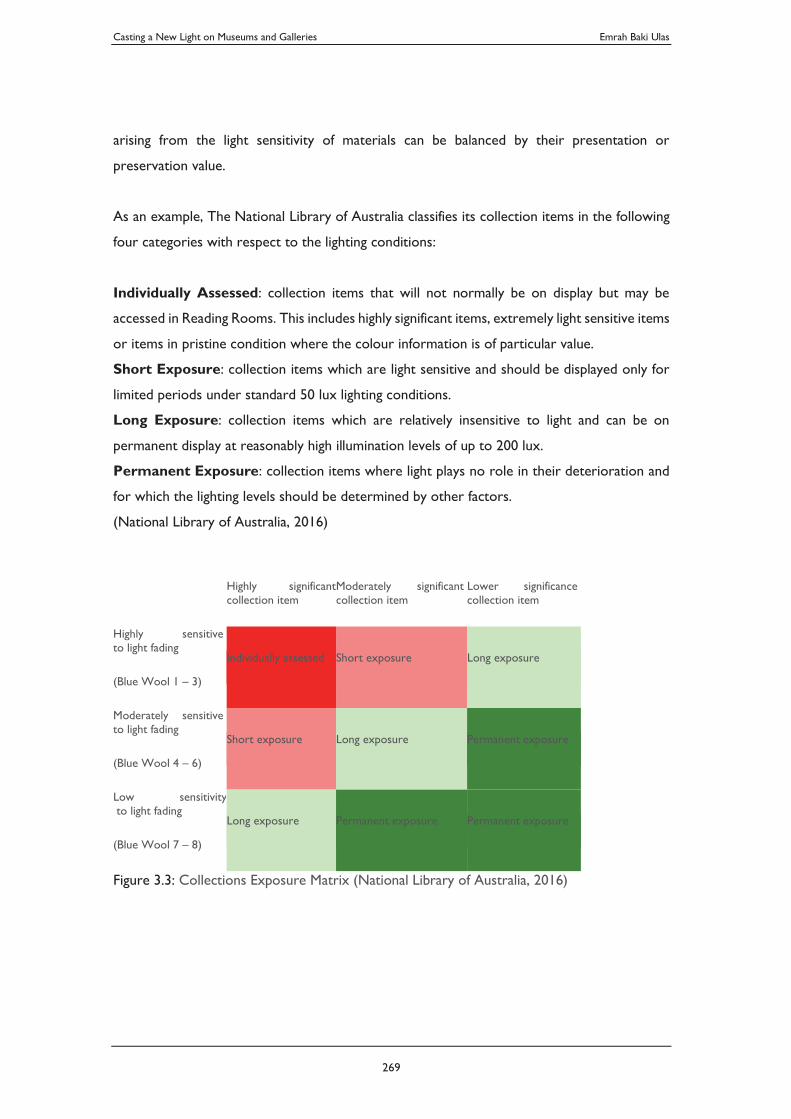
Casting a New Light on Museums and Galleries Emrah Baki Ulas
269
arising from the light sensitivity of materials can be balanced by their presentation or
preservation value.
As an example, The National Library of Australia classifies its collection items in the following
four categories with respect to the lighting conditions:
Individually Assessed: collection items that will not normally be on display but may be
accessed in Reading Rooms. This includes highly significant items, extremely light sensitive items
or items in pristine condition where the colour information is of particular value.
Short Exposure: collection items which are light sensitive and should be displayed only for
limited periods under standard 50 lux lighting conditions.
Long Exposure: collection items which are relatively insensitive to light and can be on
permanent display at reasonably high illumination levels of up to 200 lux.
Permanent Exposure: collection items where light plays no role in their deterioration and
for which the lighting levels should be determined by other factors.
(National Library of Australia, 2016)
Highly significant collection item
Moderately significant collection item
Lower significance collection item
Highly sensitive to light fading
(Blue Wool 1 – 3)
Individually assessed Short exposure Long exposure
Moderately sensitive to light fading
(Blue Wool 4 – 6)
Short exposure Long exposure Permanent exposure
Low sensitivity to light fading
(Blue Wool 7 – 8)
Long exposure Permanent exposure Permanent exposure
Figure 3.3: Collections Exposure Matrix (National Library of Australia, 2016)
Casting a New Light on Museums and Galleries Emrah Baki Ulas
270
3.1.4. Light-Emitting Diode and its Photodegradation Potential
In the last two decades, the increasing awareness and demand for more energy-efficient
systems and solutions have driven a major shift in many industries. Accounting for a
consumption share of approximately 20% of the world’s electricity production (ETP 2015;
WEO 2015 and IEA World Energy Statistics and Balances, 2014), lighting also has seen a big
change. The shift, both in the development of new lighting technologies and in terms of lighting
related legislations and best practice recommendations from governments, industry
associations and other relevant authorities have affected the practice of lighting design. As a
result, we have seen alternatives to incandescent (and other) lighting systems, rapidly appear
in the market. Some suggested that the shift in the technologies were in essence driven by
commercial motivations of large lamp manufacturers rather than being genuinely about energy
efficiency and sustainability (Shaw, 2011). These criticisms are somewhat credible, as they raise
some key questions about the overall environmental impact of the new technologies compared
to the old, including the impact of the use of heavy metals and toxic substances, they question
whether and how the traditional technologies could have been improved rather than moving
away entirely to different technologies, they note that the profit margins on newer products
in comparison to traditional sources are vastly different in the sellers’ favour. Most common
type of the first viable alternatives to incandescent lighting was compact fluorescent lighting,
and most criticisms noted above was targeted against compact fluorescent lighting. While they
have the energy saving advantage in terms of their power to convert electricity to visible light,
compact fluorescent lights had some disadvantages which made them not perfectly suitable for
some applications (including museum and gallery lighting). Most common issues involved poor
colour rendition quality, the size of the luminous apparatus (which in turn affected the ability
to optically manipulate and control the light from these sources), the losses due to their
anatomy, etc.
Light-Emitting Diodes have followed on as a more recent development in architectural lighting.
Although Light-emitting Diodes have existed as light sources for several decades since their
invention in the 1960’s (Holonyak, 1962), their luminous flux, luminous efficacy and spectral
coverage have been limited and somewhat not practical for any other use than illuminated
signage lighting and similar purposes that required low luminance. Light-Emitting Diodes have
Casting a New Light on Museums and Galleries Emrah Baki Ulas
271
seen a lot of improvement over the years, and while their contribution to architectural
applications was somewhat restricted until the 2000’s, they have seen a rapid evolution in the
last decade, surpassing all other conventional light sources and gained a strong and growing
position in the lighting industry.
With their specific lighting needs and mainly due to the difference in their organisational
objectives in comparison to most commercially driven industries; museums and galleries were,
to a large extent, able to monitor the technological changes more closely, approach their
quality issues more analytically and assess the potential of new light sources for their ability to
respond to the complex lighting requirements in museums and galleries. In this respect, it
would be fair to say museums and galleries have been relatively more thorough in terms of
having a critical approach to the level of quality of light of the alternative sources of light.
Hence, museums and galleries stayed mostly immune to this technology-driven shift until the
new light sources were proven to be reasonably safe and accepted. This noted, there has also
been a myriad of speculation on Light-emitting Diodes specific to the world of museums and
galleries also. The examples of misinformed, misguided media articles on the Light-emitting
Diodes and their impact in terms of preventive conservation have been very wide-ranging.
While some articles suggested they could pose a major risk to artworks (e.g. Kronkright, 2010),
others conversely suggested that they were perfectly safe to use for museum collections,
claiming for instance LEDs produce no ultraviolet light and completely protect fabrics and art from
fading just because their output had negligible UV content (e.g. Whitehead, 2011). As noted,
many of these sorts of claims, whether in favour of the use of Light-emitting Diodes in museum
environments or in opposition to it, carried incomplete or wrong messages that contributed
to unnecessary confusion and proliferation of wrong information in the industry. At the time
of writing this, there are quality products available in the market that utilise semiconductor
technology. Light-Emitting Diodes have, in the recent years, matured as reliable and highly
capable light sources and the range of products offered in the market include superior
luminaires compared to traditional devices of lighting (saving energy, matching or exceeding
visual expectations for most visual tasks, having better versatility for optical control and
dimming, having less potential for light-induced damage to cultural material, having longer
usable lamp life, less failure rates, and maintaining light effects consistently requiring significantly
less maintenance etc.). The amount of incomplete, missing or misguided information not only
in the overall lighting market but also specifically in the specialist field of museum and gallery
lighting, however, still prevails.
Casting a New Light on Museums and Galleries Emrah Baki Ulas
272
Let’s, here, contest the question of how much of a risk Light-emitting Diodes pose for light-
induced damage to museum displays, in comparison to other sources of light. Let’s then, also
contest the question of the relevance for today’s museum and gallery lighting guidelines in
whether they satisfactorily do address the preventive conservation requirements for museums
and galleries and if they do, how they may apply to these new sources of light in museums and
galleries; the Light-emitting Diodes.
Firstly, let’s reconsider the Berlin Function (Cuttle, 2007) that I discussed previously. The Berlin
Function was illustrated in the form of a graph that shows the correlation between the damage
potential of an emission and its spectral compositions. According to Berlin Function, damage
potential has an exponential relationship with the wavelength of the radiation, declining from
shorter wavelengths to longer wavelengths. I.e. shorter wavelength (higher frequency)
emissions, such as the ultraviolet and near ultraviolet regions (let’s say between below 400 nm)
are significantly more damaging and have much higher potential to cause fading and
decomposition of the materials through photodegradation, in comparison to longer wavelength
(lower frequency) band in the near infrared and infrared regions of the electromagnetic
spectrum. (Let’s note again here, that infrared radiation may of course also be harmful to
cultural material, and like ultraviolet and visible portions of the spectrum, the infrared band
also has a damage potential. However, the Berlin function does not illustrate this, due to the
mechanisms of such damage being different than those photochemical reactions that are
involved in the process of photodegradation. The damage that infrared radiation may cause
rather happens through the build-up of heat, causing an increase of temperature on the surface
of the material and resulting in dehydration of the material, etc. It is typically managed by
employing climate control methods that aim to stabilise the temperature and humidity within
the space. (Ulas et al., 2015)) Any differences or shift in the spectral composition of light
sources may change its potential to cause photodegradation. It is, therefore, expected that
different lighting technologies with different spectral power distribution patterns would
naturally have different degrees of damage potential due to the difference in the composition
of radiation in their emission. With exceptions, it can be predicted that sources that have
higher Ultraviolet radiation in their spectral composition would have more damage potential
than those that have less ultraviolet content in their light output, and also that sources that
have a light output with cooler (or more blue-ish) correlated colour temperatures are often
Casting a New Light on Museums and Galleries Emrah Baki Ulas
273
expected to have a higher potential for damaging artworks, compared to sources that have
warmer (or more red-ish) correlated colour temperatures, due to the fact that the spectral
composition of cooler colour temperature lights tend to contain more of the more damaging,
shorter wavelength portions of the visible spectrum than others.
With the above consideration, one can predict that light sources with different spectral power
distribution patterns would have different degrees of light-induced damage potential to
museum objects, simply because the composition of their emission would have dissimilarities.
If we consider the spectral power distribution of Light-emitting Diodes in comparison to the
traditional sources of light in museums, incandescent lamps, there are clearly identifiable
differences. Although incandescent sources typically have a spectral distribution curve that
leans over the longer wavelengths; i.e. have much higher content in the warmer end of the
spectrum, in the near-infrared and infrared region, they still produce a reasonable amount of
Ultraviolet emission in the order of 75 microwatts/lumen (Thomson, 1978). The ultraviolet
emission of incandescent light sources is typically managed using filters that block most of the
ultraviolet emission. Light-Emitting Diodes emit significantly less ultraviolet radiation, on the
other hand, they tend to have a spike in the near-ultraviolet (shorter wavelength) region of the
spectrum, which has a higher damage potential compared to the longer wavelengths. Without
an analysis of spectral power distribution patterns, it may not be straightforward to make a
comparison of the overall light-induced damage potential of these two sources. What must
also be considered, is that different light sources produced by different manufacturers tend to
have some differences in their light output, i.e. spectral power distribution patterns of different
lights of different makes and models, even if they may be of the same technology, may be
reasonably different. This may result in notable differences in their light-induced damage
potential. Although this is not new and existed as an issue with incandescent lights for decades,
variations in spectral power distribution patterns are much greater in the case of Light-emitting
Diodes. This is a result of how this type of sources of light is produced. The anatomy of a Light-
emitting Diode is significantly more sensitive to minute differences in the manufacturing
process, whereby an infinitesimal difference in the chemical structure of the semiconductor
might result in a large variance in the light composition. Likewise, the mix, consistency and the
thickness of the phosphor coating may affect the light output considerably. Due to the above
reasons, when comparing the potentially damaging impact of a traditional incandescent source
with that of a Light-emitting Diode, there are challenges to finding a universally applicable
answer. In this research, I have considered examples from both technologies that represent
Casting a New Light on Museums and Galleries Emrah Baki Ulas
274
the type of sources that are used most commonly in the museum and gallery lighting. I have
considered the spectral power distribution pattern of an Osram 12V MR 16 35W Dichroic
Tungsten Halogen Incandescent Lamp, as published by Joseph Padfield at the National Gallery in
London (2015). Padfield measured the correlated colour temperature of this lamp to be 2964K
degrees and the colour rendering index to be 99. The Spectral power distribution curve is
illustrated below in Figure 3.4. To represent a typical Light-emitting Diode for a museum or
gallery application, I have considered the spectral power distribution pattern of an Erco Opton
72644.00 12 W LED with a standard Erco flood lens (the Erco Opton features the same LED
light engine as is across all of Erco’s museum track lighting range, including the Optec, Cantax,
Parscan and Lightboard models). Again, instead of using the spectral power distribution curve
and the specifications as provided in the manufacturer’s catalogue, I refer to the independently
measured data by Joseph Padfield at the National Gallery in London (2015). Padfield notes the
correlated colour temperature to be 2987K degrees within extremely small tolerance
compared to the figure provided in Erco’s catalogue (3000K degrees). The colour rendering
index is measured to be 92 by Padfield, again conforming Erco’s specification of CRI > 90. I
have included below an illustration of the spectral power distribution curve for this light source,
below in Figure 3.5.
Before we delve into the comparative analysis, it is worth mentioning that the issue being
tackled here between the Light-emitting Diode and the incandescent sources of light is not an
entirely new one. Before Light-emitting Diodes became popular sources of lighting in museums
and galleries, there were (and to some extent still are) sources of light other than the
incandescent lights that have been used in museum and gallery lighting applications. These
include the low pressure discharge lamps such as linear fluorescent lamps, compact fluorescent
lamps; and the high-pressure discharge lamps such as metal halide lamps. These sources of light
have entirely different light outputs, with major variances in their spectral power distribution.
Discharge lamps typically have much higher emissions of ultraviolet light and can be notably
more damaging to museum objects if light levels are not managed carefully, and ultraviolet
blocking filters are not applied adequately. In the visible portions of the light spectrum also,
these different sources have distinctly different output patterns. Hence, the problem we are
tackling here with the quest to adopt the existing museum and gallery lighting guidelines for
conservation, have been present for several decades. To my knowledge, the guidelines I am
studying, such as the CIE Technical Report 2004: 157 have been applied in museums with little
or no consideration to the differences in the spectral distribution of the sources of lights used
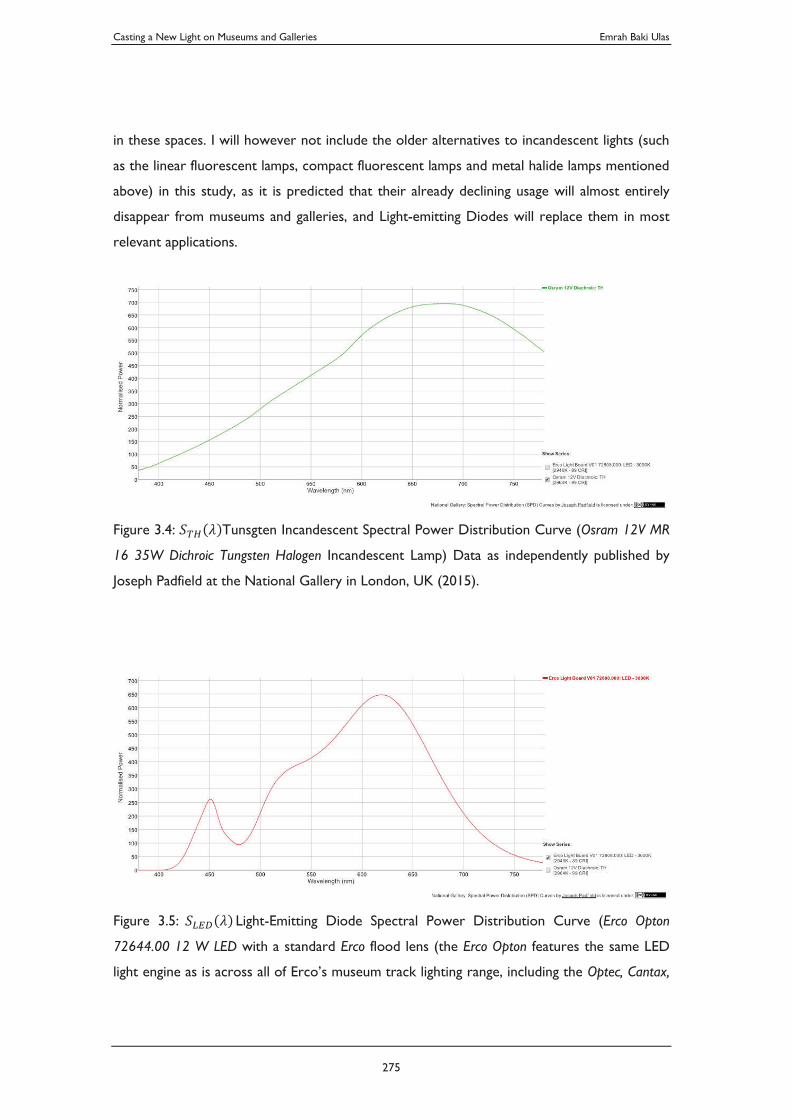
Casting a New Light on Museums and Galleries Emrah Baki Ulas
275
in these spaces. I will however not include the older alternatives to incandescent lights (such
as the linear fluorescent lamps, compact fluorescent lamps and metal halide lamps mentioned
above) in this study, as it is predicted that their already declining usage will almost entirely
disappear from museums and galleries, and Light-emitting Diodes will replace them in most
relevant applications.
Figure 3.4: Tunsgten Incandescent Spectral Power Distribution Curve (Osram 12V MR
16 35W Dichroic Tungsten Halogen Incandescent Lamp) Data as independently published by
Joseph Padfield at the National Gallery in London, UK (2015).
Figure 3.5: Light-Emitting Diode Spectral Power Distribution Curve (Erco Opton
72644.00 12 W LED with a standard Erco flood lens (the Erco Opton features the same LED
light engine as is across all of Erco’s museum track lighting range, including the Optec, Cantax,
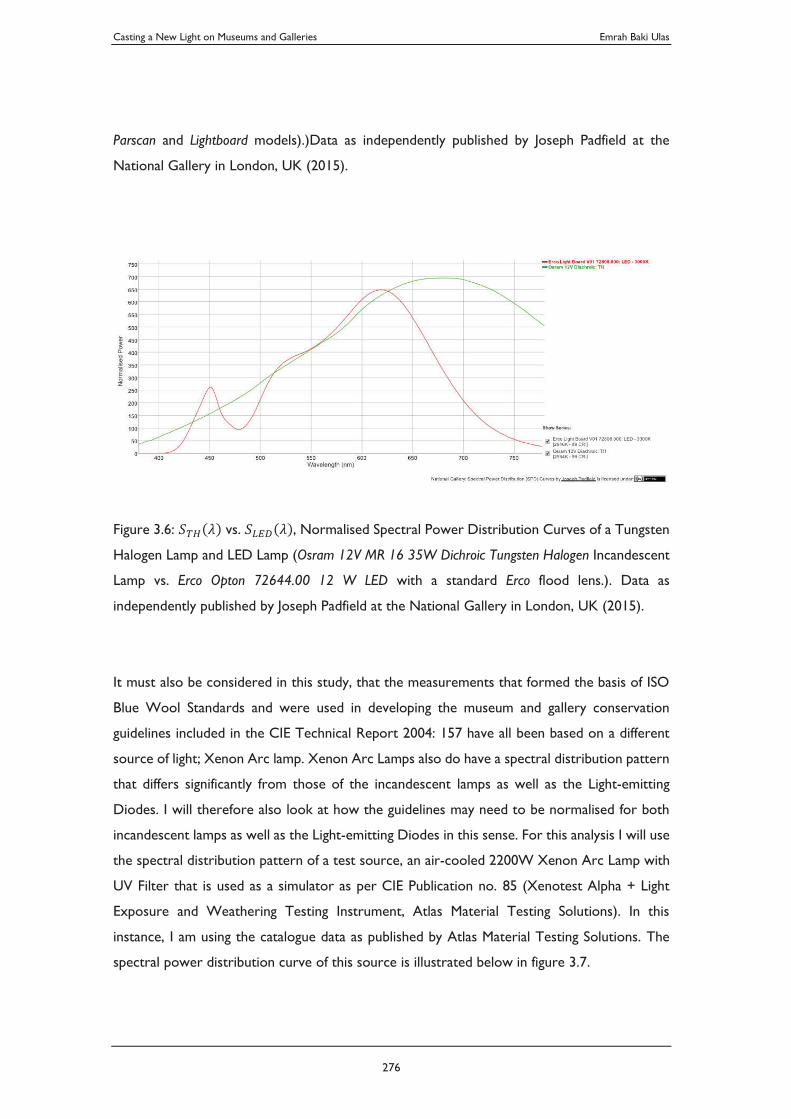
Casting a New Light on Museums and Galleries Emrah Baki Ulas
276
Parscan and Lightboard models).)Data as independently published by Joseph Padfield at the
National Gallery in London, UK (2015).
Figure 3.6: vs. , Normalised Spectral Power Distribution Curves of a Tungsten
Halogen Lamp and LED Lamp (Osram 12V MR 16 35W Dichroic Tungsten Halogen Incandescent
Lamp vs. Erco Opton 72644.00 12 W LED with a standard Erco flood lens.). Data as
independently published by Joseph Padfield at the National Gallery in London, UK (2015).
It must also be considered in this study, that the measurements that formed the basis of ISO
Blue Wool Standards and were used in developing the museum and gallery conservation
guidelines included in the CIE Technical Report 2004: 157 have all been based on a different
source of light; Xenon Arc lamp. Xenon Arc Lamps also do have a spectral distribution pattern
that differs significantly from those of the incandescent lamps as well as the Light-emitting
Diodes. I will therefore also look at how the guidelines may need to be normalised for both
incandescent lamps as well as the Light-emitting Diodes in this sense. For this analysis I will use
the spectral distribution pattern of a test source, an air-cooled 2200W Xenon Arc Lamp with
UV Filter that is used as a simulator as per CIE Publication no. 85 (Xenotest Alpha + Light
Exposure and Weathering Testing Instrument, Atlas Material Testing Solutions). In this
instance, I am using the catalogue data as published by Atlas Material Testing Solutions. The
spectral power distribution curve of this source is illustrated below in figure 3.7.
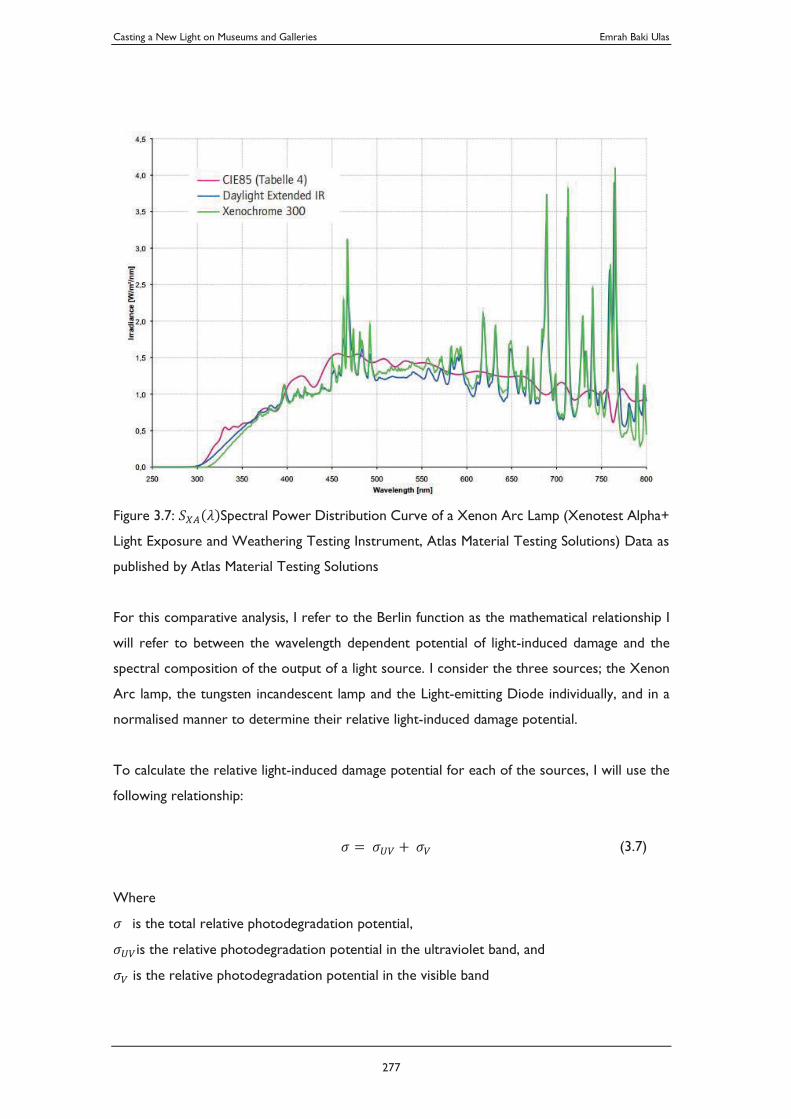
Casting a New Light on Museums and Galleries Emrah Baki Ulas
277
Figure 3.7: Spectral Power Distribution Curve of a Xenon Arc Lamp (Xenotest Alpha+
Light Exposure and Weathering Testing Instrument, Atlas Material Testing Solutions) Data as
published by Atlas Material Testing Solutions
For this comparative analysis, I refer to the Berlin function as the mathematical relationship I
will refer to between the wavelength dependent potential of light-induced damage and the
spectral composition of the output of a light source. I consider the three sources; the Xenon
Arc lamp, the tungsten incandescent lamp and the Light-emitting Diode individually, and in a
normalised manner to determine their relative light-induced damage potential.
To calculate the relative light-induced damage potential for each of the sources, I will use the
following relationship:
(3.7)
Where
is the total relative photodegradation potential,
is the relative photodegradation potential in the ultraviolet band, and
is the relative photodegradation potential in the visible band
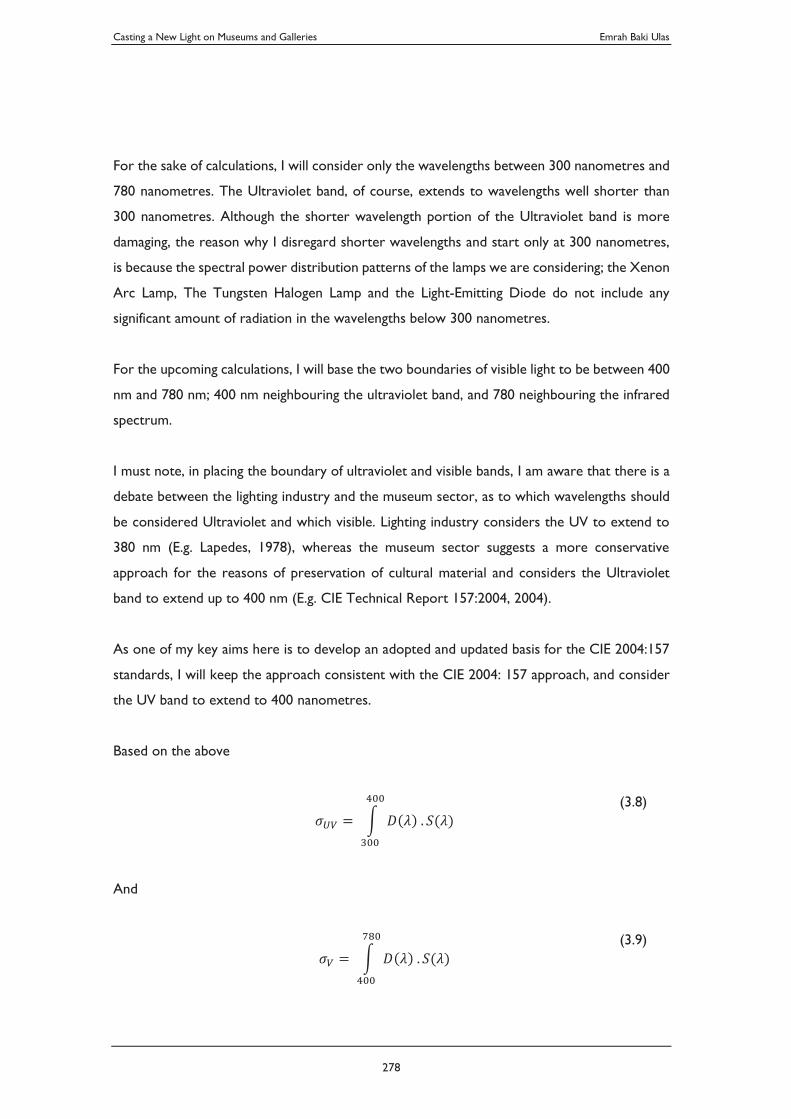
Casting a New Light on Museums and Galleries Emrah Baki Ulas
278
For the sake of calculations, I will consider only the wavelengths between 300 nanometres and
780 nanometres. The Ultraviolet band, of course, extends to wavelengths well shorter than
300 nanometres. Although the shorter wavelength portion of the Ultraviolet band is more
damaging, the reason why I disregard shorter wavelengths and start only at 300 nanometres,
is because the spectral power distribution patterns of the lamps we are considering; the Xenon
Arc Lamp, The Tungsten Halogen Lamp and the Light-Emitting Diode do not include any
significant amount of radiation in the wavelengths below 300 nanometres.
For the upcoming calculations, I will base the two boundaries of visible light to be between 400
nm and 780 nm; 400 nm neighbouring the ultraviolet band, and 780 neighbouring the infrared
spectrum.
I must note, in placing the boundary of ultraviolet and visible bands, I am aware that there is a
debate between the lighting industry and the museum sector, as to which wavelengths should
be considered Ultraviolet and which visible. Lighting industry considers the UV to extend to
380 nm (E.g. Lapedes, 1978), whereas the museum sector suggests a more conservative
approach for the reasons of preservation of cultural material and considers the Ultraviolet
band to extend up to 400 nm (E.g. CIE Technical Report 157:2004, 2004).
As one of my key aims here is to develop an adopted and updated basis for the CIE 2004:157
standards, I will keep the approach consistent with the CIE 2004: 157 approach, and consider
the UV band to extend to 400 nanometres.
Based on the above
(3.8)
And
(3.9)
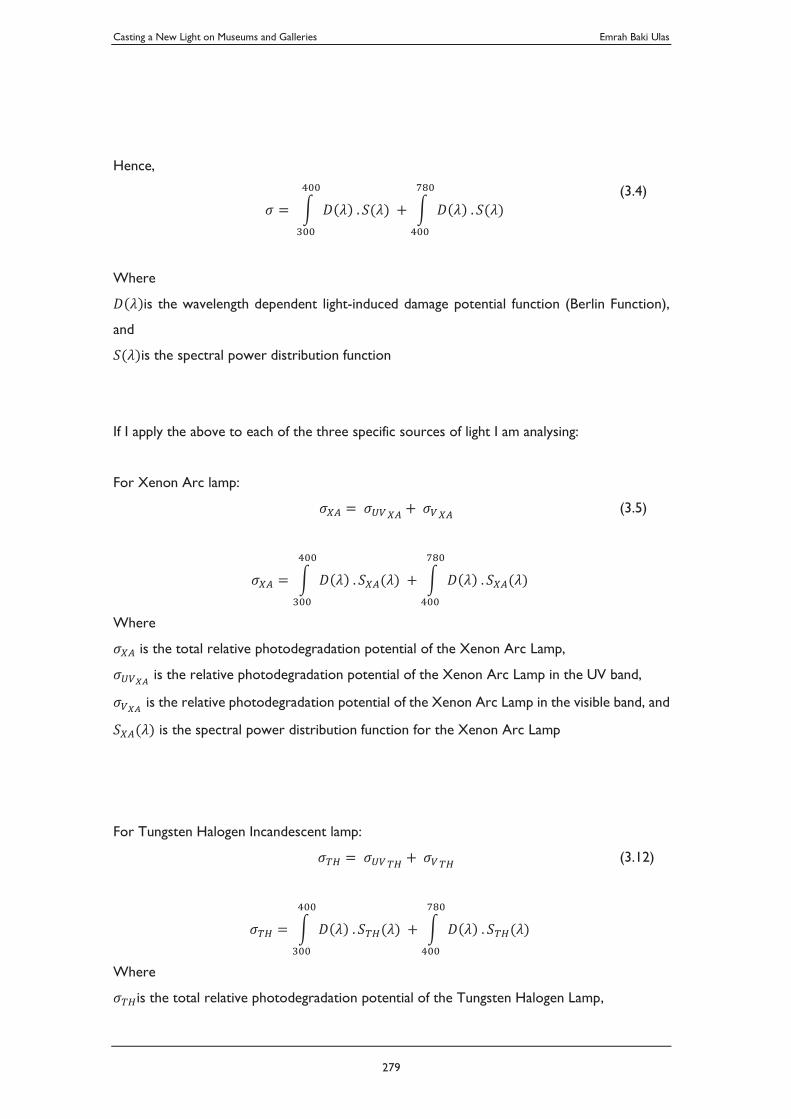
Casting a New Light on Museums and Galleries Emrah Baki Ulas
279
Hence,
(3.4)
Where
is the wavelength dependent light-induced damage potential function (Berlin Function),
and
is the spectral power distribution function
If I apply the above to each of the three specific sources of light I am analysing:
For Xenon Arc lamp:
(3.5)
Where
is the total relative photodegradation potential of the Xenon Arc Lamp,
is the relative photodegradation potential of the Xenon Arc Lamp in the UV band,
is the relative photodegradation potential of the Xenon Arc Lamp in the visible band, and
is the spectral power distribution function for the Xenon Arc Lamp
For Tungsten Halogen Incandescent lamp:
(3.12)
Where
is the total relative photodegradation potential of the Tungsten Halogen Lamp,
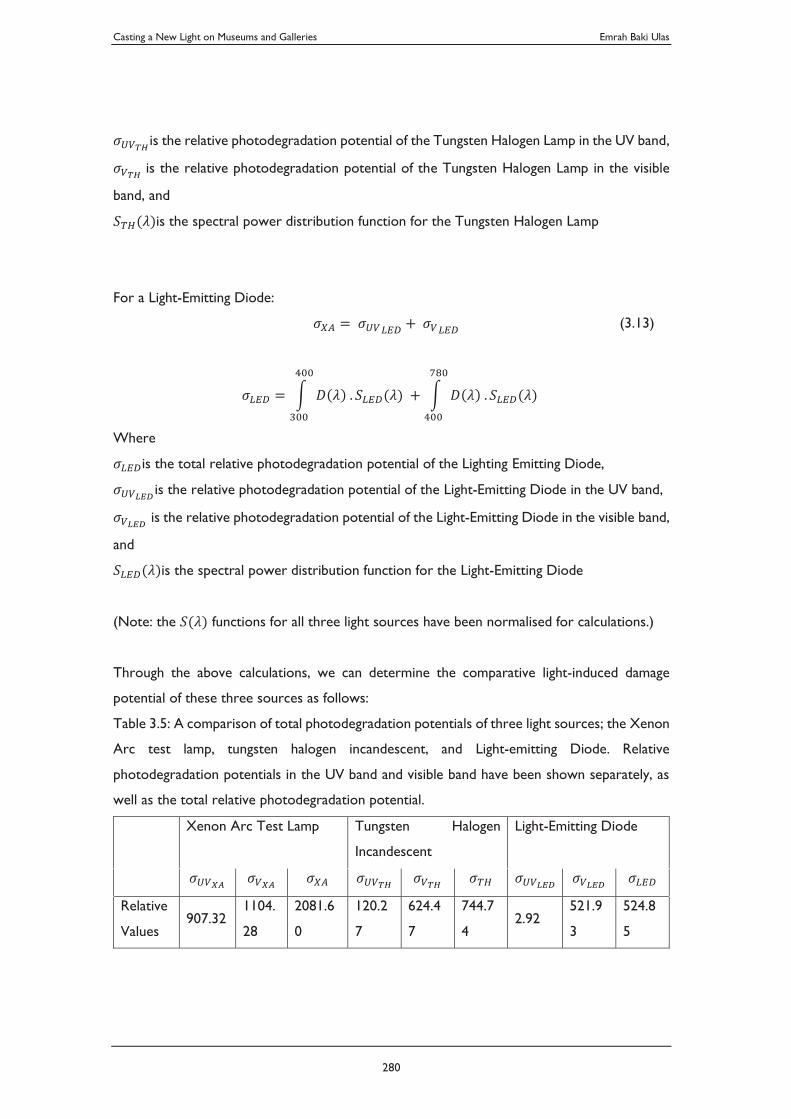
Casting a New Light on Museums and Galleries Emrah Baki Ulas
280
is the relative photodegradation potential of the Tungsten Halogen Lamp in the UV band,
is the relative photodegradation potential of the Tungsten Halogen Lamp in the visible
band, and
is the spectral power distribution function for the Tungsten Halogen Lamp
For a Light-Emitting Diode:
(3.13)
Where
is the total relative photodegradation potential of the Lighting Emitting Diode,
is the relative photodegradation potential of the Light-Emitting Diode in the UV band,
is the relative photodegradation potential of the Light-Emitting Diode in the visible band,
and
is the spectral power distribution function for the Light-Emitting Diode
(Note: the functions for all three light sources have been normalised for calculations.)
Through the above calculations, we can determine the comparative light-induced damage
potential of these three sources as follows:
Table 3.5: A comparison of total photodegradation potentials of three light sources; the Xenon
Arc test lamp, tungsten halogen incandescent, and Light-emitting Diode. Relative
photodegradation potentials in the UV band and visible band have been shown separately, as
well as the total relative photodegradation potential.
Xenon Arc Test Lamp Tungsten Halogen
Incandescent
Light-Emitting Diode
Relative
Values 907.32
1104.
28
2081.6
0
120.2
7
624.4
7
744.7
4 2.92
521.9
3
524.8
5
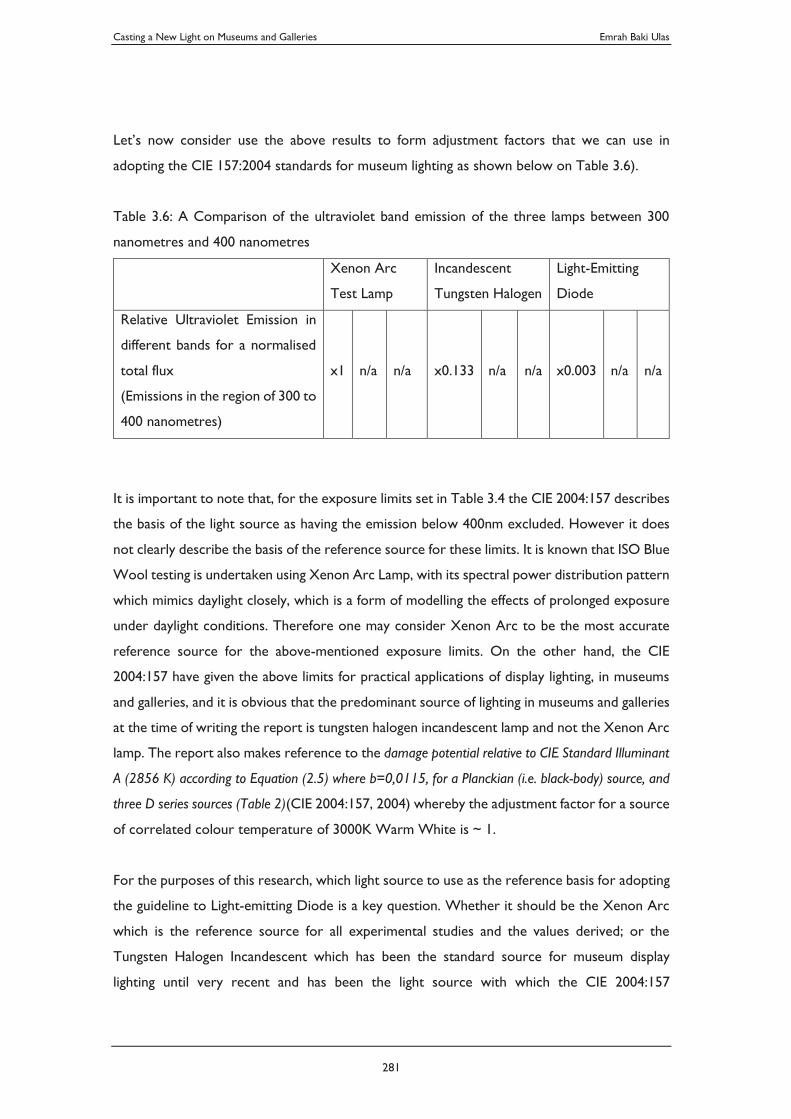
Casting a New Light on Museums and Galleries Emrah Baki Ulas
281
Let’s now consider use the above results to form adjustment factors that we can use in
adopting the CIE 157:2004 standards for museum lighting as shown below on Table 3.6).
Table 3.6: A Comparison of the ultraviolet band emission of the three lamps between 300
nanometres and 400 nanometres
Xenon Arc
Test Lamp
Incandescent
Tungsten Halogen
Light-Emitting
Diode
Relative Ultraviolet Emission in
different bands for a normalised
total flux
(Emissions in the region of 300 to
400 nanometres)
x1 n/a n/a x0.133 n/a n/a x0.003 n/a n/a
It is important to note that, for the exposure limits set in Table 3.4 the CIE 2004:157 describes
the basis of the light source as having the emission below 400nm excluded. However it does
not clearly describe the basis of the reference source for these limits. It is known that ISO Blue
Wool testing is undertaken using Xenon Arc Lamp, with its spectral power distribution pattern
which mimics daylight closely, which is a form of modelling the effects of prolonged exposure
under daylight conditions. Therefore one may consider Xenon Arc to be the most accurate
reference source for the above-mentioned exposure limits. On the other hand, the CIE
2004:157 have given the above limits for practical applications of display lighting, in museums
and galleries, and it is obvious that the predominant source of lighting in museums and galleries
at the time of writing the report is tungsten halogen incandescent lamp and not the Xenon Arc
lamp. The report also makes reference to the damage potential relative to CIE Standard Illuminant
A (2856 K) according to Equation (2.5) where b=0,0115, for a Planckian (i.e. black-body) source, and
three D series sources (Table 2)(CIE 2004:157, 2004) whereby the adjustment factor for a source
of correlated colour temperature of 3000K Warm White is ~ 1.
For the purposes of this research, which light source to use as the reference basis for adopting
the guideline to Light-emitting Diode is a key question. Whether it should be the Xenon Arc
which is the reference source for all experimental studies and the values derived; or the
Tungsten Halogen Incandescent which has been the standard source for museum display
lighting until very recent and has been the light source with which the CIE 2004:157
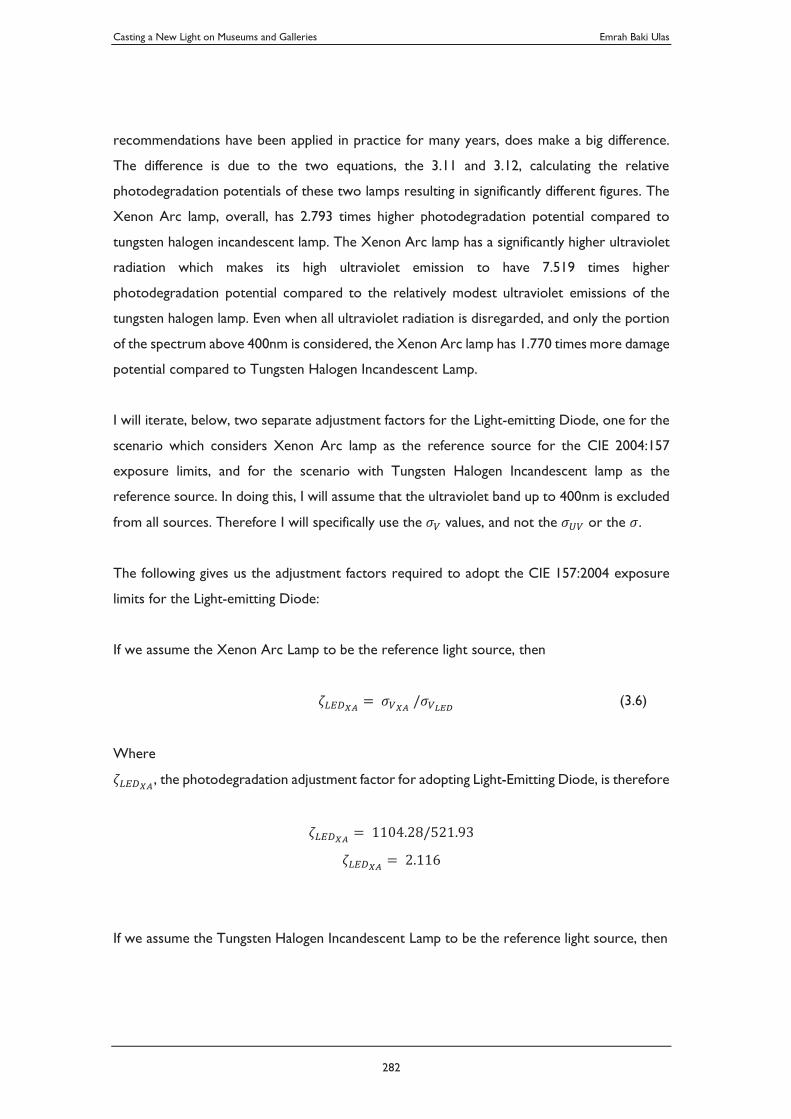
Casting a New Light on Museums and Galleries Emrah Baki Ulas
282
recommendations have been applied in practice for many years, does make a big difference.
The difference is due to the two equations, the 3.11 and 3.12, calculating the relative
photodegradation potentials of these two lamps resulting in significantly different figures. The
Xenon Arc lamp, overall, has 2.793 times higher photodegradation potential compared to
tungsten halogen incandescent lamp. The Xenon Arc lamp has a significantly higher ultraviolet
radiation which makes its high ultraviolet emission to have 7.519 times higher
photodegradation potential compared to the relatively modest ultraviolet emissions of the
tungsten halogen lamp. Even when all ultraviolet radiation is disregarded, and only the portion
of the spectrum above 400nm is considered, the Xenon Arc lamp has 1.770 times more damage
potential compared to Tungsten Halogen Incandescent Lamp.
I will iterate, below, two separate adjustment factors for the Light-emitting Diode, one for the
scenario which considers Xenon Arc lamp as the reference source for the CIE 2004:157
exposure limits, and for the scenario with Tungsten Halogen Incandescent lamp as the
reference source. In doing this, I will assume that the ultraviolet band up to 400nm is excluded
from all sources. Therefore I will specifically use the values, and not the or the .
The following gives us the adjustment factors required to adopt the CIE 157:2004 exposure
limits for the Light-emitting Diode:
If we assume the Xenon Arc Lamp to be the reference light source, then
(3.6)
Where
, the photodegradation adjustment factor for adopting Light-Emitting Diode, is therefore
If we assume the Tungsten Halogen Incandescent Lamp to be the reference light source, then
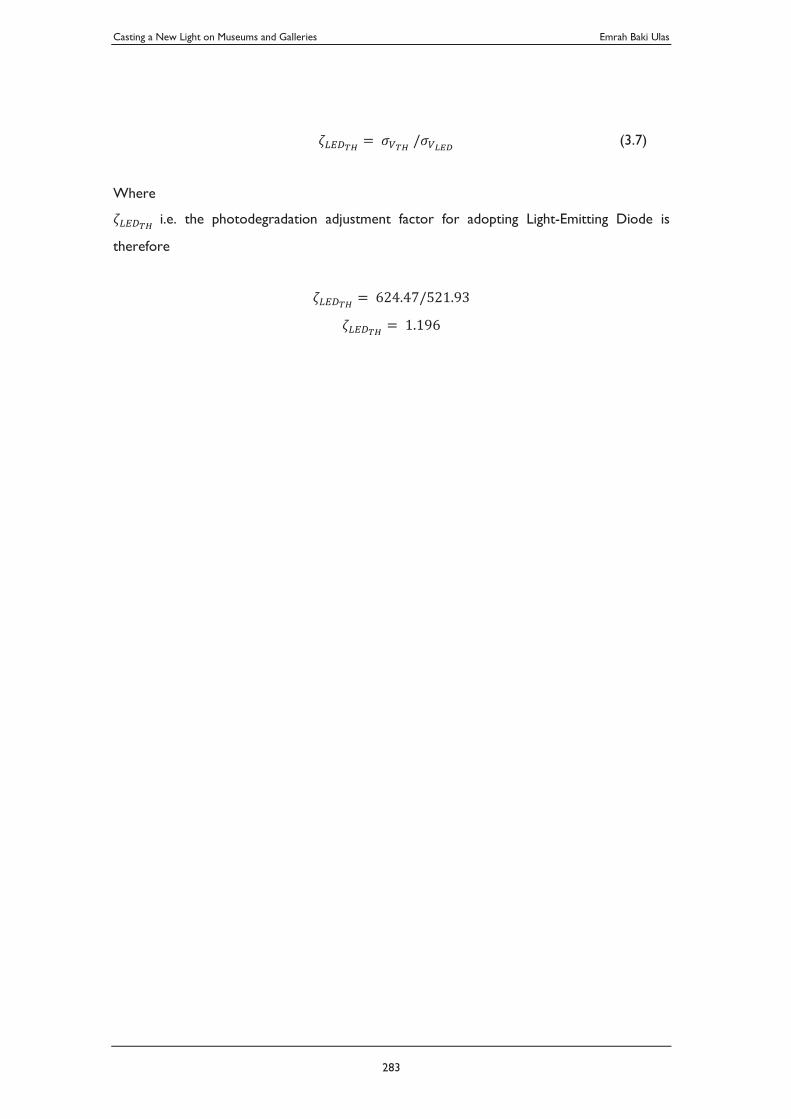
Casting a New Light on Museums and Galleries Emrah Baki Ulas
283
(3.7)
Where
i.e. the photodegradation adjustment factor for adopting Light-Emitting Diode is
therefore
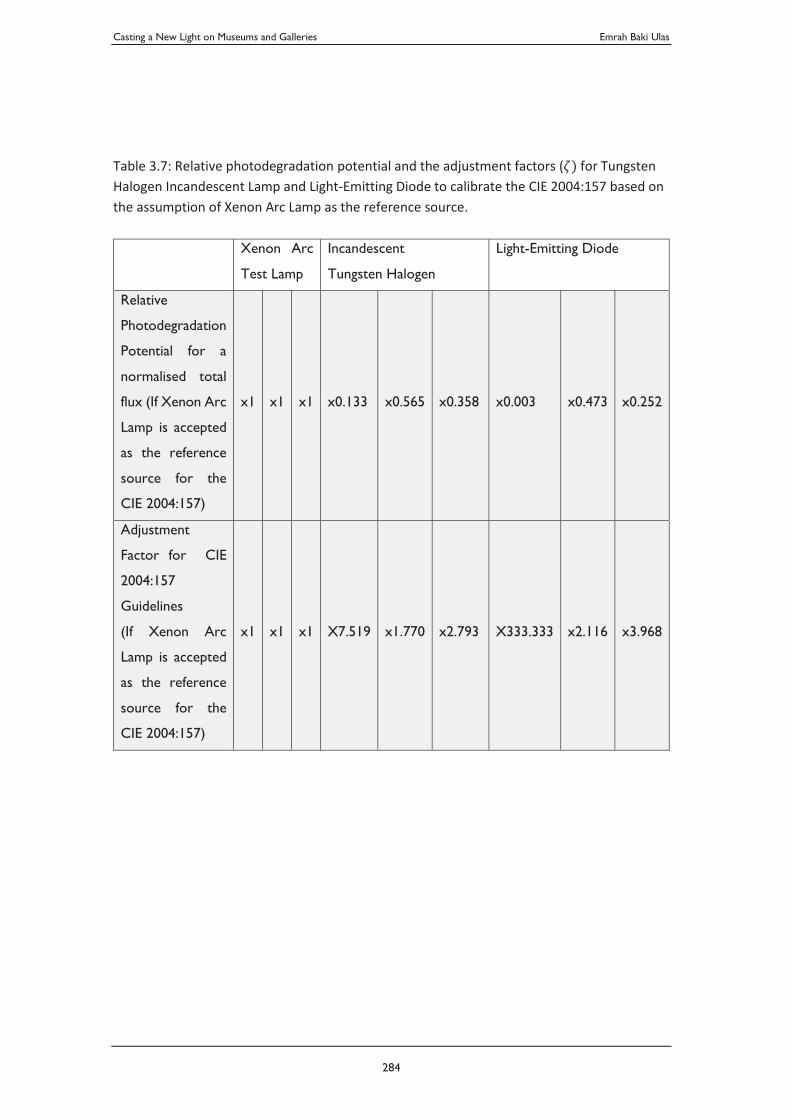
Casting a New Light on Museums and Galleries Emrah Baki Ulas
284
Table 3.7: Relative photodegradation potential and the adjustment factors ( for Tungsten Halogen Incandescent Lamp and Light-Emitting Diode to calibrate the CIE 2004:157 based on the assumption of Xenon Arc Lamp as the reference source. Xenon Arc
Test Lamp
Incandescent
Tungsten Halogen
Light-Emitting Diode
Relative
Photodegradation
Potential for a
normalised total
flux (If Xenon Arc
Lamp is accepted
as the reference
source for the
CIE 2004:157)
x1 x1 x1 x0.133 x0.565 x0.358 x0.003 x0.473 x0.252
Adjustment
Factor for CIE
2004:157
Guidelines
(If Xenon Arc
Lamp is accepted
as the reference
source for the
CIE 2004:157)
x1 x1 x1 X7.519 x1.770 x2.793 X333.333 x2.116 x3.968
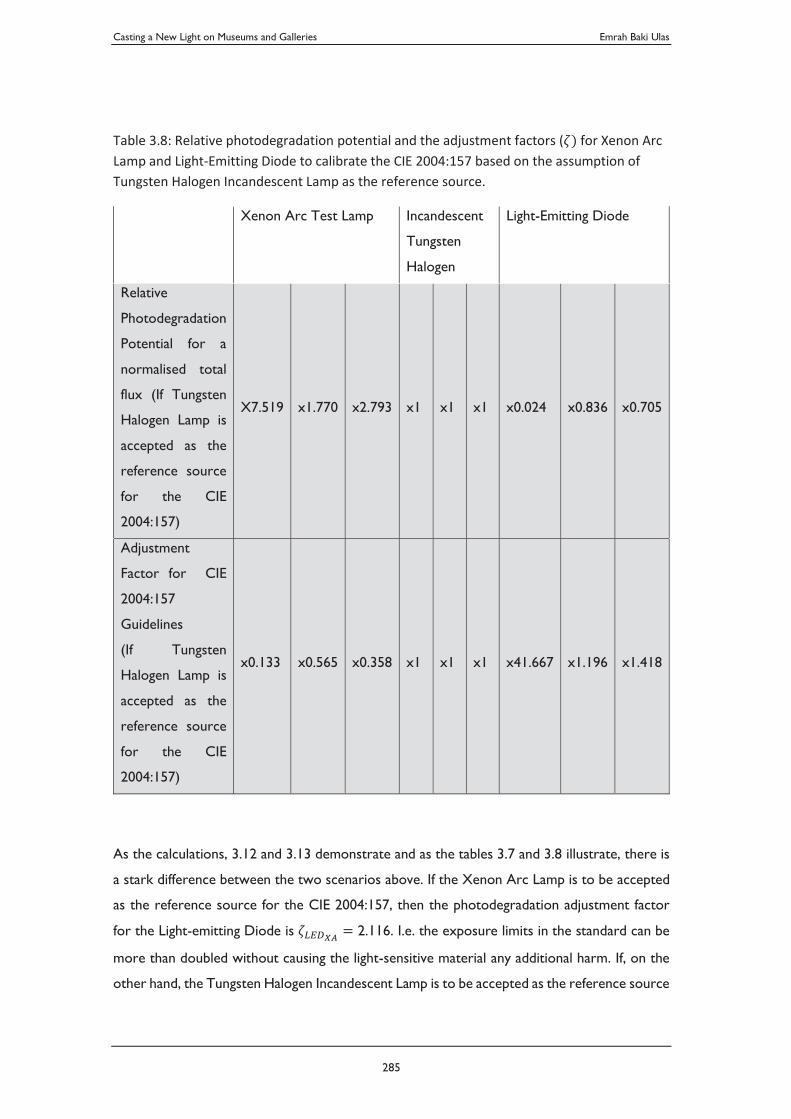
Casting a New Light on Museums and Galleries Emrah Baki Ulas
285
Table 3.8: Relative photodegradation potential and the adjustment factors ( for Xenon Arc Lamp and Light-Emitting Diode to calibrate the CIE 2004:157 based on the assumption of Tungsten Halogen Incandescent Lamp as the reference source.
Xenon Arc Test Lamp Incandescent
Tungsten
Halogen
Light-Emitting Diode
Relative
Photodegradation
Potential for a
normalised total
flux (If Tungsten
Halogen Lamp is
accepted as the
reference source
for the CIE
2004:157)
X7.519 x1.770 x2.793 x1 x1 x1 x0.024 x0.836 x0.705
Adjustment
Factor for CIE
2004:157
Guidelines
(If Tungsten
Halogen Lamp is
accepted as the
reference source
for the CIE
2004:157)
x0.133 x0.565 x0.358 x1 x1 x1 x41.667 x1.196 x1.418
As the calculations, 3.12 and 3.13 demonstrate and as the tables 3.7 and 3.8 illustrate, there is
a stark difference between the two scenarios above. If the Xenon Arc Lamp is to be accepted
as the reference source for the CIE 2004:157, then the photodegradation adjustment factor
for the Light-emitting Diode is 2.116. I.e. the exposure limits in the standard can be
more than doubled without causing the light-sensitive material any additional harm. If, on the
other hand, the Tungsten Halogen Incandescent Lamp is to be accepted as the reference source
Casting a New Light on Museums and Galleries Emrah Baki Ulas
286
for the CIE 2004:157, then the photodegradation adjustment factor for the Light-emitting
Diode is 1.196. I.e. the exposure limits in the standard can be increased in the order
of approximately 20% without causing the light-sensitive material any additional harm.
Looking at the matter strictly scientifically, the Author’s opinion is that the Xenon Arc should
be used as the reference source as it is the basis of all ISO Blue Wool Measurements. I will,
however, keep both scenarios open as we are moving on to the next section, rather than
coming to a conclusion on the above note and excluding the adjustment factor for the scenario
of the Tungsten Halogen Incandescent lamp as a reference source. In the next chapter we look
at the exposure limits of the CIE 2004:157 more closely and put the above adjustment factors
into use to calibrate the exposure limits to better fit the use of the Light-emitting Diode in
museum lighting.
Casting a New Light on Museums and Galleries Emrah Baki Ulas
287
3.2. A Framework for Evaluating the Consequence of LED Lighting on Preventive Conservation of Exhibits on Display
Concerning reducing the light-induced damage to objects, I have analysed and discussed some
of the shortcomings of the museum and gallery display lighting standards that are commonly in
use in most cultural institutions around the globe. In this analysis and discussion, I have also
pointed at the complexity of the issues in this respect. The nature of museum display items are
highly varied; they encompass a wide range of materials and techniques, their condition, age,
susceptibilities to light damage are all dependent on their specifics, as well as their past, present
and future conditions of display or storage (and even their lives pre-museum), including but
not limited to the lighting and climate control conditions. It is evident that there are countless
parameters that affect the actual rate of light-induced deterioration, and any standard or guide
in this respect is merely an attempt to address the problem in a rather limited manner, with a
considerable degree of assumptions, approximations, and simplifications. My attempt here
suggests an improved framework for advancing the museum and gallery display lighting
standards and guidelines. It does not aim to address the entire range of complexities or close
all the gaps in the current guidelines and standards, but tackle the issue in three major ways:
firstly taking into account the effect of the difference in the spectral composition of the new
(Light-emitting Diode) light sources used in museums and galleries; secondly taking into
account the actual nature of the light-induced fading, in a more detailed manner, developing
individual recommendations for each of the 8 classifications of the ISO Blue Wool Scale, rather
than grouping them in the three collated categories as in CIE 2004:157; and thirdly bringing a
definition to the intended usable lifetime of a museum article (independent of its light
susceptibility classification), and unifying the basis of the lighting recommendations based on
the same lifetime expectation across all ISO Blue Wool scala.
For the first; the effect of the difference in the spectral composition, I will refer to the
calculations performed in section 3.1 and use the relative photodegradation potential
relationships as I derived. For the second, I will analyse the individual exposure values for each
of the ISO Blue Wool Scale as per Table 3.3 and modify and further expand on the
Casting a New Light on Museums and Galleries Emrah Baki Ulas
288
recommendations given in Table 3.4 accordingly. Finally, for the third, I will recalculate these
requirements to suit a normalised life expectancy.
The framework which I will develop here is built on the same basis as the CIE Technical Report
2004:157 recommendations, however, has a key difference in that it suggest significant
adjustments to the proposed values of Kluxhour/year light exposure limits. With this basis, it
is acknowledged that not only the adjustments have their particular limitations which originate
from the margins of errors and approximations in the calculations, and the actual relevance of
the data used, but they also inherit a range of issues that have previously been discussed for
the CIE technical report 2004:157 recommendations that primarily result from the
categorisation of items in broad groups with large variances within. The adjustments proposed
are not only alterations to the absolute exposure values per each “just noticeable fade”, but
also are time-dependent; in that the recommended total light exposure per year starts at a
relatively lower allowable limit earlier in the lifetime of a museum display item, since the item
would be most susceptible to light-induced damage. The allowable exposure limit increases as
time goes since further damage would take more exposure light to cause the equivalent degree
of damage compared to earlier.
Let’s firstly consider the total allowable light exposure limits for the entire lifetime of a museum
display object, based on its ISO Blue Wool classification for light susceptibility. I will do this by
referring to Table 3.3 and Table 3.4 and by calculating the following:
Let’s define
as the ISO Rating of the material,
as the total allowable dose (exposure) for the entire lifetime* of the material
[Megaluxhours], and
as the number of years that a material with ISO Blue Wool classification would take to
fade one just noticeable fade (according to a theoretical yearly exposure of 3,000 hrs under 50
lux with no ultraviolet, as per Table 3.3),
If we define the lifetime of the object as between its undamaged, original state and the state
when it reaches a fading of 10 just noticeable fades (as per Victoria and Albert Museum’s
practice guide (Ford et al., 2011)),
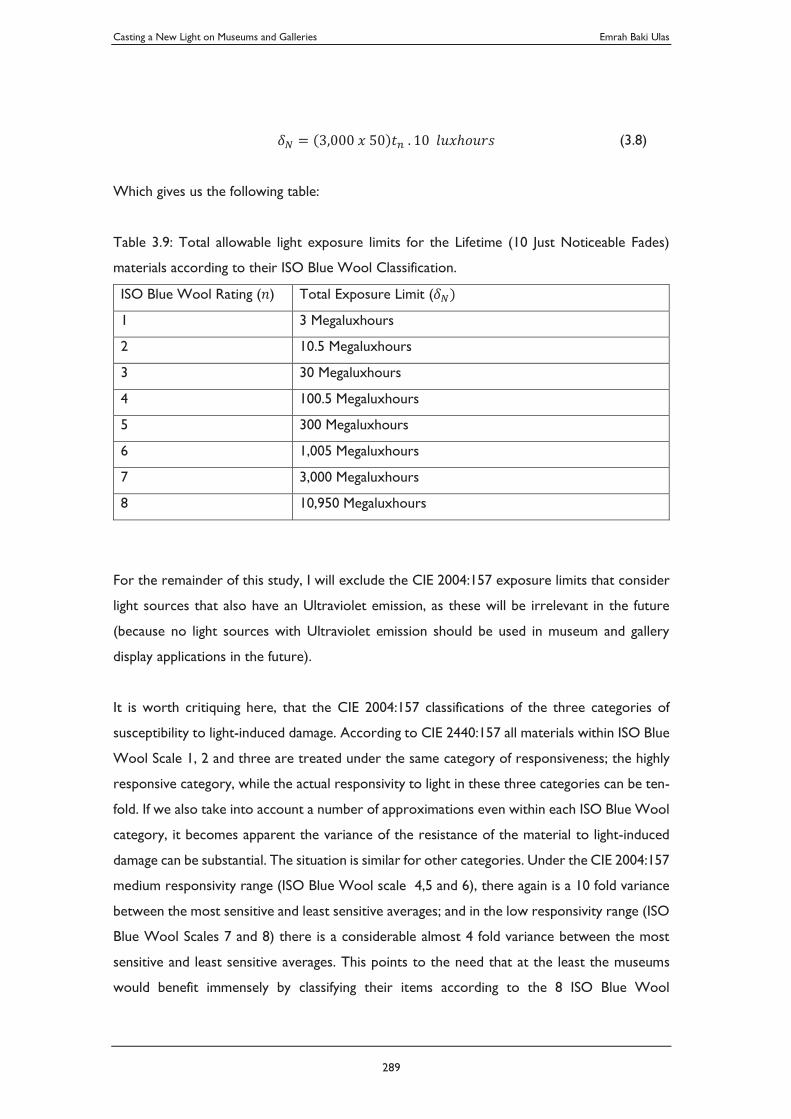
Casting a New Light on Museums and Galleries Emrah Baki Ulas
289
(3.8)
Which gives us the following table:
Table 3.9: Total allowable light exposure limits for the Lifetime (10 Just Noticeable Fades)
materials according to their ISO Blue Wool Classification.
ISO Blue Wool Rating ( ) Total Exposure Limit (
1 3 Megaluxhours
2 10.5 Megaluxhours
3 30 Megaluxhours
4 100.5 Megaluxhours
5 300 Megaluxhours
6 1,005 Megaluxhours
7 3,000 Megaluxhours
8 10,950 Megaluxhours
For the remainder of this study, I will exclude the CIE 2004:157 exposure limits that consider
light sources that also have an Ultraviolet emission, as these will be irrelevant in the future
(because no light sources with Ultraviolet emission should be used in museum and gallery
display applications in the future).
It is worth critiquing here, that the CIE 2004:157 classifications of the three categories of
susceptibility to light-induced damage. According to CIE 2440:157 all materials within ISO Blue
Wool Scale 1, 2 and three are treated under the same category of responsiveness; the highly
responsive category, while the actual responsivity to light in these three categories can be ten-
fold. If we also take into account a number of approximations even within each ISO Blue Wool
category, it becomes apparent the variance of the resistance of the material to light-induced
damage can be substantial. The situation is similar for other categories. Under the CIE 2004:157
medium responsivity range (ISO Blue Wool scale 4,5 and 6), there again is a 10 fold variance
between the most sensitive and least sensitive averages; and in the low responsivity range (ISO
Blue Wool Scales 7 and 8) there is a considerable almost 4 fold variance between the most
sensitive and least sensitive averages. This points to the need that at the least the museums
would benefit immensely by classifying their items according to the 8 ISO Blue Wool
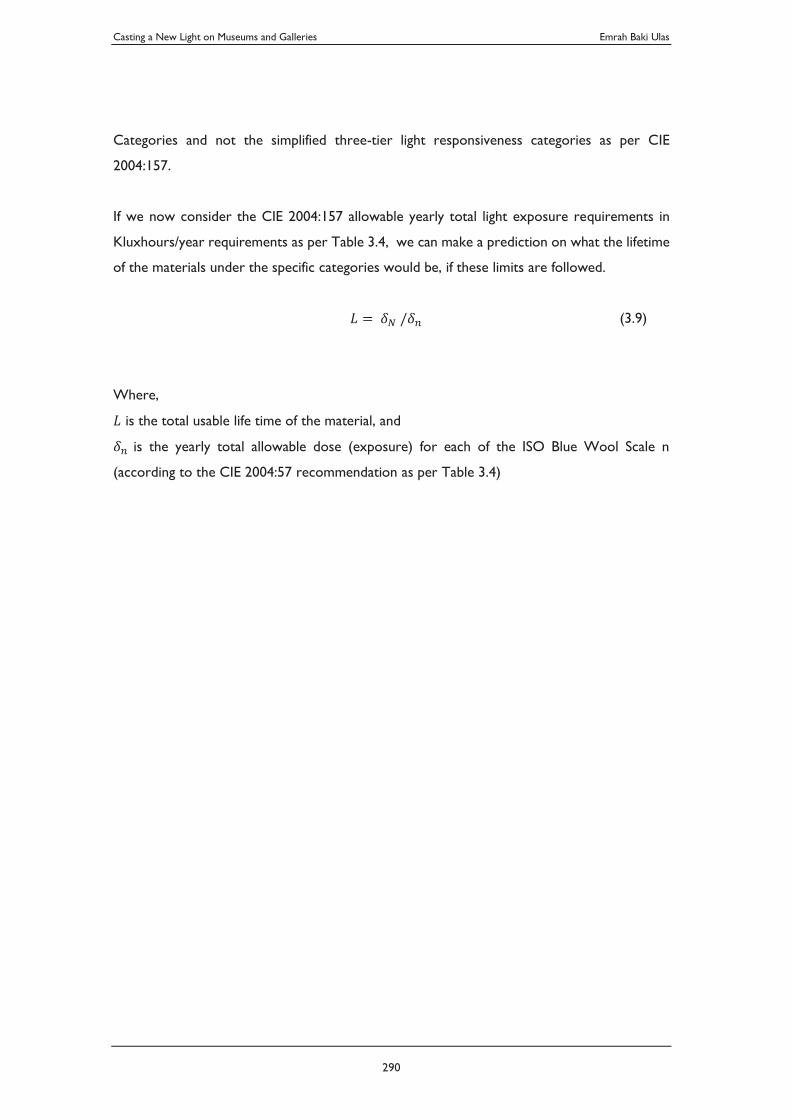
Casting a New Light on Museums and Galleries Emrah Baki Ulas
290
Categories and not the simplified three-tier light responsiveness categories as per CIE
2004:157.
If we now consider the CIE 2004:157 allowable yearly total light exposure requirements in
Kluxhours/year requirements as per Table 3.4, we can make a prediction on what the lifetime
of the materials under the specific categories would be, if these limits are followed.
(3.9)
Where,
is the total usable life time of the material, and
is the yearly total allowable dose (exposure) for each of the ISO Blue Wool Scale n
(according to the CIE 2004:57 recommendation as per Table 3.4)
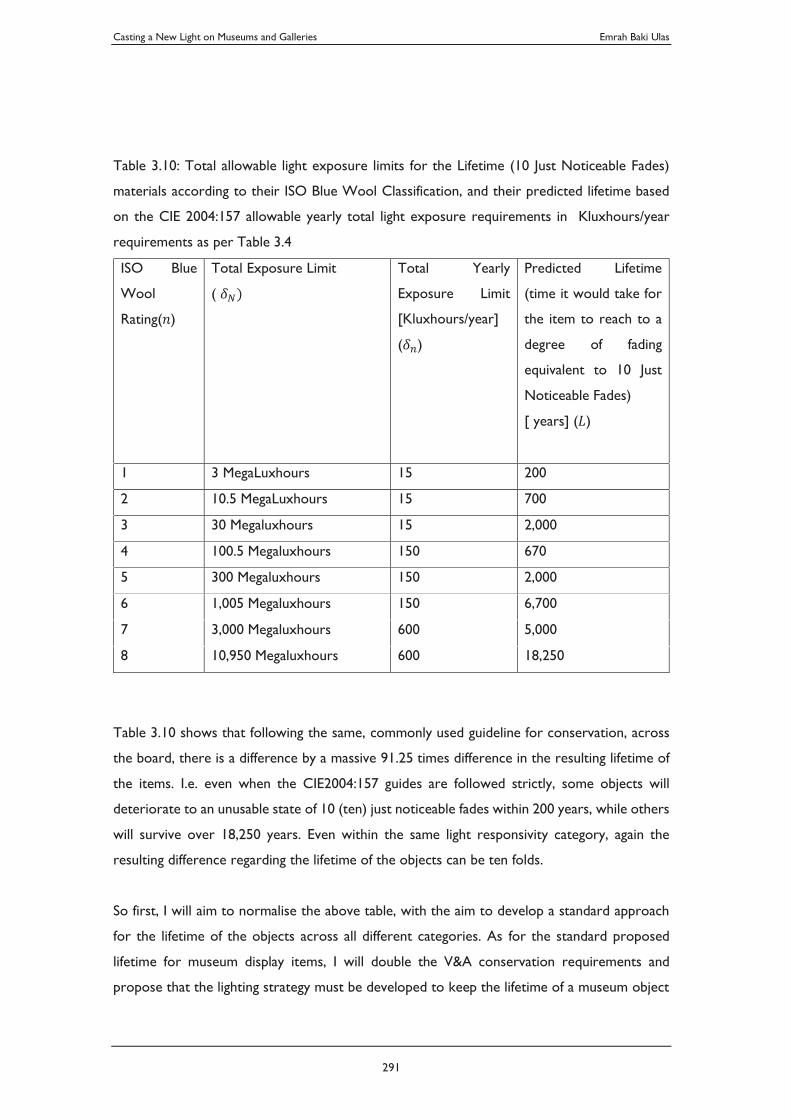
Casting a New Light on Museums and Galleries Emrah Baki Ulas
291
Table 3.10: Total allowable light exposure limits for the Lifetime (10 Just Noticeable Fades)
materials according to their ISO Blue Wool Classification, and their predicted lifetime based
on the CIE 2004:157 allowable yearly total light exposure requirements in Kluxhours/year
requirements as per Table 3.4
ISO Blue
Wool
Rating( )
Total Exposure Limit
(
Total Yearly
Exposure Limit
[Kluxhours/year]
( )
Predicted Lifetime
(time it would take for
the item to reach to a
degree of fading
equivalent to 10 Just
Noticeable Fades)
[ years] ( )
1 3 MegaLuxhours 15 200
2 10.5 MegaLuxhours 15 700
3 30 Megaluxhours 15 2,000
4 100.5 Megaluxhours 150 670
5 300 Megaluxhours 150 2,000
6 1,005 Megaluxhours 150 6,700
7 3,000 Megaluxhours 600 5,000
8 10,950 Megaluxhours 600 18,250
Table 3.10 shows that following the same, commonly used guideline for conservation, across
the board, there is a difference by a massive 91.25 times difference in the resulting lifetime of
the items. I.e. even when the CIE2004:157 guides are followed strictly, some objects will
deteriorate to an unusable state of 10 (ten) just noticeable fades within 200 years, while others
will survive over 18,250 years. Even within the same light responsivity category, again the
resulting difference regarding the lifetime of the objects can be ten folds.
So first, I will aim to normalise the above table, with the aim to develop a standard approach
for the lifetime of the objects across all different categories. As for the standard proposed
lifetime for museum display items, I will double the V&A conservation requirements and
propose that the lighting strategy must be developed to keep the lifetime of a museum object
Casting a New Light on Museums and Galleries Emrah Baki Ulas
292
to be at least 1,000 years. (I note of course that firstly, the actual lifetime of the object is
dependent on many other conditions which I neglect in this study, and secondly that the actual
photodegradation trend is of an exponentially lessening nature (which I will tackle next).
I must also note that the proposed duration of the aimed lifetime of an object is subject to a
wider and well-rounded discussion, which involves considerations regarding the items present
and future value and significance etc. I will not delve into this somewhat subjective debate here
and only note the actual figure of what the life of an object must be can be altered to suit,
based on the same logic I am following. The main aim here is to assess items of different light
susceptibility on a neutral basis, assuming they are equally significant and their intended lifetime
is equivalent and not attached to their susceptibility to light damage. Mathematically I will be
adjusting the figures in the above table (Table 3.10) as follows:
Let’s fix the value of as 1,000 years, and let’s redefine the values of accordingly.
Where
years, and
values are as per Table 3.6,
the yearly total allowable dose (exposure) for each of the ISO Blue Wool Scale , can be
redefined as follows:
(3.10)
The resulting adjusted values are derived to be as follows:
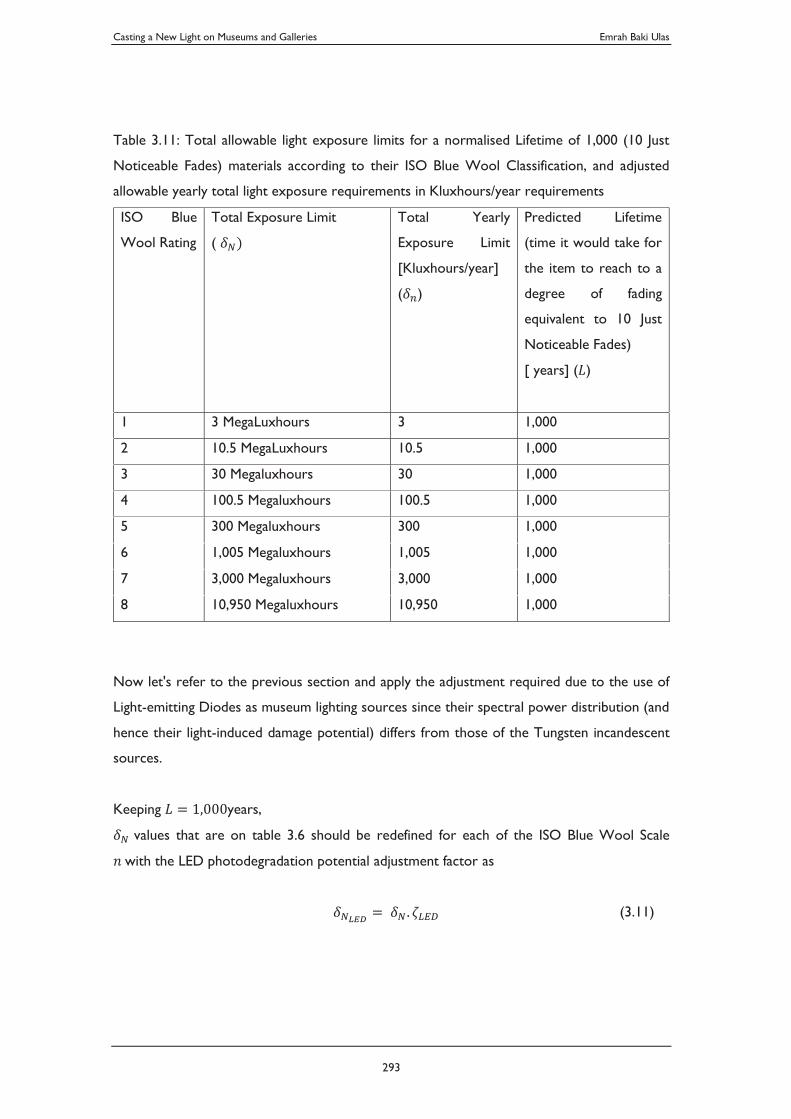
Casting a New Light on Museums and Galleries Emrah Baki Ulas
293
Table 3.11: Total allowable light exposure limits for a normalised Lifetime of 1,000 (10 Just
Noticeable Fades) materials according to their ISO Blue Wool Classification, and adjusted
allowable yearly total light exposure requirements in Kluxhours/year requirements
ISO Blue
Wool Rating
Total Exposure Limit
(
Total Yearly
Exposure Limit
[Kluxhours/year]
( )
Predicted Lifetime
(time it would take for
the item to reach to a
degree of fading
equivalent to 10 Just
Noticeable Fades)
[ years] ( )
1 3 MegaLuxhours 3 1,000
2 10.5 MegaLuxhours 10.5 1,000
3 30 Megaluxhours 30 1,000
4 100.5 Megaluxhours 100.5 1,000
5 300 Megaluxhours 300 1,000
6 1,005 Megaluxhours 1,005 1,000
7 3,000 Megaluxhours 3,000 1,000
8 10,950 Megaluxhours 10,950 1,000
Now let's refer to the previous section and apply the adjustment required due to the use of
Light-emitting Diodes as museum lighting sources since their spectral power distribution (and
hence their light-induced damage potential) differs from those of the Tungsten incandescent
sources.
Keeping years,
values that are on table 3.6 should be redefined for each of the ISO Blue Wool Scale
with the LED photodegradation potential adjustment factor as
(3.11)
Casting a New Light on Museums and Galleries Emrah Baki Ulas
294
And values are that are on table 3.8 should be redefined with the LED photodegradation
potential adjustment factor as
(3.12)
Where
is the LED photodegradation potential adjustment factor.
Since I have left the discussion on the reference source often and calculated the for both
the scenarios of Xenon Arc Lamp as the reference ( ) and the Tungsten Halogen
Incandescent lamp as the reference ( ), I will iterate equations 3.17 and 3.18 for both
scenarios, generating two distinct outcomes.
For the first scenario, according to Table 3.8, the value of is 2.116. Hence, if the
exposure limits are adjusted accordingly, the calculations show the following:
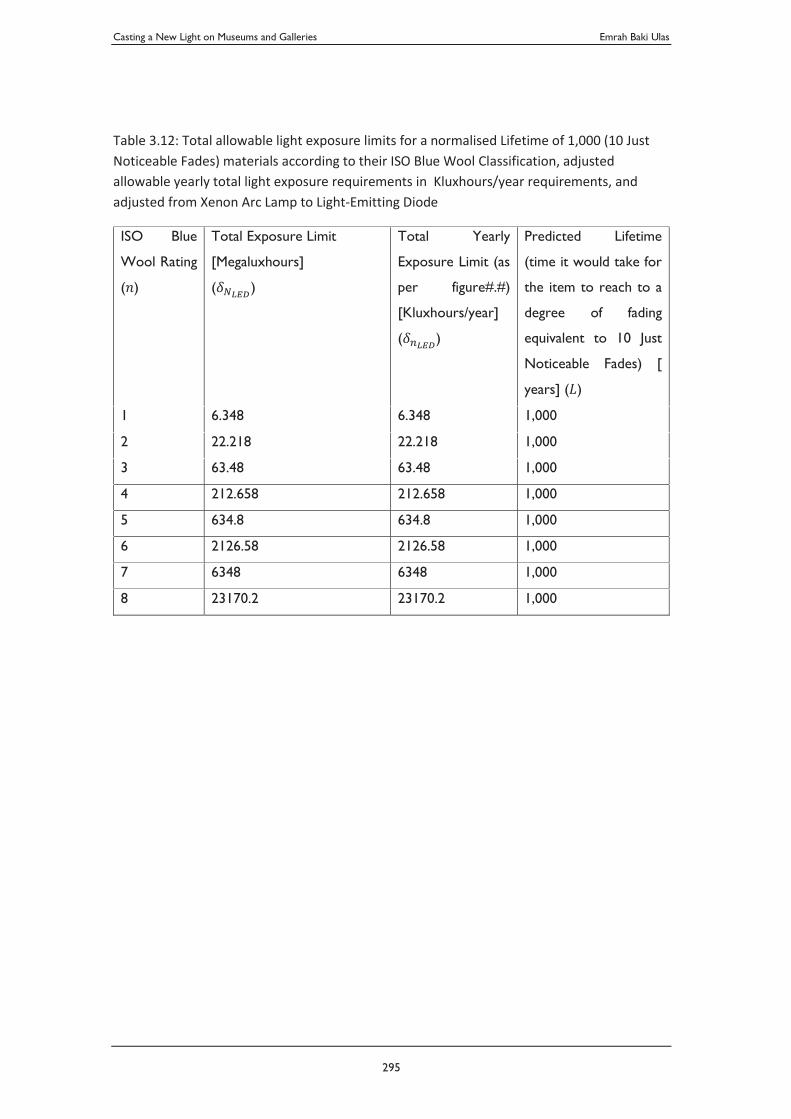
Casting a New Light on Museums and Galleries Emrah Baki Ulas
295
Table 3.12: Total allowable light exposure limits for a normalised Lifetime of 1,000 (10 Just Noticeable Fades) materials according to their ISO Blue Wool Classification, adjusted allowable yearly total light exposure requirements in Kluxhours/year requirements, and adjusted from Xenon Arc Lamp to Light-Emitting Diode
ISO Blue
Wool Rating
( )
Total Exposure Limit
[Megaluxhours]
( )
Total Yearly
Exposure Limit (as
per figure#.#)
[Kluxhours/year]
( )
Predicted Lifetime
(time it would take for
the item to reach to a
degree of fading
equivalent to 10 Just
Noticeable Fades) [
years] ( )
1 6.348 6.348 1,000
2 22.218 22.218 1,000
3 63.48 63.48 1,000
4 212.658 212.658 1,000
5 634.8 634.8 1,000
6 2126.58 2126.58 1,000
7 6348 6348 1,000
8 23170.2 23170.2 1,000
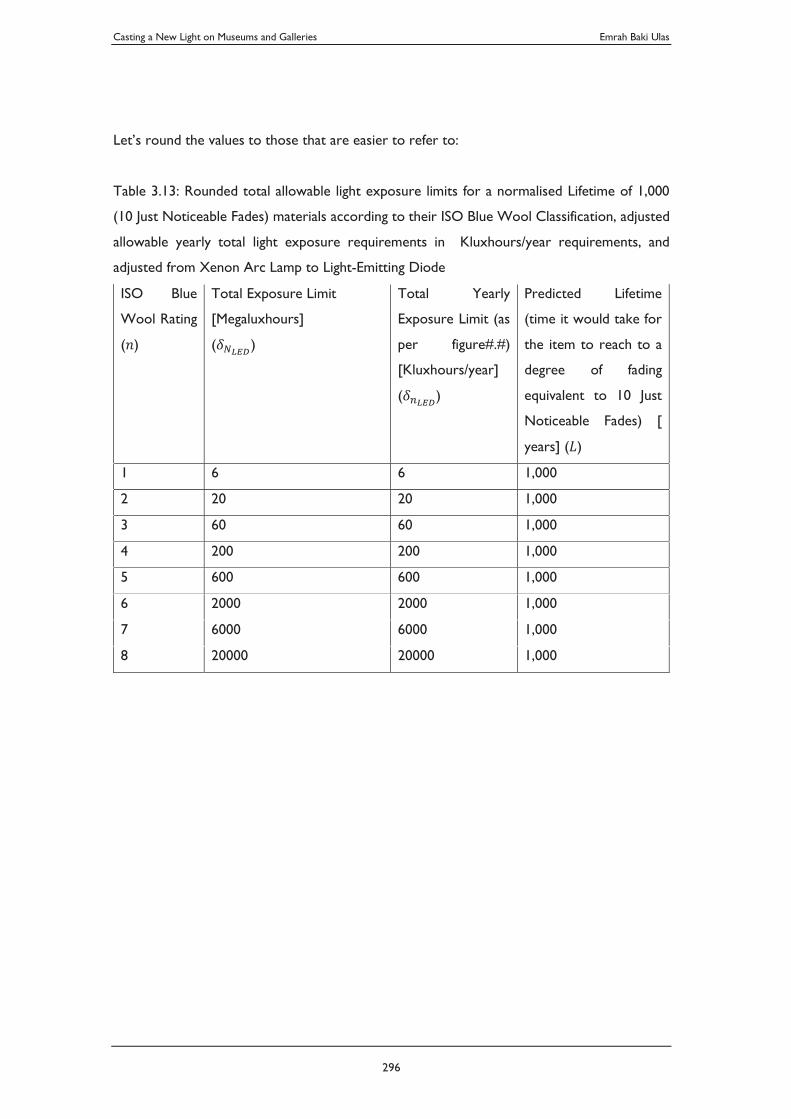
Casting a New Light on Museums and Galleries Emrah Baki Ulas
296
Let’s round the values to those that are easier to refer to:
Table 3.13: Rounded total allowable light exposure limits for a normalised Lifetime of 1,000
(10 Just Noticeable Fades) materials according to their ISO Blue Wool Classification, adjusted
allowable yearly total light exposure requirements in Kluxhours/year requirements, and
adjusted from Xenon Arc Lamp to Light-Emitting Diode
ISO Blue
Wool Rating
( )
Total Exposure Limit
[Megaluxhours]
( )
Total Yearly
Exposure Limit (as
per figure#.#)
[Kluxhours/year]
( )
Predicted Lifetime
(time it would take for
the item to reach to a
degree of fading
equivalent to 10 Just
Noticeable Fades) [
years] ( )
1 6 6 1,000
2 20 20 1,000
3 60 60 1,000
4 200 200 1,000
5 600 600 1,000
6 2000 2000 1,000
7 6000 6000 1,000
8 20000 20000 1,000
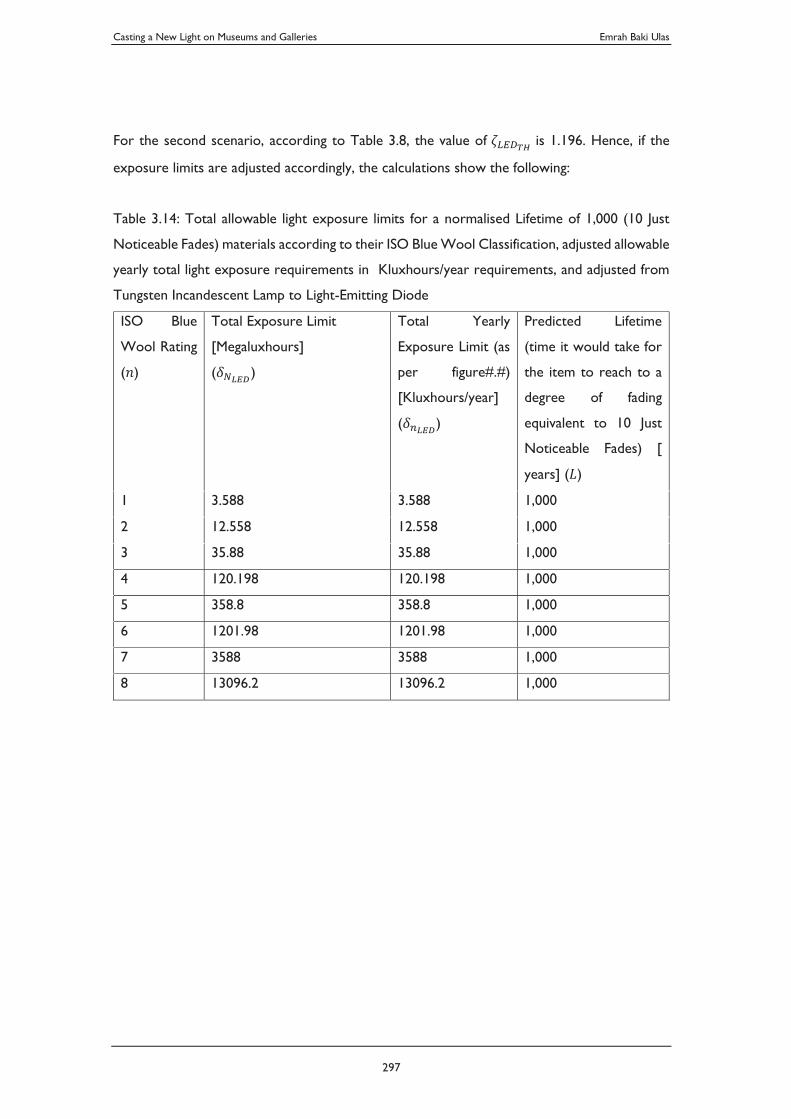
Casting a New Light on Museums and Galleries Emrah Baki Ulas
297
For the second scenario, according to Table 3.8, the value of is 1.196. Hence, if the
exposure limits are adjusted accordingly, the calculations show the following:
Table 3.14: Total allowable light exposure limits for a normalised Lifetime of 1,000 (10 Just
Noticeable Fades) materials according to their ISO Blue Wool Classification, adjusted allowable
yearly total light exposure requirements in Kluxhours/year requirements, and adjusted from
Tungsten Incandescent Lamp to Light-Emitting Diode
ISO Blue
Wool Rating
( )
Total Exposure Limit
[Megaluxhours]
( )
Total Yearly
Exposure Limit (as
per figure#.#)
[Kluxhours/year]
( )
Predicted Lifetime
(time it would take for
the item to reach to a
degree of fading
equivalent to 10 Just
Noticeable Fades) [
years] ( )
1 3.588 3.588 1,000
2 12.558 12.558 1,000
3 35.88 35.88 1,000
4 120.198 120.198 1,000
5 358.8 358.8 1,000
6 1201.98 1201.98 1,000
7 3588 3588 1,000
8 13096.2 13096.2 1,000
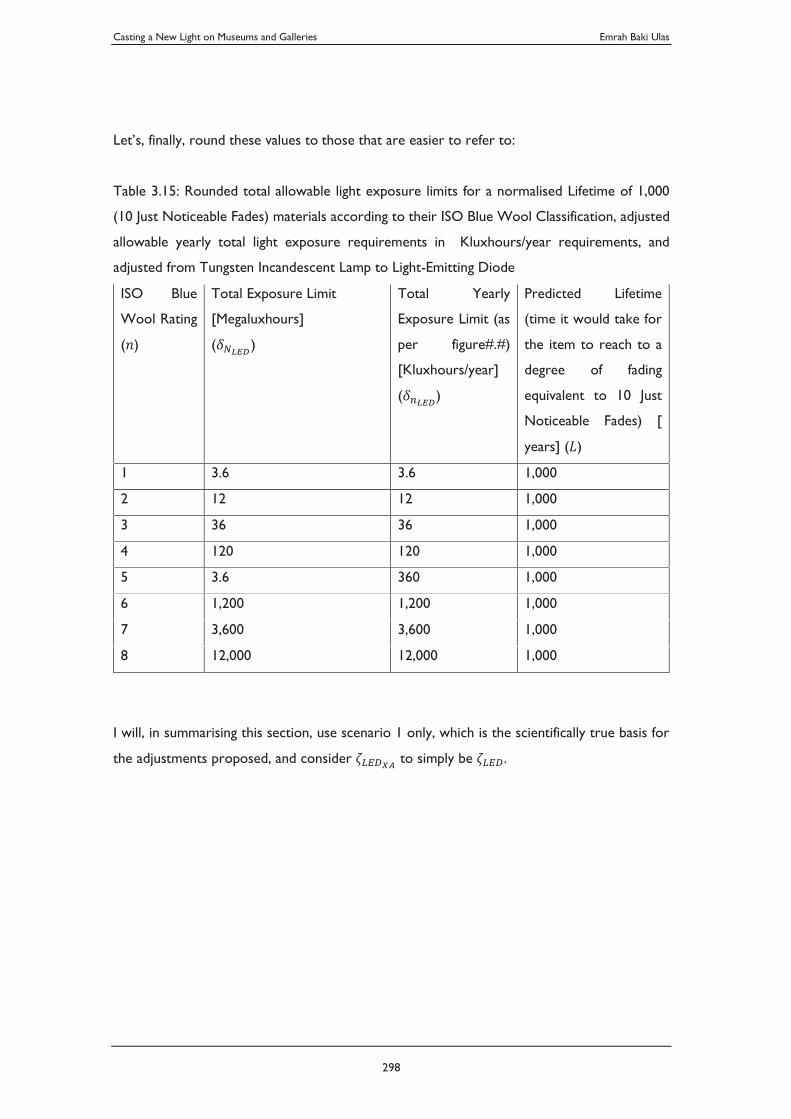
Casting a New Light on Museums and Galleries Emrah Baki Ulas
298
Let’s, finally, round these values to those that are easier to refer to:
Table 3.15: Rounded total allowable light exposure limits for a normalised Lifetime of 1,000
(10 Just Noticeable Fades) materials according to their ISO Blue Wool Classification, adjusted
allowable yearly total light exposure requirements in Kluxhours/year requirements, and
adjusted from Tungsten Incandescent Lamp to Light-Emitting Diode
ISO Blue
Wool Rating
( )
Total Exposure Limit
[Megaluxhours]
( )
Total Yearly
Exposure Limit (as
per figure#.#)
[Kluxhours/year]
( )
Predicted Lifetime
(time it would take for
the item to reach to a
degree of fading
equivalent to 10 Just
Noticeable Fades) [
years] ( )
1 3.6 3.6 1,000
2 12 12 1,000
3 36 36 1,000
4 120 120 1,000
5 3.6 360 1,000
6 1,200 1,200 1,000
7 3,600 3,600 1,000
8 12,000 12,000 1,000
I will, in summarising this section, use scenario 1 only, which is the scientifically true basis for
the adjustments proposed, and consider to simply be .
Casting a New Light on Museums and Galleries Emrah Baki Ulas
299
3.3. Summary
In Chapter 3, I have questioned the common approaches and the basis of the guidelines that
apply to museum lighting for preventive conservation of light-sensitive objects on display. These
guidelines, as applied in museums and galleries around the world in the present day, are
developed upon the law of reciprocity and consider the light-induced damage as a cumulative
effect that follows a linear model. As noted, the linearity of this model has been criticised as
light damage, in reality, follows an exponentially slowing trend. However, the advantages of this
model in its practical applications should be acknowledged. Not only that it provides a
framework that is easy to use, but also in that the exact degree of fading that has already
happened on an item compared to its original form is often challenging to determine, so there
are difficulties and risks in applying any exponential relationship in a correct manner. The linear
function, on the other hand, provides a safer approach, considering the rate of fading at the
particular point in time and providing a level of extra care assuming that fading will continue to
follow a linear pattern (while in fact, the fading will slow down). Hence, I consider the approach
that uses the law of reciprocity to remain relevant.
On the aspect of the classification of materials for their light susceptibility: This is also central
to the measures that need to be considered in order to protect the material against light-
induced damage. Newer methods such as microfadeometry are discussed in addition to the
traditional methods of lightfastness tests that entail ISO Blue Wool Testing. Microfadeometry
offers more precise measurements of the exact nature of objects and forms a more reliable
tool for conservation planning. It has the potential to replace the traditional classification of
museum objects based on the ISO Blue Wool or ASTM Scale.
The proposed new framework as developed in this chapter differs from the previous museum
guidelines in three fundamental ways:
It considers the nature of the objects in a more thorough and less approximated manner.
Instead of classifying light sensitive museum objects to three categories as high, medium and
low susceptibility; the new framework considers the scale of ISO Blue Wool with eight levels.
This provides a more tailored approach.
Casting a New Light on Museums and Galleries Emrah Baki Ulas
300
It defines an intended usable life for the collection items. The usable life is defined as the
duration between the original state of the material and its faded state after ten just noticeable
fades. (By the word “original state” I mean the state of the material as acquired. For example.
If a 2,000-year-old object is discovered today, its state as is considered original, not its
estimated state at the time it was made). The framework proposes that the lifetime of the
object is defined as one just noticeable fade per 100 years (in a linear function, and following
the law of reciprocity. Hence, the intended lifetime for exhibits regardless of their light
sensitivity is described as 1,000 years. This value can be changed, and the levels of exposure
can be adjusted accordingly.
It adjusts the parameters used in older guidelines to the use of Light-Emitting Diodes for
museum display lighting. This is an essential adjustment because the spectral composition of
Light-emitting Diodes differs from the reference sources that are traditionally used for ISO
Blue Wool testing purposes. The spectral power distribution of these different sources has
been compared with the weighting of the spectral damage function, providing the level of
adjustment required.
With the above adjustments, a new set of numeric values for exposure recommendations have
been derived. These have been provided in a new tabular reference (See Table 3.15).
Casting a New Light on Museums and Galleries Emrah Baki Ulas
301
4. Towards a New Set of Lighting Guidelines for Museums and Galleries
In this chapter, I draw an overall summary to this thesis; outline the background of the need
for a new set of lighting guidelines for museums and galleries, its potential benefits, and then
propose a new guideline, tying together the verdicts of Chapter 2 (Light and Visual Acuity in
Museums and Galleries) and Chapter 3 (Light and Preventive Conservation in Museum and
Gallery Exhibition Display). In conclusion, I offer some foresight into future developments in
this topic.
4.1. The Need for Improvement
The reasons for the imminent need for new lighting guidelines for museums and galleries can
be categorised into three groups: Firstly, issues of relevance; secondly, issues of accuracy and
thirdly, issues of precision.
Issues of relevance are principal as a result of the recent shift in lighting technologies used in
museums and galleries. Today’s dominant light source for museums and galleries is the Light-
emitting Diode. Guidelines that are applied in museums and galleries today are largely based
on experiments and assessments undertaken by reference sources other than the Light-
emitting Diode. Their spectral characteristics differ from those of the Light-emitting Diode,
resulting in different visual results and different light-induced damage potential. This makes an
adjustment to the guidelines necessary to use Light-emitting Diodes in museums in the most
appropriate manner.
The modifications to the guidelines to address the shift in the lighting technologies to Light-
Emitting Diode also relate to the second set of issues mentioned above; relating to the accuracy
of guidelines. Adjustments to the guidelines taking into account the spectral differences of these
sources make the adjusted results more accurate. Another aspect of accuracy, which has been
widely questioned and tested in this thesis, is the 50 lux rule. Experiments have shown that 50
Casting a New Light on Museums and Galleries Emrah Baki Ulas
302
lux rule is far from accurately addressing the visual acuity requirements for museum and gallery
displays. Not only that fundamentally, it has limitations being based on a one-dimensional
metric, and more importantly being a fixed figure (50 lux), in responding to the complex set of
considerations for colour and detail intelligibility, but also it has repercussions on conservation
strategies. The impact of the 50 lux rule on conservation presents itself most profoundly in the
illumination of the most sensitive museum objects. These objects typically have the lowest level
of allowance for lighting exposure and are the most difficult to manage, as the level of
illumination and the duration of exposure needs to be balanced carefully. By suggesting a
minimum acceptable level of light for display, the 50 lux rule predetermines the allowable
duration of exposure. Since it has been demonstrated that visual acuity is retained at near-
equivalent levels in the museum context at much lower levels of light, let’s now assume a
scenario that the object can be illuminated under 25 lux instead of 50 lux, according to the law
of reciprocity, the duration of the display can be doubled.
On precision-related issues, the intended usable life for museum objects is a key consideration
that is fundamental to determining the allowable exposure limits for light sensitive objects.
Current lighting guidelines for museums and galleries are applied in most institutions without
due consideration to this aspect. Also, when the guidelines are analysed with respect to the
predicted lifetime they correspond to for different categories of light susceptibility, a substantial
variance is observed (Refer to Table 3.10). It is important that the standards are normalised,
so the recommended levels of exposure are based on a uniform target length of usable life.
These can be adjusted where necessary for specific museum objects. Another aspect that
relates to precision is that the light sensitive materials are clustered into three broad
categories. Each of these categories contains materials with diverse composition and character.
These differences are not taken into account since the entire category, regardless of the
substantial differences between the materials within, is treated under the same exposure limit.
Casting a New Light on Museums and Galleries Emrah Baki Ulas
303
4.2. Potential Benefit
Addressing the aforementioned problems with current lighting guidelines for museums and
galleries will have immense positive effects, not only in maximising the use of cultural materials
in a more effective manner in the present and the future but also in the planning of exhibitions.
When better metrics are applied, the costs, resources and environmental aspects can be
managed more precisely and efficiently.
Display
Abolishing the 50 lux rule, and applying multidimensional considerations and metrics to lighting,
the conditions in which cultural material is displayed in museums and galleries will improve,
suiting better to the nature of the objects, their contexts, and the viewers’ requirements. This
will support visitor experience in enhancing the visual engagement with the objects.
Preservation
Using better and more appropriate and in-depth metrics in assessing the photodegradation
potential of Light-emitting Diodes, classifying materials with more precision, establishing an
intended usable life, cultural materials on display will be protected.
Planning
More advanced design guidelines will have a potential impact on the planning of exhibitions.
The arrangement, duration, and composition of museum displays will be better tailored to
exhibitions. This will enable the curators and facilities managers to operate more productively
and with confidence.
Savings
More accuracy and better precision will also manifest benefits in the better use of resources
and energy. Light levels and display durations will be optimised. Wastage will be lessened.
Through better management of display durations, wider aspects that relate to the rotation of
cultural material to storage will improve. The resources and space required for storage,
transportation, logistics and use of materials will be reduced.
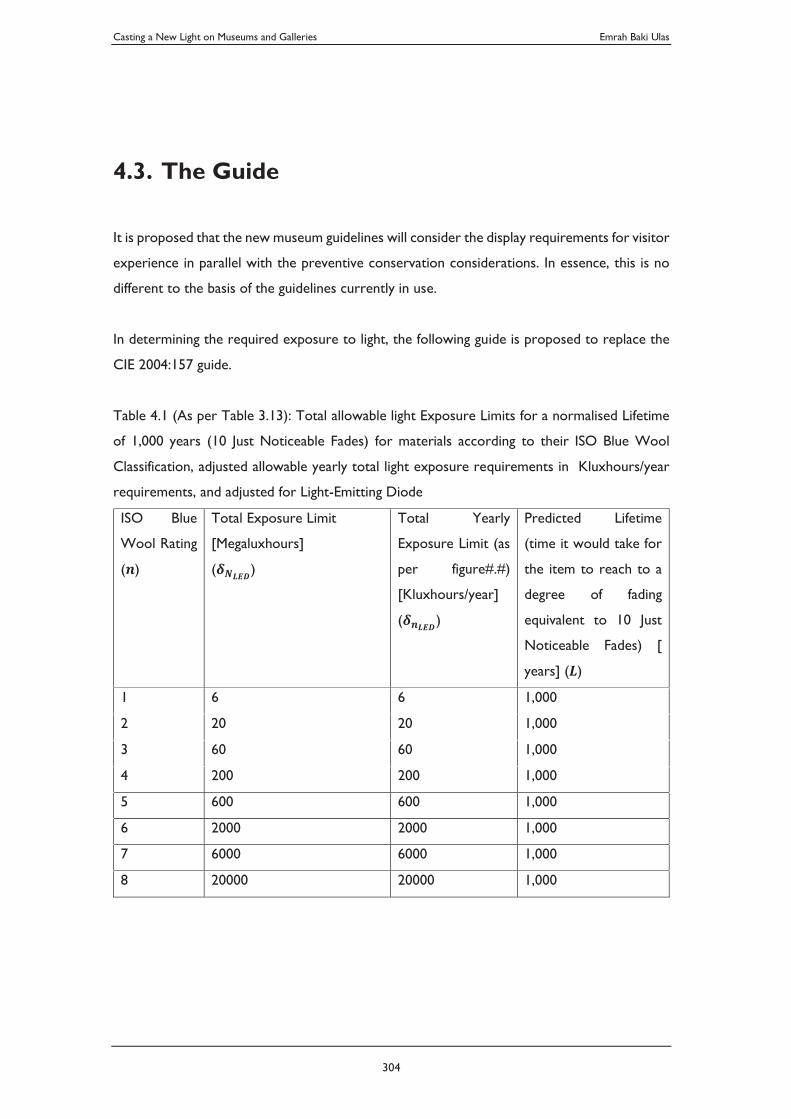
Casting a New Light on Museums and Galleries Emrah Baki Ulas
304
4.3. The Guide
It is proposed that the new museum guidelines will consider the display requirements for visitor
experience in parallel with the preventive conservation considerations. In essence, this is no
different to the basis of the guidelines currently in use.
In determining the required exposure to light, the following guide is proposed to replace the
CIE 2004:157 guide.
Table 4.1 (As per Table 3.13): Total allowable light Exposure Limits for a normalised Lifetime
of 1,000 years (10 Just Noticeable Fades) for materials according to their ISO Blue Wool
Classification, adjusted allowable yearly total light exposure requirements in Kluxhours/year
requirements, and adjusted for Light-Emitting Diode
ISO Blue
Wool Rating
( )
Total Exposure Limit
[Megaluxhours]
( )
Total Yearly
Exposure Limit (as
per figure#.#)
[Kluxhours/year]
( )
Predicted Lifetime
(time it would take for
the item to reach to a
degree of fading
equivalent to 10 Just
Noticeable Fades) [
years] ( )
1 6 6 1,000
2 20 20 1,000
3 60 60 1,000
4 200 200 1,000
5 600 600 1,000
6 2000 2000 1,000
7 6000 6000 1,000
8 20000 20000 1,000
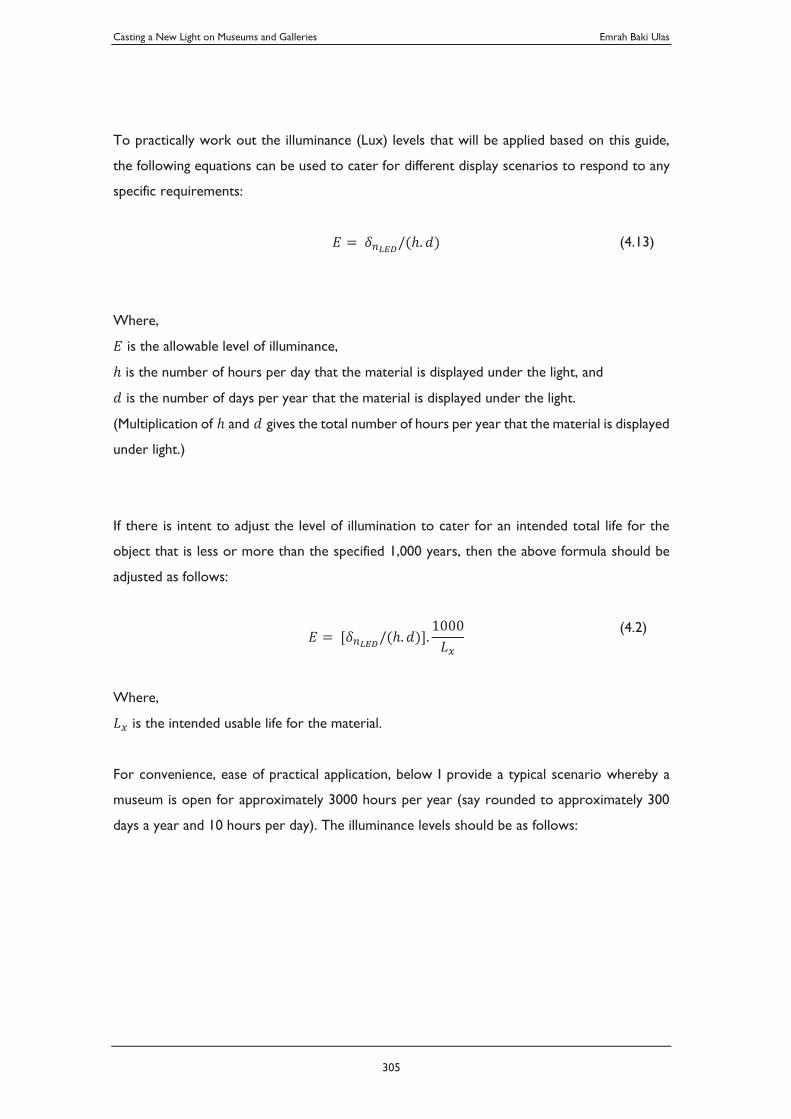
Casting a New Light on Museums and Galleries Emrah Baki Ulas
305
To practically work out the illuminance (Lux) levels that will be applied based on this guide,
the following equations can be used to cater for different display scenarios to respond to any
specific requirements:
(4.13)
Where,
is the allowable level of illuminance,
is the number of hours per day that the material is displayed under the light, and
is the number of days per year that the material is displayed under the light.
(Multiplication of and gives the total number of hours per year that the material is displayed
under light.)
If there is intent to adjust the level of illumination to cater for an intended total life for the
object that is less or more than the specified 1,000 years, then the above formula should be
adjusted as follows:
(4.2)
Where,
is the intended usable life for the material.
For convenience, ease of practical application, below I provide a typical scenario whereby a
museum is open for approximately 3000 hours per year (say rounded to approximately 300
days a year and 10 hours per day). The illuminance levels should be as follows:
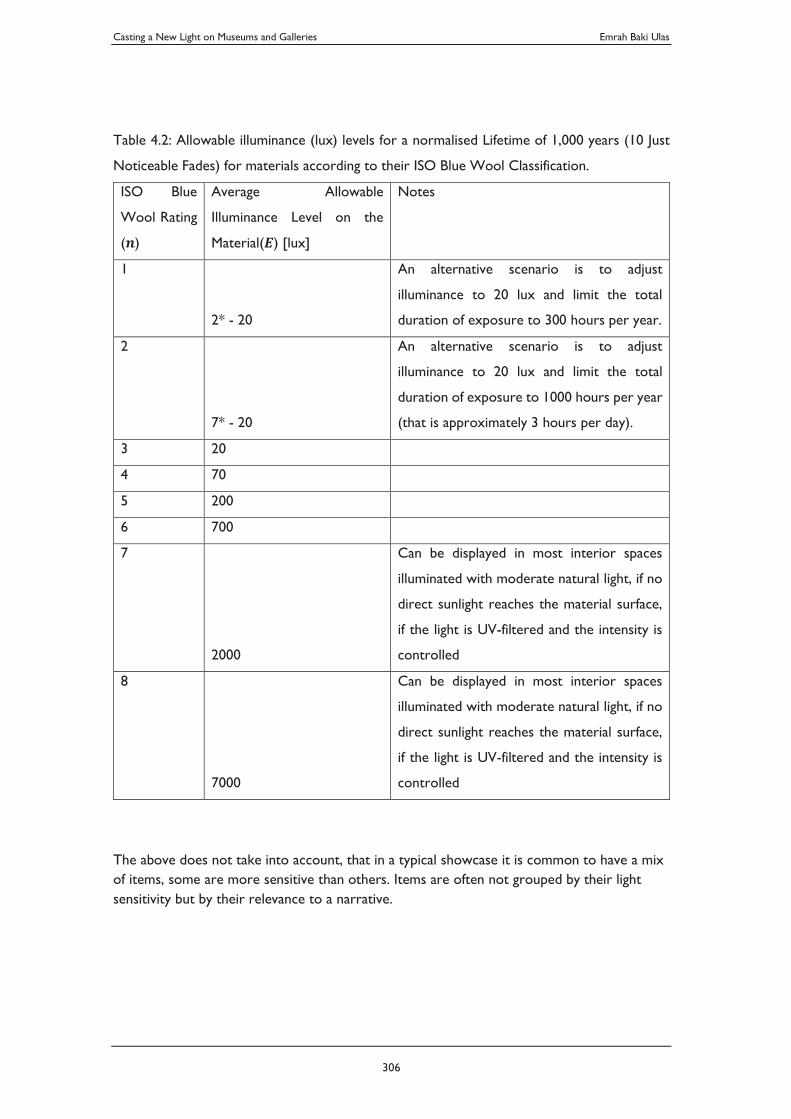
Casting a New Light on Museums and Galleries Emrah Baki Ulas
306
Table 4.2: Allowable illuminance (lux) levels for a normalised Lifetime of 1,000 years (10 Just
Noticeable Fades) for materials according to their ISO Blue Wool Classification.
ISO Blue
Wool Rating
( )
Average Allowable
Illuminance Level on the
Material( ) [lux]
Notes
1
2* - 20
An alternative scenario is to adjust
illuminance to 20 lux and limit the total
duration of exposure to 300 hours per year.
2
7* - 20
An alternative scenario is to adjust
illuminance to 20 lux and limit the total
duration of exposure to 1000 hours per year
(that is approximately 3 hours per day).
3 20
4 70
5 200
6 700
7
2000
Can be displayed in most interior spaces
illuminated with moderate natural light, if no
direct sunlight reaches the material surface,
if the light is UV-filtered and the intensity is
controlled
8
7000
Can be displayed in most interior spaces
illuminated with moderate natural light, if no
direct sunlight reaches the material surface,
if the light is UV-filtered and the intensity is
controlled
The above does not take into account, that in a typical showcase it is common to have a mix of items, some are more sensitive than others. Items are often not grouped by their light sensitivity but by their relevance to a narrative.
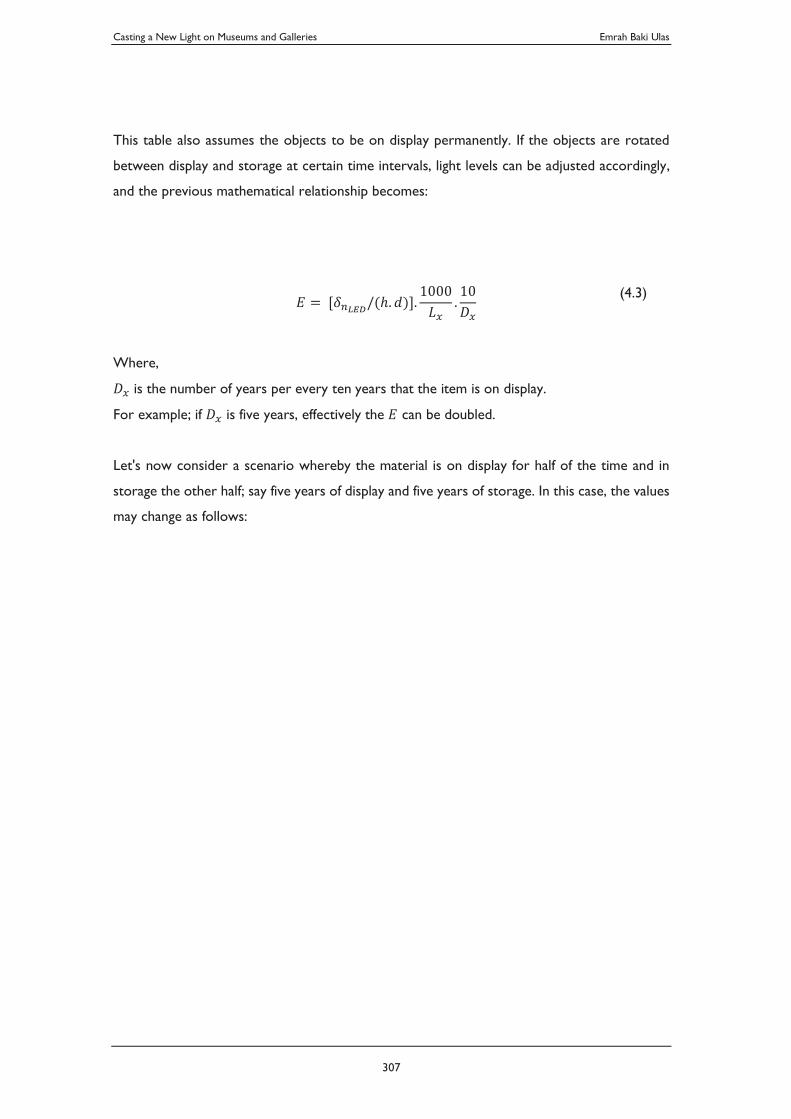
Casting a New Light on Museums and Galleries Emrah Baki Ulas
307
This table also assumes the objects to be on display permanently. If the objects are rotated
between display and storage at certain time intervals, light levels can be adjusted accordingly,
and the previous mathematical relationship becomes:
(4.3)
Where,
is the number of years per every ten years that the item is on display.
For example; if is five years, effectively the can be doubled.
Let's now consider a scenario whereby the material is on display for half of the time and in
storage the other half; say five years of display and five years of storage. In this case, the values
may change as follows:
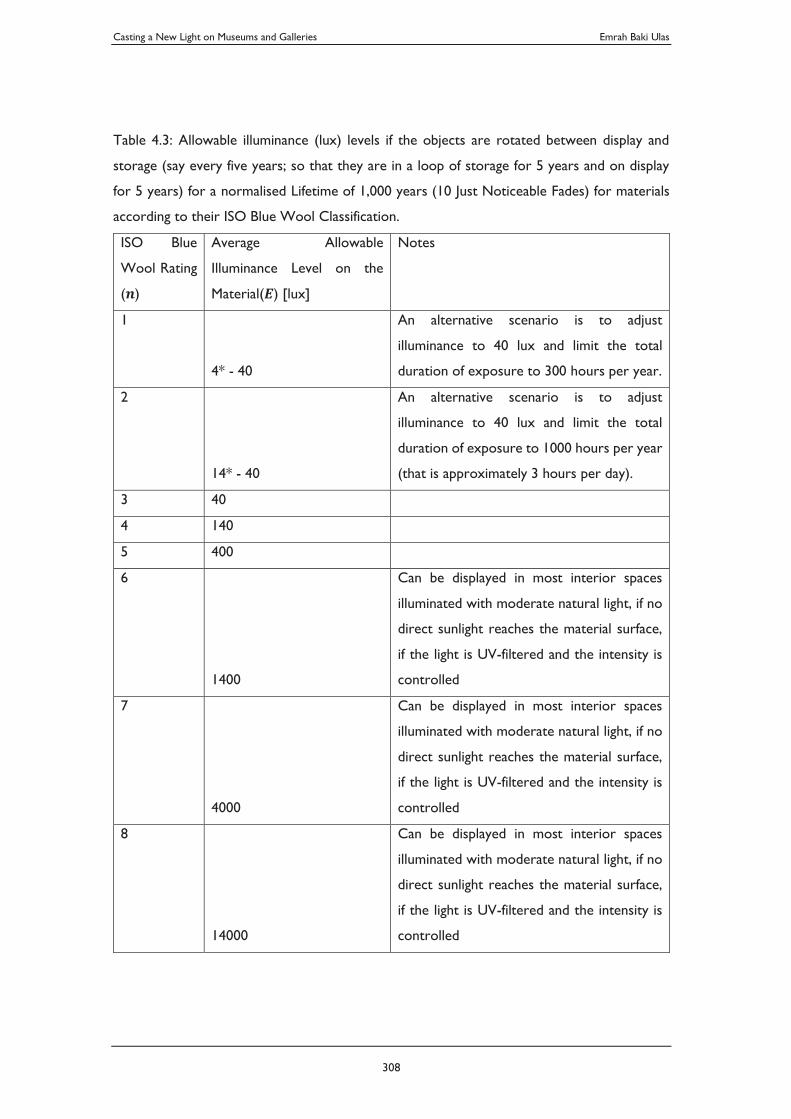
Casting a New Light on Museums and Galleries Emrah Baki Ulas
308
Table 4.3: Allowable illuminance (lux) levels if the objects are rotated between display and
storage (say every five years; so that they are in a loop of storage for 5 years and on display
for 5 years) for a normalised Lifetime of 1,000 years (10 Just Noticeable Fades) for materials
according to their ISO Blue Wool Classification.
ISO Blue
Wool Rating
( )
Average Allowable
Illuminance Level on the
Material( ) [lux]
Notes
1
4* - 40
An alternative scenario is to adjust
illuminance to 40 lux and limit the total
duration of exposure to 300 hours per year.
2
14* - 40
An alternative scenario is to adjust
illuminance to 40 lux and limit the total
duration of exposure to 1000 hours per year
(that is approximately 3 hours per day).
3 40
4 140
5 400
6
1400
Can be displayed in most interior spaces
illuminated with moderate natural light, if no
direct sunlight reaches the material surface,
if the light is UV-filtered and the intensity is
controlled
7
4000
Can be displayed in most interior spaces
illuminated with moderate natural light, if no
direct sunlight reaches the material surface,
if the light is UV-filtered and the intensity is
controlled
8
14000
Can be displayed in most interior spaces
illuminated with moderate natural light, if no
direct sunlight reaches the material surface,
if the light is UV-filtered and the intensity is
controlled
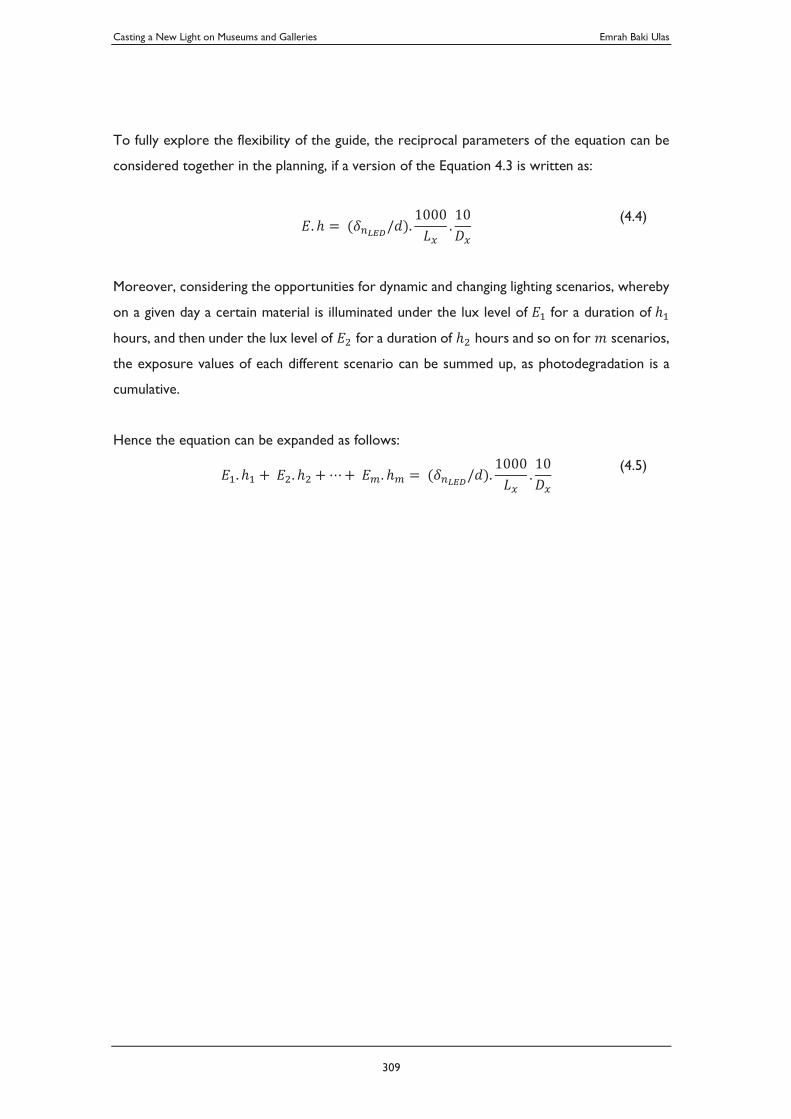
Casting a New Light on Museums and Galleries Emrah Baki Ulas
309
To fully explore the flexibility of the guide, the reciprocal parameters of the equation can be
considered together in the planning, if a version of the Equation 4.3 is written as:
(4.4)
Moreover, considering the opportunities for dynamic and changing lighting scenarios, whereby
on a given day a certain material is illuminated under the lux level of for a duration of
hours, and then under the lux level of for a duration of hours and so on for scenarios,
the exposure values of each different scenario can be summed up, as photodegradation is a
cumulative.
Hence the equation can be expanded as follows:
(4.5)
Casting a New Light on Museums and Galleries Emrah Baki Ulas
310
4.4. Conclusion and Outlook
As shown above, the new guide is based on promoting a holistic understanding of the use of
light in museum and gallery display. It draws attention to the opportunities for flexibility and
the ability to compose diverse display scenarios with various lighting configurations. Virtually,
a countless number of versions of the guidance table 4.2 can be produced by changing the
relevant parameters according to equation 4.5. With this, the new guide provides a framework
for artists, curators, conservators, exhibition designers and lighting designers to be able to
tailor the specific visual conditions of the displays to cater for numerous ways of visual
experiences for the displayed collections, while keeping to the conservation requirements, and
limiting light-induced damage on materials.
The experiments have proven that, if the visual adaptation is established, even under light levels
as low as 20 lux, most visitors would be able to have a high degree of visual acuity, with good
colour intelligibility and detail intelligibility. This gives the museum professionals the
opportunity to vary the levels of illumination within a wide range without having a significant
negative influence on the visual experience; the objects can be displayed under moderately low
levels of light for prolonged durations or under much higher light levels managing the duration
of exposure, or even under varying levels of illumination with varying periods of exposure. The
latter, dynamic lighting scenario, has further potential to enrich exhibition experience. Materials
with ISO Blue Wool Rating of 1, 2 and three can be displayed under high levels of light if the
duration of exposure is carefully monitored. At the other end of the spectrum, the usable life
of the materials with an ISO Blue Wool Rating of 6, 7 or 8 can be extended significantly by
displaying these materials under moderate interior levels of light.
By specifying a usable lifetime figure for materials for display scenarios, the thesis raises
awareness of the importance of this key parameter and how it is a key to controlling the
operational considerations.
It is acknowledged that the guide proposed as part of this thesis, while addressing significant
gaps, inaccuracies and lack of precision in the current guidelines, still relies on and deploys a
range of approximations and generalisations, and it needs more development through further
research. A possible future research area that would be most relevant to further advance the
Casting a New Light on Museums and Galleries Emrah Baki Ulas
311
guide and increasing its precision concerning the visual requirements may be one that tests the
impact of background luminance with respect to the displayed object luminance. Another
possible future research area that would be most relevant to further advance the guide and
increasing its precision regarding the preventive conservation aspects may be one that explores
methodologies alternative to ISO Blue Wool testing, and possibly engaging microfadeometry
methods. It must also be noted that as the lighting technologies and light sources change and
develop further, the issues addressed in this thesis will once again become up for due
adjustments.
Another key consideration for the new guide to be adopted and applied widely is the
requirement of the ease of use. While the guide opens the professionals up to managing various
parameters in a multidimensional manner and provides flexibility in practice, it may be
perceived to have a drawback for practical implementation compared to the old guides, which
simplified and standardised matters to simple numbers. Calculating light levels and/or durations
of exposure using mathematical formulas may not be practical in the case of many museums
and galleries. To some extent, it may be argued that the old guides have been applied in many
museums and galleries without a full understanding of the complex issues they relate to, and
just have been accepted as absolute figures. This is one of the key reasons why any new guides
have to be accessible to the many conservators that do not have the technical know-how to
calculate the levels. (This is not to suggest they could not if they had to, but with limited time
and resource, with everything else they need to do to prepare for exhibition and care for
collections, the Conservators need a guide that is simple to use and simple to explain to other
museum professionals.) In this respect, the figures in Table 4.3 can be simplified, combined and
approximated to be adopted to the old CIE 2004:157 guidelines or other similar old guidelines.
While this already provides a level of improvement, it certainly is not aligned with the full
objectives of this study. With the proposed new guide, this study aims to promote more
complex and thorough thinking on the topic and facilitate more in-depth planning of these
issues. This inevitably requires an upskilling of relevant professionals who are responsible for
lighting planning and applications in museums and galleries.
On overcoming the complexities of the new guide, a possible method is in engaging with the
technology. Tools such as mobile apps can be developed to assist in managing the requirements.
Such tools can engage cameras and map the object and background colours and luminance
values and provide more accurate and adjusted guides for lighting specific objects. These
Casting a New Light on Museums and Galleries Emrah Baki Ulas
312
technological tools, in time, can be advanced further to create profiles of particular spaces and
articles, incorporate specific characteristics of the objects and materials, and detailed
information on their susceptibility to light-induced damage. Lighting characteristics, levels of
illuminance and duration of exposure, etc. can be adjusted on the spot, generating various
configurations of lighting possibilities for the professionals to choose from.
It is also intended that this study can promote advanced thinking in other environmental factors
in museums and galleries, to enhance the visitor experience as well as to contribute to better
care for cultural heritage.
Casting a New Light on Museums and Galleries Emrah Baki Ulas
313
Bibliography
Abramov, I., Gordon, J., Feldman, O. & Chavarga, A. 2012, Sex & vision I: Spatio-temporal
resolution, Biology of Sex Differences, vol 3, no 1, p.20.
Arnaud, C. 2009. Shining light on art, Chemical & Engineering News, vol 87, no 13, p.44.
Arney, J., Jacobs, A. & Newman, R. 1979, The Influence of Oxygen on the Fading of Organic
Colorants, Journal of the American Institute for Conservation, vol 18, no 2, p.108.
Beltran, V., Druzik, J. & Maekawa, S. 2012, Large-scale assessment of light-induced color change
in air and anoxic environments, Studies in Conservation, vol 57, no 1, pp.42-57.
Blackwell, B. 2000, Light exposure to sensitive artworks during digital photograph, Spectra, vol
26, no 2, p.24-28.
Boyce, P. 2003, Human factors in lighting, 2nd edn, Taylor&Francis Group, London and New
York.
Cassar, M. 1994, Museums environment energy, 1st edn, HMSO, London.
Cassar, M. 2011, Environmental management, 1st edn, Routledge, London.
Chiari, G. 2010, Conservation science investigation, International Preservation News, vol 50, p.11-
16.
Clark, W. 1940, Photography by infrared, its principles and applications, In Annales
d'Astrophysique, vol 3, p.138.
Cuttle, C. 2000, A proposal to reduce the exposure to light of museum objects without
reducing illuminance or the levelofvisual satisfaction of museum visitors, Journal of the American
Institute for Conservation, vol 39, no 2, p.229-244.
Casting a New Light on Museums and Galleries Emrah Baki Ulas
314
Cuttle, C. 2007, Light for Art's Sake: Lighting for Artworks and Museum Displays, 1st edn.
Cuttle, C. 2009, New opportunities for LEDs in museum display lighting, Proceedings of the
Professional Lighting Design Convention, p.38-44.
Davis, W. 2010, Color quality scale, Optical Engineering, vol 49, no 3, p.033602.
Davis, W. & Ohno, Y. 2006, Development of a color quality scale, National Institute of Standards
and Technology, Gaithersburg.
del Hoyo-Melendez, J. 2012, Micro-fading spectrometry, Fibers and Polymers, vol 13, p.1079-
1085.
del Hoyo-Melendez, J. & Mecklenburg, M. 2011, An Investigation of the Reciprocity Principle
of Light Exposures Using Microfading Spectrometry, Spectroscopy Letters, vol 44, no 1, pp.52-
62.
del Hoyo-Melendez, J. & Mecklenburg, M. 2011, The Use of Micro-Fading Spectrometry to
Evaluate the Light Fastness of Materials in Oxygen-Free Environments, Spectroscopy Letters, vol
44, no 2, pp.113-121.
Dirk, C., Delgado, M., Olguin, M. & Druzik J. 2009, A prism-grating-prism spectral imaging
approach, Studies in Conservation, vol 54, no 2, p.77-89.
Dirk, C., J. Druzik, Delgado, M. & Westfall N. 2011, Lighting the world’s treasures: approaches
to safer museum lighting, Color: Research and Application, vol 36, no 4, p.238-254.
Druzik, J. 2010, Oriel microfading tester (MFT): a brief description, Postprints of the Textile
Specialty Group (TSG) of the American Institute of Conservation (AIC) 38th Annual Meeting
in Milwaukee, p.1-13.
Druzik, J. 2011, Guidelines for solid state lighting, The Getty Institute, Los Angeles.
Casting a New Light on Museums and Galleries Emrah Baki Ulas
315
Druzik, J. 2011, Caution urged when considering LED light sources for light-sensitive materials,
Conservation Distlist , Washington.
Druzik, J., & Eshøj, B. 2007, Museum lighting: its past and future development, Museum
Microclimates, p. 51-56.
Druzik, J., Gleeson, M., Pearlstein, E., Pesme, C., & Riedler, R. 2011, Das Museum, die
Vogelfeder and der Streit ums Licht: aktuelle Entwicklungen in der Farbmessung and
künstlichen Lichtalterung v. In Restauro, Forum für Restauratoren, Konservatoren und
Denkmalpfleger, vol 117, no 7, p.30.
Druzik, J. & Michalski, S. 2012, Guidelines for selecting solid-state lighting for museums,
Canadian Conservation Institute and The Getty Conservation Institute, Los Angeles.
Druzik, J. & Pesme, C. 2010, Comparison of five microfading tester (MFT) Designs, The
American Institute for Conservation of Historic and Artistic Works, p.14-29.
Ford, B. 2009, Non-destructive microfade testing at the National Museum of Australia, AICCM
Bulletin, vol 32, no 1, p.54-64.
Ford, B. & Smith, N. 2009, The development of a significance and risk based lighting framework
at the National Museum of Australia, Conserving Public and Private Collections: AICCM National
Conference, p. 21-25.
Ford, B. & Smith, N. 2010, Protecting the most important, most exhibited and most fugitive
museum objects from light-fading, American Institute of Conservation 38th Annual Meeting in
Milwaukee, WI: The Textile Specialty Group Postprints, vol. 20, pp.156-166.
Ford, B. & Smith, N. 2011, Lighting guidelines and the lightfastness of Australian indigenous
objects at the National Museum of Australia, Proceedings of the 16th Triennial Conference ICOM-
CC, p.1-13.
Ford, B. & Druzik, J. 2013, Microfading: The State of the Art for Natural History Collections.
Society for the Preservation of Natural History Collections, Collection Forum 27
Casting a New Light on Museums and Galleries Emrah Baki Ulas
316
Green, M. & Odom, J. 2008, Forensic vision with application to highway safety, 1st edn, Lawyers &
Judges, Tucson.
Guide for the storage and exhibition of archival materials, document PD 5454, 2012, British
Standards Institute, London.
Helander, M. 2006, A guide to human factors and ergonomics, Second Edition, Taylor&Francis
Group, London and New York, p.41-67.
Recommended Practice for Museum and Art Gallery Lighting (RP-30-96), 1996, Illuminating
Engineering Society of North America, New York.
Jeff, H. 2016, Photonic Frontiers: Color Measurement, Light Sources, and Vision: LED lighting makes
new demands on color measurement, retrieved in
<http://www.laserfocusworld.com/articles/print/volume-52/issue-01/features/photonic-
frontiers-color-measurement-light-sources-and-vision-led-lighting-makes-new-demands-on-
color-measurement.html>.
Kalloniatis, M. & Luu, C. 2007, Light and Dark Adaptation, retrieved in
<http://webvision.med.utah.edu/book/part-viii-gabac-receptors/light-and-dark-adaptation/>.
Lapedes, D. 1978, McGraw-Hill dictionary of scientific and technical terms, 1st edn, McGraw-
Hill, New York.
LED Professional Trends & Technologies for Future Lighting Solutions 2016, Aspects of Light
Quality in Solid State Lighting by OSRAM Opto Semiconductors, retrieved in <https://www.led-
professional.com/resources-1/articles/aspects-of-light-quality-in-solid-state-lighting-by-osram-
opto-semiconductors>.
Lerwill, A. 2011, Micro-fading spectrometry: An investigation into the display of traditional
watercolour pigments in anoxia. Doctoral dissertation, Nottingham Trent University,
Nottingham.
Casting a New Light on Museums and Galleries Emrah Baki Ulas
317
Martin, J. W., Chin, J. W. & Nguyen, T. 2003, Reciprocity law experiments in polymeric
photodegradation: a critical review, Progress in Organic Coatings, vol 47, no 3, p.292-311.
Method of measuring and specifying colour rendering properties of light sources, 1995, 1st
edn, CIE Central Bureau, Vienna.
Michalski S. 1996, The Effect of Light from Flashbulbs and Copiers, Abbey Journal, vol 20, no 6,
retrieved in <http://cool.conservation-us.org/byorg/abbey/an/an20/an20-6/an20-607.html>.
Michalski, S. 2013, Agent of deterioration: light, ultraviolet and infrared, Canadian Conservation
Institute, retrieved in <http://canada.pch.gc.ca/eng/1444925073140#det5>.
Miller, N. & J. Druzik 2012, Demonstration of LED retrofit lamps at an exhibit of 19th century
photography at the Getty Museum, Pacific Northwest National Lab (PNNL), no PNNL-21225,
Richland.
J. Paul Getty Trust 2010, Museum Lighting Research retrieved in
<http://www.getty.edu/conservation/our_projects/science/lighting/>.
Museums, Libraries and Archives 2007, ASHRAE Handbook 2007, Chapter 21, Atlanta.
National Library of Australia 2016, Policy on the Illumination of Collection Materials on Display
retrieved in <https://www.nla.gov.au/policy-and-planning/illumination-of-collection-material>.
Northeast Document Conservation Center 1999, NEDCC Preservation Leaflets, Northeast
Document Conservation Center retrieved in
<http://www.nedcc.org/free-resources/preservation-leaflets/overview>.
Padfield, J. 2015, Normalised Spectral Power Distribution (SPD) Curves, The National Gallery.
retrieved in <http://research.ng-london.org.uk/scientific/spd/?page=spd>.
PAS198 - Specification for environmental conditions for cultural collections. 2012, British
Standards Institution, London.
Casting a New Light on Museums and Galleries Emrah Baki Ulas
318
Pearlstein, E., Riedler, R., Gleeson, M., Druzik, J. & Pesme, C. 2011, A collaborative study of
native California featherwork, Paper 0405, Preprints, ICOM Committee for Conservation, ICOM-
CC, 16th Triennial Conference, vol 33 no2, p.19-23.
Perrin, T., Druzik, J. & Miller, N. 2014, SSL adoption by museums: survey results, analysis, and
recommendations Pacific Northwest National Lab (PNNL), no PNNL—23899, Richland.
Pearlstein E., Druzik, J., Pesme, C., Riedler, R. & Gleeson, M. 2011, Anthropological preventive
conservation: fading assessment on works of feathers, The Ethnographic Conservation Newsletter
of the Working Group on Ethnographic Materials of the ICOM Committee for Conservation ,
vol 31, p.4.
Randall W. 2016, What light sources will fade artwork and fabrics? retrieved in
<http://www.residentiallighting.com/what-light-sources-will-fade-artwork-and-fabrics>.
Reuss, M., Scott G. & MacKinnon, F. 2005. Conservation of exhibitions: making a maintenance
programme work. ICOM-CC 14th Triennial Meeting Preprints, The Hague, 12–16 September
2005, ed. J. Bridgland, Vol II, p.693–699.
Riedler, R., Pesme, C., Druzik, J., Gleeson, M. & Pearlstein, E. 2014, A review of color-producing
mechanisms in feathers and their influence on preventive conservation strategies, Journal of the
American Institute for Conservation, vol 53, no 1, p.44-65.
Roos, M. & Ulas, E. 2013, Looking art in a new light- Part A, Papyrus – the Official Publication
of the International Association of Museum Facility Administrators, vol 11, p.35-36.
Roos, M. & Ulas, E. 2013, Looking art in a new light- Part B, Papyrus – the Official Publication
of the International Association of Museum Facility Administrators, vol 12, p.14-16.
Russell, R. & Winkworth, K. 2009, Significance 2.0: A guide to assessing the significance of
collections. Collections Council of Australia, Canberra.
Casting a New Light on Museums and Galleries Emrah Baki Ulas
319
Saunders, D. & Kirby, J. 1996, Light-induced damage: Investigating the reciprocity principle,
ICOM committee for conservation, 11th triennial meeting in Edinburgh, Scotland, 1-6
September 1996: Preprints, p.87-90.
Schaeffer, T. 2001, Effects of light on materials in collections: data on photoflash and related
sources. Getty Publications, Los Angeles.
Schindler, W. D. & Hauser, P. 2004, Chemical finishing of textiles, Elsevier, Amsterdam.
Shaw, K. & Innes, M. 1993, Museum And Gallery Lighting (Adapted from an article written for
the UK periodical "Lighting Equipment News"), Edinburgh.
Shikder, S., Mourshed, M. & Price, A. 2012, Therapeutic lighting design for the elderly: a review,
Perspectives in public health, vol 132, no 6, p.282-291.
Shrum, G. 2011, Light Art Matters, Archlighting, Jan/Feb 2011, p.19-21.
Simmler, W. 2011, Air, 6. Photochemical degradation. Ullmann's Encyclopedia of Industrial
Chemistry.
Skarda, C. 1999, The perceptual form of life, Journal of Consciousness Studies, vol 6, no 11-12,
p.79-93.
Texas Historical Commission 2013, Basic guidelines for the preservation of historic artifacts,
retrieved in <http://www.thc.texas.gov/public/upload/publications/Basic%20Guidelines%20for
%20the%20Preservation%20of%20historic%20artifacts%202013.pdf>.
The Getty Conservative Institute 2012, Photochemistry of museum colorants under incandescent
and solid state lighting retrieved in <http://www.getty.edu/conservation/our_
projects/science/lighting/photochem.html>.
Thiagarajan, P. & Nalankilli, G. 2013, Improving light fastness of reactive dyed cotton fabric with
antioxidant and UV absorbers, Indian Journal of Fibre and Textile Research, vol 38, June 2013,
p.161-164.
Casting a New Light on Museums and Galleries Emrah Baki Ulas
320
Thomson, G. 1978, The museum environment. Elsevier, Amsterdam.
Ulas, E. 2010, Daylighting and UV study for the National Gallery of Australia, Steensen Varming,
Sydney.
Ulas, E. 2010, Daylighting and UV study for the Museum of Contemporary Art, Steensen
Varming, Sydney.
Ulas, E. 2011, Lighting study for the NSW Parliament House, Brett Whiteley Artwork Display,
Steensen Varming, Sydney.
Ulas, E., Crampton, R., Tennant, F. & Bickersteth J. 2015, A Practical Guide for Sustainable Climate
Control and Lighting in Museums and Galleries, Steensen Varming and International Conservation
Services, Sydney.
Ulas, E., Crampton, R., Tennant, F. & Bickersteth J. 2011, Technical Industry Report for
Museums and Galleries, Steensen Varming and International Conservation Services, Sydney.
Casting a New Light on Museums and Galleries Emrah Baki Ulas
321
Biography of the Author
A lighting designer, Emrah Baki Ulas is an associate at the consultancy practice Steensen Varming where he co-leads lighting design.
After graduating from high school as the valedictorian in 1999, Emrah completed his undergraduate studies in Electrical and Electronics Engineering at Bogazici University in 2004 and then continued to complete his postgraduate studies at the University of Wismar in Germany in 2006 in the field of Architectural Lighting Design. His practical career in lighting began at the Istanbul Foundation for Culture and Arts, working for the Istanbul Biennale and other high profile cultural events during his university years. He was mentored by Kemal Yigitcan, Istanbul-based leading lighting designer, Dr. Ing. Georgios Paisidis, a leading Greek lighting thinker, Dan Mackenzie, a respected engineer, Michael Day, a lighting educator, and worked alongside Mirjam Roos, a distinguished lighting designer.
Emrah holds many accolades and recognitions from the lighting industry. His projects portfolio has an emphasis on cultural institutions, particularly museums and galleries. He contributed to numerous professional lighting forums around the globe. His work has been published internationally.
Emrah describes himself as an enthusiastic advocate of the development of academic lighting education and research. He promotes a stronger integration of theory and philosophy into design practice. He pursues to challenge common best-practice methodologies through research-based evidence, for the advancement of lighting design profession.
Casting a New Light on Museums and Galleries Emrah Baki Ulas
322