Caste-specific biosynthesis of mandibular acids in honey bees … · 2017-09-23 · Abstract Female...
152
I Caste-Specific Biosynthesis of Mandibular Acids in Honey Bees (Apis mellifera L.) by Erika Plettner B. Sc. (Honors), Simon Fraser University, 1990 A THESIS SUBMITTED IN PARTIAL FULFILLMENT OF THE REQUIREMENTS FOR THE DEGREE OF DOCTOR IN PHILOSOPHY in the Department of Chemistry O Erika Plettner, 1995 SIMON FRASER UNIVERSITY September 1995 All rights reserved. This work may not be reproduced in whole or in part, by photocopy or other means, without permission of the author.
Transcript of Caste-specific biosynthesis of mandibular acids in honey bees … · 2017-09-23 · Abstract Female...

I
Caste-Specific Biosynthesis of Mandibular Acids in Honey Bees
(Apis mellifera L.)
by
Erika Plettner
B. Sc. (Honors), Simon Fraser University, 1990
A THESIS SUBMITTED IN PARTIAL FULFILLMENT OF
THE REQUIREMENTS FOR THE DEGREE OF
DOCTOR IN PHILOSOPHY
in the
Department of Chemistry
O Erika Plettner, 1995
SIMON FRASER UNIVERSITY
September 1995
All rights reserved. This work may not be
reproduced in whole or in part, by photocopy
or other means, without permission of the author.

Approval
Name:
Degree:
Title of Thesis:
Examining Committee:
Chairman:
Erika Plettner
Doctor of Philosophy
Caste-Specific Biosynthesis of Mandibular Acids in Honey
Bees (Apis mellifera L.)
Dr. S. Holdcroft
Dr. K. N. h ssor, P L> fess r, Senior Supervisor
F
Dr. M. L. Winston, Professor, Supervisory Committee
Dr. F. W. p s t e i n , r? P r o f e s s o ~ e r v i s o r y Committee
' 4 - . -. - - w -
Dr. N. Haunerland, Assistant Professor, Internal Examiner
Dr. R. M. Crewe, Professor, External Examiner
Department of Zoology, University of the Witwatersrand
Date Approved: =&-, ,995,
PARTIAL COPYRIGHT LICENSE
I hereby grant to Simon Fraser University the right to lend my
thesis, project or extended essay (the title of which is shown below) to
users of the Simon Fraser University Library, and to make partial or
single copies only for such users or in response to a request from the
library of any other university, or other educational institution, on its own
behalf or for one of its users. I further agree that permission for multiple
copying of this work for scholarly purposes may be granted by me or the
Dean of Graduate Studies. It is understood that copying or publication
of this work for financial gain shall not be allowed without my written
permission.
Title of ThesisIProjecffExtended Essay:
Caste-Specific Biosynthesis of Mandibular Acids in Honey Bees
(Apis mellifera L.) - .
Author: _ , , _ --,*. /", ,,, (signature)
Erika Plettner
(name)

Abstract
Female honey bees (Apis mellifera L.) produce a caste-specific blend of I
functionalized 10-carbon fatty acids in their mandibular glands. Queens produce acids
functionalized at the penultimate ( o l ) position, such as 9-hydroxy- and 9-keto-(E)2-
decenoic acids (9-HDA and ODA). Both are components of the queen mandibular primer
pheromone, a powerful attractant of worker bees. Workers produce 10-hydroxy-(E)2-
decenoic acid and other acids fuctionalized at the terminal (a) position, which are thought
to be preservatives of brood food.
To study the biosynthesis of mandibular acids, specifically deuterated substrates
were applied to the mandibular gland, and their conversion was followed by gas
chromatography-mass spectrometry. Studies with fatty acids of different chain length
indicated that octadecanoic acid is the entry point to the pathway. Experiments with
labelled octadecanoic acid in the presence and absence of 2-fluorooctadecanoic acid, a
P-oxidation inhibitor, indicated that 17- and 18-hydroxyoctadecanoic acids are the first
functionalized intermediates in the pathway. Using labelled mandibular acids, the keto- and
diacids were found to be derived from the corresponding hydroxy acids, and the (E)2-
unsaturated hydroxy acids from the corresponding saturated acids.
The biosynthesis of mandibular acids is accomplished in a three-step bifurcated
pathway. The o and o l branches are established at the first step: hydroxylation of
octadecanoic acid at the 18" and 17" position. The resulting 18-carbon hydroxy acids are

chain shortened to the principal 10-carbon hydroxylated components. Oxidation of the o
and o l hydroxy group, to give diacids and keto acids, completes the process. Both castes
hydroxylate octadecanoic acid at the o and w-1 position. Queens chain shorten
18-hydroxyoctadecanoic acid to the 8-carbon length and the 17-hydroxy isomer to the 10-
carbon length. Workers chain shorten 18-hydroxyoctadecanoic acid to the 10-carbon
length, and they chain shorten the 17-hydroxy isomer to PHDA to a small extent. Hydroxy
group oxidation also differs between the castes: workers are unable to oxidize 9-HDA to
ODA, but they oxidize the 10-carbon ohydroxy acids to diacids. Queens oxidize PHDA
and ohydroxy acids. Therefore, the last two steps in the pathway determine the caste-
specificity of the mandibular gland secretions of queens and workers.

Acknowledgments
I would like to thank my mentors, Dr. Keith Slessor and Dr. Mark Winston, for the
guidance, encouragement and generous support they have given me. I would also like to
thank my parents for giving me the opportunity and the support to study science.
Dr. Skip King taught me how to operate and maintain the GC and GC-MS, and he
was always willing to share his knowledge about synthesis. Mr. Greg Owen helped me with
GC-MS and Ms. Marcy Tracey ran all the NMR spectra for this project. Mr. Phil
Laflamme, Mr. Steve Mitchell and Ms. Heather Higo looked after the apiary and reared
queens used for this work. Without their help, this project would not have been possible.
All the people in Dr. Slessor's, Dr. Winston's and Dr. Gries' laboratories have made
my experience as a graduate student rewarding. In particular, I would like to thank Ms.
Pingping Zhang, Mr. Ralph Wells, Mr. Greg Sutherland, Ms. Kirsten Bray, Mr. Peter Chua,
Ms. Tanya Pankiw and Ms. Nicole Laurencelle for their help and ideas. I would also like to
thank Ms. Elizabeth Brion for secretarial assistance.
This work was supported by Simon Fraser University, an NSERC postgraduate
scholarship to E. P. and NSERC Operating and Strategic Grants to K. N. S. and M. L. W.

Table of Contents
. . Approval.. .......................................... .: ............................................................ .ii
... ............................................................................................................ Abstract iii
Acknowledgments.. .......................................................................................... .v
List of Tables .................................................................................................... x . .
List of Figures ................................................................................................... xi1
... List of Schemes ................................................................................................. xi11
......................................................................................... List of Abbreviations xiv
............................................................................................................. Introduction.. .1
Chapter I: Literature review
I. 1 Caste determination and significance of the caste-specific mandibular
acid blends in female honey bees ......................................................................... 2
1.1 The honey bee castes and their determination during development. ... 2
1.2 Mandibular components in A. mellifera queens and workers ............. 4
1.3 Role of the mandibular gland secretion in colony integration ............. 7
1.4 Existing and potential commercial applications of the mandibular
pheromone and the importance of biosynthetic studies for their
................................................................................... development.. 1 0
1.2 Biosynthesis of fatty acid-derived semiochernicals .......................................... 1 1
2.1 Fatty acid and fatty acid-derived semiochemicals .......................... 1 1
.............................................. 2.2 Fatty acid biosynthesis and degradation 12
De novo biosynthesis of fatty acids ................................................ 12
Chain shortening of fatty acids ...................................................... 14
Distinction of limited P-oxidation from complete degradation and
......................................................................... resynthesis 15

The lipid pool as a source and sink of fatty acyl intermediates
................................................. in pheromone biosynthesis 16
2.3 Functionalization of fatty acids ........................................................... 17
................................................................................ Desaturation 1 7
................................................................................ Hydroxylation 18 . . .............................................................. Hydroxy group oxidation -19
.......................................................... 2.4 Specificity in pheromone blends 21
....................................................................... 2.5 Objectives of this work 22
Chapter 11: Materials and Methods
11.1 Sources of deuterated compounds ................................................................ 23
1.1 PurchasecUdonated chemicals ............................................................. 23
1.2 Chromatographic methods and determination of deuterium
content .............................................................................................. 23
1.3 Synthesis of deuterated compounds .................................................... 24
12-D1 octadecanoic acid (Dl C18:O) .............................................. 25
........................................... 4, 4.D2 (E)2-decenoic acid (D2 C 10: 1) -28
17.18.1 8.D3 17-octadecenoic and 17.17.18.18.1 8.D5
...................... octadecanoic acids (D3 C 18: 1 and D5 C 18.0) 31
9. 1 0-D2 and 9.10. 10-D3 9-decenoic acids
(DZ and D3 C10:l A ~ ) ......................................................... 37
4. 4.D2 10-hydroxy-(E)2-decenoic and -decenedioic acids
......................................... (D2 10-HDA and D2 C 10: 1 DA) 41
4. 4432 9-hydroxy- and 9-keto-(E)2-decenoic acids
................................................... (D2 9-HDA and D2 ODA) 46
9.9. 1 0.D3. 9. 9.D2 1 0-hydroxydecanoic and 2. 2.D2 decanedioic
acids (D2. D3 10-HDAA and D2 C10:O DA) ....................... 52
9.10. 10-D3 9-hydroxydecanoic and 17.18. 1 8-D3 17-hydroxy-
..... octadecanoic acids (D3 9-HDAA and D3 17-OH C18:O) 55
vii

7. 7.D2 8.hydroxyoctanoic. 15. 1 5-D2 16-hydroxyhexadecanoic
and 1 8-Dl 18-hydroxyoctadecanoic acids (Dz 8.HOAA.
D2 16-OH C16.0. Dl 18-OH C18:O) .................................. 57
................................................................................... II.2 Treatment of the bees 63
....................................................................................... 11.3 Analytical methods 64
3.1 Identification of compounds in the extracts ......................................... 64
...................... 3.2 Quantitation of total material and incorporation of label 65
........................................................................................................ 11.4 Statistics 69
Chapter 111: Elucidation of the biosynthetic pathway of mandibular acids in workers
and queens
111.1 Search for a fatty acid precursor .................................................................. 70
III.2 De novo biosynthesis from acetate ............................................................... 72
....................................................................... III.3 Lipid-bound fatty acid profile 73
III.4 Interconversion among major components ................................................... 77 . .
4.1 Hydroxy group oxidation .................................................................... 78
............................................ 4.2 Interconversion among ohydroxy acids -80
.......................................... 4.3 Interconversion among o 1 -hydroxy acids 82
............................ 4.4 Interconversion between o and o 1 -hydroxy acids 83
III.5 Chain shortening of higher homologs ........................................................... 84
111.6 Order of the steps in the pathway ................................................................. 90
............................................................................................. 6.1 Workers 90
6.2 Queens ............................................................................................... 95
III.7 The functionalization reaction ...................................................................... 98
Chapter IV: Discussion
IV . 1 Rates of biosynthesis of functionalized acids in both castes ........................ 103
1.1 Biosynthesis of ofunctionalized acids in workers ............................. 103

1.2 Biosynthesis of a-1-functionalized acids in queens ............................ 110
IV.2 Determination of caste-specificity in mandibular acid biosynthesis .............. 113
................................................................................... 2.1 Hydroxylation 113 . . ..................................................................................... 2.2 P-Oxidation -114
. . .................................................................. 2.3 Hydroxy group oxidation 117
2.4 Biosynthesis of mandibular acids in workers and queens .................... 117
2.5 The order of the steps in the pathway and the high output of
................................................................... the mandibular glands 120
....................... 2.6 Changes in caste-specificity with age and colony state 122
................................................................................... IV.3 Concluding remarks 123
............................................................................................................. Literature cited 126

List of Tables
Table Page
I . 1 . Examples of fatty acid hydroxylation .................................................................... 19
1.2. Examples of enzymatic alcohol and aldehyde oxidations ....................................... 20
III . 1 . Percentage of labelled hydroxy acids formed from decanoic. (E)2-decenoic.
hexadecanoic. and octadecanoic acids in workers ............................................. 70
III.2. Interconversion among potential precursors to hydroxy acids in worker
mandibular glands ....................................................................... : ..................... 71
I11.3. Incorporation of one l-l3c acetate into hydroxy acids in workers ....................... 73
I11.4. Incorporation of one 1-13c acetate into straight-chain fatty acids
in workers ......................................................................................................... 73 .
III.5. Amounts of lipid-bound fatty acids found in queen and worker mandibular
glands ................................................................................................................ 75
III.6. Oxidation of 10-carbon hydroxy acids in workers and queens .............................. 78
III.7. Interconversion among ohydroxy acids in queens and workers ........................... 80
........................ III.8. Interconversion among W- 1 -hydroxy acids in queens and workers 82
............. III.9. Check for isomerization between 9- and 10-HDA in queens and workers 84
111 . 10 . Chain shortening and elongation of ohydroxy acids in workers and queens ....... 86 \
III.11. Chain shortening and elongatiod of ml-hydroxy acids in workers and queens .... 87
IJJ . 12 . Incorporation of 17- and 18-hydroxyoctadecanoic acids into the
10-carbon keto acid and diacid in mated queens .................................................. 88
III . 13 . Incorporation of label from 12-Dl C 18:O into ohydroxy acids in workers.
...................... in the absence and presence of a P-oxidation inhibitor (2-F C 18:O) 91
III . 14 . Incorporation of label from 12-Dl C18:O into a-1-hydroxy acids in workers.
in the absence and presence of a P-oxidation inhibitor (2-F C 18.0) ....................... 94
III . 15 . Incorporation of label from 18.18. 1 8-D3 C 18:O into ohydroxy acids in workers.
....................... in the absence and presence of a 0-oxidation inhibitor (2-F C 18:O) 94
......... III . 16 . Amount of labelled hydroxy acids formed from Dl and Dj C18:O in workers 95

III. 17. Incorporation of label from 1 2-Dl C 18:O into m-1 -hydroxy acids in queens,
in the absence and presence of a P-oxidation inhibitor (2-F C18:O) ........................ 96
III. 18. Incorporation of label from 12-Dl C 18:O into ohydroxy acids in queens,
in the absence and presence of a P-oxidation inhibitor (2-F C18:O) ........................ 97
III. 19. Amount of labelled mandibular acids formed from Dl C 18:O in queens .... . . .... . . .. ... ..97
III.20. Hydroxylation at the o position in workers ............................................................ 99
III.21. Assay of terminal alkenoic acids for incorporation into ohydroxy acids ............... 100
III.22. Hydroxylation at the o l position in workers ....................................................... 100
III.23. Assay of terminal alkenoic acids for incorporation into 9-HDA ............................ 101
IV. 1. Rates of incorporation of labelled substrates into ofunctionalized acids
in workers .... ... .. . .... ... . . . . . ... . . . . . . .. . . ........... . ...... . . . . .... ..... .. .. . .. . .. .. . .. .. ... ... .. . . .. ... . . .. ... .. 103
IV.2. Rate constants for the three steps in the biosynthetic pathway of . .
ofunctionalized acids in workers ........................................................................ 105
IV.3. Comparison of observed and calculated daily rates of appearance
of hydroxy and diacids in young workers ........................................................... 108
IV.4. Rates of incorporation of labelled substrates into ol-functionalized . . acids in queens .................................. ........................................................ . 110
IV.5. Rate constants for the three steps in the biosynthetic pathway of . . o 1 -functionalized acids in queens.. . . . . . . . . . . . . . . . . . . . . . . . . . . . . . . . . . . . . . . . . . . . . . . . . . . . . . . . . . . . . . . . . . . 1 1 1
IV.6. Comparison of observed and calculated daily rates of formation of 9-HDA
and ODA in queens ...................................................................................... . ...... 1 12
IV.7. Amounts of labelled hydroxy acids, 12 - 18 carbons long, accumulated during t I 10 rnin perfusions with Dl C18:O and 2-F C18:O ................................................. 114
IV.8. Rates of P-oxidation of 18- and 17-hydroxyoctadecanoic acids in workers and
mated queens.. .. . . . . . ... .. ..... . . . .. .. . . .. . . . . . . . . ........... . . . . . . . . . . . . . . . . . . . . . . . . . . . . 1 15

List of Figures
Figure Page
I . 1 . Ontogeny of worker mandibular glands ................................................................... 5
1.2. Ontogeny of queen mandibular glands ..................................................................... 6
11 . 1 . Calibration of 9-HDA. D2 9-HDA and lO.HDA, D2 10-HDA ................................. 67
II.2. Change in the FR value across a GC peak of 10-HDA ............................................ 68
II.3. Low percentage calibration line for 10.HDA. D2 10-HDA ...................................... 69
111 . 1 . GC traces of methyl esters obtained through acetolysis and transesterification
of non-acidic and acidic lipids from worker mandibular glands ............................. 76
III.2. GC-MS single ion displays from tests for oxidation of 9-HDA to ODA
............................................................................... in workers and mated queens 79
................................................................. III.3. Interconversion among ohydroxy acids 81
III.4. Amounts of labelled o and ol-hydroxy acids formed from
............................................ Dl 18-OH C18:O and Dj 17-OH C18.0. respectively 89
III.5. Single ion displays at the retention time of 18-OH C18:O from the GC-MS
traces of worker mandibular extracts .................................................................... 92
III.6. Possible routes of hydroxylation .............................................................................. 98
III.7. Biosynthetic pathway of the mandibular acids in workers and queens .................... 102
IV . 1 . Calculated increase in hydroxy- and diacids in workers. model I ............................ 106
IV.2. Calculated increase in hydroxy- and diacids in workers, model 11 ........................... 107
IV.3. Calculated increase in 9-HDA and ODA in queens, model II .................................. 112
IV.4. Amount of labelled 1%. 12- and 10-carbon o and o 1 hydroxy acids formed
................................................................. from Dl C18:O in workers and queens 116
..................................... IV.5. Caste-specific biosynthesis of mandibular acids in workers 118
............................ IV.6. Caste-specific biosynthesis of mandibular acids in mated queens 120
IV.7. Ontogeny of ohydroxy acids in queens ................................................................. 122

List of Schemes
Scheme Page r
.................................................................. 1. Synthesis of 1 2-Dl octadecanoic acid ..26
2. Route to 4,4-D2 (E)2-decenoic acid ....................................................................... 29
3. Synthesis of l7,17,18, 18,18-D5 octadecanoic and
................................................................ 17,18,1 8-D3 17-octadecenoic acids. ..32
4. Synthesis of 9, 10,lO-D3 and 9, 10-D2 9-decenoic acids ............................................. 38
5. Synthetic route to 4,4-D2 10-hydroxy-(E)2-decenoic acid and the . . ......................................................................................... corresponding diacid -42
6. Synthesis of 4,4-D2 9-hydroxy- and 9-keto-(E)2-decenoic acids ................................ 47
7. Synthesis of 9,9,10-D3 and 9,9-D2 10-hydroxydecanoic acids and . .
the corresponding diacid ..................................................................................... 53
8. Synthesis of 9,10, 10-D3 9-hydroxydecanoic and 17,18,1 8-D3 17-hydroxy-
.................................................................................................. decanoic acids.. -56
9. Synthesis of labelled 8-hydroxyoctanoic, 16-hydroxyhexadecanoic and
........................................................................... 18-hydroxyoctadecanoic acids. -59

List of Abbreviations
abbreviation
BSTFA
C1O:O
C10: 1
C1O:l A9
C12:O
C l4:O
C16:O
C18:O
C18:l
C10:O DA
C10:l DA
CI
CoA
DAE
3,lO-diOH C10
DMF
DMSO
EI
FAS
2-F C18:O
FFA
FID
meaning I
bis trimethylsilyl trifluoroacetamide
decanoic acid
(E)2-decenoic acid
9-decenoic acid
dodecanoic acid
tetradecanoic acid
hexadecanoic acid
octadecanoic acid
17-octadecenoic acid
decanedioic acid
(E)Zdecenedioic acid
chemical ionization
coenzyme A
diaminoethane
3,l O-dihydroxydecanoic acid
dimethylforrnamide
dimethylsulphoxide
electron impact
fatty acid synthase
2-fluorooctadecanoic acid
free fatty acid
flame ionization detector
intensity of an isotope peak of the M-15 fragment ion relative to
the total intensity of the M-15 ion and the isotope peak
FR value of an unlabelled standard
gas chromatography
hour

abbreviation
9-HDA
10-HDA
10-HDAA
HMPA
7-HOAA
8-HOAA
IR
JH 111
K. I.
MC
min
MS
NMR
ODA
11-OH C12:O
11-OH C12: 1
12-OH C 12:O
12-OH C12:l
13-OH C14:O
13-OH C14:l
14-OH C14:O
16-OH C l6:O
17-OH C18:O
18-OH C18:O
PA
PC, PE
PCC, PDC
meaning
(R,S) 9-hydroxy-(E)2-decenoic acid
10-hydroxy-(E)2-decenoic acid I
10-hydroxydecanoic acid
hexarnethylphosphoramide
(R,S) 7-hydroxyoctanoic acid
8-hydroxyoctanoic acid
infrared spectroscopy/ - spectrum
juvenile hormone III
Kovats Index
mandibular complex
minute
mass spectrometry
nuclear magnetic resonance
9-keto-(E)2-decenoic acid
1 1 -hydroxydodecanoic acid
1 1 -hydroxy-(E)2-dodecenoic acid
12-hydroxydodecanoic acid
12-hydroxy-(E)2-dodecenoic acid
13-hydroxytetradecanoic acid
13-hydroxy-(E)2-tetradecenoic acid
14-hydroxytetradecanoic acid
16-hydroxyhexadecanoic acid
17-hydroxyoctadecanoic acid
18-hydroxyoctadecanoic acid
phosphatidic acid
phosphatidylcholine, -ethanolamine
py&dinium chlorochromate, - dichromate
replicate
queen equivalent

abbreviation
QMC
S. E.
TAG
THF
THP
TLC
TMPA
TMS
0
01
WMC
meaning
queen mandibular complex
standard error r
triacylglycerol
tetrahydrofuran
tetrahydropyranyl group
thin-layer chromatography
trimethylphosphonoacetate
trimethylsilyl group
terminal position in an alkyl chain
penultimate position in an alkyl chain
worker mandibular complex
Introduction
A colony of honey bees exhibits an intricate social structure, at the heart of which I
are division of labor and an effective communication system. Labor is divided between the
queen, who devotes her time to egg-laying, and the workers, who carry out numerous
chores from tending brood to collecting food. Many signals coordinate the behavior of the
queen and the workers, among them chemical cues. The best known among the honey bee
signal chemicals are blends of isomeric fatty acids that are produced in both worker and
queen mandibular glands. Although the structural differences between the components of
the queen and worker mandibular complexes are small, these compounds have very different
functions in the colony. The queen uses her mandibular complex to signal her presence;
worker compounds are thought to act as a preservative and nutrient in brood food. The
biosynthesis of the mandibular complexes has not been studied and is of interest because
differentiation between queen and worker mandibular complexes is critical in the
differentiation between queen and worker behaviors that are the key to colony integration.
Insight into this physiological difference between queens and workers also may aid in the
development of more efficient beekeeping techniques that make use of these powerful
chemical signals.
The elucidation of the biosynthetic pathway of the queen and worker mandibular
complexes is described in this thesis. Chapter I is a review of the literature on caste
differentiation in the honey bee, the functions of the queen and worker mandibular
complexes and the biosynthesis of fatty acid-derived serniochemicals. The synthesis of
labelled precursors and the methods for following them are described in Chapter 11; the
experiments which led to the elucidation of the pathway are presented in Chapter m. Chapter IV is a discussion of caste-specificity in mandibular complex biosynthesis.

Chapter I: Literature Review
1.1. Caste determination and significance of the caste-specific mandibular acid blends I
in female honey bees
1.1 The honey bee castes and their determination during development
The existence of distinct queen and worker castes within a honey bee colony has
fascinated people since ancient times. However, until the 1 6 ~ ~ century, little was known
about the role of these castes in the colony. The queen, known then as "master bee", was
first recognized as female in 1586 by L. M. de Torres who observed a queen laying eggs.
Soon thereafter, the workers also were recognized as female. Detailed morphological
comparisons of queens and workers led to the conclusion that only the queen has the ability
to mate and, therefore, to reproduce (Crane 1946, Free 1982). The appearance of glass-
walled hives allowed more detailed observations which led to the realization that a colony
of honey bees consists of one queen, several thousand workers and a variable number of
drones, and that the workers perform many non-reproductive tasks in the colony such as
brood care, defense and foraging (Free, 1982). Eventually, the term "caste" was introduced
to denote individuals of the same sex that vary in form and function. The queen and the
workers are considered to be distinct castes because they differ morphologicalIy and
physiologically even though they have the same genetic complement (Wilson 197 1, p. 136).
Once it was known that queens and workers are female, beekeepers and scientists
became intrigued by how their caste is determined. In 1889, Perez observed that both
female castes arise from a fertilized egg, but follow different developmental pathways,
depending on the quality and quantity of food a young larva is given (Beetsma 1979).
Queen larvae are fed a high proportion of royal jelly, a milky secretion from the mandibular
glands of nurse bees, while worker larvae are fed mostly secretions from the
hypopharyngeal glands and pollen. When the workers need to rear a new queen, either
because of queen loss or in preparation for swarming, they elongate a cell containing a

young female larva and begin feeding her royal jelly (Winston 1987). A young female larva
can develop into a queen or a worker up to the third day of the larval instars, depending on
her feeding regime, Four day old worker larvae grafted into queen cells develop into I
workers, and larvae grafted during the third-fourth day develop into intercastes, individuals
with mixed queen and worker characteristics (Beetsma 1979). Queen and worker cells
differ in shape and orientation, and nurse bees feed larvae according to the cell type they are -
in (Beetsma 1985). Cell type is thus translated into food quality and quantity, both of which
are important factors in caste determination in female honey bees.
Numerous experiments have been done to explore the chain of events leading from
differences in food quality and quantity to caste differentiation. This work has culminated in
two hypotheses: a) royal jelly contains a hormone-like substance that induces queen
characters in larvae (trophic factor), or b) the nutritional value of the diet given to a larva
translates into a hormonal stimulus that induces the caste-specific characters (Beetsma
1979, Rachinsky 1990). Some attempts have been made to isolate and characterize the
elusive "trophic factor" in royal jelly, but the results are unclear, perhaps because the
substance is unstable (Rembold et al. 1974). On the other hand, Asencot and Lensky
(1976) were able to demonstrate that feeding young larvae worker food supplemented with
glucose and fructose results in some of them developing into queens and intercastes. The
higher the sugar content of the brood food, the greater the proportion of queens among the
larvae reared. Royal jelly has a higher sugar content than worker food, and the sugar is
thought to act as a phagostimulant, causing queen larvae to ingest more food than worker
larvae (Beetsma 1979, Winston 1987). This higher feeding rate results in neural stimuli that
are translated into higher juvenile hormone III (JH III) titers in the hemolymph of queen
larvae (Rachinsky 1990). The hormonal and neural stimuli in queen larvae lead to a higher
metabolic rate, faster growth and, therefore shorter development times for queens as
compared to workers (Beetsma 1979, Winston 1987) . This difference in development
ultimately results in morphological and physiological differences between queens and
workers.

1.2 Mandibular components in A. mellifera queens and workers
Many morphological differences between queens and workers relate to their I
respective tasks in the colony and have been studied in detail. For instance, only queens
possess fully developed ovaries and a spermatheca and only workers have pollen baskets on
their hindlegs (Winston 1987). Unlike morphological differences, the physiological
differences between queens and workers are only beginning to be explored. One such
difference is the composition of the mandibular complex (MC), a blend of several
compounds produced in the mandibular glands of female honey bees. Both queens and
workers produce a group of functionalized 10-carbon fatty acids (among other compounds)
in their mandibular glands. The fatty acids characteristic of queens have the functional
group at the second-to-last ( o l ) position in the chain, while the acids typical of workers
are functionalized at the last (a) position. The major component of queen mandibular
complex (QMC) is 9-keto-(E)2-decenoic acid (ODA), and the second most abundant is 9-
hydroxy-(E)2-decenoic acid (9-HDA) (Slessor et al. 1988, 1990). The most abundant
component of worker mandibular complex (WMC) is 10-hydroxy-(E)2-decenoic acid (1 0-
HDA) (Callow et al. 1959), followed by 10-hydroxydecanoic acid (10-HDAA). The
8-carbon compound, 8-hydroxyoctanoic acid (8-HOAA), is a minor component, and so are
the diacids corresponding to the ohydroxy acids (Weaver et al. 1968, Pain et al. 1962).
The functions of these caste-specific blends also differ. QMC is a pheromone, which
attracts nearby workers, giving rise to a retinue of workers around the queen (Free 1987,
Slessor et al. 1988), among other effects. The worker MC components have been less well
studied, but some of them could be involved in food preservation (Blum et al. 1959,
Lukoschus and Keularts 1968) and nutrition (Kinoshita and Shuel 1975).
For many years, the composition of queen and worker MC had been thought to be
mutually exclusive, until it was found that mated, laying queens always have some 10-HDA
and 10-HDAA (Crewe et al., 1982). Conversely, queenright workers always have trace
amounts of 9-HDA in their mandibular glands (Plettner et al. 1995). Workers retain the
same ratio of mandibular acids throughout their lives, and the titer of material found in the
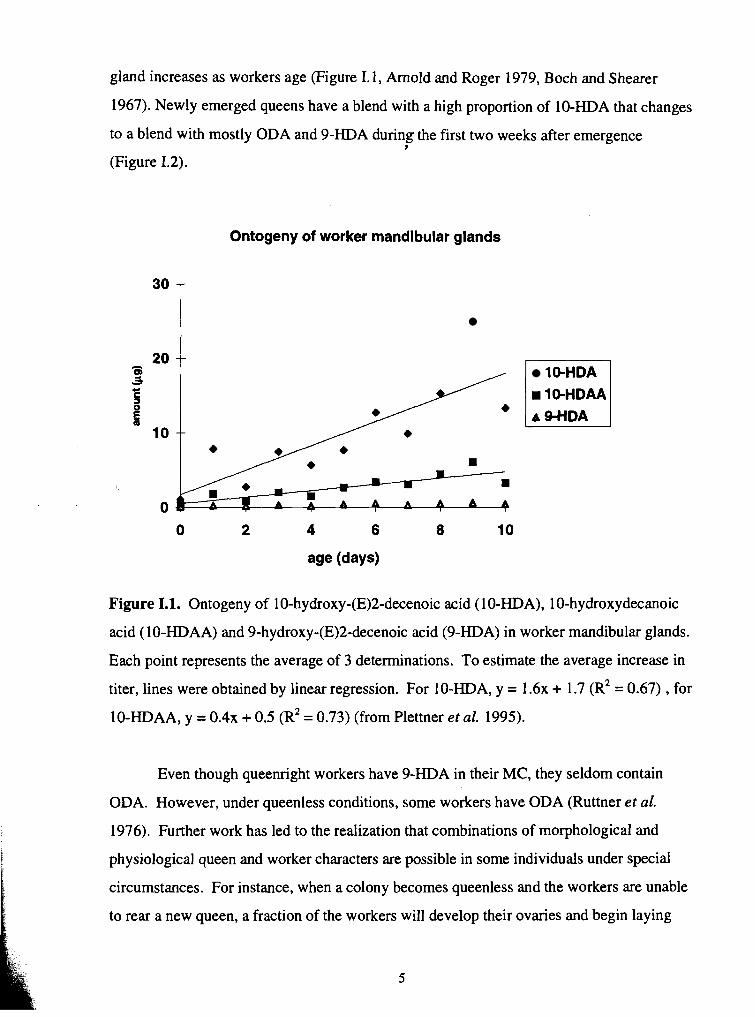
gland increases as workers age (Figure I. 1, Arnold and Roger 1979, Boch and Shearer
1967). Newly emerged queens have a blend with a high proportion of 10-HDA that changes
to a blend with mostly ODA and 9-HDA during the first two weeks after emergence I
(Figure 1.2).
Ontogeny of worker mandibular glands
10-HDA 10-HDAA
A QHDA
Figure 1.1. Ontogeny of 10-hydroxy-(E)2-decenoic acid (10-HDA), 10-hydroxydecanoic
acid (10-HDAA) and 9-hydroxy-(E)2-decenoic acid (9-HDA) in worker mandibular glands.
Each point represents the average of 3 determinations. To estimate the average increase in
titer, lines were obtained by linear regression. For 10-HDA, y = 1 . 6 ~ + 1.7 ( R ~ = 0.67) , for
10-HDAA, y = 0 . 4 ~ + 0.5 (R* = 0.73) (from Plettner et al. 1995).
Even though queenright workers have 9-HDA in their MC, they seldom contain
ODA. However, under queenless conditions, some workers have ODA (Ruttner et al.
1976). Further work has led to the realization that combinations of morphological and
physiological queen and worker characters are possible in some individuals under special
circumstances. For instance, when a colony becomes queenless and the workers are unable
to rear a new queen, a fraction of the workers will develop their ovaries and begin laying
5

unfertilized eggs. Occasionally, one of these laying workers will attract a retinue of
workers around her, just like a mated, laying queen would (Sakagami 1958). Such workers
are referred to as "false queens", and their mandibular glands contain ODA and 9-HDA,
along with a small proportion of the characteristic worker acids (Plettner et al. 1993).
Laying workers that do not attract a retinue have a worker MC. An intercaste with
developed ovaries, a small spermatheca, queen-like quantities and proportions of ODA and
9-HDA in her mandibular glands, and a worker-like external appearance has been reported
(Plettner et al. 1993). There appears to be a continuum from worker to false queen to
intercaste to virgin queen to mated queen with respect to mandibular gland states. Along
this gradation, the proportion of o 1 -functionalized queen acids increases relative to the o
functionalized worker acids. In European honey bee subspecies, the intermediate states are
rare, but in some African subspecies they are quite common. In particular, A. mellifera
capensis workers easily become false queens under queenless conditions (Crewe and
Velthius 1980, Cooke 1987, Allsopp and Crewe 1993).
Ontogeny of queen mandibular glands
ODA
Figure I. 2. Ontogeny of 9-keto-(E)2-decenoic acid (ODA), 9-HDA and 10-HDA in
queens. For 1 year old queens N = 29, for 6 day old queens N = 10 (Plettner et al.,
t unpublished observation).

1.3 Role of the mandibular gland secretion in colony integration
All social insects have developed the ability to coordinate the effort of many
individuals towards collective survival. Even though the social insects have adapted to a
wide variety of conditions,, all the advanced insect societies share three characteristics.
First, there are at least two overlapping generations cohabiting in a colony. This is an
important difference to solitary insects, such as many wasp species, in which a mother dies
before her offspring emerge. Overlap of generations is a prerequisite for the second
characteristic: extended brood care and provisioning. Females of solitary wasp species lay
their eggs on a paralyzed prey item before they die, the resulting brood having to survive on
these provisions. In contrast, social insects continuously provision and tend their brood
until shortly before pupation. The third characteristic of highly social insects'is division of
labor into reproductive and non-reproductive tasks carried out by morphologically distinct
castes. The queen, the only fertile female in the colony, lays eggs, while the workers tend
the brood, forage for food and build, clean and defend the nest. This sharp division of
reproductive and other tasks among distinct castes sets the eusocial insects (such as the
honey bees) apart from other insects that exhibit less complex social behavior (Wilson
197 1).
Another feature of highly advanced insect societies is reciprocal communication
among nestmates, which is needed to achieve coordinated colony-level responses to internal
and external stimuli. Reciprocal communication is essential for the establishment of a
hierarchy among the individuals, for recruitment of foragers to food sources and for alarm
(Wilson 197 1, HSlldobler and Wilson 1990). Among the various means used for
communication in insect societies, chemical signals are prominent. Semiochemicals are
signal chemicals used for communication between members of the same or different species,
the former being known as pheromones. Compounds that elicit a specific short-term
behavior are releasers and compounds that have a long-term physiological effect are
primers. The queen MC can be classified as both, since it is very attractive to the workers
and elicits retinue formation around the queen and swarm attraction (releasers), but also has

been found to inhibit JH 111 biosynthesis in workers and to inhibit queen rearing by workers
(primers). No releaser or primer functions have been found for worker MC, but some
components seem to be involved in food preservation and larval nutrition. J
Queen MC is a signal by which the queen makes her presence felt throughout the
nest: it delays swarming, inhibits queen rearing, stimulates pollen collection and brood
rearing in small colonies and affects division of labor among the workers. The workers in
the retinue around the queen remove QMC from her body surface and spread it throughout
the nest mostly by grooming and exchanging food with other workers (Naumann et al.
1991). When a colony becomes overcrowded, QMC can no longer circulate sufficiently
among the workers and queen rearing in preparation for swarming begins (Winston et al.
1991). When a colony loses its queen, the workers sense the loss of QMC within half an
hour and begin emergency queen rearing within one day (Winston et al. 1989, 1990).
Swarming and emergency queen rearing can be delayed by the introduction of synthetic
QMC into slightly overcrowded or queenless colonies, respectively, which confirms the role
of QMC in the inhibition of queen rearing (Winston et al. 1989, 1990, 1991). Furthermore,
synthetic QMC added to small, newly established colonies in the spring can stimulate pollen
foraging and brood rearing (Higo et al. 1992).
The major component of QMC, ODA, inhibits the biosynthesis of JH 111 in workers,
which allows the queen to influence JH 111-regulated aspects of worker behavior and
physiology, such as worker age polyethism (Kaatz et al. 1992). As workers age, they
progress through various tasks starting with work in the center of the nest, then proceeding
to the periphery and finally flying out and foraging (Winston 1987). This ordered change in
behavior is mediated by an increasing JH 111 titer in workers as they age (Robinson et al.
1991). A rapid rise of the JH III titer in newly emerged bees causes them to skip the tasks
in the nest and to begin foraging precociously (Robinson 1987). QMC may be one signal
that slows the rapid programmed rise in JH 111 in workers, thereby ensuring that workers
progress through all the tasks (Kaatz et al. 1992, Pankiw personal communication). In
spite of the large number of effects QMC has, it is not the only chemical signal that controls

and integrates worker behavior and physiology. In particular, aspects of worker physiology
that are not under the control of JH 111 do not appear to be influenced by QMC. One such
aspect is worker ovary development, which is hot affected by QMC, but appears to be
controlled by a primer pheromone emanating from the brood (Willis et al. 1990). All the
observations about QMC point to its central, albeit not unique, role in colony integration:
this semiochemical allows the queen to coordinate some activities of the workers and to
prevent the rearing of rival reproductives.
Honey bee workers gather, process and distribute the food supply for the entire
colony, and the mandibular glands (among others) are involved in food processing (Winston
1987). Therefore, one would expect the worker MC to play a role in this activity. The
provisioning of brood and storage of food require antibacterial and antifungal compounds
for preservation. Such compounds have been found among several social insects, in
particular those that live in moist environments and/or store food. For instance,
Crematogaster defomis ants produce a mixture of phenols, which exhibit antibacterial
activity, in their metapleural glands (Attygalle et al. 1989). Fire ants (Solenopsis invicta)
spray their brood with a small quantity of venom that contains a mixture of piperidine
alkaloids with antibiotic properties (Obin and Van der Meer 1985). In honey bees, the
worker MC component 10-HDA is found in royal jelly (Barker et al. 1959), along with the
other ohydroxy acids and their corresponding diacids (Weaver et al. 1968). Blum and
coworkers (1 959) found 10-HDA to exhibit antifungal and antibacterial activity in
laboratory tests, so this compound may be involved in the preservation of royal jelly. The
10-HDA also inhibits the germination of pollen, which is important if pollen is to be stored
(Lukoschus and Keularts 1968). Moreover, 10-HDA may be involved in larval nutrition.
Kinoshita and Shuel(1975) found that larvae fed with delipidated brood food pupated
precociously and exhibited high mortality. The readdition of 10-HDA to the delipidated
food partially reversed the effect of lipid removal; the readdition of the sterol fraction did
not lead to as strong a reversal. The authors suggest that 10-HDA may inhibit JH III
production in the larvae and, in the full royal jelly blend, help to disperse the sterol

components. Thus, the best understood functions of 10-HDA are related to food
preservation and larval nutrition.
1.1.4 Existing and potential commercial applications of the mandibular pheromone
and the importance of biosynthetic studies for their development.
The effects of QMC on workers have led to the development of several
commercially important applications of synthetic QMC. For instance, packaged worker
bees can be shipped with a dose of synthetic QMC instead of a live queen. The QMC
prevents the queenless workers from becoming restless and makes shipping easier. Since
QMC is very attractive to the workers, it can be used to lure workers to blooming crops
and thus enhance pollination efficiency. Furthermore, QMC can be used to suppress queen
rearing and, hence, swarming (review of practical applications: Winston and Slessor 1992).
All the known effects of QMC are dose dependent, and so are the practical applications
developed so far: an overdose may cause an unforseen side effect, but the administered dose
must be high enough to achieve the desired effect. To find suitable doses and release rates
for the various practical applications of QMC, one needs to know the natural rates of
production and dispersion of the QMC components in the colony. The rate of QMC
dispersion in a colony has been studied (Naumann et al. 1991), but the rate of production
was only determined indirectly as part of the dispersion studies. Determination of the
production rate of QMC components requires the elucidation of the biosynthetic pathway.
The breakdown of ODA in workers has been studied by Johnston et al. (1965), but the
biosynthesis of the acid components of QMC has not been studied.

1.2. Biosynthesis of fatty acid-derived semiochemicals
2.1 Fatty acid and fatty acid-derived ~emio~hemicals
Few species use free fatty acids (FFA) as semiochemicals, possibly because of the
low volatility of these compounds. Some examples include the carpet beetles which have
unsaturated fatty acids as sex pheromones (Silverstein et al. 1967, Kuwahara and Nakamura
1985). The death's head hawlunoth is able to enter and live in honey bee colonies, without
being detected by the bees, because its cuticular FFA profile mimics that of the bees (Moritz
et al. 1991). (R)3-Hydroxybutanoic acid is the contact sex pheromone of L. triangularis, a
forest spider (Schulz and Toft 1993). However, the honey bee queen mandibular
pheromone is the most extensively studied semiochemical with FFA components.
Semiochemicals that are derived from fatty acids are numerous and can be classified
into fatty alcohols, esters, aldehydes, lactones, hydrocarbons, oxiranes and ketones. Several
moths, such as B. mori and T. pityocampa, have fatty alcohols as the main component of
their sex pheromone (Ando et al. 1988, Fabrias et al. 1989). Many other moths, among
them A. velutinana and T. ni, have acetate esters of fatty alcohols (Wolf and Roelofs 1989);
A. variana and C. jkmiferana are two species from a long list that have fatty aldehydes as
their sex pheromone (Gries et al. 1994, Weatherston et al. 1971). Lactones of 12- and 14-
carbon hydroxy acids are components of the aggregation pheromone of several grain beetles
(Vanderwel and Oehlschlager 1989). Examples of hydrocarbon semiochemicals are the
housefly sex pheromone, (Z)9-tricosene, and the Arctiid moth sex pheromone, 2-
methylheptadecane (Blomquist et al. 1993, Charlton and Roelofs 199 1). The sex
pheromone of the German cockroach, 3,11 -dimethylnonacosan-2-one is derived from the
corresponding alkane (Blomquist et al. 1993).
The biosynthesis of many fatty acid-derived semiochernicals has been studied. All of
these biosynthetic routes consist of three processes: 1) synthesis of the precursor fatty acid,
2) functionalization and chain shortening or elongation and 3) carboxyl group modification.
Combinations of these processes account for all the known biosynthetic patterns of fatty
11

acid-derived semiochemicals. Almost all the species studied are able to synthesize the
precursor fatty acid de novo from acetate. However, most of them also are able to
incorporate the preformed precursor fatty acid directly. The second process, r
functionalization of the fatty acid, consists of the introduction of a second functionality such
as a C=C double bond in many moth pheromones. In many cases, the chain length of the
precursor fatty acid does not correspond to that of the final product, because the precursor
fatty acid is chain shortened or elongated before or after functionalization.
The last process in the biosynthesis of fatty acid-derived semiochemicals is the
modification of the carboxyl group. Fatty alcohols are formed by reduction of the fatty acyl
coenzyme A (CoA) ester, first to the aldehyde, then to the alcohol. The acetates are formed
from the alcohols by acetylation (Jurenka and Roelofs 1993). The aldehyde pheromone of
C. fumiferana is formed from the corresponding acetate ester by hydrolysis and oxidation
on the gland surface during release (Morse and Meighen 1987). Lactones are formed by
cyclization of the precursor hydroxy acyl CoA esters (Vanderwel et al. 1992).
Hydrocarbons are formed by reduction of the precursor fatty acyl CoA ester to an aldehyde
that is decarbonylated to give the hydrocarbon (Blomquist et al. 1993). The first two
processes, precursor fatty acid synthesis and combinations of functionalization and chain
shortening or elongation, are applicable to honey bee mandibular acid biosynthesis and are
discussed further.
2.2 Fatty acid biosynthesis and degradation
De novo biosynthesis of fatty acids
Most of the species that have been studied are able to incorporate labelled acetate
into their pheromone components, as well as into free and lipid-bound fatty acids. This
indicates that the fatty acid precursor can be synthesized in the pheromone gland.
However, preformed labelled fatty acids also are incorporated into the pheromone,
indicating that the source of the fatty acid is not important to the pheromone biosynthetic

pathway. One exception is P. gossypiella, which is unable to incorporate hexa- or
octadecanoic acid into its pheromone, but can incorporate (Z)9-octadecenoic acid. The
gland is unable to synthesize this precursor which may come from elsewhere in the insect
(Foster and Roelofs 1988).
Fatty acid synthase (FAS) is the enzyme complex responsible for fatty acid
biosynthesis from acetate. The sequence of reactions starts with the carboxylation of
acetyl-CoA to give malonyl-CoA. Malonyl-CoA is condensed with acetyl-CoA (or the
growing fatty acyl-CoA in subsequent rounds) to give 3-ketobutyryl-CoA. The 3-keto acyl-
CoA is reduced to give 3-hydroxyacyl-CoA, and this is followed by dehydration to give an
(E)2-enoyl-CoA. Reduction yields the fatty acyl-CoA two carbons longer (Stanley-
Samuelson et al. 1988). Most FAS require acetyl-CoA as starter, but some accept other
CoA esters such as 3-methylbutyryl CoA in the biosynthesis of 2-methyl-branched fatty
acids (Charlton and Roelofs 1991) or 18-carbon acyl-CoA esters in the biosynthesis of very
long chain fatty acids (Vaz et al. 1988).
In insects, as in vertebrates, these reactions occur in close succession, without
release of the intermediates. Furthermore, several rounds of condensation occur before the
growing fatty acyl-CoA is released and hydrolyzed by a thioesterase domain of the FAS
(Stanley-Sarnuelson et al. 1988). In most insect FAS studied, release occurs when the
chain has reached a 16 or 18 carbon length. For instance, Morse and Meighen (1987)
studied the chain-length specificity of a FAS found in the pheromone gland of C.
fumiferana by determining the ratio of labelled acetyl-CoA to malonyl-CoA incorporated
into the fatty acid. Since in their in vitro system only one acetyl-CoA was incorporated per
fatty acyl chain, the ratio of malonyl- to acetyl-CoA incorporated gave an indication of the
chain length of the FAS product. The ratios found corresponded to incorporation into octa-
and hexadecanoic acid. More direct methods, such as gas chromatography of the FAS
products, have been used to study the chain length specificity of insect FAS. For instance,
FAS from T. ni and M. domestica both produce hexa- and octadecanoic acids (Stanley-
Samuelson et al. 1988). The FAS from the pea aphid synthesizes mainly tetradecanoic acid.
Ryan et al. (1982) demonstrated that this is due to a separate thioesterase that specifically

hydrolyzes tetradecanoyl-CoA before it is elongated. In the absence of the thioesterase, the
aphid FAS produces hexa- and octadecanoic acids. Thus, in most insects, the FAS
synthesizes mainly hexa- and octadecanoic acids. I
Chain shorteninp of fattv acids
Fatty acids are chain shortened by P-oxidation, a sequence of reactions that leads to
the removal of acetyl-CoA from the acyl-CoA substrate. The process starts with
desaturation to give an (E)2-enoyl-CoA. This is followed by hydration to a 3-hydroxyacyl-
CoA and oxidation to a 3-ketoacyl-CoA. This intermediate is attacked by coenzyme A to
give acetyl-CoA and the shortened acyl-CoA. Both, the chain length specificity and the
extent of chain shortening vary between P-oxidation systems: some preferentially accept
18-carbon acyl CoA esters for the first round, others start with acyl-CoA esters that are 10'
to 14 carbons long (Christensen et al. 1989). Furthermore, the extent of P-oxidation varies,
depending on the subcellular location of the enzyme complex. In vertebrates, the
~tochondrial system appears to degrade fatty acids completely to acetate, while the
peroxisomal system performs limited chain shortening (Lazarow and de Duve 1976, van den
Bosch et al. 1992). In insects, both limited and complete P-oxidation are observed, but the
subcellular location of these activities hi+s not been determined.
Limited P-oxidation is common in pheromone biosynthetic pathways. For instance,
in A. velutinana and S. littoralis, hexadecanoic acid undergoes one round of chain
shortening before the A1 1 double bond or the diene system, respectively, are introduced
(Wolf and Roelofs 1989, Martinez et al. 1990). Limited chain shortening can also take
place on functionalized fatty acids. For example, the grain beetles chain-shorten (Z)9-
octadecenoic acid to (Z)3-dodecenoic acid, an intermediate in the biosynthesis of (Z)3-
dodecen- 1 1 -01ide (Vanderwel et al. 1992). Females of T. ni biosynthesize their sex
pheromone, (Z)7-dodecenyl acetate, by chain shortening of (Z) 1 1-hexadecenoic acid to the
12-carbon length (Wolf and Roelofs 1989, Jurenka and Roelofs 1993).

Distinction of limited ?-oxidation from complete degradation and resynthesis
Conversion of a fatty acid to shorter fatty acids (and derived compounds) can occur
through two routes: limited P-oxidation to the'required chain length or complete
degradation to acetate and resynthesis of the shorter fatty acid. Which of the two routes is
the major one depends on'the type of P-oxidation system as well as the chain length
specificity of the FAS. Often these enzyme systems have not been studied in sufficient
detail to delineate the route of fatty acid incorporation directly, so indirect methods have to
be used. Incorporation patterns of radiolabelled acetate and fatty acids and stable isotope
labelled fatty acids are useful in distinguishing the two possibilities. For instance, in a study
of (Z)7-dodecenyl acetate biosynthesis in T. ni, the position of radiolabel in the pheromone
formed from 16 3 ~ - ( ~ ) 1 1-hexadecenoic acid was used to distinguish limited P-oxidation
from complete degradation and resynthesis of the precursor. The pheromone isolated from
treated glands was ozonolyzed, and the fragments were separated by gas chromatography.
Only the fragment corresponding to the methyl end of the pheromone was labelled, which
indicated that the (Z) 1 1-hexadecenoic acid was incorporated mainly by limited chain
shortening (Bjostad et al. 1987).
In another example, females of A. velutinana incorporated l-l4c tetradecanoic acid
into (Z) 1 1-tetradecenoic acid and the pheromone, but not into hexa- and octadecanoic
acids, which meant that very little tetradecanoic acid was degraded to acetate and
resynthesized. Furthermore, 16,16,1 6-D3 hexadecanoic acid was incorporated into the
shorter fatty acids and the pheromone. If the deuterium labelled hexadecanoic acid had
been completely degraded and resynthesized to tetradecanoic acid, the mass label would not
have been detectable, because the deuterated acetate would be diluted in the endogenous
acetate pool and deuterium from Dg acetate would be lost during resynthesis. The
detectable incorporation of mass labelled fatty acid into the pheromone confirmed that
degradation and resynthesis was not a major route of fatty acid incorporation into the
pheromone of A. velutinana (Bjostad et al. 1987).

The b i d pool as a source and sink of fatty acvl intermediates in pheromone biosynthesis
The majority of the fatty acid found in pheromone glands is not free, but esterified
to glycerol in several forms of glycerolipid. TKese include neutral lipids such as
triacylglycerol (TAG) and phospholipids such as phosphatidylcholine and -ethanolarnine. In
the previously discussed de novo studies, labelled acetate was incorporated into free and
lipid-bound fatty acids, indicating that the lipid is synthesized in the pheromone gland. The
fatty acid profile of pheromone gland lipids typically includes hexa- and octadecanoic acids;
(Z)9-octadecenoic and polyunsaturated acids. In addition, some unusual fatty acids are
bound in the TAG of some species. For example, TAG from the pheromone gland of B.
mori contains ( Z ) 1 1-hexadecenoic acid and (E) 1 O,(Z) 12-hexadecadienoic acid (Bjostad et
al. 1987). The latter has the same diene system as the pheromone and both are known to be
precursors of the pheromone (Ando et al. 1988). The lipid may, therefore, serve as a
pheromone precursor storage site in this species.
The role of glycerolipid-bound fatty acids was studied in detail in A. velutinana
which has large quantities of (E) and (Z) 1 1-tetradecenoic acid bound in the TAG. In a
time-course of 1-14c acetate incorporation into the TAG-bound A1 1 acids and the
pheromone, label was incorporated equally fast into both. If the TAG-bound A1 1 acids had
been pheromone precursors, incorporation of label into the pheromone should have lagged
behind incorporation into the A 1 1 acids. Further studies with TAG containing labelled (E)
and (Z) 1 1-tetradecenoic acid confirmed that the TAG-bound A1 1 acids are not
intermediates in pheromone biosynthesis in this species. The TAG-bound A1 1 acids are
mostly E, but the A1 1 desaturase produces more of the Z isomer which is preferentially
incorporated into the pheromone. If the E isomer were allowed to accumulate in the free
acid pool, the Z:E ratio in the pheromone would change with time. (E)1 1-Tetradecenoic
acid is thought to be preferentially bound into the TAG to prevent its accumulation and
thereby maintain a constant Z:E ratio in the pheromone (Bjostad et al. 1987).

2.3 Functionalization of fatty acids
Functionalization is the introduction of,a structural feature into an alkyl chain. In
the biosyntheses of fatty acid-derived semiochemicals, initial functionalization frequently
occurs before modification of the fatty acid carboxyl group, and can take place before or
after chain shortening or elongation. Initial functionalization reactions include desaturation
and hydroxylation. Subsequent reactions can introduce further functional groups or modify
the one originally introduced. Examples include further desaturations or hydroxylations,
epoxidation of double bonds and oxidation of alcohol to carbonyl functionalities.
Desaturation, hydroxylation and hydroxy group oxidation are applicable to honey bee
mandibular acid biosynthesis and will be discussed further.
Desaturation
Desaturation of fatty acyl CoAYs is a common motif in the biosynthesis of many
moth pheromones. It can occur at different positions, the 9' (Ag), 1 1 4 ~ 1 1 ) and 13' (A13)
being frequently encountered. For example, a A9 desaturase converts (Z) 1 1-tetradecenoic
acid to (Z)9,(Z)ll-tetradecadienoic acid in S. littoralis (Martinez et al. 1990); A1 1
desaturases are found in T. ni and A. velutinana (Bjostad et al. 1987); A13 desaturase
activity has been recently discovered in T. pityocampa as part of the biosynthetic pathway
of (Z) 13-hexadecen- 1 1-ynyl acetate (Arsequell et al. 1990).
Wolf and Roelofs (1986) studied the A1 1 desaturase in T. ni in detail. The activity
was only found in the pheromone gland and, like other desaturases, was associated with the
rnicrosomal fraction. The substrates were the CoA esters of hexa- and octadecanoic acid, \
and NADH was required as a cofactor. Only the Z isomer Af the A1 1 alkenoic acids was
produced. The desaturase activity peaked at the same age at which pheromone production
is known to be highest, thus confirming the unique role of this enzyme in pheromone
production.
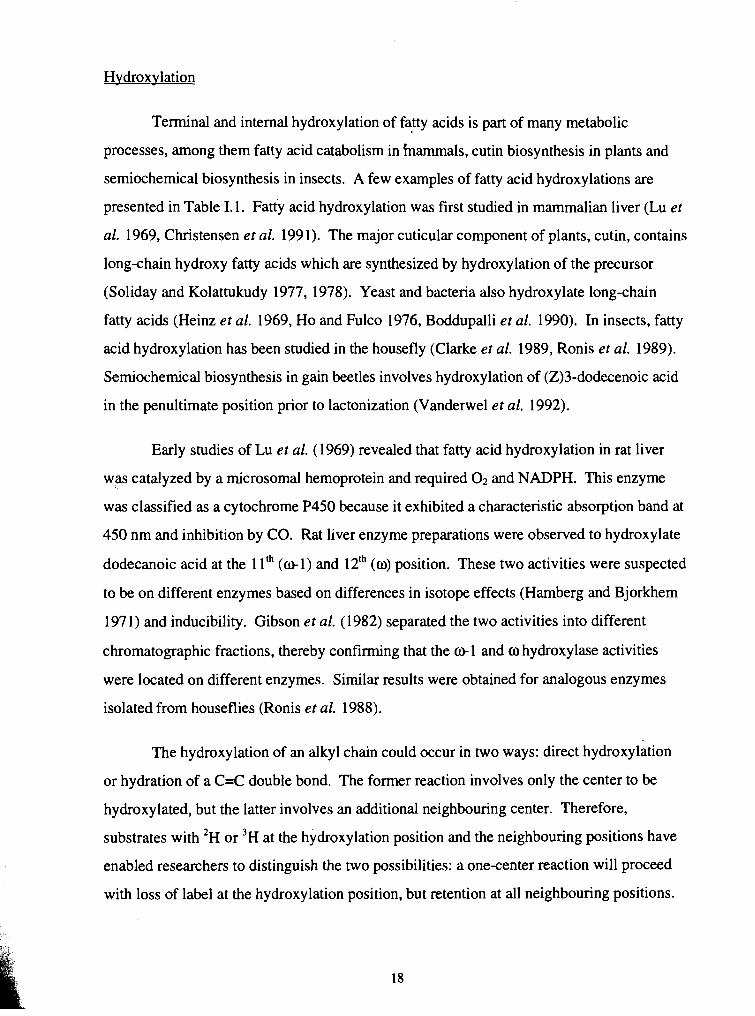
Hvdroxylation
Terminal and internal hydroxylation of fatty acids is part of many metabolic
processes, among them fatty acid catabolism in fnamrnals, cutin biosynthesis in plants and
semiochemical biosynthesis in insects. A few examples of fatty acid hydroxylations are
presented in Table I. 1. Fatty acid hydroxylation was first studied in mammalian liver (Lu et
al. 1969, Christensen et al. 1991). The major cuticular component of plants, cutin, contains
long-chain hydroxy fatty acids which are synthesized by hydroxylation of the precursor
(Soliday and Kolattukudy 1977, 1978). Yeast and bacteria also hydroxylate long-chain
fatty acids (Heinz et al. 1969, Ho and Fulco 1976, Boddupalli et al. 1990). In insects, fatty
acid hydroxylation has been studied in the housefly (Clarke et al. 1989, Ronis et al. 1989).
Semiochemical biosynthesis in gain beetles involves hydroxylation of (Z)3-dodecenoic acid
in the penultimate position prior to lactonization (Vanderwel et al. 1992).
Early studies of Lu et al. (1969) revealed that fatty acid hydroxylation in rat liver
w-as catalyzed by a rnicrosomal hemoprotein and required O2 and NADPH. This enzyme
was classified as a cytochrome P450 because it exhibited a characteristic absorption band at
450 nm and inhibition by CO. Rat liver enzyme preparations were observed to hydroxylate
dodecanoic acid at the 1 1' ( o l ) and 12' (o) position. These two activities were suspected
to be on different enzymes based on differences in isotope effects (Harnberg and Bjorkhem
197 1) and inducibility. Gibson et al. (1982) separated the two activities into different
chromatographic fractions, thereby confirming that the o 1 and o hydroxylase activities
were located on different enzymes. Similar results were obtained for analogous enzymes
isolated from houseflies (Ronis et al. 1988).
The hydroxylation of an alkyl chain could occur in two ways: direct hydroxylation
or hydration of a C=C double bond. The former reaction involves only the center to be
hydroxylated, but the latter involves an additional neighbouring center. Therefore,
substrates with 2~ or 3~ at the hydroxylation position and the neighbouring positions have
enabled researchers to distinguish the two possibilities: a one-center reaction will proceed
with loss of label at the hydroxylation position, but retention at all neighbouring positions.
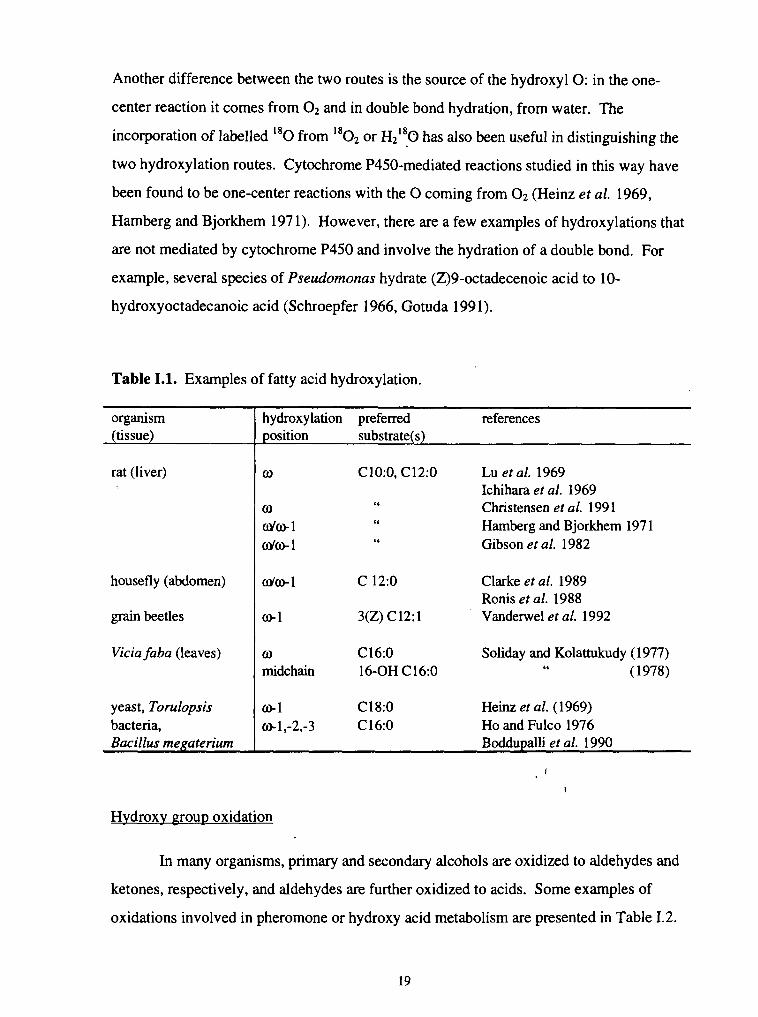
Another difference between the two routes is the source of the hydroxyl 0 : in the one-
center reaction it comes from 0 2 and in double bond hydration, from water. The
incorporation of labelled 180 from 1 8 0 2 or ~ 2 % has also been useful in distinguishing the
two hydroxylation routes. Cytochrome P450-mediated reactions studied in this way have
been found to be one-center reactions with the 0 coming from 0 2 (Heinz et al. 1969,
Hamberg and Bjorkhem 197 1). However, there are a few examples of hydroxylations that
are not mediated by cytochrome P450 and involve the hydration of a double bond. For
example, several species of Pseudomonas hydrate (Z)9-octadecenoic acid to 10-
hydroxyoctadecanoic acid (Schroepfer 1966, Gotuda 199 1).
Table 1.1. Examples of fatty acid hydroxylation.
organism (tissue)
rat (liver)
housefly (abdomen)
grain beetles
Vicia faba (leaves)
yeast, Tomlopsis bacteria, Bacillus megaterium
hydroxylation preferred references position substrate(s)
o ClO:O, C12:O Lu et al. 1969 Ichihara et al. 1969
0 I' Christensen et al. 199 1
d w l '6 Hamberg and Bjorkhem 197 1 cir'w-1 66 Gibson et al. 1982
w'w-1 C 12:O Clarke et al. 1989 Ronis et al. 1988
01 3(Z) C12: 1 Vanderwel et al. 1992
o C16:O Soliday and Kolattukudy (1977) midchain 16-OH C16:O 66 (1978)
01 C18:O Heinz et al. (1969) 01 ,-2,-3 C16:O Ho and Fulco 1976
Boddupalli et al. 1990
Hvdroxv group oxidation
In many organisms, primary and secondary alcohols are oxidized to aldehydes and
ketones, respectively, and aldehydes are further oxidized to acids. Some examples of
oxidations involved in pheromone or hydroxy acid metabolism are presented in Table 1.2.

Table I. 2. Examples of enzymatic alcohol and aldehyde oxidations.
--
organism (tissue)
C. fumiferana (pheromone gland)
rat (liver)
horse (liver)
potato (tuber)
C. fumiferana (cuticular epithelium)
H. virescens (cuticular epithelium)
" (antennae)
-- - -
type of activity substrate , product reference
alcohol oxidase
alcohol deh ydrogenase
aldehyde deh ydrogenase
'6
(Z) 1 1 tetradecen- l-ol
rnisc. C 8- C 16 aldehydes
aldehyde
17-keto C18:O
C l8:O diacid
C l6:O diacid
acid
acids
Morse and Meighen 1984
Bjorkhem and Hamberg 197 1
Bjorkhem et al. 1973.
Agrawal and Kolattukudy 1978b
Morse and Meighen, 1984
Tasayco and Prestwich, 1990
aldehyde oxidase (Z)9-tetradecenal acid
Two types of enzyme that use different electron acceptors are responsible for the
oxidation of alcohols and aldehydes: oxidases (which require Oz) and dehydrogenases
(which require NAD' or NADP'). For example, an alcohol oxidase found in the pheromone
glands of females of C. fumiferana oxidizes (Z) 1 1 -tetradecen- l-ol to the aldehyde (Morse
and Meighen 1984). The antennae of males of H. virescens contain an aldehyde oxidase
which oxidizes the sex pheromone, (Z)9-tetradecenal, to the corresponding acid to prevent
desensitization of the antennae (Tasayco and Prestwich 1990). Dehydrogenases from rat
and horse liver oxidize long-chain o 1- and ohydroxy acids to the corresponding keto- and
diacids (Bjorkhem and Hamberg 197 1, Bjorkhem et al. 1973). Potatoes contain
dehydrogenases that oxidize 16-hydroxyhexadecanoic acid to the corresponding 0x0 acid
and further to the diacid (Agrawal and Kolattukudy 1978 a,b).
2.4 Specificity in pheromone blends
Many pheromones are blends with a major and several minor components in a
precise ratio. These compounds are often synergistic in their effect, which makes the
composition of a pheromone important for optimal activity. For example, QMC elicits
highest retinue responses when all the components are present in the correct ratio (Slessor
et al. 1988, Karninsky et al. 1990). The specificity of a semiochemical blend arises because
each step in the biosynthetic pathway has an inherent degree of substrate and product
flexibility, thus allowing for a distribution of substrates to be used and a number of products
to be formed. A single pathway can therefore give rise to a blend with one major
component, resulting from the major substrate and product preference at each step, and
some minor components. For example, pheromone biosynthesis in T. ni starts with chain
shortening of octadecanoic acid, mostly by one round, but minor products from two and
three rounds are observed. (Z) A1 1 desaturation occurs on 12- to 18-carbon substrates, 16
being the preferred length. The products of the desaturase are further chain shortened by
one or, more frequently, two rounds of P-oxidation. Because carboxyl group modification
is non-specific in this species (Jurenka and Roelofs 1989, 1993), the preceding desaturation
and chain shortening determine the specificity of the pheromone blend which features (Z)7-
dodecenyl acetate as the major component and Z(5)-dodecenyl acetate, their 14-carbon
homologs and 1 1-dodecenyl acetate as minor components.
The composition of a semiochemical often changes during an insect's ontogeny.
Females of M. dornestica produce a sex pheromone comprised of mostly (Z)9-tricosene,
some cis 9,lO-epoxytricosane and (Z)14 tricosen-10-one. Newly emerged females and
males produce mainly (Z)9-heptacosene, and as females mature the proportion of this
alkene decreases and the proportion of (Z)9-tricosene, the epoxide and the ketone increase.
The 23- and 27-carbon alkenes are produced from (Z)9-octadecenoic acid by 3 and 5

rounds of chain elongation, respectively, followed by reduction and decarbonylation. (Z)9-
Tricosene is further oxidized to the ketone or the epoxide. Only females produce'(Z)9-
tricosene, the sex-specific step being the release of (Z) 15-tetracosenoyl CoA from further I
elongation. This release is stimulated by 20-hydroxyecdysone which also controls ovary
development, thereby linking sex pheromone production to ovary maturation (Blomquist et
al. 1993).
2.5 Objectives of this work
The first objective of this work was to find the fatty acid precursor(s) to the
mandibular acids and to determine whether the bees are able to synthesize the mandibular
acids de novo from acetate. The lipid-bound fatty acids from mandibular glands also were
analyzed to determine whether biosynthesis proceeds via a lipid-bound intermediate.
The next objective was to screen these compounds for interconversion, because the
major and minor components in the mandibular blends are structurally related. For
example, the keto- and diacids could be derived from the corresponding hydroxy acids by
oxidation. The saturated and (E)2-unsaturated hydroxy acids could be derived from each
other. Finally, the possibility that o and ol-hydroxy acids interconvert also was
investigated.
The final targets were to determine the order of steps in the biosynthetic pathway
and the route of o and ol-hydroxylation. This knowledge gave some insight into how the
caste-specific blends in queens and workers arise and at which points in the pathway the
control over caste-specificity resides.

Chapter 11: Materials and Methods
I
11.1. Sources of deuterated compounds
1.1 Purchaseddonated chemicals
Terminal D3 octadecanoic acid (D3 C 18:O) was purchased from MSD Isotopes,
D3 hexadecanoic acid (D3 C16:O) was a gift from Dr. R. cushleyl and 7,7,8,8-D4 decanoic
acid (D4 C10:O) was synthesized by Dr. S. in^'. The D3 C18:O was 96 % pure (by GC)
and contained 0.8 % unlabelled, 0.3 % Dl, 0.4 % D2, 94 % D3 and 4.9 % D4 (calculated
from M- 15 ion in the mass spectrum (EI) of the TMS derivative). The D3 C16:O was 98 %
pure (by GC) and contained 1.6 % D2, 93 % D3 and 5.6 % D4. The D4 C10:O was 97 %
pure by GC and contained 0.1 % unlabelled, 4.6 % D2, 19 % D3, 71 % D4 and 5.5 % Ds.
Mr. A. ~ i m ' provided 1-13c acetate, and 2-fluorooctadecanoic acid (2-F C18:O) was a gift
from Dr. J. E. 01iver2 (Oliver et al. 1994).
1.2 Chromatographic methods and determination of deuterium content
The purity of products was determined by gas chromatography (GC) on a Hewlett-
Packard (HP) 5890 instrument equipped with a 30 m DB-1 fused-silica column (0.25 rnrn
I. D., 0.25 pm film thickness) a flame ionization detector (FID) and a HP 3390A integrator.
The gas chromatograph was run in the splitless mode and was programmed 100OC (1 min),
10•‹/min to 185 (4 min), 3"Imin to 200 (0 min), 25OImin to 260 (20 min), flow 40 rnLJmin,
head pressure 125 kPa. Fatty acids were converted to the trimethylsilyl (TMS) derivatives
by reaction with bis-trimethylsilyl trifluoroacetamide (BSTFA) (Sigma) according to Slessor
et al. 1990. The silylation mixture was diluted with hexane, and an aliquot was injected on
the GC. GC-mass spectrometry (MS) was performed on a Varian Saturn Ion trap
1 Dept. of Chemistry, S. F. U. 2 USDA, ARS Beltsville Agriculture Research Center, Beltsville, MD.

instrument coupled to a Varian 3400 GC with a 30 m DB-5 fused-silica column (0.25 mm I.
D., 0.25 pm film thickness) programmed 100•‹C (1 min), 10•‹/min to 180 (7 rnin), 25OImin to
240 (18.2 min), flow 20 d r n i n , head pressure 105 kPa. Mass spectra were recorded with
the automatic gain control (AGC) on, at 70 eV in the electron impact (EI) mode, with an
ionization current of 10 PA. Most spectra were scanned from 70 - 350 amu. Chemical
ionization (CI) spectra were obtained on a HP 5985B GC-MS instrument with isobutane as
ionization gas.
NMR spectra were recorded on a 400 MHz Brucker instrument. Splitting patterns
are described as singlet (s), doublet (d), triplet (t), multiplet (m) where the splitting was not
resolved and "b" when peaks were broadened. Splitting constants are given in Hertz (Hz).
IR spectra were recorded on a Perkin Elmer instrument. Intensity of IR absorptions are
described as strong (s), medium (m), weak (w) and broad (b). Melting points were
determined on a Fisher-Johns melting point apparatus and were not corrected.
Whenever possible, deuterium content was determined from 'H NMR spectra by
monitoring the disappearance of the appropriate signal. The signal due to residual 'H at the
site of interest was integrated relative to an isolated reference signal from the same
compound and compared to an unlabelled standard. For example, when octanal was
deuterated (Scheme 2), the signal at 2.41 ppm decreased from 2 in the unlabelled material
to 0.14 H, the reference signal for integration being the aldehyde H at 9.76 ppm. The
proportion of deuterium at the a position was (2-0.14)/2 = 0.93. Deuterium content was
also estimated from the MS. Again, it was necessary to have an unlabelled standard in
order to correct for natural isotope abundance according to Biemann (1962).
1.3 Synthesis of deuterated compounds
Five methods were used for the introduction of deuterium: 1) reduction of carbonyl
groups with NaBD4,2) exchange of protons a to an aldehyde carbonyl with D2O and
pyridine, 3) deprotonation of a terminal alkyne followed by quenching with D20,4) partial

or complete catalytic reduction of alkynes with D2 and 5) solvomercuration of terminal
alkenes followed by demercuration with NaBD4. The extent of deuteration was monitored
by GC-MS and 'H NMR. In some cases, 2~ NMR was used to confirm the deuteration
pattern.
Solvents usec i for synthesis were reagent grade; solvents used for analytical work
were HPLC grade.' Tetrahydrofuran (THF) was distilled over LiAII& prior to use;
dimethylformarnide (DMF) and hexamethylphosphorarnide (HMPA) were distilled over
CaHz and stored over molecular sieves (3 A). Pyridine (BDH) was stored over NaOH
pellets. Dimethyl sulphoxide (DMSO) was distilled before use. In general, reactions were
worked up by extraction of an aqueous mixture with diethyl ether (3X). The extract was
washed with brine and dried over anhydrous Na2S04. Reactions that required anhydrous,
air-free conditions were performed in flame-dried glassware under Ar.
Reactions were monitored by thin-layer chromatography (TLC) which was
performed on 0.25 rnrn thick films of silica gel (Merck, Kieselgel60G) on glass plates.
Acidic TLC plates were prepared with aqueous 2% H3PO4 instead of water. Acidic silica
gel for the purification of free fatty acids was prepared by suspending one part of silica
(Merck Kieselgel60,230-400 mesh) in two parts of aqueous 2% H3P04, leaving the silica
to settle, decanting the supernatant and drying the slurry in an oven at 100 OC. Acidic
FloridR (60-100 mesh) was prepared the same way as acidic silica gel.
12-Dl octadecanoic acid (Dl C18:O)
This compound was synthesized from methyl 12-hydroxyoctadecanoate by the route
outlined in Scheme 1.

d O M e 10 - PCC , A O M 10
Scheme 1. Synthesis of 12-Dl octadecanoic acid (Dl C18:O)
Oxidation of methvl 12-hvdroxvoctadecanoate (1) to methvl 12-ketooctadecanoate (2)
The methyl ester 1 (Sigma, 1.00 g, 3.18 mmol) was added in small portions to a
well-stirred suspension of pyridinium chlorochromate (PCC, Aldrich, 1.03 g, 4.77 mmol) in
CH2C12 (50 rnL) at room temperature (procedure of Corey and Schmidt, 1979). The
initially orange suspension went brown soon after the addition and was left stirring at room
temperature. After 2 h, ether (100 mL) was added, and the resulting solution filtered
through a column of HorisilR (40 g) with some silica gel (5 g) on top. The black residue
that remained in the reaction vessel was rinsed with ether (100 mL), and this solution was
also filtered through the column. After evaporation of the solvent, 0.90 g of 2, a white
solid, m. p. 43-44 "C, was obtained in 91 % yield. The material was 100 % pure (GC). IR
(KBr): 2920 (s); 2849 (s); 1736 (s); 1704 (s); 1460 (m); 1209 (s) cm-l. 'H NMR (in
CDC13): 6 0.87 (3 H, t, J17,18= 7 HZ, 18-H); 1.26 (27 H, m, 4-9-, 15-17-H); 1.59 (10 H, m,
2, 10 and 14-H); 2.30 (2.3 H, t, J2,3= 7 HZ, 2-H); 2.37 (4 H, tb JloSll= J13.14= 7 HZ, 11, 13-
H); 3.66 (3 H, s, CH3). MS (EI): d e (relative abundance) 3 14 (4.6); 3 13 (18.1); 3 12

(85.6); 152 (88.9); 135 (63.8); 128 (McLafferty, 43.5); 113 (83.8); 112 (100); 85 (93.7); 83
(97.8); 81 (79.3); 71 (86.0). The ions due to McLafferty rearrangement confirm'that the
keto group is in the 12 position (Biemann 19621. I
Reduction of 2 to methyl octadecanoate (3) and hydrol~sis of 3
p-Tolylsulphonhydrazine (Sigma, 132 mg, 0.43 mmol) and 2 were mixed in
methanol and the solution was heated to 80•‹C for 2 h, after which the mixture was cooled
to 50•‹C and NaBD, (Aldrich, 13.4 mg, 0.32 mrnol) was added. Two h after the addition of
NaBD,, the apparatus was cooled to room temperature and the reaction quenched with cold
water. The reaction mixture was neutralized with 10% HC1 and extracted with ethyl acetate
(3 X 50 m . ) . The extract was washed with brine and dried over Na,,SO,. The crude
product had 10% of the desired product 3, along with 52% of unreacted 2, as well as 44%
of methyl 12-hydroxy-octadecanoate which probably formed in a competing NaBD,
reduction of the keto group. Chromatography on a column of silica gel (30 g) with
hexane:ether (lo: 1) afforded 6 mg of 3 in 4.8 % yield. The GC retention time of 3 matched
that of a commercial methyl octadecanoate standard.
Methyl octadecanoate 3 from two rounds of reduction (8.5 mg, ca. 0.03 mmol) was
hydrolyzed with 5% NaOH to give 8.5 mg of 4. Purification on a column of acidic silica gel
(1 g, in a Pasteur pipette) with hexane afforded a white solid, m. p. 66-70 OC (commercial
standard, Anachemia, 68-70•‹C), that was 93 % pure by GC (TMS derivative). MS (EI) of
the TMS derivative, mle (relative abundance): 358 (5.1); 357 (W, 19); 356 (3.4); 343 (28);
342 (M-15, 100); 341 (20) 129 (8); 117 (45); 75 (42); 73 (42). MS (CI) of the TMS
derivative, mle: 361 (1.5); 360 (6.8); 359 (29); 358 (M+l, 100); 357 (22). 2~ NMR (in
CHC13): 6 1.30 (sb). The material was 83 % Dl, as judged by MS (CI), which is consistent
with the value obtained from the M- 15 fragment in the EI spectrum (84 % Dl).
For comparison, the MS (EI) of the TMS derivative of an unlabeled standard was obtained:
m/e (relative abundance) 357 (4.6); 356 (M", 13); 355 (0.5); 343 (8.2); 342 (22); 341 (M-
15,82); 340 (2.1); 129 (38); 117 (84); 75 (45); 73 (56).

4,4-D2 (E)2-decenoic acid (D2 C10:l)
I
This compound was synthesized by condensation of octanal and
trimethylphosphonoacetate. Deuterium was introduced by exchange of the protons a to the
carbonyl group in octanal (Scheme 2).
Oxidation of 1 -octanol(51
1 -0ctano1 (5, Aldrich, 2.09 g, 16 mmol) was oxidized with PCC (6.92 g, 32 rnrnol)
by the same procedure as described in Scheme 1, which gave 1.56 g of octanal(6), a
colorless oil that was 100% pure by GC. IR: 2928 (s); 2857 (s); 171 1 (s); 1465 (m); 1274
(w) cm". 'H NMR (in CDC13): 6 0.90 (8 H, t J ~ J = 8 Hz, 8-H); 1.25 (22 H, m, 4-7-H);
1.61 (5 H, m, 3-H); 2.41 (2 H, t J2,3= 10 HZ, 2-H); 9.76 (1 H, t JlV2< 5 HZ, 1-H). MS (EI):
m/e (relative intensity) 129 (0.3); 128 (M", 0.7); 110 (1.3); 109 (1.2); 44 (1 1); 40 (100).
Deuteration of octanal(6)
Two rounds of deuteration were carried out, starting with 0.584 g (4.5 rnmol) of 6
and 10 mL of D,O/pyridine (I: 1, vlv). In both rounds, the mixture was heated to 100•‹C for
3 h, then cooled to room temperature. Once cool, cold tap water was added to the mixture
and the product extracted with pentane (2 X 50 mL). The combined pentane extract was
washed with water (2 X 5 rnL), then with brine and dried over Na$O,. Purification on a
column of silica gel (300 g) with hexane:ether (5: 1) afforded 0.142 g of a colorless oil 7
(100 % pure by GC) in 24 % yield. 'H NMR (in CDC13): 6 0.90 (3.7 H, t J7,8 = 8 HZ, 8-H);
1.25 (12 H, m, 4-7-H); 1.6 1 (3 H, m, 3-H); 2.41 (0.14, m, residual 2-H); 9.76 (1 H, s, 1 -H).
MS(E1): m/e (relative intensity) 130 (M", 0.3); 112 (0.5); 11 1 (1.2); 46 (19); 41 (100). As
calculated from the 'H NMR, 93 % of the a protons had exchanged with D.
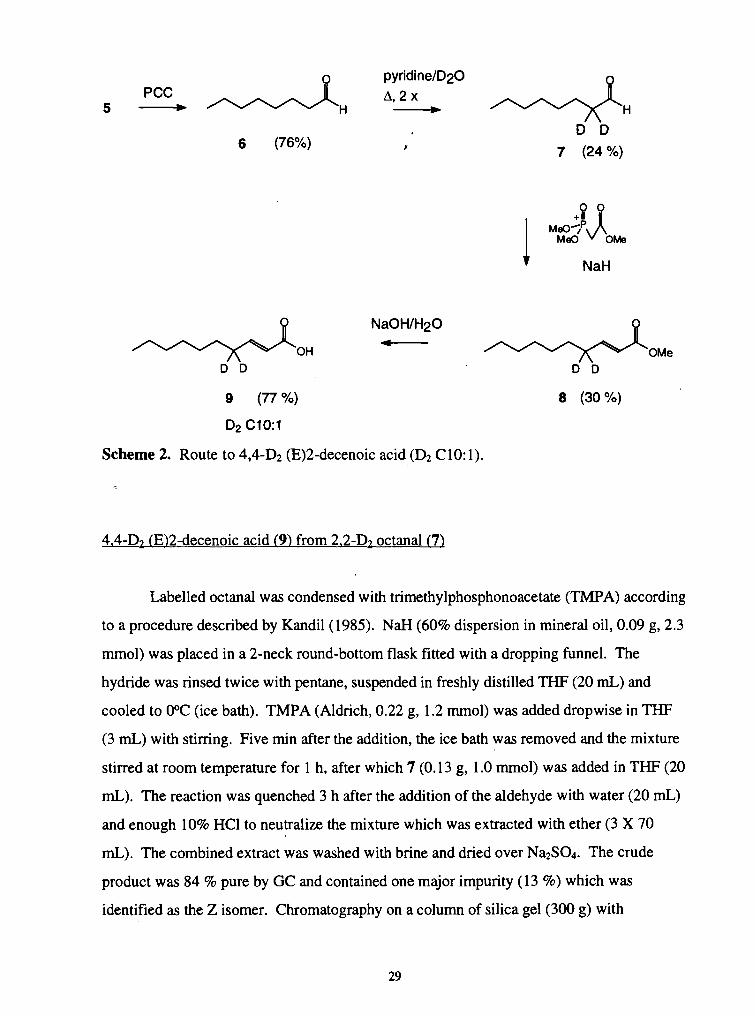
t NaH
9 (77%) 8 (30 %)
DP C10:l
Scheme 2. Route to 4,4432 (E)2-decenoic acid (D2 C10: 1).
4.4-D? (E)2-decenoic acid (9) from 2.2-D2 octanal(7)
Labelled octanal was condensed with trimethylphosphonoacetate (TMPA) according
to a procedure described by Kandil(1985). NaH (60% dispersion in mineral oil, 0.09 g, 2.3
mmol) was placed in a 2-neck round-bottom flask fitted with a dropping funnel. The
hydride was rinsed twice with pentane, suspended in freshly distilled THF (20 rnL) and
cooled to O•‹C (ice bath). TMPA (Aldrich, 0.22 g, 1.2 mmol) was added dropwise in THF
(3 mL) with stirring. Five min after the addition, the ice bath was removed and the mixture
stirred at room temperature for 1 h, after which 7 (0.13 g, 1.0 mmol) was added in THF (20
mL). The reaction was quenched 3 h after the addition of the aldehyde with water (20 mL)
and enough 10% HCl to neutralize the mixture which was extracted with ether (3 X 70
mL). The combined extract was washed with brine and dried over Na2S04. The crude
product was 84 % pure by GC and contained one major impurity (13 %) which was
identified as the Z isomer. Chromatography on a column of silica gel (300 g) with
hexane:ether 5: 1 gave 56 mg of 8, a colorless oil, in 30 % yield. The product contained 5%
of the Z isomer by GC. 'H NMR (in CDC13): 6 0.87 (4 H, t J9,10= 6Hz, 10-H), 1.26 (10.3 H,
m, 5-9-H ); 2.20 (0.1 1 H, m, residual 4-H); 3.71 '(3.5 H, s, CH3); 5.80 (1 H, d J2,3= 16 Hz, v
2-H); 6.97 (1 H, d J2,3=16 Hz, 3-H). MS (EI) : d e (relative abundance) 189 (1); 188 (M",
6); 187 (39); 155 (32); 154 (35); 125(26); 115 (28); 97 (38); 87 (100); 83 (53); 82 (42); 81
(53). The material was 93% enriched for 2 D in the allylic position, which is consistent with
the value obtained from the aldehyde intermediate.
An unlabelled standard of methyl (E)2-decenoate was synthesized by the same
procedure, starting with 0.55 g (4.3 mmol) of 6, in 42 % yield. IR: 2928 (s); 2856 (m);
1728 (s); 1658 (s); 127 1 (s); 1 175 (s) cm-' . 'H NMR (in CDC13): 6 0.87 (4 H, t J ~ J F 6 Hz,
10-H), 1.26 (1 1.3 H, m, 5-9-H ); 2.20 (2.3 H, d J3,4= 8 HZ, t J4,S= 4 HZ, 4-H); 3.7 1 (3.3 H,
S, CH3); 5.80 (1 H, d J2,3= 16 HZ, 2-H); 6.97 (1 H, d J2,3= 16 HZ, t J3,4= 8 HZ, 3-H). MS
(EI): rnle (relative abundance) 187 (2.0); 186 (M+',3.9); 185 (27); 153 (24); 152 (25);
123(25); 113 (35); 96(3 1); 87(100); 81 (66).
The Z isomer eluted from the column before the E isomer, and the unlabelled
material was isolated for identification. IR: 2926 (s); 2856 (m); 1728 (s); 1646 (m); 1170
(s). The 'H NMR resonances for the vinylic protons were 6 5.75 (1 H, d J2.3 = 10 HZ, 2-H);
6.21 (1 H, d J2,3= 10 HZ, t J3,4= 6 HZ, 3-H).
A methanol solution of 8 (6.5 mg, 0.03 mmol) was added to 5% aqueous NaOH and
stirred at room temperature overnight. Acidification and extraction with ether gave 4.6 mg
of pure 9, a colorless oil, in 77 % yield. MS (EI) of the TMS derivative: d e (relative
abundance) 245 (0.6); 244 (M", 2.5); 229 (M- 15,46); 139 (0.6); 13 1 (27); 129 (28); 1 17
(52); 83 (10) 75 (66); 73 (100).
An unlabelled standard was synthesized. MS (EI) of the TMS derivative: d e
(relative abundance) 243 (2.3); 242 (M", 0.7); 227 (M-15, 100); 152 (3.4); 137 (4.7); 129
(44); 117 (5.2); 81 (10); 75 (49); 73 (29).
17,18,18-D3 17-octadecenoic acid (Dj ~ 1 8 : l A") and 17,17,18,18,18-D5 octadecanoic
acid (D5 C18:O) I
These compounds were synthesized via 17-octadecyn- 1-01, as outlined in Scheme 3.
Deuterium was introduced by exchange of the acetylenic hydrogen and by catalytic
deuteration. I thank Ms. P. zhang3 for helping with the synthesis of DS C18:O and D3
C 18: 1 A".
1,lO-Decanediol (Aldrich, 5.03 g, 29 rnrnol) was reacted for 24 h with 40 % HBr
(20 mL) under continuous extraction with heptane. The crude product was recovered from
the heptane phase and was purified by chromatography on silica gel with hexane:ether (1 : 1)
to give 4.08 g of pure product (97 % by GC) in 60 % yield. IR: 3333 (sb); 2922 (s); 2850
(s); 1464 (s); 1372 (m); 1257 (s); 1057 (s); 722 (m); 646 (m) cm-I . MS (EI): mle (relative
abundance) 218 (M", 1.1); 191 (8.4); 189 (8.9); 178 (2.6); 176 (3.2); 163 (18.4); 161 (20);
I50 (22); 149 (61); 148 (74); 137 (39); 135 (40); 123 (3.2); 121 (4.2); 1 11 (13): 109 (23);
107 (13); 97 (61); 96 (16); 95 (27); 83 (100); 82 (33); 81 (45); 80 (6.3) 79 (12).
1-Octyne (10) and 11 were condensed according to the procedure of Hendry et al.
1975. A solution of 10 (CPL Inc., 1.16 g, 10.5 mrnol) in THF (20 mL) was mixed with
2.5 M butyl lithium (BuLi) in hexane (Sigma, 4.2 mL) at 0•‹C. The resulting yellow
Dept. of Chemistry, S. F. U.

\ D2, Pd, quinoline
Scheme 3. Synthesis of 17,17,18,18,l 8-D5 octadecanoic and l7,l8, 18-D3 17-octadecenoic
acids.
suspension was stirred for 1.5 h at O•‹C, after which a solution of 11 (1.00 g, 4.2 mmol) in
HMPA (15 mL) was added slowly. The temperature was kept at < 5 OC during the
addition. The mixture, which turned brown, was allowed to warm to room temperature and
was stirred overnight. After aqueous workup, 1.24 g of crude product was obtained.
Chromatography on a column of silica gel (300 g) with hexane:ether (1: 1) afforded 0.738 g
of pure product (94% by GC) in 66% yield. IR: 3348 (sb); 2926 (s); 2856 (s); 1942 (w);
1745 (w); 1466 (m); 1378 (m); 1 196 (w) cm-'. MS (EI) m/e (relative abundance) 206 (M-
60,0.5); 192 (1); 177 (1); 163 (2); 149 (3.2); 135 (9.5); 124 (18); 109 (25); 95 (68); 93
(24); 91 (13); 81 (100); 79 (44); 77 (13); 71 (7.6); 70 (7.4). MS(E1) of the TMS
derivative: m/e (relative abundance) 337 (0.2); 325 (0.3); 324 (2.9); 323 (M-15,9.8); 295
(2.4); 281 (1.1); 267 (1.8); 247 (4.8); 183 (5.6); 163 (6.7); 149 (12); 135 (17); 121 (20);
109 (26); 103 (13); 101 (8.7); 95 (47); 93 (21); 91 (1 1); 82 (29); 81 (64); 79 (28); 75 (100);
73 (45). 'H NMR (in CDC13): 6 0.90 (4.5 H, t J17,18 = 7 HZ, 18-H); 1.30 (26 H, m, 3-8 and
15-17-H); 1.53 (9 H, m, 9, 14, 2-H); 2.13 (4 H, tb J9,10 = J13,14 = 8 Hz, 10-,13-H); 3.63 (2
Hi t J1.2 = 6 HZ, 1-H).
Isomerization of 12 to 17-octadecvn- 1-01 (13)
Base-mediated isomerization of 12 was accomplished using the procedure of
Abrams (1982). NaH (60 % dispersion in mineral oil, 700 mg, 17.5 mmol) was rinsed with
pentane and mixed with diaminoethane (DAE, Fisher, 8 mL). Once the vigorous evolution
of HZ subsided, the mixture was heated to 80 "C. After 2 h, a solution of 12 (730 mg, 2.74
rnrnol) in DAE (8 mL) was added to the reagent at 80 OC. After addition, the mixture was
allowed to cool to room temperature and was stirred overnight. The reaction was quenched
with ice water, and the aqueous mixture acidified with 10 % HCl. Workup furnished
704 mg of crude 13 which was purified by chromatography with ether:hexane (1: 1). The
resulting product (137 mg, 19 % yield) was 93 % pure by GC. IR: 3285 (sharp peak due to
alkyne H-C superimposed on the broad OH band); 2918 (s); 2849 (m); 1736 (w); 1462 (m);
1364 (w); 1123 (w); 1060 (m). MS(E1) of the TMS derivative: m/e (relative abundance)
338 (M'., 0.5) 325 (1.6); 324 (6.3); 323 (M-15,26); 295 (2.1) 267 (2.0); 247 (4.2); 149
(4.2); 103 (7.9); 95 (10); 91 (3.5); 81 (15); 75 (100). 'H NMR: 6 1.26 (22 H, m, 3-14-H);
1.55 (9 H, m, 3- and 15-H); 1.94 (1 H, t J16,18= 3 HZ, 18-H); 2.18 (2 H, t J15,16= 8 HZ, d
J16,18= 3 Hz, 16-H); 2.38 (0.5 H, t J= 9 Hz, impurity); 3.64 (3.3 H, t J1.2= 8 HZ, 1-H + impurity).
Exchange of the acetylenic H of 13 with D
Two mL of 2.5 M BuLi (5 rnmol) in hexane were added to a solution of 13 (400
mg, 1.5 rnmol) in THF (5 mL). The mixture was stirred for 2 h, after which DzO (2 rnL)
was added. The mixture was extracted with hexane. After two rounds of deuteration by
the above procedure, material that was 83 % pure by GC (380 mg) was recovered. IR:
3314 (sb); 2919 (s); 2850 (m); 2584 (w); 2248 (w); 1654(wb); 1462 (m); 1378 (w); 1057 .
(m) cm". MS (EI) of the TMS derivative: m/e (relative abundance) 339 (M'., 0.4); 326
(1.5); 325 (5.2); 324 (M-15, 12); 323 (6.9); 149 (1.6); 103 (7.3); 95 (7.7); 91 (3.0); 82
(12); 75 (100). 'H NMR (in CDC13): 6 1.28 (28 H, m, 3-14-H); 1.57 (5.7, m, 2- and 15-H);
1.96 (0.2, sb, residual 18-H); 2.00 (0.9, m, impurity); 2.18 (1.1, t Jls,16= 8 Hz, 16 H); 3.64
(2 H, t J1,2= 8 HZ, 1-H). According to the 'H NMR, the material was 80 % Dl.
Catalytic deuteration of 14 to 17.18. 18-D3 17-octadecen-1-ol(15) and 17.17,18.18, 18-D5
octadecan- 1-01 (17)
The alkynol14 (100 mg, 0.37 mmol) was dissolved in hexane (50 rnL). Pd (5 %) on
CaC03 (Aldrich , 10 mg) and quinoline (Fisher, 0.5 mL) were added to the solution in a
filtering flask that was fitted with a pipette bulb and a septum. The flask was pressurized
with D2 and the mixture stirred for 2 h at room temperature. The crude product that was
obtained after filtration and washing of the filtrate with 10 % H2S04, contained unreacted
alkynol:alkenol3:2 (106 mg total). Purification on a column of silica gel (40 g) with
ether:hexane (1: 1) gave 39 mg of 15 (84 % by GC) in 39 % yield. IR 3346 (sb); 2922 (s);
2854 (s); 2244(w); 1582 (w); 1466 (s); 1378 (m); 1056 (sb) cm-I. MS (EI): mle (relative
abundance) 272 (4.0); 271 (M", 4.4); 270 (2.2); 269 (1.5); 252 (1.5); 168 (1.4); 167 (2.0);

153 (2.8); 152 (4.4); 15 1 (4.0); 139 (7.0); 138 (9.8); 137 (1 1); 125 (16); 124 (20); 123
(21); 11 1 (32); 110 (27); 109 (29); 97 (62); 96 (61); 95 (62); 83 (65); 82 (77); 81 (100).
MS (EI) of the TMS derivative: mle (relative abundance) 343 (W, 1.3); 342 (1.9); 341 I
(0.8); 333 (4.5); 332 (M-15 of over-reduced material, 7.3); 331 (2.5); 330 (1.1); 329 (3.4);
328 (M-15, 11); 327 (19); 326 (4.7); 325 (0.9); 299 (3.3); 298 (3.8); 297 (1.5); 296 (0.7);
185 (2.1); 149 (1.6); 143 (3.2); 129 (4.8); 11 1 (3.4); 103 (10); 95 (4.9); 91 (5.3); 89 (6.1);
81 (8.1); 75 (100). 'H NMR (in CDC13): 6 1.27 (29 H, m, 3-14-H); 1 S 6 (9 H, m, 2- and
15-H); 2.02 (2 H, t J15,16= 8.5 HZ, 16-H); 3.64 (2 H, t J1,z= 8 HZ, 1-H).
The alkynol14 (100 mg, 0.37 mmol) was deuterated by the same procedure as
described above, except that quinoline was omitted. After filtration, 148 mg of crude
product were recovered. Purification by chromatography as described above afforded 43
mg of 17 (88 % by GC) in 42 % yield. IR: 3376 (sb); 2925 (s); 2853 (s); 2251 (w); 2214
(w); 1464 (m); 1388 (s); 1056 (m) cm-'. MS (EI) of the TMS derivative: m/e (relative
abundance) 351 (0.5); 350 (1.6); 349 (4.1); 348 (8.0); 347 (M", 6.8); 346 (5.9); 345 (3.9);
344 (2.3); 343 (1.5); 342 (2.3); 336 (6.6); 335 (9.7); 334 (16); 333 (26); 332 (M-15 for D5,
44); 331 (23); 330 (1 1); 329 (3.9); 328 (2.6); 327 (M-15 for unlabelled, 6.8); 221 (7.4); 149
(27); 129 (1 1); 115 (12); 11 1 (19); 103 (33); 97 (33); 91 (26); 83 (30); 81 (13); 75 (100). 1 H NMR (in CDC13): 6 1.26 (27.5 H, m, 3-16); 1.58 (4.9 H, m, 2-H); 3.64 (2 H, t J1,~= 8
Hz, 1-H). From the MS it was apparent that a distribution of deuterated forms of the
octadecanol had formed. The distribution was centered around the Ds material as estimated
from the relative intensity of the corresponding M-15 ions: D9 (4.1 %); D8 (5.7 %); D7 (9.8
%); D6 (14 %); Ds (32 96); D4 (17 %); D3 (8.2 %); Dz (2.9 %); Dl (1.0 96); unlabelled
(5.4 %).
Oxidation of 15 and 17 to the corres~onding acids. 16 and 18
The D3 alken0115 (39 mg, 0.14 rnrnol) was oxidized, according to the procedure of
Corey and Schmidt (1979), with pyridinium dichromate (PDC, Aldrich, 194 mg, 0.52
rnrnol) in DMF (4 mL). The solution was stirred at room temperature overnight. Water (5

mL) and 10 % HCl (5 mL) were added to the solution, and the mixture was extracted with
ether (3 X). The ether extract was washed with 5 % HC1 until it was colorless. The extract
was dried over Na2S04. The crude product was purified on a 20 g column of acidic silica I
gel with ether:hexane (1: I), which afforded 38 mg of product (76 % pure by GC) in 94 %
yield. The impurities were identified as lower homologs by MS, and their proportion was
estimated by GC: 17-C (16 %), 16-C (3.8 %), 15-C (3.3 %) and 14-C (1.3 %). MS (EI) of
the TMS derivative of 16: m/e (relative abundance) 359 (2.6); 358 (7.1); 357 (M",3.6);
356 (1.4); 346 (3.5); 344 (5.4); 343 (19); 342 (M-15,60); 341 (13); 247 (3.4); 241 (2.6);
199 (10); 185 (1 1); 183 (6.6); 171 (6.4); 169 (3.5); 165 (2.8); 159 (3.5); 145 (17); 129
(63); 117 (99); 95 (21); 93 (8.5); 91 (4.0); 83 (18); 81 (25); 75 (90); 73 (100). The MS
revealed that a distribution of under- and overdeuterated forms, centered around the D3
material, had formed during the reduction: D6 (3.1 %), Ds (4.5 %), D4 (8.0 %), Dj (66 %),
D2 (14 %), Dl 3.9 %. 'H NMR (in CDC13): 6 1.27 (20 H, m, 4-14); 1.63 (4 H, m, 3- and
15-H); 2.20 (2 H, t J15,16= 7 HZ, 16-H); 2.34 (2 H, t JzS3= 8.5 HZ, 2-H). 2~ NMR (CHC13):
6 0.73 (0.15 D, sb, 18-D of over-reduced material); 1.29 (0.16 D, sb, -CD2- of over-
reduced material); 5.02 and 5.07 (2.1 D, sb not resolved, 18-D); 5.91 (1 D, sb, 17-D).
The Ds-octadecanol 17 (43 mg, 0.15 rnrnol) was oxidized as described above for 15.
After column purification, 39 mg of 18 (65 % by GC) were obtained in 87 % yield. The
impurities were the following lower homologs 17-C (15 %), 16-C (14 %), 15-C (4.3 %)
and 14-C (1.9 %). MS(E1) of the TMS derivative: m/e (relative abundance) 365 (0.6); 364
(1.6); 363 (4.5); 362 (8.7); 361 (13); 360 (7.7); 359 (3.0); 358 (0.7); 357 (0.6); 356 (1.1);
350 (2.5); 349 (4.5); 348 (9.5); 347 (18); 346 (36); 345 (15); 344 (4.2); 343 (1.4); 342
(1.2); 341 (3.0); 129 (46); 1 17 (100); 75 (61); 73 (74). MS(C1) of the TMS derivative:
m/e (relative abundance) 366 (6.8); 365 (12); 364 (25); 363 (54); 362 (M+1 for Ds, 100);
361 (51); 360 (19); 359 (12); 358 (19); 357 (M+1 for unlabelled, 14). Both mass spectra
confirm that the following distribution of over- and underdeuterated forms of 18 were
present: D9 (1.9 %), Ds (3.2 %), D7 (6.8 %), D6 (14 %), D5 (35 %), D4 (18 %), D3 (6.6 %),
D2 (3.3 %), Dl (6.2 %) and unlabelled (5.4 %). This is consistent with the values obtained
from 17. 'H NMR (in CDC13): 6 1.27 (18 H, m, 3-16-H); 1.62 (2.7 H, m, 3-H); 2.35 (2 H,

t J2,3= 8.5 Hz, 2-H). 'H NMR (CHC13): 6 0.87 (3-D, sb, 18-D); 1.28 (4-D, sb, 17-D and
additional D).
I
9,lO-D2 and 9,10,10-D3 9-decenoic acids (D2 and D3 C10:l A ~ )
These acids were synthesized via 9-decyn- 1-01 (Scheme 4).
THP derivative of 2-decyn-1-ol(21)
The THP-derivative of propynol19 (3.37 g, 24 mmol) and 1-bromoheptane 20
(Aldrich, 4.3 g, 24 mmol) were condensed by the same method used to synthesize 12 in
Scheme 3. After purification on a column of silica gel with hexane:ether (9: I), 2.23 g of
pure (94 % by GC) product was obtained in 39 % yield. IR: 2930 (s); 2875 (m); 2237 (w);
1466 (m); 1362 (m); 11 18 (s); 1025 (s) cm". MS(E1): m/e (relative abundance) 238 (W,
3.3); 195 (2.2); 180 (2.7); 167 (5.5); 153 (4.9); 137 (5.5); 125 (6.6); 111 (35); 101 (57); 95
(93); 85 (100); 81 (86); 79 (50). 'H NMR: 6 0.89 (5 H, t J 9 , ~ F 8 Hz, 10-H); 1.56 (22 H,
m, 2'-4'(THP) and 6-10-H); 2.20 (2 H, t J4,5= 8 HZ, t J1,4= 3 HZ, 4-H); 3.53 (1-H, m, 5'-H
(THP)); 3.84 (1 H, 5'-H (THP)); 4.15 (1 H, d 14 HZ, t 3 HZ, 1-H); 4.33 (1 H, d
Jl,l= 14 HZ, t J1,4= 3 HZ, 1-H); 4.81 (1 H, t J1*,2~= 5 HZ, 1'-H (THP)).
Removal of the THP group and isomerization of 22 to the terminal alkynol23
A solution of 21 (2.23 g; 9.3 rnrnol) in water:methanol: 10% HCl(1:1:1, total 30
mL) was refluxed at 60•‹C for 2 h. After workup 0.916 g of crude product was obtained.
This material was purified by column chromatography with ether:hexane (1: l), which
afforded 0.586 g of 22 (100 9% pure by GC) in 41 % yield. IR: 3329 (sb); 2930 (s); 2880
(s); 2288 (w); 2226 (w); 1475 (s); 1344 (m); 1137 (m); 1030 (s) cm-'. MS(E1) of the TMS
derivative: m/e (relative abundance) 2 13 (1.0); 2 12 (3.3); 21 1 (M-15, 15); 210 (2.2); 193
(3.3); 181 (16); 155 (9); 143 (12); 135 (11); 127 (13); 121 (7.7); 109 (6.6); 101 (7.7); 93
(14); 79 (16); 75 (100); 73 (56). 'H NMR: 6 0.87 (3.4 H, t J9,10= 8 Hz, 10-H); 1.31 (9.7 H,

BuLi
HMPA
21 X = THP (39%) 22 X = H (41 %)
1) BuLi - O D 2) D20
(92 %) 24 23 (53 O h )
I D2, Pd, quinoline
(62 O h ) 25 I 27 (76 %)
PDC
Scheme 4. Synthesis of 9,10, 10-D3 and 9, 10-D2 9-decenoic acids.
The isomerization of 22 (0.586 g, 3.8 rnmol) was accomplished the same way as the
isomerization of 12 (Scheme 3). After workup and purification by chromatography with
ether:hexane (1: I), 0.310 g of pure 23 (100 % by GC) was obtained in 53 % yield. IR:
3309 (sharp peak due to alkyne C-H superimposed on broad OH band); 293 1 (s); 2856 (m);

2361 (w); 21 17 (w); 1463 (m); 1363 (w); 1050 (s) cm-'. MS(E1) of the TMS derivative:
m/e (relative abundance) 226 (M", 0.4); 225 (0.8); 21 3 (1.6); 212 (2.3); 21 1 (M- l5,9.3);
210 (3.1); 193 (4.6); 181 (16); 155 (10); 143 (13); 135 (15); 127 (17); 109 (7.7); 95 (9.3); I
93 (10); 75 (100); 73 (60). 'H NMR (in CDC13): 6 1.34 (10 H, m, 3-6-H); 1.54 (4.6 H, m,
2- and 7-H); 1.93 (1 H, t J 8 . l ~ 3 Hz, 10-H); 2.18 (2 H, t J7,8= 7 HZ, d J8,10= 3 HZ, 8-H);
Exchange of the acetylenic H of 23 with D
The alkynol23 (0.3 10 g, 2.0 mmol) was treated with BuLi and D20 as described
before for compound 13 (Scheme 3). After workup, 0.286 g of pure (100 % by GC) 24
was recovered in 92 % yield. MS(E1) of the TMS derivative: m/e (relative abundance) 214
NMR 1.33 (5.4 H, m, 3-6-H); 1.55 (2.6 H, m, 2- and 7-H); 1.93 (0.08 H, t J8,'o= 3 Hz,
residual 10-H); 2.17 (2 H, t J7.8= 7 HZ, 8-H); 3.64 (2 H, t J1,2= 8 HZ, 1-H). This material
was 92 % enriched for 1 D, as calculated from the 'H NMR.
Deuteration of 23 to 9.10-D, 9-decen- 1-01 (27) and of 24 to 9.10. 10-D3 decen- 1-01 (25)
The unlabelled alkynol23 (288 mg, 1.87 mmol) was partially deuterated following
the same procedure as in Scheme 3. Column purification of the crude product afforded
224 mg of pure 27 (96 % by GC) in 76 % yield. MS(E1) of the TMS derivative: m/e
(relative abundance) 231 (0.9); 230 (M", 1.6); 229 (1 3) ; 228 (0.9); 217 (1.1); 216 (4.9);
215 (M-15, 16); 214 (6.6); 213 (1.6); 197 (3.8); 186 (2.7); 149 (6.6); 139 (2.7); 129 (3.3);
115 (3.8); 103 (9.9); 89 (6.0); 83 (8.2); 82 (9.3); 81 (7.7); 75 (100); 73 (26). 'H NMR: 6
1.30 (1 1.6 H, m, 3-6-H); 1.60 (7 H, m, 2- and 7-H); 2.03 (2 H, tb J7,*= 7 HZ, 8-H); 3.64 (2
H, tb J1,2= 9 Hz, l-H) 4.90 (0.2, m, residual 10-H); 4.96 (0.6 H, m, 10'-H); 5.80 (0.2, m,
residual 9-H). The 'H NMR revealed that this material was 80 % enriched with D in the 9-
f.. and 10-position and that there was some D in the 10' position. i

The labelled alkynol24 (255 mg, 1.66 mmol) was partially deuterated as described
above. The crude product was purified by chromatography on silica gel with ether:hexane
(1: I), which gave 162 mg of pure alkenol25 (92 % yield). MS(E1) of the TMS derivative:
m/e (relative abundance) 232 (0.8); 231 (M", 1.1); 218 (1.2); 217 (4.4); 216 (M-15, 16);
215 (3.3); 214 (1.1); 198 (4.3); 186 (2.3); 149 (1.3); 140 (3.3); 129 (2.7); 115 (3.2); 103
(8.8); 75 (100); 73 (26). 'H NMR (in CDC13): 6 1.31 (14.8 H, m, 3-6-H); 1.57 (4.3 H, m,
2- and 7-H); 2.04 (2 H, tb J7.8= 8 HZ, 8-H); 3.63 (2.4 H, tb J1,2= 8 HZ, 1-H); the residual
vinylic resonances were very small (not integrated).
Some unlabelled alkynol was partially hydrogenated to give an unlabelled standard
of 9-decen-1-01. MS(E1) of the TMS derivative: m/e (relative abundance) 229 (1.1) 228
(M+., 3.2); 227 (1.3); 215 (1.2); 214 (1.4); 213 (M-15, 18); 212 (2.2); 195 (1.1); 183 (1.6);
143 (9.3); 137 (4.9); 129 (16); 115 (6.6); 109 (10); 101 (13); 95 (27); 81 (37); 75 (100); 73
(47). 'H NMR (in CDC13): 6 1.32 (16 H, m, 3-6-H); 1.60 (13 H, m 2- and 7-H); 2.03 (2.4
H, tb J73= 7 HZ, d J9,8= 7 HZ, 8-H); 3.64 (2.4 H, t J1,2= 7 HZ, 1-H); 4.92 (1 H, d Jlo.,lo= 3
HZ, d J9,10= 12 HZ, 10-H); 4.99 (1 H, d Jlo,lo.= 3 HZ, db JsVlo.= 18 HZ, 10'-H); 5.81 (1 H, d
Jlo.,9= 18 HZ, d Jlo,9= 12 HZ, t J8,9= 7 HZ, 9-H).
Oxidation of the alkenols 25 and 27 to the corres~onding acids
The alkenols 25 (210 mg, 1.33 mmol) and 27 (200 mg, 1.28 rnmol) were oxidized
with PDC as described for the analogous oxidations in Scheme 3. The products were
purified on a column of acidic silica gel (50 g) with hexane:ether (2: 1) to give 26 (105 mg,
46 % yield) and 28 (122 mg, 67 % yield), respectively. For compound 26, MS(E1) of the
TMS derivative: m/e (relative abundance) 248 (1.9); 247 (2.7); 246 (7.9); 245 (M", 2.0);
232 (2.2); 231 (7.5); 230 (M-15,36); 229 (6.5); 228 (0.3); 185 (5.0); 155 (12); 129 (43);
117 (68); 96 (1 1); 75 (100); 73 (81). 2~ NMR (in CHC13): 6 0.93 (0.5 D, sb, -10-D of
over-reduced material); 1.34 (0.7 D, sb, -CD2- of over-reduced material); 5.10 (2.1 D, sb,
10-D); 5.93 (1 D, sb, 9-D). For compound 28, MS (EI) of the TMS derivative: rnle
(relative abundance) 246 (2.1); 245 (4.7); 244 (M+ ,2.8); 231 (2.0); 230 (6.5); 229 (20);
228 (13); 227 (3.1); 185 (4.1); 154 (5.6); 147 (2.1); 131 (14); 129 (38); 117 (61); 97 (3.6);

96 (8.8); 75 (100); 73 (82). 'H NMR (in CHC13): 6 0.90 (0.13 D, sb, 10-D of over-reduced
material); 1.32 (0.14 D, sb, -CD2- of over-reduced material); 5.03 (1.2 D, sb, 10-D); 5.90
(1 D, sb, 9-D). The M-15 fragment ion in the mass spectra of the TMS derivatives of I
compounds 26 and 28 was used to estimate the distribution of over- and underdeuterated
forms of these compounds. Compound 26 had 2.5 % D4, 90 % D3 and 7.9 % D2, and
compound 28 had 7.0 % D3, 55 % D2,33 % Dl and 6.0 % unlabelled.
The MS(E1) of the TMS derivative of an unlabelled standard of 9-decenoic acid
was: m/e (relative abundance) 243 (M+l, 2.0); 230 (0.8); 229 (2.2); 228 (5.5); 227 (M-15,
25); 226 (2.7); 199 (2.6); 185 (3.2); 147 (8.7); 129 (28); 117 (44); 93 (1 1); 75 (100); 73
(71).
4,4-D2 10-hydroxy-(E)2-decenoic acid (Dz 10-HDA) and 4,4-Dz(E)2-decenedioic acid
(Dz C10: 1 DA)
The synthesis of D2 10-HDA proceeded through THP-protected 8-hydroxy
octanal, as shown in Scheme 5.
8-bromo- 1 -octanol(30) and its THP derivative
1,8-octanediol (Aldrich, 10 g, 69 mmol) was treated with HBr, as described for the
analogous reaction in Scheme 3. After workup and purification by chromatography on
silica gel with hexane:ether (2: 1), 7.99 g of pure 30 (100 % by GC) was obtained in 56 %
yield. IR: 3349 (sb); 2929 (s); 2860 (m); 1464 (m); 1244 (s); 1054 (s) cm-'. MS (EI) of
the TMS derivative: m/e (relative abundance) 209 (0.3); 207 (0.3); 193 (0.4); 191 (0.3);
164 (5.5); 162 (5.9); 137 (4.7); 135 (5.3); 11 1 (5.6); 109 (5.9); 81 (1 1); 79 (3.9).
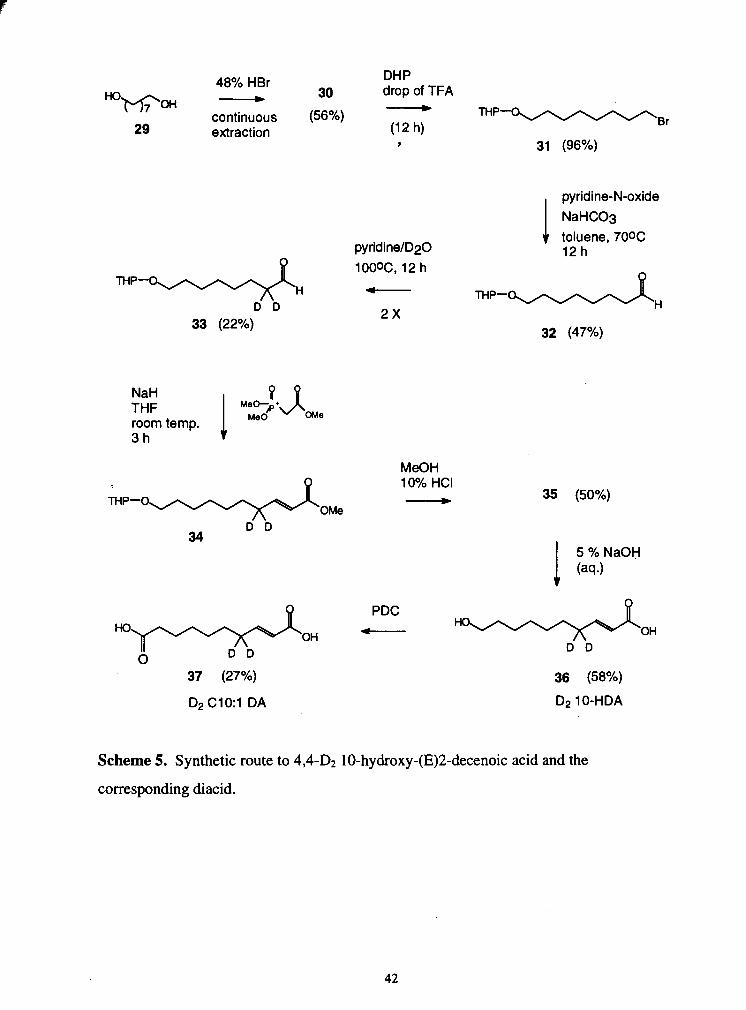
48% HBr DHP
HOw~ - 30 drop of TFA -
continuous (56%) 29
"-'p--Br extraction (12 h)
NaHC03 toluene, 70%
pyridinelD20 12 h 1 OOOC, 12 h
H MP- D D 2 X
33 (22%) d"
32 (47%)
NaH THF room temp. 3 h
MeOH 10% HCI -
OMe D D
34
I 5 % NaOH (aq.)
Scheme 5. Synthetic route to 4,4-D2 10-hydroxy-(E)2-decenoic acid and the
corresponding diacid.

8-Bromo-1-octanol (3.99g, 19.2 rnrnol) was mixed with dihydropyran (Aldrich, 3.22
g, 38.4 mmol) and a few drops of trifluoroacetic acid. The mixture was stirred at room
temperature overnight. After workup and purification of the crude product by I
chromatography on silica gel with hexane:ether (2: l), 5.38 g of pure 31 (100 % by GC) was
obtained in 96 % yield. IR: 2925 (s); 2856 (s); 1465 (m); 1366 (m); 1239 (sb); 1 120 (s);
1034 (s); 967 (m) cm-l. MS(E1): m/e (relative abundance) 252 (6); 250 (7); 163 (1 1); 161
(1 1); 83 (26).
Oxidation of 31 to the THP-derivative of 8-hydroxyoctanal(32) and deuteration of 32
The bromo group of 31 was converted to an aldehyde group using a buffered
pyridine-N-oxide reagent (Chiron, 1982). A mixture of 31 (5.38 g, 17.9 rnrnol), pyridine-
N-oxide (3.44 g, 35.9 mmol) and NaHC03 (3.77 g, 44.8 rnmol) in anhydrous toluene was
refluxed at 120 OC for 16 h. The crude material obtained after workup was purified by
chromatography on silica gel with hexane:ether (2: I), to give 1.91 g of pure product (100
% by GC) in 47 % yield. IR: 2934 (s); 2867 (s); 1726 (s); 1465 (m); 1352 (m); 1200 (w);
1122 (s); 1034 (s) cm". MS(E1): m/e (relative abundance) 227 (M-l,0.6); 137 (12); 135
(1.4); 109 (21); 85 (100); 44 (44). 'H NMR (in CDC13): 6 1.31 (12 H, m, 4-6-H, 3-H of
THP); 1.69 (20 H, m, 3- and 7-H, 2- and 4-H of THP); 2.32 (0.7, t J2,3 = 8 Hz, 2-H of acid
impurity); 2.40 (2.6 H, t J2,3= 10 HZ, d J1,2= 3 HZ, 2-H); 3.35 (1.7 H , d J8,8 = 10 HZ, t J7,8=
7.5 Hz, 8-H); 3.47 (1.7, m, 5'-H(THP)); 3.71 (1.7 H, d J8,8= 10 Hz, t J7,8= 7.5 Hz, 8-H);
3.83 (1.7, m, 5'-H(THP)); 4.55 (1.7 H, d J= 4 Hz, d J= 3 Hz, 1'-H(THP)); 9.72 (1 H, t
52.1~ 3 HZ).
The aldehyde 32 (1.55 g, 6.9 rnrnol) was treated twice with pyridine:D20 (1: 1, 10
rnL) as described before for octanal in Scheme 2. Purification of the crude product by
chromatography on silica gel with hexane:ether (2: 1) afforded 0.35 g of pure 33 (97 % by
GC) in 22 % yield. MS(E1): m/e (relative abundance) 229 (M-l,0.6); 139 (0.3); 137 (1.4);
1 1 1 (14); 85 (100); 46 (1 3). 'H NMR (in CDC13): 6 1.3 1 (12 H, m, 4-6-H, 3-H of THP);
1.69 (21 H, m, 3- and 7-H, 2'- and 4'-H of THP); 2.32 (0.13 H, m, 2-H of acid impurity);
2.40 (0.13, m, residual 2-H); 3.35 (1.6, d 58.8 = 10 HZ, t J7,8= 7 HZ, 8-H); 3.47 (1.7, m, 5'-

(1.7 H, d J= 4 Hz, d J= 2 Hz, 1'-H(THP)); 9.72 (1 H, s, 1-H). The material was 94 %
enriched for 2 D as estimated from the 'H NMR: I
10-hydroxy-(E12-decenoic acid (35)
The labelled aldehyde 33 (350 mg, 1.5 1 mmol) was condensed with TMPA (280
mg, 1.54 mmol) in the presence of NaH (120 mg, 60 % dispersion in mineral oil, 3.08
mmol), as described before for 8 in Scheme 2. The crude material obtained after workup
contained 80 % of 34 and one major impurity (12 %) which was identified as the Z isomer;
a second impurity (2%) had the same retention time as methyl 10-hydroxy-(E)2-decenoate
which was known from a previous study. The crude material was dissolved in methanol
(5 mL), water (20 mL) and 10% HCl(50 rnL) and stirred at room temperature overnight.
The crude methyl ester 35 obtained after workup was purified by chromatography on silica
gel with ether:hexane (1: I), which gave 150 mg of 35 in 50 % yield. The purified material
contained 92 % E and 7 % Z by GC. MS(E1) of the TMS derivative: mle (relative
abundance) 275 (3.7); 274 (M", 1.0); 262 (1.1); 261 (6.3); 260 (21); 259 (M-15, 100); 227
(36); 83 (26); 82 (39); 81 (22). 'H NMR (in CDC13): 6 1.30 (9 H, m, 6-8-H); 1.45 (2.5 H,
m, 5-H); 1.58 ( 5.2 H, m, 9-H); 2.20 (0.13 H, mb, 4-H); 3.62 (2.5 H, t JsVlo = 7 Hz, 10-H);
3.73 (3 H, S, -CH3); 5.77 (0.08 H, d J3,2(z)= 1 1 HZ, 2-H of Z); 5.8 1 (1 H, d J3,2(~) = 15 HZ, 2-
H of E); 6.22 (0.08 H, d J2,3(z) = 11 HZ, 3-H of Z); 6.96 (1 H, d 52.3 (E)= 15 HZ, 3-H of E).
The material was 94 % enriched for 2 D, as calculated from the 'H NMR.
For comparison, an unlabelled standard was synthesized the same way. MS(EI) of
the TMS derivative: mle (relative abundance) 273 (0.9); 272 (M", 0.7); 260 (0.7); 259
(5.4); 258 (19); 257 (M-15, 100); 256 (3.7); 225 (37); 81 (91). 'HNMR (in CDC13): 6
1.30 (9 H, m, 6-8-H); 1.45 (2.5 H, m, 5-H); 1.58 (6 H, m, 9-H); 2.20 (2 H, mb, 4-H); 3.62
(2.5 H, t J9,io = 7 Hz, 10-H); 3.73 (3 H, S, -CH3); 5.77 (0.06 H, db J3,2(z)= 1 1 Hz, 2-H of Z ) ;
5.81 (1 H, d J3,2(~) = 16 HZ, t J4,2= 2 HZ, 2-H of E); 6.22 (0.06 H, d J2,3(Z) = 11 HZ, t J4,3=
7Hz, 3-H of Z); 6.96 (1 H, d J2.3 (E)= 16 HZ, t J4,3= 7 HZ, 3-H of E).
The methyl ester 35 (123 mg, ca. 0.06 mmol) was hydrolyzed in 5% NaOH (30 rnL)
for 3 h at room temperature. After acidification with 10% HC1 and workup, 100 mg of
crude product (84 % pure by GC) were obtained., Purification on acidic silica gel with r
ether:hexane (1: 1) afforded 66 mg of pure (96 % by GC) product in 58 % yield. MS(E1) of
the TMS derivative: m/e (relative abundance) 334 (1.2); 333 (3.5); 332(W, 2.0); 320
(69); 83 (33). 2~ NMR (in CHC13): 6 2.26 (sb).
An unlabelled 10-HDA standard was also synthesized. The material was a white
solid m. p. 62-65 "C (lit. Chiron 1982,64-65 OC). MS(E1) of the TMS derivative: m/e
(relative abundance) 332 (2.8); 331 (10); 330 (M+', 3.1); 317(7.0); 316( 17.4); 3 15
(M-15,64); 314 (1.7); 299 (13); 243( 3.4); 225 (19); 149 (34); 147 (56); 81 (95). I3c NMR (in CDC13): 6 152 (3-C); 120 (2-C); 62.9 (10-C); 32.7; 32.2; 29.1; 29.0; 27.8; 25.6.
Oxidation of D? 10-HDA (36) to D? (E)2-decenedioic acid (37)
D2 10-HDA (6.5 mg, ca. 0.04 mmol) was oxidized with PDC to give the diacid 37.
The crude product was purified on acidic silica gel with hexane:ether 3: 1, which gave
1.9 mg of pure material in 27 % yield. MS(E1) of the TMS derivative: rn/e (relative
abundance) 347 (M+l, 3.7); 333 (3.3); 332 (7.3); 331(M-15,25); 330 (2.0); 287 (13); 257
(2.8); 256 (); 241 (3.1); 213 (15); 165 (31); 137 (33); 129 (16); 120 (36); 107 (12); 82 (13);
75 (92); 73 (100).
An unlabelled standard was prepared from 10-HDA. MS(E1) of the TMS
derivative: m/e (relative abundance) 345 (1.9); 344 ( W , 6.8); 331 (1.1); 330 (3.3); 329 (M-
15,30); 328 (3.0); 285 (15); 255 (3.8); 239 (3.0); 21 1 (13); 164 (34); 136 (41); 129 (15);
119 (51); 107 (15); 81 (18); 75 (100); 73 (81). 'H NMR (in CDC~~): 6 1.34 (5.7 H, m, 7-
and 6-H); 1.48 (2.9 H, m, 5-H); 1.65 (2.3 H, m, 8-H); 2.19 (2.4 H, d J3,4= 6 HZ, t J5,4= 6
HZ, 4-H); 2.35 (2 H, t J8,9 = 9 HZ, 9-H); 5.81 (1 H, d J3,2= 17 Hz, 2-H); 7.06 (1 H, d J2,3=
17 HZ, t J4,3= 6 HZ, 3-H).

4,4-D2 Phydroxy- and 9-keto -(E)2-decenoic acids (D2 PHDA and D2 ODA)
The key intermediate in the synthesis of D2 9 - @ ~ , the THP derivative of 7-
hydroxyoctanal, was synthesized by a Grignard coupling of propylene oxide and protected
5-chloro-1-pentanol, followed by THP protection of the 7-hydroxy group of the product
and oxidation to the aldehyde (Scheme 6). The rest of the synthesis was analogous to that
of D2 10-HDA.
Tetrahydropyran (30 g, 348 mmol), acetyl chloride (25 g, 3 18 mmol) and ZnC12 (5.0
g, 37 mrnol) were refluxed at 100 "C with vigorous stirring for 3.5 h. The reaction was
quenched with cold water (150 mL) and benzene (75 mL). The layers were separated, and
the benzene phase was washed with saturated NaHC03. The combined aqueous phase was
extracted with ether (3X). The organic extract was washed with brine and dried over
Na2S04. Flash evaporation of the solvent afforded 5 1.2 g of a yellow oil. The crude
product was distilled under vacuum (17 mrn Hg). The main fraction, a colorless oil,
distilled at 125 "C, and 45.5 g of pure 38 were collected (94 9% yield). MS(E1): rnle
(relative abundance) 149 (M-15,0.4); 135 (0.6); 104 (1.6); 94 (1.6); 80 (1.8); 78 (2.8); 76
(3.0); 69 (3.2); 55 (4.2); 50 (5.0); 44 (100); 43 (13).

38 BF3 I 39
(94 %) - (77 %) - MeOH , imidazole
I
2) Cul (cat.)
0
I PCC
D20 wp - 45 (64 %)
H pyridine D D
0 0 PCC -
OH
49 (56 %)
D2 ODA
Scheme 6. Synthesis of 4,4-D2 Phydroxy- and 9-keto-(E)Zdecenoic acids.

Conversion of 38 to the t-butyl dimethylsilyl derivative
To remove the acetyl group, 38 (5.3 g, 35 mmol) was dissolved in 10% BF3 r
(Aldrich) in methanol (100 rnL) and stirred overnight at room temperature. After workup,
5.1 g of a yellow oil was obtained. The crude material was purified by chromatography on
silica gel with ether:hexane (3:2), which gave 3.3 g of pure 39, a colorless oil, in 77 % yield.
MS(E1): m/e (relative abundance) 105 (3.3); 104 (M-18,6.5); 103 (13); 102 (4.3); 100
(2.2); 92 (6.0); 90 (18); 69 (1 1); 68 (53); 67 (100); 66 (18); 65 (6.5); 63 (6.0).
Imidazole (7.4 g, 109 mmol) and t-butyldimethylchlorosilane (Aldrich ,7.85 g, 52
mmol) were added to a solution of 39 from two lots (5.3 g, 43 mmol) in DMF. The
mixture was stirred at room temperature overnight. The crude product obtained after
workup was purified by chromatography on silica gel with hexane:ether (20: 1) to give
9.19 g of pure 40 (99 % by GC) in 89 % yield. I . : 2950 (s); 2862 (s); 1688 (w); 1468
(m); 1400 (s); 1250 (s); 1106 (s); 837 (s); 763 (s) cm-l. MS(E1): m/e (relative abundance)
234 (1.1); 200 (1.3); 178 (0.5); 124 (27); 123 (15); 122 (69); 121 (M-TBDMS, 11);
95 (28); 94 (7.6); 93 (68); 75 (46); 73 (35); 69 (100); 68 (82); 67 (50). 'H NMR (in
CDC13): 6 0.50 (6 H, s, Si-CH3); 0.90 (9.4 H, s, t-butyl-H); 1.52 (4.3 H, m, 3- and 4-H);
1.80 (2 H, tt JlT2 = 543 = 7 HZ, 5-H); 3.62 (2 H, t J1,2 = 7 HZ, 1-H).
The silylated chloropentanol40 was condensed with propylene oxide following a
procedure described by Kandil(1985). Crushed Mg turnings (2.50 g, 102 rnmol) were
added to a 3-neck flask. A portion of 40 (12.1 g, 50.9 mmol) in freshly distilled THF was
added, along with a drop of 1,1,2,2 tetrabromoethane and a crystal of 12. The mixture was
stirred vigorously at room temperature and, when the yellow color disappeared, the
remaining solution of 40 was added in small portions. The mixture was stirred at room
temperature for 1.5 h, after which it was cooled to -30•‹C. Once cool, CuI (0.97 g, 5.1
mmol) was added and the dark mixture was stirred at -30•‹C for 40 min before a solution of

propylene oxide (Aldrich, 2.90 g, 50.9 mmol) in THF was added. After the addition, the
mixture was warmed to 0•‹C and stirred at that temperature for 6 h. The reaction was
quenched with saturated NKCl(50 mL). The crude product obtained after workup was
purified by chromatography on silica gel with ether:hexane (1: 1) to give 9.71 g of 41 (92 %
by GC) in 73 % yield. IR: 3337 (sb); 2938 (s); 2876 (s); 1475 (m); 1400 (m); 1263 (s);
1088 (s); 843 (s); 775 (s) cm-'. 'H NMR (in CDC13): 6 0.04 (6 H, s, Si-CH3); 0.89 (1 1 H, s,
t-butyl-H); 1.19 (3.6 H, d 57.8 = 8.5 Hz, 8-H); 1.32 (7.8 H, m, 3-5-H); 1.43 (3 H, m, 6-H);
1 S O (2.6 H, m, 2-H); 3.6 (2 H, t J1.2 = 7 HZ, 1-H); 3.79 (1 H, m, 7-H).
Conversion of 41 to 7-tetrahydropyranyloxy-1-octanol(43)
Treatment of 41 (9.7 1 g, 37.3 mmol) with dihydropyran (9.41 g, 112 mmol) and a
drop of trifluoroacetic acid, followed by workup and purification on a column of silica gel
with ether:hexane (1: l), gave 13.9 g of 42, which showed two peaks 0.2 min apart in the
GC (47 and 49 %), in 70 % yield. IR: 2940 (s); 2875 (s); 2341 (w); 1744 (w); 1463 (m);
1383 (m); 1255 (m); 1088 (s); 1023 (s); 836 (s); 775 (s) cm-'. MS(E1): rn/e (relative
abundance) 3 14 (M-30,0.5); 237 (7.5); 215 (8.0); 159 (50); 137 (15); 1 1 1 (14); 85 (100);
75 (46) . The 'H NMR (in CDC13) had two sets of signals corresponding to diastereomers:
6 0.05 and 0.10 (6 H, s, -CH3); 0.88 and 0.91 (10.4 H, s, t-butyl); 1.09 and 1.18 (3 H, d
J7,8= 6 HZ, 8-H); 1.3 1 and 1.53 (17 H, m, 3-6-H and 2'-4'-H(THP)); 1.70 and 1.82 (2.2 H,
m, 2-H); 3.48 (2 H, m, 7-H); 2.58 (2 H, t J1,2= 9 HZ, 1-H); 3.73 and 3.88 (2 H, m, 5'-
H(THP)); 4.58 and 4.70 (1 H, m, 1'-H(THP)). The major impurity in the crude product
was identified as the di-THP derivative of 1,7-octanediol.
The material from the previous reaction 42 (13.8 g, 40.1 mmol) was stirred 1M
tetrabutylamrnonium fluoride in THF (Aldrich, 10 mL) at room temperature for 4 h. The
crude product was chromatographed on a 250 g column of silica gel with ether:hexane
(1: l), giving 7.15 g of 43, which displayed two peaks 0.2 min apart in the GC (49 and 51
%), in 78 % yield. IR: 3396 (sb); 2950 (s); 2875 (s); 1742 (m); 1454 (s); 1374 (s); 1259
(w); 1134 (s); 1050 (s) cm". 'H NMR (in CDC13): 6 1.09 and 1.20 (3 H, d 57.8 = 6.5 Hz, 8-
H); 1.35 and 1.52 (17 H, m, 2-6-H and 3'-4'-H(THP)); 1.70 and 1.85 (2.6 H, m, 2'-

H(THP)); 3.45 and 3.53 (2.6 H, tb 51.2 = 8 HZ, 1-H); 3.76 and 3.90 (2 H, m, 5'-H(THP));
4.62 and 4.53 (1 H, m, 1'-H(THP)).
I
Oxidation of 43 to the corresponding aldehyde (44) and deuteration of 44
The alcohol 43 (7.15 g, 3 1.1 mmol) was oxidized with PCC, and the crude product
was chromatographed on a column of silica gel with ether:hexane (1: 1) giving 5.00 g of 44
which displayed two peaks 0.2 min apart in the GC (49 and 49 %) in 70 % yield. IR: 2936
(s); 2880 (m); 1724 (s); 1454 (m); 11 19 (m); 1022 (s) cm-'. MS(E1): m/e (relative
abundance) 227 (M-1), 0.5); 213 (1.1); 159 (7.7); 137 (28); 127 (10); 109 (53); 101 (22);
85 (100). 'H NMR (in CDC13): 6 1.08 and 1.20 (3 H, d J7,8 = 7.5 Hz, 8-H); 1.35 (6 H, m,
4-5-H and 3'-H(THP)); 1.61 (1 1 H, m, 6- and 3-H and 2'- and 4'-H(THP)); 2.35 (0.2 H, t
52.3 = 10 HZ, 2-H of acid impurity); 2.42 (1.5 H, t JZv3 = 10 HZ, d J1,2 = 3 Hz, 2-H); 3.48
(1-H, m, 7-H); 3.74 and 3.90 (1.4 H, m, 5'-H(THP)); 4.64 (0.7 H, m, 1'-H(THP)); 9.73
(0.7 H, t 51.2 = 3 HZ, 1-H) .
The aldehyde 44 was subjected to two rounds of deuteration with pyridine (14 mL)
and D20 (10 mL). The crude product (a yellow oil) was purified by chromatography on
silica gel with ether:hexane (1: I), which afforded 3.20 g of 45 (96 % by GC, total of two
peaks) in 64 % yield. MS(E1): m/e (relative abundance) 229 (M- 1,0.5); 215 (1.0); 159
(3.3); 137 (1 1); 129 (13); 1 1 1 (59); 101 (23); 85 (100). 'H NMR (in CDC13): 6 108 and
1.20 (3 H, d J7,8 = 8 Hz, 8-H); 1.32 and 1.50 (13 H, m, 4-5-H and 3'-4'-H(THP)); 1.69 and
1.82 (2-H, m, 2'-H(THP)); 2.23 (0.1, mb, 2-H of acid impurity); 2.40 (0.06 H, mb, residual
2-H); 3.49 (1 H, m, 7-H); 3.72 and 3.88 (2 H, m, 5'-H(THP)); 4.65 (1 H, m, l'(THP));
9.75 (0.65 H, s, 1-H). As estimated from the 'H NMR, the material was 95 % D2.
4.4-D? 9-hvdroxy-(E)2-decenoic acid (48)
The aldehyde 45 (3.2 1 g, 13.9 mmol) was coupled with TMPA using the same
procedure as described for the analogous reaction in Scheme 2. After workup, 3.50 g of

crude product, which contained 80 % of the E and 14 % of the Z isomer, was obtained.
The two isomers were separated by chromatography on a column of silica gel (250 g) with
ether:hexane (1 : 1). The early-eluting fraction (0.14 g) contained mostly the Z isomer; the I
later-eluting one (2.88 g), mostly E. Because the second fraction still had 8 % of the Z
isomer (by GC), it was rechromatographed using hexane:ether (3:2), which gave 2.34 g of
pure 46 in 59 % yield.
Treatment of of 46 (2.34 g, 8.29 mmol) in THF (50 rnL) with 3% HCl (15 mL),
followed by chromatography on silica gel with ether:hexane (2: I), gave 1.66 g of methyl D2
9-HDA 47 (96 % pure by GC) in 100 % yield. 'H NMR (in CDC13): 6 1.18 (3.6 H, d Jsrlo =
8 Hz, 10-H); 1.47 (14.7 H, m, 5-8-H); 2.20 (0.12 H, mb, residual 4-H); 3.71 (3 H, s, -CH3);
3.79 (1 H, m, 9-H); 5.81 (1 H, d, J2,3 = 16 HZ, 2-H); 6.95 (1 H, d, 52.3 = 16 Hz, 3-H).
The methyl ester 47 (1.64 g, 8.11 mmol) was hydrolyzed with 1M NaOH (30 mL).
The resulting acid 48 was chromatographed on acidic silica with ether:hexane (3: I), giving
1.05 g of a colorless, very viscous oil (98 % pure by GC) in 69 % yield. MS(E1) of the
TMS derivative: m/e (relative abundance) 334 (1.9); 333 (4.5); 332 (M+', 1.4); 33 1 (1.0);
319 (3.2); 318 (7.2); 317 (M-15,27); 316 (3.1); 315 (0.1); 301 (10); 288 (22); 243 (12);
227 (1 1); 147 (34); 117 (77); 82 (27); 75 (64); 73 (100). 'H NMR (in CDCl3): 6 1.19 ( 4H,
d J9.10 = 7 Hz, 10-H); 1.38 (1 1 H, m, 5-8-H); 2.22 (0.14 H, m, residual 4-H); 3.80 (1 H, m,
9-H); 5.82 (1 H, d J2,3 = 16 HZ, 2-H); 7.06 (1 H, d J2.3 = 16 Hz, 3-H). 2~ NMR (in CHC13)
: 6 2.26 (sb). According to the 'H NMR the material was 93 % enriched for 2 D; the MS
indicated that the label was distributed as 90 % D2 and 10 % Dl.
An unlabelled 9-HDA standard was also synthesized. MS(EI) of the TMS
derivative: mle (relative abundance) 333 (1.8); 332 (3.8); 33 1 (14); 330 (M+, 1.2); 329
(2.7); 317 (3.9); 316 (10: 315 (M-15,37); 299 (13); 286 (24); 243 (9.3); 225 (7.5); 147
(23); 1 17 (71); 8 1 (44); 75 (63); 73 (100). 'H NMR (in CDCI3): 6 1.19 (4 H, d = 7 HZ,
10-H); 1.37 (10 H, m, 5-8-H); 2.24 (2 H, td(b) J4,5=J3,4 = 6.5 Hz, 4-H); 3.80 (1 H, m, 9-H);
5.82 (1 H, d(b) J2.3 = 16 HZ, 2-H); 7.06 (1 H, d 52.3 = 16 HZ, t J3,4 = 6.5 HZ, 3-H).

4.4-D7 9-keto-(E)2-decenoic acid (49)
A sample of D2 9-HDA (5 mg,0.02 mm$) was oxidized with PCC to give 2.8 mg of
D2 ODA 49 in 56 % yield. MS(E1) of the TMS derivative: m/e (relative abundance) 258
(M'., 6.3); 257 (2.7); 244 (3.2); 243 (M-15, 14); 242 (4.2); 225 (6.5); 215 (15); 201 (16);
185 (6.0); 167 (26); 156 (26); 144 (32); 125 (24); 109 (23); 96 (24); 82 (76); 81 (70); 75
(100); 73 (71).
The TMS derivative of unlabelled ODA (Phero Tech Inc.) gave the following MS
(EI): m/e (relative abundance) 256 (M", 5.5); 255 (1.9); 242 (2.9); 241 (M-15, 12); 223
(7.7); 213 (15); 199 (16); 183 (7.1); 166 (23); 155 (35); 142 (28); 123 (23); 108 (24); 95
(3 1); 8 1 (100); 75 (93); 73 (63).
9,9,10-D3, 9,9-D2 10-hydroxydecanoic acids (D3 and D2 10-HDAA) and 2,2-D2
decanedioic acid (C10:O DA)
These compounds were synthesized via 10-oxodecanoic acid which was deuterated
with D2Olpyridine (Scheme 7).
1 0-oxodecanoic acid (511
The terminal double bond of 10-undecenoic acid, 50, was cleaved with Nd04 and
Os04 according to the procedure of Graham and Williams (1966). 0 s04 (0.01 1 g, 0.045
mmol) was added to a solution of 50 (Matheson, 0.836 g, 4.5 mmol) in 15 mL of freshly
distilled (over Lid&) dioxane. The reaction mixture turned brown within 5 min. Nd04
(2.11 g, 9.8 mmol) was added in small portions over a period of 30 rnin, during which a
yellow precipitate formed. The mixture was stirred at 25 "C for 1.5 h, after which ether
(100 rnL) was added and the organic extract filtered through some Na2S04. The ether
extraction was repeated, and evaporation of the solvent from the combined extract afforded
0.905 g of a green oil. The crude product was redissolved in ether and filtered through

some FlorisilR, giving a yellow filtrate. The solution was concentrated and the product
recrystallized from ether:hexane 1: 1, giving 0.752 g of a white solid, m. p. 52-53 OC (lit. 56-
57 OC, Beilstein 3, III, 1269a), in 85 C yield. 11$: 3418 (s); 2934(s); 2825 (s) 1737 (s);
1700 (s); 1297 (s). MS(E1) of the TMS derivative: m/e (relative abundance) 259 (M+l, 3);
257 (1.5); 243 (M-15,6); 225 (15); 224 (1); 223 (0.5); 169 (6); 117 (44); 75 (100). 'H
NMR (in CDCl3): 6 1.30 (15 h, m, 4-7-H); 1.60 (7 H, m, 3- and 8-H); 2.35 (4 H, t JLV2 = 9
HZ, 2-H); 2.43 (2.8 H, t Js,9= 10Hzd J9,lo=3 HZ, 9-H); 9.78 (1 H, t J9,lo=3 Hz, 10-H).
Os04 (cat.) 0 - OH ~ a 1 0 4 (2eq.l OH
I PDC
6 55 (33 %)
DO C10:O DA
Scheme 7. Synthesis of 9,9,10-D3 and 9,9-D2 10-hydroxydecanoic acids and the
corresponding diacid.

Deuteration of 10-oxodecanoic acid
10-Oxodecanoic acid (203 mg, 1.09 mm$) was subjected to two rounds of
deuteration with pyridine:DzO (1: 1 ,6 mL), which gave 194 mg of crude product. This
material, which contained 20% of decanedioic acid (by GC), was chromatographed on
acidic silica gel with ether:hexane (1: I), giving 84 mg of pure 52, m. p. 48-49 "C, in 41 %
yield. MS(E1) of the TMS derivative: m/e (relative abundance) 261 (0.9); 260 (M+', 0.7);
259 (1.2); 245 (M-15, 1.9); 227 (9.4); 226 (5.2); 225 (2.8); 171 (3.4); 117 (40); 75 (100). 1 H NMR (in CDC13): 6 1.30 (9.8 H, m, 4-7-H); 1.60 (4.8 H, m, 3- and 8-H); 2.35 (2.5 H, t
J2,3= 10 HZ, 2-H); 2.43 (0.1 H, mb, residual 9-H); 9.78 (1 H, s, 10-H). The material was
95 % enriched for 2 D, as estimated from the 'H NMR.
9.9.10-D3 and 9.9-D2 10-hydroxydecanoic acids and 2.2-D7 decanedioic acid
D2 10-oxodecanoic acid, 52 (4.9 mg, 0.03 mmol), was added to a solution of
NaBD4 (1.1 mg, 0.03 mmol) in methanol. The mixture was stirred at room temperature for
3 h. Workup furnished 4.7 mg of pure (98 % by GC) D3 10-HDAA. MS(E1) of the TMS
derivative: m/e (relative abundance) 337 (1.5); 336 (M+l, 2.5); 334 (1.3);323(2.0); 322
(9.8) 321 (24.5); 320 (M-15, 86); 319 (4.9); 318 (2.0); 317 (6.0); 304 (40); 301 (2.5); 245
(2.7); 230 (20); 149 (40); 147 (33); 75 (82); 73 (100). 'H NMR (in CDC13): 6 1.29 (9 H,
m, 4-8-H); 1.57 (3.8 H, m, 3-H); 2.32 (2 H; t 52.3 = 8 Hz, 2-H); 3.65 (1 H, m, 10-H). The
material was 93 % D3, as determined from the M-15 fragment in the MS.
Reduction of 52 with NaB& gave D2 10-HDAA. MS(E1) of the TMS derivative:
m/e (relative abundance) 321 (6.7); 320 (17); 319 (66); 318 (12); 317 (1.2); 303 (42); 229
(27); 149 (41); 147 (41); 75 (91); 73 (100). The material was 92 % D2, 6.6 % Dl and
1.3 % unlabelled (calculated from the M- 15 fragment in the MS).
An unlabelled 10-HDAA standard was prepared from 51. M. p. 67-69 "C (lit.
72-73 "C, Beilstein 3, IV, 896). MS(E1) of the TMS derivative: m/e (relative abundance)
319 (6); 318 (15); 317 (67); 316 (7.7); 301 (44); 227 (28); 149 (37); 147 (33); 75 (85); 73

(100). 'H NMR (in CDC13): 6 1.29 (12 H, m, 4-8-H); 1.57 (6 H, m, 3-and 9-H); 2.32 (2 H,
t J2,3= 8 HZ, 2-H); 3.65 (2 H, t Jg,lo= 6 HZ, 10-H).
A sample of 52 (6.5 mg, 0.04 mmol) was treated with 44 mg (0.12 mmol) of PDC in I
DMF. Recrystallization of the crude product from ether:hexane (1: 1) afforded 2.3 mg of
pure Dz C10:O DA in 33 % yield. MS(EI) of the TMS derivative: mle (relative abundance)
349 (9.5); 348 (M'., 4.7); 333 (M-15, 100); 289 (3.8); 259 (1 1); 258 (3.1); 75 (55); 73 (75).
The TMS derivative of an unlabelled decanedioic acid standard (Eastman) had: mle (relative
abundance) 347 (4.4); 346 (1.3); 331 (M-15, 100); 287 (5.2); 257 (6); 75 (83); 73 (80).
9,10,10-D3 9-hydroxydecanoic acid (D3 9-HDAA) and 17,18,18-D3 17-
hydroxyoctadecanoic acid (D3 17-OH C18:O)
Conversion of terminal alkenoic acids to the corresponding o l hydroxy acids was
accomplished by solvomercurationldemercuration (Scheme 8).
The Markovnikov hydration of 28 was accomplished by the procedure of Brown
and Geoghegan (1967). Mercuric acetate (146 mg, 0.46 mmol) was dissolved in water (4
mL). Freshly distilled THF (0.5 mL) was added to the solution which turned into a bright
yellow suspension. A solution of the alkenoic acid 28 (62 mg, 0.37 mmol) in THF was
added to the suspension, and the mixture was stirred for 15 min, after which 3 M NaOH
(1.5 mL) was added. Two min later, a solution of NaBD4 (15 mg, 0.37 mmol) in 3 M
NaOH (1.5 rnL) was added. The mixture, which turned dark gray immediately, was stirred
for another 5 min. The Hg was settled by centrifugation of the reaction mixture at 800 rpm
for 30 min.

3M NaOH I D
2) NaBH4, b 3M NaOH
57 (91 %)
Scheme 8. Synthesis of 9,10,10-D3 9-hydroxydecanoic- and l7,l8,l 8-D3 17-
hydroxydecanoic acids.
The supernatant was acidified with 3 M HCl and extracted with ether (3 X) and the extract
was dried over Na2S04. The product was purified by chromatography on acidic silica (20
g) with hexane:ether (3: I), which gave 43 mg of D3 9-HDAA (93 % by GC) in 62 % yield.
'H NMR (in CDCl3): 6 1.15 (1 H, m, 10-H); 1.32 (8 H, m, 4-7-H); 1.43 (2 H, m, 8-H); 1.64
(2 H, tt J2,3 = 53.4 = 8 HZ, 3-H); 2.35 (2 H, t J2-3 = 8 Hz, 2-H); 3.79 (0.25 H, m, residual 9-
H). 2~ NMR (in CHC13): 6 1.17 (2 D, sb, 10-D); 3.75 (0.8 D, sb, 9-D). MS (EI) of the
TMS derivative: mle (relative abundance) 337 (1.8); 336 (5.2); 335 (M+ , 1.5); 334 (3.6);
333 (5.0); 323 (1.1); 322 (12); 321 (32); 320 (M-15,77); 319 (48); 318 (27); 317 (7.4);
304 (68); 288 (43); 246 969); 217 (27); 204 916); 156 (26); 149 (13); 147 914); 137 (33);
120 (100). The material was 2.7 % Ds, 7.8 % D4,48 % D3, 23 % D2, 15 % D1 and 3.1 %
unlabelled (calculated from the M-15 ion in the MS).

An unlabelled standard was also synthesized. MS(E1) of the TMS derivative: rnfe
(relative abundance) 332 (M", 1.5); 331 (1.5); 319 (2.6); 318 (1 1); 317 (M-15,37); 3 16
(6.6); 301 (35); 288 (20); 243 (26); 217 (21); 204 (13); 149 (12); 147 (8.9); 135 (17); 117
(1 00).
The alkenoic acid 16 (6 mg, 0.02 mmol) was converted to the 17-hydroxy acid 57 (2
mg), by the same procedure as outlined above4, in 30 % yield. The product was 75 % pure
by GC, the impurities being lower homologs: 17-C (1 1 %), 16-C (10 %), 15-C (3%) and
14-C (trace). 'H NMR (in CDC13): 6 1.13 (1 H, m, 18-H); 1.26 (26 H, m, 4-15-H); 1.60
(32 H, m, 3-, 16- and 18-H); 2.34 (2 H, t 52.3 = 8 HZ, 2-H); 3.55 (0.6 H, m, residual 17-H).
'H NMR (in CHC13): 6 1.17 (1.3 D, sb, 18-D); 3.78 (1 D, sb, 17-D). MS (EI) of the TMS
derivative5: m/e (relative abundance) 446 (M-l,0.2); 434 (3.3); 433 (8.3); 432 (M-15,22);
431 (5iO); 430 (7.9); 429 (1.1); 419 (1.5); 418 (5.7); 417 (14); 416 (38); 415 (5.6); 400
(25); 358 (1 1); 342 (1 1); 217 (27); 204 (28); 149 (7.7); 147 (7.1); 129 (16); 120 (100).
The M-15 ion in the MS revealed that the material was 6.0 % D4, 59 % D3, 7.0 % D2, 18 %
Dl and 10 % unlabelled.
7,7-D2 8-hydroxyoctanoic acid (D2 8-HOAA), 15,15-D2 16-hydroxyhexadecanoic acid
(D2 16-OH C16:O) and 18-Dl 18-hydroxyoctadecanoic acid (Dl 18-OH C18:O)
Unlabelled 8-HOAA and 18-OH C18:O were synthesized from the corresponding
diols as outlined in Scheme 9.
N a B b was used for demercuration. 5 Scanned from 90 - 450 arnu.
Acetylation of 1.8-octanediol and 1.18-octadecanediol
1,8-Octanediol(l0 g, 69 mmol) and watekglacial acetic acid:H2S04 (40050: 1,
100 mL) were warmed (60 "C) under continuous extraction with hexane (Babler and
Coghlan, 1979). After 1 day, the hexane extract was collected and the solvent, evaporated.
The crude product was purified by chromatography on silica gel with ether:hexane (2: I),
which afforded 6.37 g of monoacetate 59, a colorless oil, (100 % by GC) in 49 % yield. IR:
3453 (sb); 2932 (s); 2875 (m); 1740 (s); 1475 (m); 1375 (m); 1241 (s); 1037 (s). MS(E1)
of the TMS derivative: m/e (relative abundance) 261 (2.2); 260 (M", 1 1); 244 (2 1); 185 (7);
1 17 (73); 135 (16); 75 (100); 73 (87).
A solution of 1,18-octadecanediol (Karl Ind., 369 mg, 1.29 mmol) in pyridine (30
mL) was treated with acetic anhydride (145 mg, 1.42 mmol) at 100 OC for 1.5 h. The
mixture was worked up, and the crude product was purified by chromatography on silica
gel with ether:hexane (1: I), giving 133 mg of the monoacetate 60 (72 % by GC) in 31 %
yield. IR: 3386 (sb); 2925 (s); 2850 (m); 1727 (s); 1255 (s). MS(E1) of the TMS
derivative: rnle (relative abundance) 403 (3.3); 402 (1 1); 401 (34); 400 (M'., 2.1); 399
(2.3); 387 (8.3); 386 (25); 385 (M-15, 100); 384 (2.5); 325 (8.7); 250 (1 1).
Oxidation of the monoacetates 59 and 60 to the corres~onding. acetoxy acids and hydrolysis
to the hydroxy acids 63 and 65
The monoacetates 59 (2.02 g, 10.8 mmol) and 60 (133 mg, 0.41 mmol) were
oxidized with PDC in D m . The 8-acetoxyoctanoic acid 61 was separated from unreacted
diol by redissolving the crude material in saturated NaHC03:water (1: 1) and extracting the
aqueous mixture with ether. Acidification of the aqueous layer with 10% HCl and
extraction with ether, furnished 2.00 g of the acetoxy acid 61 (100% by GC) in 92 % yield.
IR: 3050 (sb); 2940 (s); 1744 (s); 1706 (s) 1388 (s); 1256 (sb); 1038 (s). MS (EI) of the
TMS derivative: m/e (relative abundance) 276 (4.8); 275 (15); 274 (I@, 86); 273 (5.6); 259
(M-15,57); 215 (18); 199 (32); 143 (17); 125 (36); 117 (100); 107 (14); 75 (88); 73 (83).
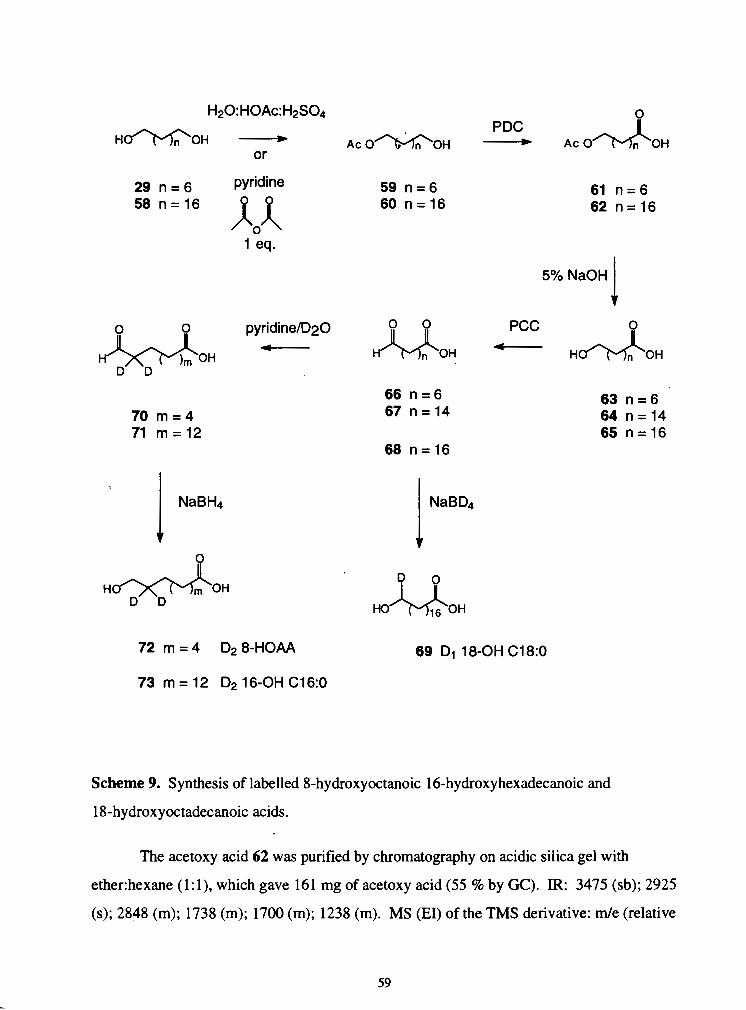
H20:HOAc:H2S04 PDC
H-OH - ACO-OH - A C O
29 n = 6 pyridine
58 n = 1 6 J A 1 eq.
5% NaOH I
Scheme 9. Synthesis of labelled 8-hydroxyoctanoic 16-hydroxyhexadecanoic and
1 8-h y drox yoctadecanoic acids.
The acetoxy acid 62 was purified by chromatography on acidic silica gel with
ether:hexane (1: I), which gave 161 mg of acetoxy acid (55 % by GC). IR: 3475 (sb); 2925
(s); 2848 (m); 1738 (m); 1700 (m); 1238 (m). MS (EI) of the TMS derivative: m/e (relative

abundance) 416 (2.4); 415 (7.8); 414 (M+., 1.3); 299 (M-15,g.g); 355 (23); 339 (100); 283
(7.7); 265 (14).
r
The acetoxy acid 61 (2.00 g, 9.9 rnrnol) was hydrolyzed with 3% NaOH. On
workup, 0.796 mg (51 % yield) of pure 8-HOAA (95 % by GC), m. p. 57-58 "C (lit.
61-63 "C, Weaver et al. 1968) was recovered. 'H NMR (in CDCl3): 6 1.33 (8.6 H, m, 4-6-
H); 1.59 (5.5 H, m, 3- and 7-H); 2.35 (2 H, t 52.3 = 7 HZ, 2-H); 3.65 (2 H, t J7,8 = 5 HZ, 8-
H). MS (EI) of the TMS derivative: m/e (relative abundance) 305 (35); 304 (M+, 3.4); 303
(3.0); 292 (1.2); 291 (9.1); 290 (21); 289 (M-15,97); 288 (2.9); 273 (58); 215 (23); 199
(28); 149 (30); 147 (33); 75 (94); 73 (100).
18-Acetoxyoctadecanoic acid 62 (161 mg, 55%, 0.26 rnrnol) was hydrolyzed with
3 % NaOH, and the product chromatographed on acidic silica with ether:hexane (1: I),
giving a total of 62 mg of hydroxy acid in 79 % yield. Two fractions were obtained from
chromatography. The first one (36 mg) contained 71 % 18-OH C18:O by GC, and the
impurities were lower homologs: 17-C (9.8 %), 16-C (10 %); 15-C (7.9 %) and 14-C (1.3
9%). The second fraction (26 mg) contained 63 % 18-OH C18:O and lower homologs: 17-C
(12 %), 16-C (17 %), 15-C (5.0 %) and 14-C (3.7 %). Analysis of the starting diol
revealed that it contained lower homologs. 'H NMR (in CDC13, fr. 1): 6 1.36 (32 H, m, 4-
16-H); 1.55 (3 H, m, 17 H); 1.64 (2 H, tt J2,3=J3,4 = 8 HZ, 3-H); 2.34 (2 H, t 52.3 = 8 HZ, 2-
H); 3.63 (2 H, t 517~8 = 6.5 Hz, 18-H). MS (EI) of the TMS derivative: rn/e (relative
abundance) 446 (1.4); 445 (3.2); 444 (M", 1.2); 432 (4.0); 43 1 (15); 430 (35); 429 (M- 15,
100); 428 (0.9); 413 (84); 354 (5.2); 339 (30); 217 (14); 204 (24).
Deuteration of 8-HOAA and 18-OH C 18:O via the corresponding 0x0-acids
Oxidation of 8-HOAA (1.19 g, 7.42 rnrnol) with PCC was carried out as described
before, except that the ether extract was filtered through acidic ~lorisil~lsilica. The product
was chromatographed on acidic silica with ether:hexane (2: I), which gave 0.329 g of

product (100 % by GC) in 28 % yield. 'H NMR (in CDC13): 6 1.34 (15.5 H, m, 4- and 5-
H); 1.64 (13 H, m, 3- and 6-H); 2.35 (7.7 H, t 52.3 = 6 HZ, 2-H + 2- and 7-H from diacid);
2.45 (3.2 H, t J6.7 = 8 HZ, d 17.8 = 2 HZ, 7-H); 4.05 (o$ H, t JrSs = 5 Hz, 8 H of hydrated
aldehyde); 9.75 (1 H, t J7,8 = 2 HZ, 8-H).
The 8-oxooctanoic acid 66 (321 mg, 2.3 mrnol) was deuterated twice with
D2Olpyridine as previously described. The crude product was chromatographed on acidic
silica with ether:hexane (2: l), which afforded 287 mg of product in 89 % yield. 'H NMR
(in CDC13): 6 1.34 (13 H, m, 4-5-H); 1.64 (8 H, m, 3- and 6-H); 2.35 (6 H, t J2,3 = 6 HZ, 2-
H); 2.45 (0.8 H, m, residual 7-H); 4.05 (0.5 H, t 57.8 = 5 HZ, 8-H of hydrated aldehyde);
9.75 (1 H, s, 8-H). This spectrum revealed that the 0x0 acid was 60 % labelled.
The deuterated 8-oxooctanoic acid (230 mg, 1.44 rnrnol) was reduced with N a B h
and the product was chromatographed on acidic silica with ether:hexane (1: I), which
afforded 61 mg of D2 8-HOAA (100 % by GC) in 26 % yield. 'H NMR (in CDC13): 1.33
(5.8 H, m, 4-6-H); 1.59 (2.6 H, m, 3- and residual 7-H); 2.35 (2 H, t J2,3 = 7 HZ, 2-H); 3.65
(2 H, m, 8-H). MS (EI) of the TMS derivative: m/e (relative abundance) 306 (M", 11); 305
(9.4); 294 (2.2); 293 (7.1); 292 (20); 291 (M-15,76); 290 (66); 289 (41); 275 (39); 274
(38); 273 (26); 217 (8); 201 (15); 149 (45); 147 (78); 75 (100); 73 (97). The MS revealed
that the 8-HOAA was 39 % D2, 35 % DI and 25 % unlabelled.
The 18-OH C 18:O (10.4 mg, 0.03 rnrnol), from fraction 1, was converted to the 0x0
acid (8.3 mg), as described before, in 80 % yield. MS (EI) of the TMS derivative: mle
(relative abundance) 370 (M'., 2.2); 355 (M-15, 100); 341 (19); 281 (39); 221 (40); 202
(80). The 0x0 acid 68 was reduced with NaBD4, and the product was purified on acidic
silica with hexane:ether 3: 1. This afforded 7 mg of Dl 18-OH C18:O (89 % by GC), m. p.
81-86 "C (lit. 99.3-99.5 "C, Beilstein 3, IV, 946), which was enriched for 18-OH C18:O but
still contained lower homologs: 17-C (8.0 %), 16-C (3.0 %), in 83 % yield. 'H NMR (in
c x l , ) : 6 1.26 (26 H, m, 4- 16-H); 1 S 6 (4.3 H, m, 17-H); 1.64 (4.3 H, m, 3-H); 2.35 (2 H,
t 52.3 = 8 HZ, 2-H); 3.63 (0.8 H, tb J17,18 = 7 HZ, 18-H). 2~ NMR (in CHC13): 6 3.65 (sb).
MS (EI) of the TMS derivative: m/e (relative abundance) 43 1 (26); ,430 (M- l5,gl); 429
(4.4); 414 (100); 355 (13); 340 (52); 281 (26); 265 (22); 217 (39); 204 (61). The material
was 96 % Dl, as calculated from the M-15 ion in the MS.
15.15-D? 16-hvdroxyhexadecanoic acid (D2 16-OH C l6:O)
16-Hydroxyhexadecanoic acid 64 (Aldrich, 2 19 mg, 0.80 rnrnol) was treated with
PCC, and the product was chromatographed on acidic silica with ether:hexane (I: 1). This
afforded 1 10 mg of the 0x0-acid 67 in 50 % yield. 'H NMR (in CDC13): 6 1.28 (58 H, m,
4-13-H), 1.61 (1 1 H, m, 3- and 14-H); 2.33 (6.5 H, t 52.3 = 10 HZ, 2-H, hydroxy- and diacid
2-H); 2.41 (2.5 H, tb J14,15 = 8 HZ, 15-H); 3.65 (0.5 H, t Jls,16 = 3 Hz, 16-H of hydroxy
acid); 9.75 (1 H, t Jls,16= Hz, 16-H). The NMR sample contained 70 % 0x0 acid, 15 %
hydroxy- and 15 % diacid by GC.
The 0x0 acid 67 (109 mg, 0.4 rnrnol) was subjected twice to deuteration with
D2O/pyridine, followed by two purifications on acidic silica with ether:hexane (1: 1) and
(3: 1). The product 68 (43 mg, 39 % yield) contained 84 % 0x0 acid, 14 % diacid and 2 %
hydroxy acid. 'H NMR (in CDC13): 6 1.26 (30.5 H, m, 4- 13-H); 1.6 1 (9.3 H, m, 3- and 14-
H); 2.32 (3 H, t 52.3 = 8 HZ, 2-H); 2.41 (1 H, tb J14,15 = 7 HZ, residual 15-H); 9.75 (1 H, sb,
16-H). The material was ca. 50 % labelled in the 15 position.
This 0x0 acid 68 was reduced with NaBh, giving 3 1 mg of pure (97 % by GC)
Dz 16-OH C16:O in 74 % yield. M. p. 92-95 "C, original 97-99 "C. 'H NMR (in CDC13): 6
1.28 (24.8 H, m, 4-14-H); 1 S 6 (6.6 H, m, 2- and residual 15 H); 2.35 (2 H, t 52.3 = 8 HZ, 2-
H); 3.63 (2 H, m, 16-H). MS (EI) of the TMS derivative: m/e (relative abundance) 419
(2.2); 418 (2.8); 417 (1.7); 405 (8.1); 404 (25); 403 (78); 402 (92); 401 (82); 387 (75); 386
(100); 385 (89); 3 13 (32); 312 (44); 3 11 (39); 217 (38);204 (55).
The TMS derivative of unlabelled 16-OH C16:O gave the following MS (EI): m/e
(relative abundance) 418 (1.4); 417 (3.9); 416 (M", 1.5); 405 (1.6); 404 (3.8); 403 (14);
402 (34); 401 (M-15, 100); 400 (1.0); 385 (86); 327 (4.9); 311 (33); 217 (18); 204 (24).

The labelled material was 23 % D2, 34 % Dl and 43 % unlabelled, as calculated from the
M-15 ion in the MS.
11.2. Treatment of the bees
The bees for this work were obtained from the S. F. U. apiculture group and were
from a North American strain of A. mellifera, most similar to A. m. ligustica. Young
workers were obtained by allowing bees to emerge from a brood comb in an incubator.
Newly emerged workers were kept in a cage with water, sugar syrup and pollen for one day
before an experiment. Queens were reared at S. F. u . ~ and, in the case of virgin queens,
were kept for one week after emergence in small cages in a queen bank. Mated queens
were ca. 1 year old, laying queens taken from their colonies during the summer.
Serniochemical biosynthesis has been studied in three ways: in vivo, by topical
applicatipn of labelled precursors onto the intact gland and in vitro. For instance, bark
beetle pheromone biosynthesis was studied in vivo by exposing the insects to vapors of
labelled volatile precursors (Vanderwel et al., 1992), while topical application onto the
pheromone gland was used in early studies of moth pheromone biosynthesis. Once the
biosynthetic pathways for moth pheromones were known, it was possible to isolate and
study individual enzymes from the pathway (Jurenka and Roelofs 1993). Early attempts in
our laboratory to study incorporation of deuterated fatty acids into worker mandibular
components in vivo failed because the fatty acids were probably metabolized in many other
tissues besides the mandibular gland and because the labelled fatty acids were diluted by the
endogenous ones. This approach was further complicated by a low survival rate of injected
or topically applied bees.
To avoid the above problems, the labelled compound to be tested was applied in
DMSO directly onto an intact mandibular gland. Freshly dissected glands were rinsed with
buffered saline (5 mM Tris, pH 7,0.02 % (wlv) MgC12, 0.02 % KCl, 0.02 % CaC12 and
- ---
6 I thank Mr. P. Laflarnrne, Mr. S. Mitchell and Ms. H. Higo for rearing queens.
63

0.9 9% NaCI), blotted with a piece of tissue and exposed to 0.5 pL of substrate solution
(generally 40 pg/pL). The gland was placed in an Eppendorf tube and perfused for 10-20
rnin, after which it was rinsed with saline, blotted and extracted with methanol (2 X 12 pL
for workers and 2 X 25 pL for queens). The methanol used for extraction contained 0.2
pg&L of 10-undecenoic acid as internal standard. Two 2 pL aliquots of the extract were
derivatized with 2 pL of BSFTA (Slessor et al. 1990). The samples were diluted with
hexane (30 pL) and one was analyzed by GC, the other by GC-MS.
The treatments were generally done in 6 - 10 replicates, with one gland per
replicate. Two types of control were included every time a new set of labelled compounds
was tested: DMSO blanks and substrate blanks. For the former, mandibular glands were
perfused with DMSO (0.5 pL) and extracted as described before. For the latter, 0.2 pL of
the solution of labelled substrate was diluted with methanol containing internal standard (20
pL). In the results, only the DMSO blanks are shown. The substrate blanks were used to
check the baseline at the retention times of interest in the GC-MS.
11.3. Analytical methods
3.1. Identification of compounds in the extracts
The compounds of interest in the extracts were identified by comparison of their GC
retention time and MS fragmentation pattern with synthetic standards. However, for some
compounds no synthetic standard was available. In such cases, the retention time was
predicted using the Kovats Index (K. I.) calculated from the K. I. of a homolog. Under
isothermal conditions, the retention times of the straight chain alkanes follow a logarithmic
pattern, and their K. I. is the number of carbons X 100. For all other compounds the K. I.
is calculated as follows:
K. I. = 100 x (CAI + log(tY/tAl) / log(tAZ/tAl))
where C is the number of carbons, t is the retention time, A1 and A2 are the straight chain
alkanes eluting before and after the compound of interest, Y (Rooney, 198 1). For a

homologous series, a one carbon increment in the chain length results in an increment of
100 in the K. I. Thus, as long as the retention time for one member of a series and for the
alkanes are known, it is possible to predict the retentiun time for any higher or lower
homolog. Even under non-isothermal conditions, this method gave good results. For
example, no standard for 12-hydroxy-(E)2-dodecenoic acid (12-OH C12: 1) was available.
The K. I. of its lower homolog, 10-HDA, was 1867 corresponding to a retention time of
12.7 min. The predicted K. I. of 12-OH C12: 1 was 2067 which gave a predicted retention
time of 15.8 min.
The MS fragmentation pattern was used to locate a compound in the vicinity of the
predicted retention time. Comparison of the mass spectra of synthetic standards revealed
that the high molecular weight fragment ions in the mass spectra were shifted by the
appropriate number of 28 mass unit increments within a series of even-numbered homologs.
This knowledge was used to predict MS fragmentation patterns of compounds for which
there was no standard. Furthermore, it was possible to distinguish o from isomeric ol
hydroxy acids by the fragmentation pattern. The former had intense M- 15 and M-3 1
fragments, while the latter had an additional M-44 fragment. Returning to the example, the
expected pattern for 12-OH C12: 1 was found at 15.7 min, which is in agreement with the
predicted retention time. The isomer, 1 1 -OH C 12: 1, came at 14.6 min (K. I. 1990) and had
the pattern of an o 1 hydroxy acid.
3.2. Quantitation of total material and incorporation of label
The compounds of interest were quantitated from the GC trace. However, some
minor components were not detected in the GC. Their quantity was estimated from the
M- 15 ion current across the GC peak in the GC-MS trace. The responses of the FID and
the GC-MS were calibrated with solutions of known concentration.
The percentage of labelled material found in treated samples was determined from
the M-15 fragment ion. This ion arises by loss of a methyl group from one of the

trimethylsilyl moieties in the parent ion and was chosen because it is much more intense
than the molecular ion and loss of label attached to the main chain is not possible in this
particular fragmentation reaction (Pierce 1968). Furthermore, this ion is not prone to
ionlmolecule reactions over a wide range of concentrations (0.2 - 20 ng of injected
material). This allowed the analysis of major and minor components, whose concentration
varied over two orders of magnitude, in a single run. Separate runs for the analysis of
major and minor components were only necessary in the case of mated queens, in which
variation between components can span four orders of magnitude.
To determine the percentage of labelled material, the ion currents for the M-15 and
M- 15+n (n = the number of D) fragments were recorded for each scan across the GC peak
without background subtraction, added, and the ratio
FR = Z(M- 1 S+n)/(C(M- 15) + X(M- 15+n))
was calculated. The FR value represents the fraction of the ion current due to an isotope
peak of ~e M- 15 fragment ion, relative to the total ion current of the fragment ion and the
isotope peak. To correct for the natural isotope abundance, the ratio (FR,,) for all
compounds of interest was calculated either from unlabelled standards or from extracts that
had been prepared for that purpose. The percentage of label in a sample was calculated
from a calibration line that had been prepared using mixtures of labelled and unlabelled
standards. The calibration lines did not change significantly between 0.2 and 20 ng of
injected material and for different compounds with the same labelling pattern (e. g., Figure
11.1). Thus, it was valid to use the line of a homolog or isomer in cases where pairs of
synthetic labelled and unlabelled standards were not available. A new set of calibration lines
was determined every time the instrument was tuned as FR values varied slightly with
tuning.
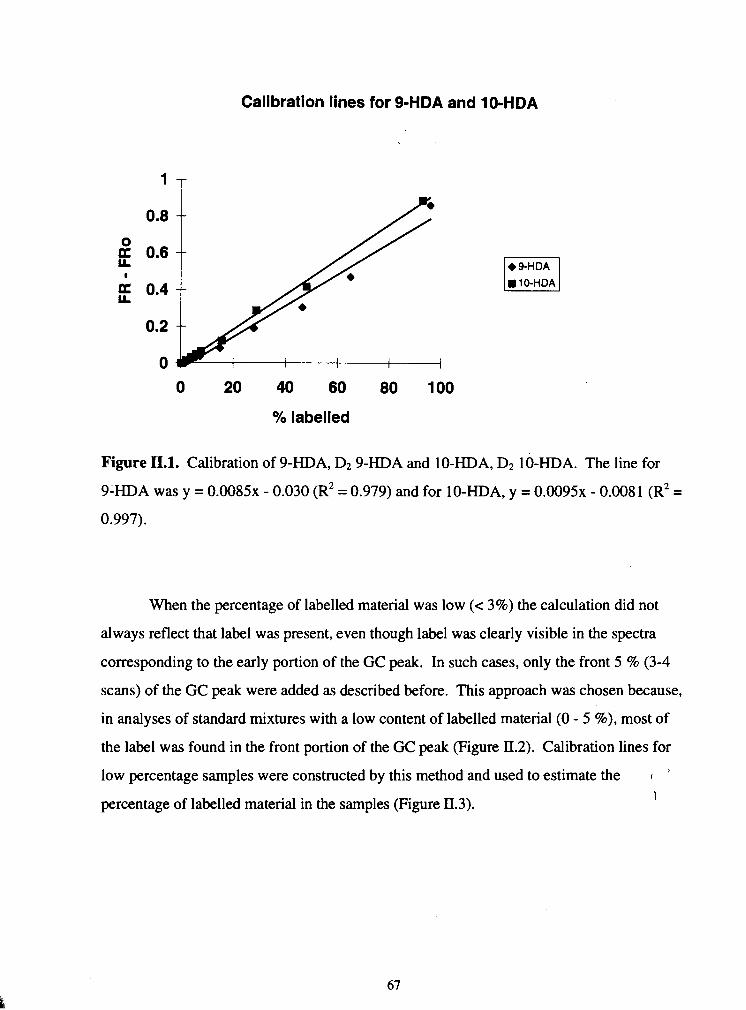
Calibration lines for 9-HDA and 10-HDA
0 20 40 60 80 100
% labelled
Figure II.1. Calibration of 9-HDA, D2 9-HDA and 10-HDA, D2 10-HDA. The line for
9-I-IDA was y = 0.0085~ - 0.030 (R2 = 0.979) and for 10-HDA, y = 0.0095~ - 0.0081 (R2 =
0.997).
When the percentage of labelled material was low (c 3%) the calculation did not
always reflect that label was present, even though label was clearly visible in the spectra
corresponding to the early portion of the GC peak. In such cases, only the front 5 % (3-4
scans) of the GC peak were added as described before. This approach was chosen because,
in analyses of standard mixtures with a low content of labelled material (0 - 5 %), most of
the label was found in the front portion of the GC peak (Figure II.2). Calibration lines for
low percentage samples were constructed by this method and used to estimate the I '
percentage of labelled material in the samples (Figure 11.3). I

Change in FR value across a GC peak
1 5 9 13 17
Scan
Figure 11.2. Change in the FR value across a GC peak of 10-HDA. The scaled area counts
and the proportion of the peak added up to a given scan are indicated with thin lines, the
change in FR (see p. 66) value calculated by adding up to a given scan is shown for 0 % of
DZ 10-HDA (triangles), 0.8 % (crosses), 1.4 % (*) and 3.6 % ( 0 ) . The MS was operated
A substrate blank was run for every set of treatments to correct for possible
contributions from impurities which may have some ions of the same mass as a compound
in the extract. Generally, the baseline in the substrate blanks did not show ions
corresponding to the M-15 or M-15+n of the compounds of interest. In the few cases
where a background was found, the contaminant ion currenthg of substrate was scaled to
the substrate in the treatments and subtracted from the appropriate ion current. In spite of
the substrate blank correction, systematic errors caused by baseline artifacts could still be
introduced. For this reason, different forms of some key substrates with different labelling

patterns and/or from different sources, which were likely to contain different impurities,
were tested.
Calibration line for 10-HDA
0.6 T
0 1 2 3 4
% labelled
Figure 1f.3. Low percentage calibration line for 10-HDA, D2 10-HDA. The FR values
were calculated using the first three scans of the GC peak. The equation for the line was
y = 0 . 1 3 ~ + 0.03 ( R ~ = 0.96).
11.4. Statistics
Data were subjected to analysis of variance (ANOVA). Means of treatments and
blanks were grouped and compared pairwise by Tukey's multiple range test with a = 0.05
(SAS Institute Inc.). Mean amounts of labelled o and o 1 -hydroxy acids accumulated
during perfusions with Dl C 18:O and 2-F C 18:O (p. 1 14) and of labelled o and o 1 -
functionalized acids formed from Dl C 18:O (p. 1 16) were compared by the Kruskal-Wallis
test (SAS Institute Inc.). Calibration lines were obtained by linear regression (Devore
1991).

Chapter 111: Elucidation of the biosynthetic pathway of mandibular acids in workers
and queens
r
III.l Search for a fatty acid precursor
The objective of these experiments was to find a straight-chain fatty acid precursor
to the functionalized acids produced by the bees. Decanoic acid applied topically to the
bees gave sporadic incorporation, so decanoic, (E)2 decenoic, hexadecanoic and
octadecanoic acids were tested directly on the glands in 10 min perfusions. Two trials were
done on workers and the results were pooled.
The incorporation of the four acids into 9-HDA, 8-HOAA, 10-HDAA and 10-HDA
is shown in Table III. 1. Only Dl C18:O gave a significant incorporation into all four
hydroxy acids analyzed. D3 C l6:O was incorporated into 8-HOAA and D4 C 10:0, into
10-HDA, D2 C10:l was not incorporated.
Table 111.1. Percentage of labelled hydroxy acids formed from decanoic, (E)2-decenoic, hexadecanoic and octadecanoic acids in workers.
treatment
DZ C10:l blank
Dq C 1o:o blank
D3 C16:O blank
Dl C18:O blank
N (9% labelled material) mean +I- S. E. " product 9-HDA 8-HOAA 10-HDAA 10-HDA
" For entries in bold type, treatments and blanks differed significantly (Pc0.05) by Tukey's test.

Because Dl C18:O was incorporated most readily, the samples were analyzed for
interconversion among the potential precursor acids. The results are shown in Table III.2.
Dl C18:O was chain shortened to hexadecanoic and (E)2-decenoic acid, but not to decanoic
acid. Dj C16:O was readily chain shortened to both 10-carbon acids and elongated to
octadecanoic acid. Dd C10:O was neither desaturated to (E)2-decenoic acid, nor elongated
to hexadecanoic acid, but it was elongated to octadecanoic acid to a small extent. Finally,
(E)2-decenoic acid was not converted to decanoic acid, but was readily elongated to hexa-
and octadecanoic acids.
Table 111.2. Interconversion among potential precursors to hydroxy acids in worker mandibular glands.
substrate
-
N (% labelled) mean +I- S. E. product C1O:l Cl0:O C 16:O C 18:O
DZ ClO:1 blank '
6 [ 94 +I- 4 ] 9.7 +I- 2.2 18 +I- 8 49 +I- 10 6 [SO+/- 111 39 +I- 10 * 2.8 +I- 1.8 0.6 +I- 0.3
DqC10:O blank
9 13 +I-4 [ 7 5 + / - 3 ] 1.6+/-0.6 0.8 +I- 0.4 ** 10 5.0 +I- 1.5 [ 3.9 +I- 0.7 ] 2.0 +I- 0.7 0.20 +I- 0.02
D3C16:O blank
Percentage of labelled material incorporated into straight-chain fatty acids from other fatty acids. Values shown in bold differ significantly from the blank (Tukey Pc0.05).
14 32+/-4 24 +I- 4 [ 86 +I- 5 ] 52 +I- 8 10 9.6 +I- 3.6 8.2 +I- 3.0 [17+1-61 0.0 +I- 0.0
DlC18:O blank
* A baseline artifact gave apparent labelling in the blanks. ** Label was visible in the mass spectra.
16 27+/-8 0.4 +I- 0.4 3.7 +I- 1.5 [ 78 +I- 3 ] 10 0.8+/-0.5 0.0 +I- 0.0 0.0 +I- 0.0 [ 2.3 +I- 0.5 ]
The results suggest that the mandibular glands must be capable of fatty acid
synthesis and P-oxidation, since the precursor acids were elongated and chain shortened.

Thus, it is possible that complete degradation to acetate and resynthesis competed with
direct utilization in the case of D,, C 10:0, which may explain the low incorporation of this
compound into octadecanoic acid and the hydroxy a&ids. On the other hand, (E)Zdecenoic
acid was elongated to octadecanoic acid but was not incorporated into the hydroxy acids.
This behavior may be due to an inhibition of P-oxidation, which would prevent complete
degradation to acetate and incorporation into the hydroxy acids. The source of inhibition
was not identified, but was most likely not the (E)Zdecenoic acid itself because its CoA
derivative is an intermediate in P-oxidation. The acids shorter than 18 carbons were
incorporated into the hydroxy acids to a lesser extent than octadecanoic acid, but were
elongated to octadecanoic acid. This suggests that incorporation of D3 C16:O and Dq C10:O
into the hydroxy acids proceeds via octadecanoic acid, the entry point to the pathway.
111.2. De novo biosynthesis from acetate
The objective of this experiment was to determine whether the precursor and
hydroxy acids can be synthesized de novo from acetate. Labelled acetate (1-I3c) was
applied to the glands in DMS0:saline 1 : 1 (1 pL of a 70 pg/pL solution), and the glands
were perfused for 10 and 20 rnin. The results are shown in Tables lII.3 and 4'.
One mass unit from 1-13c acetate was incorporated into 9-HDA, 8-HOAA,
10-HDAA and 10-HDA at one or both perfusion times, which indicates that these
compounds can be synthesized de novo from acetate in the mandibular glands. If
octadecanoic acid is the precursor, then labelled acetate should be incorporated into this
compound. Analysis of the saturated fatty acids revealed that this was the case. Of the
fatty acids analyzed, only hexa- and octadecanoic acids incorporated label from 1-13c
acetate, which suggests that the products of the fatty acyl synthetase in this tissue are hexa-
and octadecanoic acids. This is consistent with the patterns of fatty acid synthesis observed
in other insects such as T. ni and M. dornestica (Stanley-Sarnuelson et al. 1988). The
1 I thank Ms. K. Bray for helping with this experiment.
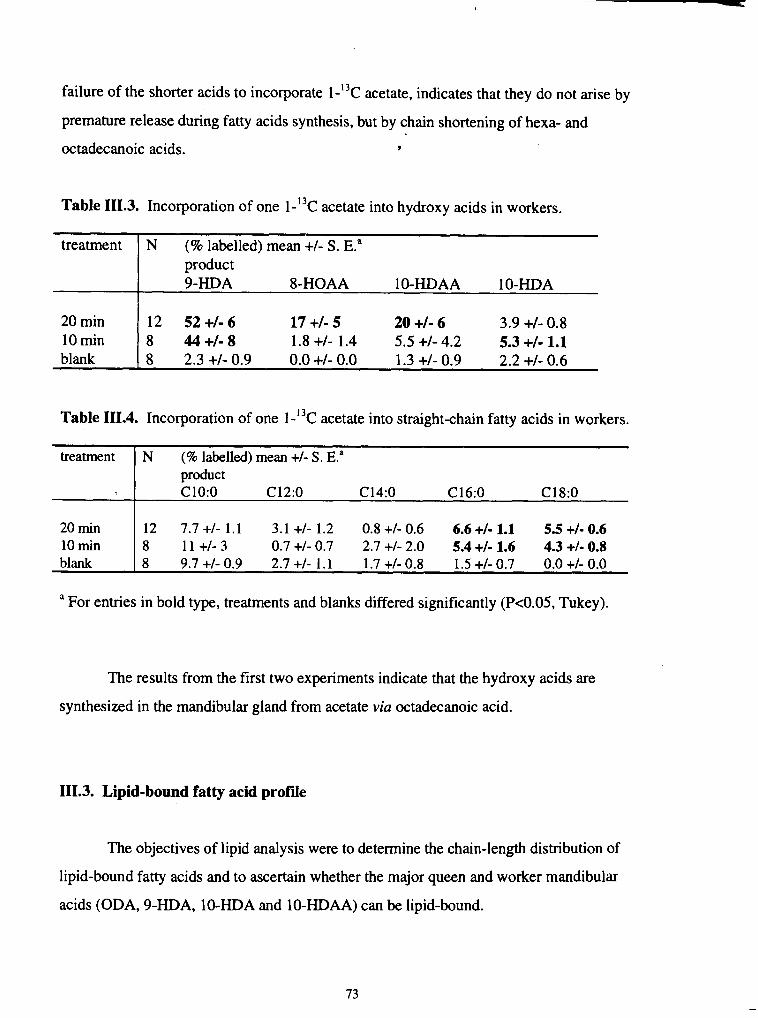
failure of the shorter acids to incorporate 1-"C acetate, indicates that they do not arise by
premature release during fatty acids synthesis, but by chain shortening of hexa- and
octadecanoic acids. I
Table 111.3. Incorporation of one 1-13c acetate into hydroxy acids in workers.
treatment
Table 111.4. Incorporation of one l-13c acetate into straight-chain fatty acids in workers.
N (5% labelled) mean +I- S. E.' product 9-HDA 8-HOAA 10-HDAA 10-HDA
20 min 10 min blank
12 52+/-6 17 +I- 5 20 +I- 6 3.9 +/- 0.8 8 44 +I- 8 1.8 +/- 1.4 5.5 +/- 4.2 5.3 +I- 1.1 8 2.3 +I- 0.9 0.0 +I- 0.0 1.3 +/- 0.9 2.2 +/- 0.6
treatment
" For entries in bold type, treatments and blanks differed significantly (Pe0.05, Tukey).
N (% labelled) mean +I- S. E." product C10:O C12:O C 14:O C 16:O C18:O
20 rnin 10 rnin blank
The results from the first two experiments indicate that the hydroxy acids are
synthesized in the mandibular gland from acetate via octadecanoic acid.
12 7.7 +I- 1.1 3.1 +I- 1.2 0.8 +I- 0.6 6.6 +I- 1.1 5.5 +I- 0.6 8 11 +/- 3 0.7+/-0.7 2.7+/-2.0 5.4+/-1.6 4.3+/-0.8 8 9.7+/-0.9 2.7+/- 1.1 1.7+/-0.8 1.5 +I-0.7 O.O+/-0.0
111.3. Lipid-bound fatty acid profde
The objectives of lipid analysis were to determine the chain-length distribution of
lipid-bound fatty acids and to ascertain whether the major queen and worker mandibular
acids (ODA, 9-HDA, 10-HDA and 10-HDAA) can be lipid-bound.

To extract the lipid, a pair of glands that had been thoroughly rinsed with saline
were soaked overnight at 4•‹C in CHC13:methanol2: 1 (500 pL). The solution was
withdrawn and the solvent evaporated to dryness under Ar. The lipids were separated on a
column of DEAE sephadex2, which adsorbs phosphatidic acid (PA), phosphatidylserine
(PS), phosphatidylinositol (PI) and free acids, but not phosphatidylcholine (PC),
phosphatidylethanolamine (PE), mono-, di- and triglycerides (Wood et al., 1989). The lipid
was resuspended in CHCl3:methanol:water 30:60:8 (10 mL) and loaded onto the column
which had been equilibrated with this solvent. Additional solvent (6 mL) was passed
through the column, and the eluate was collected. This solution contained the non-acidic
lipids. To elute the acidic lipids, the column was rinsed with CHC13:methanol: 0.8 M
sodium acetate 30:60:8. Sodium acetate was removed from the acidic fraction by
evaporating the solvent to dryness under Ar. The residue was resuspended in CHC13
(1 mL) and the suspension was centrifuged to settle the sodium acetate particles. The
supernatant was washed twice with water and three times with CHC13:methanol:water
3:48:47 (Wood et al. 1989). Both fractions were subjected to a second column separation.
TLC analysis of the lipid fractions by the method of Wolf and Roelofs (1989)
revealed that the non-acidic fraction contained mostly PC and PE and the acidic one, mostly
PA. More than 90% of the free acid present in the gland was removed during the saline
wash prior to lipid extraction. The remaining free acid eluted in the acidic fraction and was
removed along with the sodium acetate.
Both extracts were dried under Ar and treated with acetic anhydride:glacial acetic
acid 3:2 (0.3 rnL) at 150•‹C for 5 h. Once the samples had cooled to room temperature,
water (2 rnL) was added and the mixture, extracted with CHC13 (2 mL). The organic extract
was washed 4 times with 5 % NaHC03 and once with water, followed by drying over
Na2S04. By this procedure, the phospholipids were converted to triglycerides with acetate
in place of the phosphate-containing group (Kumar et al. 1983). The lipid-bound fatty
The column was prepared in a silylated Pasteur pipette with a glass wool plug at the bottom. DEAE Sephadex (Sigma, 0.5-0.6 mL wet) was layered on the glass wool.

acids were freed in the form of methyl esters by transesterification of the material recovered
from acetolysis with 0.5 M KOH in methanol (50 pL). The mixture was reacted at room
temperature for one h, after which the reaction was buenched with 1 N HCI (60 pL). The
methyl esters were extracted with hexane (3 X 50 pL), and the hexane extract was washed
with 5% NaHC03 (50 pL) and dried over Na2S04.
Table IlI.5. Amounts of fatty acids bound in acidic and non-acidic lipids from queen and
worker mandibular glands.
compound amounts (nghe) queen worker acidic non-acidic acidic non-acidic
96 9 8 16
244 44 56 60
1230 3 1 119 224
2880 619 254 171
5240 476 556 1860
4450 not detected 366 not detected
5390 4870 1880 6170
387 10 9 52
1480 639 16 300
2650 46 17 295
4220 5 2 1 3 3
Abbreviations: C10:O = decanoic acid, C12:O = dodecanoic acid, etc. The acids were analyzed as the corresponding methyl esters.
* Standards of methyl (all 2) 9,12,15-octadecatrienoate and 9,12-octadecadienoate eluted at the same retention time.
The hexane extract containing the methyl esters was analyzed by GC. Compounds
were identified by comparison of their retention time with standards. To find compounds
with free hydroxyl groups, a sample of the hexane solution was derivatized with BSWA
and analyzed by GC. Compounds with free hydroxyl groups are silylated in the BSTFA

time (min.)
Figure III.1. GC traces of methyl esters obtained through acetolysis and transesterification
of non-acidic (NA) and acidic (A) lipids from worker mandibular glands. Arrows indicate
the retention times of the methyl esters of a) ODA, b) 9-HDA, c) 10-HDAA and
d) 10-HDA. Numbers indicate the methyl esters of 1) decanoic, 2) dodecanoic, 3)
tetradecanoic, 4) (Z)9-hexadecenoic, 5) hexadecanoic, 6) (all Z) 9,12,15-octadecatrienoic
and/or 9,12-octadecadienoic, 7) (Z) 1 1 -octadecenoic, 8) octadecanoic, 9) (Z)9-octadecenoic
and 10) eicosanoic acids.
treatment and, therefore, come at a later retention time. To verify the identity of peaks
whose retention time matched that of a standard methyl ester, an aliquot of the hexane
solution was transesterified with KOH in ethanol. Fihally, to determine whether keto- or
aldehydo acid esters were present, an aliquot of the original hexane solution was treated
with NaBH4 in methanol. Samples from the worked up transesterification and reduction
were run directly and as BSTFA derivatives. Methyl esters whose identity was known were
quantitated from the GC trace of the original hexane solution (Figure ID. 1).
Even though PC and PE appeared to be major constituents of the mandibular gland
lipid by TLC, the total quantity of fatty acid methyl esters recovered from the non-acidic
lipid fraction was low compared to the amount recovered from the acidic lipid (Table III.5).
A possible explanation is that some PC and PE was lost during the column separation or the
acetolysis of these compounds was incomplete.
Queens and workers had similar fatty acid profiles (Table III.5). In both castes, the
most abundant lipid-bound fatty acids were 16 and 18 carbons long. Octadecanoic acid was
one of the most abundant fatty acids in non-acidic lipid and one of the least abundant in
acidic lipid. Hexadecanoic acid was abundant in both types of lipid. The possibility that the
lipid may serve as an additional source of octadecanoic acid for mandibular acid
biosynthesis was not pursued. More importantly, none of the mandibular acids nor any
other hydroxy- or keto acids were found to be lipid-bound in either caste. Thus, the lipid in
the mandibular gland is not a reservoir for oxygen-functionalized acids. Furthermore,
failure to find lipid-bound hydroxy- or keto acids suggests that the biosynthesis of
mandibular acids does not proceed through a lipid-bound intermediate.
111.4 Interconversion among major components
The objective of these experiments was to determine whether the major components
in the queen and worker blends can interconvert. In the first set of treatments, the major
hydroxy acids (10-HDAA, 10-HDA and 9-HDA) were tested for oxidation to the

corresponding di- and keto acids. In the second set, the 8- and 10-carbon mhydroxy acids
were tested for interconversion, and in the third set the analogous treatments with the 10-
carbon ol-hydroxy acids were done in both castes. Finally, 9- and 10-HDA were tested I
for isomerization with respect to the hydroxy group.
4.1 Hydroxy group oxidation
To test for oxidation of hydroxy acids, worker and queen mandibular glands were
perfused with D3 10-HDAA, D2 10-HDA and D2 9-HDA, and the resulting extracts were
analyzed for the corresponding oxidation products, C10:O DA, C10: 1 DA and ODA. The
results are shown in Table III.6.
Table III.6. Oxidation of 10-carbon hydroxy acids in workers and queens.
caste
worker ; tr. bl.
substrate oxidized D3 10-HDAA D2 10-HDA D2 9-HDA 24 +I- 2 (9) 78 +I- 14 (8) not detected 6.4 +I- 0.1 (10) 5.1 +I- 0.2 (10)
queen (virgin) tr. bl.
The values represent the mean +I- S. E. of the percentage of labelled oxidized product formed from the corresponding substrate (C 10:O DA from 10-HDAA, C 10: 1 DA from 10-HDA, ODA from 9-HDA). Entries corresponding to treatments (tr.) shown in boldface are significantly different from the blank (bl.), Tukey P<0.05. The number of replicates is indicated in parenthesis after each entry.
46.5 +I- 0.2 (8) 71 +I- 2 (8) 13 +I- 13 (8) 11.0+/-2.3 (8) 24.6+/-6.8 (8) 2.9+/-1.2 (8)
queen (mated) tr. bl.
Workers and virgin queens both readily oxidized ohydroxy acids to the
not determined not determined 6.6 +I- 2.8 (8) 0.5 +I-0.3 (8)
corresponding diacids. This conversion was found to proceed via the corresponding oxo-
acids (data not shown). Neither workers nor virgin queens oxidized 9-HDA to ODA, but
mated queens did (Figure III.2). Mated queens were not tested for oxidation of the m
hydroxy acids.
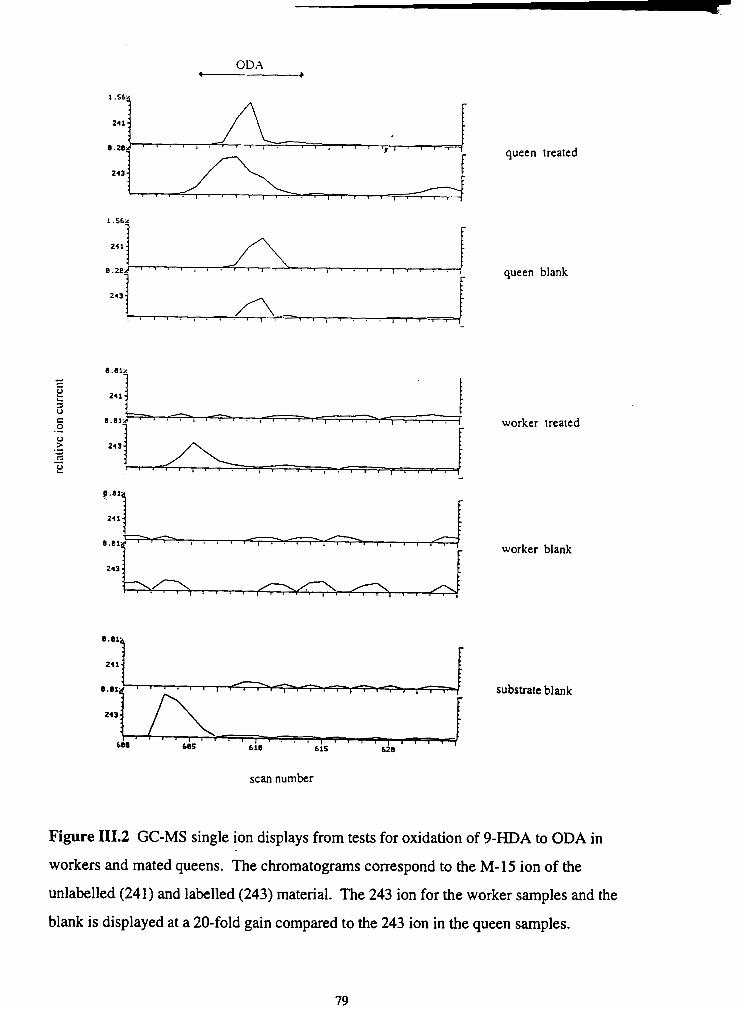
ODA ______.
243
I . ,
queen treated
queen blank
worker treated
worker blank
substrate blank
scan number
Figure 111.2 GC-MS single ion displays from tests for oxidation of 9-HDA to ODA in
workers and mated queens. The chromatograms correspond to the M-15 ion of the
unlabelled (241) and labelled (243) material. The 243 ion for the worker samples and the
blank is displayed at a 20-fold gain compared to the 243 ion in the queen samples.

4.2 Interconversion among ohydroxy acids
Labelled 10-HDAA and 10-HDA were tested for interconversion in virgin queens
and workers, and 8-HOAA was tested for elongation and further chain shortening in
workers. The results are listed in Table III.7.
Table 111.7. Interconversion among ohydroxy acids in queens and workers.
caste
- - - -
queens (virgin)
workers.
substrate (% labelled material) mean +I- S. E. product 10-HDAA 10-HDA 8-HOAA
D3 10-HDAA [ 83 +I- 3 ] 1.1 +I- 0.1 1.4 +I- 0.1 blank [ 1.1 +I- 0.1 ] 1.3 +I- 0.4 1.3 +I- 0.1
D2 10-HDA 1.3 +I- 0.5 [ 53 +I- 2 ] 30 +I- 5 blank 0.5 +I- 0.1 [ 0.2 +I- 0.1 ] 3.6 +I- 0.9
D3 10-HDAA [ 86 +I- 4 ] 17 +I- 7 20 +I- 10 blank [ 0.3 +I- 0.1 ] 0.5 +I- 0.1 1.3 +I- 0.7
D2 10-HDA 27 +I- 4 [ 90 +I- 5 ] 48 +I- 4 blank 0.3 +I- 0.2 [ 0.5 +I- 0.2 ] 1.3 +I- 0.7
DZ 8-HOAA 1.5 +I- 0.1 4.0 +I- 1.4 [ 73 +I- 1 ] blank 3.6 +I- 0.2 4.1 +I- 0.4 [ 6.3 +I- 1.8 ]
Percentage of labelled material found in mandibular glands treated with labelled ohydroxy acids. Bracketed entries on the diagonal correspond to the applied substrates. Bold entries indicate a significant difference between treatments and blanks (Tukey Pc0.05). For queens, N = 8; for workers, N = 10.
Virgin queens did not convert 10-HDAA to 10-HDA or 8-HOAA, but they chain
shortened 10-HDA to 8-HOAA. Workers chain shortened 10-HDAA and 10-HDA to
8-HOAA and they converted 10-HDA to the saturated form. They did not elongate or
further chain-shorten 8-HOAA. These data suggest that the ohydroxy acids can be

Figure 111.3. Interconversion among ohydroxy acids.
produced from 10-HDAA by limited P-oxidation. The process would start with the
conversion of 10-HDAA to its CoA ester, followed by desaturation at the second position
to give 10-HDA-CoA, hydration of the (E)2 double bond to give 3,lO-dihydroxydecanoyl-
CoA, oxidation of the 3-hydroxy group to give the 3-keto acyl-CoA and attack by
coenzyme A to give acetyl-CoA and 8-HOAA-CoA (Figure III.3). The identification of
3,lO-dihydroxydecanoic acid in worker mandibular secretions (Weaver et al., 1968) further
supports the idea that the blend of ohydroxy acids arises by limited P-oxidation of
10-HDAA-CoA, with hydrolysis of intermediate CoA esters.

Workers chain shortened 10-HDAA and 10-HDA more efficiently than virgin
queens. Furthermore, workers converted 10-HDA tq 10-HDAA, which suggests that the
(E)2 desaturation of 10-HDAA is reversible in that h e . This process was not seen in the
virgin queens. The observed difference between the castes may be due to differences in the
specificity of P-oxidation, the ability to convert the hydroxy acids to their CoA esters or a
combination.
4.3 Interconversion among a-1-hydroxy acids
The o 1-hydroxy acids, D3 9-HDAA and D2 9-HDA, were tested for
interconversion, and the results are shown in Table III.8.
Table 111.8. Interconversion among ol-hydroxy acids in queens and workers.
caste
queens (mated)
workers
substrate (% labelled) mean +/- S. E. product 9-HDAA 9-HDA 7-HOAA
D3 9-HDAA [ loo+/-0 ] 0.8 +/- 0.3 3.8 +I- 3.8 blank [ 0.5 +/- 0.5 ] 0.05 +/- 0.05 1.9 +/- 1.0
DZ 9-HDA 0.6 +/- 0.6 [ 2 7 + / - 9 ] 16+/-9 blank 0.0 +/- 0.0 [ 0.0 +/- 0.0 ] 0.1 +/- 0.1
D3 9-HDAA [ loo+/-0 ] 24 +/- 3 not determined blank [5.6 +/- 3.7 ] 3.8 +/- 0.9
Dz 9-HDA 58 +I- 4 [ 82 +I- 3 ] not determined blank 21 +/- 3 [9.3 +/- 1.51
Percentage of labelled material found in mandibular glands treated with labelled ohydroxy acids. Bracketed entries on the diagonal correspond to the applied substrates. Bold entries indicate a significant difference between treatments and blanks (Tukey Pc0.05). For queens, N = 8; for workers, N = 10.

Queens were able to convert 9-HDAA to 9-HDA, and they may have been able to
chain-shorten 9-HDA to 7-HOAA to a small extent. .As with the ohydroxy acids, (E)2- I
desaturation of 9-HDAA was not reversible in queens. In workers, 9-HDAA and 9-HDA
readily interconverted, just like 10-HDAA and 10-HDA did. These data suggest that, like
the ohydroxy acids, the blend of ol-hydroxy acids also arises by limited P-oxidation.
Queens and workers must have a P-oxidation system able to chain-shorten CO- and o l -
hydroxy acids, but this P-oxidation system differs between the castes. This difference
manifests itself in different abilities to chain-shorten the 10-carbon acids and in different
reversibilities of the desaturation step.
4.4 Interconversion between o and ol-hydroxy acids
The possibility that the ohydroxy acids can interconvert with their o 1-isomers was
investigated with D2 9-HDA and D2 10-HDA which were tested for incorporation into 10-
and 9-HDA, respectively (Table III.9).
The data reveal that there was no interconversion between 9- and 10-HDA. If the
conversion of ol-hydroxy acids to the oisomers were to occur by dehydration to the
terminal alkenoic acid followed by rehydration, an anti-Markovnikov hydration would be
required. This reaction is unlikely because it would preceed through a primary carbocation
intermediate which is less stable than the secondary carbocation formed during a
Markovnikov hydration (Carey and Sundberg, 1983). The opposite conversion, o to o l , is
more likely, but was not detected.

Table 111.9. Check for isomerization between 9- and 10-HDA in queens and workers
caste
queens (virgin)
workers
substrate N (% labelled) mean +I- S. E. product 9-HDA 10-HDA
D2 9-HDA 8 - - - - - - - - - - - - - 0.6 +I- 0.3 blank 8 0.1 +I- 0.1
D2 10-HDA 8 0.1 +I- 0.1 ------------- blank 8 3.7 +/- 1.4
Dz 9-HDA 6 -------------- 0.9 +I- 0.8 blank 6 1 .O +I- 0.5
Dz 10-HDA 8 0.0 +I- 0.0 ------------- blank 8 0.0 +I- 0.0
Percentage of labelled material found in glands treated with D2 9-HDA or D2 10-HDA. Except for the entry in boldface, there were no significant differences between treatments and blanks. In the case of the queen 9-HDA blanks, nonanedioic acid, which elutes before 9?HDA and has a 3 17 ion (the same as M- 15 ion for D2 labelled 9-HDA), overlapped with the front part of the 9-HDA peak.
The experiments described so far indicate that the biosynthesis of o and o l-
functionalized acids starts with octadecanoic acid which is synthesized de novo from acetate
and is incorporated into both types of functionalized acid. The hydroxy acids are derived
from 9- and 10-HDAA by limited P-oxidation, and the keto- and diacids are formed from
the corresponding hydroxy acids by oxidation. Finally, the pools of 6% and o l-
functionalized acids appear to be separate.
111.5. Chain shortening of higher hornologs
The conversion of octadecanoic acid to 9- and 10-HDAA requires at least two
processes: hydroxylation and chain shortening to the 10-carbon length. These steps could
occur in either order: octadecanoic acid (or its CoA ester) could be hydroxylated and the

resulting 18-carbon hydroxy acid, chain shortened, or octadecanoyl-CoA could be
shortened to decanoyl-CoA which could be hydroxylated to 10-HDAA-CoA. The first
experiment ruled out the possibility that free decanoic acid is hydroxylated, but not that
decanoyl-CoA is. If decanoyl-CoA only formed by chain shortening of longer CoA esters,
the second proposed pathway would still be consistent with the results from the first
experiment.
If hydroxylation preceded chain shortening, then the glands should contain higher
homologs of the mandibular acids and should be able to chain-shorten them. Thus,
mandibular extracts from both castes were screened for 12-, 14-, 16- and 18-carbon
homologs of the 10-carbon hydroxy acids by the method described in chapter 11. The 12-
carbon homologs were easily detected in both castes (20-50 ng). The 14- and 16-carbon
compounds were present in trace amounts (< 5 ng); 18- and 17-hydroxyoctanoic acids were
detectable in some samples (< 5 ng).
To determine whether 18- and 17-hydroxyoctadecanoic acids are chain shortened in
the mandibular glands, Dl 18-OH C18:O and D3 17-OH C18:O were assayed in both castes.
In workers, D2 16-OH C16:O was also tested. Control runs with the corresponding 10-
carbon homologs, 10-HDAA and 9-HDAA were done to assess whether the higher
homologs can arise from the 10-carbon acids by elongation.
Dl 18-OH C18:O was chain shortened to the 12-, 10- and 8-carbon length in both
castes (Table JII. 10). Workers incorporated label from D2 16-OH C16:O into all the shorter
hydroxy acids analyzed, and they converted D2 10-HDAA to 10-HDA and 8-HOAA, as
observed before. The 10-HDAA was also elongated to 12-OH C12: 1, but not to 12-OH
C 12:O or further.
D3 17-OH C18:O was chain shortened to the 10-carbon length in both castes (Table
JII. 1 1). Queens also showed label in the 14-carbon homolog, but this result was probably
due to a trace contamination of the substrate with 14-OH C14:O (Chapter 11, p 57).

Tab
le 1
11.1
0. C
hain
sho
rten
ing
and
elon
gatio
n of
ohy
drox
y ac
ids
in w
orke
rs a
nd q
ueen
s.
cast
e
wor
kers
00
Q\
quee
ns
trea
tmen
t (%
labe
lled
mat
eria
l) m
ean
+I-
S. E
. "
prod
uct
14-O
H C
14:O
12
-OH
C 1
210
12-O
H C
12: 1
10-H
DA
A
10-H
DA
8-H
OA
A
Dl 18
-OH
C18
:O
0.0 +I-
0.0
5.8
+I- 1
.1
7.3 +I-
1.2
4.5 +I-
1.1
4.7 +I-
1.2
6.8 +I-
1.1
blan
k 2.
0 +I-
0.8
1.9 +I-
1.2
2.9 +I-
0.9
2.5
+I-
0.7
1.
2 +I-
0.6
1.7 +I-
0.9
Dz
1 6-O
H c
1 6:o
b 17
+I- 1
20
+I-
2 49
+I-
5 9.
3 +I-
1.9
2.8
+I-
0.4
*
12 +I-
2 bl
ank
2.0 +I-
0.8
2.1 +I-
1.4
2.9
+I-
0.9
2.
6 +
I- 0
.7
1.2
+I-
0.6
1.
9 +I-
0.7
Dz 10
-HD
AA
0.
7 +I-
0.5
2.9 +I-
2.4
12 +I-
4 [
70 +I-
3 ]
0.3 +I-
0.1
5.6 +I-
2.6
* bl
ank
0.0 +I-
0.0
0.2 +I-
0.2
0.0
+I-
0.0
[ 0
.0 +
I- 0
.0 ]
0.
0 +
I- 0
.0
0.1 +I-
0.1
Dl 18
-OH
C18
:O
15 +
I-
8 *
5.5 +I-
1.0
3.5 +I-
0.8
* 0.
0 +I-
0.0
1.9 +I-
0.5
1 .O +
I-
0:3 -
bl
ank
0.0 +I-
0.0
2.3
+I-
0.9
1.
5 +I-
0.7
0.0 +I-
0.0
0.2 +I-
0.1
0.09
+I-
0.04
Perc
enta
ge o
f la
belle
d m
ater
ial f
ound
in g
land
s tre
ated
with
lab
elle
d oh
ydro
xy a
cids
of
diff
eren
t cha
in le
ngth
. Fo
r w
orke
rs, N
= 1
0 an
d fo
r que
ens
N =
8.
" Fo
r ent
ries
in b
old
type
, tre
atm
ents
and
bla
nks
diff
ered
sig
nifi
cant
ly (P
-cO
.05)
by
Tuk
ey's
test
. Fo
r en
trie
s m
arke
d *,
Pc0
.07.
Thi
s su
bstr
ate
cont
aine
d 34
% o
f Dl
and
23 %
of
Dz.
The
refo
re, c
ompo
unds
wer
e an
alyz
ed fo
r th
e pe
rcen
tage
of
one
and
two
D
pres
ent a
nd th
e va
lues
sho
wn
are
the
tota
l of Dl
and Dz.

Tab
le 1
11.11
. C
hain
sho
rten
ing
and
elon
gatio
n of
wl-
hydr
oxy
acid
s in
wor
kers
and
que
ens.
cast
e
wor
kers
quee
ns
--
trea
tmen
t (%
labe
lled
mat
eria
l) m
ean
+I- S
. E. "
pr
oduc
t 13
-OH
C14
:O
11-O
HC
12:O
11
-OH
C12
:l
9-H
DA
A
9-H
DA
7-
HO
AA
D3
17-O
H C
18:O
bl
ank
D3 9
-HD
AA
bl
ank
D3
17-O
H C
18:O
bl
ank
D3 P
HD
AA
bl
ank
DZ
9-H
DA
bl
ank
46 +
I- 2
3 2.
1 +I
- 1.
4
not d
eter
min
ed
5.2
+I-
2.7
1.9
+I-
1.0
3.8
+I-
39
1.
9 +I
- 1.
0 '
16 +
I- 9
0.
1 +I
- 0.
1
Perc
enta
ge o
f la
belle
d m
ater
ial f
ound
in g
land
s tr
eate
d w
ith l
abel
led
wl-
hydr
oxy
acid
s of
diff
eren
t cha
in le
ngth
. Fo
r w
orke
rs, N
= 1
0 an
d fo
r que
ens
N =
8.
Bra
cket
ed e
ntri
es c
orre
spon
d to
app
lied
subs
trat
es.
n. d
. = n
ot d
etec
ted
" Fo
r ent
ries
in b
old
tvve
. tre
atm
ents
and
bla
nks
diff
ered
sig
nifi
cant
lv (P
c0.0
5) b
v T
ukev
's te
st.
For
entr
ies m
arke
d *.
Pc0.
07.
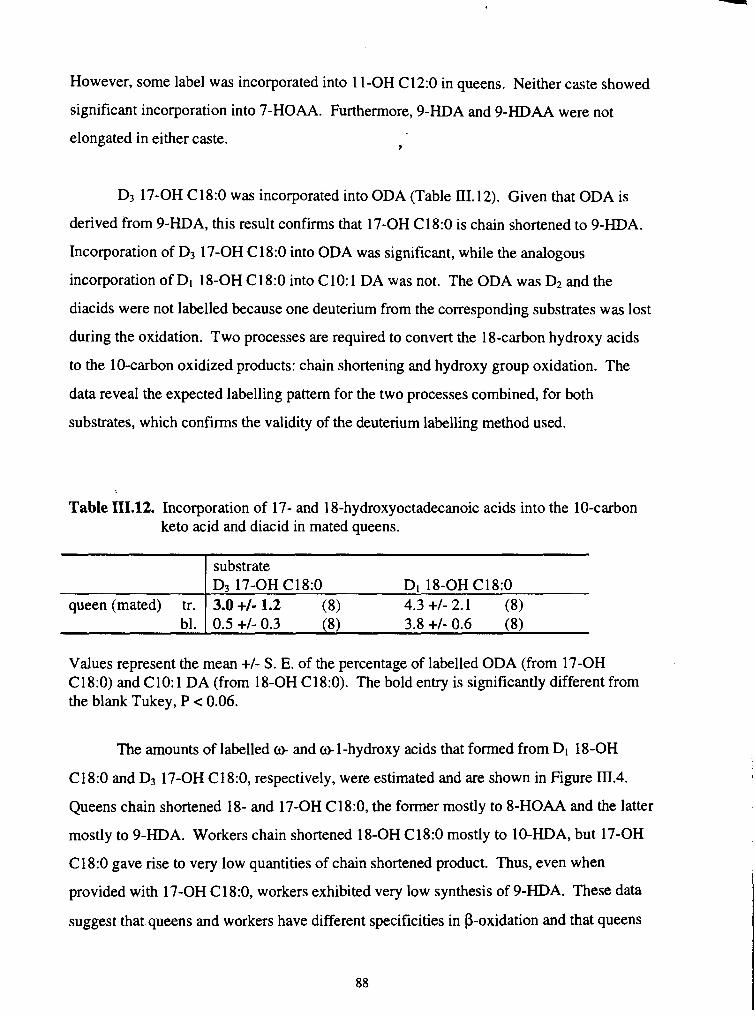
However, some label was incorporated into 11-OH C12:O in queens. Neither caste showed
significant incorporation into 7-HOAA. Furthermore, 9-HDA and 9-HDAA were not
elongated in either caste. I
D3 17-OH C 18:O was incorporated into ODA (Table 111.12). Given that ODA is
derived from 9-HDA, this result confirms that 17-OH C18:O is chain shortened to 9-HDA.
Incorporation of D3 17-OH C18:O into ODA was significant, while the analogous
incorporation of Dl 18-OH C 18:O into C 10: 1 DA was not. The ODA was D2 and the
diacids were not labelled because one deuterium from the corresponding substrates was lost
during the oxidation. Two processes are required to convert the 18-carbon hydroxy acids
to the 10-carbon oxidized products: chain shortening and hydroxy group oxidation. The
data reveal the expected labelling pattern for the two processes combined, for both
substrates, which confirms the validity of the deuterium labelling method used.
Table 111.12. Incorporation of 17- and 18-hydroxyoctadecanoic acids into the 10-carbon keto acid and diacid in mated queens.
Values represent the mean +/- S. E. of the percentage of labelled ODA (from 17-OH C18:O) and C10: 1 DA (from 18-OH C18:O). The bold entry is significantly different from the blank Tukey, P c 0.06.
queen (mated) tr. bl.
The amounts of labelled o and o 1-hydroxy acids that formed from Dl 18-OH
C18:O and D3 17-OH C18:0, respectively, were estimated and are shown in Figure IIt.4.
Queens chain shortened 18- and 17-OH C18:0, the former mostly to 8-HOAA and the latter
mostly to 9-HDA. Workers chain shortened 18-OH C l8:O mostly to 10-HDA, but 17-OH
C 18:O gave rise to very low quantities of chain shortened product. Thus, even when
provided with 17-OH C18:0, workers exhibited very low synthesis of 9-HDA. These data
suggest that queens and workers have different specificities in P-oxidation and that queens
substrate D3 17-OH C18:O Dl 18-OH C 18:O 3.0 +I- 1.2 (8) 4.3+/-2.1 (8) 0.5 +/- 0.3 (8) 3.8+/-0.6 (8)

are able to chain-shorten both, o and wl-hydroxy acids, while the workers preferentially
chain-shorten ohydroxy acids to the 10-carbon length. It is not clear whether workers
have a very low chain shortening activity for o 1 -hydroxy acids, or whether they degrade
17-OH C 18:O beyond the 8-carbon length.
o-hydroxy acids
compound
o-1 hydroxy acids
compound
Figure 111.4. Amounts of labelled m and o 1 -hydroxy acids formed from Dl 18-OH C 1 8:O
and Dj 17-OH C l8:O, respectively. The abbreviations indicate the chain-length of the
hydroxy acids and the presence (: 1) or absence (:O) of an (E)2-double bond.

To summarize, worker and queen mandibular extracts contain higher homologs of
the 10-carbon hydroxy acids. These homologs arise from 18- and 17-octadecanoic acid by
chain shortening, not from the 10-carbon hydroxy acids by chain elongation. Thus,
hydroxylation of octadecanoic acid at the 1 8 ~ and 17" position is most likely the first step in
the conversion of octadecanoic acid to the 10-carbon hydroxy acids. This is followed by P- oxidation which differs in queens and workers.
111.6 Order of the steps in the pathway
To verify that hydroxylation precedes P-oxidation in the conversion of octadecanoic
acid to the 10-carbon hydroxy acids, workers and queens were treated with labelled
octadecanoic acid and 2-fluorooctadecanoic acid (2-F C18:0), an inhibitor of P-oxidation.
The CoA ester of 2-F C18:O is a competitive inhibitor of acyl CoA dehydrogenase
(Fendrich and Abeles, 1982; Rose11 et al. 1992). If hydroxylation occurs before chain
shortening, the inhibited samples should show incorporation of label into the 18-carbon
hydroxy acids. If hydroxylation occurs after chain shortening and the 18-carbon hydroxy
acids arise by chain elongation from shorter homologs, no labelled 18-carbon hydroxy acids
should be present in the inhibited samples.
6.1 Workers
Workers incorporated Dl C18:O into the 8- and 12-carbon ohydroxy acids and
18-OH C 18:O (Table III. 13, Figure IIIS), which indicates that the glands were able to
incorporate the substrate in the absence of a P-oxidation inhibitor. The 14-OH C14:O
showed no incorporation of label; 16-OH C16:O was not detected. In the presence of
2-F C18:0, there was no incorporation into 12-OH C12: 1 or any of the shorter hydroxy
acids, which suggests that P-oxidation was inhibited from the 12-carbon length onward.
The 18-OH C18:O was labelled in both treatments.

Table 111.13. Incorporation of label from 12-Dl octadecanoic acid into whydroxy acids in workers, in the absence and presence of a Pioxidation inhibitor (2-fluorooctadecanoic acid).
treatment
Dl C18:O blank
Dl C18:O blank
N (% labelled materiaP) mean +/- S.E. " product 18-OH C18:O 14-OH C14:O 12-OH C12:O 12-OH C12: 1
(% labelled material) mean +/- S.E. " product 10-HDAA 10-HDA 3,1 Odi-OH. 8-HOAA
C10
" For entries in bold type, treatments and blanks differed significantly (P<0.05, Tukey).
Incorporation of label into 18-OH C 18:O in the inhibited treatment indicates that
hydroxylation precedes P-oxidation. The observations that inhibition with 2-F C18:O
manifested itself from the 12-carbon length onward and that the 14-OH C14:O did not show
incorporation of label, suggests that P-oxidation of 1 8-OH C18:O to 12-OH C12:O is tightly
coupled with little release or exchange of intermediates. Because of this, 2-F C18:O does
not interfere with chain shortening of 18-OH C18:O to the 12-carbon length. At that point a
new set of P-oxidation enzymes, specific for shorter chain lengths, may continue the chain
shortening process, which would make it possible for 2-F C18:O-CoA to compete with
12-OH C 12:O-CoA and, therefore, inhibit further P-oxidation of the hydroxy acid.

0.0lW
A , , . ,n . ,~. . .~. . .~. , . . l , . . , , . . . . DMSO 7
substrate blank
scan number
Figure 111.5. Single ion displays at the retention time of 18-OH C18:O from the GC-MS
traces of worker mandibular extracts. The glands were treated with 2-F C18:O and
Dl C18:0,2-F C18:0, Dl C18:O and DMSO. The substrate blank for Dl C18:O is also
shown. The ions displayed correspond to the M-15 ion of labelled (430) and unlabelled
(429) 18-OH Cl8:O.

The results for the ol-hydroxy acids were similar (Table III.14), except that
labelling of 17-OH C18:O in the inhibited treatments was not significantly different from the
blanks. This may have been due to dilution df the labelled substrate with 2-F C18:O (which
may also get hydroxylated). Nevertheless, some labelled 17-OH C18:O was visible in some
of the samples. The 9-HDAA showed some label in the inhibited runs, which could be due
either to incomplete inhibition or to an artifact. Since the blanks also showed some
apparent labelling, an artifact may have been present at the retention time of 9-HDAA
Furthermore, 1 1-OH C12: 1 and 9-HDA did not incorporate label in the inhibited runs,
which means that inhibition was successful. As with the ohydroxy acids, the substrate was
incorporated into the 12- and 10-carbon hydroxy acids'in the absence of inhibitor and the
17-hydroxy acid was labelled in both treatments. Inhibition by 2-F C 18:O manifested itself
from 1 1 -OH C 12:O onward.
The experiment was repeated with D3 C18:O as the substrate, and similar results
were obtained (Table III. 15). The solution of D3 C18:O and 2-F C 18:O used for the
inhibited treatments was too viscous for application and had to be diluted 2X. This may
explain the low percentage of label in 18-OH C18:O in the inhibited treatment. The
amounts of labelled 9-HDA, 10-HDAA and 10-HDA formed from both substrates in the
non-inhibited treatments were estimated from the percentage of labelled and the total
mount of these acids (Table III. 16).
The mount of each compound formed from both substrates was similar, which
suggests that the terminal deuterium in D3 C18:O did not interfere with incorporation of this
substrate into ol-hydroxy acids. Furthermore, the labelled materials formed in
approximately the same ratio as the total acids present, namely, 9-HDA: 10-HDAA: 10-
HDA, 1:40: 110. This indicates that the pathway was not affected by the addition of
exogenous C 18:O.
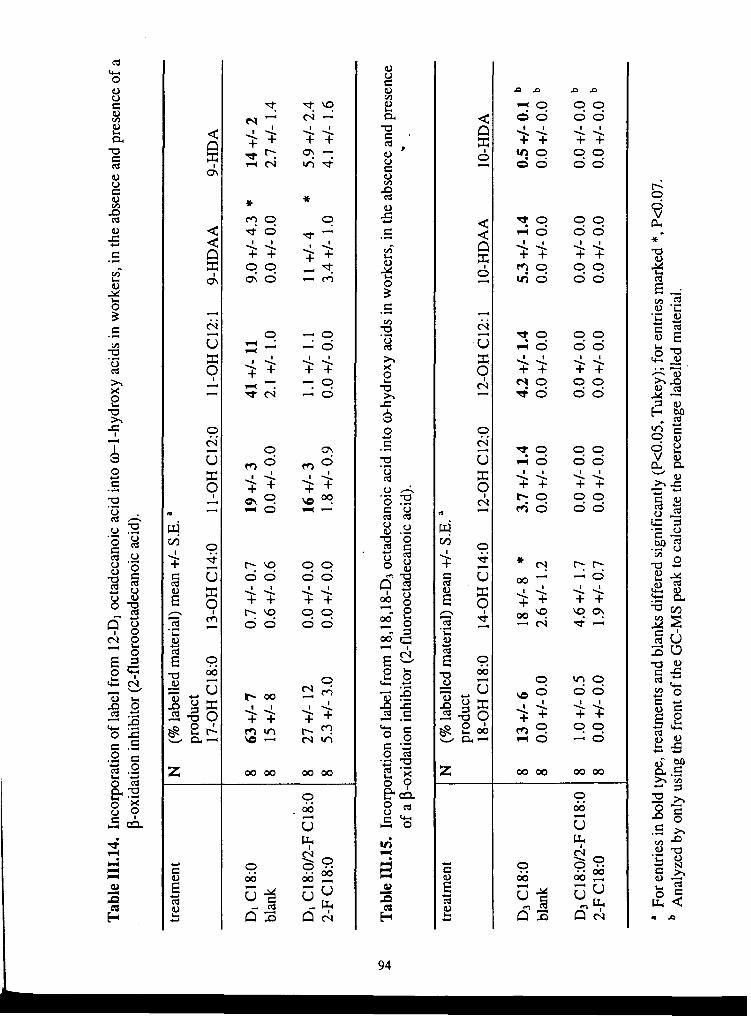
Tab
le 1
11.1
4.
Inco
rpor
atio
n of
lab
el f
rom
12-
Dl o
ctad
ecan
oic
acid
into
a-1
-hyd
roxy
aci
ds in
wor
kers
, in
the
abse
nce
and
pres
ence
of
a P-
oxid
atio
n in
hibi
tor (
2-fl
uoro
octa
deca
noic
aci
d).
trea
tmen
t I N
(%
labe
lled
mat
eria
l) m
ean
+I- S.E. "
I pr
oduc
t
\D
P
Tab
le 1
11.1
5.
Inco
rpor
atio
n of
lab
el f
rom
18,
18,1
8-D
3 oct
adec
anoi
c ac
id in
to m
hydr
oxy
acid
s in
wor
kers
, in
the
abse
nce
and
pres
ence
of
a (
3-ox
idat
ion
inhi
bito
r (2-
fluo
rooc
tade
cano
ic a
cid)
. w
Dl C
18:O
bl
ank
8 63
+I-
7
0.7
+I- 0
.7
19 +
I- 3
41
+I-
11
9.0
+I- 4
.3 *
14
+I-
2
8 1
5+
/-8
0.
6 +I
- 0.
6 0.
0 +I
- 0.
0 2.
1 +I
- 1.
0 0.
0 +I
- 0.
0 2.
7 +I
- 1.
4
D3
Cl8
:O
blan
k
trea
tmen
t
" Fo
r en
trie
s in
bold
type
, tre
atm
ents
and
bla
nks
diff
ered
sign
ific
antly
(P<0
.05,
Tuk
ey);
for e
ntri
es m
arke
d *,
P<0.
07.
Ana
lyze
d by
onl
y us
ing
the
fron
t of
the
GC
-MS
peak
to c
alcu
late
the
perc
enta
ge la
belle
d m
ater
ial.
N
(% la
belle
d m
ater
ial)
mea
n +I
- S.E. "
prod
uct
18-O
H C
18:O
14
-OH
C14
:O
12-O
H C
12:O
12
-OH
C12
: 1
10-H
DA
A
1 0-H
DA

Table 111.16. Amount of labelled hydroxy acids formed from Dl and Dj C 18:O in workers.
Dl C18:O blank
treatment
Dg C18:O blank
N (amount of labelled material (ng)) mean +I- S. E. " product p
9-HDA 10-HDAA 10-HDA
total (pglb I 0.04 +I- 0.01 1.6 +I- 0.2 4.2 +I- 0.5
" For entries in bold type, treatments and blanks differed significantly (Pc0.05, Tukey). b Total amount of materiallpair of glands for workers of the same age.
6.2 queens
An experiment with Dl C18:O and 2-F C 18:O was undertaken with mated queens.
The results are shown in Table III. 17.
In the non-inhibited treatment, label was incorporated into the 14- and 10-carbon
acids, which indicates that the glands used for the experiment were active. The inhibited
treatments showed label in 17-OH C18:0, the Idcarbon acids and 9-HDAA. Neither
treatment gave labelled 12-carbon hydroxy acids. Furthermore, the inhibited samples
showed a significant increase in the total amount of 14- and 12-carbon hydroxy acids (data
not shown). This accumulation may be due to an inhibition of P-oxidation from 9-HDAA
onward. The observation that the labelling patterns were parallel for both treatments from
13-OH C 14:O to 9-HDAA also supports the idea that P-oxidation from 17-OH C 18:O to 9-
HDAA is tightly coupled with little exchange of intermediates. The last cycle of P- oxidation from 9-HDAA to 9-HDA and further to 7-HOAA may be completed by a
different set of enzymes.

Table 111.17. Incorporation of label from 1 2-Dl octadecanoic acid into e l -hydroxy acids in queens, in the absence and presence of a P-oxidation inhibitor (2-fluorooctadecanoic acid).
treatment
Dl C18:O Dl C18:0/2-F C18:O blank
Dl C18:O Dl C18:0/2-F C18:O blank
(% labelled material) mean +I- S.E. a
product 17-OH C18:O 13-OH C14:O 13-OH C14:l 11-OH C120
(% labelled material) mean +I- S.E. a
product 11-OHC12:l 9-HDAA 9-HDA ODA
"or bold entries, treatments and blanks differed significantly (Pe0.05, Tukey); for entries marked *, Pc0.07. b The amount of labelled material was significantly higher than in the blanks. N = 8, except for entries marked ', for which N = 7.
The 18-carbon hydroxy acids were more difficult to detect in queens than in
workers, which may reflect a faster utilization of these compounds in queens. Thus, 17-OH
C18:O was probably formed in the non-inhibited runs, but was chain shortened immediately
and, hence did not accumulate. In the inhibited runs, some labelled 17-OH C18:O
accumulated. A similar effect was observed for 18-OH C18:O (Table III.8): it accumulated
only in the inhibited runs. The 14-carbon ohydroxy acids were present at trace levels and
were not analyzed. The only other ohydroxy acid that incorporated label in the inhibited
treatments was 12-OH C 12: 1.

Table 111.18. Incorporation of label from 12-Dl octadecanoic acid into mhydroxy acids in queens, in the absence and presence of a P-oxidation inhibitor (2-fluorooctadecanoic acid). .
I
" For bold entries, treatments and blanks differed significantly (Pc0.05, Tukey); for entries marked *, P~0.07. N = 8 for all treatments.
treatment
Dl C18:O DIC18:0/2-FC18:O blank
The amounts of labelled 9-HDAA, 9-HDA, ODA and 10-HDAA formed in the non-
inhibited treatment were estimated and are shown in Table III. 19. As in the workers, the
pounts of labelled material paralleled the total amounts suggesting that the queen pathway
is not affected by the addition of exogenous octadecanoic acid.
(9% labelled material) mean +I- S.E. a
product 18-OH C18:O 12-OH C12:O 12-OH C12: 1 10-HDAA
7.8 +I- 5.4 1 .O +I- 0.9 2.1 +I- 0.8 0.4 +I- 0.4 18+/-5 * 2.3+/-1.2 3.8 +I- 0.8 0.0 +I- 0.0 7.2 +I- 4.2 2.3 +I- 0.9 1.5 +I- 0.7 0.0 +I- 0.0
Table 111.19. Amount of labelled mandibular acids formed from Dl C18:O in queens.
treatment (amount of labelled material (ng)) mean +I- S. E." product 9-HDAA 9-HDA ODA 10-HDAA
Dl C18:O blank
" For entries in bold type, treatments and blanks differed significantly (P<0.05, Tukey). b Amount of acid found in one gland from queens of the same age. N = 8 for all treatments.
15 +I- 9 269 +I- 94 1880 +I- 370 0.9 +I- 0.9 0.0 +I- 0.0 0.0 +I- 0.0 560 +I- 370 0.0 +I- 0.0
total (pglb
The incorporation of label into the 18-carbon hydroxy acids shows that
hydroxylation precedes P-oxidation in the conversion of octadecanoic acid to the 10-carbon
1.2 +I- 0.4 27 +I- 7 50 +I- 12 1.3 +I- 0.3

hydroxy acids in both castes. Furthermore, the different patterns of inhibition of P- oxidation by 2-F C18:O in queens and workers are consistent with the hypothesis that the
castes have different specificities in P-oxidation. Finally, workers and queens produced
labelled o and ol-hydroxy acids in the ratio found in their normal blends which indicates
that the exogenous octadecanoic acid did not alter the caste-specificity of the pathway.
111.7 The functionalization reaction
The hydroxylation reaction is the first point at which the key structural difference
between the caste-specific compounds, the o and ol-hydroxy group, is introduced. Thus,
the mechanism of this important step was investigated using substrates labelled at or next to
the hydroxylation site and determining the loss or retention of label. Hydroxylation can
occur by two routes (Figure III.6): direct introduction of the hydroxy group by a
cytochrome-P450 fatty acid hydroxylase (I-center reaction) or by desaturation, followed by
hydration of the double bond (2-center reaction).
N ADPH NADPH H)- -
0 2 'Y -
0 2
Figure 111.6. Possible routes of hydroxylation.

To distinguish the two routes of hydroxylation for the whydroxy acids, worker
glands were treated with 18,18,18,17,17-D5 C 18:O. If hydroxylation takes place by a 1 -
center reaction, the products should be Dq and if the 2-center route is operative, the
products should be D3. The results are shown in Table III.20.
Table 111.20. Hydroxylation at the oposition in workers
treatment
labelling pattern
DS C18:O blank
(% labelled material) mean +I- S. E. " product
" For entries in bold type, treatments and blanks differed significantly (P4.05, Tukey). b Analyzed by only using the front of the GC-MS peak to calculate the % labelled material. N = 8 for all treatments.
Incorporation of 4 D into 10-HDAA and 10-HDA was significant; incorporation of
3 D was not. This suggests that hydroxylation at the oposition occurs by a 1-center
reaction, possibly catalyzed by a cytochrome P450. Labelled substrate was incorporated
into 10-HDAA and 10-HDA only in the absence of 2-F C18:O which indicates that
incorporation of the D5 C18:O occurred by the same pathway as that of Dl and D3 C18:O in
previous experiments and that the results were not due to impurities in the D5 C18:O.
To verify the previous result, worker glands were perfused with D3 C18: 1 and D3 ClO: 1 ~ ~ .
No incorporation of terminal alkenoic acids was observed (Table III.21), which confirms
that ohydroxylation does not proceed by hydration of a terminal double bond.

Table 111.21. Assay of terminal alkenoic acids for incorporation into 0 hydroxy acids.
treatment I (% labelled) mean +I- S. E. product 8-HOAA 10-HDAA 10-HDA
None of the treatments differed significantly from the blank (P<0.05) N = 4 for all treatments
D3 c18:1A1' D3 ~ 1 0 : 1A9 blank
To distinguish the hydroxylation routes for the ol-hydroxy acids, worker glands
2.3 +I- 1.9 0.0 +I- 0.0 0.4 +I- 0.3 2.5 +I- 1.5 1.7 +I- 0.3 5.8 +I- 4.1 0.4 +I- 0.5 0.0 +I- 0.0 4.7 +I- 2.1
were perfused with D3 C18:O and the 9-HDA was analyzed. If hydroxylation involves a
terminal double bond, the product should be D2 and if hydroxylation is direct or involves an
0 2 / 0 1 double bond, the product should be D3. Worker glands were chosen because in
queen glands, the large amount of endogenous material made analysis for the two labelling
patterns difficult. The results are shown in Table III.22.
Table 111.22. Hydroxylation at the a-1-position in workers
treatment
D3 C l8:O blank
(9% labelled material) mean +I- S. E. " product 9-HDA
labelling pattern
" For entries in bold type, treatments and blanks differed significantly (Pc0.05, Tukey). N = 8 for all treatments.
DZ D3
Incorporation of 3 D into 9-HDA was significant and incorporation of 2 D was not.
Therefore, o 1 -hydroxylation does not involve a terminal double bond. To verify this
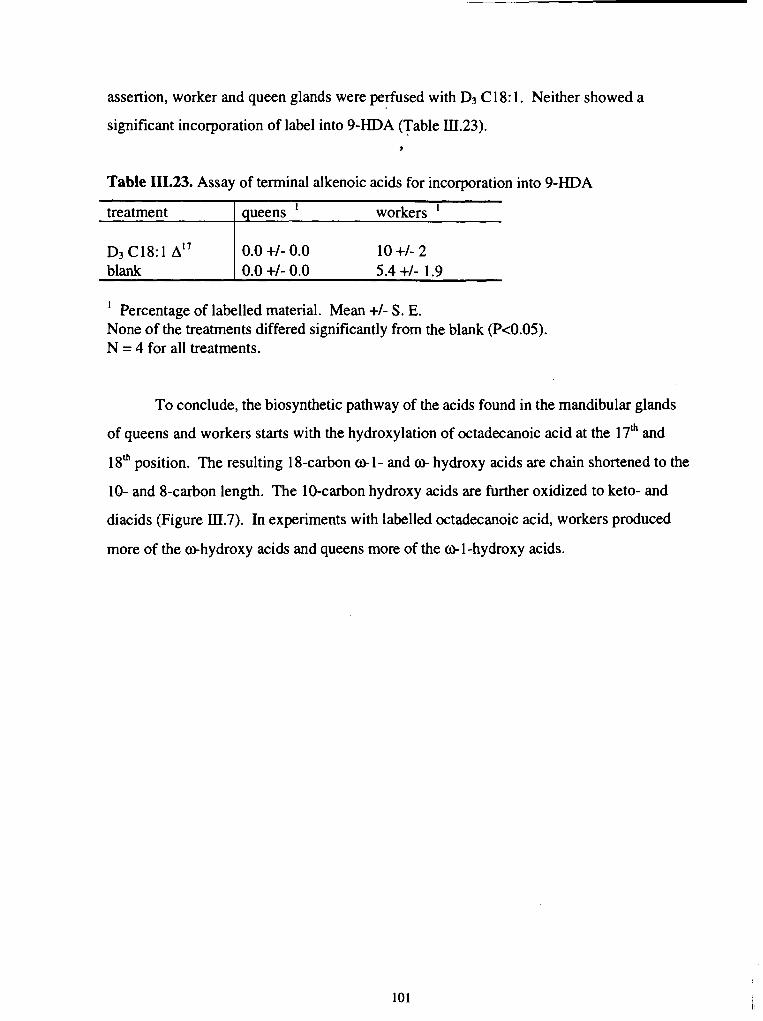
assertion, worker and queen glands were perfused with D3 C18: 1. Neither showed a
significant incorporation of label into 9-HDA (Table III.23). I
Table 111.23. Assay of terminal alkenoic acids for incorporation into 9-HDA
treatment
I Percentage of labelled material. Mean +I- S. E. None of the treatments differed significantly from the blank (Pc0.05). N = 4 for all treatments.
queens 1 workers 1
D3 C18:l A" blank
To conclude, the biosynthetic pathway of the acids found in the mandibular glands
0.0 +I- 0.0 10 +I- 2 0.0 +I- 0.0 5.4 +I- 1.9
of queens and workers starts with the hydroxylation of octadecanoic acid at the 17' and
18' position. The resulting 18-carbon o l - and o hydroxy acids are chain shortened to the
10- and 8-carbon length. The 10-carbon hydroxy acids are further oxidized to keto- and
diacids (Figure III.7). In experiments with labelled octadecanoic acid, workers produced
more of the ohydroxy acids and queens more of the ol-hydroxy acids.

I boxidat ion I
/ hydroxy group oxidation
0
OH 0
C10:l DA ODA
workers queens
Figure 111.7. Biosynthetic pathway of the mandibular acids in workers and queens. Both
castes synthesize both types of acid, but workers produce mainly 10-carbon o
functionalized acids and queens produce 1 0-carbon o 1 -functionalized acids.

Chapter IV: Discussion
IV.l. Rates of biosynthesis of functionalized acids in both castes
The rates of mandibular acid biosynthesis can be estimated from the quantities of
labelled material formed in the experiments previously described. These rates are
composites which cover several steps such as substrate uptake and conversion of FFA to
CoA esters. The error in these estimates is large because of variablilty in substrate uptake,
enzyme levels and reaction volumes between glands. However, a comparison between the
overall rate of product formation from C18:O and the rates for the individual steps is valid
within the limits of error because the same method was used for all the experiments. The
objectives of the rate analysis were to find the fastest and slowest steps and to determine
whether rates estimated for the individual steps were consistent with the overall rate of
product formation from C 18:O.
1.1 Biosynthesis of ofunctionalized acids in workers
Table IV.l. Rates of incorporation of labelled substrates into mfunctionalized acids in workers.
substrate product N glandstrep. perfusion amount of rate time (rnin) product (ng) ' (nglmin) '
D2 10-HDA 8-HOAA 8 1 20 83 +I- 14 4.1 +/- 0.7 C10:l DA 600 +I- 130 30 +/- 7
1 Mean +/- S . E. 2 The amounts of labelled 10-HDA and 10-HDAA formed from Dl C18:O were similar (Table 111.16).
The rates of formation of 10-HDAA and 10-HDA from labelled C18:O and from
Dl 18-OH C l8:O and the rate of diacid formation from labelled 10-HDAA and 10-HDA are
shown in Table IV. 1. Rates in nmol/midgland' for P-oxidation, the last round of P- oxidation and hydroxy group oxidation were estimated directly from the data in Table IV. 1
and the rate of hydroxylation was estimated from the accumulation of labelled ohydroxy
acids in the presence of 2-F C18:O and Dl C l8:O. Inhibition of P-oxidation in the presence
of 2-F C18:O manifested itself from the 12-carbon length onward (section III.6), so the
amounts of labelled 18-OH C18:O and 12-OH C12:O were added to obtain an estimate of
the total amount of octadecanoic acid hydroxylated during the perfusion' (Table IV.2).
To assess how the rates of the three steps scale relative to each other, the rate of
product formation was divided by the substrate titer in a young worker (Table IV.2).
However, because the actual substrate concentration at the reaction site is not known, this
approach gives a rough estimate, and only values one or more orders of magnitude apart
can be considered different. The rate constant for P-oxidation is larger than the constant for
hydroxylation, which suggests that P-oxidation is faster than hydroxylation. This is
consistent with the observation that the 10-carbon hydroxy acids accumulate and
18-OH C 18:O does not. The low values. for the last desaturation and for the last round of
P-oxidation suggest that the rate of P-oxidation slows down once the 10-carbon length has
been reached. Hydroxy group oxidation is slower than P-oxidation, which may explain why
the diacids are not the major products of the pathway.
' The amount of labelled 18-OH C18:O formed from Dl C18:O in 10 rnin was 5.0 +I- 1.5 ng (1.7 x nmol) and the amount of 12-OH C12:O was 23.7 +I- 5.6 ng (0.1 1 nmol). Since all the 12-OH C 12:O came from 18-OH C 18:0, the total 18-OH C 18:O formed during the perfusion of two glands must have been 0.13 nmol, giving a rate of 6.3 x lo-' nmoVmidgland.
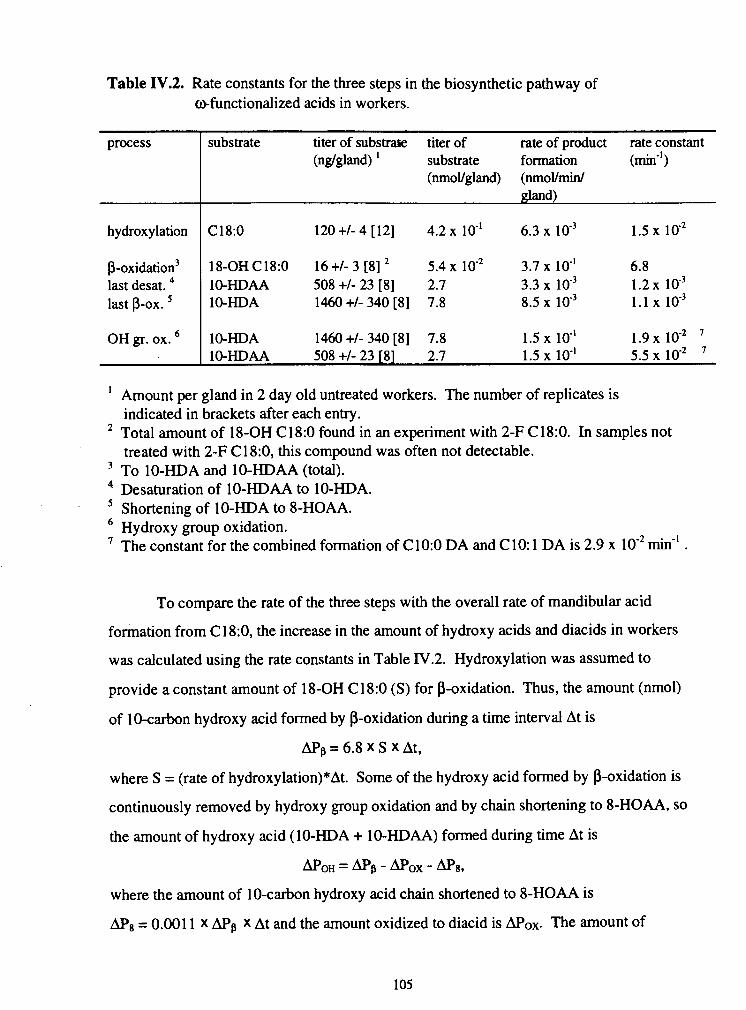
Table IV.2. Rate constants for the three steps in the biosynthetic pathway of ofunctionalized acids in workers.
process substrate titer of substrate titer of rate of product rate constant (ngkland) ' substrate formation (rnin-I )
(nmoltgland) (nrnol/minl gland)
hydroxylation C 18:O 120+/-4[12] 4 . 2 ~ 1 0 ~ ' 6.3 x 1.5 x lo-'
p-oxidation3 last desat. last p-ox. 5
Amount per gland in 2 day old untreated workers. The number of replicates is indicated in brackets after each entry. Total amount of 18-OH C18:O found in an experiment with 2-F C18:O. In samples not treated with 2-F C18:0, this compound was often not detectable. To 10-HDA and 10-HDAA (total). Desaturation of 10-HDAA to 10-HDA. Shortening of 10-HDA to 8-HOAA. Hydroxy group oxidation. The constant for the combined formation of C10:O DA and C10: 1 DA is 2.9 x rnin-I .
18-OH C 18:O 16 +/- 3 [8] ' 5.4 x lom2 3.7 x lo-' 6.8 10-HDAA 508 +I- 23 [8] 2.7 3.3 lo" 1.2 10-HDA 1460 +I- 340 [8] 7.8 8.5 x 10" 1.1 x 10"
OH gr. ox.
To compare the rate of the three steps with the overall rate of mandibular acid
10-HDA 1460 +/- 340 [8] 7.8 1.5 x lo-' 1 . 9 ~ lo-' 10-HDAA 508 +/- 23 [8] 2.7 1.5 x 10" 5.5 x lo-'
formation from C18:0, the increase in the amount of hydroxy acids and diacids in workers
was calculated using the rate constants in Table IV.2. Hydroxylation was assumed to
provide a constant amount of 18-OH C18:O (S) for P-oxidation. Thus, the amount (nmol)
of 10-carbon hydroxy acid formed by P-oxidation during a time interval At is
APp = 6.8 x S x At,
where S = (rate of hydroxylation)*At. Some of the hydroxy acid formed by P-oxidation is
continuously removed by hydroxy group oxidation and by chain shortening to 8-HOAA, so
the amount of hydroxy acid (10-HDA + 10-HDAA) formed during time At is
DOH = D p ' @OX - D s ,
where the amount of 10-carbon hydroxy acid chain shortened to 8-HOAA is
hP8 = 0.001 1 x D p x At and the amount oxidized to diacid is APox. The amount of

hydroxy acid available for oxidation is not known, so two alternative hypotheses were
tested using models: all the accumulated hydroxy acid is available for oxidation (model I),
or only the newly formed hydroxy acid (APp) is available for oxidation (model II). Thus, for
model I, the amount of hydroxy acid oxidized is APox i = 0.029 x POH i X At,
where POH i = POH i -1 + APp it the total hydroxy acid accumulated from the start to the i" time
interval. For model II the amount of hydroxy acid oxidized is APox = 0.029 x APp X At.
Calculated increase in hydroxy- and diacids in workers, model I
1500 T
0 20 40 60
time (min)
Figure IV.l. Increase in 10-HDA + 10-HDAA (+) and in C10:O DA + C10: 1 DA (W) in
workers, calculated using model I.
The amount of 10-HDA + 10-HDAA accumulated at the i" time interval is POH i =
POH i - I + APOH i and that of C 1010 DA + C 10: 1 DA is Pox = Pox i-l + APox. The amount
obtained after each iteration was converted from nmol to ng to allow comparison of the
results from the model with results from experiments with labelled C18:O. In model I, the
amount of hydroxy acid initially increases but eventually decreases, while the amount of
diacid rises (Figure IV. 1). This would mean that workers accumulate mostly diacids in their
mandibular glands. Since this is not consistent with experimental observation, the

assumption that all the accumulated hydroxy acid is available for hydroxy group oxidation is
not correct. The reactions may occur in different subcellular compartments and the hydroxy
acids may continuously be removed for secretion. Both of these factors would limit the
amount of substrate available for a given step.
Calculated increase in hydroxy- and diacids in workers, model II
+OH acids
0 10 20 30 40 50 60
time (min)
Figure IV.2. Increase in the amount of 10-HDA + 10-HDAA (+) and of
C 10:O DA + C 10: 1 DA ( 0 ) in workers, calculated using model II. The increase is linear
giving y = 22x + 5.2 for the hydroxy acids and y = 2 . 3 ~ for the diacids.
The outcome of model I1 depends on the time interval, At, chosen. The larger the
interval, the smaller the ratio of hydroxy acid:diacid formed. The experimentally observed
ratio is ca. 10, and the time interval at which hydroxy acid:diacid is close to 10 in model I is
3 min, so At = 3 min was used for the iterations in model II. This calculation gave a linear
pattern (Figure IV.2) which allowed to estimate the amount of total hydroxy acids and
diacids formed per day. The calculated values were within the range of estimates obtained
from experiments with labelled C18:O (Table IV.3). This suggests that the independent rate

sis estimates for the three steps are con
and diacids from C l8:O.
;tent with the overall rate of formation of hydroxy-
Table IV.3. Comparison of observed and calculated daily rates of appearance of hydroxy and diacids in young workers.
model 11 1 63 6.5
Source of estimate
I mean +/- S. E. Treatment of individual worker glands for 20 min with Dl C18:O.
3 See Table III. 16. N. D. = not determined
rate of appearance of rate of appearance of 10-HDA + 10-HDAA C10:O DA + C10:l DA (pgldaylworker) (pgldaylworker)
To conclude, f3-oxidation is the fastest step in the pathway, which means that the
total product accumulated is limited by the rate of hydroxylation. Furthermore, only the
hydroxy acid formed during a short time interval appears to be accessible to oxidation. The
hydroxy acids accumulate away from the site of biosynthesis, possibly in the central
reservoir of the mandibular glands. Biosynthesis may occur in the glandular cells that are
embedded in the glandular epithelium. Ducts connect the glandular cells to the reservoir
and may provide an avenue for collection of glandular products (Vallet et al. 1991). The
contents of the central reservoir are secreted through a pore in the mandible (Winston
1987). The increase in total hydroxy acid titer in the mandibular glands as workers age
(Figure I. 1) is ca. 2 pg/day/worker2, but 63 pg/day/worker are biosynthesized. This means
Estimated from the slopes of the lines obtained for the increase in 10-HDA and 10- HDAA with age in workers (Figure I. 1, p. 5).
that secretion may be slightly slower than biosynthesis: ca. 61 pglday of hydroxy acid (of
which ca. 46 pg is PO-HDA) must be secreted in young workers.
r
The functions of the worker-produced acids in the colony are not fully understood.
If these acids were only components of brood food, one would expect their production to
cease when workers shift from brood tending to other tasks. However, foragers have the
highest levels of hydroxy acids in their mandibular glands (Boch and Shearer 1967,
Robinson et al., unpublished observation). Unlike the hypopharyngeal glands (which are
associated with brood care), the mandibular glands do not diminish in size as workers age,
although their microscopic appearance and enzyme profiles change (Vallet et al. 1991,
Costa-Leonardo 1980). One possible role of 10-HDA produced by older workers may be
inhibition of precocious foraging among younger nestmates. Young workers progress
through age polyethism faster when they are kept isolated from older workers than when
workers of all ages are present. Conversely, old workers assume tasks of younger ones
when they are kept in isolation from other age groups (Winston and Fergusson 1985). This
effect could be mediated by an inhibitor of JH III biosynthesis that is produced by older
workers. There are two reasons why 10-HDA is a good candidate inhibitor. First, this
compound accumulates in the mandibular glands as workers age, which would be consistent
with the observation that old workers inhibit the onset of foraging in younger nestmates and
among each other when no young bees are present. Second, 10-HDA structurally
resembles ODA which is known to inhibit JH III biosynthesis (Kaatz et al. 1992). The
potential primer effect of 10-HDA has been suggested previously in the context of larval
development (Kinoshita and S hue1 1975).
The experiments described in this thesis were done with young workers. Therefore,
it is not known whether the rates of biosynthesis and secretion change as workers age.
Possibilities for future work include studying the ontogeny of biosynthesis, following the
fate of 10-HDA and the other worker acids in the hive and determining the role of the
mandibular acids produced by foragers.

1.2 Biosynthesis of ol-functionalized acids in queens
The estimated rates of formation of 9-FDA and ODA from labelled C 18:O and
17-OH C18:0, and of oxidation of 9-HDA to ODA in queens are summarized in Table IV.4.
As with workers, the rates and rate constants for the three steps in the biosynthesis of ODA
and 9-HDA were calculated to find the fastest and the slowest step (Table IV.5).
Table IV.4. Rates of incorporation of labelled substrates into ol-functionalized acids
ODA 10 1880 +I- 370 10 +I- 2 9-HDA 270 +I- 90 1.4 +I- 0.5
substrate product perfusion amount of labelled rate time (min) product (ng) ' (nmollrnin)
D2 9-HDA 1 ODA 10 180 +I- 70 1 .O +I- 0.4
D3 17-OHC18:O
1 Mean +I- S. E. 2 Rate of product formation. All these experiments were done with 1 gland/replicate. N = 8 for all treatments.
ODA 10 230 +I- 210 1.2 +I- 1.2 9-HDA 62 +I- 42 0.3 +I- 0.2
The rate of hydroxylation was estimated from the experiment with 2-F c18:03. The
rate of P-oxidation was estimated as the rate of appearance of labelled 9-HDA and ODA
with D3 17-OH C18:O as substrate. The rate of oxidation of 9-HDA was obtained from the
experiment with D2 9-HDA (Table IV.5). Rate constants were estimated by dividing the
rate by the substrate titer. As in workers, P-oxidation in queens was faster than
hydroxylation, and hydroxy group oxidation was slower than P-oxidation.
During the 10 min perfusion, 17-OH C18:O (1.3 +I- 0.6 ng, 0.004 nmol), 13-OH C14:O (1 1 +I- 2 ng, 0.045 nmol), 1 1-OH C12:O (12 +I- 5 ng, 0.056 nmol) and 1 1-OH C12: 1 (15 +I- 11 ng, 0.072 nmol) accumulated. Since all the shorter hydroxy acids were derived form 17-OH C 18:0, the total amount of C18:O hydroxylated was 0.177 nmol, which gave a rate of 1 . 7 7 ~ nmol/min/gland.

The rate constants were used to model the increase in 9-HDA and ODA in queens in
the same way as the ofunctionalized acids were modelled in workers, except that no chain
shortening of 9-HDA to 7-HOAA was included. The experimentally observed ratio of total
ODA:9-HDA is ca. 2.5 in mated queens (Pankiw et al. in preparation). Model II was run
with a time interval of 6 rnin, which gave a ratio of ODA:9-HDA close to 2.5 and a linear
increase with time for both compounds (Figure IV.3).
Table IV.5. Rate constants for the three steps in the biosynthetic pathway of o l- functionalized acids in queens.
process
I The number of replicates is indicated in brackets after each entry. 2 Titer in untreated queens of the same age. 3 Titer of 17-OH C 18:O in queens treated with 2-F C 18:O. In untreated queens this
compound was not detectable. 4 Titer in a newly emerged queen.
substrate titer of substrate titer of rate of product rate constant (W/gland) substrate formation (min-' ) mean +/- S . E. ' (nmoVgland) (nmoYmin/gland)
hydroxylation
P-oxidation
OH gr. ox.
The ratio of final products was used to find the optimum time interval for the
iterations in the model. Therefore, the model only indicates whether the calculated overall
rate of mandibular acid biosynthesis from C18:O is consistent with the experimentally
determined rate. It does not give insight into how the ratio of ODA:9-HDA arises. Even if
oxidation of 9-HDA is slightly slower than P-oxidation, ODA can be the major product of
the pathway, if removal of 9-HDA is slower than oxidation and therefore a large proportion
of the 9-HDA is available for oxidation.
C 18:O 1 18 +/- 20 [712 0.42 1.8 x 4.2 x loe2
17-OH C 18:O 1.4 +/- 0.4 [813 4.7 x 1.6 x lo-' 3.3
9-HDA 140 +/- 30 [814 0.75 9.8 x lom2 1.3 x lo-'

Calculated increase in ODA and 9-HDA in queens, model II
60
time (min)
Figure IV.3. Increase in the amount of ODA (m) and 9-HDA (+) in queens, calculated
using model 11 with At = 6 rnin. The increase is linear giving y = 19x + 155 for 9-HDA and
y = 35x for ODA.
Table IV.6. Comparison of observed and calculated daily rates of formation of 9-HDA and ODA in queens.
Source of estimate
model 11 1 55 1 44
rate of formation of 9-HDA rate of formation of ODA (pgldaylqueen) (pgldaylqueen)
experiment with Dl C18:O
Naumann et al. (199 1) I N. D. 204 +I- 192 1
I Mean +I- S. E.
77 +I- 27 I 54 1 +I- 105 1
Daily production of 9-HDA and ODA was estimated from model I1 and from the
experiment with Dl C18:O to allow comparison with data from Naumann et al. (1991). The
calculated rate of 9-HDA formation was close to the experimental value; the rate calculated

for ODA was lower (Table IV.6). However, the blanks in the experiment with Dl C18:O
showed some apparent labelling in the ODA (Table III. 19, p. 97) and this artifact may have
also affected the treatments, thus giving an overestimate. Correcting for this apparent label
in the blanks, 380 +I- 210 pgldaylqueen were obtained, which overlaps with the range
obtained by Naumann et al. (1991). Thus, queens produce between 1 and 2 queen
equivalents (Qeq) per day, where 1 Qeq consists of 200 pg of ODA and 80 pg of 9-HDA
(Pankiw et al. in preparation). One Qeqlday is the best dose in practical applications of
synthetic queen mandibular pheromone, such as suppression of emergency queen rearing
(Winston et al. 1991), delaying of swarming (Winston et al. 1990) and stimulation of pollen
foraging in small colonies (Higo et al. 1992).
IV.2. Determination of caste-specificity in mandibular acid biosynthesis
The final objective of this work was to determine which step(s) in the pathway
control the caste-specific pattern of mandibular acids in workers and queens. This
information can be obtained from the experiments described in Chapter III by comparing the
conversion of w- and ol-functionalized acids at each step in both castes.
2.1 Hydroxylation
The accumulation of hydroxy acids with more than 12 carbons in the presence of
2-F C18:O allows to estimate of the amount of 17- and 18-hydroxyoctadecanoic acid
formed during the perfusion. Comparison of these two amounts should give an indication
of the hydroxylation preference. The results of this calculation are presented in Table IV.7.
In workers, ohydroxylation was slightly, but not significantly, higher than o l-
hydroxylation and the opposite was true in queens. Therefore, even though hydroxylation is
the step at which the functionalization pattern is introduced, no significant bias towards CO-
or o 1 -hydroxylation was observed in workers or queens. -

Table IV.7. Amounts of labelled hydroxy acids, 12- 18-carbons long, accumulated during 10 rnin perfusions with Dl C 18:O and 2-F C 18:O.
caste glandslrep. amount accumulated (nmol) ' hydroxy group position o 01
workers
' Mean +/- S. E. N = 8 for both castes. The amounts of accumulated o and o 1 hydroxy acids did not differ significantly within each caste (Kruskal-Wallis P>0.05).
2 0.13 +/- 0.03 0.09 +/- 0.03
queens
Both queens and workers were able to chain-shorten 18-OH C18:O (Section III.5).
Queens preferentially chain shortened 18-OH C 18:O to the 8-carbon length, while workers
shortened it to the 10-carbon length. The observed ability of mated queens to chain-shorten
18-OH C18:O is consistent with their high 8-HOAA titer. For example, the queens whose
9-HDA, ODA and 10-HDA titer was shown in Figure 1.2, had 76 +/- 8 pg (N = 29) of
8-HOAA in their mandibular glands. Chain shortening of 17-OH C18:O to 10-carbon
hydroxy acids occurred to a much larger extent in queens than in workers (Table IV.8).
However, it was not possible to determine whether workers have a very low chain
shortening activity for ol-hydroxy acids or whether they channel 17-OH C18:O into other
products that were not analyzed.
1 0.73 +/- 0.52 0.77 +/- 0.54

Table IV.8. Rates of P-oxidation of 18- and 17-hydroxyoctadecanoic acids in workers and mated queens.
rate of formation of themajor chain
workers 7.0 x 10 -4 3
queens 1 . 6 ~ lo-'
1 Rate of appearance of labelled 10-HDA and 10-HDAA from Dl 18-OH C 18:O. 2 Rate of appearance of labelled 8-HOAA from Dl 18-OH Cl8:O.
Rate of appearance of labelled 9-HDAA and 9-HDA from D3 17-OH C l8:O. 4 Rate of appearance of labelled 9-HDA and ODA from D3 17-OH C 1 8:O.
The caste-specific pattern in P-oxidation can arise gradually or at one point in the
chain shortening sequence. The amount of o and ol-hydroxy acids formed from
Dl C18:O was compared at the 18-, 12- and 10-carbon length (Figure IV.3), to find the
point at which different specificities in P-oxidation became apparent. There was no
significant difference in the amounts of o and o l -hydroxy acids (Kruskal-Wallis, P4.05)
at the 18- and 12-carbon length, but at the 10-carbon length differences in amounts were
pronounced in both castes. Workers had significantly more labelled 10-HDAA than
9-HDAA and 10-HDA than 9-HDA. In queens the pattern was reversed. This suggests
that workers preferentially release ohydroxy acids from further P-oxidation at the 10-
carbon length and queens release ol-hydroxy acids at that length.

workers
compound
queens
compound
Figure IV.4. Amount of labelled 18-, 12- and 10- carbon w and wl-hydroxy acids formed
from Dl C18:O in workers and queens. The idcarbon hydroxy acids were not detected and
the 14-carbon hydroxy acids showed no significant incorporation of label. Each datum
point represents the mean of 8 replicates. The compound names indicate the chain length
and the presence (: 1) or absence (:O) of an (E)2 double bond.
Inhibition by 2-F C18:O (section III.6) manifested itself at the same chain length as
specificity in p-oxidation. This observation suggests that p-oxidation from the 18- to the

12-carbon length is tightly coupled and not specific for hydroxy group position. From that
point onward, P-oxidation may be continued by a different set of enzymes specific for
shorter chain lengths and for hydroxy group pesition.
2.3 Hydroxy group oxidation
Workers were able to oxidize ohydroxy acids to diacids, but not ol-hydroxy acids
to keto acids. Preliminary in vitro studies with worker mandibular gland homogenates
revealed that the hydroxy group oxidation activity is specific for 10-carbon ohydroxy acids
(G. Sutherland, unpublished observation). These results ruled out the possibility that intact
worker mandibular glands did not oxidize 9-HDA because of poor substrate uptake. Thus,
hydroxy group oxidation enhances the caste-specific pattern that is established by
P-oxidation of the hydroxy acids in workers (Figure IV.4).
In queens, the specificity of hydroxy group oxidation appeared to change with age.
Young virgin queens oxidized ohydroxy acids to diacids, but they did not significantly
oxidize 9-HDA to ODA (Table III.6). However, young queens must have some 9-HDA
oxidizing activity because they always have low levels of ODA in their mandibular glands
(Slessor et al. 1990). This activity may have been too low to detect by the method used in
this study. Mated queens oxidized 9-HDA, but oxidation of o-hydroxy acids was not
detected. Mated queens have traces of the diacids, so they probably retain some o
oxidizing activity as they age. The picture gained from these observations is that young
queens preferentially oxidize ohydroxy acids, while older mated queens oxidize mainly
9-HDA.
2.4 Biosynthesis of mandibular acids in workers and queens
Biosynthesis of mandibular acids in workers begins with the hydroxylation of
octadecanoic acid at the 17' and 18' position (Figure IV.4). There appears to be no

preference for one or the other position. The 18-carbon hydroxy acids are chain shortened
by P-oxidation to the 10-carbon length. Workers chain-shorten 18-OH C18:O much faster
3.0 x 10⁻¹ I diacids
Figure IV.5. Caste-specific biosynthesis of mandibular acids in workers. Estimated rates
(nmoVmin/gland) for the three steps of the pathway are indicated next to the arrows
(hydroxylation p. 114, P-oxidation p. 115, hydroxy group oxidation p. 105). The major
component of the blend is shown in bold type.
than 17-OH C18:0, as judged by the conversion of these compounds into 10-carbon
hydroxy acids. The ohydroxy acids are oxidized to the corresponding diacids, but the o l -
hydroxy acids are not detectably oxidized to keto acids. Thus, P-oxidation and hydroxy
group oxidation determine the caste-specific biosynthesis of ofunctionalized acids in
workers.
Queens begin their biosynthesis like workers do, with the unbiased hydroxylation of
octadecanoic acid (Figure IV.5). Unlike workers, queens P-oxidize both 17- and
18-hydroxyoctadecanoic acids; the former to the 10-carbon length and the latter to the
8-carbon length. The pattern of hydroxy group oxidation in queens is opposite to the
pattern in workers. Queens oxidize 9-HDA to ODA, but they probably oxidize ohydroxy
acids to diacids only to a small extent. Therefore, P-oxidation and hydroxy group oxidation
are responsible for the preponderance of 10-carbon ol-functionalized acids in mature
queens.

I 9.8 x 10⁻²
wo " ODA
Figure IV.6. Caste-specific biosynthesis of mandibular acids in mated queens. Estimated
rates (nmoVmin/gland) for the three steps of the pathway are indicated next to the arrows
(hydroxylation p. 114, P-oxidation p. 115, hydroxy group oxidation p. 11 1). The major
component of the blend is shown in bold type.
2.5 The order of the steps in the pathway and the high output of the mandibular
glands
The total production of mandibular acids in queens and workers is higher than the
production of semiochemicals in other insects. For example, females of T. ni have 225 +/-

17 ng of (Z)7-dodecenyl acetate in their pheromone glands (Jurenka et al. 1994), ca. three
orders of magnitude less material than the amount of ODA in queen mandibular glands.
Furthermore, the biosynthetic pathway of mandibular acids in honey bees is longer than
other semiochemical biosyntheses. These observations lead to the question why the bees do
not use a shorter pathway, such as hydroxylation of decanoic acid to 9- and 10-HDAA,
followed by desaturation. Precursor availability and the hydroxylation reaction may help to
explain why mandibular acids are synthesized by the observed pathway. The precursor,
octadecanoic acid, is one of the most abundant free and lipid-bound fatty acids in the gland.
Furthermore, the results from the experiments with labelled acetate and other fatty acids
suggest that hexa- and octadecanoic acids are synthesized directly from acetate and that
shorter acids are derived from hexadecanoic acid by chain shortening. Therefore, a pathway
in which decanoic acid was hydroxylated would be nearly as long as the observed pathway.
Product inhibition of the hydroxylation reaction may be a possible reason why decanoic acid
is not the hydroxylation substrate in the mandibular glands.
The ohydroxylation of octadecanoic acid is a one-center reaction, most likely
catalyzed by cytochrome P-450 fatty acid hydroxylase. The of-hydroxylation does not
proceed by an intermediate with a terminal double bond and may be catalyzed by a similar
hydroxylase. Some cytochromes P-450 are known to be inhibited by their product. For
example, ecdysone 20-monooxygenase is inhibited by 20-hydroxyecdysone (Mitchell and
Smith 1986). A polysubstrate monooxygenase preparation from houseflies, which converts
(Z)9-tricosene to 10-keto-(Z) 14-tricosene via the corresponding alcohol, is inhibited by 10-
keto-(Z) 14-tricosene (Guo et al. 1991). A rnicrosomal fatty acid hydroxylase preparation
from rat liver, which hydroxylates dodecanoic acid at the 11 and 12 position, is inhibited by
12-OH C 12:O (Ellin et al. 1973). If o and o l fatty acid hydroxylation in the mandibular
glands is inhibited by one or both products, glandular output would be curtailed as products
accumulate. Continuous removal of 17- and 18-OH C18:O by rapid P-oxidation prevents
the accumulation of these compounds and may thereby minimize product inhibition of
hydroxylation.

Future in vitro studies of hydroxylation, P-oxidation and hydroxy group oxidation
with gland homogenates will give insights into the subcellular location of these activities,
their cofactor requirements, kinetic pararnetervand inhibition patterns. The hydroxylation
reaction is of interest because few fatty acid hydroxylases, whose function is known, have
been studied in insects. Studies of P-oxidation and hydroxy group oxidation will delineate
how the caste-specific pattern of mandibular acid biosynthesis arises in queens and workers.
2.6 Changes in caste-specificity with age and colony state
The composition of the MC changes in queens during their ontogeny and in some
workers as a consequence of queenlessness. In newly emerged queens, the major o
hydroxy acid is 10-HDA; 8-HOAA is present in smaller quantities. In mated queens, this
pattern is reversed: 8-HOAA is the major ohydroxy acid (Figure IV.7). Furthermore, in
young queens the quantity of ohydroxy acids is equal to the quantity of ol-functionalized
acids. As queens age, the quantity of the latter increases relative to the ohydroxy acids.
These changes may be due to a shift in P-oxidation from a worker-like specificity to the
characteristic queen specificity and an increase in the ability to oxidize 9-HDA.
Ontogeny of o-hydroxy acids in queens
Figure IV.7. Ontogeny of 8-hydroxyoctanoic (8-HOAA) and 10-hydroxy-(E)2-decenoic
acid (10-HDA) in queens (Plettner et al. unpublished observation).

In contrast to queens, workers in a queenright colony do not experience a change in
the composition of their MC as they age (Figure I. 1). However, when a colony becomes
queenless, a false queen can occasionally arise, False queens have a MC intermediate
between that of a queenright worker and a mature queen. These individuals must therefore
gain the ability to oxidize 9-HDA and may also experience a shift in the specificity of
P-oxidation similar to young queens. The observation that false queens only arise after
prolonged queenlessness suggests that the biosynthetic pattern characteristic of workers is
maintained by inhibition of queen-specific P-oxidation andlor 9-HDA oxidation in
queenright colonies. When this unknown inhibitory factor disappears after loss of the queen
and the brood, a few individuals become false queens. Numerous studies with queenless
workers reveal that MC composition in workers does not correlate with their ovarian
development (Plettner et al. 1993 and references therein), so mandibular acid biosynthesis
and ovarian development may be under separate control. Furthermore, different subspecies
of Apis mellifera and different strains within these subspecies vary in their ease of false
queen formation, which suggests that there is a genetic predisposition for this phenomenon
(Robinson et al. 1990).
IV.3 Concluding remarks
The present study outlines the biosynthetic pathway of the o and o l -
functionalized locarbon acids found in the mandibular glands of workers and queens. The
precursor to these compounds is octadecanoic acid which can be incorporated directly or
synthesized de novo from acetate. Conversion of octadecanoic acid to the 10-carbon
mandibular acids requires three steps. Octadecanoic acid is hydroxylated at the o or o l-
position and the resulting 18-carbon hydroxy acids are chain shortened to the 10-carbon
length. The 10-carbon o and ol-hydroxy acids are oxidized to diacids and keto acids,
respectively.
The estimated rates of the three steps for both types of acid in both castes give
insights into the total glandular production and the caste-specificity in the biosynthesis.
Both castes hydroxylate octadecanoic acid to rde same extent, but they differ in their ability
to chain-shorten the 18-carbon hydroxy acids and to oxidize the o- and ol-hydroxy acids.
This two-point control over caste-specificity ensures that workers produce mainly 10-HDA,
only trace levels of 9-HDA and no detectable ODA, and that mature queens produce more
9-HDA and ODA than 10-HDA. Both castes, however, can hydroxylate octadecanoic acid
at the o and ol-position and therefore have the potential to produce the other caste's
characteristic compounds.
This work has led to new insights into honey bee primer pheromone production and
the establishment of distinct queen and worker chemical signals. However, many questions
remain unanswered. The mechanisms and the stereoselectivities of the o l hydroxylation
and hydroxy group oxidation are not known. These stereoselectivities are of interest
because the 9-HDA in mature queens is variable with a mean of 70 % R and 30 % S
(Slessor et al. 1990) and the two enantiomers of 9-HDA have different activities in swarm
stabilization (Winston et al. 1982). A more detailed picture of P-oxidation in queens and
workers is also of interest because it is the first caste-specific step in the pathway. The data
presented in this thesis indicate that caste-specific P-oxidation occurs from the 12-carbon
length onward. However, each cycle of P-oxidation consists of four reactions which may
not contribute equally to the caste-specific pattern.
Workers produce their characteristic mandibular acids at levels that are comparable
to 9-HDA and ODA production in queens, yet little is known about the functions of the
worker acids in the colony. Interactions between the queen and the workers that are
mediated by queen mandibular pheromone are the most extensively studied form of
chemical communication within the hive. However, many decisions, ranging from task
distribution to foraging strategy, are made by the workers and require communication
between them. Screening the worker mandibular acids for primer and releaser activities is
likely to give new insights into communication among workers.
The mandibular gland ontogeny of workers and queens and the changes in some
queenless workers present many questions for further research. The changes seen in queen
ontogeny and false queens may correlate with changes in the caste-specific enzymes of the
mandibular acid pathway. Furthermore, the maintenance of the caste-specific pattern of
mandibular acid biosynthesis in queenright workers and in mated queens may require
continuous pheromonal feedback from the colony.
Workers and queens have a characteristic pattern of mandibular acids at emergence,
which suggests that the biosynthetic capabilities of the mandibular gland are fixed during
larval development. With suitable probes, expression of the key enzymes in the pathway
may be followed through larval and adult development. Such studies will greatly enhance
knowledge about caste differentiation of physiological characters in eusocial insects and
about the communication system that is at the heart of the social structure in a honey bee
colony.

Literature cited
Abrams, S. R. 1982. Isomerization of acetyknic acids with sodium salt of 1,2- diaminoethane: a one step synthesis of megatomic acid. Can. J. Chem. 60: 1238.
Agrawal, V. P., Kolattukudy, P. E. 1978a. Purification and Characterization of a Wound- Induced oHydroxyfatty Acid:NADP Oxidoreductase from Potato Tuber Disks (Solanum tuberosum L.). Arch. Biochem. Biophys. 191: 452-465.
Agrawal, V. P., Kolattukudy, P. E. 1978b. Mechanism of Action of a Wound-Induced ~Hydroxyfatty Acid:NADP Oxidoreductase Isolated from Potato Tubers (Solanum tuberosum L.). Arch. Biochem. Biophys. 191: 466-478.
Allsopp, M. H., Crewe, R. M. 1993. The Cape Honey Bee as a Trojan Horse Rather Than the Hordes of Genghis Khan. American Bee Journal 133: 121- 123.
Ando, T., Takema, H., Rika, A., Uchiyama, M. 1988. Biosynthetic Pathway of Bombykol, the Sex Pheromone of the Female Silkworm Moth. Agric. Biol. Chem. 52: 473-478.
Amold, G., Roger, B. 1979. Group Effect on the Content of 10-Hydroxydec-2-enoic acid in the Head of Worker Bees. Apidologie 10: 35-42.
Arsequell, G., Fabrias, G., Camps, F. 1990. Sex Pheromone Biosynthesis in the Processionary Moth Thaumetopoea pityocampa by Delta- 13 Desaturation. Arch. Insect Biochem. Physiol. 14: 47-56.
Asencot, M., Lensky, Y. 1976. The effect of sugars and juvenile hormone on the differentiation of the female honeybee larvae (Apis mellifera L.) to queens. Life Sciences 18: 693-700.
Attygalle, A. B., Siegel, B., Vostrowsky, O., Bestman, H. J., Maschwitz, U. 1989. Chemical Composition and Function of Metapleural Gland Secretion of the Ant Crernatogaster deformis Smith (Hymenoptera Myrmicinae). J. Chem. Ecol. 15: 317-328.
Babler, J. H., Coghlan, M. J. 1979. A facile Method for Monoacetylation of Symmetrical Diols: Application to the Total Synthesis of Z-8-Dodecenyl Acetate, the Sex Attractant of the Oriental Fruit Moth. Tetrahedron Lett. # 22: 197 1-1974.
Barker, S. A., Foster, A. B., Lamb, D. C. , Hodgson, N. 1959. Identification of 10- ~ ~ d r o x ~ - ~ ~ - d e c e n o i c Acid in Royal Jelly. Nature (Lond.) 183: 996-997.
Beetsma, J. 1979. The Process of Queen-Worker Differentiation in the Honeybee. Bee World 60: 24-39.
Beetsma, J. 1985. Feeding behavior of nurse bees, larval food composition and caste differentiation in the honey bee (Apis mellifera L.). In: Experimental Behavioral Ecology (Ed's: B. Holldobler and M. Lindauer). Fischer Verlag, Stuttgart, pp 407-4 10.
Beilsteins Handbuch der Organischen Chemie. Springer-Verlag, Berlin.
Biemann, K. 1962. Mass Spectrometry. Mc Graw Hill, New York.
Bjorkhem, I., Harnberg, M. 197 1. ~Oxidation of Fatty Acids. J. Biol. Chem. 246: 7417-7420.
Bjorkhem, I., Jornvall, H. Zeppezauer, E. 1973. Oxidation of ~Hydroxylated fatty acids and steroids by alcohol dehydrogenase. Biochem. Biophys Res. Comm. 52: 413- 420.
Bjostad, L. B., Wolf, W. A., Roelofs, W. L. 1987. Pheromone Biosynthesis in Lepidopterans: Desaturation and Chain Shortening. In: Pheromone Biochemistry (Ed's: G. D. Prestwich and G. J. Blomquist). Academic Press Inc., London, pp 77- 120.
Blomquist, G. J., Tillman-Wall, J. A., Guo, L. Quilici, D. R., Gu, P., Schal, G. 1993. Hydrocarbon and Hydrocarbon Derived Sex Pheromones in Insects: Biochemistry and Endocrine Regulation. In: Insect Lipids: Chemistry, Biochemistry and Biology (Ed's D. W. Stanley-Samuelson and D. R. Nelson), U. of Nebraska Press, Lincoln, pp 317-351.
Blum, M. S., Novak, A. F., Taber, S. 1959. 1 0 - ~ ~ d r o x ~ - ~ ~ - d e c e n o i c acid, and antibiotic found in royal jelly. Science 130: 452-453.
Boch, R., Shearer, D. A. 1967. 2-Heptanone and 10-Hydroxy-trans-dec-2-enoic Acid in the Mandibular Glands of Worker Honey Bees of Different Ages. 2. vergl. Physiol. 54: 1-11.
Boddupalli, S. S., Estabrook, R. W., Peterson, J. A. 1990. Fatty Acid Monooxygenation by Cytochrome P-450Bbf-5 J. Bio. Chem. 265: 4233-4239.
van den Bosch, H., Schutgens, R. B. H., Wanders, R. J. A., Tager, J. M. 1992. Biochemistry of Peroxysomes. Ann. Rev. Biochem. 61: 157-197.
Brown, H. C., Geoghegan, P. 1967. The Oxymercuration-Demercuration of Representative Olefins. A Convenient, Mild Procedure for the Markovinkov Hydration of the Carbon-Carbon Double Bond. J. Am. Chem. Soc. 89: 1522- 1524.
Callow, R. K., Johnston, N. C., Simpson, J. 1959. 1 0 - ~ ~ d r o x ~ - ~ ~ - d e c e n o i c Acid in the Honeybee (Apis mellifera). Experientia 15: 42 1 -422.
Carey, F. A., Sundberg, R. J. 1983. Advanced Organic Chemistry, second Ed., Plenum, New York.
Charlton, R. E., Roelofs, W. L. 1991. Biosynthesis of a Volatile, Methyl-Branched Hydrocarbon Sex Pheromone From Leucine by Arctiid Moths (Holomelina Spp.) Arch. Insect Biochem. Physiol. 18: 81-97.
Chiron, R. 1982. New Synthesis of Royal Jelly Acid. J. Chem. Ecol. 8: 709-7 13.
Christensen, E., Gronn, M., Hagve, T.-A., Christophersen, B. 0. 1991. Omega-oxidation of fatty acids studied in isolated liver cells. Biochim. Biophys. Acta 1081: 167- 173.
Christensen, E., Hagve, T.-A., Gron, M. Christophersen, B. 0. 1989. P-Oxidation of medium chain (C8-C14) fatty acids studied in isolated liver cells. Biochim. Biophys. Acta 1004: 1 87- 195.
Clarke, S. E., Brealey, C. J., Gibson, G. G. 1989. Cytochrome P-450 in the housefly: induction, substrate specificity and comparison to three rat hepatic enzymes. Xenobiotica 19: 1 175- 1 180.
Cooke, M. J. 1987. Are we opening Pandora's box again? Am. Bee J. 127: 15-17.
Corey, E. J., Schmidt, G. 1979. Useful procedures for the oxidation of alcohols involving pyridinium dichromate in aprotic media. Tetrahedron Letters # 5: 399-402.
Costa-Leonardo, A. M. 1980. Estudios morfologicos do ciclo secretor das glandulas mandibulares de Apis mellifera L. (Hymenoptera, Apidae). Rev. Bras. Ent. 24: 143-151.
Crane, E. 1946. The World's Beekeeping Past and Present. In: The Hive and the Honey Bee (Ed. Dadant & Sons), Dadant & Sons, Illinois, Chapter 1.
Crewe, R. M. 1982. Compositional variability: the key to social signals produced by the honeybee mandibular glands. In: The Biology of Social Insects (Ed's M. D. Breed, G. D. Michener, H. E. Evans), Westview Press, London, pp 318.

Crewe, R. M., Velthius, H. H. W. 1980. False queens: a consequence of mandibular gland signals in worker honeybees. Naturwissenshafien 67: 467-469.
Devore, J. L. 1991. Probability and Statistics for Engineering and the Sciences. Third Ed. BrooksICole Pub. Co., Pacific Grove, CA.
Ellin, A., Orrenius, S., Pilotti, A., Swahn, C.-G. 1973. Cytochrome P450~ of Rat Cortex Microsomes: Further Studies on its Interaction with Fatty Acids. Arch. Biochem. Biophys. 158: 597-604.
Fabrias, G., Arsequell, G. Camps, F. 1989. Sex Pheromone Precursors in the Processionary Moth Thaumetopoea pityocampa (Lepidoptera: Thaumetopoeae). Insect Biochem. 19: 177- 18 1.
Fendrich, G., Abeles, R. H. 1982. Mechanism of Action of Butyryl-CoA Dehydrogenase: Reactions with Acetylenic, Olefinic and Fluorinated Substrate Analogues. Biochemistry 21: 6685-6695.
Foster, S. P., Roelofs, W. L. 1988. Pink Bollworm Sex Pheromone Biosynthesis from Oleic Acid. Insect Biochem. 18: 28 1-286.
Free, J. B. 1982. Bees and Mankind. George Allen & Unwin, London.
Free, J. B. 1987. Pheromones of Social Bees. Chapman and Hall, London.
Gibson, G. G., Orton, T. C., Tamburini, P. P. 1982. Cytochrome P-450 induction by clofibrate. Biochem. J. 203: 16 1 - 168.
Gotuda, H. 1991. Production of Hydroxy and 0x0 Fatty Acids by Microorganisms as a Model of Adipocere Formation. Hokkaido-Igaku-Zasshi 66: 142- 150.
Graham, S. H., Williams, A. J. S. 1966. Alkylidenecyclobutanes. Part 11. The Oxidation of Benzylidenecyclobutane and of Bis-(p-methoxyphenyl) methylenecyclobutane. J. Chem Soc. ( C ) 5655-660.
Gries, G., Li, J., Gries, R., Bowers, W. W., West, R. J., Wimalaratne, P. D. C., Khaskin, G., King, G. G. S., Slessor, K. N. 1994. (E)-l1,13-tetradecadienal: major sex pheromone component of the eastern blackheaded budworm Acleris variana (Fern.) (Lepidoptera: Tortricidae). J. Chem. Ecol. 20: 1-7.
Guo, L., Latli, B., Prestwich; G. D., Blomquist, G. J. 1991. Metabolically Blocked Analogs of Housefly Sex Pheromone: 11. Metabolism Studies. J. Chem. Ecol. 17: 1769-1781.
Hamberg, M., Bjorkhem, I. 197 1. @Oxidation of Fatty Acids. Mechanism of Microsomal o l - and o2-hydroxylation. J. Biol. Chem. 246: 74 1 1-741 6.

Heinz, E., Tulloch, A. P., Spencer, J. F. T. 1969. Stereospecific Hydroxylation of Long Chain Compounds by a Species of Torulopsis. J. Biol. Chem. 244: 882-888.
Hendry, L. B., Korzeniowski, S. H. Hindenlang, D. M., Kosaruch, Z., Mumrna, R. 0, Jugovich, J. 1975. An Economical Synthesis of the Major Sex Attractant of the Oak Leaf Roller- cis 10-Tetradecenyl Acetate. J. Chem. Ecol. 1, 3 17-322.
Higo, H. A., Colley, S. J., Winston, M. L. Slessor, K. N. 1992. Effects of Honey Bee (Apis Mellifera L.) Queen Mandibular Gland Pheromone on Foraging and Brood Rearing. Can. Ent. 124: 409-418.
Ho, P., Fulco, A. 1976. Involvement of a Single Hydroxylase Species in the Hydroxylation of Palmitate at the l , 0 2 and 0 3 Positions by a Preparation from Bacillus megaterium. Biochim. Biophys. Acta 431: 249-256.
Holldobler, B., Wilson, E. 0 . 1990. The Ants. Harvard University Press. Cambridge, Mass.
Ichihara, K., Kusunose, E., Kusunose, M. 1969. Some Properties and Distribution of the ~Hydroxylation System of Medium-Chain Fatty Acids. Biochim. Biophys. Acta 176: 704-7 12.
Johnston, N. C., Law, J. H., Weaver, N. 1965. Metabolism of 9-ketodec-2-enoic Acid by Worker Honeybees (Apis mellifera L.). Biochemistry 4: 16 15- 162 1.
Jurenka, R. A., Haynes, K. F., Adolf, R. O., Bengtsson, M., Roelofs, W. L. 1994. Sex Pheromone Component Ratio in the Cabbage Looper Moth Altered by a Mutation Affecting the Fatty Acid Chain-Shortening Reactions in the Pheromone Biosynthetic Pathway. Insect Biochem. Molec. Biol. 24: 373-38 1.
Jurenka, R. A., Roelofs, W. L. 1989. Characterization of the Acetyltransferase used in Pheromone Biosynthesis in Moths: Specificity for the Z isomer in Tortricidae. Insect Biochem. 19: 639-644.
Jurenka, R. A., Roelofs, W. L. 1993. Biosynthesis and Endocrine Regulation of Fatty Acid Derived Sex Pheromones in Moths. In: Insect Lipids: Chemistry, Biochemistry and Biology (Ed's D. W. Stanley-Samuelson and D. R. Nelson), U. of Nebraska Press, Lincoln, pp 353-388.
Kaatz, H. H., Hildebrandt, H., Engels, W. 1992. Primer effect of queen pheromone on juvenile hormone biosynthesis in adult worker honey bees. J. Comp. Physiol. B 162: 588-592.

Kaminski, L.-A., Slessor, K. N., Winston, M. L., Hay, N. W., Borden, J. H. 1990. Honeybee response to queen mandibular pheromone in laboratory bioassays. J. Chem. Ecol. 16: 841-859.
Kandil, A. A. 1985. Ph. D. Thesis: Chiral Synthesis of Insect Pheromones. Simon Fraser University, Burnaby, Canada.
Kinoshita, G., Shuel, R. W. 1975. Mode of action of royal jelly in honeybee development. Some aspects of lipid nutrition. Can. J. 2001. 53: 3 1 1 -3 1 9.
Kumar, R., Weintraub, S. T., Hanahan, D. J. 1983. Differential susceptibility of mono- and di-0-alkyl ether phosphoglycerides to acetolysis. J. Lipid Res. 24: 930-937.
Kuwahara, Y., Nakamura, S. 1985. (Z)5 and (E)5-Undecenoic Acid: Identification of the Sex Pheromone of the Varied Carpet Beetle, knthrenus verbasci L. (Coleoptera: Dermestidae). Appl. Ent. Zool. 20: 354-356.
Lazarow, P. B., de Duve, Ch. 1976. A fatty acyl-CoA oxidizing system in rat liver peroxisomes; enhancement by clofibrate, a hypolipidemic drug. Proc. Nut. Acad. Sci. (U. S. A.) 73: 2043-2046.
Lu, A. Y. H., Junk, K., Coon, M. J. 1969. Resolution of the Cytochrome P-450- containing ~Hydroxylation System of Liver Microsomes into Three Components. J. Biol. Chem. 244: 3744-3721.
Lukoschus, F. S., Keularts, J. L. W. 1968. Eine weitere Funktion der Mandibeldriise der Arbeiterin von Apis mellifica L.- Produktion eines Pollenkeimung hemmenden Stoffes. Z. Bienenforschung 9: 333-343.
~artl'nez, T., Fabrias, G., Camps, F. 1990. Sex Pheromone Biosynthetic Pathway in Spodoptera littoralis and Its Activation by a Neurohormone. J. Biol. Chem. 265: 1381-1387.
Mitchell, M. J., Smith, S. L. 1986. Characterization of ecdysone 20-monooxygenase activity in wandering stage larvae of Drosophila melanogaster. Insect Biochem. 16: 525-537.
Moritz, A., Kirchner, H., Crewe, R. M. 1991. Chemical Camouflage of the Death's Head Hawlunoth (Acherontia atropos L.) in honeybee colonies. Naturwissenschaffen 78: 179-182.
Morse, D., Meighen, E. 1984. Aldehyde Pheromones in Lepidoptera: Evidence for an Acetate Ester Precursor in Choristoneurafimiferana. Science 226: 1434-1436.

Morse, D., Meighen, E. 1987. Pheromone Biosynthesis: Enzymatic Studies in Lepidoptera. In: Pheromone Biochemistry (Ed's G. D. Prestwich, G. J. Blomquist). Acad. Press Inc., London, pp 12 1- 158.
Naumann, K., Winston, M. L., Slessor, K. N., Prestwich, G. D., Webster, F. X. 1991. Production and transmission of honey bee queen (Apis mellifera L.) mandibular gland pheromone. Behav. Ecol. Sociobiol. 29: 32 1-332.
Obin, M. S., Van der Meer, R. K. 1985. Gaster Flagging by Fire Ants (Solenopsis spp): Functional Significance of Venom Dispersal Behavior. J. Chem. Ecol. 11: 1757- 1768.
Oliver, J. E., Waters, R. M., Lusby, W. R. 1994. A Convenient Synthesis of a Fluoro Carboxylic Acids. Synthesis # 3:273-275.
Pain, J., Barbier, M., Bogdanovsky, D., Lederer, E. 1962. Chemistry and biological activity of the secretions of queen and worker honeybees (Apis mellifera L.). Comp. Biochem. Physiol. 6: 233-241.
Pankiw, T., Winston, M. L., Plettner, E., Slessor, K. N., Pettis, J. S., Taylor, 0. R. In preparation. Mandibular Gland Components of European and Africanized Honey Bee Queens (Apis mellifera L.).
Pierce, A. E. 1968. Silylation of Organic Compounds. Pierce Chemical Co. Rockford, Illinois, pp 35.
Plettner, E., Slessor, K. N., Winston, M. L., Robinson, G. E., Page, R. E. 1993. Mandibular Gland Components and Ovarian Development as Measures of Caste Differentiation in the Honey Bee (Apis mellifera L.) J. Insect Physiol. 39: 235-240.
Plettner, E., Sutherland, G. R. J., Slessor, K. N., Winston, M. L. 1995. Why not be a queen?- Regioselectivity in the mandibular secretions of honey bee castes. J. Chem. Ecol. 21: 1017-1029.
Rachinsky, A. 1990. Juvenilhormon und Ekdysteroide in der Kastenentwicklung der Honigbiene (Apis mellifera L.) Ph. D. Thesis. Eberhard-Karls-Universitat, Tiibingen, Germany.
Rembold, H., Lackner, B. Geistbeck, I. 1974. The chemical basis of honeybee, Apis mellifera, caste formation. Partial purification of queen bee detenninator from royal jelly. J. Insect Physiol. 20:307-3 14.
Robinson, G. E. 1987. Regulation of honey bee age polyethism by juvenile hormone. Behav. Ecol. Sociobiol. 20: 329-338.

Robinson, G. E., Page, R. E., Fondrk, K. 1990. Intracolonial behavioral variation in worker oviposition, oophagy and larval care in queenless honey bee colonies. Behav. Ecol. Sociobiol. 26: 3 15-323.
Robinson, G. E., Strambi, C., Strambi, A., Feldlaufer, M. F. 1991. Comparison of Juvenile Hormone and Ecdysteriod Haemolymph Titres in Adult Worker and Queen Honey Bees (Apis mellifera). J. Insect Physiol. 37: 929-935.
Ronis, M. J. J., Hodgson, E. 1989. Cytochrome P-450 monooxygenases in insects. Xenobiotica 19: 1077- 1092.
Ronis, M. J. J., Hodgson, E., Dauterman, W. C. 1988. Characterization of Multiple Forms of Cytochrome P-450 from an Insecticide Resistant Strain of House Fly (Musca Domestica). Pesticide Biochem. Physiol. 32: 74-90.
Rooney, T. A. 198 1. Theory of Chromatography. In: High Resolution Gas Chromatorgaphy (Ed. R. R. Freeman) Second Ed. Hewlett-Packard Co. pp 7-2 1.
Rosell, G., Hospital, S., Camps, F., Guerrero, A. 1992. Inhibition of a chain shortening step in the biosynthesis of the sex pheromone of the Egyptian armyworm Spodoptera littoralis. Insect Biochem. Mol. Biol. 22: 679-685.
Ruttner, F., Koeninger, N., Veith, H. J. 1976. Queen substance bei eierlegenden Arbeiterinnen der Honigbiene (Apis mellifera L.). Natunvissenschaften 63: 434.
Ryan, R. O., de Renobales, M., Dillwith, J., Heisler, Ch. R., Blomquist, G. J. 1982. Biosynthesis of Myristate in an Aphid: Involvement of a Specific Acylthioseterase. Arch. Biochem. Biophys. 213: 26-36.
Sakagami, S. F. 1958. The false-queen: fourth adjustive response in dequeened honeybee colonies. Behaviour 13: 280-296.
Schroepfer, G. J. 1966. Stereospecific Conversion of Oleic Acid to 10-Hydroxystearic Acid. J. Biol. Chem. 241: 5441-5447.
Schulz, S., Toft, S. 1993. Identification of a Sex Pheromone from a Spider. Science 260: 1635-1637.
Silverstein, R. M., Rodin, 0. J., Burkholder, W. E., Gorman, J. E. 1967. Sex Attractant of the Black Carpet Beetle. Science 157: 85-86.
Slessor, K. N., Kaminski, L.-A., King, G. G. S., Borden , J. H., Winston, M. L. 1988. Serniochemical basis for the retinue response to queen honey bees. Nature 332: 354-356.

Slessor, K. N., Kaminski, L.-A., King, G. G. S., Winston, M. L. 1990. Semiochernicals of the honey bee queen mandibula glands. J. Chem. Ecol. 16: 85 1-860.
Soliday, Ch. L., Kolattukudy, p. E. 1977. Biosynthesis of Cutin. ~Hydroxylation of Fatty Acids by a Microsoma1 Preparation from Germinating Vicia faba. Plant Physiol. 59: 11 16-1 121.
Soliday, Ch. L, Kolattukudy, P. E. 1978. Midchain Hydroxylation of 16-Hydroxypalmitic Acid by the Endoplasmic Reticulum Fraction from Germinating Vicia faba. Arch. Biochem Biophys. 188: 338-347.
Stanley-Samuelson, D. W., Jurenka, R. A., Cripps, C. Blomquist, G. J., de Renobales, M. 1988. Fatty Acids in Insects: Composition, Metabolism and Biological Significance. Arch. Ins. Biochem. Physiol. 9: 1-33.
Tasayco, M. L., Prestwich, G. D. 1990. Aldehyde-Oxidizing Enzymes in an Adult Moth: In Vitro Study of Aldehyde Metabolism in Heliothis virescens. Arch. Biochem. Biophys. 278: 44-4-45 1.
Vallet, A., Cassier, P., Lensky, Y. 1991. Ontogeny of the fine structure of the mandibular glands of the honeybee (Apis mellifera L.) workers and the pheromonal activity of 2-heptanone. J. Insect Physiol. 37: 789-804.
Vanderwel, D., Johnston, B., Oehlschlager, A. C. 1992. Cucujolide Biosynthesis in the Merchant and Rusty Grain Beetles. Insect Biochem. Mol. Biol. 22: 875-883.
Vanderwel, D., Oehlschlager, A. C. 1989. Pheromone Biosynthesis in Coleoptera. Chemica Scripta 29: 40 1 -406.
Vaz, A. H., Jurenka, R. A., Blomquist, G. J., Reitz, R. C. 1988. Tissue and Chain Length Specificity of the Fatty Acyl CoA Elongation System in the American Cockroach. Arch. Biochem. Biophys. 267: 551-557.
Weatherston, J., Roelofs, W., Comeau, A. Sanders, C. J. 1971. Studies of physiologically active Arthropod secretions. X. Sex pheromone of the Eastern Spruce Budworm, Choristoneura fumiferana. Can. Entomol. 103: 174 1 - 1747.
Weaver, N., Johnston, N. C., Benjamin, R., Law, J. H. 1968. Novel Fatty Acids From the Royal Jelly of Honeybees (Apis mellifera L.) Lipids 3: 535-538.
Willis, L. G., Winston, M. L., Slessor, K. N. 1990. Queen honey bee mandibular pheromone does not affect worker ovary development. Can. En?. 122: 1093- 1 099.
Wilson, E. 0. 1971. The Insect Societies. Harvard University Press. Cambridge, Mass.

Winston, M. L. 1987. The Biology of the Honey Bee. Harvard University Press, Cambridge, Mass.
Winston, M. L., Fergusson, L. A. 1985. The effect of worker loss on temporal caste structure of the honeybee (Apis mellifera L.). Can. J. Zool. 63: 777-780.
Winston, M. L., Higo, H. A., Colley, S. J., Pankiw, T., Slessor, K. N. 1991. The role of queen mandibular pheromone and colony congestion in the honey bee (Apis mellifera) reproductive swarming. J. Insect Behav. 4: 649-660.
Winston, M. L., Higo, H. A., Slessor, K. N. 1990. Effect of various dosages of queen mandibular pheromone on the inhibition of queen rearing in the honey bee (Hymenoptera: Apidae). Ann. Ent. Soc. Am. 83: 234-238.
Winston, M. L., Slessor, K. N. 1992. The essence of Royalty: Honey Bee Queen Pheromone. American Scientist 80: 374-385.
Winston, M. L., Slessor, K. N., Smirle, M. J., Kandil, A. A. 1982. The influence of a queen-produced substance, 9-HDA, on swarm clustering behavior in the honeybee Apis mellifera L. J. Chem. Ecol. 8: 1283- 1288.
Winston, M. L., Slessor, K. N., Willis, L. G., Naumann, K., Higo, H. A., Wyborn, M. H., Karninsky, L.-A. 1989. The influence of queen mandibular pheromones on worker attraction to swarm clusters and inhibition of queen rearing in the honey bee. Insect Soc. 36: 15-27.
Wolf, W. A., Roelofs, W. L. 1986. Properties of the A1 1 desaturase enzyme used in cabbage looper moth sex pheromone biosynthesis. Arch. Insect Biochem. Physiol. 3: 45-52.
Wolf, W. A., Roelofs, W. L. 1989. Enzymes Involved in the Biosynthesis of Sex Pheromones in Moths. In: Biocatalysis in Agricultural Technology (ACS Symposium Series 389, Ed's: J. R. Whitaker, P. E. Sonnet). Am. Chem. Soc. pp 323-33 1.
Wood, G. W., Cornwell, M., Williamson, L. S. 1989. High performance thin-layer chromatography and densitometry of synaptic plasma membrane lipids. J. Lipid Res. 30: 775-779.