CASL Photo Book · development, reactor startup testing, and core follow. Fresh fuel elements are...
65
CASL Photo Book August 7, 2014 CASL-U-2014-0177-000 CASL-U-2014-0177-000
Transcript of CASL Photo Book · development, reactor startup testing, and core follow. Fresh fuel elements are...
CASL Photo Book
August 7, 2014
CASL-U-2014-0177-000
CASL-U-2014-0177-000

Predictive science-based simulation technology that harnesses world-class computational power to enhance clean energy production
CASL-U-2014-0177-000
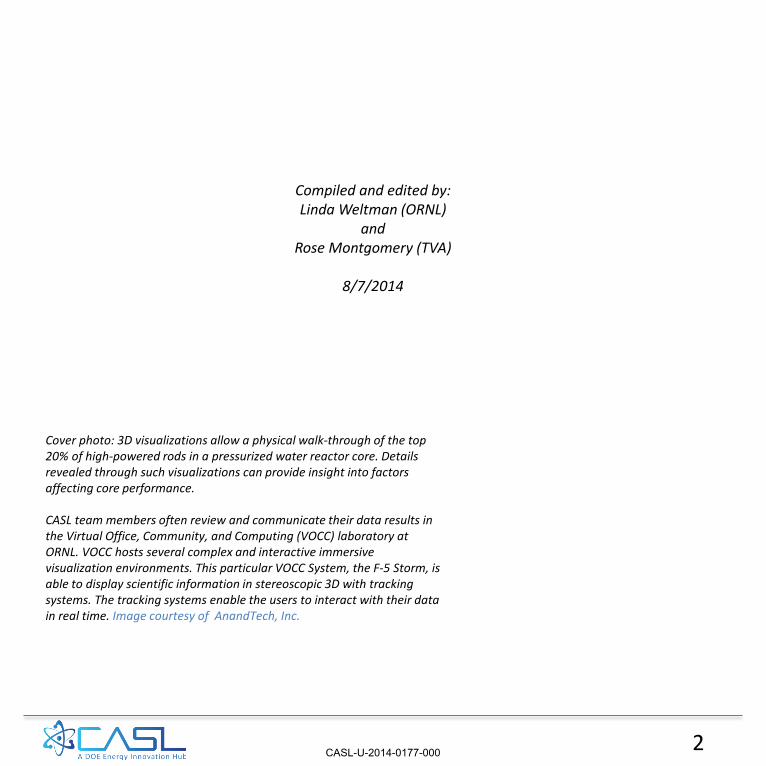
Cover photo: 3D visualizations allow a physical walk-through of the top 20% of high-powered rods in a pressurized water reactor core. Details revealed through such visualizations can provide insight into factors affecting core performance. CASL team members often review and communicate their data results in the Virtual Office, Community, and Computing (VOCC) laboratory at ORNL. VOCC hosts several complex and interactive immersive visualization environments. This particular VOCC System, the F-5 Storm, is able to display scientific information in stereoscopic 3D with tracking systems. The tracking systems enable the users to interact with their data in real time. Image courtesy of AnandTech, Inc.
2
Compiled and edited by: Linda Weltman (ORNL)
and Rose Montgomery (TVA)
8/7/2014
CASL-U-2014-0177-000

Contents Forward 5
Nuclear Energy Production 7
Modeling the Physics of a Reactor Core
Simulating the Fission Process with VERA 15 Heating and Phase Change of the Flowing Water: Thermal-hydraulics M&S 25 Fuel Performance M&S: Changes in the Fuel as it is Depleted 35
M&S of Coolant Corrosion Chemistry Effects 41
Interacting Multi-Physics modeled with VERA 47
The Virtual Environment for Reactor Applications (VERA) 53
Abbreviated Terms 63
3 CASL-U-2014-0177-000

4 CASL-U-2014-0177-000

Nuclear energy is a tremendous technological success story for the United States. A mere 25 years passed between English physicist James Chadwick’s confirmation of the neutron’s existence to the first full-scale atomic nuclear-powered electrical production plant at the Pennsylvania Shippingport Atomic Power Station in 1957—just four years after President Eisenhower gave his historical Atoms for Peace speech to the United Nations envisioning commercial nuclear power. Accelerated and translational R&D, from fundamental discovery to commercialized technology, has nevertheless proven challenging for nuclear energy; innovations are must be purpose driven in an enterprise that is inherently conservative and regulatory-driven. Translational research—a high return proposition for nuclear energy—is exactly what Energy Innovation Hubs established by the U.S. Department of Energy (DOE) strive to enable and accelerate. Hubs bring together teams of top scientists and engineers from academia, industry, and government to collaborate and overcome critical known barriers to achieving national climate and energy goals that have proven resistant to solution via the normal R&D enterprise. Hubs focus on a single topic, with the objective of rapidly bridging the gaps between basic research, engineering development, and commercialization through a close partnership with industry. To achieve this goal, the Hubs necessarily consist of large, highly integrated and collaborative creative teams working to solve priority technology challenges. For the Consortium for Advanced Simulation of Light Water Reactors (CASL), awarded as the first Hub by the DOE Office of Nuclear Energy (NE) in July 2010, the focus is on innovating commercial nuclear power generation, specifically the modeling and simulation (M&S) of nuclear reactors. CASL not only strives to bring innovation to the nuclear energy enterprise but also to help retain and strengthen U.S. leadership in two DOE mission areas: HPC-enabled M&S and nuclear energy. Nuclear energy is by far the largest clean-air energy source in the U.S. and the only clean-air energy source that produces large amounts of electricity around the clock. It is a secure source not subject to changing weather conditions, unpredictable fuel cost fluctuations, or over-dependence on foreign suppliers. Nuclear energy facilities produce no air pollution and do not emit greenhouse gases. As the U.S. moves toward a clean-energy, low-carbon economy, nuclear energy must continue to be a part of the energy mix. M&S technology is a mainstay in the nuclear industry. It informs consequential nuclear power operational and safety decisions. The slow evolution of commercial nuclear technology and its strong dependence on M&S are driven by the industry’s limited ability to perform frequent full-scale irradiated experiments due to cost, safety and feasibility, and economic uncertainties. Even industry’s advanced light water reactors (e.g., ESBWR, AP1000, EPR, SMR) rely on the current nuclear industry M&S technology, which, though continuously improved and central to the industry’s evolution, has not sufficiently capitalized on the benefits that more precise predictive simulation and fundamental understanding offer. Opportunities for reduced uncertainties in design and operating margins, as well as operating cost reductions and plant lifetime extension, are lost due to the lack of technology progression and leadership in the industry’s M&S. CASL’s mission is to recapture the benefits of leadership in M&S for nuclear technology by providing coupled, high fidelity, usable capabilities needed to address light water reactor (LWR) operational and safety performance-defining phenomena. CASL’s unique partnership of DOE National Labs, academia, and industry possesses unparalleled collective institutional knowledge, nuclear science and engineering talent, computational science leadership, and LWR design and regulatory accomplishments. The CASL Energy Innovation Hub implements organizational values driven by a well-defined yet dynamic plan with a strategy of delivering prototype products early and often as informed by active Industry and Science Councils and regular engagement with all levels of the U.S. Nuclear Regulatory Commission (NRC). CASL’s Board of Directors —chaired during its first two years by Ernest Moniz, current Secretary of Energy, and at present chaired by Dale Klein, former Chairman of the NRC - provides key oversight and advice on management and Science and Technology strategies. This book provides a pictorial of CASL’s partnership, objectives, and significant progress in achieving accelerated M&S capabilities for the advancement of reliable clean-air nuclear energy and the reestablishment of the U.S. leadership in HPC-enabled M&S and nuclear energy. The images, illustrative of CASL’s objectives, represent the leading edge of higher fidelity nuclear energy modeling and simulation.
Forward
5 CASL-U-2014-0177-000
6 CASL-U-2014-0177-000

Nuclear Energy Production
7 CASL-U-2014-0177-000

8 CASL-U-2014-0177-000
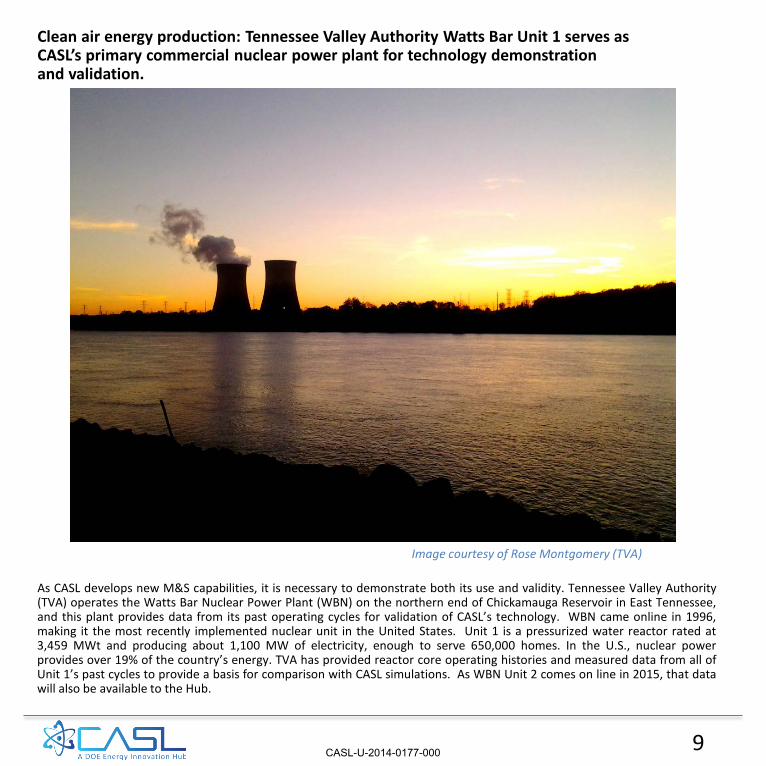
Clean air energy production: Tennessee Valley Authority Watts Bar Unit 1 serves as CASL’s primary commercial nuclear power plant for technology demonstration and validation.
Image courtesy of Rose Montgomery (TVA)
As CASL develops new M&S capabilities, it is necessary to demonstrate both its use and validity. Tennessee Valley Authority (TVA) operates the Watts Bar Nuclear Power Plant (WBN) on the northern end of Chickamauga Reservoir in East Tennessee, and this plant provides data from its past operating cycles for validation of CASL’s technology. WBN came online in 1996, making it the most recently implemented nuclear unit in the United States. Unit 1 is a pressurized water reactor rated at 3,459 MWt and producing about 1,100 MW of electricity, enough to serve 650,000 homes. In the U.S., nuclear power provides over 19% of the country’s energy. TVA has provided reactor core operating histories and measured data from all of Unit 1’s past cycles to provide a basis for comparison with CASL simulations. As WBN Unit 2 comes on line in 2015, that data will also be available to the Hub.
9 CASL-U-2014-0177-000

At the core of the commercial nuclear fleet is a nuclear workhorse - the nuclear fuel assembly. They are required to function in water, under extreme heat and pressure and in a harsh radiation environment without leaking for up to 6 long years. Watts Bar Unit 1, a Westinghouse pressurized water reactor (PWR) four-loop nuclear steam supply system (NSSS), operates a core of 193 fuel assemblies. Each assembly is about 13-feet tall and contains 264 fuel rods, for a total of 50,952 fuel rods operated in each core.
Each fuel rod is about 1/2” in diameter (about the diameter of a double-A battery), is about 12-feet long, and contains as many as 400 uranium dioxide fuel pellets, stacked end to end. The fuel rods are held in a square lattice through the use of spacer grids that are evenly spaced along the length of the fuel assembly, and the whole structure is fixed in the reactor by heavy steel blocks called nozzles. The bottom nozzle includes a filter plate to keep debris in the reactor coolant from getting to the fuel rods. In a PWR fuel assembly, several hollow tubes called guide thimbles are used to guide the reactor’s control rods within the core. Every 18 or 24 months, the reactor is refueled by removing approximately a third of the nuclear fuel assemblies in the core and replacing them with fresh fuel.
Illustration of typical pressurized light water reactor fuel assembly with a 17×17 array of fuel rods, spacer grids, guide tubes, and control rods. Image courtesy of Westinghouse Electric Company, LLC.
Control rods
Top nozzle
Spacer grid
Fuel rods
Guide thimbles
Approximately one third of the fuel in the reactor core is replaced with fresh fuel every 18 to 24 months. This image shows a used fuel assembly with the characteristic blue Cherenkov
glow (at the center of the image) being removed from the reactor core. Image courtesy of Tennessee Valley Authority
The core of a typical Pressurized Water Reactor includes 50,952 fuel rods.
10 CASL-U-2014-0177-000

Prior to operating the power production cycle, core design engineers at the fuel vendor and the utility work to ensure that the core reload pattern (also referred to as the “shuffle”) will extract the maximum amount of energy from the fuel while maintaining the required safety margins.
The nuclear reactor core design process utilizes M&S tools at each step: fuel loading plan development, safety analysis, operational data development, reactor startup testing, and core follow. Fresh fuel elements are usually alternated with partially burned fuel elements to distribute the power as evenly as possible over the core, producing a characteristic checker-board pattern power. Because the fuel loading pattern determines the energy capacity, core power distribution and fuel efficiency, it is a crucial part of the power generation process.
Once the cycle design and core loading pattern have been established, operational support data is generated by the utility and the fuel vendor. The data includes a description of the fuel design and the cycle design, and provides predictions for core reactivity and power distribution. The operational support data is used by Reactor Engineering and Operations to operate the reactor. After executing a planned shutdown of the reactor and offloading the fuel from the reactor core, Operations places the partially burned fuel along with the fresh fuel elements into the core using the core loading pattern developed by the Core Designers.
As the reactor is re-started, testing is performed to confirm the core operates as-designed. If the test results do not meet the test acceptance criteria, further action must be taken before the reactor can be operated at the rated power. The evaluation may include personnel from Operations, Reactor Engineering, Nuclear Fuel Engineering and the fuel vendor. During the operating cycle, the core’s operating characteristics are followed by Reactor Engineering and Operations using detectors and instrumentation inside the reactor core. This core follow monitoring ensures that the reactor core is running smoothly. The core cycle design process provides just one example of the potential application of CASL’s M&S technology.
Modeling and Simulation tools are essential to the efficient and safe operation of the commercial nuclear power fleet.
Pressure vessel head
Control rod drives
Fuel cavity
Reactor pressure vessel
Coolant inlet and outlet nozzles
Three-dimensional computer-aided design (CAD) physical models are used to develop simulation geometry of the combined physics processes under way in a reactor core. This model of the Watts Bar Unit 1 reactor (shown disassembled with a cutaway of the core barrel to show the fuel cavity) was developed for CASL coolant flow simulations. Image courtesy of Westinghouse Electric Company, LLC.
11 CASL-U-2014-0177-000

To enable high confidence in its predictions, a multi-physics model typically must resolve large scale (e.g., the reactor vessel, inner diameter: 173 in.), meso-scale (e.g., geometric features such as mixing vanes, height: 0.5 in.), and micro-scale (e.g., typical fuel pellet grain size: 50μm). All of the software components representing a distinct physical process form a tightly coupled environment from the large scale to the small scale.
CASL’s Virtual Environment for Reactor Applications (VERA) provides for interoperability between individual physics subcomponents and solutions (coupling) supporting a variety of physical scales and temporal scales, and further offers the ability provide upscaled, engineering solutions for faster simulation turnaround time or reduced computational intensity to support the needs of industry users.
A primary challenge in modeling and simulation of multiple, simultaneously interacting physics processes lies in the diversity of granularity required of the physical models.
A cutaway (quarter) view of the Watts Bar Unit 1 physical model showing the fuel assemblies (in green). The CASL higher fidelity simulations include much more detail than typical industry simulations, including in this model explicit rendering of the fuel assembly spacer grids, guide tubes, and nozzles. Image courtesy of Westinghouse Electric Company, LLC.
Pressure vessel head
Control rod drives
Fuel assemblies
Lower core plate
Coolant outlet nozzles
12 CASL-U-2014-0177-000
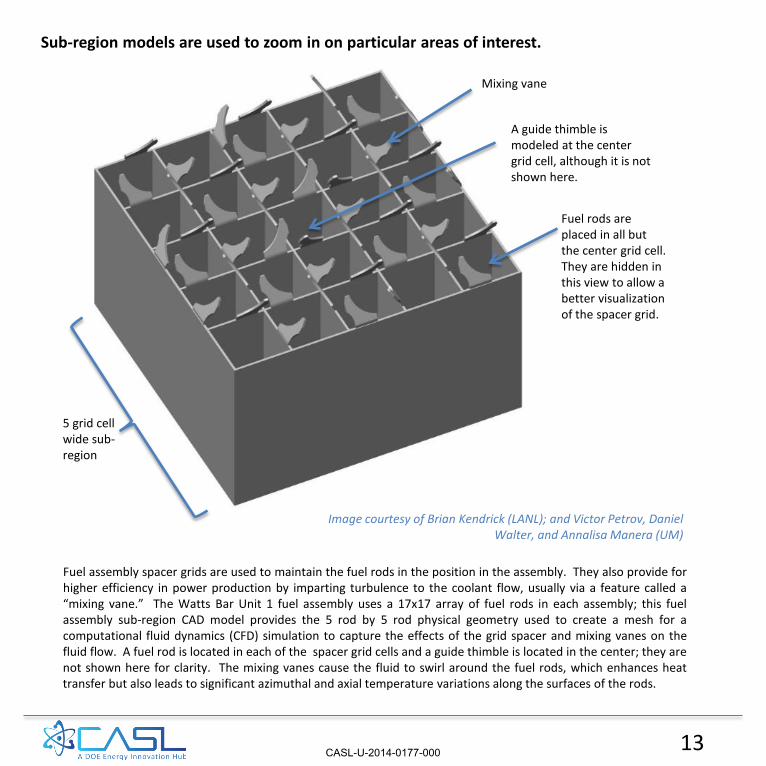
Sub-region models are used to zoom in on particular areas of interest.
Image courtesy of Brian Kendrick (LANL); and Victor Petrov, Daniel Walter, and Annalisa Manera (UM)
Fuel assembly spacer grids are used to maintain the fuel rods in the position in the assembly. They also provide for higher efficiency in power production by imparting turbulence to the coolant flow, usually via a feature called a “mixing vane.” The Watts Bar Unit 1 fuel assembly uses a 17x17 array of fuel rods in each assembly; this fuel assembly sub-region CAD model provides the 5 rod by 5 rod physical geometry used to create a mesh for a computational fluid dynamics (CFD) simulation to capture the effects of the grid spacer and mixing vanes on the fluid flow. A fuel rod is located in each of the spacer grid cells and a guide thimble is located in the center; they are not shown here for clarity. The mixing vanes cause the fluid to swirl around the fuel rods, which enhances heat transfer but also leads to significant azimuthal and axial temperature variations along the surfaces of the rods.
Mixing vane
5 grid cell wide sub-region
Fuel rods are placed in all but the center grid cell. They are hidden in this view to allow a better visualization of the spacer grid.
A guide thimble is modeled at the center grid cell, although it is not shown here.
13 CASL-U-2014-0177-000
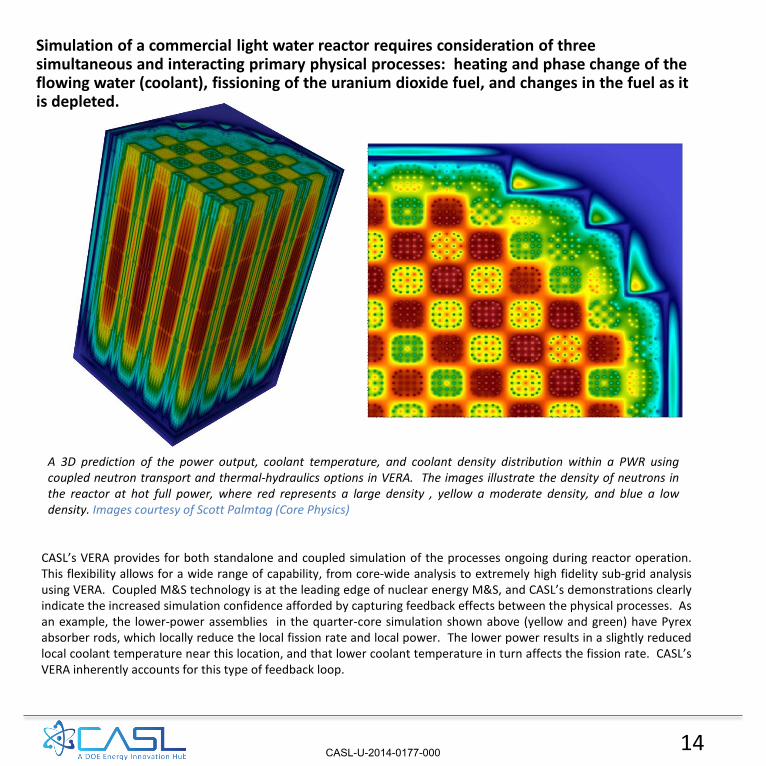
CASL’s VERA provides for both standalone and coupled simulation of the processes ongoing during reactor operation. This flexibility allows for a wide range of capability, from core-wide analysis to extremely high fidelity sub-grid analysis using VERA. Coupled M&S technology is at the leading edge of nuclear energy M&S, and CASL’s demonstrations clearly indicate the increased simulation confidence afforded by capturing feedback effects between the physical processes. As an example, the lower-power assemblies in the quarter-core simulation shown above (yellow and green) have Pyrex absorber rods, which locally reduce the local fission rate and local power. The lower power results in a slightly reduced local coolant temperature near this location, and that lower coolant temperature in turn affects the fission rate. CASL’s VERA inherently accounts for this type of feedback loop.
A 3D prediction of the power output, coolant temperature, and coolant density distribution within a PWR using coupled neutron transport and thermal-hydraulics options in VERA. The images illustrate the density of neutrons in the reactor at hot full power, where red represents a large density , yellow a moderate density, and blue a low density. Images courtesy of Scott Palmtag (Core Physics)
Simulation of a commercial light water reactor requires consideration of three simultaneous and interacting primary physical processes: heating and phase change of the flowing water (coolant), fissioning of the uranium dioxide fuel, and changes in the fuel as it is depleted.
14 CASL-U-2014-0177-000
Simulating the Fission Process with VERA
15 CASL-U-2014-0177-000
16 CASL-U-2014-0177-000
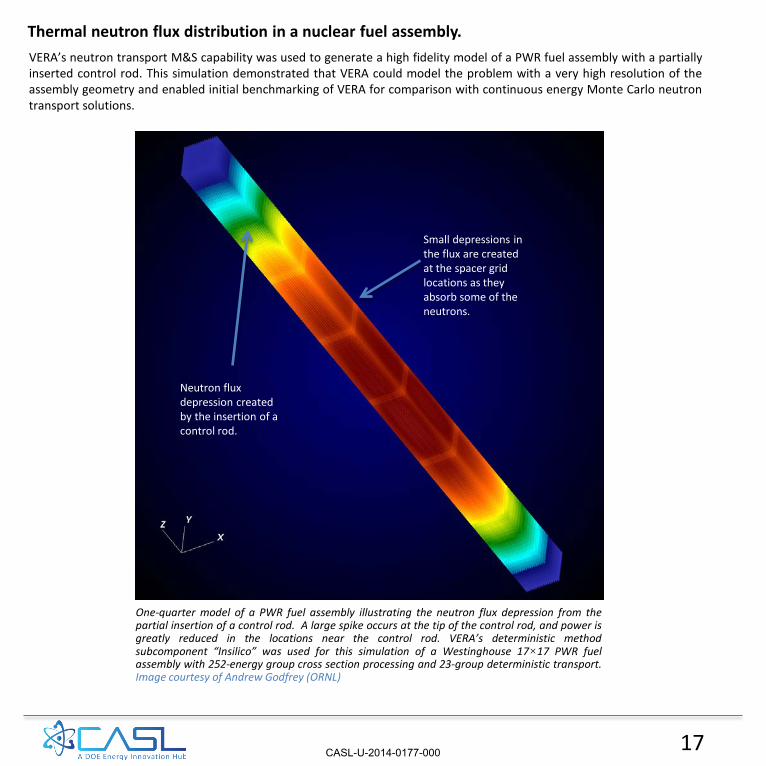
VERA’s neutron transport M&S capability was used to generate a high fidelity model of a PWR fuel assembly with a partially inserted control rod. This simulation demonstrated that VERA could model the problem with a very high resolution of the assembly geometry and enabled initial benchmarking of VERA for comparison with continuous energy Monte Carlo neutron transport solutions.
One-quarter model of a PWR fuel assembly illustrating the neutron flux depression from the partial insertion of a control rod. A large spike occurs at the tip of the control rod, and power is greatly reduced in the locations near the control rod. VERA’s deterministic method subcomponent “Insilico” was used for this simulation of a Westinghouse 17×17 PWR fuel assembly with 252-energy group cross section processing and 23-group deterministic transport. Image courtesy of Andrew Godfrey (ORNL)
Thermal neutron flux distribution in a nuclear fuel assembly.
Neutron flux depression created by the insertion of a control rod.
Small depressions in the flux are created at the spacer grid locations as they absorb some of the neutrons.
17 CASL-U-2014-0177-000
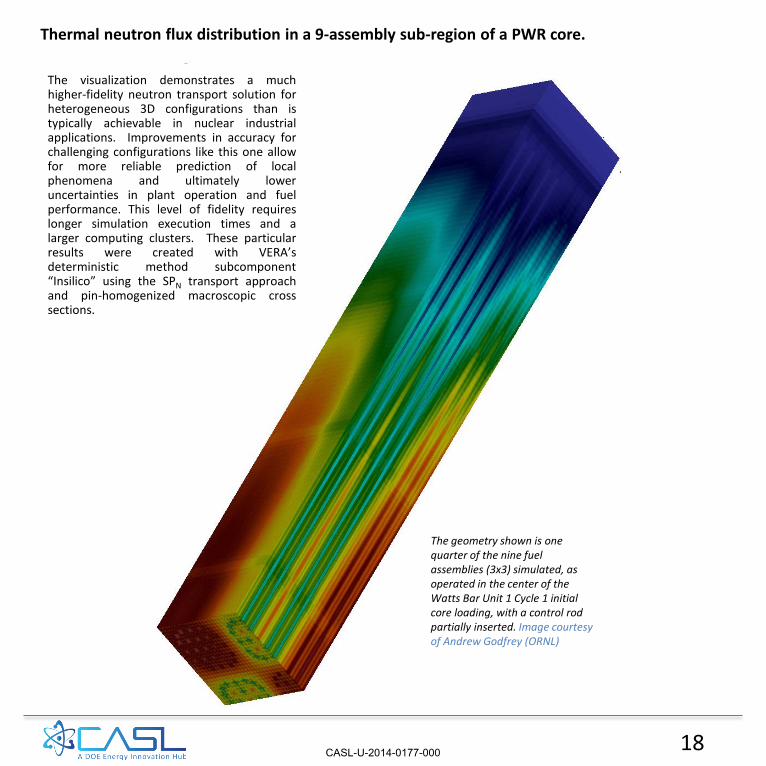
The visualization demonstrates a much higher-fidelity neutron transport solution for heterogeneous 3D configurations than is typically achievable in nuclear industrial applications. Improvements in accuracy for challenging configurations like this one allow for more reliable prediction of local phenomena and ultimately lower uncertainties in plant operation and fuel performance. This level of fidelity requires longer simulation execution times and a larger computing clusters. These particular results were created with VERA’s deterministic method subcomponent “Insilico” using the SPN transport approach and pin-homogenized macroscopic cross sections.
Thermal neutron flux distribution in a 9-assembly sub-region of a PWR core.
The geometry shown is one quarter of the nine fuel assemblies (3x3) simulated, as operated in the center of the Watts Bar Unit 1 Cycle 1 initial core loading, with a control rod partially inserted. Image courtesy of Andrew Godfrey (ORNL)
18 CASL-U-2014-0177-000
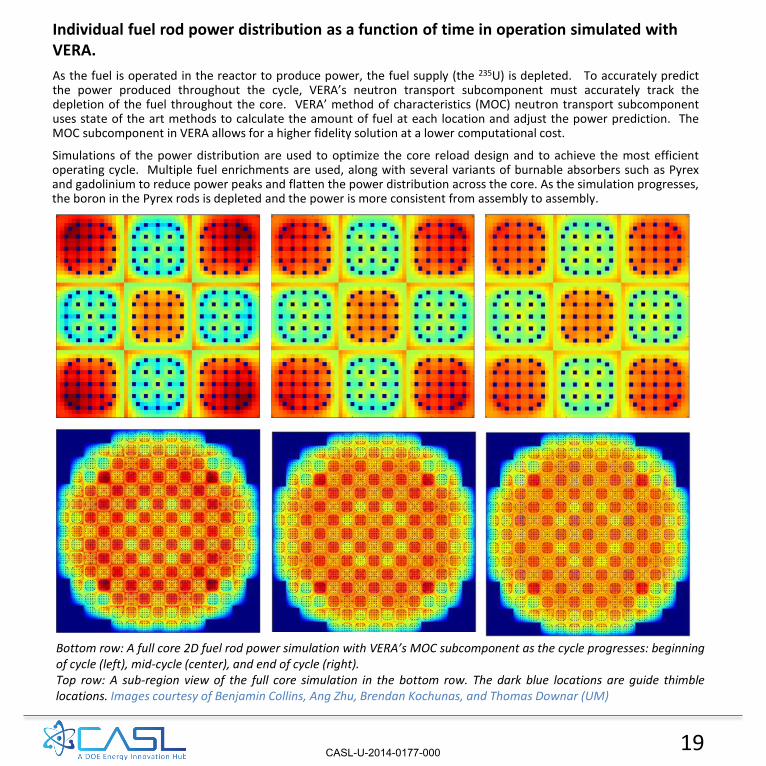
Bottom row: A full core 2D fuel rod power simulation with VERA’s MOC subcomponent as the cycle progresses: beginning of cycle (left), mid-cycle (center), and end of cycle (right). Top row: A sub-region view of the full core simulation in the bottom row. The dark blue locations are guide thimble locations. Images courtesy of Benjamin Collins, Ang Zhu, Brendan Kochunas, and Thomas Downar (UM)
As the fuel is operated in the reactor to produce power, the fuel supply (the 235U) is depleted. To accurately predict the power produced throughout the cycle, VERA’s neutron transport subcomponent must accurately track the depletion of the fuel throughout the core. VERA’ method of characteristics (MOC) neutron transport subcomponent uses state of the art methods to calculate the amount of fuel at each location and adjust the power prediction. The MOC subcomponent in VERA allows for a higher fidelity solution at a lower computational cost.
Simulations of the power distribution are used to optimize the core reload design and to achieve the most efficient operating cycle. Multiple fuel enrichments are used, along with several variants of burnable absorbers such as Pyrex and gadolinium to reduce power peaks and flatten the power distribution across the core. As the simulation progresses, the boron in the Pyrex rods is depleted and the power is more consistent from assembly to assembly.
Individual fuel rod power distribution as a function of time in operation simulated with VERA.
19 CASL-U-2014-0177-000

Power escalation during reactor start-up.
The images show the relative power distribution for each power level; at lower power there is a slight redistribution towards the bottom of the reactor due to temperature feedback. Images courtesy of Benjamin Collins (ORNL).
As the reactor is brought up to full power, the operators stop at specific points to check the measured power against the predictions. This ensures that the core and instrumentation are performing as expected. VERA can be used to provide a more precise indication of local power than current industry M&S capabilities, since each fuel rod is explicitly calculated.
These images illustrate the power predictions for the Watts Bar Unit 1 cycle 1 startup at essentially zero power (top), 50% power (middle) and full power (bottom). Control rod bank D is inserted just 4% (the darker blue locations at the top of the core; all other control rods are withdrawn. The stepped cutaway is provided to allow a view inside the core.
~0% power
50% power
100% power
20 CASL-U-2014-0177-000

VERA’s Monte Carlo methods provide for simulation benchmarks. In terms of neutron transport, a continuous-energy Monte Carlo transport solution provides the highest fidelity (“gold standard”) results to benchmark VERA’s MOC and deterministic neutron transport subcomponents. VERA’s Monte Carlo subcomponent, Shift, provides both 2D and 3D capabilities capable of modeling the smallest fuel assembly features in detail. The high-resolution models enable accurate verification of the neutron transport solution without the introduction of additional error due to approximation of the geometry, boundary conditions, and the multigroup neutron energy model.
A simulation of Westinghouse’s advanced
AP1000 reactor startup core at hot full power, beginning
of the cycle, with VERA’s Monte Carlo subcomponent.
A quarter of the core is shown, with cutaways at
various elevations to showing the local power.
The control rod was added to the image to illustrate the
insertion locations in an assembly. Image courtesy of
Fausto Franceschini (WEC); Benjamin Collins (UM); and
Jess Gehin, Andrew Godfrey, Thomas Evans, and Steven
Hamilton (ORNL)
21 CASL-U-2014-0177-000
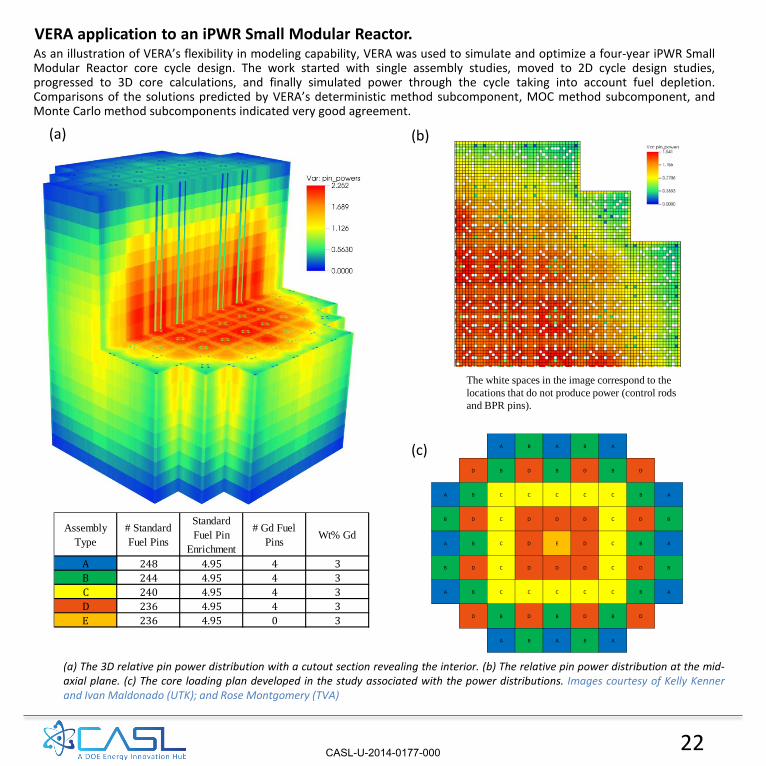
VERA application to an iPWR Small Modular Reactor.
The white spaces in the image correspond to the locations that do not produce power (control rods and BPR pins).
A B A B A
D B D B D B D
A B C C C C C B A
B D C D D D C D B
A B C D E D C B A
B D C D D D C D B
A B C C C C C B A
D B D B D B D
A B A B A
Assembly Type
# Standard Fuel Pins
Standard Fuel Pin
Enrichment
# Gd Fuel Pins Wt% Gd
A 248 4.95 4 3B 244 4.95 4 3C 240 4.95 4 3D 236 4.95 4 3E 236 4.95 0 3
(a) The 3D relative pin power distribution with a cutout section revealing the interior. (b) The relative pin power distribution at the mid-axial plane. (c) The core loading plan developed in the study associated with the power distributions. Images courtesy of Kelly Kenner and Ivan Maldonado (UTK); and Rose Montgomery (TVA)
As an illustration of VERA’s flexibility in modeling capability, VERA was used to simulate and optimize a four-year iPWR Small Modular Reactor core cycle design. The work started with single assembly studies, moved to 2D cycle design studies, progressed to 3D core calculations, and finally simulated power through the cycle taking into account fuel depletion. Comparisons of the solutions predicted by VERA’s deterministic method subcomponent, MOC method subcomponent, and Monte Carlo method subcomponents indicated very good agreement.
(a) (b)
(c)
22 CASL-U-2014-0177-000

Full core 3D fuel depletion of a 4 year iPWR Small Modular Reactor cycle. To determine if the SMR core designed was capable of producing power for the full four-year cycle, 3D full core simulations were completed for several points in the operating time, know as Effective Full Power Days (EFPD). The EFPDs is a measure of the energy used; the typical cycle length for a full size commercial PWR is about 500 EFPD.
The target cycle length for the iPWR SMR study was 1400 EFPD; however, after 1350 EFPDs of operation (~3.7 years), this core design was not producing the required power. One factor that led to this result was that the reactor control rods were not included in the model. Images courtesy of Kelly Kenner and Ivan Maldonado (UTK), and Rose Montgomery (TVA)
700 EFPD
400 EFPD
3 EFPD
1400 EFPD
23 CASL-U-2014-0177-000

24 CASL-U-2014-0177-000

Heating and Phase Change of the Flowing Water:
Thermal-Hydraulics M&S
25 CASL-U-2014-0177-000

26 CASL-U-2014-0177-000

The efficiency of power generation is dependent upon the transfer of heat from the fission process to the reactor coolant. It all comes down to the basic process of heating water. The fission process heats the fuel rods, and that heat is transferred to the coolant as it flows by the rods. CASL is researching techniques that can provide high-fidelity thermal-hydraulic simulations of full field flow structures covering the range of performance from single phase subcooled boiling to isothermal two-phase flow. New and improved techniques have been developed, and high performance computing models and simulations have added significant understanding of underlying physical phenomena that could not have been revealed previously. These techniques yield information for improving performance, better understanding of safety margins, and for extending equipment lifetime.
Measurements of velocity fields associated with bubble dynamics in two-phase flow systems. Images courtesy of Yassin Hassan (TAMU)
27 CASL-U-2014-0177-000

In fluid dynamics, flow is characterized as “laminar” (flowing in smooth, non-interacting layers) or “turbulent” (flow with chaotic and unsteady velocity and cross-layer interactions such as vortices). Evaluation of the turbulence created by reactor and fuel components, such as hairpin vortices produced by turbulent shear near the spacer grids, is only possible through direct numerical simulation. Fully resolved bubbles can be tracked using a level-set interface tracking method that allows them to interact with the turbulence structures and allows the structures to undergo deformation and coalescence processes. This type of simulation is necessary to developing closure laws for larger scale multiphase computational fluid dynamics simulations.
To illustrate and industry application, in the past, the turbulent flow created by spacer grid mixing vanes has caused very small, but frequent, individual fuel rod vibration. The motion of the rod against its spacer grid is called grid-to-rod-fretting (GTRF). GTRF can wear away the fuel rod cladding, leading to fuel rod leaks. The manifestation of this failure mechanism is complex, involving many factors; CASL’s work in this area will provide tools to forecast GTRF and thus avoid it in future.
Simulation of a complex flow pattern with entrained bubbles. Instantaneous liquid velocity in the background planes shows the turbulence as it evolves in the channel. Hairpin vortices appear as yellow and cyan. Image courtesy of Igor Bolotnov (NCSU)
Spacer grid mixing vanes provide a key to better heat transfer efficiency, creating complex flow patterns around a fuel rod that are difficult to accurately predict and correlate to overall heat transfer.
28 CASL-U-2014-0177-000
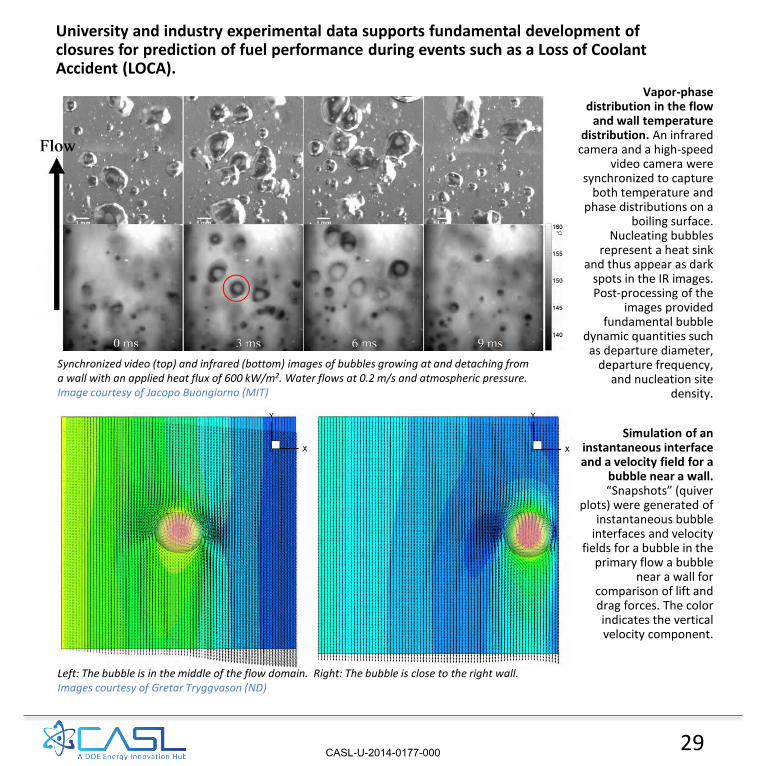
University and industry experimental data supports fundamental development of closures for prediction of fuel performance during events such as a Loss of Coolant Accident (LOCA).
Synchronized video (top) and infrared (bottom) images of bubbles growing at and detaching from a wall with an applied heat flux of 600 kW/m2. Water flows at 0.2 m/s and atmospheric pressure. Image courtesy of Jacopo Buongiorno (MIT)
Vapor-phase distribution in the flow
and wall temperature distribution. An infrared
camera and a high-speed video camera were
synchronized to capture both temperature and
phase distributions on a boiling surface.
Nucleating bubbles represent a heat sink
and thus appear as dark spots in the IR images. Post-processing of the
images provided fundamental bubble
dynamic quantities such as departure diameter,
departure frequency, and nucleation site
density.
Simulation of an instantaneous interface and a velocity field for a
bubble near a wall. “Snapshots” (quiver
plots) were generated of instantaneous bubble
interfaces and velocity fields for a bubble in the
primary flow a bubble near a wall for
comparison of lift and drag forces. The color indicates the vertical velocity component.
Left: The bubble is in the middle of the flow domain. Right: The bubble is close to the right wall. Images courtesy of Gretar Tryggvason (ND)
29 CASL-U-2014-0177-000
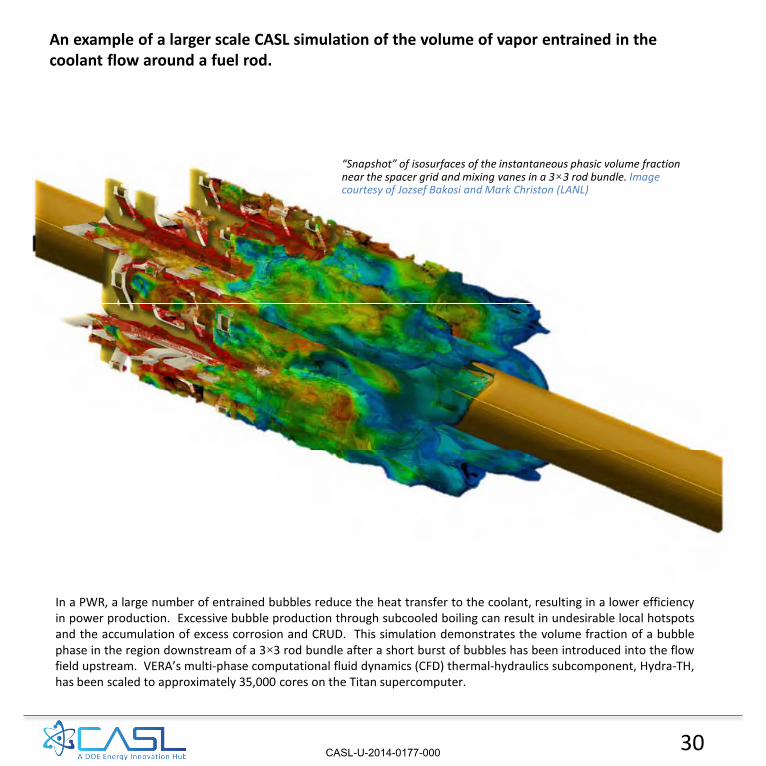
An example of a larger scale CASL simulation of the volume of vapor entrained in the coolant flow around a fuel rod.
In a PWR, a large number of entrained bubbles reduce the heat transfer to the coolant, resulting in a lower efficiency in power production. Excessive bubble production through subcooled boiling can result in undesirable local hotspots and the accumulation of excess corrosion and CRUD. This simulation demonstrates the volume fraction of a bubble phase in the region downstream of a 3×3 rod bundle after a short burst of bubbles has been introduced into the flow field upstream. VERA’s multi-phase computational fluid dynamics (CFD) thermal-hydraulics subcomponent, Hydra-TH, has been scaled to approximately 35,000 cores on the Titan supercomputer.
“Snapshot” of isosurfaces of the instantaneous phasic volume fraction near the spacer grid and mixing vanes in a 3×3 rod bundle. Image courtesy of Jozsef Bakosi and Mark Christon (LANL)
30 CASL-U-2014-0177-000

Fuel rod
Velocity
A close-up view of a CASL computational mesh for simulating turbulence imparted by spacer grid mixing vanes. This simulation used sub-region (5 rods by 5 rod) in three axially distributed spacer grids. The fuel regions are modeled to account for heat conduction within the fuel as well as heat transfer into the fluid. The CFD mesh for the 5×5 sub-region model included approximately 64 million polyhedral cells to represent the 24 fuel rods, the central guide tube, and three grid spacers with mixing vanes. High-resolution CFD meshes are needed to accurately model the heat transfer and complex turbulent fluid flow through the grid spacer. Images courtesy of Brian Kendrick (LANL); and Victor Petrov, Daniel Walter, and Annalisa Manera (UM). The mesh was created using CD-adapco’s STAR-CCM+ mesh engine.
Repeatable flow patterns are generated by the mixing vanes on the spacer grids of a PWR fuel assembly. These are revealed through CFD flow simulation. Low-pressure regions (the dark blue spots) indicate stable vortices in two of the flow sub-channels; the associated instantaneous velocity vectors shown indicate the presence of swirl in the region downstream of the spacer grid and mixing vanes. Image courtesy of Mark Christon, Jozsef Bakosi, Nate Barnett, Marianne Francois, and Rob Lowie (LANL)
VERA Computational Fluid Dynamics tools applied in simulating the four flow channels around a fuel rod for a typical PWR fuel assembly.
A flow sub-channel
31 CASL-U-2014-0177-000

Simulation of turbulence in a PWR fuel assembly to support GTRF analysis.
Turbulence structures generated by mixing vanes are visualized through “helicity” isosurfaces (above and right). Images courtesy of Mark Christon and Jozsef Bakosi (LANL)
Spacer grid-induced turbulence is beneficial for heat transfer, but can have negative feedback if the fuel rod vibrates as a result. Simulations of turbulence in a PWR fuel assembly support CASL’s initiatives for prediction of grid-to-rod-fretting vulnerability of particular spacer grid designs. An implicit large-eddy simulation was used as part of a broader study to assess both large-eddy-simulation and unsteady Reynolds-averaged Navier-Stokes (RANS) models for the accurate prediction of the turbulent excitation of the fuel rod with the VERA CFD subcomponent, Hydra-TH, multiphase solver. In addition to studies comparing large-eddy simulation and unsteady RANS, mesh sensitivity studies have been performed to assess the requisite mesh resolution for accurate prediction of the turbulent excitation on the fuel rods for GTRF.
32 CASL-U-2014-0177-000
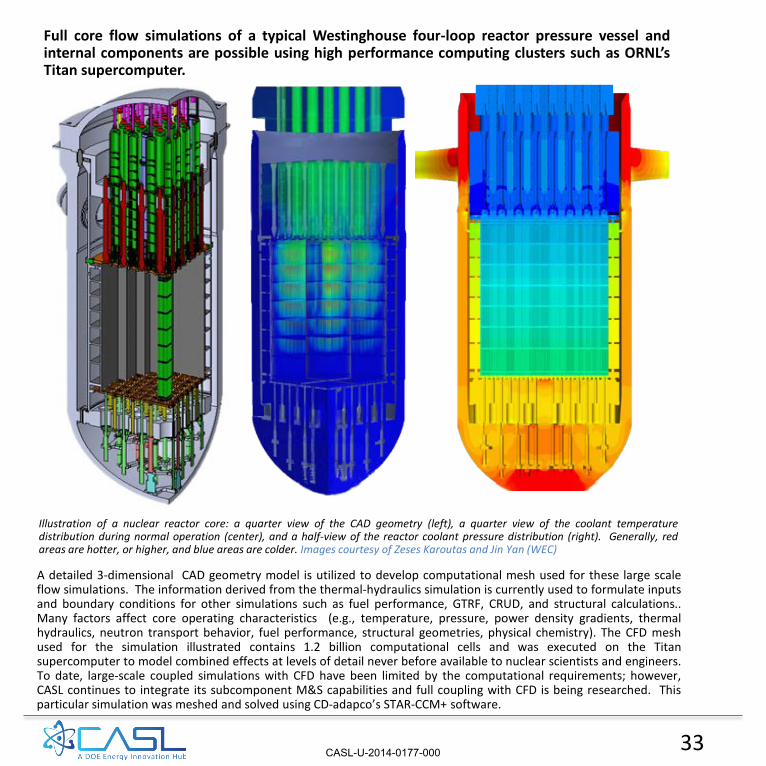
Illustration of a nuclear reactor core: a quarter view of the CAD geometry (left), a quarter view of the coolant temperature distribution during normal operation (center), and a half-view of the reactor coolant pressure distribution (right). Generally, red areas are hotter, or higher, and blue areas are colder. Images courtesy of Zeses Karoutas and Jin Yan (WEC)
A detailed 3-dimensional CAD geometry model is utilized to develop computational mesh used for these large scale flow simulations. The information derived from the thermal-hydraulics simulation is currently used to formulate inputs and boundary conditions for other simulations such as fuel performance, GTRF, CRUD, and structural calculations.. Many factors affect core operating characteristics (e.g., temperature, pressure, power density gradients, thermal hydraulics, neutron transport behavior, fuel performance, structural geometries, physical chemistry). The CFD mesh used for the simulation illustrated contains 1.2 billion computational cells and was executed on the Titan supercomputer to model combined effects at levels of detail never before available to nuclear scientists and engineers. To date, large-scale coupled simulations with CFD have been limited by the computational requirements; however, CASL continues to integrate its subcomponent M&S capabilities and full coupling with CFD is being researched. This particular simulation was meshed and solved using CD-adapco’s STAR-CCM+ software.
Full core flow simulations of a typical Westinghouse four-loop reactor pressure vessel and internal components are possible using high performance computing clusters such as ORNL’s Titan supercomputer.
33 CASL-U-2014-0177-000

CASL VERA includes engineering scale tools, including the COBRA-TF subchannel thermal-hydraulic subcomponent to allow higher fidelity simulations at a lower computational intensity. The temperature and density of the water (the coolant) is a key variable in the simulation of commercial power reactors. CASL’s VERA includes to primary methods to evaluate the thermal-hydraulic conditions in the core: computational fluid dynamics and subchannel methods. Subchannel methods have been widely used by industry and are reliable for calculating the bulk coolant response. VERA’s COBRA-TF uses a 9-field equation model primarily applicable to the simulation of Loss of Coolant Accidents. It incorporates conservation equations addressing liquid films, vapor phase, and entrained liquid droplets. The subchannel method a versatile lower computational intensity simulation method that is particularly useful for coupled calculations with neutron transport.
A 3D coupled simulation using subchannel flow methods coupled with the VERA deterministic transport subcomponent was used to calculate detailed information about the coolant conditions throughout the core. Image courtesy of Scott Palmtag (Core Physics); and John Turner (ORNL)
34 CASL-U-2014-0177-000
Fuel Performance M&S: Changes in the Fuel
as it is Depleted
35 CASL-U-2014-0177-000

36 CASL-U-2014-0177-000
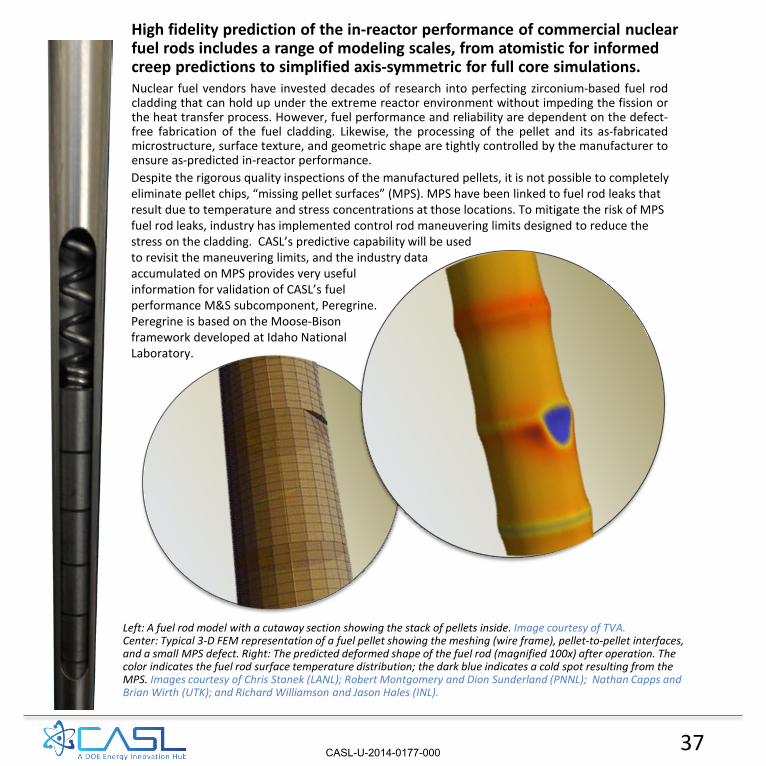
Left: A fuel rod model with a cutaway section showing the stack of pellets inside. Image courtesy of TVA. Center: Typical 3-D FEM representation of a fuel pellet showing the meshing (wire frame), pellet-to-pellet interfaces, and a small MPS defect. Right: The predicted deformed shape of the fuel rod (magnified 100x) after operation. The color indicates the fuel rod surface temperature distribution; the dark blue indicates a cold spot resulting from the MPS. Images courtesy of Chris Stanek (LANL); Robert Montgomery and Dion Sunderland (PNNL); Nathan Capps and Brian Wirth (UTK); and Richard Williamson and Jason Hales (INL).
Nuclear fuel vendors have invested decades of research into perfecting zirconium-based fuel rod cladding that can hold up under the extreme reactor environment without impeding the fission or the heat transfer process. However, fuel performance and reliability are dependent on the defect-free fabrication of the fuel cladding. Likewise, the processing of the pellet and its as-fabricated microstructure, surface texture, and geometric shape are tightly controlled by the manufacturer to ensure as-predicted in-reactor performance.
High fidelity prediction of the in-reactor performance of commercial nuclear fuel rods includes a range of modeling scales, from atomistic for informed creep predictions to simplified axis-symmetric for full core simulations.
Despite the rigorous quality inspections of the manufactured pellets, it is not possible to completely eliminate pellet chips, “missing pellet surfaces” (MPS). MPS have been linked to fuel rod leaks that result due to temperature and stress concentrations at those locations. To mitigate the risk of MPS fuel rod leaks, industry has implemented control rod maneuvering limits designed to reduce the stress on the cladding. CASL’s predictive capability will be used to revisit the maneuvering limits, and the industry data accumulated on MPS provides very useful information for validation of CASL’s fuel performance M&S subcomponent, Peregrine. Peregrine is based on the Moose-Bison framework developed at Idaho National Laboratory.
37 CASL-U-2014-0177-000
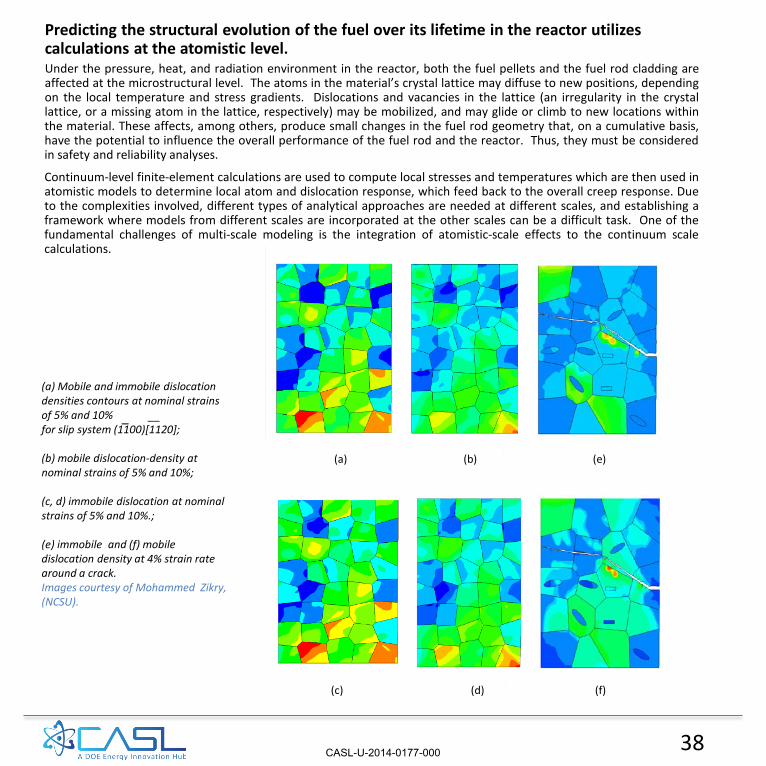
Under the pressure, heat, and radiation environment in the reactor, both the fuel pellets and the fuel rod cladding are affected at the microstructural level. The atoms in the material’s crystal lattice may diffuse to new positions, depending on the local temperature and stress gradients. Dislocations and vacancies in the lattice (an irregularity in the crystal lattice, or a missing atom in the lattice, respectively) may be mobilized, and may glide or climb to new locations within the material. These affects, among others, produce small changes in the fuel rod geometry that, on a cumulative basis, have the potential to influence the overall performance of the fuel rod and the reactor. Thus, they must be considered in safety and reliability analyses.
Continuum-level finite-element calculations are used to compute local stresses and temperatures which are then used in atomistic models to determine local atom and dislocation response, which feed back to the overall creep response. Due to the complexities involved, different types of analytical approaches are needed at different scales, and establishing a framework where models from different scales are incorporated at the other scales can be a difficult task. One of the fundamental challenges of multi-scale modeling is the integration of atomistic-scale effects to the continuum scale calculations.
Predicting the structural evolution of the fuel over its lifetime in the reactor utilizes calculations at the atomistic level.
(a) Mobile and immobile dislocation densities contours at nominal strains of 5% and 10% for slip system (1100)[1120]; (b) mobile dislocation-density at nominal strains of 5% and 10%; (c, d) immobile dislocation at nominal strains of 5% and 10%.; (e) immobile and (f) mobile dislocation density at 4% strain rate around a crack. Images courtesy of Mohammed Zikry, (NCSU).
38
_ __
(a) (b)
(c)
(e)
(d) (f)
CASL-U-2014-0177-000
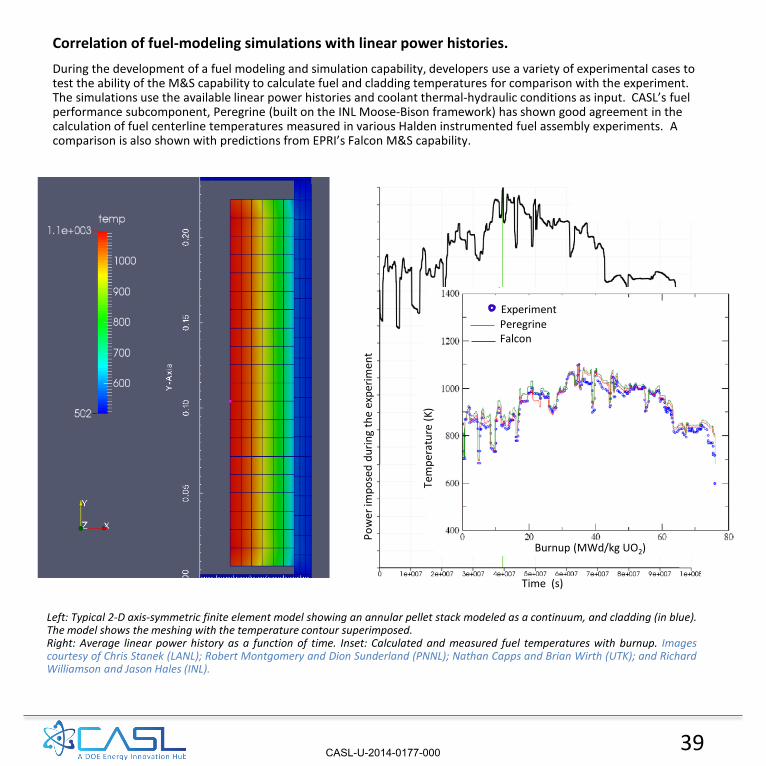
Correlation of fuel-modeling simulations with linear power histories. During the development of a fuel modeling and simulation capability, developers use a variety of experimental cases to test the ability of the M&S capability to calculate fuel and cladding temperatures for comparison with the experiment. The simulations use the available linear power histories and coolant thermal-hydraulic conditions as input. CASL’s fuel performance subcomponent, Peregrine (built on the INL Moose-Bison framework) has shown good agreement in the calculation of fuel centerline temperatures measured in various Halden instrumented fuel assembly experiments. A comparison is also shown with predictions from EPRI’s Falcon M&S capability.
Left: Typical 2-D axis-symmetric finite element model showing an annular pellet stack modeled as a continuum, and cladding (in blue). The model shows the meshing with the temperature contour superimposed. Right: Average linear power history as a function of time. Inset: Calculated and measured fuel temperatures with burnup. Images courtesy of Chris Stanek (LANL); Robert Montgomery and Dion Sunderland (PNNL); Nathan Capps and Brian Wirth (UTK); and Richard Williamson and Jason Hales (INL).
39
Experiment Peregrine Falcon
Burnup (MWd/kg UO2)
Tem
pera
ture
(K)
Time (s)
Pow
er im
pose
d du
ring
the
expe
rimen
t
CASL-U-2014-0177-000
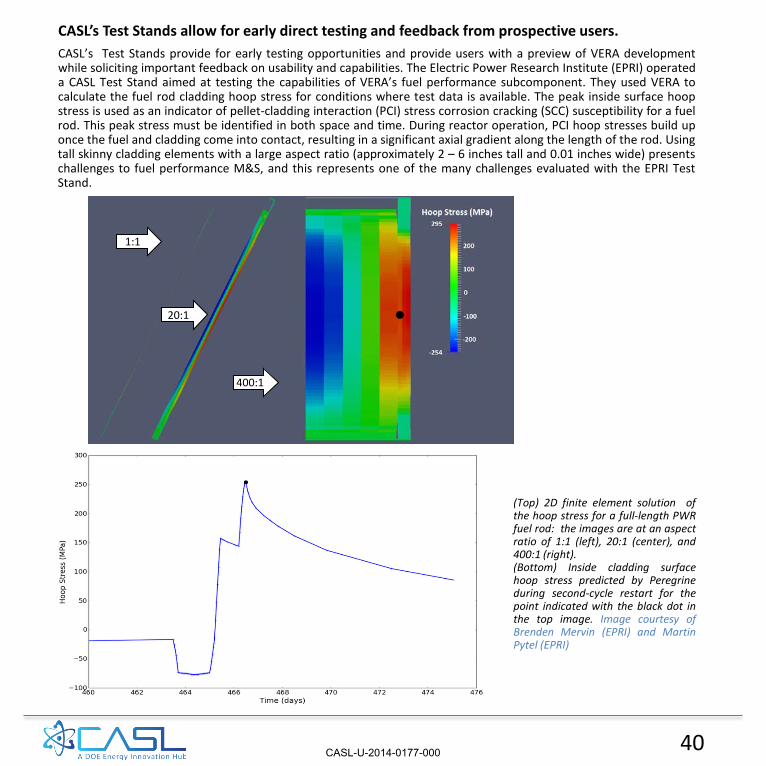
CASL’s Test Stands allow for early direct testing and feedback from prospective users. CASL’s Test Stands provide for early testing opportunities and provide users with a preview of VERA development while soliciting important feedback on usability and capabilities. The Electric Power Research Institute (EPRI) operated a CASL Test Stand aimed at testing the capabilities of VERA’s fuel performance subcomponent. They used VERA to calculate the fuel rod cladding hoop stress for conditions where test data is available. The peak inside surface hoop stress is used as an indicator of pellet-cladding interaction (PCI) stress corrosion cracking (SCC) susceptibility for a fuel rod. This peak stress must be identified in both space and time. During reactor operation, PCI hoop stresses build up once the fuel and cladding come into contact, resulting in a significant axial gradient along the length of the rod. Using tall skinny cladding elements with a large aspect ratio (approximately 2 – 6 inches tall and 0.01 inches wide) presents challenges to fuel performance M&S, and this represents one of the many challenges evaluated with the EPRI Test Stand.
(Top) 2D finite element solution of the hoop stress for a full-length PWR fuel rod: the images are at an aspect ratio of 1:1 (left), 20:1 (center), and 400:1 (right). (Bottom) Inside cladding surface hoop stress predicted by Peregrine during second-cycle restart for the point indicated with the black dot in the top image. Image courtesy of Brenden Mervin (EPRI) and Martin Pytel (EPRI)
20:1
400:1
1:1
40 CASL-U-2014-0177-000

M&S of Coolant Corrosion Chemistry Effects
41 CASL-U-2014-0177-000

42 CASL-U-2014-0177-000

Above: A scanning electron microscope (SEM) image of the waterside surface of a PWR CRUD flake. The dark circles are boiling chimneys. Image courtesy of Electric Power Research Institute (EPRI)
Below: Cross section of a crud flake. The top of the flake was adjacent to the cladding surface; the bottom was adjacent to the coolant. The dark features that protrude through the crud are the boiling chimneys. Image courtesy of Jeff Secker (WEC)
As the coolant in light water reactors is circulated through the primary loop, it carries along both soluble and particulate CRUD – nickel and iron corrosion products released by the reactor’s steel and inconel piping and components. CRUD deposits are typically porous, and sub-cooled boiling within the porous CRUD layer results in concentration of boric acid and lithium hydroxide within the CRUD. The porosity of CRUD can vary from deposit to deposit. Also, the porosity can vary through the thickness of the deposit, with lower porosity near the clad than on the waterside of the deposit.
In PWRs, thick CRUD deposits (>50 microns, about half the thickness of a sheet of paper) can result in boron compounds precipitating in the CRUD, affecting the local power production and inducing CRUD induced power shifts (CIPS). During core power maneuvers as coolant temperatures are reduced, the boron dissolves back into the coolant. CIPS can degrade shutdown margin, since the dissolution of boron after plant trip increases core reactivity.
As operating PWRs have implemented power uprates and optimized fuel management strategies to improve fuel efficiency, CRUD deposition on fuel assemblies has become more prevalent. Higher heat fluxes associated with the power uprates lead to increase sub-cooled boiling rates in the core. As CRUD deposits thicken and densify, the deposits can impede heat transfer to the coolant, resulting in increased fuel cladding temperatures. Deposits that impede heat transfer can result in accelerated in cladding corrosion and corrosion-induced localized corrosion (CILC).
Fuel rod leaks related to CRUD deposits have occurred in at least five PWRs. While current industry M&S CRUD deposition tools have proven successful in reducing the occurrences of CIPS and CILC, much uncertainty remains about CRUD modeling. Improved models are needed in many areas, including the effect of coolant chemistry (in particular pH), operational transients such as plant trips or power maneuvers on corrosion release rates, feedback to local fuel rod heat flux from CRUD and boron deposition, sub-cooled boiling rates and crud chimney modeling, and boron concentration models. CASL is working to advance the state of the art in many of these areas; particular emphasis is being applied to the development of refined micro-scale crud deposition models that are coupled with higher fidelity local subcooled boiling predictions to capture the feedback between the insulating crud layer, the local coolant temperature and density, and the neutron flux and power.
In PWRs, coolant corrosion chemistry deposits can affect the local power production.
43 CASL-U-2014-0177-000

CASL M&S capabilities were used to simulate the cladding temperature, CRUD thickness, and turbulent kinetic energy on the surfaces of 24 fuel rods in a 5×5 subassembly at the end of a 502 day plant cycle. The cladding temperature and turbulent kinetic energy were computed using a commercial CFD capability, CD-adapco’s STAR-CCM+; the CRUD thickness was computed using VERA’s coolant corrosion subcomponent, MAMBA.
The two M&S capabilities were loosely coupled and exchange information periodically. The CFD-computed cladding heat flux and surface temperatures provided the local heat transfer boundary conditions needed by MAMBA. The CFD-computed turbulent kinetic energy was also used to model erosion effects on the CRUD layer due to surface shear stresses. The MAMBA-computed CRUD thickness and thermal resistance was used by the CFD M&S capability in its heat transfer calculation.
The calculation simulated 502 EPFDs of operation. The CRUD is predicted to be thickest in regions of hotter cladding temperatures and lower turbulent kinetic energy. The results helped to verify that thermal-hydraulic feedback is required in order to accurately predict crud deposition.
Simulations of fuel rod cladding temperature, crud thickness, and turbulent kinetic energy.
Predicted cladding temperature (top), crud thickness (middle), and turbulent kinetic energy (bottom) on the surfaces of 24 fuel rods in a 5x5 sub-region model at the end of a 502 EFPD operating cycle (fuel rod power production held constant). Images courtesy of Brian Kendrick (LANL), Victor Petrov, Daniel Walter, and Annalisa Manera (UM)
44 CASL-U-2014-0177-000

Simulation of PWR crud deposits to reduce the potential for crud growth.
Field observations indicate that CRUD thickness varies dramatically from rod to rod. This is related directly to variations in the local thermal-hydraulic conditions due to turbulence and swirling of the coolant around the fuel rods. Regions of maximum CRUD thickness may occur at different axial and azimuthal locations on each rod. The CASL-simulated deposits are consistent with the patterns in CRUD deposits observed downstream of spacer grids in operating PWRs. Predicting the location of maximum CRUD thickness is important to assessing and mitigating the risk of accelerated fuel rod cladding corrosion (CRUD-induced localized corrosion, (CILC). Simulations using VERA are expected to be used to optimize grid-spacer and mixing-vane designs to enhance heat transfer while minimizing the potential for thick CRUD.
Right: A view looking down into the sub-region modeled (the guide thimble is not shown). Below: Detailed views of CRUD predicted on the surfaces of fuel rods within an eight rod sub-region model. The rods surround a central guide thimble location; the axial span modeled is about an eighth of the total fuel assembly active fuel length and includes one spacer grid (the spacer grid and guide thimble tube are not shown). Thicker CRUD is red, white indicates a thin layer, and blue regions have no CRUD. Images courtesy of Brian Kendrick (LANL) and Victor Petrov, Daniel Walter, and Annalisa Manera (UM)
45 CASL-U-2014-0177-000
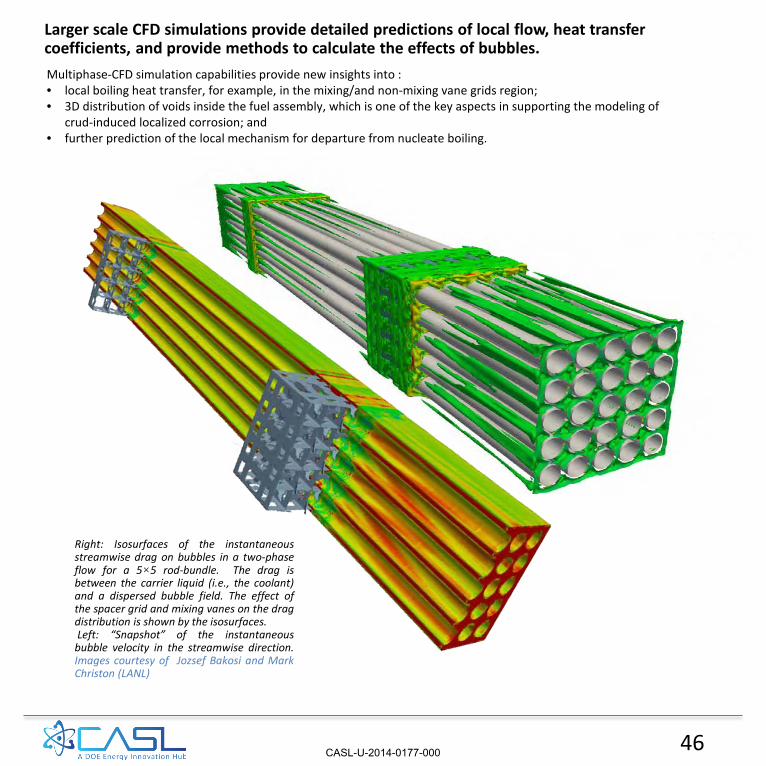
Larger scale CFD simulations provide detailed predictions of local flow, heat transfer coefficients, and provide methods to calculate the effects of bubbles.
Right: Isosurfaces of the instantaneous streamwise drag on bubbles in a two-phase flow for a 5×5 rod-bundle. The drag is between the carrier liquid (i.e., the coolant) and a dispersed bubble field. The effect of the spacer grid and mixing vanes on the drag distribution is shown by the isosurfaces. Left: “Snapshot” of the instantaneous bubble velocity in the streamwise direction. Images courtesy of Jozsef Bakosi and Mark Christon (LANL)
Multiphase-CFD simulation capabilities provide new insights into : • local boiling heat transfer, for example, in the mixing/and non-mixing vane grids region; • 3D distribution of voids inside the fuel assembly, which is one of the key aspects in supporting the modeling of
crud-induced localized corrosion; and • further prediction of the local mechanism for departure from nucleate boiling.
46 CASL-U-2014-0177-000
Interacting Multi-Physics modeled with VERA
47 CASL-U-2014-0177-000
48 CASL-U-2014-0177-000
49
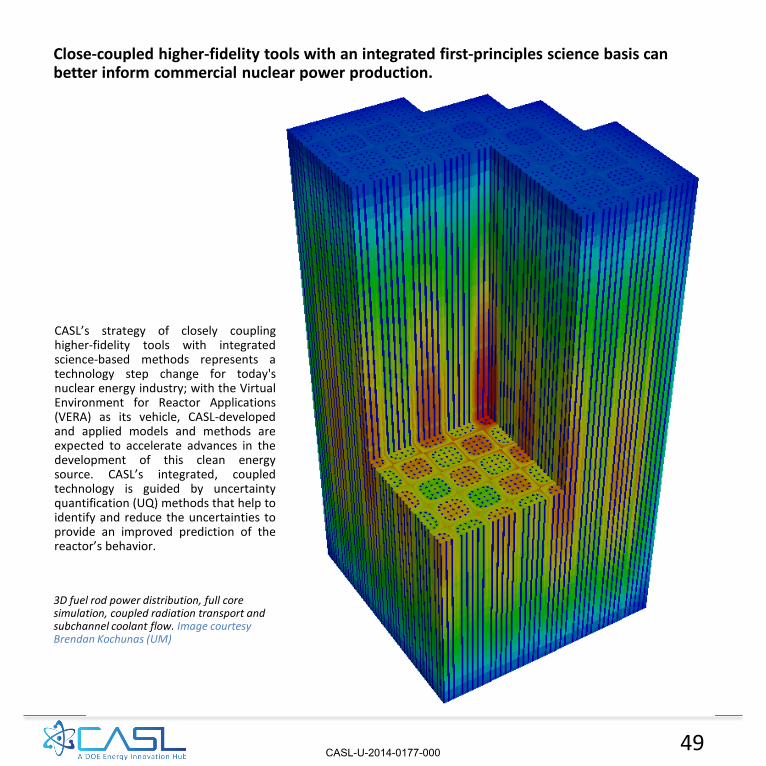
CASL’s strategy of closely coupling higher-fidelity tools with integrated science-based methods represents a technology step change for today's nuclear energy industry; with the Virtual Environment for Reactor Applications (VERA) as its vehicle, CASL-developed and applied models and methods are expected to accelerate advances in the development of this clean energy source. CASL’s integrated, coupled technology is guided by uncertainty quantification (UQ) methods that help to identify and reduce the uncertainties to provide an improved prediction of the reactor’s behavior.
3D fuel rod power distribution, full core simulation, coupled radiation transport and subchannel coolant flow. Image courtesy Brendan Kochunas (UM)
Close-coupled higher-fidelity tools with an integrated first-principles science basis can better inform commercial nuclear power production.
CASL-U-2014-0177-000

Images produced by VERA-CS of coolant enthalpy distribution in a PWR at hot-full power. The VERA Core Simulator, using Cobra-TF and Insilico software M&S capabilities, was used to predict the power, temperature, and density distribution within a Westinghouse PWR. The enthalpy rise within the core is not uniform and is closely related to the power distribution. However, cross-flow between fuel channels and enhanced mixing in the spacer grids redistributes the coolant to create a more uniform distribution. Also, the 2D plot of the coolant enthalpy at the core exit displays the very large enthalpy gradients at the core periphery.
Left: 3D image of the core enthalpy ; Below: 2D image at the core exit. Images courtesy of Scott Palmtag (Core Physics)
50 CASL-U-2014-0177-000
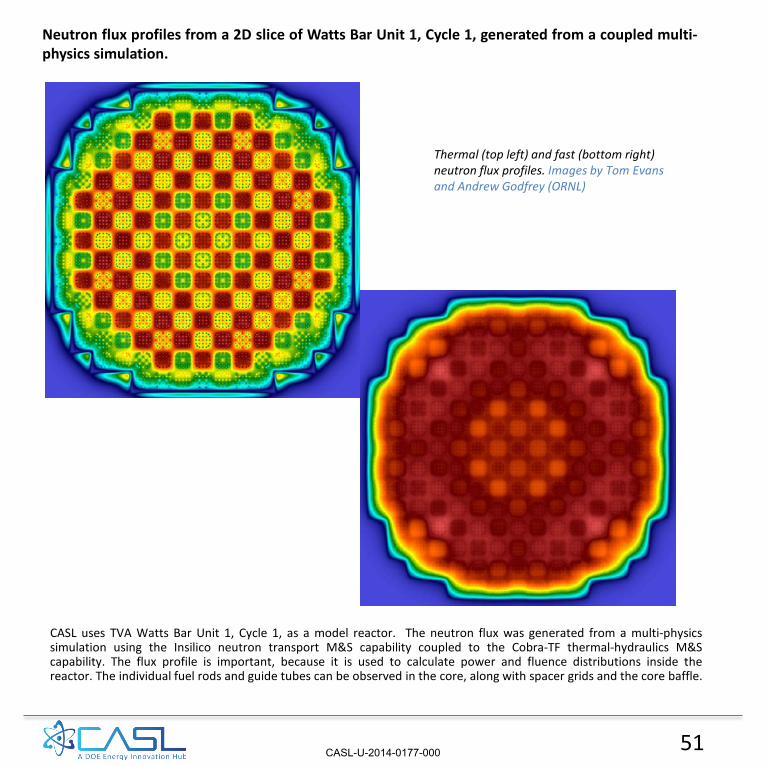
Neutron flux profiles from a 2D slice of Watts Bar Unit 1, Cycle 1, generated from a coupled multi-physics simulation.
Thermal (top left) and fast (bottom right) neutron flux profiles. Images by Tom Evans and Andrew Godfrey (ORNL)
CASL uses TVA Watts Bar Unit 1, Cycle 1, as a model reactor. The neutron flux was generated from a multi-physics simulation using the Insilico neutron transport M&S capability coupled to the Cobra-TF thermal-hydraulics M&S capability. The flux profile is important, because it is used to calculate power and fluence distributions inside the reactor. The individual fuel rods and guide tubes can be observed in the core, along with spacer grids and the core baffle.
51 CASL-U-2014-0177-000
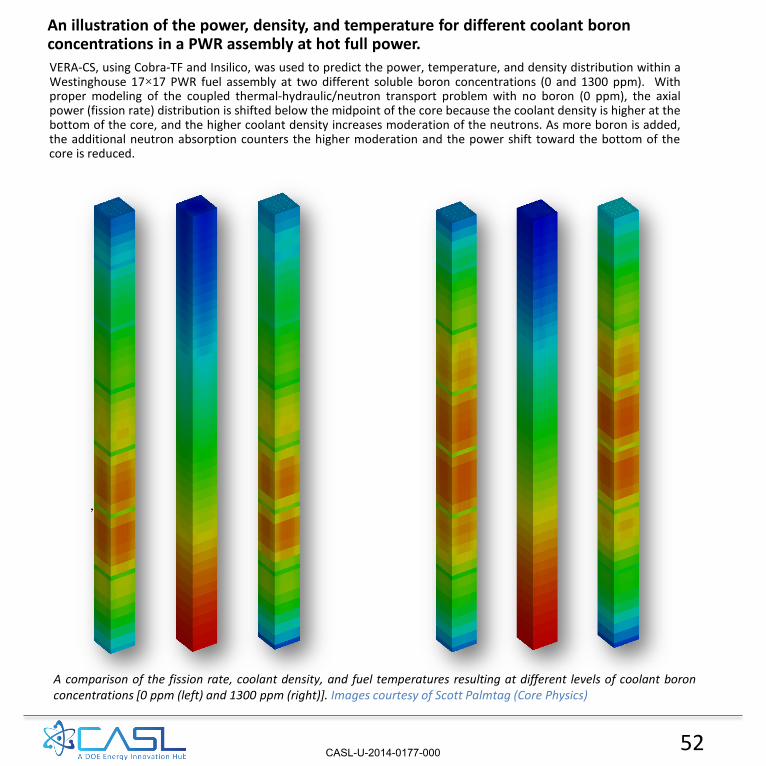
An illustration of the power, density, and temperature for different coolant boron concentrations in a PWR assembly at hot full power. VERA-CS, using Cobra-TF and Insilico, was used to predict the power, temperature, and density distribution within a Westinghouse 17×17 PWR fuel assembly at two different soluble boron concentrations (0 and 1300 ppm). With proper modeling of the coupled thermal-hydraulic/neutron transport problem with no boron (0 ppm), the axial power (fission rate) distribution is shifted below the midpoint of the core because the coolant density is higher at the bottom of the core, and the higher coolant density increases moderation of the neutrons. As more boron is added, the additional neutron absorption counters the higher moderation and the power shift toward the bottom of the core is reduced.
A comparison of the fission rate, coolant density, and fuel temperatures resulting at different levels of coolant boron concentrations [0 ppm (left) and 1300 ppm (right)]. Images courtesy of Scott Palmtag (Core Physics)
52 CASL-U-2014-0177-000

The Virtual Environment for Reactor Applications
(VERA)
53 CASL-U-2014-0177-000

54 CASL-U-2014-0177-000

The VERA M&S toolset.
The M&S subcomponents that are part of VERA and how they interact with related tools that are not distributed by CASL (interoperability). Image courtesy of John Turner (ORNL)
VERA is a software system that combines the best aspects of toolkits and frameworks, providing a versatile environment with coupled combinations and varying fidelity levels adaptable to available computational resources. VERA incorporates the required solvers, coupling technologies, and uncertainty quantification codes to consider feedback effects from multiple simultaneously interacting physics and allows for a common input to run the many applications within the environment. VERA currently houses 12 individual physics components and 12 infrastructure components within 17 code repositories.
The VERA core simulator, VERA-CS, represents a very useful subset of the VERA tools that is comparable with industry core simulators; VERA’s combination of science-based models and advanced numerical methods and algorithms provide more fidelity along multiple axes (space, angle, energy). CASL’s coupled physics studies have verified that feedback effects can and should be included in core cycle design evaluations and related risk assessments, and have pointed out changes possible within existing industry M&S tools where implementation of higher fidelity elements can have an effect. CASL’s early investigations have already resulted in the adoption of CASL advancements within industry tools.
VERA is currently available through the ORNL Radiation Safety and Software Information Center (RSICC) and a copy can be requested at www.casl.gov.
55 CASL-U-2014-0177-000
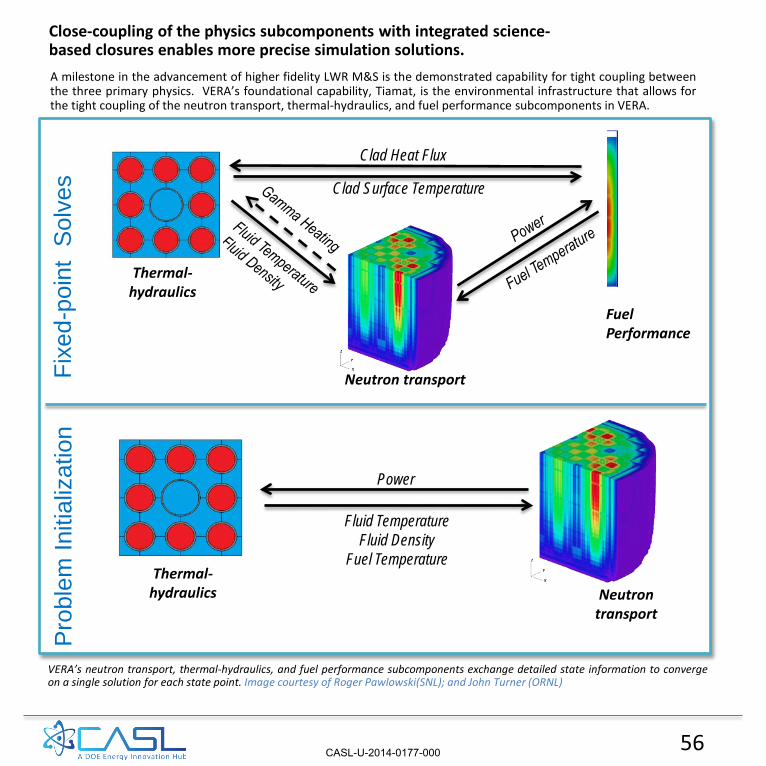
Close-coupling of the physics subcomponents with integrated science-based closures enables more precise simulation solutions. A milestone in the advancement of higher fidelity LWR M&S is the demonstrated capability for tight coupling between the three primary physics. VERA’s foundational capability, Tiamat, is the environmental infrastructure that allows for the tight coupling of the neutron transport, thermal-hydraulics, and fuel performance subcomponents in VERA.
VERA’s neutron transport, thermal-hydraulics, and fuel performance subcomponents exchange detailed state information to converge on a single solution for each state point. Image courtesy of Roger Pawlowski(SNL); and John Turner (ORNL)
Clad Heat Flux
Clad Surface Temperature
Fuel Performance
Neutron transport
Thermal-hydraulics
Neutron transport
Power
Fluid Temperature Fluid Density
Fuel Temperature Thermal-
hydraulics
Fixe
d-po
int
Sol
ves
Pro
blem
Initi
aliz
atio
n
56 CASL-U-2014-0177-000

In many CASL applications, the geometry and mesh representing the physical domain of the problem may or may not be identical. For massively parallel simulations, it is also common that the geometry or mesh have different parallel decompositions requiring parallel communication to exchange information. Furthermore, for flexibility, VERA M&S subcomponents leverage their own preexisting software and mathematical frameworks. In order to provide enabling technology for data transfer operations between CASL M&S subcomponents, VERA includes an infrastructure subcomponent called the Data Transfer Kit (DTK). DTK manages the relationship between data, geometry, mesh, and their parallel distribution. The DTK software library was developed specifically for VERA, and is designed to provide parallel services for data transfer between CASL M&S subcomponents in coupled simulations.
Data transfers in CASL simulations can occur over a shared region of space (such as the transfer of temperature in the volume of a nuclear fuel pin from a heat transfer component to a neutronics component) or over a shared interface (such as the transfer of temperature on the surface of a fuel pin from a heat transfer component to a CFD component). DTK implements several parallel algorithms for data transfer including geometry and mesh volume interpolation algorithms, weighted residual methods, and point cloud methods based on moving least square reconstruction and spline interpolation.
An example of data trans- fer on a shared interface between two different spacer grid meshes using DTK. Most of VERA’s physics components utilize differ- ent mesh topologies to solve their part of the coup- led problem. The geometric intersection of the triangle mesh (top left) and the quadrilateral mesh (top right) is calculated by DTK (shown in the lower image). This intersection mesh permits accurate and conservative data transfer between the meshes by allowing for accurate numerical integration. Images courtesy of Stuart Slattery (ORNL) ;and Roger Pawlowski (SNL)
Coupled M&S requires dedicated data handling infrastructure.
57 CASL-U-2014-0177-000
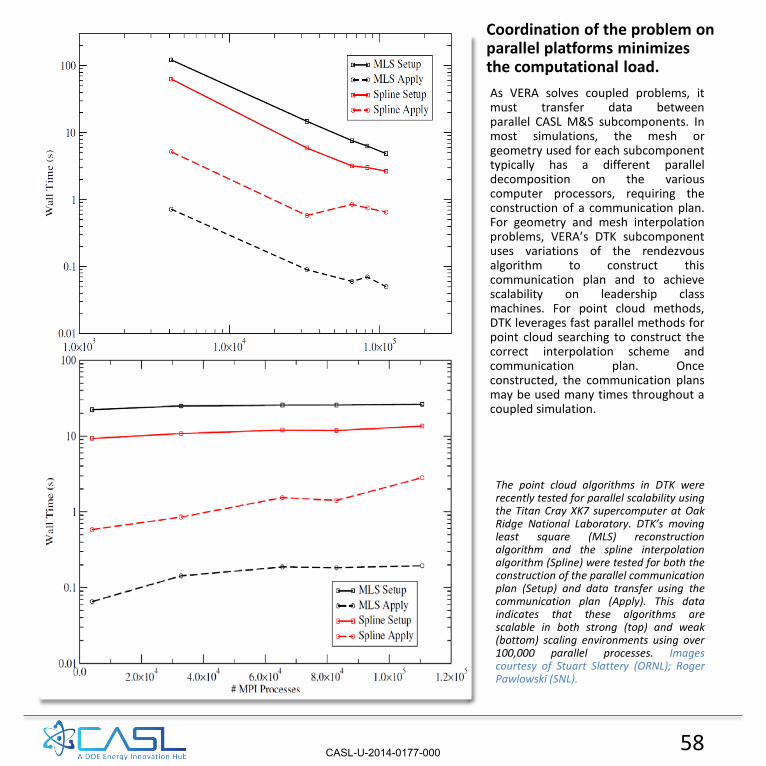
As VERA solves coupled problems, it must transfer data between parallel CASL M&S subcomponents. In most simulations, the mesh or geometry used for each subcomponent typically has a different parallel decomposition on the various computer processors, requiring the construction of a communication plan. For geometry and mesh interpolation problems, VERA’s DTK subcomponent uses variations of the rendezvous algorithm to construct this communication plan and to achieve scalability on leadership class machines. For point cloud methods, DTK leverages fast parallel methods for point cloud searching to construct the correct interpolation scheme and communication plan. Once constructed, the communication plans may be used many times throughout a coupled simulation.
The point cloud algorithms in DTK were recently tested for parallel scalability using the Titan Cray XK7 supercomputer at Oak Ridge National Laboratory. DTK’s moving least square (MLS) reconstruction algorithm and the spline interpolation algorithm (Spline) were tested for both the construction of the parallel communication plan (Setup) and data transfer using the communication plan (Apply). This data indicates that these algorithms are scalable in both strong (top) and weak (bottom) scaling environments using over 100,000 parallel processes. Images courtesy of Stuart Slattery (ORNL); Roger Pawlowski (SNL).
Coordination of the problem on parallel platforms minimizes the computational load.
58 CASL-U-2014-0177-000
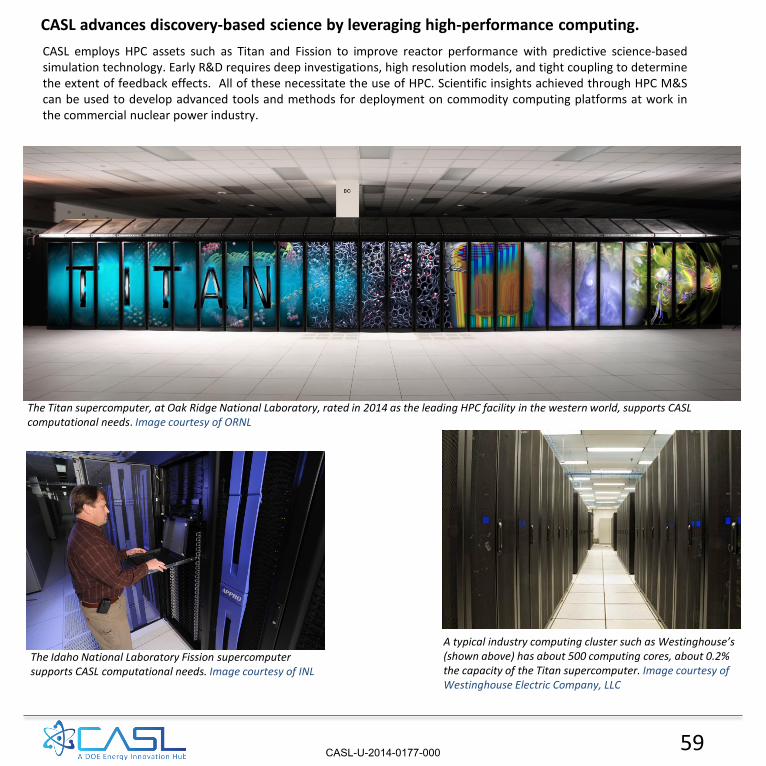
The Titan supercomputer, at Oak Ridge National Laboratory, rated in 2014 as the leading HPC facility in the western world, supports CASL computational needs. Image courtesy of ORNL
A typical industry computing cluster such as Westinghouse’s (shown above) has about 500 computing cores, about 0.2% the capacity of the Titan supercomputer. Image courtesy of Westinghouse Electric Company, LLC
The Idaho National Laboratory Fission supercomputer supports CASL computational needs. Image courtesy of INL
CASL employs HPC assets such as Titan and Fission to improve reactor performance with predictive science-based simulation technology. Early R&D requires deep investigations, high resolution models, and tight coupling to determine the extent of feedback effects. All of these necessitate the use of HPC. Scientific insights achieved through HPC M&S can be used to develop advanced tools and methods for deployment on commodity computing platforms at work in the commercial nuclear power industry.
CASL advances discovery-based science by leveraging high-performance computing.
59 CASL-U-2014-0177-000

One of CASL’s goals is to enable the use of leadership-class parallel computing for engineering design and analysis of relevant problems faced by the nuclear power industry by developing and deploying software tools and demonstrating their applicability. Pioneering a higher fidelity more science-based technology necessarily requires significant computational support. CASL’s large-scale highest fidelity simulations require hundreds of thousands of cores working in concert to converge a solution. A mesh resolution upwards of 1 million computational cells is necessary for sub-region analyses; a billion cells or more could be required for full system analysis. And it isn’t only the actual simulation computations that take advantage of parallel processing: advanced modeling and simulation tools
(a) VERA computing requirements depend upon the application, and applications are designed to scale to available computing capacity.
(b) VERA subcomponents have been tested for scalability. As an example, shown above is MPACT 3-D MOC Strong Scaling for the Takeda Benchmark Problem.
(c) Each Titan node contains one NVIDIA Kepler GPU (show n) plus an AMD 16-core Opteron CPU.
Scalability of the VERA M&S tools is required to take advantage of HPC while allowing execution on industry platforms.
Functionality VERA
Computing Requirements Geometry Processing Cores
Input N/A 100 – 1,000 Neutronics Quarter Core 1,000 – 10,000 Thermal Hydraulics Quarter Core 100 – 1,000 CFD Assembly 10,000 – 100,000 Fuel Performance Single Pin 1,000 – 5,000 Chemistry Assembly Section 1,000 – 10,000 Structural Assembly 10,000 – 100,000 Uncertainty Quantification Assembly 10,000 – 100,000
Output visualization N/A 1,000 – 10,000
60
1.00
10.00
100.00
1000.00
10000.00
100000.00
1 8 64 512 4096
Spee
dup
Number of Processors
Observed Ideal
create heavy demand for geometry, meshing, visualization, data storage and analysis. Visualization of the inputs and outputs can be very computationally intensive, and the massive amounts for data generated by the calculations and the supporting validation data require a large storage capacity.
CASL strives to improve, optimize, and extend the functionality of its data management, solution transfer, solvers, and input/output features. VERA has been demonstrated on a variety of systems, from industry-class computing clusters to DOE’s leading edge HPC clusters. Keeping pace with emerging architectural issues such as on-node parallelism, increasing levels of memory hierarchy, and balancing computation and data movement are priorities for CASL’s development team. VERA must be able to take advantage of increased parallelism, and must be able to efficiently manage additional levels of memory and floating point hierarchy in order to exploit the leading edge of hardware capability as it becomes available.
(b) (a)
(c)
CASL-U-2014-0177-000
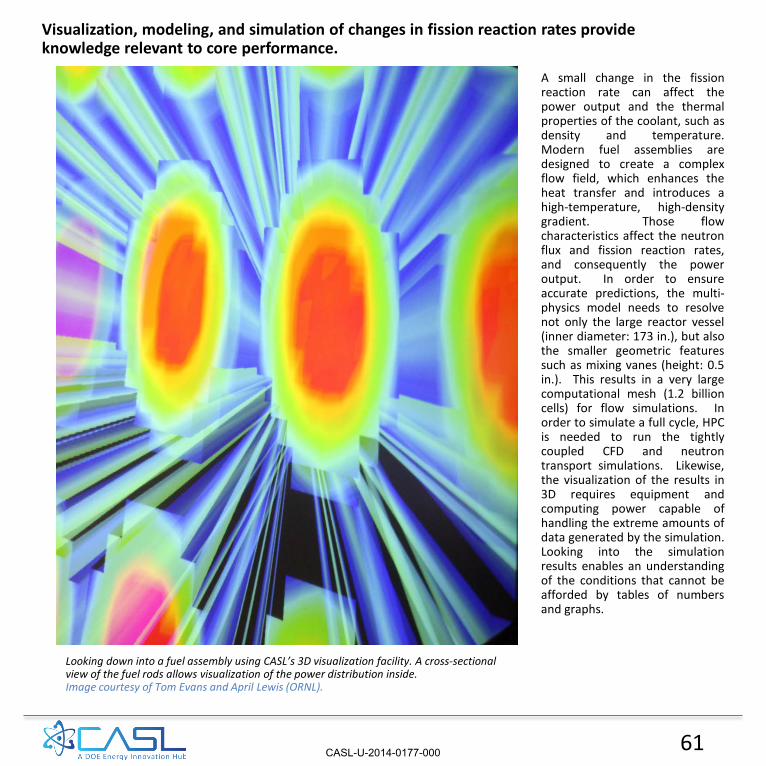
Looking down into a fuel assembly using CASL’s 3D visualization facility. A cross-sectional view of the fuel rods allows visualization of the power distribution inside. Image courtesy of Tom Evans and April Lewis (ORNL).
A small change in the fission reaction rate can affect the power output and the thermal properties of the coolant, such as density and temperature. Modern fuel assemblies are designed to create a complex flow field, which enhances the heat transfer and introduces a high-temperature, high-density gradient. Those flow characteristics affect the neutron flux and fission reaction rates, and consequently the power output. In order to ensure accurate predictions, the multi-physics model needs to resolve not only the large reactor vessel (inner diameter: 173 in.), but also the smaller geometric features such as mixing vanes (height: 0.5 in.). This results in a very large computational mesh (1.2 billion cells) for flow simulations. In order to simulate a full cycle, HPC is needed to run the tightly coupled CFD and neutron transport simulations. Likewise, the visualization of the results in 3D requires equipment and computing power capable of handling the extreme amounts of data generated by the simulation. Looking into the simulation results enables an understanding of the conditions that cannot be afforded by tables of numbers and graphs.
Visualization, modeling, and simulation of changes in fission reaction rates provide knowledge relevant to core performance.
61 CASL-U-2014-0177-000

The VERA physics models are numerical representations of physical processes. It is important to understand the accuracy of VERA prior to making decisions based on its predictions. To facilitate the validation effort and to quantify the uncertainty associated with the various physics models, VERA includes a subcomponent for sensitivity analysis (Dakota). Dakota is used to vary the hundreds of parameters associated with the calculation simultaneously to examine the sensitivity of the solution to each individually. This is one method CASL uses to evaluate the accuracy and uncertainty of VERA’s complex models.
Which ones are different?
Scatter plots are generated by VERA’s validation subcomponent, Dakota, to examine the sensitivity of the solution to each relevant modeling parameter. This study on the calculation of total flow as predicted by VERA’s subchannel flow model uses Latin hypercube sampling for 30 model form parameters. The superimposed regression lines characterize the trends, revealing two parameters with a strong influence on total pressure (vertical liquid wall drag coefficient and pressure loss coefficient of spacer grids in the sub-channel).
Image courtesy of Brian Adams (SNL).
The validity and uncertainty of VERA’s predications must be demonstrated.
62 CASL-U-2014-0177-000

2D two-dimensional 3D three-dimensional BPR Burnable poison rod CAD computer-aided design CASL Consortium for Advanced Simulation of
Light Water Reactors CFD computational fluid dynamics CILC CRUD-induced localized corrosion CRUD Chalk River/corrosion-related unidentified
deposit DNB departure from nucleate boiling DNS direct numerical simulation EA finite-element analysis EFPD Effective Full Power Days EPRI Electric Power Research Institute FEM finite element mesh GTRF grid-to-rod fretting HPC high performance computing IFA instrumented fuel assembly INL Idaho National Laboratory iPWR Integral Pressurized Water Reactor LANL Los Alamos National Laboratory LWR light water reactor
63
M&S modeling and simulation MIT The Massachusetts Institute of Technology MLS moving least square MOC method of characteristics MPS missing pellet surface NCSU North Carolina State University ND The University of Notre Dame ORNL Oak Ridge National Laboratory PCI pellet-cladding interaction PNNL Pacific Northwest National Laboratory PWR Pressurized Water Reactor RANS Reynolds-averaged Navier Stokes RSICC Radiation Safety and Software Information
Center SMR Small Modular Reactor SNL Sandia National Laboratory TAMU Texas A&M University TVA Tennessee Valley Authority UM The University of Michigan UTK The University of Tennessee, Knoxville VERA Virtual Environment for Reactor Applications VERA-CS Virtual Environment for Reactor Applications
Core Simulator VOCC Virtual Office Community and Computing
Laboratory WBN Watts Bar Nuclear WEC Westinghouse Electric Company, LLC.
Abbreviated Terms
CASL-U-2014-0177-000

All narrative and images contained in this publication were provided for uses relating to the Consortium for Advanced Simulation of LWRs(CASL), which is managed at Oak Ridge National
Laboratory by UT-Battelle for the U.S. Dept. of Energy.
Further information on Progress at CASL in Modeling and Simulation for Light Water Reactors
can be found at http://www.casl.gov
CASL-U-2014-0177-000


![SPENT FUEL CHARACTERIZATION PROCESS on Spent Fuel... · • [%C] • Assembly process Identify affected population Visual inspections Identify elements with top nozzle inserts fractured](https://static.fdocuments.us/doc/165x107/5fc2c1e4e5c34a1a341382a4/spent-fuel-characterization-process-on-spent-fuel-a-c-a-assembly-process.jpg)