
_Casio_fx9860GSD_9860G_E
596
fx-9860G SD fx-9860G User’s Guide E http://edu.casio.com
Transcript of _Casio_fx9860GSD_9860G_E

8/20/2019 _Casio_fx9860GSD_9860G_E
http://slidepdf.com/reader/full/casiofx9860gsd9860ge 1/595
fx-9860G SD fx-9860GUser’s Guide
E
http://edu.casio.com

8/20/2019 _Casio_fx9860GSD_9860G_E
http://slidepdf.com/reader/full/casiofx9860gsd9860ge 2/595
GUIDELINES LAID DOWN BY FCC RULES FOR USE OF THE UNIT IN THE U.S.A. (not appli-
cable to other areas).
NOTICEThis equipment has been tested and found to comply with the limits for a Class B digital device,pursuant to Part 15 of the FCC Rules. These limits are designed to provide reasonable protec-
tion against harmful interference in a residential installation. This equipment generates, usesand can radiate radio frequency energy and, if not installed and used in accordance with theinstructions, may cause harmful interference to radio communications. However, there is noguarantee that interference will not occur in a particular installation. If this equipment doescause harmful interference to radio or television reception, which can be determined by turningthe equipment off and on, the user is encouraged to try to correct the interference by one or moreof the following measures:
• Reorient or relocate the receiving antenna.• Increase the separation between the equipment and receiver.
• Connect the equipment into an outlet on a circuit different from that to which the receiver isconnected.• Consult the dealer or an experienced radio/TV technician for help.
FCC WARNINGChanges or modifications not expressly approved by the party responsible for compliance couldvoid the user’s authority to operate the equipment.Proper connectors must be used for connection to host computer and/or peripherals in order tomeet FCC emission limits.
Connector SB-62 Power Graphic Unit to Power Graphic Unit
USB connector that comes with the fx-9860G SD/fx-9860GPower Graphic Unit to PC for IBM Machine
IBM is a registered trademark of International Business Machines Corporation.
Declaration of ConformityModel Number: fx-9860G SD/fx-9860G
Trade Name: CASIO COMPUTER CO., LTD.
Responsible party: CASIO, INC.
Address: 570 MT. PLEASANT AVENUE, DOVER, NEW JERSEY 07801
Telephone number: 973-361-5400
This device complies with Part 15 of the FCC Rules. Operation is subject to the
following two conditions: (1) This device may not cause harmful interference, and
(2) this device must accept any interference received, including interference that may
cause undesired operation.

8/20/2019 _Casio_fx9860GSD_9860G_E
http://slidepdf.com/reader/full/casiofx9860gsd9860ge 3/595
BEFORE USING THE CALCULATOR
FOR THE FIRST TIME...
This calculator does not contain any main batteries when you purchase it. Be sure to
perform the following procedure to load batteries, reset the calculator, and adjust the
contrast before trying to use the calculator for the first time.
1. Making sure that you do not accidently press theo key, slide the case onto the
calculator and then turn the calculator over. Remove the back cover from the calculator
by pulling with your finger at the point marked1.
2. Load the four batteries that come with the calculator.
• Make sure that the positive (+) and negative (–) ends of the batteries are facing
correctly.
3. Remove the insulating sheet at the location marked “BACK UP” by pulling in the
direction indicated by the arrow.
4. Replace the back cover, making sure that its tabs enter the holes marked2 and turn
the calculator front side up. The calculator will turn on automatically and the MAIN
MENU will appear on the display.
1
220060601

8/20/2019 _Casio_fx9860GSD_9860G_E
http://slidepdf.com/reader/full/casiofx9860gsd9860ge 4/595
P button
• If the Main Menu shown to the right is not on the display,
open the back cover and press the P button located
inside of the battery compartment.
5. Use the cursor keys (f,c,d,e) to select the SYSTEM icon and press
w, then press1( ) to display the contrast adjustment screen.
6. Adjust the contrast.
• Thee cursor key makes display contrast darker.
• Thed cursor key makes display contrast lighter.• 1(INIT) returns display contrast to its initial default.
7. To exit display contrast adjustment, pressm.
20060601

8/20/2019 _Casio_fx9860GSD_9860G_E
http://slidepdf.com/reader/full/casiofx9860gsd9860ge 5/595
20050401
TURNING POWER ON AND OFF
USING MODES
BASIC CALCULATIONS
REPLAY FEATURE
FRACTION CALCULATIONS
EXPONENTS
GRAPH FUNCTIONS
DUAL GRAPH
DYNAMIC GRAPH
TABLE FUNCTION
Quick-Start

8/20/2019 _Casio_fx9860GSD_9860G_E
http://slidepdf.com/reader/full/casiofx9860gsd9860ge 6/595
20050401
Quick-Start
Welcome to the world of graphing calculators.
Quick-Start is not a complete tutorial, but it takes you through many of the most common
functions, from turning the power on, and on to graphing complex equations. Whenyou’re done, you’ll have mastered the basic operation of this calculator and will be readyto proceed with the rest of this user’s guide to learn the entire spectrum of functions
available.
Each step of the examples in Quick-Start is shown graphically to help you follow along
quickly and easily. When you need to enter the number 57, for example, we’ve indi-cated it as follows:
Pressfh.
Whenever necessary, we’ve included samples of what your screen should look like.
If you find that your screen doesn’t match the sample, you can restart from the begin-ning by pressing the “All Clear” buttono.
TURNING POWER ON AND OFF
To turn power on, presso.
To turn power off, press!oOFF
.
Calculator power turns off automatically if you do not perform any operation within the
Auto Power Off trigger time you specify. You can specify either six minutes or 60minutes as the trigger time.
USING MODES
This calculator makes it easy to perform a wide range of calculations by simplyselecting the appropriate mode. Before getting into actual calculations and operation
examples, let’s take a look at how to navigate around the modes.
To select the RUN • MAT mode
1. Pressm to display the Main Menu.
1
Quick-Start

8/20/2019 _Casio_fx9860GSD_9860G_E
http://slidepdf.com/reader/full/casiofx9860gsd9860ge 7/595
20050401
2. Usedefc to highlight RUN • MAT
and then pressw.
This is the initial screen of the RUN • MAT mode,where you can perform manual calculations,matrix calculations, and run programs.
BASIC CALCULATIONS
With manual calculations, you input formulas from left to right, just as they are writtenon paper. With formulas that include mixed arithmetic operators and parentheses, the
calculator automatically applies true algebraic logic to calculate the result.
Example: 15 × 3 + 61
1. Presso to clear the calculator.
2. Pressbf*d+gbw.
Parentheses Calculations
Example: 15 × (3 + 61)
1. Pressbf*(d+gb)w.
Built-In Functions
This calculator includes a number of built-in scientific functions, including trigonometricand logarithmic functions.
Example: 25 × sin 45˚
Important!
Be sure that you specify Deg (degrees) as the angle unit before you try this
example.
2
Quick-Start

8/20/2019 _Casio_fx9860GSD_9860G_E
http://slidepdf.com/reader/full/casiofx9860gsd9860ge 8/595
20050401
1. Press!m to display the Setup screen.
2. Presscccccc1(Deg)
to specify degrees as the angle unit.
3. PressJ to clear the menu.
4. Presso to clear the unit.
5. Presscf*sefw.
REPLAY FEATURE
With the replay feature, simply pressd ore to recall the last calculation thatwas performed so you can make changes or re-execute it as it is.
Example: To change the calculation in the last example from (25 × sin 45˚) to(25 × sin 55˚)
1. Pressd to display the last calculation.
2. Pressd to move the cursor (I) to the right side of 4.
3. PressD to delete 4.
4. Pressf.
5. Pressw to execute the calculation again.
3
Quick-Start
SET UP

8/20/2019 _Casio_fx9860GSD_9860G_E
http://slidepdf.com/reader/full/casiofx9860gsd9860ge 9/595
20050401
FRACTION CALCULATIONS
You can use the$ key to input fractions into calculations. The symbol “ { ” is used
to separate the various parts of a fraction.
Example: 31 / 16 + 37 / 9
1. Presso.
2. Pressdb$bg+dh$jw.
Converting an Improper Fraction to a Mixed Fraction
While an improper fraction is shown on the display, press!Mto convert it to amixed fraction.
Press!M again to convert back to an improper fraction.
Converting a Fraction to Its Decimal Equivalent
While a fraction is shown on the display, pressM to convert it to its decimalequivalent.
PressM again to convert back to a fraction.
Indicates871
/ 144
4
Quick-Start
<
<

8/20/2019 _Casio_fx9860GSD_9860G_E
http://slidepdf.com/reader/full/casiofx9860gsd9860ge 10/595
20050401
EXPONENTS
Example: 1250 × 2.065
1. Presso.
2. Pressbcfa*c.ag.
3. PressM and the ^ indicator appears on the display.
4. Pressf. The ^5 on the display indicates that 5 is an exponent.
5. Pressw.
5
Quick-Start

8/20/2019 _Casio_fx9860GSD_9860G_E
http://slidepdf.com/reader/full/casiofx9860gsd9860ge 11/595
20050401
GRAPH FUNCTIONS
The graphing capabilities of this calculator makes it possible to draw complex graphs
using either rectangular coordinates (horizontal axis: x ; vertical axis: y) or polarcoordinates (angle: θ ; distance from origin: r ).All of the following graphing examples are performed starting from the calculator setup
in effect immediately following a reset operation.
Example 1: To graph Y = X(X + 1)(X – 2)
1. Pressm.
2. Usedefc to highlight
GRAPH, and then pressw.
3. Input the formula.
v(v+b)
(v-c)w
4. Press6(DRAW) orw to draw the graph.
Example 2: To determine the roots of Y = X(X + 1)(X – 2)
1. Press!5(G-SLV).
6
Quick-Start

8/20/2019 _Casio_fx9860GSD_9860G_E
http://slidepdf.com/reader/full/casiofx9860gsd9860ge 12/595
20050401
2. Press1(ROOT).
Presse for other roots.
Example 3: Determine the area bounded by the origin and the X = –1 root obtained
for Y = X(X + 1)(X – 2)
1. Press!5(G-SLV)6(g).
2. Press3(∫ dx ).
3. Used to move the pointer to the location where
X = –1, and then pressw. Next, usee to
move the pointer to the location where X = 0, and
then pressw to input the integration range,
which becomes shaded on the display.
7
Quick-Start

8/20/2019 _Casio_fx9860GSD_9860G_E
http://slidepdf.com/reader/full/casiofx9860gsd9860ge 13/595
20050401
DUAL GRAPH
With this function you can split the display between two areas and display two graph
windows.
Example: To draw the following two graphs and determine the points of intersection
Y1 = X(X + 1)(X – 2)
Y2 = X + 1.2
1. Press!mcc1(G+G)
to specify “G+G” for the Dual Screen setting.
2. PressJ, and then input the two functions.
v(v+b)(v-c)wv+b.cw
3. Press6(DRAW) orw to draw the graphs.
Box Zoom
Use the Box Zoom function to specify areas of a graph for enlargement.
1. Press!2(ZOOM)1(BOX).
2. Used e f c to move the pointer
to one corner of the area you want to specify and
then pressw.
8
Quick-Start
SET UP

8/20/2019 _Casio_fx9860GSD_9860G_E
http://slidepdf.com/reader/full/casiofx9860gsd9860ge 14/595
20050401
3. Used e f c to move the pointeragain. As you do, a box appears on the display.
Move the pointer so the box encloses the area
you want to enlarge.
4. Pressw, and the enlarged area appears in the
inactive (right side) screen.
DYNAMIC GRAPH
Dynamic Graph lets you see how the shape of a graph is affected as the valueassigned to one of the coefficients of its function changes.
Example: To draw graphs as the value of coefficient A in the following function changes
from 1 to 3
Y = AX2
1. Pressm.
2. Used e f c to highlight DYNA,
and then pressw.
3. Input the formula.
avA
vxw
12356
9
Quick-Start

8/20/2019 _Casio_fx9860GSD_9860G_E
http://slidepdf.com/reader/full/casiofx9860gsd9860ge 15/595
20050401
4. Press4(VAR)bw to assign an initial valueof 1 to coefficient A.
5. Press2(SET)bwdwbwto specify the range and increment of change
in coefficient A.
6. PressJ.
7. Press6(DYNA) to start Dynamic Graph drawing.
The graphs are drawn 10 times.
• To interrupt an ongoing Dynamic Graph drawing
operation, presso.
↓
↓↑
↓↑
10
Quick-Start

8/20/2019 _Casio_fx9860GSD_9860G_E
http://slidepdf.com/reader/full/casiofx9860gsd9860ge 16/595
20050401
TABLE FUNCTION
The Table Function makes it possible to generate a table of solutions as different
values are assigned to the variables of a function.
Example: To create a number table for the following function
Y = X (X+1) (X–2)
1. Pressm.
2. Usedefc to highlight
TABLE, and then pressw.
3. Input the formula.
v(v+b)(v-c)w
4. Press6(TABL) to generate the number
table.
To learn all about the many powerful features of this calculator, read on and explore!
11
Quick-Start

8/20/2019 _Casio_fx9860GSD_9860G_E
http://slidepdf.com/reader/full/casiofx9860gsd9860ge 17/595
20050401
Precautions when Using this ProductA progress bar and/or a busy indicator appear on the display whenever the calculator is
performing a calculation, writing to memory (including Flash memory), or reading frommemory (including Flash memory).
Never press the P button or remove the batteries from the calculator when the progress baror busy indicator is on the display. Doing so can cause memory contents to be lost and can
cause malfunction of the calculator.
This calculator is equipped with Flash memory for data storage. It is recommended that you
always backup your data to Flash memory. For details about the backup procedure, see
“12-7 MEMORY Mode” in the User’s Guide.
You can also transfer data to a computer using the Program-Link software (FA-124) that
comes bundled with the calculator. The Program-Link software can also be used to backup
data to a computer.
u fx-9860G SD only
If the message “No Card” appears even though an SD card is loaded in the SD card slot, it
means that the calculator is not recognizing the card for some reason. Try removing the card
and then loading it again. If this does not work, contact the developer of the SD card. Note
that some SD cards may not be compatible with this calculator.
Precautions when Connecting to a
ComputerA special USB driver must be installed on your computer in order to connect to the calculator.
The driver is installed along with the Program-Link software (FA-124) that comes bundled
with the calculator. Be sure to install the Program-Link software (FA-124) on your computer
before trying to connect the calculator. Attempting to connect the calculator to a computer
that does not have the Program-Link software installed can cause malfunction. For
information about how to install the Program-Link software, see the User’s Guide on the
bundled CD-ROM.
Progress bar
Busy indicator

8/20/2019 _Casio_fx9860GSD_9860G_E
http://slidepdf.com/reader/full/casiofx9860gsd9860ge 18/595
20050401
Handling Precautions• Your calculator is made up of precision components. Never try to take it apart.
• Avoid dropping your calculator and subjecting it to strong impact.
• Do not store the calculator or leave it in areas exposed to high temperatures or humidity, or
large amounts of dust. When exposed to low temperatures, the calculator may require more
time to display results and may even fail to operate. Correct operation will resume once the
calculator is brought back to normal temperature.
• The display will go blank and keys will not operate during calculations. When you are operating
the keyboard, be sure to watch the display to make sure that all your key operations are beingperformed correctly.
• Replace the main batteries once every one year regardless of how much the calculator is used
during that period. Never leave dead batteries in the battery compartment. They can leak and
damage the unit.
• Keep batteries out of the reach of small children. If swallowed, consult a physician immediately.
• Avoid using volatile liquids such as thinner or benzine to clean the unit. Wipe it with a soft, dry
cloth, or with a cloth that has been moistened with a solution of water and a neutral detergentand wrung out.
• Always be gentle when wiping dust off the display to avoid scratching it.
• In no event will the manufacturer and its suppliers be liable to you or any other person for any
damages, expenses, lost profits, lost savings or any other damages arising out of loss of dataand/or formulas arising out of malfunction, repairs, or battery replacement. It is up to you to
prepare physical records of data to protect against such data loss.
• Never dispose of batteries, the liquid crystal panel, or other components by burning them.
• Be sure that the power switch is set to OFF when replacing batteries.
• If the calculator is exposed to a strong electrostatic charge, its memory contents may be
damaged or the keys may stop working. In such a case, perform the Reset operation to clear
the memory and restore normal key operation.
• If the calculator stops operating correctly for some reason, use a thin, pointed object to press
the P button on the back of the calculator. Note, however, that this clears all the data in
calculator memory.
• Note that strong vibration or impact during program execution can cause execution to stop orcan damage the calculator’s memory contents.
• Using the calculator near a television or radio can cause interference with TV or radio reception.
• Before assuming malfunction of the unit, be sure to carefully reread this user’s guide and ensure
that the problem is not due to insufficient battery power, programming or operational errors.
• Battery life can be reduced dramatically by certain operations and by the use of certain types of
SD cards.

8/20/2019 _Casio_fx9860GSD_9860G_E
http://slidepdf.com/reader/full/casiofx9860gsd9860ge 19/595
20050401
Be sure to keep physical records of all important data! Low battery power or incorrect replacement of the batteries that power the unit can cause the
data stored in memory to be corrupted or even lost entirely. Stored data can also be affected by
strong electrostatic charge or strong impact. It is up to you to keep back up copies of data to
protect against its loss.
In no event shall CASIO Computer Co., Ltd. be liable to anyone for special, collateral, incidental,or consequential damages in connection with or arising out of the purchase or use of these
materials. Moreover, CASIO Computer Co., Ltd. shall not be liable for any claim of any kind
whatsoever against the use of these materials by any other party.
• The contents of this user’s guide are subject to change without notice.
• No part of this user’s guide may be reproduced in any form without the express written
consent of the manufacturer.
• The options described in Chapter 12 of this user’s guide may not be available in certain
geographic areas. For full details on availability in your area, contact your nearest CASIOdealer or distributor.

8/20/2019 _Casio_fx9860GSD_9860G_E
http://slidepdf.com/reader/full/casiofx9860gsd9860ge 20/595
20050401
Contents
Getting Acquainted — Read This First!
Chapter 1 Basic Operation
1-1 Keys ................................................................................................. 1-1-1
1-2 Display .............................................................................................. 1-2-1
1-3 Inputting and Editing Calculations .................................................... 1-3-1
1-4 Option (OPTN) Menu ....................................................................... 1-4-1
1-5 Variable Data (VARS) Menu ............................................................. 1-5-1
1-6 Program (PRGM) Menu ................................................................... 1-6-1
1-7 Using the Setup Screen ................................................................... 1-7-11-8 Using Screen Capture ...................................................................... 1-8-1
1-9 When you keep having problems… ................................................. 1-9-1
Chapter 2 Manual Calculations
2-1 Basic Calculations ............................................................................ 2-1-1
2-2 Special Functions ............................................................................. 2-2-1
2-3 Specifying the Angle Unit and Display Format ................................. 2-3-1
2-4 Function Calculations ....................................................................... 2-4-1
2-5 Numerical Calculations ..................................................................... 2-5-12-6 Complex Number Calculations ......................................................... 2-6-1
2-7 Binary, Octal, Decimal, and Hexadecimal Calculations
with Integers ..................................................................................... 2-7-1
2-8 Matrix Calculations ........................................................................... 2-8-1
Chapter 3 List Function
3-1 Inputting and Editing a List ............................................................... 3-1-1
3-2 Manipulating List Data ...................................................................... 3-2-1
3-3 Arithmetic Calculations Using Lists .................................................. 3-3-13-4 Switching Between List Files ............................................................ 3-4-1
Chapter 4 Equation Calculations
4-1 Simultaneous Linear Equations........................................................ 4-1-1
4-2 Quadratic and Cubic Equations........................................................ 4-2-1
4-3 Solve Calculations ............................................................................ 4-3-1
4-4 What to Do When an Error Occurs ................................................... 4-4-1
1
Contents

8/20/2019 _Casio_fx9860GSD_9860G_E
http://slidepdf.com/reader/full/casiofx9860gsd9860ge 21/595
20050401
Chapter 5 Graphing5-1 Sample Graphs ................................................................................ 5-1-1
5-2 Controlling What Appears on a Graph Screen ................................. 5-2-1
5-3 Drawing a Graph .............................................................................. 5-3-15-4 Storing a Graph in Picture Memory .................................................. 5-4-1
5-5 Drawing Two Graphs on the Same Screen ...................................... 5-5-1
5-6 Manual Graphing .............................................................................. 5-6-1
5-7 Using Tables ..................................................................................... 5-7-1
5-8 Dynamic Graphing............................................................................ 5-8-1
5-9 Graphing a Recursion Formula ........................................................ 5-9-1
5-10 Changing the Appearance of a Graph ............................................ 5-10-1
5-11 Function Analysis ........................................................................... 5-11-1
Chapter 6 Statistical Graphs and Calculations
6-1 Before Performing Statistical Calculations ....................................... 6-1-1
6-2 Calculating and Graphing Single-Variable Statistical Data ............... 6-2-1
6-3 Calculating and Graphing Paired-Variable Statistical Data .............. 6-3-1
6-4 Performing Statistical Calculations ................................................... 6-4-1
6-5 Tests ................................................................................................. 6-5-1
6-6 Confidence Interval .......................................................................... 6-6-1
6-7 Distribution ....................................................................................... 6-7-1
Chapter 7 Financial Calculation (TVM)
7-1 Before Performing Financial Calculations ........................................ 7-1-1
7-2 Simple Interest ................................................................................. 7-2-1
7-3 Compound Interest ........................................................................... 7-3-1
7-4 Cash Flow (Investment Appraisal) .................................................... 7-4-1
7-5 Amortization ..................................................................................... 7-5-1
7-6 Interest Rate Conversion .................................................................. 7-6-1
7-7 Cost, Selling Price, Margin ............................................................... 7-7-1
7-8 Day/Date Calculations ...................................................................... 7-8-1
2
Contents

8/20/2019 _Casio_fx9860GSD_9860G_E
http://slidepdf.com/reader/full/casiofx9860gsd9860ge 22/595
20050401
3
Contents
Chapter 8 Programming8-1 Basic Programming Steps ................................................................ 8-1-1
8-2 PRGM Mode Function Keys ............................................................. 8-2-1
8-3 Editing Program Contents ................................................................ 8-3-18-4 File Management .............................................................................. 8-4-1
8-5 Command Reference ....................................................................... 8-5-1
8-6 Using Calculator Functions in Programs .......................................... 8-6-1
8-7 PRGM Mode Command List ............................................................ 8-7-1
8-8 Program Library ................................................................................ 8-8-1
Chapter 9 Spreadsheet9-1 Spreadsheet Overview ..................................................................... 9-1-1
9-2 File Operations and Re-calculation .................................................. 9-2-19-3 Basic Spreadsheet Screen Operations ............................................ 9-3-1
9-4 Inputting and Editing Cell Data ......................................................... 9-4-1
9-5 S • SHT Mode Commands ................................................................ 9-5-1
9-6 Statistical Graphs ............................................................................. 9-6-1
9-7 Using the CALC Function ................................................................. 9-7-1
9-8 Using Memory in the S • SHT Mode ................................................. 9-8-1
Chapter 10 eActivity
10-1 eActivity Overview ........................................................................ 10-1-110-2 Working with eActivity Files .......................................................... 10-2-1
10-3 Inputting and Editing eActivity File Data....................................... 10-3-1
10-4 Using Matrix Editor and List Editor ............................................... 10-4-1
10-5 eActivity File Memory Usage Screen ........................................... 10-5-1
Chapter 11 System Settings Menu11-1 Using the System Settings Menu ................................................. 11-1-1
11-2 System Settings ........................................................................... 11-2-1
11-3 Version List ................................................................................... 11-3-111-4 Reset ............................................................................................ 11-4-1
Chapter 12 Data Communications12-1 Connecting Two Units .................................................................. 12-1-1
12-2 Connecting the Unit to a Personal Computer ............................... 12-2-1
12-3 Performing a Data Communication Operation ............................. 12-3-1
12-4 Data Communications Precautions .............................................. 12-4-1
12-5 Image Transfer ............................................................................. 12-5-1
12-6 Add-ins ......................................................................................... 12-6-1
12-7 MEMORY Mode ........................................................................... 12-7-1
20060601

8/20/2019 _Casio_fx9860GSD_9860G_E
http://slidepdf.com/reader/full/casiofx9860gsd9860ge 23/595
20050401
4
Contents
Chapter 13 Using SD Cards (fx-9860G SD only)
13-1 Using an SD Card ........................................................................ 13-1-1
13-2 Formatting an SD Card ................................................................ 13-2-1
13-3 SD Card Precautions during Use ................................................. 13-3-1
Appendix1 Error Message Table ........................................................................... α -1-1
2 Input Ranges .......................................................................................α -2-1
3 Specifications .......................................................................................α -3-1
4 Key Index .............................................................................................α -4-1
5 P Button (In case of hang up) ............................................................. α -5-1
6 Power Supply .......................................................................................α -6-1

8/20/2019 _Casio_fx9860GSD_9860G_E
http://slidepdf.com/reader/full/casiofx9860gsd9860ge 24/595
20050401
Getting Acquainted
— Read This First!
About this User’s Guide
u!
x( )
The above indicates you should press! and thenx, which will input a symbol. All
multiple-key input operations are indicated like this. Key cap markings are shown, followed
by the input character or command in parentheses.
u m EQUA
This indicates you should first pressm, use the cursor keys (f,c,d,e) to select
the EQUA mode, and then pressw. Operations you need to perform to enter a mode from
the Main Menu are indicated like this.
uFunction Keys and Menus
• Many of the operations performed by this calculator can be executed by pressing function
keys1 through6. The operation assigned to each function key changes according to
the mode the calculator is in, and current operation assignments are indicated by function
menus that appear at the bottom of the display.
• This user’s guide shows the current operation assigned to a function key in parentheses
following the key cap for that key.1(Comp), for example, indicates that pressing1
selects {Comp}, which is also indicated in the function menu.
• When (g) is indicated in the function menu for key6, it means that pressing6 displays
the next page or previous page of menu options.
uuuuuMenu Titles
• Menu titles in this user’s guide include the key operation required to display the menubeing explained. The key operation for a menu that is displayed by pressingK and then
{MAT} would be shown as: [OPTN]-[MAT].
•6(g) key operations to change to another menu page are not shown in menu title key
operations.
0

8/20/2019 _Casio_fx9860GSD_9860G_E
http://slidepdf.com/reader/full/casiofx9860gsd9860ge 25/595
20050401
0-1-1Getting Acquainted
uGraphs
As a general rule, graph operations are shown on
facing pages, with actual graph examples on the right
hand page. You can produce the same graph on yourcalculator by performing the steps under the Procedure
above the graph.
Look for the type of graph you want on the right hand
page, and then go to the page indicated for that graph.
The steps under “Procedure” always use initial RESET
settings.
The step numbers in the “Set Up” and “Execution” sections on the left hand page
correspond to the “Procedure” step numbers on the right hand page.
Example:
Left hand page Right hand page
3. Draw the graph. 3 5(DRAW)(orw)
uuuuuCommand List
The PRGM Mode Command List (page 8-7) provides a graphic flowchart of the various
function key menus and shows how to maneuver to the menu of commands you need.
Example: The following operation displays Xfct: [VARS]-[FACT]-[Xfct]
uuuuuPage Contents
Three-part page numbers are centered at the top of
each page. The page number “1-2-3”, for example,
indicates Chapter 1, Section 2, page 3.
uuuuuSupplementary Information
Supplementary information is shown at the bottom of each page in a “ (Notes)” block.
* indicates a note about a term that appears in the same page as the note.
# indicates a note that provides general information about topic covered in the same section
as the note.
20050401
1-2-2 Display
Icon Mode Name Description
S • SHT Use this mode to perform spreadsheet calculations.Each fi le(Spreadsheet) contains a 26-column⋅ 999-line spreadsheet.In addition to
the calculator’s built-in commands and S • SHT modecommands, you can also perform statistical calculations andgraph statistical data using the same procedures that you usein the STAT mode.
GRAPH Use this mode to store graph functions and to draw graphsusing the functions.
DYNA Use this mode to store graph functions and to draw multiple(Dynamic Graph) versions of a graph by changing the values assigned to the
variables in a function.
TABLE Use this mode to store functions, to generate a numerictable of different solutions as the values assigned tovariables in a function change, and to draw graphs.
RECUR Use this mode to store recursion formulas, to generate a(Recursion) numeric table of different solutions as the values assigned to
variables in a function change, and to draw graphs.
CONICS Use this mode to draw graphs of conic sections.
EQUA Use this mode to solve linear equations with two through six
(Equation) unknowns, quadratic equations, and cubic equations.
PRGM Use this mode to store programs in the program area and to( P ro g ra m) r u n p r og r ams .
T VM U se th i s mod e to p er for mf i na n ci a l cal cul a ti o nsa n d to d ra w
(Financial) cash flow and other types of graphs.to make
LINK Use this mode to transfer memory contents or back-up data
to another unit or PC.
MEMORY Use this mode to manage data stored in memory.
SYSTEM Use this mode to ini tialize memory, adjust contrast, and tomake other system settings.
20050401
kkkkkAbout the Function Menu
Use the function keys (1 to6) to access the menus and commands in the menu bar
along the bottom of the display screen. You can tell whether a menu bar item is a menu or a
command by its appearance.
• Next Menu
Example:
Selecting displays a menu of hyperbolic functions.
• Command Input
Example:
Selecting inputs the sinh command.
• Direct Command Execution
Example:
Selecting executes the DRAW command.
kkkkkAbout Display Screens
This calculator uses two types of display screens: a text screen and a graph screen. The text
screen can show 21 columns and 8 lines of characters, with the bottom line used for the
function key menu.The graph screen uses an area t hat measures 127 (W) ⋅ 63 (H) dots.
Text Screen Graph Screen
The contents of each type of screen are stored in independent memory areas.
Press!6(G T) to switch between the graph screen and text screen.
1-2-3 Display 1-2-2
Display 1-2-3
Display
5-1-1Sample Graphs
5-1-2 Sample Graphs
20050301
5-1 Sample Graphs
kkkkkHowto drawasimplegraph(1)
Description
Todrawa graph,simply inputthe applicablefunction.
Set Up
1.FromtheMainMenu,entertheGRAPHMode.
Execution
2.Inputthefunctionyouwanttograph.
HereyouwouldusetheV-Windowtospeci fytherangeandotherparametersofthe
graph.See 5-2-1.
3.Drawthegraph.
20050301
Ex am p le T o g ra p h y =3 x2
Procedure
1mGRAPH
2dvxw
36(DRAW)(orw)
Result Screen
#PressingAwhile a graph is on the display
will return to the screen in step 2.

8/20/2019 _Casio_fx9860GSD_9860G_E
http://slidepdf.com/reader/full/casiofx9860gsd9860ge 26/595
20050401
Basic Operation1-1 Keys
1-2 Display
1-3 Inputting and Editing Calculations
1-4 Option (OPTN) Menu
1-5 Variable Data (VARS) Menu
1-6 Program (PRGM) Menu
1-7 Using the Setup Screen
1-8 Using Screen Capture
1-9 When you keep having problems…
Chapter1

8/20/2019 _Casio_fx9860GSD_9860G_E
http://slidepdf.com/reader/full/casiofx9860gsd9860ge 27/595
20050401
1-1 Keys
1-1-1Keys

8/20/2019 _Casio_fx9860GSD_9860G_E
http://slidepdf.com/reader/full/casiofx9860gsd9860ge 28/595
20050401
Page Page Page Page Page Page
5-11-1
Page Page Page Page Page
5-2-7 5-2-1
2-4-7 2-4-5
1-1-3 2-4-7 2-4-5
5-10-1 5-11-9 1-2-3
1-6-1
1-1-3 1-4-1 1-5-1 1-2-1
1-7-1
2-4-5 2-4-5
2-4-5 2-4-5
2-4-4 2-4-4
2-4-4 2-4-4
1-3-2
1-3-1
2-1-1
2-1-1
2-1-1
2-1-1
2-2-5
2-1-12-1-1
2-4-7
2-1-1
2-4-10
2-4-10
3-1-2
2-6-2 2-4-4
2-8-11
1-8-1
1-3-7
1-3-5 1-3-7
2-4-12 2-4-7
2-1-1
10-3-13 10-3-12
2-4-4
2-4-4
2-2-12-4-11
1-1-2 Keys
kkkkkKey Table

8/20/2019 _Casio_fx9860GSD_9860G_E
http://slidepdf.com/reader/full/casiofx9860gsd9860ge 29/595
20050401
1-1-3 Keys
kkkkkKey Markings
Many of the calculator’s keys are used to perform more than one function. The functions
marked on the keyboard are color coded to help you find the one you need quickly andeasily.
Function Key Operation
1 log l
2 10 x !l
3 B al
The following describes the color coding used for key markings.
Color Key Operation
Orange Press! and then the key to perform the marked function.
Red Pressa and then the key to perform the marked function.
# Alpha Lock Normally, once you pressa and then a key
to input an alphabetic character, the keyboard
reverts to its primary functions immediately.
If you press! and thena, the keyboard
locks in alpha input until you pressa again.

8/20/2019 _Casio_fx9860GSD_9860G_E
http://slidepdf.com/reader/full/casiofx9860gsd9860ge 30/595
20050401
1-2-1Display
1-2 Display
k Selecting Icons
This section describes how to select an icon in the Main Menu to enter the mode you want.
uuuuu To select an icon
1. Pressm to display the Main Menu.
2. Use the cursor keys (d,e,f,c) to move the highlighting to the icon you want.
3. Pressw to display the initial screen of the mode whose icon you selected.
Here we will enter the STAT mode.
• You can also enter a mode without highlighting an icon in the Main Menu by inputting the
number or letter marked in the lower right corner of the icon.
Currently selected icon
Icon Mode Name Description
RUN • MAT Use this mode for arithmetic calculations and function(Run • Matrix) calculations, and for calculations involving binary, octal,
decimal, and hexadecimal values and matrices.
STAT Use this mode to perform single-variable (standard deviation)(Statistics) and paired-variable (regression) statistical calculations, to
perform tests, to analyze data and to draw statistical graphs.
e • ACT eActivity lets you input text, math expressions, and other data
(eActivity) in a notebook-like interface. Use this mode when you want tostore text or formulas, or built-in application data in a file.
The following explains the meaning of each icon.

8/20/2019 _Casio_fx9860GSD_9860G_E
http://slidepdf.com/reader/full/casiofx9860gsd9860ge 31/595
20050401
1-2-2 Display
Icon Mode Name Description
S • SHT Use this mode to perform spreadsheet calculations. Each file(Spreadsheet) contains a 26-column × 999-line spreadsheet. In addition to
the calculator’s built-in commands and S • SHT modecommands, you can also perform statistical calculations andgraph statistical data using the same procedures that you use
in the STAT mode.
GRAPH Use this mode to store graph functions and to draw graphs
using the functions.
DYNA Use this mode to store graph functions and to draw multiple(Dynamic Graph) versions of a graph by changing the values assigned to the
variables in a function.
TABLE Use this mode to store functions, to generate a numeric
table of different solutions as the values assigned tovariables in a function change, and to draw graphs.
RECUR Use this mode to store recursion formulas, to generate a(Recursion) numeric table of different solutions as the values assigned to
variables in a function change, and to draw graphs.
CONICS Use this mode to draw graphs of conic sections.
EQUA Use this mode to solve linear equations with two through six
(Equation) unknowns, quadratic equations, and cubic equations.
PRGM Use this mode to store programs in the program area and to(Program) run programs.
TVM Use this mode to perform financial calculations and to draw
(Financial) cash flow and other types of graphs. to make
LINK Use this mode to transfer memory contents or back-up data
to another unit or PC.
MEMORY Use this mode to manage data stored in memory.
SYSTEM Use this mode to initialize memory, adjust contrast, and tomake other system settings.

8/20/2019 _Casio_fx9860GSD_9860G_E
http://slidepdf.com/reader/full/casiofx9860gsd9860ge 32/595
20050401
kkkkkAbout the Function Menu
Use the function keys (1 to6) to access the menus and commands in the menu bar
along the bottom of the display screen. You can tell whether a menu bar item is a menu or acommand by its appearance.
• Next Menu
Example:
Selecting displays a menu of hyperbolic functions.
• Command Input
Example:
Selecting inputs the sinh command.
• Direct Command Execution
Example:
Selecting executes the DRAW command.
kkkkkAbout Display Screens
This calculator uses two types of display screens: a text screen and a graph screen. The textscreen can show 21 columns and 8 lines of characters, with the bottom line used for the
function key menu. The graph screen uses an area that measures 127 (W) × 63 (H) dots.
Text Screen Graph Screen
The contents of each type of screen are stored in independent memory areas.
Press!6(G↔T) to switch between the graph screen and text screen.
1-2-3 Display

8/20/2019 _Casio_fx9860GSD_9860G_E
http://slidepdf.com/reader/full/casiofx9860gsd9860ge 33/595
20050401
kkkkkNormal Display
The calculator normally displays values up to 10 digits long. Values that exceed this limit are
automatically converted to and displayed in exponential format.
uHow to interpret exponential format
1.2E+12 indicates that the result is equivalent to 1.2 × 10¹². This means that you should move
the decimal point in 1.2 twelve places to the right, because the exponent is positive. This
results in the value 1,200,000,000,000.
1.2E–03 indicates that the result is equivalent to 1.2 × 10⁻³. This means that you should move
the decimal point in 1.2 three places to the left, because the exponent is negative. This
results in the value 0.0012.
You can specify one of two different ranges for automatic changeover to normal display.
Norm 1 .................. 10–2 (0.01) > | x |, | x | > 1010
Norm 2 .................. 10–9 (0.000000001) > | x |, | x | > 1010
All of the examples in this manual show calculation results using Norm 1.
See page 2-3-2 for details on switching between Norm 1 and Norm 2.
1-2-4 Display

8/20/2019 _Casio_fx9860GSD_9860G_E
http://slidepdf.com/reader/full/casiofx9860gsd9860ge 34/595
20050401
kkkkk Special Display Formats
This calculator uses special display formats to indicate fractions, hexadecimal values, and
degrees/minutes/seconds values.
u Fractions
................. Indicates: 456
u Hexadecimal Values
................. Indicates: 0ABCDEF1(16), which
equals 180150001(10)
u Degrees/Minutes/Seconds
................. Indicates: 12° 34’ 56.78”
• In addition to the above, this calculator also uses other indicators or symbols, which are
described in each applicable section of this manual as they come up.
kkkkkCalculation Execution IndicatorWhenever the calculator is busy drawing a graph or executing a long, complex calculation or
program, a black box “k” flashes in the upper right corner of the display. This black box tells
you that the calculator is performing an internal operation.
1-2-5 Display
12––––23

8/20/2019 _Casio_fx9860GSD_9860G_E
http://slidepdf.com/reader/full/casiofx9860gsd9860ge 35/595
20050401
1-3 Inputting and Editing Calculations
Note
• Unless specifically noted otherwise, all of the operations in this section are explained using theLinear input mode.
kkkkk Inputting Calculations
When you are ready to input a calculation, first pressA to clear the display. Next, input
your calculation formulas exactly as they are written, from left to right, and pressw to
obtain the result.
○ ○ ○ ○ ○
Example 1 2 + 3 – 4 + 10 =
Ac+d-e+baw
○ ○ ○ ○ ○
Example 2 2(5 + 4) ÷ (23 × 5) =
Ac(f+e)/
(cd*f)w
k Editing Calculations
Use thed ande keys to move the cursor to the position you want to change, and then
perform one of the operations described below. After you edit the calculation, you can
execute it by pressingw. Or you can usee to move to the end of the calculation and
input more.
u To change a step
○ ○ ○ ○ ○
Example To change cos60 to sin60
Acga
ddd
D
s
1-3-1Inputting and Editing Calculations

8/20/2019 _Casio_fx9860GSD_9860G_E
http://slidepdf.com/reader/full/casiofx9860gsd9860ge 36/595
20050401
In the Linear input mode, pressing!D(INS) changes the cursor to ‘‘ ’’.
The next function or value you input is overwritten at the location of ‘‘ ’’.
Acga
ddd!D(INS)
s
To abort this operation, press!D(INS) again.
u To delete a step ○ ○ ○ ○ ○
Example To change 369 × × 2 to 369 × 2
Adgj**c
dD
In the insert mode, theD key operates as a backspace key.
1-3-2 Inputting and Editing Calculations
#The cursor is a vertical flashing line (I) whenthe insert mode is selected. The cursor is a
horizontal flashing line ( ) when the overwrite
mode is selected.
# The initial default for Linear input mode is theinsert mode. You can switch to the overwrite
mode by pressing1Y(INS).

8/20/2019 _Casio_fx9860GSD_9860G_E
http://slidepdf.com/reader/full/casiofx9860gsd9860ge 37/595
20050401
1-3-3 Inputting and Editing Calculations
u To insert a step
○ ○ ○ ○ ○
Example To change 2.36
2
to sin2.36
2
Ac.dgx
ddddd
s
u To change the last step you input
○ ○ ○ ○ ○
Example To change 369 × 3 to 369 × 2
Adgj*d
D
c

8/20/2019 _Casio_fx9860GSD_9860G_E
http://slidepdf.com/reader/full/casiofx9860gsd9860ge 38/595
20050401
kkkkkUsing Replay Memory
The last calculation performed is always stored into replay memory. You can recall the
contents of the replay memory by pressingd ore.If you presse, the calculation appears with the cursor at the beginning. Pressingd
causes the calculation to appear with the cursor at the end. You can make changes in the
calculation as you wish and then execute it again.
○ ○ ○ ○ ○
Example 1 To perform the following two calculations
4.12 × 6.4 = 26.368
4.12 × 7.1 = 29.252
Ae.bc*g.ew
dddd
!D(INS)
h.b
w
After you pressA, you can pressf orc to recall previous calculations, in sequence
from the newest to the oldest (Multi-Replay Function). Once you recall a calculation, you can
usee andd to move the cursor around the calculation and make changes in it to create
a new calculation. ○ ○ ○ ○ ○
Example 2
Abcd+efgw
cde-fghw
A
f (One calculation back)
f (Two calculations back)
1-3-4 Inputting and Editing Calculations
# A calculation remains stored in replay memory
until you perform another calculation.
# The contents of replay memory are not
cleared when you press theA key, so youcan recall a calculation and execute it evenafter pressing theA key.
# Replay memory is enabled in the Linear input
mode only. In the Math input mode, the history
function is used in place of the replay memory.For details, see “History Function” (page 2-2-6).
20050901

8/20/2019 _Casio_fx9860GSD_9860G_E
http://slidepdf.com/reader/full/casiofx9860gsd9860ge 39/595
20050401
1-3-5 Inputting and Editing Calculations
# The copy range of text you can specify
depends on the current “Input Mode” setting.
Linear input mode: 1 character
1 line
Multiple lines
Math input mode: 1 line only
kMaking Corrections in the Original Calculation
○ ○ ○ ○ ○
Example 14 ÷ 0 × 2.3 entered by mistake for 14 ÷ 10 × 2.3
Abe/a*c.d
w
PressJ.
Make necessary changes.
db
Execute again.
w
kkkkkUsing the Clipboard for Copy and Paste
You can copy (or cut) a function, command, or other input to the clipboard, and then paste
the clipboard contents at another location.
u To specify the copy range
Linear input mode
1. Move the cursor (I) to the beginning or end of the range of text you want to copy andthen press!i(CLIP).This changes the cursor to “ ”.
2. Use the cursor keys to move the cursor and highlight the range of text you want to
copy.
Cursor is positioned automatically at the location of the cause of the error.

8/20/2019 _Casio_fx9860GSD_9860G_E
http://slidepdf.com/reader/full/casiofx9860gsd9860ge 40/595
20050401
3. Press1(COPY) to copy the highlighted text to the clipboard, and exit the copy range
specification mode.
To cancel text highlighting without performing a copy operation, pressJ.
Math input mode
1. Use the cursor keys to move the cursor to the line you want to copy.
2. Press!i(CLIP) . The cursor will change to “ ”.
3. Press1(CPY • L) to copy the highlighted text to the clipboard.
u To cut the text
1. Move the cursor (I) to the beginning or end of the range of text you want to cut and
then press!i(CLIP). This changes the cursor to “ ”.
2. Use the cursor keys to move the cursor and highlight the range of text you want to cut.
3. Press2(CUT) to cut the highlighted text to the clipboard.
The CUT operation is supported for the Linear input mode only. It is not supported for the Math
input mode.
1-3-6 Inputting and Editing Calculations
The selected characters are not changed when you copy them.
Cutting causes the original characters to be deleted.

8/20/2019 _Casio_fx9860GSD_9860G_E
http://slidepdf.com/reader/full/casiofx9860gsd9860ge 41/595
20050401
uPasting Text
Move the cursor to the location where you want to paste the text, and then press!
j(PASTE). The contents of the clipboard are pasted at the cursor position.
A
!j(PASTE)
kkkkkCatalog Function
The Catalog is an alphabetic list of all the commands available on this calculator. You caninput a command by calling up the Catalog and then selecting the command you want.
u To use the Catalog to input a command
1. Press!e(CATALOG) to display an alphabetic Catalog list of commands.
2. Input the first letter of the command you want to input. This will display the first
command that starts with that letter.
3. Use the cursor keys (f,c) to highlight the command you want to input, and then
pressw.
○ ○ ○ ○ ○
Example To use the Catalog to input the ClrGraph command
A!e(CATALOG)I(C)c~cw
PressingJ or!J(QUIT) closes the Catalog.
1-3-7 Inputting and Editing Calculations

8/20/2019 _Casio_fx9860GSD_9860G_E
http://slidepdf.com/reader/full/casiofx9860gsd9860ge 42/595
20050401
k Input Operations in the Math Input Mode
Selecting “Math” for the “Input Mode” setting on the Setup screen (page 1-7-1) turns on the
Math input mode, which allows natural input and display of certain functions, just as theyappear in your textbook.
Note
• The initial default “Input Mode” setting is “Linear” (Linear input mode). Before trying to
perform any of the operations explained in this section, be sure to change the “Input Mode”
setting to “Math”.
• In the Math input mode, all input is insert mode (not overwrite mode) input. Note that the
!D(INS) operation (page 1-3-2) you use in the Linear input mode to switch to insert
mode input performs a completely different function in the Math input mode. For more
information, see “Inserting a Function into an Existing Expression” (page 1-3-13).
• Unless specifically stated otherwise, all operations in this section are performed in the
RUN • MAT mode.
1-3-8 Inputting and Editing Calculations

8/20/2019 _Casio_fx9860GSD_9860G_E
http://slidepdf.com/reader/full/casiofx9860gsd9860ge 43/595
20050401
uMath Input Mode Functions and Symbols
The functions and symbols listed below can be used for natural input in the Math input
mode. The “Bytes” column shows the number of bytes of memory that are used up by input
in the Math input mode.
Function/Symbol Key Operation Bytes
Fraction (Improper) $ 9
Mixed Fraction*1 !$(&) 14
Power M 4
Square x 4
Negative Power (Reciprocal) !)( x –1) 5
!x( ) 6
Cube Root !((3 ) 9
Power Root !M( x ) 9
e x !I(e x ) 6
10 x !l(10 x ) 6
log(a,b) (Input from MATH menu*2) 7
Abs (Absolute Value) (Input from MATH menu*2) 6
Linear Differential*3 (Input from MATH menu*2) 7
Quadratic Differential*3 (Input from MATH menu*2) 7
Integral*3 (Input from MATH menu*2) 8
Σ Calculation*4 (Input from MATH menu*2) 11
Matrix (Input from MATH menu*2) 14*5
Parentheses ( and) 1
Braces (Used during list input.) !*( { ) and!/( } ) 1
Brackets (Used during matrix input.) !+( [ ) and!-( ] ) 1
1-3-9 Inputting and Editing Calculations
*1 Mixed fraction is supported in the Math input
mode only.
*2 For information about function input from the
MATH function menu, see “Using the MATHMenu” on page 1-3-10.
*3 Tolerance cannot be specified in the Math input
mode. If you want to specify tolerance, use the
Linear input mode.
*4
For Σ calculation in the Math input mode, thepitch is always 1. If you want to specify a
different pitch, use the Linear input mode.
*5 This is the number of bytes for a 2 × 2 matrix.

8/20/2019 _Casio_fx9860GSD_9860G_E
http://slidepdf.com/reader/full/casiofx9860gsd9860ge 44/595
20050401
uUsing the MATH Menu
In the RUN • MAT mode, pressing4(MATH) displays the MATH menu.
You can use this menu for natural input of matrices, differentials, integrals, etc.• {MAT} ... {displays the MAT submenu, for natural input of matrices}
• {2×2} ... {inputs a 2 × 2 matrix}
• {3×3} ... {inputs a 3 × 3 matrix}
• { m× n} ... {inputs a matrix with m lines and n columns (up to 6 × 6)}
• {logab} ... {starts natural input of logarithm log ab}
• {Abs} ... {starts natural input of absolute value |X|}
• { d / dx} ... {starts natural input of linear differentialdx d f ( x ) x = a }
• { d 2 / dx2} ... {starts natural input of quadratic differentialdx 2d 2 f ( x ) x = a }
• {∫ dx} … {starts natural input of integral f ( x )dx a
b }
• {Σ(} … {starts natural input of Σ calculation f ( x ) x=α
β
α Σ }
uMath Input Mode Input Examples
This section provides a number of different examples showing how the MATH function
menu and other keys can be used during Math input mode natural input. Be sure to payattention to the input cursor position as you input values and data.
○ ○ ○ ○ ○
Example 1 To input 23 + 1
AcM
d
e
+b
w
1-3-10 Inputting and Editing Calculations

8/20/2019 _Casio_fx9860GSD_9860G_E
http://slidepdf.com/reader/full/casiofx9860gsd9860ge 45/595
20050401
○ ○ ○ ○ ○
Example 2 To input ( )1+2
5
2
A(b+
$
cc
f
e
)x
w
J
○ ○ ○ ○ ○
Example 3 To input 1+ x + 1 dx0
1
Ab+4(MATH)6(g)1(∫ dx )
a+(X)+b
ea
fb
e
w
J
1-3-11Inputting and Editing Calculations

8/20/2019 _Casio_fx9860GSD_9860G_E
http://slidepdf.com/reader/full/casiofx9860gsd9860ge 46/595
20050401
○ ○ ○ ○ ○
Example 4 To input 2 ×12
212
2
Ac*4(MATH)1(MAT)1(2×2)
$bcc
ee
!x( )ce
e!x( )cee$bcc
w
u When the calculation does not fit within the display window
Arrows appear at the left, right, top, or bottom edge of the display to let you know when
there is more of the calculation off the screen in the corresponding direction.
When you see an arrow, you can use the cursor keys to scroll the screen contents and
view the part you want.
1-3-12 Inputting and Editing Calculations

8/20/2019 _Casio_fx9860GSD_9860G_E
http://slidepdf.com/reader/full/casiofx9860gsd9860ge 47/595
20050401
u Inserting a Function into an Existing Expression
In the Math input mode, you can make insert a natural input function into an existing
expression. Doing so will cause the value or parenthetical expression to the right of the
cursor to become the argument of the inserted function. Use!D(INS) to insert a
function into an existing expression.
u To insert a function into an existing expression
○ ○ ○ ○ ○
Example To insert the function into the expression 1 + (2 + 3) + 4 so the
parenthetical expression becomes the argument of the function
1. Move the cursor so it is located directly to the left of the part of the expression that
you want to become the argument of the function you will insert.
2. Press!D(INS).
• This changes the cursor to an insert cursor (').
3. Press!x( ) to insert the function.
• This inserts the function and makes the parenthetical expression its argument.
u Function Insert Rules
The following are the basic rules that govern how a value or expressions becomes the
argument of an inserted function.
• If the insert cursor is located immediately to the left of an open parenthesis, everything
from the open parenthesis to the following closing parenthesis will be the argument of the
inserted function.
• If the input cursor is located immediately to the left of a value or fraction, that value or
fraction will be the argument of the inserted function.
1-3-13 Inputting and Editing Calculations
# In the Linear input mode, pressing
!D(INS) will change to the insert mode.
See page 1-3-2 for more information.

8/20/2019 _Casio_fx9860GSD_9860G_E
http://slidepdf.com/reader/full/casiofx9860gsd9860ge 48/595
20050401
u Functions that Support Insertion
The following lists the functions that can be inserted using the procedure under “To insert a
function into an existing expression” (page 1-3-13). It also provides information about how
insertion affects the existing calculation.
1-3-14 Inputting and Editing Calculations
Function Key OperationExpression After
Insertion
Improper Fraction $
Power M
!x( )
Cube Root !((3 )
Power Root !M( x )
e x !I(e x )
10 x !l(10 x )
log(a,b) 4(MATH)2(logab)
Absolute Value 4(MATH)3(Abs)
Linear Differential 4(MATH)4(d / dx )
Quadratic Differential 4(MATH)5(d 2 / dx 2)
Integral4(MATH)6(g)
1(∫ dx )
Original
Expression
Σ Calculation 4(MATH)6(g)
2(Σ( )
uEditing Calculations in the Math Input Mode
The procedures for editing calculations in the Math input mode are basically the same as
those for the Linear input mode. For more information, see “Editing Calculations” (page
1-3-1).
Note however, that the following points are different between the Math input mode and the
Linear input mode.
• Overwrite mode input that is available in the Linear input mode is not supported by the
Math input mode. In the Math input mode, input is always inserted at the current cursorlocation.
• In the Math input mode, pressing theD key always performs a backspace operation.

8/20/2019 _Casio_fx9860GSD_9860G_E
http://slidepdf.com/reader/full/casiofx9860gsd9860ge 49/595
20050401
• Note the following cursor operations you can use while inputting a calculation with natural
display format.
To do this: Press this key:
Move the cursor from the end of the calculation to the beginning eMove the cursor from the beginning of the calculation to the end d
uMath Input Mode Calculation Result Display
Fractions, matrices, and lists produced by Math input mode calculations are displayed in
natural format, just as they appear in your textbook.
Sample Calculation Result Displays
1-3-15 Inputting and Editing Calculations
# Fractions are displayed either as improper
fractions or mixed fractions, depending on the
“Frac Result” setting on the Setup screen. For
details, see “1-7 Using the Setup Screen”.
# Matrices are displayed in natural format, up
to 6 × 6. A matrix that has more than six rows
or columns will be displayed on a MatAns
screen, which is the same screen used in the
Linear input mode.
# Lists are displayed in natural format for up to
20 elements. A list that has more than 20
elements will be displayed on a ListAns
screen, which is the same screen used in the
Linear input mode.
# Arrows appear at the left, right, top, or bottom
edge of the display to let you know when
there is more data off the screen in the
corresponding direction.
You can use the cursor keys to scroll the screen
and view the data you want.
# Pressing2(DEL)1(DEL • L) while a
calculation result is selected will delete both the
result and the calculation that produced it.
# The multiplication sign cannot be omitted
immediately before an improper fraction or
mixed fraction. Be sure to always input a
multiplication sign in this case.
2Example: 2 × —
5c*$ccf
# AM,x, or!)( x –1) key operation cannot
be followed immediately by anotherM,x, or
!)( x –1) key operation. In this case, use
parentheses to keep the key operationsseparate.
Example: (32)–1
(dx)!)( x –1)
20060601

8/20/2019 _Casio_fx9860GSD_9860G_E
http://slidepdf.com/reader/full/casiofx9860gsd9860ge 50/595
20050401
1-3-16 Inputting and Editing Calculations
uMath Input Mode Input Restrictions
Note the following restrictions that apply during input of the Math input mode.
• Certain types of expressions can cause the vertical width of a calculation formula to begreater than one display line. The maximum allowable vertical width of a calculation
formula is about two display screens (120 dots). You cannot input any expression that
exceeds this limitation.
20060601

8/20/2019 _Casio_fx9860GSD_9860G_E
http://slidepdf.com/reader/full/casiofx9860gsd9860ge 51/595

8/20/2019 _Casio_fx9860GSD_9860G_E
http://slidepdf.com/reader/full/casiofx9860gsd9860ge 52/595
20050401
uOption menu during numeric data input in the STAT, TABLE, RECUR, EQUAand S • SHT modes
• {LIST} / {CPLX} / {CALC} / {HYP} / {PROB} / {NUM} / {ANGL} / {ESYM} / {FMEM} / {LOGIC}
uuuuuOption menu during formula input in the GRAPH, DYNA, TABLE, RECURand EQUA modes
• {List} / {CALC} / {HYP} / {PROB} / {NUM} / {FMEM} / {LOGIC}
The following shows the function menus that appear under other conditions.
uOption menu when a number table value is displayed in the TABLE orRECUR mode
• {LMEM} … {list memory menu}
• {° ’ ”} / {ENG} / {ENG}
The meanings of the option menu items are described in the sections that cover each mode.
1-4-2 Option (OPTN) Menu

8/20/2019 _Casio_fx9860GSD_9860G_E
http://slidepdf.com/reader/full/casiofx9860gsd9860ge 53/595
20050401
1-5 Variable Data (VARS) Menu
To recall variable data, pressJ to display the variable data menu.
{V-WIN} / {FACT} / {STAT} / {GRPH} / {DYNA} /
{TABL} / {RECR} / {EQUA*1} / {TVM*1}
See “8-7 PRGM Mode Command List” for details on the variable data (VARS) menu.
u V-WIN — Recalling V-Window values
• {X} / {Y} / {T,θ }... { x -axis menu}/{ y-axis menu}/{T, θ menu}
• {R-X} / {R-Y} / {R-T,θ }
... { x -axis menu}/{ y-axis menu}/{T,θ menu} for right side of Dual Graph• {min} / {max} / {scal} / {dot} / {ptch}
... {minimum value}/{maximum value}/{scale}/{dot value*2}/{pitch}
u FACT — Recalling zoom factors
• {Xfact} / {Yfact}
... { x -axis factor}/{ y-axis factor}
1-5-1Variable Data (VARS) Menu
*1The EQUA and TVM items appear only when
you access the variable data menu from the
RUN
• MAT, PRGM or e
• ACT mode.
# The variable data menu does not appear ifyou pressJ while binary, octal, decimal, or
hexadecimal is set as the default number
system.
*2The dot value indicates the display range (Xmax
value – Xmin value) divided by the screen dot
pitch (126).
The dot value is normally calculated automati-cally from the minimum and maximum values.
Changing the dot value causes the maximum to
be calculated automatically.

8/20/2019 _Casio_fx9860GSD_9860G_E
http://slidepdf.com/reader/full/casiofx9860gsd9860ge 54/595
20050401
u STAT — Recalling statistical data
• {X} … {single-variable, paired-variable x -data}
• { n} / { o o o o o } / {Σ x} / {Σ x2} / { xσ n} / { xσ n–1} / {minX} / {maxX}…{number of data}/{mean}/{sum}/{sum of squares}/{population standard
deviation}/{sample standard deviation}/{minimum value}/{maximum value}
• {Y} ... {paired-variable y-data}
• { p p p p p } / {Σ
y} / {Σ
y2} / {Σ xy} / {
yσ n} / {
yσ n–1} / {minY} / {maxY}
…{mean}/{sum}/{sum of squares}/{sum of products of x -data and y-data}/
{population standard deviation}/{sample standard deviation}/{minimum value}/
{maximum value}
• {GRPH} ... {graph data menu}
• { a} / { b} / { c} / { d } / {e}
... {regression coefficient and polynomial coefficients}
• { r} / { r2} ... {correlation coefficient}/{coefficient of determination}
• {MSe} ... {mean square error}
• {Q1} / {Q3}
... {first quartile}/{third quartile}
• {Med} / {Mod}
... {median}/{mode} of input data
• {Strt} / {Pitch}
... histogram {start division}/{pitch}
• {PTS} ... {summary point data menu}
• { x1} / { y1} / { x2} / { y2} / { x3} / { y3} ... {coordinates of summary points}
1-5-2 Variable Data (VARS) Menu

8/20/2019 _Casio_fx9860GSD_9860G_E
http://slidepdf.com/reader/full/casiofx9860gsd9860ge 55/595
20050401
u GRPH — Recalling Graph Functions
• {Y} / { r} ... {rectangular coordinate or inequality function}/{polar coordinate function}
• {Xt} / {Yt}... parametric graph function {Xt}/{Yt}
• {X} ... {X=constant graph function}
(Press these keys before inputting a value to specify a storage memory.)
u DYNA — Recalling Dynamic Graph Set Up Data
• {Strt} / {End} / {Pitch}
... {coefficient range start value}/{coefficient range end value}/{coefficient value
increment}
u TABL — Recalling Table Set Up and Content Data
• {Strt} / {End} / {Pitch}
... {table range start value}/{table range end value}/{table value increment}
• {Reslt*1}
... {matrix of table contents}
1-5-3 Variable Data (VARS) Menu
*1 The Reslt item appears only when the TABL
menu is displayed in the RUN
• MAT, PRGM or
e
• ACT mode.

8/20/2019 _Casio_fx9860GSD_9860G_E
http://slidepdf.com/reader/full/casiofx9860gsd9860ge 56/595
20050401
u RECR — Recalling Recursion Formula*1, Table Range, and Table Content Data
• {FORM} ... {recursion formula data menu}
• { a n} / { a n+1} / { a n+2} / { b n} / { b n+1} / { b n+2} / { c n} / { c n+1} / { c n+2}
... {an}/{an+1}/{an+2}/{bn}/{bn+1}/{bn+2}/{cn}/{cn+1}/{cn+2} expressions
• {RANG} ... {table range data menu}
• {Strt} / {End}
... table range {start value}/{end value}
• { a0} / { a1} / { a2} / { b0} / { b1} / { b2} / { c0} / { c1} / { c2}
... {a0}/{a1}/{a2}/{b0}/{b1}/{b2}/{c0}/{c1}/{c2} value
• { a nSt} / { b nSt} / { c nSt}
... origin of {an }/{bn}/{cn} recursion formula convergence/divergence graph (WEB
graph)
• {Reslt*2} ... {matrix of table contents*3}
u EQUA — Recalling Equation Coefficients and Solutions*4 *5
• {S-Rlt}/{S-Cof}
... matrix of {solutions}/{coefficients} for linear equations with two through six
unknowns*6
• {P-Rlt}/{P-Cof}
... matrix of {solution}/{coefficients} for a quadratic or cubic equation
u TVM — Recalling Financial Calculation Data
• { n} / { I %} / { PV } / { PMT } / { FV }... {payment periods (installments)}/{interest (%)}/{principal}/{payment amount}/
{account balance or principal plus interest following the final installment}
• { P / Y } / {C / Y }... {number of installment periods per year}/{number of compounding periods
per year}
1-5-4 Variable Data (VARS) Menu
*1 An error occurs when there is no function or
recursion formula numeric table in memory.
*2 “Reslt” is available only in the RUN
• MAT,
PRGM and e
• ACT modes.
*3 Table contents are stored automatically in
Matrix Answer Memory (MatAns).*4 Coefficients and solutions are stored
automatically in Matrix Answer Memory
(MatAns).
*5 The following conditions cause an error.
- When there are no coefficients input for the
equation
- When there are no solutions obtained for the
equation
*6 Coefficient and solution memory data for a
linear equation cannot be recalled at the same
time.

8/20/2019 _Casio_fx9860GSD_9860G_E
http://slidepdf.com/reader/full/casiofx9860gsd9860ge 57/595
20050401
1-6 Program (PRGM) Menu
To display the program (PRGM) menu, first enter the RUN • MAT or PRGM mode from the
Main Menu and then press!J(PRGM). The following are the selections available in theprogram (PRGM) menu.
• {COM} ...... {program command menu}
• {CTL} ........ {program control command menu}
• {JUMP} .... {jump command menu}
• {? } ............ {input prompt}
• {^} ........... {output command}
• {CLR} ....... {clear command menu}
• {DISP } ...... {display command menu}
• {REL} ....... {conditional jump relational operator menu}
• {I/O} .......... {I/O control/transfer command menu}
• {:} ............. {multistatement connector}
The following function key menu appears if you press!J(PRGM) in the RUN • MAT
mode or the PRGM mode while binary, octal, decimal, or hexadecimal is set as the default
number system.
• {Prog} ...... {program recall}
• {JUMP} / {?} / {^} / {REL} / {: }
The functions assigned to the function keys are the same as those in the Comp mode.
For details on the commands that are available in the various menus you can access from
the program menu, see “8. Programming”.
1-6-1Program (PRGM) Menu

8/20/2019 _Casio_fx9860GSD_9860G_E
http://slidepdf.com/reader/full/casiofx9860gsd9860ge 58/595
20050401
1-7 Using the Setup Screen
The mode’s Setup screen shows the current status of mode settings and lets you make any
changes you want. The following procedure shows how to change a setup.
u To change a mode setup
1. Select the icon you want and pressw to enter a mode and display its initial screen.
Here we will enter the RUN • MAT mode.
2. Press!m(SET UP) to display the mode’s
Setup screen.
• This Setup screen is just one possible example.Actual Setup screen contents will differ
according to the mode you are in and that mode’s
current settings.
3. Use thef and c cursor keys to move the highlighting to the item whose setting you
want to change.
4. Press the function key (1 to6) that is marked with the setting you want to make.
5. After you are finished making any changes you want, pressJ to exit the Setup
screen.
k Setup Screen Function Key Menus
This section details the settings you can make using the function keys in the Setup screen.
indicates default setting.
u Input Mode
• {Math}/{Line}... {Math}/{Linear} input mode
1-7-1Using the Setup Screen
.
.
.

8/20/2019 _Casio_fx9860GSD_9860G_E
http://slidepdf.com/reader/full/casiofx9860gsd9860ge 59/595
20050401
uMode (calculation/binary, octal, decimal, hexadecimal mode)
• {Comp} ... {arithmetic calculation mode}
• {Dec} / {Hex} / {Bin} / {Oct}... {decimal}/{hexadecimal}/{binary}/{octal}
u Frac Result (fraction result display format)
• {d/c}/{ab/c}... {improper}/{mixed} fraction
u Func Type (graph function type)
Pressing one of the following function keys also switches the function of thev key.
• {Y=} / {r=} / {Parm} / {X=c}
... {rectangular coordinate}/{polar coordinate}/{parametric coordinate}/
{X = constant} graph
• {Y>} / {Y<} / {Yt} / {Ys}
... { y> f ( x )}/{ y< f ( x )}/{ y≥ f ( x )}/{ y≤ f ( x )} inequality graph
uDraw Type (graph drawing method)
• {Con} / {Plot}
... {connected points}/{unconnected points}
uDerivative (derivative value display)
• {On} / {Off}... {display on}/{display off} while Graph-to-Table, Table & Graph, and Trace are
being used
uAngle (default angle unit)
• {Deg} / {Rad} / {Gra}
... {degrees}/{radians}/{grads}
uComplex Mode
• {Real} ... {calculation in real number range only}• { a + bi} / { r
∠θ }
... {rectangular format}/{polar format} display of a complex calculation
uCoord (graph pointer coordinate display)
• {On} / {Off}
... {display on}/{display off}
uGrid (graph gridline display)
• {On} / {Off}
... {display on}/{display off}
1-7-2 Using the Setup Screen

8/20/2019 _Casio_fx9860GSD_9860G_E
http://slidepdf.com/reader/full/casiofx9860gsd9860ge 60/595
20050401
uAxes (graph axis display)
• {On} / {Off}
... {display on}/{display off}
u Label (graph axis label display)
• {On} / {Off}
... {display on}/{display off}
uDisplay (display format)
• {Fix} / {Sci} / {Norm} / {Eng}
... {fixed number of decimal places specification}/{number of significant digits
specification}/{normal display setting}/{engineering mode}
uStat Wind (statistical graph V-Window setting method)
• {Auto} / {Man}
... {automatic}/{manual}
uResid List (residual calculation)
• {None} / {LIST}
... {no calculation}/{list specification for the calculated residual data}
u List File (list file display settings)
• {FILE} ... {settings of list file on the display}
u Sub Name (list naming)
• {On} / {Off}
... {display on}/{display off}
uGraph Func (function display during graph drawing and trace)
• {On} / {Off}
... {display on}/{display off}
uDual Screen (dual screen mode status)
• {G+G} / {GtoT} / {Off}
... {graphing on both sides of dual screen}/{graph on one side and numeric table
on the other side of dual screen}/{dual screen off}
uSimul Graph (simultaneous graphing mode)
• {On} / {Off}
... {simultaneous graphing on (all graphs drawn simultaneously)}/{simultaneousgraphing off (graphs drawn in area numeric sequence)}
1-7-3 Using the Setup Screen

8/20/2019 _Casio_fx9860GSD_9860G_E
http://slidepdf.com/reader/full/casiofx9860gsd9860ge 61/595
20050401
uBackground (graph display background)
• {None} / {PICT}
... {no background}/{graph background picture specification}
u Sketch Line (overlaid line type)
• { } / { }{ } / { }
... {normal}/{thick}/{broken}/{dot}
uDynamic Type (dynamic graph type)
• {Cnt} / {Stop}
... {non-stop (continuous)}/{automatic stop after 10 draws}
u Locus (dynamic graph locus mode)
• {On} / {Off}
... {locus drawn}/{locus not drawn}
uY=Draw Speed (dynamic graph draw speed)
• {Norm} / {High}
... {normal}/{high-speed}
uVariable (table generation and graph draw settings)
• {RANG} / {LIST}
... {use table range}/{use list data}
uΣ Display (Σ value display in recursion table)
• {On} / {Off}
... {display on}/{display off}
uSlope (display of derivative at current pointer location in conic sectiongraph)
• {On} / {Off}
... {display on}/{display off}
uPayment (payment period setting)
• {BGN} / {END}
... {beginning}/{end} setting of payment period
1-7-4 Using the Setup Screen

8/20/2019 _Casio_fx9860GSD_9860G_E
http://slidepdf.com/reader/full/casiofx9860gsd9860ge 62/595
20050401
*1The 365-day year must be used for date
calculations in the TVM mode.
Otherwise, an error occurs.
*2Selecting “Form” (formula) causes a formula in
the cell to be displayed as a formula. The
“Form” does not affect any non-formula data in
the cell.
*3Specifies the direction the cell cursor moves when
you press thew key to register cell input, when
the Sequence command generates a number
table, and when you recall data from List memory.
uDate Mode (number of days per year setting)
• {365} / {360}
... interest calculations using {365}*1
/{360} days per year
uAuto Calc (spreadsheet auto calc)
• {On} / {Off}
... {execute}/{not execute} the formulas automatically
uShow Cell (spreadsheet cell display mode)
• {Form} / {Val} ... {formula}*2 /{value}
uMove (spreadsheet cell cursor direction)*3
• {Low} / {Right} ... {move down}/{move right}
1-7-5 Using the Setup Screen

8/20/2019 _Casio_fx9860GSD_9860G_E
http://slidepdf.com/reader/full/casiofx9860gsd9860ge 63/595
20050401
1-8-1Using Screen Capture
1-8 Using Screen Capture
Any time while operating the calculator, you can capture an image of the current screen and
save it in capture memory.
u To capture a screen image
1. Operate the calculator and display the screen you want to capture.
2. Press!h(CAPTURE).
• This displays a memory area selection dialog box.
3. Input a value from 1 to 20 and then pressw.
• This will capture the screen image and save it in capture memory area named“Capt n” (n = the value you input).
• You cannot capture the screen image of a message indicating that an operation or data
communication is in progress.
• A memory error will occur if there is not enough room in main memory to store the screen
capture.
u To recall a screen image from capture memory
1. In the RUN • MAT mode (Linear input mode), pressK6(g)6(g)5(CAPT)
1(RCL).
2. Enter a capture memory number in the range of 1 to 20, and then pressw.
• You can also use the RclCapt command in a program to recall a screen image from
capture memory.

8/20/2019 _Casio_fx9860GSD_9860G_E
http://slidepdf.com/reader/full/casiofx9860gsd9860ge 64/595
20050401
1-9 When you keep having problems…
If you keep having problems when you are trying to perform operations, try the following
before assuming that there is something wrong with the calculator.
kkkkkGetting the Calculator Back to its Original Mode Settings
1. From the Main Menu, enter the SYSTEM mode.
2. Press5(RSET).
3. Press1(STUP), and then press1(Yes).
4. PressJm to return to the Main Menu.
Now enter the correct mode and perform your calculation again, monitoring the results onthe display.
kkkkk In Case of Hang Up
• Should the unit hang up and stop responding to input from the keyboard, press the P button
on the back of the calculator to reset the calculator to its initial defaults (see page α -5-1).
Note, however, that this may clear all the data in calculator memory.
1-9-1When you keep having problems…

8/20/2019 _Casio_fx9860GSD_9860G_E
http://slidepdf.com/reader/full/casiofx9860gsd9860ge 65/595
20050401
kkkkk Low Battery Message
If either of the following messages appears on the display, immediately turn off the calculator
and replace main batteries as instructed.
If you continue using the calculator without replacing main batteries, power will automatically
turn off to protect memory contents. Once this happens, you will not be able to turn power
back on, and there is the danger that memory contents will be corrupted or lost entirely.
# You will not be able to perform data
communications operations after the low
battery message appears.
1-9-2 When you keep having problems…

8/20/2019 _Casio_fx9860GSD_9860G_E
http://slidepdf.com/reader/full/casiofx9860gsd9860ge 66/595
20050401
Manual Calculations2-1 Basic Calculations
2-2 Special Functions2-3 Specifying the Angle Unit and Display Format
2-4 Function Calculations
2-5 Numerical Calculations
2-6 Complex Number Calculations
2-7 Binary, Octal, Decimal, and Hexadecimal Calculations
with Integers
2-8 Matrix Calculations
Chapter 2
Linear/Math input mode (page 1-3-8)
• Unless specifically noted otherwise, all of the operations in this chapter are
explained using the Linear input mode.
• When necessary, the input mode is indicated by the following symbols.
<Math> .... Math input mode
<Line> ..... Linear input mode

8/20/2019 _Casio_fx9860GSD_9860G_E
http://slidepdf.com/reader/full/casiofx9860gsd9860ge 67/595
20050401
2-1-1Basic Calculations
2-1 Basic Calculations
kkkkkArithmetic Calculations
• Enter arithmetic calculations as they are written, from left to right.
• Use the- key to input the minus sign before a negative value.
• Calculations are performed internally with a 15-digit mantissa. The result is rounded to a
10-digit mantissa before it is displayed.
• For mixed arithmetic calculations, multiplication and division are given priority over
addition and subtraction.
Example Operation23 + 4.5 – 53 = –25.5 23+4.5-53w
56 × (–12) ÷ (–2.5) = 268.8 56*-12/-2.5w
(2 + 3) × 102 = 500 (2+3)*1E2w*1
1 + 2 – 3 × 4 ÷ 5 + 6 = 6.6 1+2-3*4/5+6w
100 – (2 + 3) × 4 = 80 100-(2+3)*4w
2 + 3 × (4 + 5) = 29 2+3*(4+5w*2
(7 – 2) × (8 + 5) = 65 (7-2)(8+5)w*3
<Line>6= 0.3
3
6 /(4*5)w*44 × 5 10
<Math>
$6c4*5w
(1 + 2i) + (2 + 3i) = 3 + 5i (b+c!a(i))+(c+
d!a(i))w
(2 + i) × (2 – i) = 5 (c+!a(i))*(c-!a(i)
)w
*1(2+3)E2 does not produce the correct
result. Be sure to enter this calculation as shown.
*2Final closed parentheses (immediately before
operation of thew key) may be omitted, no
matter how many are required.
*3A multiplication sign immediately before an open
parenthesis may be omitted.
*4This is identical to 6/ 4/ 5w.

8/20/2019 _Casio_fx9860GSD_9860G_E
http://slidepdf.com/reader/full/casiofx9860gsd9860ge 68/595
20050401
2-1-2
Basic Calculations
*1Displayed values are rounded off to the place
you specify.
kkkkkNumber of Decimal Places, Number of Significant Digits, NormalDisplay Range [SET UP]- [Display] -[Fix] / [Sci] / [Norm]
• Even after you specify the number of decimal places or the number of significant digits,internal calculations are still performed using a 15-digit mantissa, and displayed values
are stored with a 10-digit mantissa. Use Rnd of the Numeric Calculation Menu (NUM)
(page 2-4-1) to round the displayed value off to the number of decimal place and
significant digit settings.
• Number of decimal place (Fix) and significant digit (Sci) settings normally remain in effect
until you change them or until you change the normal display range (Norm) setting.
○ ○ ○ ○ ○
Example 100 ÷ 6 = 16.66666666...
Condition Operation Display
100/6w 16.66666667
4 decimal places !m(SET UP)f (orc 12 times)*1
1(Fix)ewJw 16.6667
5 significant digits !m(SET UP)f (orc 12 times)*1
2(Sci)fwJw 1.6667E+01
Cancels specification !m(SET UP)f (orc 12 times)3(Norm)Jw 16.66666667

8/20/2019 _Casio_fx9860GSD_9860G_E
http://slidepdf.com/reader/full/casiofx9860gsd9860ge 69/595
2006100120070101
Example 200 ÷ 7 × 14 = 400
Condition Operation Display
200/7*14w 400
3 decimal places !m(SET UP)f (orc 12 times)
1(Fix)dwJw 400.000
Calculation continues using
display capacity of 10 digits
200/7w
*
14w
28.571
Ans × I
400.000
• If the same calculation is performed using the specified number of digits:
200/7w 28.571
The value stored internally is
rounded off to the number of
decimal places specified on
the Setup screen.
K6(g)4(NUM)4(Rnd)w
*
14w
28.571
Ans × I
399.994
200/7w 28.571
You can also specify the
number of decimal places for
rounding of internal values
for a specific calculation.*1
(Example: To specifyrounding to two decimal
places)
6(RndFi)!-(Ans),2)
w
*
14w
RndFix(Ans,2)
28.570
Ans × I
399.980
k Calculation Priority Sequence
This calculator employs true algebraic logic to calculate the parts of a formula in the following
order:
1 Type A functions
Coordinate transformation Pol ( x, y), Rec (r, θ ) Derivatives, second derivatives, integrations, Σ calculations
d / dx, d 2 / dx2, ∫ dx, Σ, Mat, Solve, FMin, FMax, List→Mat, Seq, Min, Max, Median, Mean,
Augment, Mat→List, P(, Q(, R(, t(, List, RndFix, log ab
Composite functions*2 fn, Yn, rn, Xtn, Ytn, Xn
2-1-3
Basic Calculations
*1 To turn off rounding, specify 10 for the
significant number of digits.
*2 You can combine the contents of multiple
function memory (fn) locations or graphmemory (Yn, rn, Xtn, Ytn, Xn) locations into
composite functions. Specifying fn1(fn2), for
example, results in the composite function
fn1°fn2 (see page 5-3-3).
A composite function can consist of up to five
functions.
# You cannot use a differential, quadratic
differential, integration, Σ, maximum/minimumvalue, Solve, RndFix or log ab calculation
expression inside of a RndFix calculation term.

8/20/2019 _Casio_fx9860GSD_9860G_E
http://slidepdf.com/reader/full/casiofx9860gsd9860ge 70/595
2006100120070101
2-1-4
Basic Calculations
2 Type B functions
With these functions, the value is entered and then the function key is pressed.
x2, x–1, x!, ° ’ ”, ENG symbols, angle unit °, r, g
3 Power/root ^( x y
), x
'4 Fractions a b / c
5 Abbreviated multiplication format in front of π, memory name, or variable name.
2π, 5A, etc.
6 Type C functions
With these functions, the function key is pressed and then the value is entered.
', 3', log, In, e x, 10 x, sin, cos, tan, sin–1, cos–1, tan–1, sinh, cosh, tanh, sinh–1, cosh–1,
tanh–1, (–), d, h, b, o, Neg, Not, Det, Trn, Dim, Identity, Sum, Prod, Cuml, Percent, AList,
Abs, Int, Frac, Intg, Arg, Conjg, ReP, ImP
7 Abbreviated multiplication format in front of Type A functions, Type C functions, and
parenthesis.
2'3, A log2, etc.
8 Permutation, combination nPr, nCr, ∠
9 ×, ÷
0 +, –
! Relational operators =, ≠, >, <, ≥, ≤
@ And (logical operator), and (bitwise operator)
# Or (logical operator), or, xor, xnor (bitwise operator)
Example 2 + 3 × (log sin2π2 + 6.8) = 22.07101691 (angle unit = Rad)1
2
3
4
5
6
1
2
3
4
5
6
# When functions with the same priority are
used in series, execution is performed fromright to left.
e xIn 120 → e x{In( 120)}
Otherwise, execution is from left to right.
# Compound functions are executed from right to
left.# Anything contained within parentheses receives
highest priority.

8/20/2019 _Casio_fx9860GSD_9860G_E
http://slidepdf.com/reader/full/casiofx9860gsd9860ge 71/595
2006100120070101
2-1-5
Basic Calculations
# Most of the calculator’s keys are inoperativewhile an error message is displayed.
PressJ to clear the error and display the
error position (see page 1-3-5).
# See the “Error Message Table” on page α-1-1for information on other errors.
k Multiplication Operations without a Multiplication Sign
You can omit the multiplication sign (×) in any of the following operations.
• Before Type A functions (1 on page 2-1-3) and Type C functions (6 on page 2-1-4),
except for negative signs
Example 2sin30, 10log1.2, 2'3, 2Pol(5, 12), etc.
• Before constants, variable names, memory names
Example 2π, 2AB, 3Ans, 3Y1, etc.
• Before an open parenthesis
Example 3(5 + 6), (A + 1)(B – 1), etc.
k Overflow and Errors
Exceeding a specified input or calculation range, or attempting an illegal input causes an
error message to appear on the display. Further operation of the calculator is impossible
while an error message is displayed. The following events cause an error message to appear
on the display.• When any result, whether intermediate or final, or any value in memory exceeds
±9.999999999 × 1099 (Ma ERROR).
• When an attempt is made to perform a function calculation that exceeds the input range
(Ma ERROR).
• When an illegal operation is attempted during statistical calculations (Ma ERROR). For
example, attempting to obtain 1VAR without data input.
• When an improper data type is specified for the argument of a function calculation
(Ma ERROR).
• When the capacity of the numeric value stack or command stack is exceeded (StackERROR). For example, entering 25 successive( followed by 2+ 3* 4w.
• When an attempt is made to perform a calculation using an illegal formula (Syntax
ERROR). For example, 5** 3w.

8/20/2019 _Casio_fx9860GSD_9860G_E
http://slidepdf.com/reader/full/casiofx9860gsd9860ge 72/595
20050401
• When you try to perform a calculation that causes memory capacity to be exceeded
(Memory ERROR).
• When you use a command that requires an argument, without providing a valid argument
(Argument ERROR).• When an attempt is made to use an illegal dimension during matrix calculations (Dimension
ERROR).
• When you are in the real mode and an attempt is made to perform a calculation that
produces a complex number solution. Note that “Real” is selected for the Complex Mode
setting on the Setup screen (Non-Real ERROR).
kMemory Capacity
In the Linear input mode, each time you press a key, either one byte or two bytes is used.
Some of the functions that require one byte are:b,c,d, sin, cos, tan, log, In, , and π.
Some of the functions that take up two bytes are d / dx (, Mat, Xmin, If, For, Return, DrawGraph,
SortA(, PxIOn, Sum, and an+1.
For details about the number of bytes required for each function in the Math input mode, see
page 1-3-9.
2-1-6 Basic Calculations
# As you input numeric values or commands,
they appear flush left on the display.Calculation results, on the other hand, are
displayed flush right.
# The allowable range for both input and output
values is 15 digits for the mantissa and twodigits for the exponent. Internal calculations are
also performed using a 15-digit mantissa and
two-digit exponent.

8/20/2019 _Casio_fx9860GSD_9860G_E
http://slidepdf.com/reader/full/casiofx9860gsd9860ge 73/595
20050401
2-2 Special Functions
kkkkkCalculations Using Variables
Example Operation Display
193.2aav(A)w 193.2
193.2 ÷ 23 = 8.4 av(A)/23w 8.4
193.2 ÷ 28 = 6.9 av(A)/28w 6.9
kkkkkMemory
uVariables (Alpha Memory)
This calculator comes with 28 variables as standard. You can use variables to store values
you want to use inside of calculations. Variables are identified by single-letter names, whichare made up of the 26 letters of the alphabet, plus r and θ . The maximum size of values that
you can assign to variables is 15 digits for the mantissa and 2 digits for the exponent.
u To assign a value to a variable
[value]a [variable name]w
○ ○ ○ ○ ○
Example To assign 123 to variable A
Abcdaav(A)w
○ ○ ○ ○ ○
Example To add 456 to variable A and store the result in variable B
Aav(A)+efgaa
l(B)w
2-2-1Special Functions
# Variable contents are retained even when
you turn power off.

8/20/2019 _Casio_fx9860GSD_9860G_E
http://slidepdf.com/reader/full/casiofx9860gsd9860ge 74/595
20050401
u To display the contents of a variable
○ ○ ○ ○ ○
Example To display the contents of variable A
Aav(A)w
u To clear a variable
○ ○ ○ ○ ○
Example To clear variable A
Aaaav(A)w
u To assign the same value to more than one variable
[value]a [first variable name*1]a3(~) [last variable name*1]w
○ ○ ○ ○ ○
Example To assign a value of 10 to variables A through F
Abaaav(A)
a3(~)at(F)w
uFunction Memory [OPTN]-[FMEM]
Function memory (f1~f20) is convenient for temporary storage of often-used expressions. For
longer term storage, we recommend that you use the GRAPH mode for expressions and the
PRGM mode for programs.
• {STO} / {RCL} / {fn} / {SEE} ... {function store}/{function recall}/{function area specification
as a variable name inside an expression}/{function list}
2-2-2 Special Functions
*1 You cannot use “r ” or “θ ” as a variable name.

8/20/2019 _Casio_fx9860GSD_9860G_E
http://slidepdf.com/reader/full/casiofx9860gsd9860ge 75/595
20050401
u To store a function
○ ○ ○ ○ ○
Example To store the function (A+B) (A–B) as function memory number 1
(av(A)+al(B))
(av(A)-al(B))
K6(g)6(g)3(FMEM)
1(STO)bw
JJJ
u To recall a function
○ ○ ○ ○ ○
Example To recall the contents of function memory number 1
K6(g)6(g)3(FMEM)
2(RCL)bw
u To recall a function as a variable
daav(A)w
baal(B)w
K6(g)6(g)3(FMEM)3(fn)
b+cw
u To display a list of available functions
K6(g)6(g)3(FMEM)4(SEE)
2-2-3 Special Functions
# If the function memory number to which you
store a function already contains a function, the
previous function is replaced with the new one.
# The recalled function appears at the current
location of the cursor on the display.

8/20/2019 _Casio_fx9860GSD_9860G_E
http://slidepdf.com/reader/full/casiofx9860gsd9860ge 76/595
20050401
2-2-4 Special Functions
u To delete a function
○ ○ ○ ○ ○
Example To delete the contents of function memory number 1
AK6(g)6(g)3(FMEM)
1(STO)bw
• Executing the store operation while the display is blank deletes the function in the
function memory you specify.
u To use stored functions ○ ○ ○ ○ ○
Example To store x3 + 1, x2 + x into function memory, and then graph:
y = x3 + x2 + x + 1
Use the following V-Window settings.
Xmin = – 4, Xmax = 4, Xscale = 1
Ymin = –10, Ymax = 10, Yscale = 1
!m(SET UP)ccc1(Y=)J
AvMd+bK6(g)6(g)3(FMEM)1(STO)bw(stores ( x 3 + 1))
JAvx+v1(STO)cw(stores ( x 2 + x ))
JA!4(SKTCH)1(Cls)w
5(GRPH)1(Y=)
K6(g)6(g)3(FMEM)3(fn)b+
3(fn)cw
• For full details about graphing, see “5. Graphing”.
# You can also usea to store a function infunction memory in a program.
In this case, you must enclose the function
inside of double quotation marks.

8/20/2019 _Casio_fx9860GSD_9860G_E
http://slidepdf.com/reader/full/casiofx9860gsd9860ge 77/595
2006100120070101
k Answer Function
The Answer Function automatically stores the last result you calculated by pressing
w (unless thew key operation results in an error). The result is stored in the answermemory.
u To use the contents of the answer memory in a calculation
Example 123 + 456 = 579
789 – 579 = 210
Abcd+efgw
hij-!-(Ans)w
In the Math input mode, the answer memory is refreshed with each calculation. Note,
however, that the answer memory content recall operation is different from that used in
the Linear input mode. For details, see “History Function” (page 2-2-6).
k Performing Continuous Calculations
Answer memory also lets you use the result of one calculation as one of the arguments inthe next calculation.
Example 1 ÷ 3 =
1 ÷ 3 × 3 =
Ab/dw
(Continuing)*dw
Continuous calculations can also be used with Type B functions ( x2
, x–1
, x!, page 2-1-4),+, –, ^( x y), x', ° ’ ”, etc.
2-2-5
Special Functions
# The largest value that the answer memory
can hold is 15 digits for the mantissa and 2
digits for the exponent.
# Only numeric values and calculation resultscan be stored in answer memory.
# Answer memory contents are not cleared when
you press theA key or when you switch power
off.
# When “Linear” is selected as the Input Mode,answer memory contents are not changed by an
operation that assigns values to Alpha memory
(such as:faav(A)w).

8/20/2019 _Casio_fx9860GSD_9860G_E
http://slidepdf.com/reader/full/casiofx9860gsd9860ge 78/595
20050401
2-2-6 Special Functions
kkkkkHistory Function
The history function maintains a history of calculation expressions and results in the Math
input mode. Up to 30 sets of calculation expressions and results are maintained.
b+cw
*cw
You can also edit the calculation expressions that are maintained by the history function
and recalculate. This will recalculate all of the expressions starting from the edited
expression.
○ ○ ○ ○ ○
Example To change “1+2” to “1+3” and recalculate
Perform the following operation following the sample shown above.
ffffdDdw
# The value stored in the answer memory is
always dependent on the result produced by
the last calculation performed. If history
contents include operations that use the
answer memory, editing a calculation may
affect the answer memory value used insubsequent calculations.
- If you have a series of calculations that use the
answer memory to include the result of the
previous calculation in the next calculation,
editing a calculation will affect the results of all
the other calculations that come after it.
- When the first calculation of the history includesthe answer memory contents, the answer
memory value is “0” because there is no
calculation before the first one in history.
20050901

8/20/2019 _Casio_fx9860GSD_9860G_E
http://slidepdf.com/reader/full/casiofx9860gsd9860ge 79/595
20050401
k Stacks
The unit employs memory blocks, called stacks , for storage of low priority values and
commands. There is a 10-level numeric value stack , a 26-level command stack , and a 10-level program subroutine stack . An error occurs if you perform a calculation so complex that
it exceeds the capacity of available numeric value stack or command stack space, or if
execution of a program subroutine exceeds the capacity of the subroutine stack.
○ ○ ○ ○ ○
Example
2-2-7 Special Functions
1
2
3
4
5
b
c
d
e
f
g
h
2
3
4
5
4
×
(
(
+
×
(
+ .
.
.
. . .
Numeric Value Stack Command Stack
# Calculations are performed according to thepriority sequence. Once a calculation is
executed, it is cleared from the stack.
# Storing a complex number takes up two numericvalue stack levels.
# Storing a two-byte function takes up two
command stack levels.
20050901

8/20/2019 _Casio_fx9860GSD_9860G_E
http://slidepdf.com/reader/full/casiofx9860gsd9860ge 80/595
20050401
kUsing Multistatements
Multistatements are formed by connecting a number of individual statements for sequential
execution. You can use multistatements in manual calculations and in programmedcalculations. There are two different ways that you can use to connect statements to form
multistatements.
• Colon (:)
Statements that are connected with colons are executed from left to right, without stopping.
• Display Result Command (^)
When execution reaches the end of a statement followed by a display result command,
execution stops and the result up to that point appears on the display. You can resume
execution by pressing thew key. ○ ○ ○ ○ ○
Example 6.9 × 123 = 848.7
123 ÷ 3.2 = 38.4375
Abcdaav(A)
!J(PRGM)6(g)5(:)g.j
*av(A)!J(PRGM)5(^)
av(A)/d.cw
w
2-2-8 Special Functions
# You cannot construct a multistatement in
which one statement directly uses the result of
the previous statement.Example: 123 × 456: × 5
Invalid
20050901

8/20/2019 _Casio_fx9860GSD_9860G_E
http://slidepdf.com/reader/full/casiofx9860gsd9860ge 81/595
20050401
2-3 Specifying the Angle Unit and Display
Format
Before performing a calculation for the first time, you should use the Setup screen to specify
the angle unit and display format.
kkkkk Setting the Angle Unit [SET UP]- [Angle]
1. On the Setup screen, highlight “Angle”.
2. Press the function key for the angle unit you want to specify, then pressJ.
• {Deg} / {Rad} / {Gra} ... {degrees}/{radians}/{grads}
• The relationship between degrees, grads, and radians is shown below.
360° = 2π radians = 400 grads
90° = π /2 radians = 100 grads
kkkkk Setting the Display Format [SET UP]- [Display]
1. On the Setup screen, highlight “Display”.
2. Press the function key for the item you want to set, then pressJ.
• {Fix} / {Sci} / {Norm} / {Eng} ... {fixed number of decimal places specification}/ {number of significant digits specification}/{normal display}/{Engineering mode}
u To specify the number of decimal places (Fix)
○ ○ ○ ○ ○
Example To specify two decimal places
1(Fix)cw
Press the number key that corresponds to the
number of decimal places you want to specify
( n = 0 to 9).
2-3-1Specifying the Angle Unit and Display Format
# Displayed values are rounded off to the
number of decimal places you specify.

8/20/2019 _Casio_fx9860GSD_9860G_E
http://slidepdf.com/reader/full/casiofx9860gsd9860ge 82/595
20050401
u To specify the number of significant digits (Sci)
○ ○ ○ ○ ○
Example To specify three significant digits
2(Sci)dw
Press the number key that corresponds
to the number of significant digits you
want to specify ( n = 0 to 9).
Specifying 0 makes the number of
significant digits 10.
u To specify the normal display (Norm 1/Norm 2)Press3(Norm) to switch between Norm 1 and Norm 2.
Norm 1: 10–2 (0.01)>| x |, | x | >1010
Norm 2: 10–9 (0.000000001)>| x |, | x | >1010
Ab/caaw (Norm 1)
(Norm 2)
u To specify the engineering notation display (Eng mode)
Press4(Eng) to switch between engineering notation and standard notation. The
indicator “/E” is on the display while engineering notation is in effect.
You can use the following symbols to convert values to engineering notation, such as
2,000 (= 2 × 10³) → 2k.
E (Exa) × 1018 m (milli) × 10–3
P (Peta) × 1015 µ (micro) × 10–6
T (Tera) × 1012 n (nano) × 10–9
G (Giga) × 109 p (pico) × 10–12
M (Mega) × 106 f (femto) × 10–15
k (kilo) × 103
2-3-2 Specifying the Angle Unit and Display Format
# Displayed values are rounded off to the numberof significant digits you specify.
# The engineering symbol that makes themantissa a value from 1 to 1000 is automatically
selected by the calculator when engineering
notation is in effect.

8/20/2019 _Casio_fx9860GSD_9860G_E
http://slidepdf.com/reader/full/casiofx9860gsd9860ge 83/595
20050401
2-4 Function Calculations
k Function Menus
This calculator includes five function menus that give you access to scientific functions not
printed on the key panel.
• The contents of the function menu differ according to the mode you entered from the Main
Menu before you pressed theK key. The following examples show function menus that
appear in the RUN • MAT mode.
uuuuuHyperbolic Calculations (HYP) [OPTN]-[HYP]
• {sinh} / {cosh} / {tanh} ... hyperbolic {sine}/{cosine}/{tangent}
• {sinh–1} / {cosh–1} / {tanh–1} ... inverse hyperbolic {sine}/{cosine}/{tangent}
uuuuuProbability/Distribution Calculations (PROB) [OPTN]-[PROB]
• { x!} ... {press after inputting a value to obtain the factorial of the value.}
• { nP r} / { nC r} ... {permutation}/{combination}
• {Ran#}... {pseudo random number generation (0 to 1)}
• {P(} / {Q(} / {R(} ... normal distribution probability {P(t )}/{Q(t )}/{R(t )}
• { t(} ... {value of normalized variate t ( x )}
uuuuuNumeric Calculations (NUM) [OPTN]-[NUM]
• {Abs} ... {select this item and input a value to obtain the absolute value of the value.}
• {Int}/{Frac} ... select the item and input a value to extract the {integer}/{fraction} part.
• {Rnd} ... {rounds off the value used for internal calculations to 10 significant digits
(to match the value in the Answer Memory), or to the number of decimal places (Fix)
and number of significant digits (Sci) specified by you.}
• {Intg} ... {select this item and input a value to obtain the largest integer that is not greater
than the value.}
• {RndFi} ... {rounds off the value used for internal calculations to specified digits (0~9)
(see page 2-1-3).}
2-4-1Function Calculations

8/20/2019 _Casio_fx9860GSD_9860G_E
http://slidepdf.com/reader/full/casiofx9860gsd9860ge 84/595
20050401
*1The { ° ’ ” } menu operation is available only
when there is a calculation result on the
display.*2The {ENG} and {ENG} menu operations are
available only when there is a calculation
result on the display.
uuuuuAngle Units, Coordinate Conversion, Sexagesimal Operations (ANGL)
[OPTN]-[ANGL]
• {°} / {r} / {g} ... {degrees}/{radians}/{grads} for a specific input value• {° ’ ”} ... {specifies degrees (hours), minutes, seconds when inputting a degrees/minutes/
seconds value}
• {° ’ ”} ... {converts decimal value to degrees/minutes/seconds value}*1
• {Pol(} / {Rec(} ... {rectangular-to-polar}/{polar-to-rectangular} coordinate conversion
• {'DMS} ... {converts decimal value to sexagesimal value}
uuuuuEngineering Symbol (ESYM) [OPTN]-[ESYM]
• {m} / {µ} / {n} / {p} / {f} ... {milli (10–3)}/{micro (10–6)}/{nano (10–9)}/{pico (10–12)}/ {femto (10–15)}
• {k } / {M} / {G} / {T} / {P} / {E} ... {kilo (103)}/{mega (106)}/{giga (109)}/{tera (1012)}/{peta (1015)}/
{exa (1018)}
• {ENG} / {ENG} ... shifts the decimal place of the displayed value three digits to
the {left}/{right} and {decreases}/{increases} the exponent by three.*2
When you are using engineering notation, the engineering symbol is also changed
accordingly.
2-4-2 Function Calculations
# ENG/ENG switching is disabled for the following
types of calculation results.
- Result of matrix calculation input in the Mathinput mode
- Result of list calculation input in the Math input
mode

8/20/2019 _Casio_fx9860GSD_9860G_E
http://slidepdf.com/reader/full/casiofx9860gsd9860ge 85/595
20050401
kkkkkAngle Units
To change the angle unit of an input value, first pressK6(g)5(ANGL). On the
function key menu that appears, select “°”, “r”, or “g”.• Be sure to specify Comp for Mode in the Setup screen.
Example Operation
To convert 4.25 rad to degrees: !m(SET UP)cccccc1(Deg)J
243.5070629 4.25K6(g)5(ANGL)2(r)w
47.3° + 82.5rad = 4774.20181° 47.3+82.5K6(g)5(ANGL)2(r)w
2°2030 + 3930 = 3°00 00 2K6(g)5(ANGL)4(° ’ ”) 204(° ’ ”) 30
4(° ’ ”)+04(° ’ ”)394(° ’ ”)304(° ’ ”)w5(° ’ ”)
2.255° = 2°1518 2.255K6(g)5(ANGL)6(g)3('DMS)w
2-4-3 Function Calculations
# Once you specify an angle unit, it remains ineffect until you specify a different one. The
specification is retained even if you turn
power off.

8/20/2019 _Casio_fx9860GSD_9860G_E
http://slidepdf.com/reader/full/casiofx9860gsd9860ge 86/595
20050401
kkkkk Trigonometric and Inverse Trigonometric Functions
• Be sure to set the angle unit before performing trigonometric function and inverse
trigonometric function calculations.
• Be sure to specify Comp for Mode in the Setup screen.
Example Operation
sin 63° = 0.8910065242 !m(SET UP)cccccc
1(Deg)J
s63w
πcos (–– rad) = 0.5 !m(SET UP)cccccc32(Rad)J
<Line>
c(!E(π)/3)w
<Math>
c$!E(π)c3w
tan (– 35gra) = – 0.6128007881 !m(SET UP)cccccc
3(Gra)J
t-35w
2 • sin 45° × cos 65° = 0.5976724775 !m(SET UP)cccccc
1(Deg)J
2*s45*c65w*1
cosec 30° =1
= 2 !m(SET UP)cccccc
sin30° 1(Deg)J
<Line>
1/s30w
<Math>
$1cs30w
sin-10.5 = 30° !m(SET UP)cccccc
( x when sin x = 0.5) 1(Deg)J
!s(sin–1)0.5*2w
2-4-4 Function Calculations
*1* can be omitted. *2Input of leading zero is not necessary.
π(90° = ––– radians = 100 grads)
2

8/20/2019 _Casio_fx9860GSD_9860G_E
http://slidepdf.com/reader/full/casiofx9860gsd9860ge 87/595
20050401
k Logarithmic and Exponential Functions
• Be sure to specify Comp for Mode in the Setup screen.
Example Operation
log 1.23 (log101.23) = 0.08990511144 l1.23w
log2 8 = 3 <Line>
K4(CALC)6(g)4(logab)2,8)w
<Math>
4(MATH)2(logab) 2e8w
In 90 (loge90) = 4.49980967 I90w
101.23 = 16.98243652 !l(10 x )1.23w(To obtain the antilogarithm of common
logarithm 1.23)
e4.5 = 90.0171313 !I(e x )4.5w
(To obtain the antilogarithm of natural
logarithm 4.5)
(–3)4 = (–3) × (–3) × (–3) × (–3) = 81 (-3)M4w
–3
4
= –(3 × 3 × 3 × 3) = –81 -3M4w1 <Line>
7 (= 123 7 ) = 1.9886477957!M(
x )123w
123
<Math>
!M( x
)7e123w
<Line>
2 + 3 × 3 – 4 = 10 2+3*3!M( x
)64-4w*164
<Math>
2+3*!M( x
)3e64e-4w
2-4-5 Function Calculations
*1 ^ ( x y) and x take precedence over
multiplication and division.
# You cannot use a differential, quadratic
differential, integration, Σ, maximum/minimum
value, Solve, RndFix or log ab calculation
expression inside of a log ab calculation term.
# The Linear input mode and Math input mode
produce different results when two or more
powers are input in series, like: 2M3M2.
Linear input mode: 2^3^2 = 64
Math input mode: = 512
This is because the Math input mode internally
treats the above input as: 2^(3^(2)).

8/20/2019 _Casio_fx9860GSD_9860G_E
http://slidepdf.com/reader/full/casiofx9860gsd9860ge 88/595
20050401
kHyperbolic and Inverse Hyperbolic Functions
• Be sure to specify Comp for Mode in the Setup screen.
Example Operation
sinh 3.6 = 18.28545536 K6(g)2(HYP)1(sinh)3.6w
cosh 1.5 – sinh 1.5 K6(g)2(HYP)2(cosh)1.5-
= 0.2231301601 1(sinh)1.5w
= e–1.5 (Display: –1.5) I!-(Ans)w
(Proof of cosh x ± sinh x = e± x )
cosh–1 20
= 0.7953654612<Line>
15 K6(g)2(HYP)5(cosh–1)(20/15)w
<Math>K6(g)2(HYP)5(cosh–1)$20c15w
Determine the value of x
when tanh 4 x = 0.88
x = tanh–1 0.88 <Line>
4 K6(g)2(HYP)6(tanh–1)0.88/4w
= 0.3439419141 <Math>
$K6(g)2(HYP)6(tanh–1)0.88c4w
2-4-6 Function Calculations

8/20/2019 _Casio_fx9860GSD_9860G_E
http://slidepdf.com/reader/full/casiofx9860gsd9860ge 89/595
20050401
kOther Functions
• Be sure to specify Comp for Mode in the Setup screen.
Example Operation
+ = 3.65028154 !x( )2+!x( )5w2 5
= 1.755317302 <Line>(3 + i)
+0.2848487846i !x( )(d+!a(i))w
<Math>
!x( )d+!a(i)w
(–3)2 = (–3) × (–3) = 9 (-3)xw
–32 = –(3 × 3) = –9 -3xw
<Line>
(3!)( x–1
)-4!)( x–1
))!)( x–1
)w
<Math>
$1c$1c3e-$1c4w
8! (= 1 × 2× 3× .... × 8) 8K6(g)3(PROB)1( x !)w = 40320
3 = 42 <Line>36 × 42 × 49!((3
)(36*42*49)w
<Math>
!((3 )36*42*49w
What is the absolute value of
the common logarithm of
| log | = 0.1249387366<Line>
K6(g)4(NUM)1(Abs)l(3/4)w
<Math>
4(MATH)3(Abs)l$3c4w
What is the integer part of K6(g)4(NUM)2(Int)-3.5w
– 3.5? – 3
What is the decimal part of K6(g)4(NUM)3(Frac)-3.5w
– 3.5? – 0.5
What is the nearest integer K6(g)4(NUM)5(Intg)-3.5w
not exceeding – 3.5? – 4
2-4-7 Function Calculations
3
4?
3
4
1–––––– = 121 1–– – ––3 4

8/20/2019 _Casio_fx9860GSD_9860G_E
http://slidepdf.com/reader/full/casiofx9860gsd9860ge 90/595
20050401
kRandom Number Generation (Ran#)
This function generates a 10-digit truly random or sequentially random number that is greater
than zero and less than 1.• A truly random number is generated if you do not specify anything for the argument.
Example Operation
Ran# (Generates a random number.) K6(g)3(PROB)4(Ran#)w
(Each press ofw generates a new random w
number.) w
• Specifying an argument from 1 to 9 generates random numbers based on that sequence.
• Specifying an argument of 0 initializes the sequence.*1
Example Operation
Ran# 1 (Generates the first random number in sequence 1.) K6(g)3(PROB)
4(Ran#)bw
(Generates the second random number in sequence 1.) w
Ran# 0 (Initializes the sequence.) 4(Ran#)aw
Ran# 1 (Generates the first random number in sequence 1.) 4(Ran#)bw
2-4-8 Function Calculations
*1Changing to a different sequence or
generating a totally random number (without
an argument) initializes the sequence.

8/20/2019 _Casio_fx9860GSD_9860G_E
http://slidepdf.com/reader/full/casiofx9860gsd9860ge 91/595
20050401
2-4-9 Function Calculations
kCoordinate Conversion
uuuuu Rectangular Coordinates uuuuu Polar Coordinates
• With polar coordinates, θ can be calculated and displayed within a range of
–180°< θ < 180° (radians and grads have same range).
• Be sure to specify Comp for Mode in the Setup screen.
Example Operation
Calculate r and θ ° when x = 14 and y = 20.7 !m(SET UP)cccccc
1(Deg)J
K6(g)5(ANGL)6(g)1(Pol()
14,20.7)wJ
Calculate x and y when r = 25 and θ = 56° 2(Rec()25,56)w
1 24.989 → 24.98979792 (r )
2 55.928 → 55.92839019 (θ )
1 13.979 → 13.97982259 ( x )
2 20.725 → 20.72593931 ( y)

8/20/2019 _Casio_fx9860GSD_9860G_E
http://slidepdf.com/reader/full/casiofx9860gsd9860ge 92/595
20050401
2-4-10 Function Calculations
n! n!nPr = ––––– nCr = –––––––(n – r )! r ! (n – r )!
k Permutation and Combination
uuuuu Permutation uuuuu Combination
• Be sure to specify Comp for Mode in the Setup screen.
○ ○ ○ ○ ○
Example To calculate the possible number of different arrangements using 4
items selected from among 10 items
Formula Operation
10P4 = 5040 10K6(g)3(PROB)2(nPr )4w
○ ○ ○ ○ ○
Example To calculate the possible number of different combinations of 4 items
that can be selected from among 10 items
Formula Operation
10C4 = 210 10K6(g)3(PROB)3(nCr )4w
kkkkk Fractions
How you should input fractions depends on the input mode that is currently selected.
• For information about the Math input mode, see “Input Operations in the Math Input Mode”
on page 1-3-8.
• Fraction calculation results are always reduced before being displayed.
Denominator
Improper Fraction Mixed Fraction
Math input mode
Linear input mode
73
13
2
7 { 3 2 { 1 { 3
Numerator Denominator Integer PartNumerator
($7c3) (1$(()2e1c3)
(7$3) (2$1$3)

8/20/2019 _Casio_fx9860GSD_9860G_E
http://slidepdf.com/reader/full/casiofx9860gsd9860ge 93/595
20050401
• Be sure to specify Comp for Mode in the Setup screen.
Example Operation
<Math>
$2c5e+!$(&)3e1c4 w
<Line>
2$5+3$1$4w
<Math>
$1c2578e+$1c4572w
<Line>
1$2578+1$4572w
<Math>
$1c2e*.5w
<Line>
1$2*.5w
1.5+2.3!a(i)w
MM*3
<Math>
$1c$1c3e+$1c4w
<Line>1$(1$3+1$4)w
2-4-11Function Calculations
2 1 73–– + 3 –– = –––5 4 20
1 1––––– + –––––2578 4572 = 6.066202547 × 10–4*1
1–– × 0.5 = 0.25*2
2
*1When the total number of characters,
including integer, numerator, denominator
and delimiter marks exceeds 10, the fractionis automatically displayed in decimal format.
*2Calculations containing both fractions and
decimals are calculated in decimal format.
*3PressingM once when converting the decimal
part of a complex number to a fraction first
displays the real part and imaginary part onseparate lines.
3 231.5 + 2.3i = –– + –– i
2 10
Display: 3{2
+23{10i
1 12–––––– = ––1 1 7–– + ––
3 4

8/20/2019 _Casio_fx9860GSD_9860G_E
http://slidepdf.com/reader/full/casiofx9860gsd9860ge 94/595
20050401
2-4-12 Function Calculations
Switching between improper fraction and mixed fraction format
Pressing the!M(<) key toggles the display fraction between mixed fraction and
improper fraction format.
Switching between fraction and decimal format
• If the calculation result includes a fraction, the display format (improper fraction or mixed
fraction) is in accordance with the “Frac Result” setting of the Setup screen. For details,
see “1-7 Using the Setup Screen”.
• You cannot switch from decimal format to mixed fraction format if the total number of digits
used in the mixed fraction (including integer, numerator, denominator, and separator
symbols) is greater than 10.
k Engineering Notation Calculations
Input engineering symbols using the engineering notation menu.
• Be sure to specify Comp for Mode in the Setup screen.
Example Operation
!m(SET UP)f (orc 12 times)
4(Eng)J
999k (kilo) + 25k (kilo) 999K6(g)6(g)1(EYSM)6(g)1(k)+= 1.024M (mega) 251(k)w
9 ÷ 10 = 0.9 = 900m (milli) 9/10w
= 0.9 K6(g)6(g)1(EYSM)6(g)6(g)3(ENG)*1
= 0.0009k (kilo) 3(ENG)*1
= 0.9 2(ENG)*2
= 900m 2(ENG)*2
*1Converts the displayed value to the next higher
engineering unit, by shifting the decimal point
three places to the right.
*2Converts the displayed value to the next lower
engineering unit, by shifting the decimal point
three places to the left.
⇒M⇐

8/20/2019 _Casio_fx9860GSD_9860G_E
http://slidepdf.com/reader/full/casiofx9860gsd9860ge 95/595
20061001
2-5 Numerical Calculations
The following describes the items that are available in the menus you use when performing
differential/quadratic differential, integration, Σ, maximum/minimum value, and Solvecalculations.
When the option menu is on the display, press4(CALC) to display the function analysis
menu. The items of this menu are used when performing specific types of calculations.
• {Solve} / {d / dx} / {d 2 / dx2} / {∫ dx} / {FMin} / {FMax} / {Σ(} ... {solve}/{differential}/
{quadratic differential}/{integration}/{minimum value}/{maximum value}/{Σ (sigma)}
calculations
k Solve Calculations
The following is the syntax for using the Solve function in a program.
Solve( f ( x), n, a, b) (a: lower limit, b: upper limit, n: initial estimated value)
There are two different input methods that can be used for Solve calculations: direct
assignment and variable table input.
With the direct assignment method (the one described here), you assign values directly to
variables. This type of input is identical to that used with the Solve command used in the
PRGM mode.
Variable table input is used with the Solve function in the EQUA mode. This input method is
recommended for most normal Solve function input.
An error (Time Out) occurs when there is no convergence of the solution.
For information about Solve calculations, see page 4-3-1.
2-5-1
Numerical Calculations
20070101
# You cannot use a differential, quadraticdifferential, integration, Σ, maximum/minimum
value, Solve, RndFix or log ab calculation
expression inside of a Solve calculation term.
# PressingA during calculation of Solve(while the cursor is not shown on the display)
interrupts the calculation.

8/20/2019 _Casio_fx9860GSD_9860G_E
http://slidepdf.com/reader/full/casiofx9860gsd9860ge 96/595
20050401
kDifferential Calculations [OPTN]-[CALC]-[ d / dx]
To perform differential calculations, first display the function analysis menu, and then input
the values using the syntax below.
K4(CALC)2(d / dx ) f ( x ),a,tol)
The differentiation for this type of calculation is defined as:
In this definition, infinitesimal is replaced by a sufficiently small A x , with the value in the
neighborhood of f ' (a) calculated as:
In order to provide the best precision possible, this unit employs central difference to perform
differential calculations.
Using Differential Calculation in a Graph Function
• Omitting the tolerance (tol) value when using the differential command inside of a graphfunction simplifies the calculation for drawing the graph. In such a case, precision is
sacrificed for the sake of faster drawing. The tolerance value is specified, the graph is
drawn with the same precision obtained when you normally perform a differential
calculation.
• You can also omit input of the derivative point by using the following format for the
differential graph: Y2=d / dx (Y1). In this case, the value of the X variable is used as the
derivative point.
2-5-2 Numerical Calculations
d d / dx ( f ( x ), a) ⇒ ––– f (a)
dx
f (a + A x ) – f (a) f '(a) = lim –––––––––––––
A x A x →0
f (a + A x ) – f (a) f '(a) –––––––––––––
A x
(a: point for which you want to determine the
derivative, tol: tolerance)

8/20/2019 _Casio_fx9860GSD_9860G_E
http://slidepdf.com/reader/full/casiofx9860gsd9860ge 97/595
20061001
Example To determine the derivative at point x = 3 for the function
y = x3 + 4 x2 + x – 6, with a tolerance of “tol ” = 1E – 5
Input the function f ( x).
AK4(CALC)2(d / dx)vMd+evx+v-g,
Input point x = a for which you want to determine the derivative.
d,
Input the tolerance value.
bE-f)
w
<Math>
A4(MATH)4(d / dx)vMde
+evx+v-ged
w
2-5-3
Numerical Calculations
# In the function f ( x), only X can be used as
a variable in expressions. Other variables
(A through Z excluding X, r, θ) are treated
as constants, and the value currently
assigned to that variable is applied during the
calculation.
# Input of the tolerance (tol) value and the
closing parenthesis can be omitted. If you
omit tolerance (tol) value, the calculator
automatically uses a value for tol as 1E-10.
# Specify a tolerance (tol) value of 1E-14 or
greater. An error (Time Out) occurs whenever
no solution that satisfies the tolerance value
can be obtained.
# In the Math input mode, the tolerance value is
fixed at 1E-10 and cannot be changed.
# Inaccurate results and errors can be caused by
the following:
- discontinuous points in x values
- extreme changes in x values
- inclusion of the local maximum point and local
minimum point in x values
- inclusion of the inflection point in x values
- inclusion of undifferentiable points in x values
- differential calculation results approaching zero
20070101

8/20/2019 _Casio_fx9860GSD_9860G_E
http://slidepdf.com/reader/full/casiofx9860gsd9860ge 98/595
20050401
uApplications of Differential Calculations
• Differentials can be added, subtracted, multiplied or divided with each other.
Therefore:
• Differential results can be used in addition, subtraction, multiplication, and division, and in
functions.
2 × f '(a), log ( f '(a)), etc.
• Functions can be used in any of the terms ( f ( x ), a, tol) of a differential.
2-5-4 Numerical Calculations
# You cannot use a differential, quadratic
differential, integration, Σ, maximum/minimumvalue, Solve, RndFix or log ab calculation
expression inside a differential calculation
term.
# PressingA during calculation of a differential
(while the cursor is not shown on the display)interrupts the calculation.
# Always use radians (Rad mode) as the angle
unit when performing trigonometric differentials.
d d ––– f (a) = f '(a), ––– g (a) = g'(a)dx dx
f '(a) + g'(a), f '(a) × g'(a), etc.
d ––– (sin x + cos x , sin0.5, 1E - 8), etc.dx

8/20/2019 _Casio_fx9860GSD_9860G_E
http://slidepdf.com/reader/full/casiofx9860gsd9860ge 99/595
20061001
k Quadratic Differential Calculations [OPTN]-[CALC]-[d 2 / dx2]
After displaying the function analysis menu, you can input quadratic differentials using the
following syntax.
K4(CALC)3(d 2 / dx2) f ( x),a,tol)
(a: differential coefficient point, tol: tolerance)
Quadratic differential calculations produce an approximate differential value using the
following second order differential formula, which is based on Newton’s polynomial
interpretation.
In this expression, values for “sufficiently small increments of h” are used to obtain a value
that approximates f ”(a).
Example To determine the quadratic differential coefficient at the point where
x = 3 for the function y = x3 + 4 x2 + x – 6
Here we will use a tolerance tol = 1E – 5
Input the function f ( x).
AK4(CALC)3(d 2 / dx2)vMd+
evx+v-g,
Input 3 as point a, which is the differential coefficient point.
d,
Input the tolerance value.
bE-f)
w
d 2 d 2 ––– ( f ( x), a) ⇒ ––– f (a)dx2 dx2d 2 d 2
––– ( f ( x), a) ⇒ ––– f (a)dx2 dx2
f ''(a) =180h
2
2 f (a + 3h) – 27 f (a + 2h) + 270 f (a + h) – 490 f (a) + 270 f (a – h) – 27 f (a –2h) + 2 f (a – 3h) f ''(a) =
180h2
2 f (a + 3h) – 27 f (a + 2h) + 270 f (a + h) – 490 f (a) + 270 f (a – h) – 27 f (a –2h) + 2 f (a – 3h)
2-5-5
Numerical Calculations
# In the function f ( x), only X can be used as
a variable in expressions. Other variables
(A through Z excluding X, r, θ) are treatedas constants, and the value currently
assigned to that variable is applied during the
calculation.
# Input of the tolerance (tol) value and the closing
parenthesis can be omitted.
# Specify a tolerance (tol) value of 1E-14 or
greater. An error (Time Out) occurs whenever
no solution that satisfies the tolerance value can
be obtained.
20070101

8/20/2019 _Casio_fx9860GSD_9860G_E
http://slidepdf.com/reader/full/casiofx9860gsd9860ge 100/595
20061001
<Math>
A4(MATH)5(d 2 / dx2)vMde
+evx+v-gedw
u Quadratic Differential Applications
• Arithmetic operations can be performed using two quadratic differentials.
Therefore: f '' (a) + g'' (a), f '' (a) × g'' (a), etc.
• The result of a quadratic differential calculation can be used in a subsequent arithmetic
or function calculation.
2 × f '' (a), log ( f '' (a) ), etc.
• Functions can be used within the terms ( f ( x), a, tol ) of a quadratic differential
expression.
d 2
d 2
––– f (a) = f ''(a), ––– g (a) = g''(a)dx
2dx
2
d 2
d 2
––– f (a) = f ''(a), ––– g (a) = g''(a)dx
2dx
2
d 2
––– (sin x + cos x, sin 0.5, 1E - 8), etc.dx
2
d 2
––– (sin x + cos x, sin 0.5, 1E - 8), etc.dx
2
2-5-6
Numerical Calculations
# In the Math input mode, the tolerance value is
fixed at 1E-10 and cannot be changed.
# The rules that apply for linear differential also
apply when using a quadratic differential
calculation for the graph formula (see page
2-5-2).
# Inaccurate results and errors can be caused
by the following:
- discontinuous points in x values
- extreme changes in x values
- inclusion of the local maximum point and
local minimum point in x values
- inclusion of the inflection point in x values
- inclusion of undifferentiable points in x values
- differential calculation results approaching
zero
# You can interrupt an ongoing quadratic
differential calculation by pressing theA key.
# Always use radians (Rad mode) as the angle
unit when performing trigonometric quadratic
differentials.
# You cannot use a differential, quadratic
differential, integration, Σ, maximum/minimum
value, Solve, RndFix or log ab calculation
expression inside of a quadratic differential
calculation term.
# With quadratic differential calculation,
calculation precision is up to five digits for themantissa.
20070101

8/20/2019 _Casio_fx9860GSD_9860G_E
http://slidepdf.com/reader/full/casiofx9860gsd9860ge 101/595
20050401
kkkkk Integration Calculations [OPTN]-[CALC]-[ ∫ dx]
To perform integration calculations, first display the function analysis menu and then input
the values using the syntax below.K4(CALC)4 ( ∫ dx ) f ( x ) , a , b , tol )
∫ ( f ( x ), a, b, tol) ⇒ ∫ ab f ( x )dx
As shown in the illustration above, integration calculations are performed by calculating
integral values from a through b for the function y = f ( x ) where a < x < b, and f ( x ) > 0. This
in effect calculates the surface area of the shaded area in the illustration.
○ ○ ○ ○ ○
Example To perform the integration calculation for the function shown
below, with a tolerance of “ tol ” = 1E - 4
∫ 15 (2 x2 + 3 x + 4) dx
Input the function f ( x ).
AK4(CALC)4(∫ dx )cvx+dv+e,
Input the start point and end point.
b,f,
Input the tolerance value.
bE-e)
w
2-5-7 Numerical Calculations
Area of ∫ ab f ( x )dx is calculated
(a: start point, b: end point, tol: tolerance)
# If f ( x ) < 0 where a < x < b, the surface area
calculation produces negative values (surface
area × – 1).

8/20/2019 _Casio_fx9860GSD_9860G_E
http://slidepdf.com/reader/full/casiofx9860gsd9860ge 102/595
20050401
<Math>
4(MATH)6(g)1(∫ dx )cvx+
dv+eebffw
uuuuuApplication of Integration Calculation
• Integrals can be used in addition, subtraction, multiplication or division.
∫ ab f ( x ) dx + ∫ c
d g ( x ) dx , etc.
• Integration results can be used in addition, subtraction, multiplication or division, in
functions.
2 × ∫ ab f ( x ) dx , etc. log (∫ a
b f ( x ) dx ), etc.
• Functions can be used in any of the terms ( f ( x ) , a, b, tol) of an integral.
∫ cos 0.5
(sin x + cos x ) dx = ∫ (sin x + cos x , sin 0.5, cos 0.5, 1E - 4)sin 0.5
2-5-8 Numerical Calculations
# In the Math input mode, the tolerance value is
fixed at 1E-5 and cannot be changed.
# In the function f ( x ), only X can be used as a
variable in expressions. Other variables (A
through Z excluding X, r , θ ) are treated as
constants, and the value currently assigned to
that variable is applied during the calculation.# Input of “tol” and closing parenthesis can be
omitted. If you omit “tol,” the calculator
automatically uses a default value of 1E-5.
# Integration calculations can take a long time to
complete.
# You cannot use a differential, quadratic
differential, integration, Σ, maximum/minimum
value, Solve, RndFix or log ab calculation
expression inside of an integration calculation
term.

8/20/2019 _Casio_fx9860GSD_9860G_E
http://slidepdf.com/reader/full/casiofx9860gsd9860ge 103/595
20050401
Note the following points to ensure correct integration values.
(1) When cyclical functions for integration values become positive or negative for different
divisions, perform the calculation for single cycles, or divide between negative andpositive, and then add the results together.
∫ a
b f ( x )dx =
∫ a
c f ( x )dx + (–
∫ c
b f ( x )dx )
Positive part ( S ) Negative part ( S )
(2) When minute fluctuations in integration divisions produce large fluctuations in integration
values, calculate the integration divisions separately (divide the large fluctuation areas
into smaller divisions), and then add the results together.
∫ ab f ( x )dx = ∫ a
x 1 f ( x )dx + ∫ x 1
x 2 f ( x )dx +.....+ ∫ x 4
b
f ( x )dx
2-5-9 Numerical Calculations
Negative part (S )
Positive
part (S )
# PressingA during calculation of an integral
(while the cursor is not shown on the display)
interrupts the calculation.# Always use radians (Rad mode) as the angle
unit when performing trigonometric
integrations.
# An error (Time Out) occurs whenever no
solution that satisfies the tolerance value can
be obtained.

8/20/2019 _Casio_fx9860GSD_9860G_E
http://slidepdf.com/reader/full/casiofx9860gsd9860ge 104/595
20050401
kkkkk Σ Calculations [OPTN]-[CALC]-[Σ ]
To perform Σ calculations, first display the function analysis menu, and then input the values
using the syntax below.
K4(CALC)6(g)3(Σ( ) ak , k , α , β , n )
○ ○ ○ ○ ○
Example To calculate the following:
Use n = 1 as the distance between partitions.
AK4(CALC)6(g)3(Σ( )a,(K)
x-da,(K)+f,
a,(K),c,g,b)w
<Math>
A4(MATH)6(g)2(Σ( )a,(K)
x-da,(K)+fe
a,(K)ecfgw
2-5-10
Numerical Calculations
6
Σ (k 2 – 3k + 5)k = 2
# The value of the specified variable changes
during a Σ calculation. Be sure to keep
separate written records of the specified
variable values you might need later before
you perform the calculation.
# You can use only one variable in the function for
input sequence ak .
# Input integers only for the initial term (α ) of
sequence ak and last term (β ) of sequence ak .
# Input of n and the closing parentheses can be
omitted. If you omit n, the calculator automati-
cally uses n = 1.# In the Math input mode, the distance between
partitions (n) is fixed at 1 and cannot be
changed.
β
Σ (ak , k , α , β , n) = Σ ak = aα + aα +1 +........+ aβ
k = α (n: distance between partitions)
20060601

8/20/2019 _Casio_fx9860GSD_9860G_E
http://slidepdf.com/reader/full/casiofx9860gsd9860ge 105/595
20050401
u Σ Calculation Applications
• Arithmetic operations using Σ calculation expressions
Expressions:
Possible operations: Sn + Tn, Sn – Tn, etc.
• Arithmetic and function operations using Σ calculation results
2 × Sn, log (Sn), etc.
• Function operations using Σ calculation terms (ak , k )
Σ (sink , k , 1, 5), etc.
2-5-11Numerical Calculations
n n
Sn =Σ ak , Tn =Σ bk
k = 1 k = 1
# You cannot use a differential, quadratic
differential, integration, Σ, maximum/minimum
value, Solve, RndFix or log ab calculation
expression inside of a Σ calculation term.
# Make sure that the value used as the final term
β is greater than the value used as the initial
term α . Otherwise, an error will occur.
# To interrupt an ongoing Σ calculation (indicated
when the cursor is not on the display), press the
A key.

8/20/2019 _Casio_fx9860GSD_9860G_E
http://slidepdf.com/reader/full/casiofx9860gsd9860ge 106/595
20050401
2-5-12 Numerical Calculations
kkkkkMaximum/Minimum Value Calculations [OPTN]-[CALC]-[FMin]/[FMax]
After displaying the function analysis menu, you can input maximum/minimum calculations
using the formats below, and solve for the maximum and minimum of a function withininterval a < x < b.
uuuuuMinimum Value
K4(CALC)6(g)1(FMin) f ( x ) , a , b , n )
(a: start point of interval, b: end point of interval, n: precision (n = 1 to 9))
uuuuuMaximum Value
K4(CALC)6(g)2(FMax) f ( x ), a , b , n )
(a: start point of interval, b: end point of interval, n: precision (n = 1 to 9))
○ ○ ○ ○ ○
Example 1 To determine the minimum value for the interval defined by start
point a = 0 and end point b = 3, with a precision of n = 6 for the
function y = x2 – 4 x + 9
Input f ( x ).
AK4(CALC)6(g)1(FMin)vx-ev+j,
Input the interval a = 0, b = 3.
a,d,
Input the precision n = 6.
g)
w

8/20/2019 _Casio_fx9860GSD_9860G_E
http://slidepdf.com/reader/full/casiofx9860gsd9860ge 107/595
20050401
2-5-13 Numerical Calculations
# In the function f ( x ), only X can be used as avariable in expressions. Other variables (A
through Z excluding X, r , θ ) are treated as
constants, and the value currently assigned to
that variable is applied during the calculation.
# Input of n and the closing parenthesis can be
omitted.
# Discontinuous points or sections with drastic
fluctuation can adversely affect precision or
even cause an error.
# You cannot use a differential, quadratic
differential, integration, Σ, maximum/minimumvalue, Solve, RndFix or log ab calculation
expression inside of a maximum/minimum
calculation term.
# Inputting a larger value for n increases theprecision of the calculation, but it also increases
the amount of time required to perform the
calculation.
# The value you input for the end point of the
interval (b) must be greater than the value you
input for the start point (a). Otherwise an error
occurs.
# You can interrupt an ongoing maximum/
minimum calculation by pressing theA key.
# You can input an integer in the range of 1 to 9
for the value of n. Using any value outside thisrange causes an error.
○ ○ ○ ○ ○
Example 2 To determine the maximum value for the interval defined by start
point a = 0 and end point b = 3, with a precision of n = 6 for the
function y = – x2 + 2 x + 2
Input f ( x ).
AK4(CALC)6(g)2(FMax)-vx+cv+c,
Input the interval a = 0, b = 3.
a,d,
Input the precision n = 6.
g)
w

8/20/2019 _Casio_fx9860GSD_9860G_E
http://slidepdf.com/reader/full/casiofx9860gsd9860ge 108/595
20050401
2-6 Complex Number Calculations
You can perform addition, subtraction, multiplication, division, parentheses calculations,
function calculations, and memory calculations with complex numbers just as you do with themanual calculations described on pages 2-1-1 and 2-4-7.
You can select the complex number calculation mode by changing the Complex Mode item
on the Setup screen to one of the following settings.
• {Real} ... Calculation in the real number range only*1
• { a+ bi} ... Performs complex number calculation and displays results in rectangular
form
• { r∠θ
} ... Performs complex number calculation and displays results in polar form*2
PressK3(CPLX) to display the complex calculation number menu, which contains the
following items.
• {i} ... {imaginary unit i input}
• {Abs} / {Arg} ... obtains {absolute value}/{argument}
• {Conj} ... {obtains conjugate}
• {ReP} / {ImP} ... {real}/{imaginary} part extraction
• {' r∠θ
} / {' a
+ bi
} ... converts the result to {polar}/{rectangular} form
2-6-1Complex Number Calculations
*1 When there is an imaginary number in the
argument, however, complex number
calculation is performed and the result is
displayed using rectangular form.
Examples:
ln 2i = 0.6931471806 + 1.570796327i
ln 2i + ln (- 2 ) = (Non-Real ERROR)
*2 The display range of θ depends on the angle
unit set for the Angle item on the Setup
screen.• Deg ... –180 < θ < 180
• Rad ... – π < θ < π
• Gra ... –200 < θ < 200
# Solutions obtained by the Real, a+bi and r ∠θ
modes are different for power root ( x y) calculations
when x < 0 and y = m / n when n is an odd number.
Example:
3 x (- 8) = – 2 (Real)
= 1 + 1.732050808i (a+bi)
= 2∠60 (r ∠θ )
# To input the “ ∠ ” operator into the polar coordinate
expression (r ∠θ ), press!v.
20050601

8/20/2019 _Casio_fx9860GSD_9860G_E
http://slidepdf.com/reader/full/casiofx9860gsd9860ge 109/595
20050401
2-6-2 Complex Number Calculations
kkkkkArithmetic Operations [OPTN]-[CPLX]-[i]
Arithmetic operations are the same as those you use for manual calculations. You can even
use parentheses and memory. ○ ○ ○ ○ ○
Example 1 (1 + 2i) + (2 + 3i)
AK3(CPLX)
(b+c1(i))
+(c+d1(i))w
○ ○ ○ ○ ○
Example 2 (2 + i) × (2 – i)
AK3(CPLX)
(c+1(i))
*(c-1(i))w
kkkkkReciprocals, Square Roots, and Squares
○ ○ ○ ○ ○
Example (3 + i)
AK3(CPLX)
!x( )(d+1(i))w
kkkkkComplex Number Format Using Polar Form
○ ○ ○ ○ ○
Example 2∠30 × 3∠45 = 6∠75
!m(SET UP)cccccc
1(Deg)c3(r ∠θ )J
Ac!v(∠)da*d
!v(∠)efw
# You can also use!a(i) in place of
K3(CPLX)1(i).

8/20/2019 _Casio_fx9860GSD_9860G_E
http://slidepdf.com/reader/full/casiofx9860gsd9860ge 110/595
20050401
2-6-3 Complex Number Calculations
kkkkkAbsolute Value and Argument [OPTN]-[CPLX]-[Abs]/[Arg]
The unit regards a complex number in the form a + bi as a coordinate on a Gaussian plane,
and calculates absolute value Z and argument (arg). ○ ○ ○ ○ ○
Example To calculate absolute value ( r) and argument (θ ) for the complex
number 3 + 4i, with the angle unit set for degrees
AK3(CPLX)2(Abs)
(d+e1(i))w
(Calculation of absolute value)
AK3(CPLX)3(Arg)
(d+e1(i))w
(Calculation of argument)
kkkkkConjugate Complex Numbers [OPTN]-[CPLX]-[Conj]
A complex number of the form a + bi becomes a conjugate complex number of the form
a – bi.
○ ○ ○ ○ ○
Example To calculate the conjugate complex number for the complex number 2+ 4i
AK3(CPLX)4(Conj)
(c+e1(i))w
# The result of the argument calculation differs
in accordance with the current angle unit
setting (degrees, radians, grads).
Imaginary axis
Real axis

8/20/2019 _Casio_fx9860GSD_9860G_E
http://slidepdf.com/reader/full/casiofx9860gsd9860ge 111/595
20050401
kkkkk Extraction of Real and Imaginary Parts [OPTN]-[CPLX]-[ReP]/[lmP]
Use the following procedure to extract the real part a and the imaginary part b from a
complex number of the form a + bi. ○ ○ ○ ○ ○
Example To extract the real and imaginary parts of the complex number 2 + 5i
AK3(CPLX)6(g)1(ReP)
(c+f6(g)1(i))w
(Real part extraction)
AK3(CPLX)6(g)2(ImP)
(c+f6(g)1(i))w(Imaginary part extraction)
2-6-4 Complex Number Calculations
# The input/output range of complex numbers is
normally 10 digits for the mantissa and two
digits for the exponent.
# When a complex number has more than 21
digits, the real part and imaginary part are
displayed on separate lines.# When either the real part or imaginary part of
a complex number equals zero, that part is not
displayed in rectangular form.
# The following functions can be used with
complex numbers.
, x 2, x –1, ^( x y), 3 , x , In, log, logab, 10 x , e x ,
Int, Frac, Rnd, Intg, RndFix(, Fix, Sci, ENG,
ENG, ° ’ ”, ° ’ ”, a b / c, d / c

8/20/2019 _Casio_fx9860GSD_9860G_E
http://slidepdf.com/reader/full/casiofx9860gsd9860ge 112/595
20050401
2-6-5 Complex Number Calculations
kkkkk Polar and Rectangular Form Transformation
[OPTN]-[CPLX]-[''''' r∠θ ]/ [''''' a+ bi ]
Use the following procedure to transform a complex number displayed in rectangular form topolar form, and vice versa.
○ ○ ○ ○ ○
Example To transform the rectangular form of complex number 1 + 3 i to its
polar form
!m(SET UP)cccccc
1(Deg)c2(a+bi)J
Ab+(!x( )d)
K3(CPLX)1(i)6(g)3('r ∠θ )w
Ac!v(∠)ga
K3(CPLX)6(g)4('a+bi)w

8/20/2019 _Casio_fx9860GSD_9860G_E
http://slidepdf.com/reader/full/casiofx9860gsd9860ge 113/595
20050401
2-7 Binary, Octal, Decimal, and Hexadecimal
Calculations with Integers
You can use the RUN • MAT mode and binary, octal, decimal, and hexadecimal settings to
perform calculations that involve binary, octal, decimal and hexadecimal values. You can also
convert between number systems and perform bitwise operations.
• You cannot use scientific functions in binary, octal, decimal, and hexadecimal calcula-
tions.
• You can use only integers in binary, octal, decimal, and hexadecimal calculations, which
means that fractional values are not allowed. If you input a value that includes a decimal
part, the calculator automatically cuts off the decimal part.
• If you attempt to enter a value that is invalid for the number system (binary, octal,
decimal, hexadecimal) you are using, the calculator displays an error message. The
following shows the numerals that can be used in each number system.
Binary: 0, 1
Octal: 0, 1, 2, 3, 4, 5, 6, 7
Decimal: 0, 1, 2, 3, 4, 5, 6, 7, 8, 9
Hexadecimal: 0, 1, 2, 3, 4, 5, 6, 7, 8, 9, A, B, C, D, E, F
• Negative binary, octal, and hexadecimal values are produced using the two’s comple-ment of the original value.
• The following are the display capacities for each of the number systems.
Number System Display Capacity
Binary 16 digits
Octal 11 digits
Decimal 10 digits
Hexadecimal 8 digits
2-7-1Binary, Octal, Decimal, and Hexadecimal Calculations with Integers
# The alphabetic characters used in the
hexadecimal number appear differently on
the display to distinguish them from text
characters.
Normal TextHexadecimal Values
Keys
A B C D E F
u v w x y z

8/20/2019 _Casio_fx9860GSD_9860G_E
http://slidepdf.com/reader/full/casiofx9860gsd9860ge 114/595
20050401
• The following are the calculation ranges for each of the number systems.
Binary Values
Positive: 0 < x < 111111111111111
Negative: 1000000000000000 < x < 1111111111111111
Octal Values
Positive: 0 < x < 17777777777
Negative: 20000000000 < x < 37777777777
Decimal Values
Positive: 0 < x < 2147483647
Negative: –2147483648 < x < –1
Hexadecimal Values
Positive: 0 < x < 7FFFFFFF
Negative: 80000000 < x < FFFFFFFF
uuuuu To perform a binary, octal, decimal, or hexadecimal calculation
1. In the main menu, select RUN • MAT.[SET UP]- [Mode] -[Dec]/[Hex]/[Bin]/[Oct]
2. Press!m(SET UP)c and then specify the default number system by pressing
2(Dec),3(Hex),4(Bin), or5(Oct) for the Mode setting.
3. PressJ to change to the screen for calculation input. This causes a function menu
with the following items to appear.
• {d~o} / {LOG} / {DISP} ... {number system specification}/{bitwise operation}/
{decimal/hexadecimal/binary/octal conversion} menu
2-7-2 Binary, Octal, Decimal, and Hexadecimal Calculations with Integers

8/20/2019 _Casio_fx9860GSD_9860G_E
http://slidepdf.com/reader/full/casiofx9860gsd9860ge 115/595
20050401
kkkkk Selecting a Number System
You can specify decimal, hexadecimal, binary, or octal as the default number system using
the Setup screen.
uuuuu To specify a number system for an input value
You can specify a number system for each individual value you input. Press1(d~o) to
display a menu of number system symbols. Press the function key that corresponds to the
symbol you want to select and then input the value.
• {d} / {h} / {b} / {o} ... {decimal}/{hexadecimal}/{binary}/{octal}
uuuuu To input values of mixed number systems
○ ○ ○ ○ ○
Example To input 12310 or 10102, when the default number system is
hexadecimal
!m(SET UP)c3(Hex)J
A1(d~o)1(d)bcdw
3(b)babaw
kkkkkArithmetic Operations
○ ○ ○ ○ ○
Example 1 To calculate 101112 + 110102
!m(SET UP)c4(Bin)J
Ababbb+
bbabaw
2-7-3 Binary, Octal, Decimal, and Hexadecimal Calculations with Integers

8/20/2019 _Casio_fx9860GSD_9860G_E
http://slidepdf.com/reader/full/casiofx9860gsd9860ge 116/595
20050401
○ ○ ○ ○ ○
Example 2 To input and execute 1238 × ABC16, when the default number system is
decimal or hexadecimal
!m(SET UP)c2(Dec)J
A1(d~o)4(o)bcd*
2(h)ABC*1w
J3(DISP)2('''''Hex)w
kkkkkNegative Values and Bitwise OperationsPress2(LOG) to display a menu of negation and bitwise operators.
• {Neg} ... {negation}*2
• {Not} / {and} / {or} / {xor} / {xnor} ... {NOT}*3 /{AND}/{OR}/{XOR}/{XNOR}*4
u Negative Values
○ ○ ○ ○ ○
Example To determine the negative of 1100102
!m(SET UP)c4(Bin)J
A2(LOG)1(Neg)
bbaabaw
uBitwise Operations
○ ○ ○ ○ ○
Example 1 To input and execute “12016 and AD16”
!m(SET UP)c3(Hex)J
Abca2(LOG)
3(and)AD*1w
2-7-4 Binary, Octal, Decimal, and Hexadecimal Calculations with Integers
*1 See page 2-7-1.
*2 two’s complement
*3 one’s complement (bitwise complement)
*4 bitwise AND, bitwise OR, bitwise XOR,
bitwise XNOR
# Negative binary, octal, and hexadecimal values
are produced by taking the binary two’s
complement and then returning the result to theoriginal number base. With the decimal number
base, negative values are displayed with a minus
sign.

8/20/2019 _Casio_fx9860GSD_9860G_E
http://slidepdf.com/reader/full/casiofx9860gsd9860ge 117/595
20050401
○ ○ ○ ○ ○
Example 2 To display the result of “368 or 11102” as an octal value
!m(SET UP)c5(Oct)J
Adg2(LOG)
4(or)J1(d~o)3(b)
bbbaw
○ ○ ○ ○ ○
Example 3 To negate 2FFFED16
!m(SET UP)c3(Hex)J
A2(LOG)2(Not)
cFFFED*1w
uNumber System Transformation
Press3(DISP) to display a menu of number system transformation functions.
• {'''''Dec} / {'''''Hex} / {'''''Bin} / {'''''Oct} ... transformation of displayed value to its {decimal}/
{hexadecimal}/{binary}/{octal} equivalent
u To convert a displayed value from one number system to another
○ ○ ○ ○ ○
Example To convert 2210 (default number system) to its binary or octal value
A!m(SET UP)c2(Dec)J
1(d~o)1(d)ccw
J3(DISP)3('''''Bin)w
4('''''Oct)w
2-7-5 Binary, Octal, Decimal, and Hexadecimal Calculations with Integers
*1 See page 2-7-1.

8/20/2019 _Casio_fx9860GSD_9860G_E
http://slidepdf.com/reader/full/casiofx9860gsd9860ge 118/595
20050401
2-8-1
Matrix Calculations
2-8 Matrix Calculations
From the Main Menu, enter the RUN • MAT mode, and press1('MAT) to perform Matrix
calculations.
26 matrix memories (Mat A through Mat Z) plus a Matrix Answer Memory (MatAns), make it
possible to perform the following matrix operations.
• Addition, subtraction, multiplication
• Scalar multiplication calculations
• Determinant calculations
• Matrix transposition
• Matrix inversion
• Matrix squaring
• Raising a matrix to a specific power
• Absolute value, integer part extraction, fractional part extraction, maximum integer
calculations
• Matrix modification using matrix commands
The maximum number of rows that can be specified for a matrix is 255, and the maximum
number of columns is 255.
# About Matrix Answer Memory (MatAns)
The calculator automatically stores matrix
calculation results in Matrix AnswerMemory. Note the following points about
Matrix Answer Memory.
• Whenever you perform a matrix calculation, the
current Matrix Answer Memory contents are
replaced by the new result. The previouscontents are deleted and cannot be recovered.
• Inputting values into a matrix does not affect
Matrix Answer Memory contents.

8/20/2019 _Casio_fx9860GSD_9860G_E
http://slidepdf.com/reader/full/casiofx9860gsd9860ge 119/595
20050401
k Inputting and Editing Matrices
Pressing1('MAT) displays the Matrix Editor screen. Use the Matrix Editor to input and
edit matrices.
• {DEL} / {DEL·A} ... deletes {a specific matrix}/{all matrices}
• {DIM} ... {specifies the matrix dimensions (number of cells)}
u Creating a Matrix
To create a matrix, you must first define its dimensions (size) in the Matrix Editor. Then you
can input values into the matrix.
u To specify the dimensions (size) of a matrix ○ ○ ○ ○ ○
Example To create a 2-row × 3-column matrix in the area named Mat B
Highlight Mat B.
c
3(DIM) (This step can be omitted.)
Specify the number of rows.cw
Specify the number of columns.
dw
w
• All of the cells of a new matrix contain the value 0.
2-8-2
Matrix Calculations
# If “Memory ERROR” remains next to the matrix
area name after you input the dimensions, it
means there is not enough free memory to create
the matrix you want.
m × n … m (row) × n (column) matrix
None… no matrix preset

8/20/2019 _Casio_fx9860GSD_9860G_E
http://slidepdf.com/reader/full/casiofx9860gsd9860ge 120/595
20061001
u To input cell values
Example To input the following data into Matrix B :
The following operation is a continuation of the example calculation on the previous page.
bwcwdw
ewfwgw
(Data is input into the highlighted cell.
Each time you pressw, the highlighting
moves to the next cell to the right.)
To exit the Matrix input screen, pressJ.
1 2 3
4 5 6
1 2 3
4 5 6
# You cannot input complex numbers into the
cell of a matrix.
# Displayed cell values show positive
integers up to six digits, and negative
integers up to five digits (one digit used
for the negative sign). Exponential valuesare shown with up to two digits for the
exponent. Fractional values are not
displayed.
# You can see the entire value assigned to
a cell by using the cursor keys to move the
highlighting to the cell whose value you want
to view.
2-8-3
Matrix Calculations
20070101

8/20/2019 _Casio_fx9860GSD_9860G_E
http://slidepdf.com/reader/full/casiofx9860gsd9860ge 121/595
20050401
uDeleting Matrices
You can delete either a specific matrix or all matrices in memory.
u To delete a specific matrix
1. While the Matrix Editor is on the display, usef andc to highlight the matrix you
want to delete.
2. Press1(DEL).
3. Press1(Yes) to delete the matrix or6(No) to abort the operation without deleting
anything.
u To delete all matrices
1. While the Matrix Editor is on the display, press2(DEL·A).
2. Press1(Yes) to delete all matrices in memory or6(No) to abort the operation
without deleting anything.
2-8-4
Matrix Calculations
# The indicator “None” replaces the
dimensions of the matrix you delete.# Inputting the format or changing the dimensions
of a matrix deletes its current contents.

8/20/2019 _Casio_fx9860GSD_9860G_E
http://slidepdf.com/reader/full/casiofx9860gsd9860ge 122/595
20050401
kMatrix Cell Operations
Use the following procedure to prepare a matrix for cell operations.
1. While the Matrix Editor is on the display, usef andc to highlight the name of thematrix you want to use.
You can jump to a specific matrix by inputting the letter that corresponds to the matrix
name. Inputtingai(N), for example, jumps to Mat N.
Pressing!-(Ans) jumps to the Matrix current Memory.
2. Pressw and the function menu with the following items appears.
• {R-OP} ... {row operation menu}
• {ROW}
• {DEL}/{INS}/{ADD} ... row {delete}/{insert}/{add}
• {COL}• {DEL}/{INS}/{ADD} ... column {delete}/{insert}/{add}
• {EDIT} ... {cell editing screen}
All of the following examples use Matrix A.
u Row Calculations
The following menu appears whenever you press1(R-OP) while a recalled matrix is on the
display.
• {Swap} ... {row swap}
• {×Rw} ... {product of specified row and scalar}
• {×Rw+} ... {addition of one row and the product of a specified row with a scalar}
• {Rw+} ... {addition of specified row to another row}
u To swap two rows
○ ○ ○ ○ ○
Example To swap rows two and three of the following matrix :
1 2
Matrix A = 3 4
5 6
1(R-OP)1(Swap)
Input the number of the rows you want to swap.
cwdw
6(EXE) (orw)
2-8-5
Matrix Calculations

8/20/2019 _Casio_fx9860GSD_9860G_E
http://slidepdf.com/reader/full/casiofx9860gsd9860ge 123/595
20050401
uuuuu To calculate the scalar multiplication of a row
○ ○ ○ ○ ○
Example To calculate the product of row 2 of the following matrix and the scalar4 :
1 2
Matrix A = 3 4
5 6
1(R-OP)2(×Rw)
Input multiplier value.
ew
Specify row number.
cw
6(EXE) (orw)
uuuuu To calculate the scalar multiplication of a row and add the result to anotherrow
○ ○ ○ ○ ○
Example To calculate the product of row 2 of the following matrix and the scalar
4, then add the result to row 3 :
1 2
Matrix A = 3 4
5 6
1(R-OP)3(×Rw+)
Input multiplier value.
ew
Specify number of row whose product should be
calculated.
cw
Specify number of row where result should be added.
dw
6(EXE) (orw)
2-8-6
Matrix Calculations

8/20/2019 _Casio_fx9860GSD_9860G_E
http://slidepdf.com/reader/full/casiofx9860gsd9860ge 124/595
20050401
u To add two rows together
○ ○ ○ ○ ○
Example To add row 2 to row 3 of the following matrix :1 2
Matrix A = 3 4
5 6
1(R-OP)4(Rw+)
Specify number of row to be added.
cw
Specify number of row to be added to.
dw
6(EXE) (orw)
u Row Operations
• { DEL} ... {delete row}
• {INS} ... {insert row}
• {ADD} ... {add row}
u To delete a row
○ ○ ○ ○ ○
Example To delete row 2 of the following matrix :
1 2
Matrix A = 3 4
5 6
c
2(ROW)1(DEL)
2-8-7
Matrix Calculations

8/20/2019 _Casio_fx9860GSD_9860G_E
http://slidepdf.com/reader/full/casiofx9860gsd9860ge 125/595
20050401
u To insert a row
○ ○ ○ ○ ○
Example To insert a new row between rows one and two of the followingmatrix :
1 2
Matrix A = 3 4
5 6
c
2(ROW)2(INS)
u To add a row
○ ○ ○ ○ ○
Example To add a new row below row 3 of the following matrix :
1 2
Matrix A = 3 4
5 6
cc
2(ROW)3(ADD)
2-8-8
Matrix Calculations

8/20/2019 _Casio_fx9860GSD_9860G_E
http://slidepdf.com/reader/full/casiofx9860gsd9860ge 126/595
20050401
2-8-9
Matrix Calculations
uColumn Operations
• {DEL} ... {delete column}
• {INS} ... {insert column}
• {ADD} ... {add column}
u To delete a column
○ ○ ○ ○ ○
Example To delete column 2 of the following matrix :
1 2
Matrix A = 3 4
5 6
e
3(COL)1(DEL)
u To insert a column
○ ○ ○ ○ ○
Example To insert a new column between columns 1 and 2 of the following
matrix :
1 2
Matrix A = 3 4
5 6
e
3(COL)2(INS)

8/20/2019 _Casio_fx9860GSD_9860G_E
http://slidepdf.com/reader/full/casiofx9860gsd9860ge 127/595
20050401
u To add a column
○ ○ ○ ○ ○
Example To add a new column to the right of column 2 of the followingmatrix :
1 2
Matrix A = 3 4
5 6
e
3(COL)3(ADD)
kModifying Matrices Using Matrix Commands [OPTN]-[MAT]
u To display the matrix commands
1. From the Main Menu, enter the RUN • MAT mode.
2. PressK to display the option menu.
3. Press2(MAT) to display the matrix command menu.
The following describes only the matrix command menu items that are used for creating
matrices and inputting matrix data.
• {Mat} ... {Mat command (matrix specification)}
• {M→L} ... {Mat→List command (assign contents of selected column to list file)}
• {Det} ... {Det command (determinant command)}
• {Trn} ... {Trn command (transpose matrix command)}
• {Aug} ... {Augment command (link two matrices)}
• {Iden} ... {Identity command (identity matrix input)}
• {Dim} ... {Dim command (dimension check)}
• {Fill} ... {Fill command (identical cell values)}
2-8-10
Matrix Calculations

8/20/2019 _Casio_fx9860GSD_9860G_E
http://slidepdf.com/reader/full/casiofx9860gsd9860ge 128/595
20050401
u Matrix Data Input Format [OPTN]-[MAT]-[Mat]
The following shows the format you should use when inputting data to create a matrix using
the Mat command.
a11 a12 a1n
a21 a22 a2n
am1 am2 amn
= [ [a11, a12, ..., a1n] [a21, a22, ..., a2n] .... [am1, am2, ..., amn] ]
→ Mat [letter A through Z]
○ ○ ○ ○ ○
Example 1 To input the following data as Matrix A :
1 3 5
2 4 6
!+( [ )!+( [ )b,d,f
!-( ] )!+( [ )c,e,g
!-( ] )!-( ] )aK2(MAT)
1(Mat)av(A)
w
2-8-11
Matrix Calculations
# You can also use!c(Mat) in place ofK2 (MAT)1(Mat).
# The maximum value of both m and n is 255.
# An error occurs if memory becomes full as youare inputting data.
# You can also use the above format inside a
program that inputs matrix data.
Matrix name

8/20/2019 _Casio_fx9860GSD_9860G_E
http://slidepdf.com/reader/full/casiofx9860gsd9860ge 129/595

8/20/2019 _Casio_fx9860GSD_9860G_E
http://slidepdf.com/reader/full/casiofx9860gsd9860ge 130/595
20050401
2-8-13
Matrix Calculations
uModifying Matrices Using Matrix Commands
You can also use matrix commands to assign values to and recall values from an existing
matrix, to fill in all cells of an existing matrix with the same value, to combine two matrices
into a single matrix, and to assign the contents of a matrix column to a list file.
u To assign values to and recall values from an existing matrix
[OPTN]-[MAT]-[Mat]
Use the following format with the Mat command to specify a cell for value assignment and
recall.
Mat X [m, n]
X .................................. matrix name (A through Z, or Ans)
m ................................. row number
n ................................. column number
○ ○ ○ ○ ○
Example 1 Assign 10 to the cell at row 1, column 2 of the following matrix :
1 2
Matrix A = 3 4
5 6
baaK2(MAT)1(Mat)
av(A)!+( )b,c
!-( )w
JJ1('MAT)w
○ ○ ○ ○ ○
Example 2 Multiply the value in the cell at row 2, column 2 of the abovematrix by 5
K2(MAT)1(Mat)
av(A)!+( )c,c
!-( )*fw

8/20/2019 _Casio_fx9860GSD_9860G_E
http://slidepdf.com/reader/full/casiofx9860gsd9860ge 131/595
20050401
uuuuu To fill a matrix with identical values and to combine two matrices into asingle matrix [OPTN]-[MAT]-[Fill]/[Aug]
Use the Fill command to fill all the cells of an existing matrix with an identical value and the
Augment command to combine two existing matrices into a single matrix.
○ ○ ○ ○ ○
Example 1 To fill all of the cells of Matrix A with the value 3
K2(MAT)6(g)3(Fill)
d,6(g)1(Mat)av(A)w
1(Mat)av(A)w
○ ○ ○ ○ ○
Example 2 To combine the following two matrices :
A =1
B =3
2 4
K2(MAT)5(Aug)
1(Mat)av(A),
1(Mat)al(B)w
2-8-14
Matrix Calculations
# The two matrices you combine must have the
same number of rows. An error occurs if you
try to combine two matrices that have
different number of rows.
# You can use Matrix Answer Memory to assign the
results of the above matrix input and edit
operations to a matrix variable. To do so, use the
following syntax.
• Fill (n, Mat α ) → Mat β
• Augment (Mat α , Mat β )→ Mat γ
In the above, α , β , and γ are any variablenames A through Z, and n is any value.
The above does not affect the contents of Matrix
Answer Memory.

8/20/2019 _Casio_fx9860GSD_9860G_E
http://slidepdf.com/reader/full/casiofx9860gsd9860ge 132/595
20050401
uuuuu To assign the contents of a matrix column to a list
[OPTN]-[MAT]-[M→L]
Use the following format with the Mat→
List command to specify a column and a list.
Mat→ List (Mat X, m)→ List n
X = matrix name (A through Z, or Ans)
m = column number
n = list number
○ ○ ○ ○ ○
Example To assign the contents of column 2 of the following matrix to list 1 :
1 2
Matrix A = 3 4
5 6
K2(MAT)2(M→L)
1(Mat)av(A),c)
aK1(LIST)1(List)bw
1(List)bw
# You can also use!b(List) in place of
K1(LIST)1(List).
2-8-15
Matrix Calculations

8/20/2019 _Casio_fx9860GSD_9860G_E
http://slidepdf.com/reader/full/casiofx9860gsd9860ge 133/595
20050401
kMatrix Calculations [OPTN]-[MAT]
Use the matrix command menu to perform matrix calculation operations.
u To display the matrix commands
1. From the Main Menu, enter the RUN • MAT mode.
2. PressK to display the option menu.
3. Press2(MAT) to display the matrix command menu.
The following describes only the matrix commands that are used for matrix arithmeticoperations.
• {Mat} ... {Mat command (matrix specification)}
• {Det} ... {Det command (determinant command)}
• {Trn} ... {Trn command (transpose matrix command)}
• {Iden} ... {Identity command (identity matrix input)}
All of the following examples assume that matrix data is already stored in memory.
2-8-16
Matrix Calculations

8/20/2019 _Casio_fx9860GSD_9860G_E
http://slidepdf.com/reader/full/casiofx9860gsd9860ge 134/595
20050401
uMatrix Arithmetic Operations [OPTN]-[MAT]-[Mat]/[Iden]
○ ○ ○ ○ ○
Example 1 To add the following two matrices (Matrix A + Matrix B) :
A =1 1
B =2 3
2 1 2 1
AK2(MAT)1(Mat)av(A)+
1(Mat)al(B)w
○ ○ ○ ○ ○
Example 2 Calculate the product to the following matrix using a multiplier valueof 5 :
Matrix A =1 2
3 4
AfK2(MAT)1(Mat)
av(A)w
○ ○ ○ ○ ○
Example 3 To multiply the two matrices in Example 1 (Matrix A × Matrix B)
AK2(MAT)1(Mat)av(A)*
1(Mat)al(B)w
○ ○ ○ ○ ○
Example 4 To multiply Matrix A (from Example 1) by a 2 × 2 identity matrix
AK2(MAT)1(Mat)av(A)*
6(g)1(Iden)cw
Number of rows and columns
# The two matrices must have the same
dimensions in order to be added or
subtracted. An error occurs if you try to
add or subtract matrices of different
dimensions.
# For multiplication (Matrix 1 × Matrix 2), the
number of columns in Matrix 1 must match
the number of rows in Matrix 2. Other-
wise, an error occurs.
2-8-17
Matrix Calculations
# When performing matrix arithmetic operations,
inputting the Identity command at the location
of a matrix command (such as Mat A) makes it
possible to perform identity matrix
calculations.

8/20/2019 _Casio_fx9860GSD_9860G_E
http://slidepdf.com/reader/full/casiofx9860gsd9860ge 135/595
20050401
uDeterminant [OPTN]-[MAT]-[Det]
○ ○ ○ ○ ○
Example Obtain the determinant for the following matrix :
1 2 3
Matrix A = 4 5 6
–1 –2 0
K2(MAT)3(Det)1(Mat)
av(A)w
uMatrix Transposition [OPTN]-[MAT]-[Trn]
A matrix is transposed when its rows become columns and its columns become rows.
○ ○ ○ ○ ○
Example To transpose the following matrix :
1 2
Matrix A = 3 45 6
K2(MAT)4(Trn)1(Mat)
av(A)w
2-8-18
Matrix Calculations
# Determinants can be obtained only for square
matrices (same number of rows and
columns). Trying to obtain a determinant for a
matrix that is not square produces an error.
# The determinant of a 2 × 2 matrix is
calculated as shown below.
# The determinant of a 3 × 3 matrix is calculated
as shown below.
| A | = a11 a12
= a11a22 – a12a21
a21 a22
= a11a22a33 + a12a23a31 + a13a21a32
– a11a23a32 – a12a21a33 – a13a22a31
a11 a12 a13
a21 a22 a23
a31 a32 a33
| A | =

8/20/2019 _Casio_fx9860GSD_9860G_E
http://slidepdf.com/reader/full/casiofx9860gsd9860ge 136/595
20050401
uMatrix Inversion [OPTN]-[MAT]-[ x–1]
○ ○ ○ ○ ○
Example To invert the following matrix :
Matrix A =1 2
3 4
K2(MAT)1(Mat)
av(A)!) ( x–1) w
uSquaring a Matrix [OPTN]-[MAT]-[ x2]
○ ○ ○ ○ ○
Example To square the following matrix :
Matrix A =1 2
3 4
K2(MAT)1(Mat)av(A)xw
2-8-19
Matrix Calculations
# Only square matrices (same number of rows
and columns) can be inverted. Trying to invert
a matrix that is not square produces an error.
# A matrix with a determinant of zero cannot be
inverted. Trying to invert a matrix with
determinant of zero produces an error.
# Calculation precision is affected for matrices
whose determinant is near zero.
# A matrix being inverted must satisfy the
conditions shown below.
The following shows the formula used to
invert Matrix A into inverse matrix A–1.
A A–1 = A–1 A = E =1 0
0 1
A =a b
c d
Note that ad – bc 0.
A–1=1
ad – bc
d –b
–c a
G

8/20/2019 _Casio_fx9860GSD_9860G_E
http://slidepdf.com/reader/full/casiofx9860gsd9860ge 137/595
20050401
uRaising a Matrix to a Power [OPTN]-[MAT]-[ ]
○ ○ ○ ○ ○
Example To raise the following matrix to the third power :
Matrix A =1 2
3 4
K2(MAT)1(Mat)av(A)
Mdw
uDetermining the Absolute Value, Integer Part, Fraction Part, andMaximum Integer of a Matrix [OPTN]-[NUM]-[Abs]/[Frac]/[Int]/[Intg]
○ ○ ○ ○ ○
Example To determine the absolute value of the following matrix :
Matrix A =1 –2
–3 4
K6(g)4(NUM)1(Abs)
K2(MAT)1(Mat)av(A)w
2-8-20
Matrix Calculations
# Determinants and inverse matrices are
subject to error due to dropped digits.
# Matrix operations are performed
individually on each cell, so calculations
may require considerable time to
complete.
# The calculation precision of displayed
results for matrix calculations is ± 1 at the
least significant digit.# If a matrix calculation result is too large to
fit into Matrix Answer Memory, an error
occurs.
# You can use the following operation to transfer
Matrix Answer Memory contents to another
matrix (or when Matrix Answer Memory
contains a determinant to a variable).
MatAns → Mat α
In the above, α is any variable name A through
Z. The above does not affect the contents of
Matrix Answer Memory.
# For matrix power calculations, calculation ispossible up to a power of 32766.
20050901

8/20/2019 _Casio_fx9860GSD_9860G_E
http://slidepdf.com/reader/full/casiofx9860gsd9860ge 138/595
20050401
2-8-21
Matrix Calculations
k Performing Matrix Calculations Using Natural Input
u To specify the dimensions (size) of a matrix
1. In the RUN • MAT mode, press!m(SET UP)1(Math)J.
2. Press4(MATH) to display the MATH menu.
3. Press1(MAT) to display the following menu.
• {2×2} … {inputs a 2 × 2 matrix}
• {3×3} … {inputs a 3 × 3 matrix}
• { m× n} … {inputs an m-row × n-column matrix (up to 6 × 6)}
○ ○ ○ ○ ○
Example To create a 2-row × 3-column matrix
3(m×n)
Specify the number of rows.
cw
Specify the number of columns.
dw
w

8/20/2019 _Casio_fx9860GSD_9860G_E
http://slidepdf.com/reader/full/casiofx9860gsd9860ge 139/595
20050401
2-8-22
Matrix Calculations
u To input cell values
○ ○ ○ ○ ○
Example To perform the calculation shown below1
12
33× 8
135 64
The following operation is a continuation of the example calculation on the previous page.
be$bcceedde
$bdceee!x( )f
eege*iw
u To assign a matrix created using natural input to a MAT mode matrix
○ ○ ○ ○ ○
Example To assign the calculation result to Mat J
!c(Mat)!-(Ans)a
!c(Mat)a)(J)w
# Pressing theD key while the cursor islocated at the top (upper left) of the matrix
will delete the entire matrix.
D
⇒

8/20/2019 _Casio_fx9860GSD_9860G_E
http://slidepdf.com/reader/full/casiofx9860gsd9860ge 140/595
20050401
List FunctionA list is a storage place for multiple data items.
This calculator lets you store up to 26 lists in a single file, and
you can store up to six files in memory. Stored lists can be used
in arithmetic and statistical calculations, and for graphing.
3-1 Inputting and Editing a List
3-2 Manipulating List Data
3-3 Arithmetic Calculations Using Lists
3-4 Switching Between List Files
Chapter
3
List 1 List 2 List 3 List 4 List 5 List 26
1
SUB
56 1 107 3.5 4 0
2 37 2 75 6 0 0
3 21 4 122 2.1 0 0
4 69 8 87 4.4 2 0
5 40 16 298 3 0 0
6 48 32 48 6.8 3 07 93 64 338 2 9 0
8 30 128 49 8.7 0 0• • • • • •• • • • • •• • • • • ••
•••• • • • • •
Element number Display range Cell
Row
List name
Column
Sub name

8/20/2019 _Casio_fx9860GSD_9860G_E
http://slidepdf.com/reader/full/casiofx9860gsd9860ge 141/595
20050401
3-1 Inputting and Editing a List
When you enter the STAT mode, the “List Editor” will appear first. You can use the List Editor
to input data into a list and to perform a variety of other list data operations.
uuuuu To input values one-by-one
Use the cursor keys to move the highlighting to the list name, sub name or cell you want to
select.
The screen automatically scrolls when the highlighting is located at either edge of the
screen.
The following example is performed starting with the highlighting located at Cell 1 of List 1.
1. Input a value and pressw to store it in the list.
dw
• The highlighting automatically moves down to the
next cell for input.
2. Input the value 4 in the second cell, and then input the result of 2 + 3 in the next cell.
ewc+dw
3-1-1Inputting and Editing a List
# You can also input the result of an expres-
sion or a complex number into a cell.
# You can input values up to 999 cells in a single list.

8/20/2019 _Casio_fx9860GSD_9860G_E
http://slidepdf.com/reader/full/casiofx9860gsd9860ge 142/595
20050401
uuuuu To batch input a series of values
1. Use the cursor keys to move the highlighting to another list.
2. Press!*( { ), and then input the values you want, pressing, between each
one. Press!/( } ) after inputting the final value.
!*( { )g,h,i!/( } )
3. Pressw to store all of the values in your list.
w
You can also use list names inside of a mathematical expression to input values into another
cell. The following example shows how to add the values in each row in List 1 and List 2, andinput the result into List 3.
1. Use the cursor keys to move the highlighting to the name of the list where you want the
calculation results to be input.
2. PressK and input the expression.
K1(LIST)1(List)b+K1(LIST)1(List)cw
3-1-2
Inputting and Editing a List
# You can also use!b(List) in place of
K1(LIST)1(List).
# Remember that a comma separates values, so
you should not input a comma after the final
value of the set you are inputting.
Right: {34, 53, 78}
Wrong: {34, 53, 78,}

8/20/2019 _Casio_fx9860GSD_9860G_E
http://slidepdf.com/reader/full/casiofx9860gsd9860ge 143/595
20050401
kkkkk Editing List Values
uuuuu To change a cell value
Use the cursor keys to move the highlighting to the cell whose value you want to change.
Input the new value and pressw to replace the old data with the new one.
uuuuu To edit the contents of a cell
1. Use the cursor keys to move the highlighting to the cell whose contents you want to
edit.
2. Press6(
)2(EDIT).3. Make any changes in the data you want.
uuuuu To delete a cell
1. Use the cursor keys to move the highlighting to the cell you want to delete.
2. Press6()3(DEL) to delete the selected cell and cause everything below it to be
shifted up.
3-1-3 Inputting and Editing a List
# The cell delete operation does not affect cells
in other lists. If the data in the list whose cell
you delete is somehow related to the data in
neighboring lists, deleting a cell can cause
related values to become misaligned.

8/20/2019 _Casio_fx9860GSD_9860G_E
http://slidepdf.com/reader/full/casiofx9860gsd9860ge 144/595
20050401
uuuuu To delete all cells in a list
Use the following procedure to delete all the data in a list.
1. Use the cursor key to move the highlighting to any cell of the list whose data you wantto delete.
2. Pressing6()4(DEL
• A) causes a confirmation message to appear.
3. Press1(Yes) to delete all the cells in the selected list or6(No) to abort the delete
operation without deleting anything.
uuuuu To insert a new cell
1. Use the cursor keys to move the highlighting to the location where you want to insert
the new cell.
2. Press6()5(INS) to insert a new cell, which contains a value of 0, causing
everything below it to be shifted down.
# The cell insert operation does not affect cells
in other lists. If the data in the list where you
insert a cell is somehow related to the data in
3-1-4 Inputting and Editing a List
neighboring lists, inserting a cell can cause related
values to become misaligned.

8/20/2019 _Casio_fx9860GSD_9860G_E
http://slidepdf.com/reader/full/casiofx9860gsd9860ge 145/595
20050401
3-1-5 Inputting and Editing a List
kkkkkNaming a List
You can assign List 1 through List 26 “sub names” of up to eight bytes each.
uuuuu To name a list
1. On the Setup screen, highlight “Sub Name” and then press1(On)J.
2. Use the cursor keys to move the highlighting to the SUB cell of the list you want to
name.
3. Type in the name and then pressw.
• To type in a name using alpha characters, press!a to enter the ALPHA-LOCK
mode.
Example: YEAR
-(Y)c(E)v(A)g(R)
• The following operation displays a sub name in the RUN•MAT mode.
!b(List) n!+( [ )a!-( ] )w
(n = list number from 1 to 26)
# Though you can input up to 8 bytes for the
sub name, only the characters that can fit
within the List Editor cell will be displayed.
# The List Editor SUB cell is not displayed when “Off”
is selected for “Sub Name” on the Setup screen.

8/20/2019 _Casio_fx9860GSD_9860G_E
http://slidepdf.com/reader/full/casiofx9860gsd9860ge 146/595
20050401
kkkkk Sorting List Values
You can sort lists into either ascending or descending order. The highlighting can be located
in any cell of the list.
uuuuu To sort a single list
Ascending order
1. While the lists are on the screen, press6()1(TOOL)1(SRT •A).
2. The prompt “How Many Lists?:” appears to ask how many lists you want to sort. Here
we will input 1 to indicate we want to sort only one list.
bw
3. In response to the “Select List List No:” prompt, input the number of the list you want to
sort.
bw
Descending order
Use the same procedure as that for the ascending order sort. The only difference is that
you should press2(SRT•D) in place of1(SRT •A).
3-1-6 Inputting and Editing a List

8/20/2019 _Casio_fx9860GSD_9860G_E
http://slidepdf.com/reader/full/casiofx9860gsd9860ge 147/595
20050401
uuuuu To sort multiple lists
You can link multiple lists together for a sort so that all of their cells are rearranged in
accordance with the sorting of a base list. The base list is sorted into either ascending order
or descending order, while the cells of the linked lists are arranged so that the relative
relationship of all the rows is maintained.
Ascending order
1. While the lists are on the screen, press6()1(TOOL)1(SRT •A).
2. The prompt “How Many Lists?:” appears to ask how many lists you want to sort. Here
we will sort one base list linked to one other list, so we should input 2.
cw
3. In response to the “Select Base List List No:” prompt, input the number of the list you
want to sort into ascending order. Here we will specify List 1.
bw
4. In response to the “Select Second List List No:” prompt, input the number of the list
you want to link to the base list. Here we will specify List 2.
cw
3-1-7 Inputting and Editing a List

8/20/2019 _Casio_fx9860GSD_9860G_E
http://slidepdf.com/reader/full/casiofx9860gsd9860ge 148/595
20050401
3-1-8 Inputting and Editing a List
Descending order
Use the same procedure as that for the ascending order sort. The only difference is that
you should press2(SRT•D) in place of1(SRT •A).
# You can specify a value from 1 to 6 as the
number of lists for sorting.
# If you specify a list more than once for a single
sort operation, an error occurs.
An error also occurs if lists specified for sorting
do not have the same number of values (rows).

8/20/2019 _Casio_fx9860GSD_9860G_E
http://slidepdf.com/reader/full/casiofx9860gsd9860ge 149/595
20050401
3-2 Manipulating List Data
List data can be used in arithmetic and function calculations. In addition, various list data
manipulation functions make manipulation of list data quick and easy.
You can use list data manipulation functions in the RUN
• MAT, STAT, TABLE, EQUA and
PRGM modes.
kkkkk Accessing the List Data Manipulation Function Menu
All of the following examples are performed after entering the RUN
• MAT mode.
PressK and then1(LIST) to display the list data manipulation menu, which contains the
following items.
• {List} / {L→M} / {Dim} / {Fill} / {Seq} / {Min} / {Max} / {Mean} / {Med} / {Aug} / {Sum} / {Prod} / {Cuml} /
{%} / {AAAAA}
Note that all closing parentheses at the end of the following operations can be omitted.
u To transfer list contents to Matrix Answer Memory [OPTN]-[LIST]-[L→M]
K1(LIST)2(L→M)1(List) <list number 1-26>
,1(List) <list number 1-26> ...,1(List) <list number 1-26>)w
• You can skip input1(List) in the part of the above operation.
• All the lists must contain the same number of data items. If they don’t, an error occurs.
Example: List→ Mat (1, 2)w
○ ○ ○ ○ ○
Example To transfer the contents of List 1 (2, 3, 6, 5, 4) to column 1, and the
contents of List 2 (11, 12, 13, 14, 15) to column 2 of Matrix Answer
Memory
AK1(LIST)2(L→M)
1(List)b,
1(List)c)w
3-2-1
Manipulating List Data

8/20/2019 _Casio_fx9860GSD_9860G_E
http://slidepdf.com/reader/full/casiofx9860gsd9860ge 150/595
20050401
u To count the number of data items in a list [OPTN]-[LIST]-[Dim]
K1(LIST)3(Dim)1(List) <list number 1-26>w
• The number of cells a list contains is its “dimension.”
○ ○ ○ ○ ○
Example To count the number of values in List 1 (36, 16, 58, 46, 56)
AK1(LIST)3(Dim)
1(List)bw
u To create a list or matrix by specifying the number of data items
[OPTN]-[LIST]-[Dim]
Use the following procedure to specify the number of data in the assignment statement
and create a list.
<number of data n>aK1(LIST)3(Dim)1(List)
<list number 1-26>w
n = 1 - 999
○ ○ ○ ○ ○
Example To create five data items (each of which contains 0) in List 1
AfaK1(LIST)3(Dim)
1(List) bw
You can view the newly created list by entering
the STAT mode.
Use the following procedure to specify the number of data rows and columns, and the matrixname in the assignment statement and create a matrix.
!*( { )<number of row m>,<number of column n>!/( } )a
K1(LIST)3(Dim)K2(MAT)1(Mat)a<matrix name>w
m, n = 1 - 255, matrix name: A - Z
3-2-2 Manipulating List Data

8/20/2019 _Casio_fx9860GSD_9860G_E
http://slidepdf.com/reader/full/casiofx9860gsd9860ge 151/595
20050401
3-2-3 Manipulating List Data
○ ○ ○ ○ ○
Example To create a 2-row × 3-column matrix (each cell of which
contains 0) in Matrix A
A!*( { )c,d!/( } )a
K1(LIST)3(Dim)
K2(MAT)1(Mat)av(A)w
The following shows the new contents of Mat A.
u To replace all data items with the same value [OPTN]-[LIST]-[Fill]
K1(LIST)4(Fill) <value>,1(List) <list number 1-26>)w
○ ○ ○ ○ ○
Example To replace all data items in List 1 with the number 3
AK1(LIST)4(Fill)
d,1(List)b)w
The following shows the new contents of List 1.
u To generate a sequence of numbers [OPTN]-[LIST]-[Seq]
K1(LIST)5
(Seq) <expression>,
<variable name>,
<start value>, <end value>, <increment>) w
• The result of this operation is stored in ListAns Memory.
○ ○ ○ ○ ○
Example To input the number sequence 12, 62, 112, into a list, using the function
f ( x) = X2. Use a starting value of 1, an ending value of 11, and an
increment of 5
AK1(LIST)5(Seq)vx,
v,b,bb,f)w
Specifying an ending value of 12, 13, 14, or 15 produces the same result as shown above,
because all of them are less than the value produced by the next increment (16).

8/20/2019 _Casio_fx9860GSD_9860G_E
http://slidepdf.com/reader/full/casiofx9860gsd9860ge 152/595
20050401
3-2-4 Manipulating List Data
u To find the minimum value in a list [OPTN]-[LIST]-[Min]
K1(LIST)6(g)1(Min)6(g)6(g)1(List) <list number 1-26>)w
○ ○ ○ ○ ○
Example To find the minimum value in List 1 (36, 16, 58, 46, 56)
AK1(LIST)6(g)1(Min)
6(g)6(g)1(List)b)w
u To find the maximum value in a list [OPTN]-[LIST]-[Max]
Use the same procedure as when finding the minimum value (Min), except press
6(g)2(Max) in place of6(g)1(Min).
u To find which of two lists contains the smallest value [OPTN]-[LIST]-[Min]
K1(LIST)6(g)1(Min)6(g)6(g)1(List) <list number 1-26>
,1(List) <list number 1-26>)w
• The two lists must contain the same number of data items. If they don’t, an error occurs.
• The result of this operation is stored in ListAns Memory. ○ ○ ○ ○ ○
Example To find whether List 1 (75, 16, 98, 46, 56) or List 2 (35, 59, 58, 72, 67)
contains the smallest value
K1(LIST)6(g)1(Min)
6(g)6(g)1(List)b,
1(List)c)w
u To find which of two lists contains the greatest value [OPTN]-[LIST]-[Max]
Use the same procedure as that for the smallest value, except press6(g)2(Max) in
place of6(g)1(Min).
• The two lists must contain the same number of data items. If they don’t, an error
occurs.
• The result of this operation is stored in ListAns Memory.

8/20/2019 _Casio_fx9860GSD_9860G_E
http://slidepdf.com/reader/full/casiofx9860gsd9860ge 153/595
20050401
u To calculate the mean of data items [OPTN]-[LIST]-[Mean]
K1(LIST)6(g)3(Mean)6(g)6(g)1(List) <list number 1-26>)w
○ ○ ○ ○ ○
Example To calculate the mean of data items in List 1 (36, 16, 58, 46, 56)
AK1(LIST)6(g)3(Mean)
6(g)6(g)1(List)b)w
u To calculate the mean of data items of specified frequency
[OPTN]-[LIST]-[Mean]
This procedure uses two lists: one that contains values and one that indicates the frequency
(number of occurrences) of each value. The frequency of the data in Cell 1 of the first list is
indicated by the value in Cell 1 of the second list, etc.
• The two lists must contain the same number of data items. If they don’t, an error occurs.
K1(LIST)6(g)3(Mean)6(g)6(g)1(List)<list number 1-26 (data)>
,1(List)<list number 1-26 (frequency)>)w
○ ○ ○ ○ ○
Example To calculate the mean of data items in List 1 (36, 16, 58, 46, 56), whose
frequency is indicated by List 2 (75, 89, 98, 72, 67)
AK1(LIST)6(g)3(Mean)
6(g)6(g)1(List)b,
1(List)c)w
u To calculate the median of data items in a list [OPTN]-[LIST]-[Med]
K1(LIST)6(g)4(Med)6(g)6(g)1(List)<list number 1-26>
)w
○ ○ ○ ○ ○
Example To calculate the median of data items in List 1 (36, 16, 58, 46, 56)
AK1(LIST)6(g)4(Med)
6(g)6(g)1(List)b)w
3-2-5 Manipulating List Data

8/20/2019 _Casio_fx9860GSD_9860G_E
http://slidepdf.com/reader/full/casiofx9860gsd9860ge 154/595
20050401
u To calculate the median of data items of specified frequency[OPTN]-[LIST]-[Med]
This procedure uses two lists: one that contains values and one that indicates the frequency
(number of occurrences) of each value. The frequency of the data in Cell 1 of the first list is
indicated by the value in Cell 1 of the second list, etc.
• The two lists must contain the same number of data items. If they don’t, an error occurs.
K1(LIST)6(g)4(Med)6(g)6(g)1(List) <list number 1-26 (data)>
,1(List) <list number 1-26 (frequency)>)w
○ ○ ○ ○ ○
Example To calculate the median of values in List 1 (36, 16, 58, 46, 56), whose
frequency is indicated by List 2 (75, 89, 98, 72, 67)
AK1(LIST)6(g)4(Med)
6(g)6(g)1(List)b,
1(List)c)w
uuuuu To combine lists [OPTN]-[LIST]-[Aug]
• You can combine two different lists into a single list. The result of a list combination
operation is stored in ListAns memory.
K1(LIST)6(g
)5(Aug)6(g
)6(g
)1(List) <list number 1-26>,1(List) <list number 1-26>)w
○ ○ ○ ○ ○
Example To combine the List 1 (–3, –2) and List 2 (1, 9, 10)
AK1(LIST)6(g)5(Aug)
6(g)6(g)1(List)b,
1(List)c)w
u To calculate the sum of data items in a list [OPTN]-[LIST]-[Sum]
K1(LIST)6(g)6(g)1(Sum)6(g)1(List)<list number 1-26>w
○ ○ ○ ○ ○
Example To calculate the sum of data items in List 1 (36, 16, 58, 46, 56)
AK1(LIST)6(g)6(g)1(Sum)
6(g)1(List)bw
3-2-6
Manipulating List Data

8/20/2019 _Casio_fx9860GSD_9860G_E
http://slidepdf.com/reader/full/casiofx9860gsd9860ge 155/595
20050401
u To calculate the product of values in a list [OPTN]-[LIST]-[Prod]
K1(LIST)6(g)6(g)2(Prod)6(g)1(List)<list number 1-26>w
○ ○ ○ ○ ○
Example To calculate the product of values in List 1 (2, 3, 6, 5, 4)
AK1(LIST)6(g)6(g)2(Prod)
6(g)1(List)bw
u To calculate the cumulative frequency of each data item
[OPTN]-[LIST]-[Cuml]
K1(LIST)6(g)6(g)3(Cuml)6(g)1(List) <list number 1-26>w
• The result of this operation is stored in ListAns Memory.
○ ○ ○ ○ ○
Example To calculate the cumulative frequency of each data item in List 1
(2, 3, 6, 5, 4)
AK1(LIST)6(g)6(g)3(Cuml)
6(g)1(List)bw
u To calculate the percentage represented by each data item
[OPTN]-[LIST]-[%]
K1(LIST)6(g)6(g)4(%)6(g)1(List)<list number 1-26>w
• The above operation calculates what percentage of the list total is represented
by each data item.
• The result of this operation is stored in ListAns Memory.
3-2-7
Manipulating List Data
2+3= 2+3+6= 2+3+6+5= 2+3+6+5+4=

8/20/2019 _Casio_fx9860GSD_9860G_E
http://slidepdf.com/reader/full/casiofx9860gsd9860ge 156/595
20050401
○ ○ ○ ○ ○
Example To calculate the percentage represented by each data item in List 1
(2, 3, 6, 5, 4)
AK1(LIST)6(g)6(g)4(%)
6(g)1(List)bw
u
To calculate the differences between neighboring data inside a list[OPTN]-[LIST]-[AAAAA]
K1(LIST)6(g)6(g)5(A)<list number 1-26>w
• The result of this operation is stored in ListAns memory.
○ ○ ○ ○ ○
Example To calculate the difference between the data items in List 1
(1, 3, 8, 5, 4)
AK1(LIST)6(g)6(g)5(A)
bw
3-2-8 Manipulating List Data
2/(2+3+6+5+4) × 100 = 3/(2+3+6+5+4) × 100 = 6/(2+3+6+5+4) × 100 = 5/(2+3+6+5+4) × 100 = 4/(2+3+6+5+4) × 100 =
3 – 1 = 8 – 3 = 5 – 8 = 4 – 5 =
# You can specify the storage location in list
memory for a calculation result produced by alist calculation whose result is stored in ListAns
memory. For example, specifying “AList 1→ List
2” will store the result of AList 1 in List 2.
# The number of cells in the new AList is one
less than the number of cells in the original list.
# An error occurs if you execute AList for a list
that has no data or only one data item.

8/20/2019 _Casio_fx9860GSD_9860G_E
http://slidepdf.com/reader/full/casiofx9860gsd9860ge 157/595
20050401
3-3 Arithmetic Calculations Using Lists
You can perform arithmetic calculations using two lists or one list and a numeric value.
Calculation results are
stored in ListAns Memory.
k Error Messages
• A calculation involving two lists performs the operation between corresponding cells.
Because of this, an error occurs if the two lists do not have the same number of values(which means they have different “dimensions”).
• An error occurs whenever an operation involving any two cells generates a mathematical
error.
k Inputting a List into a Calculation
There are two methods you can use to input a list into a calculation.
u To input a specific list by name
1. PressK to display the first Operation Menu.
• This is the function key menu that appears in the RUN
• MAT mode when you pressK.
2. Press1(LIST) to display the List Data Manipulation Menu.
3. Press1(List) to display the “List” command and input the number of the list you want
to specify.
3-3-1Arithmetic Calculations Using Lists
List
Numeric Value
List
Numeric Value
+
−
×
÷
= List
ListAns Memory

8/20/2019 _Casio_fx9860GSD_9860G_E
http://slidepdf.com/reader/full/casiofx9860gsd9860ge 158/595
20050401
u To directly input a list of values
You can also directly input a list of values using {, }, and,.
○ ○ ○ ○ ○
Example 1 To input the list: 56, 82, 64
!*( { )fg,ic,
ge!/( } )
41 6 ○ ○ ○ ○ ○
Example 2 To multiply List 3 ( = 65 ) by the list 0
22 4
K1(LIST)1(List)d*!*( { )g,a,e!/( } )w
246The resulting list 0 is stored in ListAns Memory.
88
u To assign the contents of one list to another list
Usea to assign the contents of one list to another list.
○ ○ ○ ○ ○
Example 1 To assign the contents of List 3 to List 1
K1(LIST)1(List)da1(List)bw
In place ofK1(LIST)1(List)d operation in the above procedure, you could input
!*( { )eb,gf,cc!/( } ).
○ ○ ○ ○ ○
Example 2 To assign the list in ListAns Memory to List 1
K1(LIST)1(List)!-(Ans)a1(List)bw
3-3-2 Arithmetic Calculations Using Lists

8/20/2019 _Casio_fx9860GSD_9860G_E
http://slidepdf.com/reader/full/casiofx9860gsd9860ge 159/595
20050401
u To recall the value in a specific list cell
You can recall the value in a specific list cell and use it in a calculation. Specify the cell
number by enclosing it inside square brackets.
○ ○ ○ ○ ○
Example To calculate the sine of the value stored in Cell 3 of List 2
sK1(LIST)1(List)c!+( [ )d!-( ] )w
u To input a value into a specific list cell
You can input a value into a specific list cell inside a list. When you do, the value that was
previously stored in the cell is replaced with the new value you input.
○ ○ ○ ○ ○
Example To input the value 25 into Cell 2 of List 3
cfaK1(LIST)1(List)d!+( [ )c!-( ] )w
kRecalling List Contents
○ ○ ○ ○ ○
Example To recall the contents of List 1
K1(LIST)1(List)bw
• The above operation displays the contents of the list you specify and also stores them in
ListAns Memory. You can then use the ListAns Memory contents in a calculation.
u To use list contents in ListAns Memory in a calculation
○ ○ ○ ○ ○
Example To multiply the list contents in ListAns Memory by 36
K1(LIST)1(List)!-(Ans)*dgw
• The operationK1(LIST)1(List)!-(Ans) recalls ListAns Memory contents.
• This operation replaces current ListAns Memory contents with the result of the above
calculation.
3-3-3 Arithmetic Calculations Using Lists

8/20/2019 _Casio_fx9860GSD_9860G_E
http://slidepdf.com/reader/full/casiofx9860gsd9860ge 160/595
20050401
kGraphing a Function Using a List
When using the graphing functions of this calculator, you can input a function such as Y1 =
List 1 X. If List 1 contains the values 1, 2, 3, this function will produces three graphs: Y = X,Y = 2X, Y = 3X.
There are certain limitations on using lists with graphing functions.
○ ○ ○ ○ ○
Example To input the data 1, 2, 3 into List 1, and then graph the data in the
GRAPH mode
1. In the STAT mode, input 1, 2, 3 into List 1.
2. In the GRAPH mode, input the formula Y1=List 1X.
K1(List)bvw
3. Graph the data, which will produce three graphs.
k Inputting Scientific Calculations into a List
You can use the numeric table generation functions in the TABLE mode to input values that
result from certain scientific function calculations into a list. To do this, first generate a table
and then use the list copy function to copy the values from the table to the list.
○ ○ ○ ○ ○
Example To use the TABLE mode to create a number table for the formula (Y1 =
x2 –1), and then copy the table to List 1 in the STAT mode
1. In the TABLE mode, input the formula Y1 = x 2 –1.
2. Create the number table.
3. Usee to move the highlighting to the Y1 column.
4. PressK1(LMEM).
3-3-4 Arithmetic Calculations Using Lists

8/20/2019 _Casio_fx9860GSD_9860G_E
http://slidepdf.com/reader/full/casiofx9860gsd9860ge 161/595
20050401
5. Pressbw.
6. Enter the STAT mode to confirm that TABLE mode column Y1 has been copied to List 1.
k Performing Scientific Function Calculations Using a List
Lists can be used just as numeric values are in scientific function calculations. When the
calculation produces a list as a result, the list is stored in ListAns Memory.
41 ○ ○ ○ ○ ○
Example To use List 3 65 to perform sin (List 3)
22
Use radians as the angle unit.
sK1(LIST)1(List)dw
–0.158
The resulting list 0.8268 is stored in ListAns Memory.
–8E–3
In place of theK1(LIST)1(List)d operation in the above procedure, you could input
!*( { )eb,gf,cc!/( } ).
1 4 ○ ○ ○ ○ ○
Example To use List 1 2 and List 2 5 to perform List 1List 2
3 6
This creates a list with the results of 14, 25, 36.
K1(LIST)1(List)bM1(List)cw
1
The resulting list 32 is stored in ListAns Memory.
729
3-3-5 Arithmetic Calculations Using Lists

8/20/2019 _Casio_fx9860GSD_9860G_E
http://slidepdf.com/reader/full/casiofx9860gsd9860ge 162/595
20050401
3-4-1Switching Between List Files
3-4 Switching Between List Files
You can store up to 26 lists (List 1 to List 26) in each file (File 1 to File 6). A simple operation
lets you switch between list files.
u To switch between list files
1. From the Main Menu, enter the STAT mode.
Press!m(SET UP) to display the STAT mode Setup screen.
2. Usec to highlight “List File”.
3. Press1(FILE) and then input the number of the list file you want to use.
○ ○ ○ ○ ○
Example To select File 3
1(FILE)d
w
All subsequent list operations are applied to the lists contained in the file you select (List File3 in the above example).

8/20/2019 _Casio_fx9860GSD_9860G_E
http://slidepdf.com/reader/full/casiofx9860gsd9860ge 163/595
20050401
Chapter
Equation CalculationsYour graphic calculator can perform the following three types ofcalculations:
• Simultaneous linear equations• Quadratic and cubic equations
• Solve calculations
From the Main Menu, enter the EQUA mode.
• {SIML} ... {linear equation with 2 to 6 unknowns}
• {POLY} ... {degree 2 or 3 equation}
• {SOLV} ... {solve calculation}
4-1 Simultaneous Linear Equations
4-2 Quadratic and Cubic Equations
4-3 Solve Calculations
4-4 What to Do When an Error Occurs
4

8/20/2019 _Casio_fx9860GSD_9860G_E
http://slidepdf.com/reader/full/casiofx9860gsd9860ge 164/595
20050401
4-1-1Simultaneous Linear Equations
4-1 Simultaneous Linear Equations
Description
You can solve simultaneous linear equations with two to six unknowns.
• Simultaneous Linear Equation with Two Unknowns:
a1 x 1 + b1 x 2 = c1
a2 x 1 + b2 x 2 = c2
• Simultaneous Linear Equation with Three Unknowns:
a1 x 1 + b1 x 2 + c1 x 3 = d 1
a2 x 1 + b2 x 2 + c2 x 3 = d 2
a3 x 1 + b3 x 2 + c3 x 3 = d 3
Set Up
1. From the Main Menu, enter the EQUA mode.
Execution
2. Select the SIML (simultaneous equation) mode, and specify the number of unknowns
(variables).
You can specify from 2 to 6 unknowns.
3. Sequentially input the coefficients.
The cell that is currently selected for input is highlighted. Each time you input a
coefficient, the highlighting shifts in the sequence:a1 → b1 → c1→… an → bn → cn → (n = 2 to 6)
You can also input fractions and values assigned to variables as coefficients.
You can cancel the value you are inputting for the current coefficient by pressingJ
at any time before you pressw to store the coefficient value. This returns to the
coefficient to what it was before you input anything. You can then input another value if
you want.
To change the value of a coefficient that you already stored by pressingw, move the
cursor to the coefficient you want to edit. Next, input the value you want to change to.
Pressing3(CLR) clears all coefficients to zero.
4. Solve the equations.
…

8/20/2019 _Casio_fx9860GSD_9860G_E
http://slidepdf.com/reader/full/casiofx9860gsd9860ge 165/595
20050401
4-1-2 Simultaneous Linear Equations
○ ○ ○ ○ ○
Example To solve the following simultaneous linear equations for x, y, and z
4 x + y – 2 z = – 1
x + 6 y + 3 z = 1– 5 x + 4 y + z = – 7
Procedure
1m EQUA
21(SIML)
2(3)
3 ewbw-cw-bw
bwgwdwbw
-fwewbw-hw
41(SOLV)
Result Screen
# Internal calculations are performed using a 15-
digit mantissa, but results are displayed using
a 10-digit mantissa and a 2-digit exponent.
# Simultaneous linear equations are solved by
inverting the matrix containing the coefficients
of the equations. For example, the following
shows the solution ( x 1, x 2, x 3) of a simultane-
ous linear equation with three unknowns.
x 1 a1 b1 c1–1 d 1
x 2 = a2 b2 c2 d 2
x 3 a3 b3 c3 d 3
Because of this, precision is reduced as the
value of the determinant approaches zero. Also,
simultaneous equations with three or more
unknowns may take a very long time to solve.
# An error occurs if the calculator is unable to find
a solution.
# After calculation is complete, you can press
1 (REPT), change coefficient values, and then
re-calculate.

8/20/2019 _Casio_fx9860GSD_9860G_E
http://slidepdf.com/reader/full/casiofx9860gsd9860ge 166/595
20050401
4-2-1Quadratic and Cubic Equations
# Internal calculations are performed using a
15-digit mantissa, but results are displayed
using a 10-digit mantissa and a 2-digit
exponent.
# It may take considerable time for the
calculation result of cubic equations to
appear on the display.
# An error occurs if the calculator is unable to find
a solution.
# After calculation is complete, you can press
1(REPT), change coefficient values, and then
re-calculate.
4-2 Quadratic and Cubic Equations
Description
You can use this calculator to solve quadratic equations and cubic equations.
• Quadratic Equation:ax 2 + bx + c = 0 (a ≠ 0)
• Cubic Equation:ax 3 + bx 2 + cx + d = 0 (a ≠ 0)
Set Up
1. From the Main Menu, enter the EQUA mode.
Execution2. Select the POLY (higher degree equation) mode, and specify the degree of the
equation.
You can specify a degree 2 or 3.
3. Sequentially input the coefficients.
The cell that is currently selected for input is highlighted. Each time you input a
coefficient, the highlighting shifts in the sequence:
a → b → c → …
You can also input fractions and values assigned to variables as coefficients.
You can cancel the value you are inputting for the current coefficient by pressingJat any time before you pressw to store the coefficient value. This returns to the
coefficient to what it was before you input anything. You can then input another value if
you want.
To change the value of a coefficient that you already stored by pressingw, move the
cursor to the coefficient you want to edit. Next, input the value you want to change to.
Pressing3(CLR) clears all coefficients to zero.
4. Solve the equations.

8/20/2019 _Casio_fx9860GSD_9860G_E
http://slidepdf.com/reader/full/casiofx9860gsd9860ge 167/595

8/20/2019 _Casio_fx9860GSD_9860G_E
http://slidepdf.com/reader/full/casiofx9860gsd9860ge 168/595
20050401
4-3-1
Solve Calculations
4-3 Solve Calculations
Description
The Solve Calculation mode lets you determine the value of any variable in a formula without
having to solve the equation.
Set Up
1. From the Main Menu, enter the EQUA mode.
Execution
2. Select the Solve Calculation mode, and input the equation as it is written.
If you do not input an equals sign, the calculator assumes that the expression is to the
left of the equals sign, and there is a zero to the right. *1
3. In the table of variables that appears on the display, input values for each variable.
You can also specify values for Upper and Lower to define the upper and lower limits of
the range of solutions. *2
4. Select the variable for which you want to solve to obtain the solution.
“Lft” and “Rgt” indicate the left and right sides that are calculated using the solution.*3
*1An error occurs if you input more than one equals
sign.
*2An error occurs if the solution falls outside the
range you specify.
*3Solutions are approximated using Newton’s
method. Lft and Rgt values are displayed for
confirmation, because Newton’s method may
produce results that are the real solution.The closer the difference between the Lft
and Rgt values is to zero, the lower degree
of error in the result.
# The message “Retry” appears on the display
when the calculator judges that convergence is
not sufficient for the displayed results.
# A Solve operation will produce a single solution.
Use POLY when you want to obtain multiple
solutions for a high-order equation (such as
ax 2 + bx + c = 0).
20060601

8/20/2019 _Casio_fx9860GSD_9860G_E
http://slidepdf.com/reader/full/casiofx9860gsd9860ge 169/595
20050401
4-3-2 Solve Calculations
○ ○ ○ ○ ○
Example An object thrown into the air at initial velocity V takes time T to reach
height H. Use the following formula to solve for initial velocity V when
H = 14 (meters), T = 2 (seconds) and gravitational acceleration is G =
9.8 (m/s2).
H = VT – 1/2 GT2
Procedure
1m EQUA
23(SOLV)
aM(H)!.(=)ac(V)a/(T)-(b/c)
a$(G)a/(T)xw
3 bew(H = 14)
aw(V = 0)
cw(T = 2)
j.iw(G = 9.8)
4 Pressfff to highlight V = 0, and then press6(SOLV).
Result Screen

8/20/2019 _Casio_fx9860GSD_9860G_E
http://slidepdf.com/reader/full/casiofx9860gsd9860ge 170/595
20050401
4-4 What to Do When an Error Occurs
uError during coefficient value input
Press theJ key to clear the error and return to the value that was registered for the
coefficient before you input the value that generated the error. Try inputting a new value
again.
uError during calculation
Press theJ key to clear the error and display the coefficient. Try inputting values for the
coefficients again.
4-4-1What to Do When an Error Occurs
kkkkkClearing Equation Memories
1. Enter the equation calculation mode (SIML or POLY) you want to use and
perform the function key operation required for that mode.
• In the case of the SIML mode (1), use the function keys to specify the number
of unknowns.
• In the case of the POLY mode (2), use the function keys to specify the degreeof the polynomial.
• If you pressed3(SOLV), advance directly to step 2.
2. Press2(DEL).
3. Press1(Yes) to delete the applicable equation memories or6(No) to abort
the operation without deleting anything.

8/20/2019 _Casio_fx9860GSD_9860G_E
http://slidepdf.com/reader/full/casiofx9860gsd9860ge 171/595
20050401
GraphingSections 5-1 and 5-2 of this chapter provide basic information
you need to know in order to draw a graph. The remaining
sections describe more advanced graphing features and functions.
Select the icon in the Main Menu that suits the type of graph you
want to draw or the type of table you want to generate.• GRAPH … General function graphing
• CONICS … Conic section graphing
(5-1-5 ~ 5-1-6, 5-11-17~5-11-22)
• RUN · MAT … Manual graphing (5-6-1 ~ 5-6-4)
• TABLE … Number table generation (5-7-1 ~ 5-7-16)
• DYNA … Dynamic Graph (5-8-1 ~ 5-8-8)
• RECUR … Recursion graphing or number table generation(5-9-1 ~ 5-9-10)
5-1 Sample Graphs5-2 Controlling What Appears on a Graph Screen
5-3 Drawing a Graph
5-4 Storing a Graph in Picture Memory
5-5 Drawing Two Graphs on the Same Screen
5-6 Manual Graphing
5-7 Using Tables
5-8 Dynamic Graphing
5-9 Graphing a Recursion Formula
5-10 Changing the Appearance of a Graph
5-11 Function Analysis
Chapter
5

8/20/2019 _Casio_fx9860GSD_9860G_E
http://slidepdf.com/reader/full/casiofx9860gsd9860ge 172/595
20050401
5-1-1Sample Graphs
5-1 Sample Graphs
kkkkkHow to draw a simple graph (1)
Description
To draw a graph, simply input the applicable function.
Set Up
1. From the Main Menu, enter the GRAPH mode.
Execution2. Input the function you want to graph.
Here you would use the V-Window to specify the range and other parameters of the
graph. See 5-2-1.
3. Draw the graph.

8/20/2019 _Casio_fx9860GSD_9860G_E
http://slidepdf.com/reader/full/casiofx9860gsd9860ge 173/595
20050401
5-1-2 Sample Graphs
○ ○ ○ ○ ○
Example To graph y = 3 x2
Procedure
1m GRAPH
2 dvxw
36(DRAW) (orw)
Result Screen
# PressingA while a graph is on the display
will return to the screen in step 2.

8/20/2019 _Casio_fx9860GSD_9860G_E
http://slidepdf.com/reader/full/casiofx9860gsd9860ge 174/595
20050401
5-1-3 Sample Graphs
kkkkkHow to draw a simple graph (2)
Description
You can store up to 20 functions in memory and then select the one you want for graphing.
Set Up
1. From the Main Menu, enter the GRAPH mode.
Execution
2. Specify the function type and input the function whose graph you want to draw.
You can use the GRAPH mode to draw a graph for the following types of expressions:
rectangular coordinate expression, polar coordinate expression, parametric function,
X = constant expression, inequality.
3(TYPE)1(Y=) ... rectangular coordinates
2(r =) ... polar coordinates
3(Parm) ... parametric function
4(X=c) ... X = constant function
5(CONV)1('Y=)~5('Y≤) ... changes the function type
6(g)1(Y>)~4(Y≤) ... inequality
Repeat this step as many times as required to input all of the functions you want.
Next you should specify which of the functions among those that are stored in memoryyou want to graph (see 5-3-6). If you do not select specific functions here, the graph
operation will draw graphs of all the functions currently stored in memory.
3. Draw the graph.

8/20/2019 _Casio_fx9860GSD_9860G_E
http://slidepdf.com/reader/full/casiofx9860gsd9860ge 175/595
20050401
5-1-4 Sample Graphs
○ ○ ○ ○ ○
Example Input the functions shown below and draw their graphs
Y1 = 2 x2 – 3, r2 = 3sin2θ
Procedure
1m GRAPH
23(TYPE)1(Y=)cvx-dw
3(TYPE)2(r =)dscvw
36(DRAW)
Result Screen
(Parametric) (Inequality)

8/20/2019 _Casio_fx9860GSD_9860G_E
http://slidepdf.com/reader/full/casiofx9860gsd9860ge 176/595
20050401
5-1-5 Sample Graphs
kkkkkHow to draw a simple graph (3)
Description
Use the following procedure to graph the function of a parabola, circle, ellipse, or hyperbola.
Set Up
1. From the Main Menu, enter the CONICS mode.
Execution
2. Use the cursorfc keys to specify one of the function type as follows.
3. Input values for the required variables.
4. Graph the function.
Graph Type Function
Parabola X = A (Y – K)2 + H
X = AY2 + BY + C
Y = A (X – H)2 + K
Y = AX2 + BX + C
Circle (X – H)2 + (Y – K)2 = R2
AX2 + AY2 + BX + CY + D = 0
Ellipse (X – H)2 (Y – K)2
–––––––– + –––––––– = 1A2 B2
Hyperbola (X – H)2 (Y – K)2
–––––––– – –––––––– = 1A2 B2
(Y – K)2 (X – H)2
–––––––– – –––––––– = 1A2 B2

8/20/2019 _Casio_fx9860GSD_9860G_E
http://slidepdf.com/reader/full/casiofx9860gsd9860ge 177/595
20050401
5-1-6 Sample Graphs
○ ○ ○ ○ ○
Example Graph the circle (X–1)2 + (Y–1)2 = 22
Procedure
1m CONICS
2ccccw
3 bwbwcw
46(DRAW)
Result Screen
(Parabola) (Ellipse) (Hyperbola)

8/20/2019 _Casio_fx9860GSD_9860G_E
http://slidepdf.com/reader/full/casiofx9860gsd9860ge 178/595
20050401
kkkkkHow to draw a simple graph (4)
Description
You can specify the graph line style, if you want.
Set Up
1. From the Main Menu, enter the GRAPH mode.
Execution
2. Input the function you want to graph.
Here you would use the V-Window to specify the range and other parameters of the
graph. See 5-2-1.
3. Select the line style.
4(STYL)1( ) … Normal (initial default)
2( ) … Thick (twice the thickness of Normal)
3( ) … Broken (thick broken)
4( ) … Dot (dotted)
4. Draw the graph.
The line style selection is valid only when “Connect” is selected for “Draw Type” on the Setup
screen.
5-1-7 Sample Graphs
# The initial default line setting for an inequality
(Y>, Y<) is dot plot type.
# You can change the graph line style while in the
GRAPH, TABLE or RECUR mode.

8/20/2019 _Casio_fx9860GSD_9860G_E
http://slidepdf.com/reader/full/casiofx9860gsd9860ge 179/595
20050401
○ ○ ○ ○ ○
Example To graph y = 3 x2
Procedure
1m GRAPH
23(TYPE)1(Y=)dvxw
3f4(STYL)3( )J
46(DRAW) (orw)
Result Screen
(Normal) (Thick) (Dotted)
5-1-8 Sample Graphs

8/20/2019 _Casio_fx9860GSD_9860G_E
http://slidepdf.com/reader/full/casiofx9860gsd9860ge 180/595
20050401
5-2 Controlling What Appears on a Graph Screen
kkkkk V-Window (View Window) Settings
Use the View Window to specify the range of the x - and y-axes, and to set the spacing
between the increments on each axis. You should always set the V-Window parameters you
want to use before graphing.
u To make V-Window settings
1. From the Main Menu, enter the GRAPH mode.
2. Press!3(V-WIN) to display the V-Window setting screen.
Rectangular coordinate parameter
Xmin … Minimum x -axis value
Xmax … Maximum x -axis value
Xscale … Spacing of x -axis increments
Xdot … Value that corresponds to one x -axis dot
Ymin … Minimum y-axis value
Ymax … Maximum y-axis value
Yscale … Spacing of y-axis incrementsPolar coordinate parameter
Tθ min ... T, θ minimum values
Tθ max ... T, θ maximum values
Tθ ptch ... T, θ pitch
3. Pressc to move the highlighting and input an appropriate value for each parameter,
pressingw after each.
• {INIT} / {TRIG} / {STD} … V-Window {initial settings}/{initial settings using specified
angle unit}/{standardized settings}
• {STO} / {RCL} … V-Window setting {store}/{recall}
After settings are the way you want them, pressJ or!J(QUIT) to exit the V-Window
setting screen.*1
5-2-1Controlling What Appears on a Graph Screen
*1Pressingw without inputting anything while
k is displayed exits the V-Window setting
screen.

8/20/2019 _Casio_fx9860GSD_9860G_E
http://slidepdf.com/reader/full/casiofx9860gsd9860ge 181/595
20050401
5-2-2 Controlling What Appears on a Graph Screen
uV-Window Setting Precautions
• Inputting zero for Tθ ptch causes an error.
• Any illegal input (out of range value, negative sign without a value, etc.) causes an error.• When Tθ max is less than Tθ min, Tθ ptch becomes negative.
• You can input expressions (such as 2π) as V-Window parameters.
• When the V-Window setting produces an axis that does not fit on the display, the
scale of the axis is indicated on the edge of the display closest to the origin.
• Changing the V-Window settings clears the graph currently on the display and
replaces it with the new axes only.
• Changing the Xmin or Xmax value causes the Xdot value to be adjusted automatically.
Changing the Xdot value causes the Xmax value to be adjusted automatically.
• A polar coordinate (r =) or parametric graph will appear coarse if the settings youmake in the V-Window cause the Tθ ptch value to be too large, relative to the
differential between the Tθ min and Tθ max settings. If the settings you make cause
the Tθ ptch value to be too small relative to the differential between the Tθ min and Tθ
max settings, on the other hand, the graph will take a very long time to draw.
• The following is the input range for V-Window parameters.
–9.999999999E 97 to 9.999999999E 97

8/20/2019 _Casio_fx9860GSD_9860G_E
http://slidepdf.com/reader/full/casiofx9860gsd9860ge 182/595
20050401
kkkkk Initializing and Standardizing the V-Window
u To initialize the V-Window
1. From the Main Menu, enter the GRAPH mode.
2. Press!3(V-WIN).
This displays the V-Window setting screen.
3. Press1(INIT) to initialize the V-Window.
Xmin = –6.3, Xmax = 6.3, Xscale = 1, Xdot = 0.1
Ymin = –3.1, Ymax = 3.1, Yscale = 1
Tθ min = 0, Tθ max = 2π (rad), Tθ ptch = 2π /100 (rad)
u To initialize the V-Window in accordance with an angle unit
In step 3 of the procedure under “To initialize the V-Window” above, press2(TRIG) to
initialize the V-Window in accordance with an angle unit.
Xmin = –3π (rad), Xmax = 3π (rad), Xscale = π /2 (rad), Xdot = π /21 (rad),
Ymin = –1.6, Ymax = 1.6, Yscale = 0.5
u To standardize the V-Window
The following are the standard V-Window settings of this calculator.
Xmin = –10, Xmax = 10, Xscale = 1, Xdot = 0.15873015
Ymin = –10, Ymax = 10, Yscale = 1
Tθ min = 0, Tθ max = 2π (rad), Tθ ptch = 2π /100 (rad)
In step 3 of the procedure under “To initialize the V-Window” above, press3(STD) to
standardize V-Window settings in accordance with the above.
5-2-3 Controlling What Appears on a Graph Screen
# Initialization and standardization cause Tθ
min, Tθ max, Tθ ptch values to change
automatically in accordance with the current
angle unit setting as shown below.
Deg mode:
Tθ min = 0, Tθ max = 360, Tθ ptch = 3.6
Gra mode:
Tθ min = 0, Tθ max = 400, Tθ ptch = 4

8/20/2019 _Casio_fx9860GSD_9860G_E
http://slidepdf.com/reader/full/casiofx9860gsd9860ge 183/595
20050401
kkkkk V-Window Memory
You can store up to six sets of V-Window settings in V-Window memory for recall when you
need them.
u To store V-Window settings
1. From the Main Menu, enter the GRAPH mode.
2. Press!3(V-WIN) to display the V-Window setting screen, and input the values you
want.
3. Press4(STO) to display the pop-up window.
4. Press a number key to specify the V-Window memory where you want to save the
settings, and then pressw. Pressingbw stores the settings in V-Window Memory1 (V-Win1).
u To recall V-Window memory settings
1. From the Main Menu, enter the GRAPH mode.
2. Press!3(V-WIN) to display the V-Window setting screen.
3. Press5(RCL) to display the pop-up window.
4. Press a number key to specify the V-Window memory number for the settings you want
to recall, and then pressw. Pressingbw recalls the settings in V-Window Memory1 (V-Win1).
5-2-4 Controlling What Appears on a Graph Screen
# Storing V-Window settings to a memory that
already contains setting data replaces the
previous data with the new settings.
# Recalling settings causes the current V-Window
settings to be replaced with those recalled from
memory.

8/20/2019 _Casio_fx9860GSD_9860G_E
http://slidepdf.com/reader/full/casiofx9860gsd9860ge 184/595
20050401
kkkkk Specifying the Graph Range
Description
You can define a range (start point, end point) for a function before graphing it.
Set Up
1. From the Main Menu, enter the GRAPH mode.
2. Make V-Window settings.
Execution
3. Specify the function type and input the function. The following is the syntax for function
input.
Function,!+( [ )Start Point, End Point!-( ] )
4. Draw the graph.
5-2-5 Controlling What Appears on a Graph Screen

8/20/2019 _Casio_fx9860GSD_9860G_E
http://slidepdf.com/reader/full/casiofx9860gsd9860ge 185/595
20050401
5-2-6 Controlling What Appears on a Graph Screen
○ ○ ○ ○ ○
Example Graph y = x2 + 3 x – 2 within the range – 2 < x < 4
Use the following V-Window settings.
Xmin = – 3, Xmax = 5, Xscale = 1Ymin = –10, Ymax = 30, Yscale = 5
Procedure
1m GRAPH
2!3(V-WIN)
-dwfwbwc
-bawdawfwJ
33(TYPE)1(Y=)vx+dv-c,
!+( [ )-c,e!-( ] )w
46(DRAW)
Result Screen
# You can specify a range when graphing
rectangular expressions, polar expressions,
parametric functions, and inequalities.

8/20/2019 _Casio_fx9860GSD_9860G_E
http://slidepdf.com/reader/full/casiofx9860gsd9860ge 186/595
20050401
5-2-7 Controlling What Appears on a Graph Screen
kkkkk Zoom
Description
This function lets you enlarge and reduce the graph on the screen.
Set Up
1. Draw the graph.
Execution
2. Specify the zoom type.
!2(ZOOM)1(BOX) ... Box zoom
Draw a box around a display area, and that area is enlarged to
fill the entire screen.
2(FACT)
3(IN)/ 4(OUT) ... Factor zoom
The graph is enlarged or reduced in accordance with the factor
you specify, centered on the current pointer location.
5(AUTO) ... Auto zoom
V-Window y-axis settings are automatically adjusted so the
graph fills the screen along the y-axis.
6(g)1(ORIG) ... Original size
Returns the graph to its original size following a zoom opera-
tion.
6(g)2(SQR) ... Graph correction
V-Window x -axis values are corrected so they are identical to
the y-axis values.
6(g)3(RND) ... Coordinate rounding
Rounds the coordinate values at the current pointer location.
6(g)4(INTG) ... Integer
Each dot is given a width of 1, which makes coordinate values
integers.
6(g)5(PRE) ... Previous
V-Window parameters are returned to what they were prior to
the last zoom operation.
Box zoom range specification
3. Use the cursor keys to move the pointer ( ) in the center of the screen to the location
where you want one corner of the box to be, and then pressw.
4. Use the cursor keys to move the pointer. This causes a box to appear on the screen.
Move the cursor until the area you want to enlarge is enclosed in the box, and then
pressw to enlarge it.

8/20/2019 _Casio_fx9860GSD_9860G_E
http://slidepdf.com/reader/full/casiofx9860gsd9860ge 187/595

8/20/2019 _Casio_fx9860GSD_9860G_E
http://slidepdf.com/reader/full/casiofx9860gsd9860ge 188/595
20050401
5-2-9 Controlling What Appears on a Graph Screen
kkkkk Factor Zoom
Description
With factor zoom, you can zoom in or out, centered on the current cursor position.
Set Up
1. Draw the graph.
Execution
2. Press!2(ZOOM)2(FACT) to open a pop-up window for specifying the x -axis
and y-axis zoom factor. Input the values you want and then pressJ.
3. Press!2(ZOOM)3(IN) to enlarge the graph, or!2(ZOOM)4(OUT) to
reduce it. The graph is enlarged or reduced centered on the current pointer location.
4. Use the cursor keys to move the cursor to the point upon which you want the zoom
operation to be centered, and then pressJ to zoom.

8/20/2019 _Casio_fx9860GSD_9860G_E
http://slidepdf.com/reader/full/casiofx9860gsd9860ge 189/595
20050401
5-2-10 Controlling What Appears on a Graph Screen
○ ○ ○ ○ ○
Example Enlarge the graphs of the two expressions shown below five times on
both the x- and y-axis to see if they are tangent.
Y1 = ( x + 4)( x + 1)( x – 3), Y2 = 3 x + 22
Use the following V-Window settings.
Xmin = –8, Xmax = 8, Xscale = 1
Ymin = –30, Ymax = 30, Yscale = 5
Procedure
1m
GRAPH
!3(V-WIN)-iwiwbwc
-dawdawfwJ
3(TYPE)1(Y=)(v+e)(v+b)
(v-d)w
dv+ccw
6(DRAW)
2!2(ZOOM)2(FACT)fwfwJ
3!2(ZOOM)3(IN)
4f~f,d~dw
Result Screen
# You can repeat factor zoom to enlarge or
reduce a graph even further.
20050601

8/20/2019 _Casio_fx9860GSD_9860G_E
http://slidepdf.com/reader/full/casiofx9860gsd9860ge 190/595
20050401
5-3-1Drawing a Graph
5-3 Drawing a Graph
You can store up to 20 functions in memory. Functions in memory can be edited, recalled,
and graphed.
kkkkk Specifying the Graph Type
Before you can store a graph function in memory, you must first specify its graph type.
1. While the Graph relation list is on the display, press3(TYPE) to display the graph
type menu, which contains the following items.
• {Y=} / {r=} / {Parm} / {X=c} ... {rectangular coordinate}/{polar coordinate}/{parametric}/
{X=constant}*1 graph
• {Y>} / {Y<} / {Yttttt} / {Yss
sss} ... {Y> f ( x )}/{Y< f ( x )}/{Y
> f ( x )}/{Y
< f ( x )} inequality graph
• {CONV}
• {'Y=} / {'Y>} / {'Y<} / {'Yttttt} / {'Ysssss}
... {changes the function type of the selected expression}
2. Press the function key that corresponds to the graph type you want to specify.
kkkkk Storing Graph Functions
u To store a rectangular coordinate function (Y=) *2
○ ○ ○ ○ ○
Example To store the following expression in memory area Y1 : y = 2 x2 – 5
3(TYPE)1(Y=) (Specifies rectangular coordinate expression.)
cvx-f(Inputs expression.)
w (Stores expression.)
*1 Attempting to draw a graph for an expressionin which X is input for an X = constantexpression results in an error.
*2A function cannot be stored into a memory area thatalready contains a function of a different type fromthe one you are trying to store. Select a memoryarea that contains a function that is the same typeas the one you are storing, or delete the function inthe memory area to which you are trying to store.

8/20/2019 _Casio_fx9860GSD_9860G_E
http://slidepdf.com/reader/full/casiofx9860gsd9860ge 191/595
20050401
5-3-2 Drawing a Graph
u To store a polar coordinate function ( r=) *1
○ ○ ○ ○ ○
Example To store the following expression in memory area r2 : r = 5 sin3θ
3(TYPE)2(r =) (Specifies polar coordinate expression.)
fsdv(Inputs expression.)
w(Stores expression.)
u To store a parametric function *2
○ ○ ○ ○ ○
Example To store the following functions in memory areas Xt3 and Yt3 :
x = 3 sin T y = 3 cos T
3(TYPE)3(Parm) (Specifies parametric expression.)
dsvw(Inputs and stores x expression.)
dcvw(Inputs and stores y expression.)
*1A function cannot be stored into a memory area
that already contains a function of a differenttype from the one you are trying to store. Selecta memory area that contains a function that isthe same type as the one you are storing, ordelete the function in the memory area to which
you are trying to store.
*2You will not be able to store the expression in an
area that already contains a rectangular
coordinate expression, polar coordinateexpression, X = constant expression or inequality.
Select another area to store your expression or
delete the existing expression first.

8/20/2019 _Casio_fx9860GSD_9860G_E
http://slidepdf.com/reader/full/casiofx9860gsd9860ge 192/595
20050401
5-3-3 Drawing a Graph
u To store an X = constant expression *1
○ ○ ○ ○ ○
Example To store the following expression in memory area X4 :
X = 3
3(TYPE)4(X=c) (Specifies X = constant expression.)
d(Inputs expression.)
w(Stores expression.)
• Inputting X, Y, T, r , or θ for the constant in the above procedures causes an error.
u To store an inequality *1
○ ○ ○ ○ ○
Example To store the following inequality in memory area Y5 :
y > x2 – 2 x – 6
3(TYPE)6(g)1(Y>) (Specifies an inequality.)
vx-cv-g(Inputs expression.)
w(Stores expression.)
u To create a composite function
○ ○ ○ ○ ○
Example To use relations in Y1 and Y2 to create composite functions for Y3
and Y4
Y1= (X + 1), Y2 = X2 + 3
Assign Y1°Y2 to Y3, and Y2°Y1 to Y4.
(Y1°Y2 = ((x2 + 3) +1) = (x2 + 4) Y2°Y1 = ( (X + 1)) 2 + 3 = X + 4 (X –1))
Input relations into Y3 and Y4.
3(TYPE)1(Y=)J4(GRPH)
1(Y)b(1(Y)c)w
J4(GRPH)1(Y)c
(1(Y)b)w
• A composite function can consist of up to five functions.
*1A function cannot be stored into a memoryarea that already contains a function of a
different type from the one you are trying to
store. Select a memory area that contains a
function that is the same type as the one you arestoring, or delete the function in the memory area to
which you are trying to store.
20050901

8/20/2019 _Casio_fx9860GSD_9860G_E
http://slidepdf.com/reader/full/casiofx9860gsd9860ge 193/595
20050401
u To assign values to the coefficients and variables of a graph function
○ ○ ○ ○ ○
Example To assign the values –1, 0, and 1 to variable A in Y = AX
2
–1, and draw agraph for each value
3(TYPE)1(Y=)
av(A)vx-bw
J4(GRPH)1(Y)b(av(A)
!.(=)-b)w
J4(GRPH)1(Y)b(av(A)
!.(=)a)w
J4(GRPH)1(Y)b(av(A)
!.(=)b)w
ffff1(SEL)
6(DRAW)
The above three screens are produced using the Trace function.
See “5-11 Function Analysis” for more information.
5-3-4 Drawing a Graph
20050901

8/20/2019 _Casio_fx9860GSD_9860G_E
http://slidepdf.com/reader/full/casiofx9860gsd9860ge 194/595

8/20/2019 _Casio_fx9860GSD_9860G_E
http://slidepdf.com/reader/full/casiofx9860gsd9860ge 195/595
20050401
kkkkk Editing and Deleting Functions
u To edit a function in memory ○ ○ ○ ○ ○
Example To change the expression in memory area Y1 from y = 2 x2 – 5 to
y = 2 x2 – 3
e (Displays cursor.)
eeeeeDd(Changes contents.)
w(Stores new graph function.)
u To change the line style of a graph function
1. On the Graph relation list screen, usef andc to highlight the relation whose line
style you want to change.
2. Press4(STYL).
3. Select the line style.
○ ○ ○ ○ ○
Example To change the line style of y = 2 x2 – 3, which is stored in area Y1, to
“Broken”.
4(STYL)3( ) (Selects “Broken”.)
5-3-6 Drawing a Graph
…→

8/20/2019 _Casio_fx9860GSD_9860G_E
http://slidepdf.com/reader/full/casiofx9860gsd9860ge 196/595
20050401
u To change the type of a function*1
1. While the Graph relation list is on the display, pressf orc to move the highlighting
to the area that contains the function whose type you want to change.
2. Press3(TYPE)5(CONV).
3. Select the function type you want to change to.
○ ○ ○ ○ ○
Example To change the function in memory area Y1 from y = 2 x2 – 3 to
y < 2 x2 – 3
3(TYPE)5(CONV)3('''''Y<) (Changes the function type to “Y<”.)
u To delete a function1. While the Graph relation list is on the display, pressf orc to move the highlighting
to the area that contains the function you want to delete.
2. Press2(DEL) orD.
3. Press1(Yes) to delete the function or6(No) to abort the procedure without deleting
anything.
5-3-7 Drawing a Graph
*1The function type can be changed for
rectangular coordinate functions and
inequalities only.
# Parametric functions come in pairs (Xt and Yt).

8/20/2019 _Casio_fx9860GSD_9860G_E
http://slidepdf.com/reader/full/casiofx9860gsd9860ge 197/595
2006100120070101
k Selecting Functions for Graphing
u To specify the draw/non-draw status of a graph
1. On the graph relation list, usef andc to highlight the relation you do not want to
graph.
2. Press1(SEL).
• Each press of1(SEL) toggles graphing on and off.
3. Press6(DRAW).
Example To select the following functions for drawing :
Y1 = 2 x
2
– 5, r 2 = 5 sin3θ Use the following V-Window settings.
Xmin = –5, Xmax = 5, Xscale = 1
Ymin = –5, Ymax = 5, Yscale = 1
Tθ min = 0, Tθ max = π , Tθ ptch = 2π / 60
cf (Select a memory area that contains a function
for which you want to specify non-draw.)
1(SEL) (Specifies non-draw.)
6(DRAW) orw (Draws the graphs.)
• You can use the Setup screen settings to alter the appearance of the graph screen as
shown below.
• Grid: On (Axes: On Label: Off)
This setting causes dots to appear at the grid
intersects on the display.
• Axes: Off (Label: Off Grid: Off)
This setting clears the axis lines from the display.
• Label: On (Axes: On Grid: Off)
This setting displays labels for the x- and y-axes.
5-3-8 Drawing a Graph

8/20/2019 _Casio_fx9860GSD_9860G_E
http://slidepdf.com/reader/full/casiofx9860gsd9860ge 198/595
20050401
kkkkkGraph Memory
Graph memory lets you store up to 20 sets of graph function data and recall it later when you
need it.A single save operation saves the following data in graph memory.
• All graph functions in the currently displayed Graph relation list (up to 20)
• Graph types
• Function graph line information
• Draw/non-draw status
• V-Window settings (1 set)
u To store graph functions in graph memory
1. Press5(GMEM)1(STO) to display the pop-up window.
2. Press a number key to specify the Graph memory where you want to save the graph
function, and then pressw. Pressingbw stores the graph function to Graph
Memory 1 (G-Mem1).
• There are 20 graph memories numbered G-Mem1 to G-Mem20.
u To recall a graph function
1. Press5(GMEM)2(RCL) to display the pop-up window.
2. Press a number key to specify the Graph memory for the function you want to recall,
and then pressw. Pressingbw recalls the graph function in Graph Memory 1
(G-Mem1).
5-3-9 Drawing a Graph
# Storing a function in a memory area that
already contains a function replaces theexisting function with the new one.
# If the data exceeds the calculator’s remaining
memory capacity, an error occurs.
# Recalling data from graph memory causes any
data currently on the Graph relation list to bedeleted.

8/20/2019 _Casio_fx9860GSD_9860G_E
http://slidepdf.com/reader/full/casiofx9860gsd9860ge 199/595
20050401
5-4 Storing a Graph in Picture Memory
You can save up to 20 graphic images in picture memory for later recall. You can overdraw
the graph on the screen with another graph stored in picture memory.
u To store a graph in picture memory
1. After graphing in GRAPH mode, press K1(PICT)1(STO) to display the pop-up
window.
2. Press a number key to specify the Picture memory where you want to save the picture,
and then pressw. Pressingbw stores the picture function to Picture Memory 1
(Pict 1).
• There are 20 picture memories numbered Pict 1 to Pict 20.
u To recall a stored graph
1. After graphing in GRAPH mode, press K1(PICT)2(RCL) to display the pop-up
window.
2. Press a number key to specify the Picture memory for the picture you want to recall,
and then pressw. Pressingbw recalls the picture function in Picture Memory 1
(Pict 1).
• Recalling picture memory contents causes the currently displayed graph to beoverwritten.
• Use the sketch Cls function (page 5-10-1) to clear a graph that was recalled from
picture memory.
5-4-1Storing a Graph in Picture Memory
# Storing a graphic image in a memory area that
already contains a graphic image replaces the
existing graphic image with the new one.
# A dual graph screen or any other type of graph
that uses a split screen cannot be saved in
picture memory.

8/20/2019 _Casio_fx9860GSD_9860G_E
http://slidepdf.com/reader/full/casiofx9860gsd9860ge 200/595
20050401
5-5 Drawing Two Graphs on the Same Screen
kkkkkCopying the Graph to the Sub-screen
Description
Dual Graph lets you split the screen into two parts. Then you can graph two different
functions in each for comparison, or draw a normal size graph on one side and its enlarged
version on the other side. This makes Dual Graph a powerful graph analysis tool.
With Dual Graph, the left side of the screen is called the “main screen,” while the right side is
called the “sub-screen.”
uuuuu Main ScreenThe graph in the main screen is actually drawn from a function.
uuuuu Sub-screen
The graph on the sub-screen is produced by copying or zooming the main screen graph.
You can even make different V-Window settings for the sub-screen and main screen.
Set Up
1. From the Main Menu, enter the GRAPH mode.
2. On the Setup screen, select G+G for Dual Screen.3. Make V-Window settings for the main screen.
Press6(RIGHT) to display the sub-graph settings screen. Pressing6(LEFT)
returns to the main screen setting screen.
Execution
4. Store the function, and draw the graph in the main screen.
5. Perform the Dual Graph operation you want.
K1(COPY) ... Duplicates the main screen graph in the sub-screen
K2(SWAP) ... Swaps the main screen contents and sub-screen contents
5-5-1Drawing Two Graphs on the Same Screen

8/20/2019 _Casio_fx9860GSD_9860G_E
http://slidepdf.com/reader/full/casiofx9860gsd9860ge 201/595
20050401
○ ○ ○ ○ ○
Example Graph y = x( x + 1)( x – 1) in the main screen and sub-screen.
Use the following V-Window settings.
(Main Screen)Xmin = –2, Xmax = 2, Xscale = 0.5
Ymin = – 2, Ymax = 2, Yscale = 1
(Sub-screen)
Xmin = – 4, Xmax = 4, Xscale = 1
Ymin = – 3, Ymax = 3, Yscale = 1
Procedure
1m GRAPH
2!m(SET UP)cc1(G+G)J
3!3(V-WIN)-cwcwa.fwc
-cwcwbw
6(RIGHT)-ewewbwc
-dwdwbwJ
43(TYPE)1(Y=)v(v+b)(v-b)w
6(DRAW)
5 K1(COPY)
Result Screen
5-5-2 Drawing Two Graphs on the Same Screen
# PressingA while a graph is on the display
will return to the screen in step 4.

8/20/2019 _Casio_fx9860GSD_9860G_E
http://slidepdf.com/reader/full/casiofx9860gsd9860ge 202/595
20050401
kkkkkGraphing Two Different Functions
Description
Use the following procedure to graph different functions in the main screen and sub-screen.
Set Up
1. From the Main Menu, enter the GRAPH mode.
2. On the Setup screen, select G+G for Dual Screen.
3. Make V-Window settings for the main screen.
Press6(RIGHT) to display the sub-graph settings screen. Pressing6(LEFT)
returns to the main screen setting screen.
Execution
4. Store the functions for the main screen and sub-screen.
5. Select the function of the graph that you want to eventually have in the sub-screen.
6. Draw the graph in the main screen.
7. Swap the main screen and sub-screen contents.
8. Return to the function screen.
9. Select the function of the next graph you want in the main screen.
10. Draw the graph in the main screen.
5-5-3 Drawing Two Graphs on the Same Screen

8/20/2019 _Casio_fx9860GSD_9860G_E
http://slidepdf.com/reader/full/casiofx9860gsd9860ge 203/595
20050401
○ ○ ○ ○ ○
Example Graph y = x( x + 1)( x – 1) in the main screen, and y = 2 x2 – 3 in the sub-
screen.
Use the following V-Window settings.
(Main Screen)
Xmin = – 4, Xmax = 4, Xscale = 1
Ymin = – 5, Ymax = 5, Yscale = 1
(Sub-screen)
Xmin = –2, Xmax = 2, Xscale = 0.5
Ymin = – 2, Ymax = 2, Yscale = 1
Procedure1m GRAPH
2!m(SET UP)cc1(G+G)J
3!3(V-WIN)-ewewbwc
-fwfwbw
6(RIGHT)-cwcwa.fwc
-cwcwbwJ
43(TYPE)1(Y=)v(v+b)(v-b)w
cvx-dw5ff1(SEL)
66(DRAW)
7 K2(SWAP)
8A
91(SEL)
06(DRAW)
Result Screen
5-5-4 Drawing Two Graphs on the Same Screen

8/20/2019 _Casio_fx9860GSD_9860G_E
http://slidepdf.com/reader/full/casiofx9860gsd9860ge 204/595
20050401
kkkkkUsing Zoom to Enlarge the Sub-screen
Description
Use the following procedure to enlarge the main screen graph and then move it to the sub-screen.
Set Up
1. From the Main Menu, enter the GRAPH mode.
2. On the Setup screen, select G+G for Dual Screen.
3. Make V-Window settings for the main screen.
Execution
4. Input the function and draw the graph in the main screen.
5. Use Zoom to enlarge the graph, and then move it to the sub-screen.
5-5-5 Drawing Two Graphs on the Same Screen

8/20/2019 _Casio_fx9860GSD_9860G_E
http://slidepdf.com/reader/full/casiofx9860gsd9860ge 205/595
20050401
○ ○ ○ ○ ○
Example Draw the graph y = x( x + 1)( x – 1) in the main screen, and then use
Box Zoom to enlarge it.
Use the following V-Window settings.
(Main Screen)
Xmin = –2, Xmax = 2, Xscale = 0.5
Ymin = – 2, Ymax = 2, Yscale = 1
Procedure
1m GRAPH
2!m(SET UP)cc1(G+G)J
3!3(V-WIN)-cwcwa.fwc
-cwcwbwJ
43(TYPE)1(Y=)v(v+b)(v-b)w
6(DRAW)
5!2(ZOOM)1(BOX)
c~ce~ew
f~fd~dw
Result Screen
5-5-6 Drawing Two Graphs on the Same Screen

8/20/2019 _Casio_fx9860GSD_9860G_E
http://slidepdf.com/reader/full/casiofx9860gsd9860ge 206/595
2006100120070101
5-6-1Manual Graphing
5-6 Manual Graphing
k Rectangular Coordinate Graph
Description
Inputting the Graph command in the RUN • MAT mode enables drawing of rectangular
coordinate graphs.
Set Up
1. From the Main Menu, enter the RUN • MAT mode.
2. Make V-Window settings.
Execution
3. Input the commands for drawing the rectangular coordinate graph.
4. Input the function.
# Certain functions can be graphed easily using built-in function graphs.
# You can draw graphs of the following built-in scientific functions.
• Rectangular Coordinate Graph
• sin x
• cos x
• tan x
• sin
–1
x
• cos
–1
x
• tan–1 x • sinh x • cosh x • tanh x • sinh–1 x
• cosh–1 x • tanh–1 x •' x • x 2 • log x
• ln x • 10 x • e x • x –1 • 3' x
• Polar Coordinate Graph
• sin θ • cos θ • tan θ • sin–1 θ • cos–1 θ
• tan–1 θ • sinh θ • cosh θ • tanh θ • sinh–1 θ
• cosh–1 θ • tanh–1 θ •'θ • θ 2 • log θ
• lnθ • 10θ • eθ • θ
–1 • 3'θ
• Input for x and θ variables is not required for a built-in function.
• When inputting a built-in function, other operators or values cannot be input.
• Built-in function graph statements cannot be used as part of a multi-statement or in a program.
# V-Window settings are made automatically for built-in graphs.

8/20/2019 _Casio_fx9860GSD_9860G_E
http://slidepdf.com/reader/full/casiofx9860gsd9860ge 207/595
20050401
5-6-2 Manual Graphing
○ ○ ○ ○ ○
Example Graph y = 2 x2 + 3 x – 4
Use the following V-Window settings.
Xmin = –5, Xmax = 5, Xscale = 2Ymin = –10, Ymax = 10, Yscale = 5
Procedure
1m RUN • MAT
2!3(V-WIN)-fwfwcwc
-bawbawfwJ
3!4(SKTCH)1(Cls)w
5(GRPH)1(Y=)
4 cvx+dv-ew
Result Screen

8/20/2019 _Casio_fx9860GSD_9860G_E
http://slidepdf.com/reader/full/casiofx9860gsd9860ge 208/595
20050401
5-6-3 Manual Graphing
kkkkk Integration Graph
Description
Inputting the Graph command in the RUN • MAT mode enables graphing of functionsproduced by an integration calculation.
The calculation result is shown in the lower left corner of the display, and the calculation
range is cross plot type.
Set Up
1. From the Main Menu, enter the RUN • MAT mode.
2. Make V-Window settings.
Execution3. Input graph commands for the integration graph.
4. Input the function.

8/20/2019 _Casio_fx9860GSD_9860G_E
http://slidepdf.com/reader/full/casiofx9860gsd9860ge 209/595
20050401
5-6-4 Manual Graphing
○ ○ ○ ○ ○
Example Graph the integration ∫ ( x + 2)( x – 1)( x – 3) dx.
Use the following V-Window settings.
Xmin = – 4, Xmax = 4, Xscale = 1Ymin = –8, Ymax = 12, Yscale = 5
Procedure
1m RUN • MAT
2!3(V-WIN)-ewewbwc
-iwbcwfwJ
3!4(SKTCH)1(Cls)w
5(GRPH)5(G • ∫ dx)
4 (v+c)(v-b)(v-d),
-c,bw
Result Screen
1
–2

8/20/2019 _Casio_fx9860GSD_9860G_E
http://slidepdf.com/reader/full/casiofx9860gsd9860ge 210/595
20050401
5-6-5 Manual Graphing
kkkkkDrawing Multiple Graphs on the Same Screen
Description
Use the following procedure to assign various values to a variable contained in an expres-sion and overwrite the resulting graphs on the screen.
Set Up
1. From the Main Menu, enter the GRAPH mode.
2. On the Setup screen, change the “Dual Screen” setting to “Off”.
3. Make V-Window settings.
Execution
4. Specify the function type and input the function. The following is the syntax for function
input.
Expression containing one variable,!+( [ ) variable!.(=)
value, value, ..., value!-( ] )
5. Draw the graph.

8/20/2019 _Casio_fx9860GSD_9860G_E
http://slidepdf.com/reader/full/casiofx9860gsd9860ge 211/595
20050401
5-6-6 Manual Graphing
○ ○ ○ ○ ○
Example To graph y = A x2 – 3 as the value of A changes in the sequence 3, 1,
–1.
Use the following V-Window settings.
Xmin = – 5, Xmax = 5, Xscale = 1
Ymin = –10, Ymax = 10, Yscale = 2
Procedure
1m GRAPH
2!m(SET UP)cc3(Off)J
3!3(V-WIN)-fwfwbwc
-bawbawcwJ43(TYPE)1(Y=)av(A)vx-d,
!+( [ )av(A)!.(=)d,b,-b!-( ] )w
56(DRAW)
Result Screen
# The value of only one of the variables in the
expression can change.
# Any of the following cannot be used for the
variable name: X, Y, r , θ , T.
# You cannot assign a variable to the variable
inside the function.
# When Simul Graph is turned on, all of the
graphs for the specified variable values are
drawn simultaneously.
# Overwrite can be used when graphingrectangular expressions, polar expressions,
parametric functions, X = constant functions,
and inequalities.

8/20/2019 _Casio_fx9860GSD_9860G_E
http://slidepdf.com/reader/full/casiofx9860gsd9860ge 212/595
20050401
5-6-7 Manual Graphing
kkkkkUsing Copy and Paste to Graph a Function
Description
You can graph a function by copying it to the clipboard, and then pasting it into the graphscreen.
There are two types of functions you can paste into the graph screen.
Type 1 (Y= expression)
A function with the Y variable to the left of the equal sign is graphed as Y=
expression.
Example: To paste Y=X and graph it
• Any spaces to the left of Y are ignored.
Type 2 (expression)
Pasting this type of expression graphs Y= expression.
Example: To paste X and graph Y=X
• Any spaces to the left of the expression are ignored.
Set Up
1. Copy the function you want to graph to the clipboard.
2. From the Main Menu, enter the GRAPH mode.
3. On the Setup screen, change the “Dual Screen” setting to “Off”.
4. Make V-Window settings.
5. Draw the graph.
Execution
6. Paste the expression.
# Paste is supported only when “Off” is selected
for the “Dual Screen” setting on the Setup
screen.
# Though there is no limit per se on the number
of graphs you can draw by pasting a function,
the total number of graphs supported by traceand other functions is 30 (number of graphs
drawn using expression number 1 to 20, plus
graphs drawn using pasted functions).
# For the graph of a pasted function, the graph
expression that appears when using trace or
other functions is displayed in the format:
Y= expression.
# Re-executing a draw without clearing graph
screen memory will redraw all the graphs,including those produced by pasting functions.

8/20/2019 _Casio_fx9860GSD_9860G_E
http://slidepdf.com/reader/full/casiofx9860gsd9860ge 213/595
20050401
5-6-8 Manual Graphing
○ ○ ○ ○ ○
Example While the graph of y = 2 x2 + 3 x – 4 is currently displayed, to paste the
previously copied function Y=X from the clipboard
Use the following V-Window settings.
Xmin = – 5, Xmax = 5, Xscale = 2
Ymin = –10, Ymax = 10, Yscale = 5
Procedure
1m
RUN • MAT
a-(Y)!.(=)v
!i(CLIP)ddd1(COPY)
2mGRAPH
3!m(SET UP)cc3(Off)J
4!3(V-WIN)-fwfwcwc
-bawbawfwJ
53(TYPE)1(Y=)cvx+dv-ew
6(DRAW)
6!j(PASTE)
Result Screen

8/20/2019 _Casio_fx9860GSD_9860G_E
http://slidepdf.com/reader/full/casiofx9860gsd9860ge 214/595
20050401
5-7 Using Tables
To enter the TABLE mode, select the TABLE icon on the Main Menu.
k Storing a Function and Generating a Number Table
u To store a function
○ ○ ○ ○ ○
Example To store the function y = 3 x2 – 2 in memory area Y1
Usef andc to move the highlighting in the Table relation list to the memory area where
you want to store the function. Next, input the function and pressw to store it.
uVariable Specifications
There are two methods you can use to specify value for the variable x when generating a
numeric table.
• Table range method
With this method, you specify the conditions for the change in value of the variable.
• List
With this method, the data in the list you specify is substituted for the x -variable to
generate a number table.
u To generate a table using a table range
○ ○ ○ ○ ○
Example To generate a table as the value of variable x changes from –3 to 3, in
increments of 1
m TABLE5(SET)
-dwdwbw
The numeric table range defines the conditions under which the value of variable x changes
during function calculation.
Start............ Variable x start value
End ............. Variable x end valueStep ............ Variable x value change (interval)
After specifying the table range, pressJ to return to the Table relation list.
5-7-1Using Tables

8/20/2019 _Casio_fx9860GSD_9860G_E
http://slidepdf.com/reader/full/casiofx9860gsd9860ge 215/595
20050401
u To generate a table using a list
1. While the Table relation list is on the screen, display the Setup screen.
2. Highlight Variable and then press2(LIST) to display the pop-up window.3. Select the list whose values you want to assign for the x -variable.
• To select List 6, for example, pressgw. This causes the setting of the Variable item
of the Setup screen to change to List 6.
4. After specifying the list you want to use, pressJ to return to the previous screen.
uGenerating a Table
○ ○ ○ ○ ○
Example To generate a table of values for the functions stored in memory areasY1 and Y3 of the Table relation list
Usef andc to move the highlighting to the function you want to select for table
generation and press1(SEL) to select it.
The “=” sign of selected functions is highlighted on the screen. To deselect a function, move
the cursor to it and press1(SEL) again.
Press6(TABL) to generate a number table using the functions you selected. The value of
variable x changes according to the range or the contents of the list you specified.
The example screen shown here shows the results
based on the contents of List 6 (– 3, –2, –1, 0, 1, 2, 3).
Each cell can contain up to six digits, including negative sign.
5-7-2 Using Tables

8/20/2019 _Casio_fx9860GSD_9860G_E
http://slidepdf.com/reader/full/casiofx9860gsd9860ge 216/595

8/20/2019 _Casio_fx9860GSD_9860G_E
http://slidepdf.com/reader/full/casiofx9860gsd9860ge 217/595
20050401
kkkkk Editing and Deleting Functions
u To edit a function
○ ○ ○ ○ ○
Example To change the function in memory area Y1 from y = 3 x2 – 2 to
y = 3 x2 – 5
Usef andc to move the highlighting to the function you want to edit.
Usee to move the cursor to the beginning of the expression.
Used ande to move the cursor to the location of the change.
eeeeeeDf
w
6(TABL)
• You can specify the graph line style when graphing a connect type graph (G • CON).
The line style specification also applies to the GRAPH mode.
• The Function Link Feature automatically reflects any changes you make to functions in
the GRAPH mode list, and DYNA mode list.
u To delete a function
1. Usef andc to move the highlighting to the function you want to delete and then
press2(DEL) orD.
2. Press1(Yes) to delete the function or6(No) to abort the operation without deleting
anything.
5-7-4 Using Tables

8/20/2019 _Casio_fx9860GSD_9860G_E
http://slidepdf.com/reader/full/casiofx9860gsd9860ge 218/595
20050401
5-7-5 Using Tables
kkkkk Editing Tables
You can use the table menu to perform any of the following operations once you generate a
table.• Change the values of variable x
• Edit (delete, insert, and append) rows
• Delete a table
• Draw a connect type graph
• Draw a plot type graph
• {FORM} ... {return to Table relation list}
• {DEL} ... {delete table}
• {ROW}
• {DEL} / {INS} / {ADD} ... {delete}/{insert}/{add} row
• {EDIT } ... {edit value of x -variable}
• {G·CON} / {G·PLT} ... {connected type}/{draw plot type} graph draw
u To change variable values in a table
○ ○ ○ ○ ○
Example To change the value in Column x, Row 3 of the table generated onpage 5-7-2 from – 1 to – 2.5
cc -c.fw
• When you change a variable value in Column x , all values in the columns to the right are
recalculated and displayed.
# If you try to replace a value with an illegaloperation (such as division by zero), an error
occurs and the original value remains
unchanged.
# You cannot directly change any values in theother (non- x ) columns of the table.

8/20/2019 _Casio_fx9860GSD_9860G_E
http://slidepdf.com/reader/full/casiofx9860gsd9860ge 219/595
20050401
5-7-6 Using Tables
uRow Operations
u To delete a row
○ ○ ○ ○ ○
Example To delete Row 2 of the table generated on page 5-7-2
c 3(ROW)1(DEL)
u To insert a row
○ ○ ○ ○ ○
Example To insert a new row between Rows 1 and 2 in the table generated on
page 5-7-2
c 3(ROW)2(INS)

8/20/2019 _Casio_fx9860GSD_9860G_E
http://slidepdf.com/reader/full/casiofx9860gsd9860ge 220/595
20050401
5-7-7 Using Tables
u To add a row
○ ○ ○ ○ ○
Example To add a new row below Row 7 in the table generated on page 5-7-2
cccccc 3(ROW)3(ADD)
uDeleting a Table
1. Display the table and then press2(DEL).
2. Press1(Yes) to delete the table or6(No) to abort the operation without deleting
anything.

8/20/2019 _Casio_fx9860GSD_9860G_E
http://slidepdf.com/reader/full/casiofx9860gsd9860ge 221/595
20050401
kkkkkCopying a Table Column to a List
A simple operation lets you copy the contents of a numeric table column into a list.
Used ande to move the cursor to the column you want to copy. The cursor can be in anyrow.
u To copy a table to a list
○ ○ ○ ○ ○
Example To copy the contents of Column x into List 1
K1(LMEM)
Input the number of the list you want to copy and then pressw.
bw
5-7-8 Using Tables

8/20/2019 _Casio_fx9860GSD_9860G_E
http://slidepdf.com/reader/full/casiofx9860gsd9860ge 222/595
20050401
kkkkkDrawing a Graph from a Number Table
Description
Use the following procedure to generate a number table and then draw a graph based on thevalues in the table.
Set Up
1. From the Main Menu, enter the TABLE mode.
2. Make V-Window settings.
Execution
3. Store the functions.
4. Specify the table range.
5. Generate the table.
6. Select the graph type and draw it.
5(G • CON) ... line graph*1
6(G • PLT) ... plot type graph*1
• Selecting6(G • PLT) draws a 1-dot broken line plot type graph, regardless of the
currently selected line style (page 5-3-6).
5-7-9 Using Tables
*1After drawing the graph, pressing!
6(G ↔ T) orA returns to the number
table screen.

8/20/2019 _Casio_fx9860GSD_9860G_E
http://slidepdf.com/reader/full/casiofx9860gsd9860ge 223/595
20050401
○ ○ ○ ○ ○
Example Store the two functions below, generate a number table, and then draw
a line graph. Specify a range of –3 to 3, and an increment of 1.
Y1 = 3 x2 – 2, Y2 = x2
Use the following V-Window settings.
Xmin = 0, Xmax = 6, Xscale = 1
Ymin = –2, Ymax = 10, Yscale = 2
Procedure
1m TABLE
2!3(V-WIN)awgwbwc
-cwbawcwJ
33(TYPE)1(Y=)dvx-cw
vxw
45(SET)-dwdwbwJ
56(TABL)
65(G • CON)
Result Screen
5-7-10 Using Tables
# You can use Trace, Zoom, or Sketch after
drawing a graph.

8/20/2019 _Casio_fx9860GSD_9860G_E
http://slidepdf.com/reader/full/casiofx9860gsd9860ge 224/595
20050401
kkkkk Specifying a Range for Number Table Generation
Description
Use the following procedure to specify a number table range when calculating scatter datafrom a function.
Set Up
1. From the Main Menu, enter the TABLE mode.
Execution
2. Store the functions.
3. Specify the table range.
4. Select the functions for which you want to generate a table.
The “=” sign of selected functions is highlighted on the screen.
5. Generate the table.
5-7-11Using Tables

8/20/2019 _Casio_fx9860GSD_9860G_E
http://slidepdf.com/reader/full/casiofx9860gsd9860ge 225/595
20050401
○ ○ ○ ○ ○
Example Store the three functions shown below, and then generate a table for
functions Y1 and Y3. Specify a range of –3 to 3, and an increment of 1.
Y1 = 3 x2 – 2, Y2 = x + 4, Y3 = x2
Procedure
1m TABLE
23(TYPE)1(Y=)dvx-cw
v+ew
vxw
35(SET)-dwdwbwJ
4ff1(SEL)
56(TABL)
Result Screen
5-7-12 Using Tables
# You can generate number tables from
rectangular coordinate, polar coordinate, and
parametric functions.
# You can include derivatives in generated
number tables by specifying On for the
Derivative item on the Setup screen.

8/20/2019 _Casio_fx9860GSD_9860G_E
http://slidepdf.com/reader/full/casiofx9860gsd9860ge 226/595
20050401
kkkkk Simultaneously Displaying a Number Table and Graph
Description
Specifying T+G for Dual Screen on the Setup screen makes it possible to display a numbertable and graph at the same time.
Set Up
1. From the Main Menu, enter the TABLE mode.
2. Make V-Window settings.
3. On the Setup screen, select T+G for Dual Screen.
Execution
4. Input the function.
5. Specify the table range.
6. The number table is displayed in the sub-screen on the right.
7. Specify the graph type and draw the graph.
5(G • CON) ... line graph
6(G • PLT) ... plot type graph
5-7-13 Using Tables
# The Setup screen’s “Dual Screen” setting is
applied in the TABLE mode and the RECUR
mode.

8/20/2019 _Casio_fx9860GSD_9860G_E
http://slidepdf.com/reader/full/casiofx9860gsd9860ge 227/595
20050401
○ ○ ○ ○ ○
Example Store the function Y1 = 3 x2 – 2 and simultaneously display its number
table and line graph. Use a table range of –3 to 3 with an increment of 1.
Use the following V-Window settings.
Xmin = 0, Xmax = 6, Xscale = 1
Ymin = –2, Ymax = 10, Yscale = 2
Procedure
1m TABLE
2!3(V-WIN)awgwbwc
-cwbawcwJ
3!m(SET UP)cc1(T+G)J
43(TYPE)1(Y=)dvx-cw
55(SET)
-dwdwbwJ
66(TABL)
75(G • CON)
Result Screen
5-7-14 Using Tables
# You can make the number table active by
pressingK1(CHNG) orA.
# After drawing a graph, you can return to the
number table screen by pressing!6(G↔T)
orA.

8/20/2019 _Casio_fx9860GSD_9860G_E
http://slidepdf.com/reader/full/casiofx9860gsd9860ge 228/595
20050401
5-7-15 Using Tables
kkkkkUsing Graph-Table Linking
Description
With Dual Graph, you can use the following procedure to link the graph and table screens sothe pointer on the graph screen jumps to the location of the currently selected table value.
Set Up
1. From the Main Menu, enter the TABLE mode.
2. Make the required V-Window settings.
Display the Setup screen, select the Dual Screen item, and change its setting to “T+G”.
Execution
3. Input the function of the graph and make the required table range settings.
4. With the number table on the right side of the display, draw the graph on the left side.
5(G • CON) ... connect type graph
6(G • PLT) ... plot type graph
5. PressK2(GLINK) to enter the Graph-Table Linking mode.
6. Now when you usec andf to move the highlighting among the cells in the table,
the pointer jumps to the corresponding point on the graph screen.
If there are multiple graphs, pressingd ande causes the pointer to jump between
them.To exit the Graph-Table Linking mode, pressJ or!J(QUIT).

8/20/2019 _Casio_fx9860GSD_9860G_E
http://slidepdf.com/reader/full/casiofx9860gsd9860ge 229/595
20050401
5-7-16 Using Tables
○ ○ ○ ○ ○
Example Store the function Y1 = 3log x and simultaneously display its number
table and plot-type graph. Use a table range of 2 through 9, with an
increment of 1.
Use the following V-Window settings.
Xmin = –1, Xmax = 10, Xscale = 1
Ymin = – 1, Ymax = 4, Yscale = 1
Procedure
1m TABLE
2!3(V-WIN)-bwbawbwc
-bwewbwJ
!m(SET UP)cc1(T+G)J
33(TYPE)1(Y=)dlvw
5(SET)
cwjwbwJ
46(TABL)
6(G • PLT)
5K2(GLINK)
6c ~c,f ~f
Result Screen
…→←…

8/20/2019 _Casio_fx9860GSD_9860G_E
http://slidepdf.com/reader/full/casiofx9860gsd9860ge 230/595
20050401
5-8 Dynamic Graphing
kkkkkUsing Dynamic GraphDescription
Dynamic Graph lets you define a range of values for the coefficients in a function, and then
observe how a graph is affected by changes in the value of a coefficient. It helps to see how
the coefficients and terms that make up a function influence the shape and position of a
graph.
Set Up
1. From the Main Menu, enter the DYNA mode.2. Make V-Window settings.
Execution
3. On the Setup screen, specify the Dynamic Type.
1(Cnt) ... Continuous
2(Stop) ... Automatic stop after 10 draws
4. Use the cursor keys to select the function type on the built-in function type list.*1
5. Input values for coefficients, and specify which coefficient will be the dynamic
variable.*2
6. Specify the start value, end value, and increment.
7. Specify the drawing speed.
3(SPEED)1( ) .....Pause after each draw (Stop&Go)
2( ) .......Half normal speed (Slow)
3( ) .......Normal speed (Normal)
4( ) ......Twice normal speed (Fast)
8. Draw the Dynamic Graph.
5-8-1Dynamic Graphing
*1The following are the seven built-in function
types.
•Y=AX+B
•Y=A(X–B)2+C
•Y=AX2+BX+C
•Y=AX^3+BX2+CX+D
•Y=Asin(BX+C)
•Y=Acos(BX+C)
•Y=Atan(BX+C)
After you press3(TYPE) and select the
function type you want, you can then input the
actual function.
1(Y=) ... rectangular coordinate expression
2(r=) ... polar coordinate expression
3(Parm) ... parametric function
Entering the DYNA mode when a Function Type
that is not one of the three types listed above is
selected in the GRAPH mode causes the
Function Type to change automatically to
“rectangular coordinate expression (Y=)”.
*2You could also pressw here and display the
parameter setting menu.
# The message “Too Many Functions” appears
when more than one function is selected for
Dynamic Graphing.

8/20/2019 _Casio_fx9860GSD_9860G_E
http://slidepdf.com/reader/full/casiofx9860gsd9860ge 231/595
20050401
○ ○ ○ ○ ○
Example Use Dynamic Graph to graph y = A ( x – 1)2 – 1, in which the value of
coefficient A changes from 2 through 5 in increments of 1. The Graph
is drawn 10 times.
Use the following V-Window settings.
Xmin = –6.3, Xmax = 6.3, Xscale = 1
Ymin = –3.1, Ymax = 3.1, Yscale = 1 (initial defaults)
Procedure
1m DYNA
2!3(V-WIN)1(INIT)J
3!m(SET UP)2(Stop)J
45(B-IN)c1(SEL)
54(VAR)cwbw-bw
62(SET)cwfwbwJ
73(SPEED)3( )J
86(DYNA)
Result Screen
↓
→
←
↓↑
→
←
5-8-2 Dynamic Graphing
1
4
2
3
Repeats from1 through4.

8/20/2019 _Casio_fx9860GSD_9860G_E
http://slidepdf.com/reader/full/casiofx9860gsd9860ge 232/595
20050401
kkkkkDrawing a Dynamic Graph Locus
Description
Turning on the Dynamic Graph locus setting on the Setup screen lets you overlay a graphdrawn by changing the coefficient values.
Set Up
1. From the Main Menu, enter the DYNA mode.
2. Make V-Window settings.
Execution
3. On the Setup screen, select “On” for “Locus”.
4. Use the cursor keys to select the function type on the built-in function type list.
5. Input values for coefficients, and specify which coefficient will be the dynamic variable.
6. Specify the start value, end value, and increment.
7. Specify Normal for the draw speed.
8. Draw the Dynamic Graph.
5-8-3 Dynamic Graphing

8/20/2019 _Casio_fx9860GSD_9860G_E
http://slidepdf.com/reader/full/casiofx9860gsd9860ge 233/595
20050401
5-8-4 Dynamic Graphing
○ ○ ○ ○ ○
Example Use Dynamic Graph to graph y = A x, in which the value of coefficient
A changes from 1 through 4 in increments of 1. The Graph is drawn 10
times.
Use the following V-Window settings.
Xmin = –6.3, Xmax = 6.3, Xscale = 1
Ymin = –3.1, Ymax = 3.1, Yscale = 1 (initial defaults)
Procedure
1m DYNA
2!3(V-WIN)1(INIT)J
3!m(SET UP)c1(On)J
45(B-IN)1(SEL)
54(VAR)bwaw
62(SET)bwewbwJ
73(SPEED)3( )J
86(DYNA)
Result Screen
↓
→
←
↓↑
→
←
Repeats from1 through4.
1
4
2
3

8/20/2019 _Casio_fx9860GSD_9860G_E
http://slidepdf.com/reader/full/casiofx9860gsd9860ge 234/595
20050401
kkkkkDynamic Graph Application Examples
Description
You can also use Dynamic Graph to simulate simple physical phenomena.
Set Up
1. From the Main Menu, enter the DYNA mode.
2. Make V-Window settings.
Execution
3. On the Setup screen, specify Stop for Dynamic Type and Deg for Angle.
4. Specify Parm (parametric function) as the function type, and input a function thatcontains a dynamic variable.
5. Specify the dynamic coefficient.
6. Specify the start value, end value, and increment.
7. Specify Normal for the draw speed.
8. Start the Dynamic Graph operation.
5-8-5 Dynamic Graphing

8/20/2019 _Casio_fx9860GSD_9860G_E
http://slidepdf.com/reader/full/casiofx9860gsd9860ge 235/595
20050401
○ ○ ○ ○ ○
Example The path over time T of a ball thrown in the air at initial velocity V and
an angle of θ degrees from horizontal can be calculated as follows.
X = (Vcos θ )T, Y = (Vsin θ )T – (1/2)gT2 (g = 9.8m/s2)
Use Dynamic Graph to plot the path of a ball thrown at an initial
velocity of 20 meters per second, at horizontal angles of 30, 45, and 60
degrees (Angle: Deg).
Use the following V-Window settings.
Xmin = –1, Xmax = 42, Xscale = 5
Ymin = –1, Ymax = 16, Yscale = 2
Tθ min = 0, Tθ max = 6, Tθ ptch = 0.1
Procedure
1m DYNA
2!3(V-WIN)-bwecwfwc
-bwbgwcw
awgwa.bwJ
3!m(SET UP)2(Stop)
cccccc1(Deg)J
43(TYPE)3(Parm)
(cacav(A))vw(casav(A))v-e.jvxw
54(VAR)
62(SET)dawgawbfwJ
73(SPEED)3( )J
86(DYNA)
Result Screen
···→
←···
5-8-6 Dynamic Graphing

8/20/2019 _Casio_fx9860GSD_9860G_E
http://slidepdf.com/reader/full/casiofx9860gsd9860ge 236/595
20050401
kAdjusting the Dynamic Graph Speed
You can use the following procedure to adjust the Dynamic Graph speed while the draw
operation is taking place.
1. While a Dynamic Graph draw operation is being performed, pressA to change to the
speed adjustment menu.
• { } ... {Each step of the Dynamic Graph draw operation is performed each time you
pressw.}
• { } / { } / { } ... {slow (1/2 speed)}/{normal (default speed)}/{fast (double speed)}
• {STO} ... {stores graph conditions and screen data in Dynamic Graph memory}
2. Press the function key (1 to4) that corresponds to the speed you want to change
to.
kGraph Calculation DOT Switching FunctionUse this function to specify drawing of all the dots on the Dynamic Graph X-axis, or every
other dot. This setting is value for Dynamic Func Y= graphic only.
1. Press!m(SET UP) to display the Setup screen.
2. Presscc to select Y=Draw Speed.
3. Select the graphing method.
1(Norm) … Draws all X-axis dots. (initial default)
2(High) … Draws every other X-axis dot. (faster drawing than Normal)
4. PressJ.
5-8-7 Dynamic Graphing
# To clear the speed adjustment menu without
changing anything, pressw.
# Press!6(G↔T) to return to the graph
screen.

8/20/2019 _Casio_fx9860GSD_9860G_E
http://slidepdf.com/reader/full/casiofx9860gsd9860ge 237/595
20050401
kkkkkUsing Dynamic Graph Memory
You can store Dynamic Graph conditions and screen data in Dynamic Graph memory for
later recall when you need it. This lets you save time, because you can recall the data andimmediately begin a Dynamic Graph draw operation. Note that you can store one set of data
in memory at any one time.
The following is all of the data that makes up a set.
• Graph functions (up to 20)
• Dynamic Graph conditions
• Setup screen settings
• V-Window contents
• Dynamic Graph screen
uuuuu To save data in Dynamic Graph memory
1. While a Dynamic Graph draw operation is being performed, pressA to change to the
speed adjustment menu.
2. Press5(STO). In response to the confirmation dialog that appears, press1(Yes) to
save the data.
uuuuu To recall data from Dynamic Graph memory
1. Display the Dynamic Graph relation list.
2. Pressing6(RCL) recalls Dynamic Graph memory contents and draws the graph.
5-8-8 Dynamic Graphing
# If there is already data stored in DynamicGraph memory, the data save operation
replaces it with the new data.
# Data recalled from Dynamic Graph memoryreplaces the calculator’s current graph
functions, draw conditions, and screen data.
The previous data is lost when it is replaced.

8/20/2019 _Casio_fx9860GSD_9860G_E
http://slidepdf.com/reader/full/casiofx9860gsd9860ge 238/595
20050401
5-9 Graphing a Recursion Formula
kkkkkGenerating a Number
Table from a Recursion FormulaDescription
You can input up to three of the following types of recursion formulas and generate a number
table.
• General term of sequence {an}, composed of an, n
• Linear two-term recursion composed of an+1, an, n
• Linear three-term recursion composed of an+2, an+1, an, n
Set Up
1. From the Main Menu, enter the RECUR mode.
Execution
2. Specify the recursion type.
3(TYPE)1(an) ... {general term of sequence an}
2(an+1) ... {linear two-term recursion}
3(an+2) ... {linear three-term recursion}
3. Input the recursion formula.
4. Specify the table range. Specify a start point and end point for n. If necessary, specify a
value for the initial term, and a pointer start point value if you plan to graph the formula.
5. Display the recursion formula number table.
5-9-1Graphing a Recursion Formula

8/20/2019 _Casio_fx9860GSD_9860G_E
http://slidepdf.com/reader/full/casiofx9860gsd9860ge 239/595
20050401
○ ○ ○ ○ ○
Example Generate a number table from recursion between three terms as
expressed by a n+2 = a n+1 + a n, with initial terms of a1 = 1, a2 = 1
(Fibonacci sequence), as n changes in value from 1 to 6.
Procedure
1m RECUR
23(TYPE)3(an+2)
34(n. an ··)3(an+1)+2(an)w
45(SET)2(a1)bwgwbwbwJ
56(TABL)
Result Screen
5-9-2 Graphing a Recursion Formula
# Pressing1(FORM) will return to the screen
for storing recursion formulas.
* The first two values correspond toa1 = 1 and a2 = 1.
# Specifying On for the Σ Display of the Setup
screen causes the sum of each term to be
included in the table.

8/20/2019 _Casio_fx9860GSD_9860G_E
http://slidepdf.com/reader/full/casiofx9860gsd9860ge 240/595
20050401
kkkkkGraphing a Recursion Formula (1)
Description
After generating a number table from a recursion formula, you can graph the values on a linegraph or plot type graph.
Set Up
1. From the Main Menu, enter the RECUR mode.
2. Make V-Window settings.
Execution
3. Specify the recursion formula type and input the formula.
4. Specify the table range, and start and ending values for n. If necessary, specify the
initial term value and pointer start point.
5. Select the line style for the graph.
6. Display the recursion formula number table.
7. Specify the graph type and draw the graph.
5(G • CON) ... line graph
6(G • PLT) ... plot type graph
• Selecting6(G • PLT) draws a 1-dot broken line plot type graph, regardless of the
currently selected line style (page 5-3-6).
5-9-3 Graphing a Recursion Formula

8/20/2019 _Casio_fx9860GSD_9860G_E
http://slidepdf.com/reader/full/casiofx9860gsd9860ge 241/595
20050401
○ ○ ○ ○ ○
Example Generate a number table from recursion between two terms as
expressed by a n+1 = 2 a n+1, with an initial term of a1 = 1, as n changes
in value from 1 to 6. Use the table values to draw a line graph.
Use the following V-Window settings.
Xmin = 0, Xmax = 6, Xscale = 1
Ymin = –15, Ymax = 65, Yscale = 5
Procedure
1m RECUR
2!3(V-WIN)awgwbwc
-bfwgfwfwJ
33(TYPE)2(an+1)c2(an)+bw
45(SET)2(a1)bwgwbwJ
51(SEL+S)f2( )J
66(TABL)
75(G • CON)
Result Screen
5-9-4 Graphing a Recursion Formula
# After drawing a graph, you can use Trace,
Zoom, and Sketch.
# After drawing a graph, you can return to the
number table screen by pressing!6(G↔T)
orA.

8/20/2019 _Casio_fx9860GSD_9860G_E
http://slidepdf.com/reader/full/casiofx9860gsd9860ge 242/595
20050401
kkkkkGraphing a Recursion Formula (2)
Description
The following describes how to generate a number table from a recursion formula and graphthe values while Σ Display is On.
Set Up
1. From the Main Menu, enter the RECUR mode.
2. On the Setup screen, specify On for Σ Display.
3. Make V-Window settings.
Execution
4. Specify the recursion formula type and input the recursion formula.
5. Specify the table range, and start and ending values for n. If necessary, specify the
initial term value and pointer start point.
6. Select the line style for the graph.
7. Display the recursion formula number table.
8. Specify the graph type and draw the graph.
5(G • CON)1(an) ... Line graph with ordinate an, abscissa n
6(Σan) ... Line graph with ordinate Σan, abscissa n
6(G • PLT)1(an) ... Plot type graph with ordinate an, abscissa n
6(Σan) ... Plot type graph with ordinate Σan, abscissa n
• Selecting6(G • PLT) draws a 1-dot broken line plot type graph, regardless of the
currently selected line style (page 5-3-6).
5-9-5 Graphing a Recursion Formula

8/20/2019 _Casio_fx9860GSD_9860G_E
http://slidepdf.com/reader/full/casiofx9860gsd9860ge 243/595
20050401
○ ○ ○ ○ ○
Example Generate a number table from recursion between two terms as
expressed by a n+1 = 2 a n+1, with an initial term of a1 = 1, as n changes
in value from 1 to 6. Use the table values to draw a plot line graph with
ordinate Σ a n, abscissa n.
Use the following V-Window settings.
Xmin = 0, Xmax = 6, Xscale = 1
Ymin = –15, Ymax = 65, Yscale = 5
Procedure
1m RECUR
2!m(SET UP)1(On)J
3!3(V-WIN)awgwbwc
-bfwgfwfwJ
43(TYPE)2(an+1)c2(an)+bw
55(SET)2(a1)bwgwbwJ
61(SEL+S)f2( )J
76(TABL)
86(G • PLT)6(Σan)
Result Screen
5-9-6 Graphing a Recursion Formula

8/20/2019 _Casio_fx9860GSD_9860G_E
http://slidepdf.com/reader/full/casiofx9860gsd9860ge 244/595
20050401
kkkkkWEB Graph (Convergence, Divergence)
Description
y = f ( x ) is graphed by presuming an+1 = y, an = x for linear two-term regression an+1 = f (an)composed of an+1, an. Next, it can be determined whether the function is convergent or
divergent.
Set Up
1. From the Main Menu, enter the RECUR mode.
2. Make V-Window settings.
Execution
3. Select 2-term recursion as the recursion formula type, and input the formula.
4. Specify the table range, n start and end points, initial term value, and pointer start
point.
5. Display the recursion formula number table.
6. Draw the graph.
7. Pressw, and the pointer appears at the start point you specified.
Pressw several times.
If convergence exists, lines that resemble a spider web are drawn on the display.
Failure of the web lines to appear indicates either divergence or that the graph is
outside the boundaries of the display screen. When this happens, change to larger
V-Window values and try again.
You can usefc to select the graph.
5-9-7 Graphing a Recursion Formula
# To change the graph line style, press1(SEL+S) after step 4.
# With WEB Graph, you can specify the line typefor a y = f ( x ) graph. The line type setting is valid
only when “Connect” is selected for “Draw Type”
on the Setup screen.

8/20/2019 _Casio_fx9860GSD_9860G_E
http://slidepdf.com/reader/full/casiofx9860gsd9860ge 245/595
20050401
○ ○ ○ ○ ○
Example To draw the WEB graph for the recursion formula a n+1 = –3( a n)2 + 3 a n,
b n+1 = 3 b n + 0.2, and check for divergence or convergence. Use the
following table range and V-Window Settings.
Table Range
Start = 0, End = 6, a0 = 0.01, a nStr = 0.01, b0 = 0.11, b nStr = 0.11
V-Window Settings
Xmin = 0, Xmax = 1, Xscale = 1
Ymin = 0, Ymax = 1, Yscale = 1
Procedure
1m RECUR
2!3(V-WIN)awbwbwc
awbwbwJ
33(TYPE)2(an+1)-d2(an)x+d2(an)w
d3(bn)+a.cw
45(SET)1(a0)
awgwa.abwa.bbwc
a.abwa.bbwJ
56(TABL)
64(WEB)
7w~w(an is convergence)
cw~w(bn is divergence)
Result Screen
5-9-8 Graphing a Recursion Formula

8/20/2019 _Casio_fx9860GSD_9860G_E
http://slidepdf.com/reader/full/casiofx9860gsd9860ge 246/595
20050401
5-9-9 Graphing a Recursion Formula
kkkkkGraphing a Recursion Formula on Dual Screen
Description
When “T+G” is specified for the Dual Screen setting, you can view the number table andgraph at the same time.
Set Up
1. From the Main Menu, enter the RECUR mode.
2. Make V-Window settings.
3. On the Setup screen, select T+G for Dual Screen.
Execution
4. Specify the recursion formula type and input the formula.
5. Specify the table range, and start and ending values for n. If necessary, specify the
initial term value and pointer start point.
6. Select the line style for the graph.
7. Display the recursion formula number table.
8. Specify the graph type and draw the graph.
5(G • CON) ... line graph
6(G • PLT) ... plot type graph
# The Setup screen’s “Dual Screen” setting is
applied in the TABLE mode and the RECUR
mode.

8/20/2019 _Casio_fx9860GSD_9860G_E
http://slidepdf.com/reader/full/casiofx9860gsd9860ge 247/595
20050401
5-9-10 Graphing a Recursion Formula
○ ○ ○ ○ ○
Example Generate a number table from recursion between two terms as
expressed by a n+1 = 2 a n+1, with an initial term of a1 = 1, as n changes
in value from 1 to 6. Use the table values to draw a line graph.
Use the following V-Window settings.
Xmin = 0, Xmax = 6, Xscale = 1
Ymin = –15, Ymax = 65, Yscale = 5
Procedure
1m RECUR
2!3(V-WIN)awgwbwc
-bfwgfwfwJ
3!m(SET UP)ccc1(T+G)J
43(TYPE)2(an+1)c2(an)+bw
55(SET)2(a1)bwgwbwJ
61(SEL+S)f2( )J
76(TABL)
85(G • CON)
Result Screen
# You can make the number table active by
pressingK1(CHNG) orA.
# After drawing a graph, you can return to the
number table screen by pressing!6(G↔T)
orA.

8/20/2019 _Casio_fx9860GSD_9860G_E
http://slidepdf.com/reader/full/casiofx9860gsd9860ge 248/595
20050401
5-10-1Changing the Appearance of a Graph
*1 The above shows the function menu that appears
in the GRAPH mode. Menu items may differ
somewhat in other modes.
*2 In the case of an inverse function graph, drawing
starts immediately after you select this option.
*3 Some sketch functions require specification of two
points. After you pressw to specify the first point,
use the cursor keys to move the pointer to the
location of the second point and pressw.
# You can specify line type for the following sketch
functions: Tangent, Normal, Inverse, Line, F • Line,
Circle, Vertical, Horizontal, Pen
5-10 Changing the Appearance of a Graph
kkkkkDrawing a LineDescription
The sketch function lets you draw points and lines inside of graphs.
You can select one of four different line styles for drawing with the sketch function.
Set Up
1. From the Main Menu, enter the GRAPH mode.
2. Make V-Window settings.
3. On the Setup screen, use the “Sketch Line” setting to specify the line style you want.
1( ) … Normal (initial default)2( ) … Thick (twice the thickness of Normal)
3(
) … Broken (thick broken)
4( ) … Dot (dotted)
4. Input the function of the graph.
5. Draw the graph.
Execution
6. Select the sketch function you want to use.*1
!4(SKTCH)1(Cls) ... Screen clear
2(Tang) ... Tangent line
3(Norm) ... Line normal to a curve
4(Inv) ... Inverse function*2
6(g)1(PLOT)
{Plot}/{Pl • On}/{Pl • Off}/{Pl • Chg}
... Point {Plot}/{On}/{Off}/{Change}
6(g)2(LINE)
{Line}/{F • Line} ...{connects 2 points plotted by6(g)1(PLOT)
with a line}/{for drawing a line between any 2 points}
6(g)3(Crcl) ... Circle
6(g)4(Vert) ... Vertical line
6(g)5(Hztl) ... Horizontal line
6(g)6(g)1(PEN) ... Freehand
6(g)6(g)2(Text) ... Text input
7. Use the cursor keys to move the pointer ( ) to the location where you want to draw,
and pressw.*3
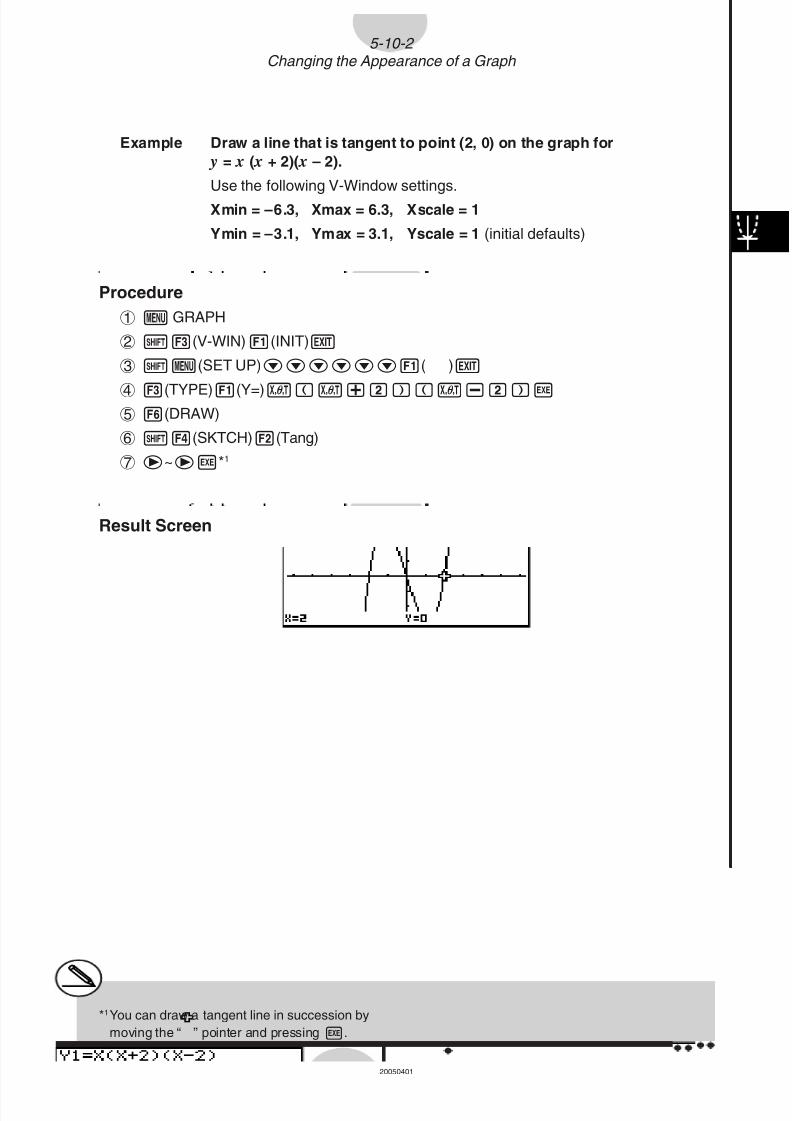
8/20/2019 _Casio_fx9860GSD_9860G_E
http://slidepdf.com/reader/full/casiofx9860gsd9860ge 249/595
20050401
○ ○ ○ ○ ○
Example Draw a line that is tangent to point (2, 0) on the graph for
y = x ( x + 2)( x – 2).
Use the following V-Window settings.
Xmin = –6.3, Xmax = 6.3, Xscale = 1
Ymin = –3.1, Ymax = 3.1, Yscale = 1 (initial defaults)
Procedure
1m GRAPH
2!3(V-WIN)1(INIT)J
3!m(SET UP)cccccc1( )J
43(TYPE)1(Y=)v(v+c)(v-c)w56(DRAW)
6!4(SKTCH)2(Tang)
7e~ew*1
Result Screen
5-10-2 Changing the Appearance of a Graph
*1You can draw a tangent line in succession by
moving the “ ” pointer and pressingw.

8/20/2019 _Casio_fx9860GSD_9860G_E
http://slidepdf.com/reader/full/casiofx9860gsd9860ge 250/595
20050401
kkkkk Inserting Comments
Description
You can insert comments anywhere you want in a graph.
Set Up
1. Draw the graph.
Execution
2. Press!4(SKTCH)6(g)6(g)2(Text), and a pointer appears in the center of
the display.
3. Use the cursor keys to move the pointer to the location where you want the text to be,
and input the text.
5-10-3 Changing the Appearance of a Graph
# You can input any of the following characters as
comment text: A~Z, r , θ , space, 0~9, ., +, –, ×,
÷, (–), EXP, π, Ans, (, ), [, ], {, }, comma, →,
x 2, ^ , log, In, , x , 10 x , e x , 3 , x –1, sin, cos,
tan, sin–1, cos–1, tan–1, i, List, Mat, ∠

8/20/2019 _Casio_fx9860GSD_9860G_E
http://slidepdf.com/reader/full/casiofx9860gsd9860ge 251/595
20050401
○ ○ ○ ○ ○
Example Insert text into the graph y = x ( x + 2)( x – 2).
Use the following V-Window settings.
Xmin = – 5, Xmax = 5, Xscale = 1Ymin = – 5, Ymax = 5, Yscale = 1
Procedure
1m GRAPH
!3(V-WIN)-fwfwbwc
-fwfwbwJ
3(TYPE)1(Y=)v(v+c)(v-c)w
6(DRAW)
2!4(SKTCH)6(g)6(g)2(Text)
3f~f d~d
a-(Y)!.(=)v(v+c)(v-c)
Result Screen
5-10-4 Changing the Appearance of a Graph

8/20/2019 _Casio_fx9860GSD_9860G_E
http://slidepdf.com/reader/full/casiofx9860gsd9860ge 252/595
20050401
kkkkk Freehand Drawing
Description
You can use the pen option for freehand drawing in a graph.
Set Up
1. Draw the graph.
Execution
2. Press!4(SKTCH)6(g)6(g)1(PEN), and a pointer appears in the center of
the screen.
3. Use the cursor keys to move the pointer to the point from which you want to start
drawing, and then pressw.
4. Use the cursor keys to move the pointer. A line is drawn wherever you move the
pointer. To stop the line, pressw.
Repeat step 3 and 4 to draw other lines.
5-10-5 Changing the Appearance of a Graph

8/20/2019 _Casio_fx9860GSD_9860G_E
http://slidepdf.com/reader/full/casiofx9860gsd9860ge 253/595
20050401
○ ○ ○ ○ ○
Example Use the pen to draw on the graph y = x ( x + 2)( x – 2).
Use the following V-Window settings.
Xmin = – 5, Xmax = 5, Xscale = 1Ymin = – 5, Ymax = 5, Yscale = 1
Procedure
1m GRAPH
!3(V-WIN)-fwfwbwc
-fwfwbwJ
3(TYPE)1(Y=)v(v+c)(v-c)w
6(DRAW)
2!4(SKTCH)6(g)6(g)1(PEN)
3f~f d~dw
4cd…,e~e,ef…,d~dw
Result Screen
5-10-6 Changing the Appearance of a Graph

8/20/2019 _Casio_fx9860GSD_9860G_E
http://slidepdf.com/reader/full/casiofx9860gsd9860ge 254/595

8/20/2019 _Casio_fx9860GSD_9860G_E
http://slidepdf.com/reader/full/casiofx9860gsd9860ge 255/595
20050401
5-10-8 Changing the Appearance of a Graph
Draw the dynamic graph.
(Y = X2 – 1)
↓↑(Y = X2)
↓↑(Y = X2 + 1)
• See “5-8 Dynamic Graphing” for details on using the Dynamic Graph feature.

8/20/2019 _Casio_fx9860GSD_9860G_E
http://slidepdf.com/reader/full/casiofx9860gsd9860ge 256/595
20050401
5-11 Function Analysis
kkkkkReading Coordinates on a Graph LineDescription
Trace lets you move a pointer along a graph and read out coordinates on the display.
Set Up
1. From the Main Menu, enter the GRAPH mode.
2. Draw the graph.
Execution3. Press!1(TRCE), and a pointer appears in the center of the graph.*1
4. Used ande to move the pointer along the graph to the point at which you want to
display the derivative.
When there are multiple graphs on the display, pressf andc to move between
them along the x -axis of the current pointer location.
5. You can also move the pointer by pressingv to display the pop-up window, and then
inputting coordinates.
The pop-up window appears even when you input coordinates directly.
To exit a trace operation, press!1(TRCE).
*1The pointer is not visible on the graph when
it is located at a point outside the graph
display area or when an error of no value
occurs.
# You can turn off display of the coordinates at the
pointer location by specifying “Off” for the “Coord”
item on the Setup screen.
5-11-1
Function Analysis

8/20/2019 _Casio_fx9860GSD_9860G_E
http://slidepdf.com/reader/full/casiofx9860gsd9860ge 257/595
20050401
○ ○ ○ ○ ○
Example Read coordinates along the graph of the function shown below.
Y1 = x2 – 3
Use the following V-Window settings.
Xmin = – 5, Xmax = 5, Xscale = 1
Ymin = –10, Ymax = 10, Yscale = 2
Procedure
1m GRAPH
2!3(V-WIN)-fwfwbwc
-bawbawcwJ
3(TYPE)1(Y=)vx-dw6(DRAW)
3!1(TRCE)
4d~d
5-bw
Result Screen
5-11-2
Function Analysis
# The following shows how coordinates are
displayed for each function type.
• Polar Coordinate Graph
• Parametric Graph
• Inequality Graph
# The pointer will not move if you press thed and
e keys during trace of an “X=c” type graph.

8/20/2019 _Casio_fx9860GSD_9860G_E
http://slidepdf.com/reader/full/casiofx9860gsd9860ge 258/595
20050401
kkkkkDisplaying the Derivative
Description
In addition to using Trace to display coordinates, you can also display the derivative at thecurrent pointer location.
Set Up
1. From the Main Menu, enter the GRAPH mode.
2. On the Setup screen, specify On for Derivative.
3. Draw the graph.
Execution
4. Press!1(TRCE), and the pointer appears at the center of the graph. The current
coordinates and the derivative also appear on the display at this time.
5. Used ande to move the pointer along the graph to the point at which you want to
display the derivative.
When there are multiple graphs on the display, pressf andc to move between
them along the x -axis of the current pointer location.
6. You can also move the pointer by pressingv to display the pop-up window, and then
inputting coordinates.
The pop-up window appears even when you input coordinates directly.
5-11-3
Function Analysis

8/20/2019 _Casio_fx9860GSD_9860G_E
http://slidepdf.com/reader/full/casiofx9860gsd9860ge 259/595
20050401
○ ○ ○ ○ ○
Example Read coordinates and derivatives along the graph of the function
shown below.
Y1 = x2 – 3
Use the following V-Window settings.
Xmin = –5, Xmax = 5, Xscale = 1
Ymin = –10, Ymax = 10, Yscale = 2
Procedure
1m
GRAPH
2!m(SET UP)cccc1(On)J
3!3(V-WIN)-fwfwbwc
-bawbawcwJ
3(TYPE)1(Y=)vx-dw
6(DRAW)
4!1(TRCE)
5d~d
6-bw
Result Screen
5-11-4
Function Analysis
20050601

8/20/2019 _Casio_fx9860GSD_9860G_E
http://slidepdf.com/reader/full/casiofx9860gsd9860ge 260/595
20050401
kkkkkGraph to Table
Description
You can use trace to read the coordinates of a graph and store them in a number table. Youcan also use Dual Graph to simultaneously store the graph and number table, making this an
important graph analysis tool.
Set Up
1. From the Main Menu, enter the GRAPH mode.
2. On the Setup screen, specify GtoT for Dual Screen.
3. Make V-Window settings.
Execution
4. Save the function and draw the graph on the active (left) screen.
5. Activate Trace. When there are multiple graphs on the display, pressf andc to
select the graph you want.
6. Used ande to move the pointer and pressw to store coordinates into the
number table. Repeat this step to store as many values as you want.
7. PressK1(CHNG) to make the number table active.
8. From the pop-up window, input the list number you want to save.
5-11-5
Function Analysis

8/20/2019 _Casio_fx9860GSD_9860G_E
http://slidepdf.com/reader/full/casiofx9860gsd9860ge 261/595
20050401
○ ○ ○ ○ ○
Example Save, in a table, the coordinates in the vicinity of the points of
intersection at X = 0 for the two graphs shown below, and store the
table contents in List 1.
Y1 = x2 – 3, Y2 = – x + 2
Use the following V-Window settings.
Xmin = – 5, Xmax = 5, Xscale = 1
Ymin = –10, Ymax = 10, Yscale = 2
Procedure
1m GRAPH
2!m(SET UP)cc2(GtoT)J
3!3(V-WIN)-fwfwbwc
-bawbawcwJ
43(TYPE)1(Y=)vx-dw
-v+cw
6(DRAW)
5!1(TRCE)
6d~dwe~ew
7K1(CHNG)8K2(LMEM)bw
Result Screen
5-11-6
Function Analysis
# Instead of pressingK1(CHNG) in step 7,
you could pressA to make the number table
active.

8/20/2019 _Casio_fx9860GSD_9860G_E
http://slidepdf.com/reader/full/casiofx9860gsd9860ge 262/595
20050401
kkkkkCoordinate Rounding
Description
This function rounds off coordinate values displayed by Trace.
Set Up
1. From the Main Menu, enter the GRAPH mode.
2. Draw the graph.
Execution
3. Press!2(ZOOM)6(g)3(RND). This causes the V-Window settings to be
changed automatically in accordance with the Rnd value.
4. Press!1(TRCE), and then use the cursor keys to move the pointer along the
graph. The coordinates that now appear are rounded.
5-11-7
Function Analysis

8/20/2019 _Casio_fx9860GSD_9860G_E
http://slidepdf.com/reader/full/casiofx9860gsd9860ge 263/595
20050401
○ ○ ○ ○ ○
Example Use coordinate rounding and display the coordinates in the vicinity of
the points of intersection for the two graphs produced by the
functions shown below.
Y1 = x2 – 3, Y2 = – x + 2
Use the following V-Window settings.
Xmin = – 5, Xmax = 5, Xscale = 1
Ymin = –10, Ymax = 10, Yscale = 2
Procedure
1m GRAPH
2!3(V-WIN)-fwfwbwc
-bawbawcwJ
3(TYPE)1(Y=)vx-dw
-v+cw
6(DRAW)
3!2(ZOOM)6(g)3(RND)
4!1(TRCE)
d~d
Result Screen
5-11-8
Function Analysis

8/20/2019 _Casio_fx9860GSD_9860G_E
http://slidepdf.com/reader/full/casiofx9860gsd9860ge 264/595
20050401
kkkkkCalculating the Root
Description
This feature provides a number of different methods for analyzing graphs.
Set Up
1. From the Main Menu, enter the GRAPH mode.
2. Draw the graphs.
Execution
3. Select the analysis function.
!5(G-SLV)1(ROOT) ... Calculation of root2(MAX) ... Local maximum value
3(MIN) ... Local minimum value
4(Y-ICPT) ... y-intercept
5(ISCT) ... Intersection of two graphs
6(g)1(Y-CAL) ... y-coordinate for given x -coordinate
6(g)2(X-CAL) ... x -coordinate for given y-coordinate
6(g)3(∫ dx ) ... Integral value for a given range
4. When there are multiple graphs on the screen, the selection cursor (k) is located at
the lowest numbered graph. Pressf andc to move the cursor to the graph you
want to select.
5. Pressw to select the graph where the cursor is located and display the value
produced by the analysis.
When an analysis produces multiple values, presse to calculate the next value.
Pressingd returns to the previous value.
5-11-9
Function Analysis

8/20/2019 _Casio_fx9860GSD_9860G_E
http://slidepdf.com/reader/full/casiofx9860gsd9860ge 265/595
20050401
○ ○ ○ ○ ○
Example Draw the graph shown below and calculate the root for Y1.
Y1 = x( x + 2)( x – 2)
Use the following V-Window settings.
Xmin = –6.3, Xmax = 6.3, Xscale = 1
Ymin = –3.1, Ymax = 3.1, Yscale = 1 (initial defaults)
Procedure
1m GRAPH
2!3(V-WIN)1(INIT)J
3(TYPE)1(Y=)v(v+c)(v-c)w
6(DRAW)3!5(G-SLV)1(ROOT)
5e
e
Result Screen
5-11-10
Function Analysis
# When analyzing a single graph, results appear
as soon as you select an analysis function in
step 3, so step 4 is not necessary.
# Root, local maximum value, local minimumvalue, and y-intercept can be calculated for
rectangular coordinate graphs and inequality
graphs only.
# Graph analysis is not possible for the graph
whose function is the format X = constant.
# The y-intercept is the point where the graph
crosses the y-axis.
…

8/20/2019 _Casio_fx9860GSD_9860G_E
http://slidepdf.com/reader/full/casiofx9860gsd9860ge 266/595
20050401
kkkkkCalculating the Point of Intersection of Two Graphs
Description
Use the following procedure to calculate the point of intersection of two graphs.
Set Up
1. Draw the graphs.
Execution
2. Press!5(G-SLV)5(ISCT). When there are three or more graphs, the selection
cursor (k) appears at the lowest numbered graph.
3. Pressf andc to move the cursor to the graph you want to select.
4. Pressw to select the first graph, which changes the shape of the cursor fromk to
.
5. Pressf andc to move the cursor to the second graph.
6. Pressw to calculate the point of intersection for the two graphs.
When an analysis produces multiple values, presse to calculate the next value.
Pressingd returns to the previous value.
5-11-11
Function Analysis

8/20/2019 _Casio_fx9860GSD_9860G_E
http://slidepdf.com/reader/full/casiofx9860gsd9860ge 267/595
20050401
○ ○ ○ ○ ○
Example Graph the two functions shown below, and determine the point of
intersection between Y1 and Y2.
Y1 = x + 1, Y2 = x2
Use the following V-Window settings.
Xmin = – 5, Xmax = 5, Xscale = 1
Ymin = – 5, Ymax = 5, Yscale = 1
Procedure
1m GRAPH
!3(V-WIN)-fwfwbwc
-fwfwbwJ
3(TYPE)1(Y=)v+bw
vxw
6(DRAW)
2!5(G-SLV)5(ISCT)
6e
Result Screen
5-11-12
Function Analysis
# In the case of two graphs, the point of
intersection is calculated immediately after
you press!55 in step 2.
# You can calculate the point of intersection for
rectangular coordinate graphs and inequality
graphs only.
…

8/20/2019 _Casio_fx9860GSD_9860G_E
http://slidepdf.com/reader/full/casiofx9860gsd9860ge 268/595
20050401
kDetermining the Coordinates for Given Points
Description
The following procedure describes how to determine the y-coordinate for a given x , and the x -coordinate for a given y.
Set Up
1. Draw the graph.
Execution
2. Select the function you want to perform. When there are multiple graphs, the selection
cursor (k) appears at the lowest numbered graph.
!5(G-SLV)6(g)1(Y-CAL) ... y-coordinate for given x
6(g)2(X-CAL) ... x -coordinate for given y
3. Usefc to move the cursor (k) to the graph you want, and then pressw to select
it.
4. Input the given x -coordinate value or y-coordinate value.
Pressw to calculate the corresponding y-coordinate value or x -coordinate value.
5-11-13
Function Analysis

8/20/2019 _Casio_fx9860GSD_9860G_E
http://slidepdf.com/reader/full/casiofx9860gsd9860ge 269/595
20050401
○ ○ ○ ○ ○
Example Graph the two functions shown below and then determine the y-
coordinate for x = 0.5 and the x-coordinate for y = 2.2 on graph Y2.
Y1 = x + 1, Y2 = x( x + 2)( x – 2)
Use the following V-Window settings.
Xmin = –6.3, Xmax = 6.3, Xscale = 1
Ymin = –3.1, Ymax = 3.1, Yscale = 1 (initial defaults)
Procedure
1m GRAPH
!3(V-WIN)1(INIT)J
3(TYPE)1(Y=)v+bw
v(v+c)(v-c)w
6(DRAW)
2!5(G-SLV)6(g)1(Y-CAL) 2 !5(G-SLV)6(g)2(X-CAL)
3cw 3 cw
4 a.fw 4 c.cw
Result Screen
5-11-14
Function Analysis
# When there are multiple results for the above
procedure, presse to calculate the next
value. Pressingd returns to the previousvalue.
# Step 3 of the above procedure is skipped
when there is only one graph on the display.
# The X-CAL value cannot be obtained for a
parametric function graph.
# After obtaining coordinates with the aboveprocedure, you can input different coordinates
by first pressingv.

8/20/2019 _Casio_fx9860GSD_9860G_E
http://slidepdf.com/reader/full/casiofx9860gsd9860ge 270/595
20050401
kkkkkCalculating the lntegral Value for a Given Range
Description
Use the following procedure to obtain integration values for a given range.
Set Up
1. Draw the graph.
Execution
2. Press!5(G-SLV)6(g)3(∫ dx ). When there are multiple graphs, this causes the
selection cursor (k) to appear at the lowest numbered graph.
3. Usefc to move the cursor (k) to the graph you want, and then pressw to select
it.
4. Usede to move the lower limit pointer to the location you want, and then pressw.
You can also move the pointer by pressingv to display the pop-up window, and then
inputting coordinates.
5. Usee to move the upper limit pointer to the location you want.
You can also move the pointer by pressingv to display the pop-up window, and then
inputting the upper limit and lower limit values for the integration range.
6. Pressw to calculate the integral value.
5-11-15
Function Analysis
# You can also specify the lower limit and upperlimit by inputting them on the 10-key pad.
# When setting the range, make sure that the lower
limit is less than the upper limit.
# Integral values can be calculated for rectangularcoordinate graphs only.

8/20/2019 _Casio_fx9860GSD_9860G_E
http://slidepdf.com/reader/full/casiofx9860gsd9860ge 271/595
20050401
○ ○ ○ ○ ○
Example Graph the function shown below, and then determine the integral
value at (–2, 0).
Y1 = x( x + 2)( x – 2)
Use the following V-Window settings.
Xmin = –6.3, Xmax = 6.3, Xscale = 1
Ymin = – 4, Ymax = 4, Yscale = 1
Procedure
1m GRAPH
!3(V-WIN)-g.dwg.dwbwc
-ewewbwJ
3(TYPE)1(Y=)v(v+c)(v-c)w
6(DRAW)
2!5(G-SLV)6(g)3(∫ dx )
4d~d(Lower limit: x = –2)w
5e~e(Upper limit: x = 0)
6w
Result Screen
5-11-16
Function Analysis
…

8/20/2019 _Casio_fx9860GSD_9860G_E
http://slidepdf.com/reader/full/casiofx9860gsd9860ge 272/595
20050401
kkkkkConic Section Graph Analysis
You can determine approximations of the following analytical results using conic section
graphs.
• Focus/vertex/eccentricity
• Length of latus rectum
• Center/radius
• x -/ y-intercept
• Directrix/axis of symmetry drawing and analysis
• Asymptote drawing and analysis
1. From the Main Menu, enter the CONICS mode.2. Usef andc to select the conic section you want to analyze.
3. Input the conic section constants.
4. Draw the Graph.
After graphing a conic section, press!5(G-SLV) to display the following graph analysis
menus.
uParabolic Graph Analysis
• {FOCS} / {VTX} / {LEN} / {e} ... {focus}/{vertex}/{length of latus rectum}/{eccentricity}• {DIR} / {SYM} ... {directrix}/{axis of symmetry}
• {X-IN} / {Y-IN} ... { x -intercept}/{ y-intercept}
uCircular Graph Analysis
• {CNTR} / {RADS} ... {center}/{radius}
• {X-IN} / {Y-IN} ... { x -intercept}/{ y-intercept}
uElliptical Graph Analysis• {FOCS} / {VTX} / {CNTR} / {e} ... {focus}/{vertex}/{center}/{eccentricity}
• {X-IN} / {Y-IN} ... { x -intercept}/{ y-intercept}
uHyperbolic Graph Analysis
• {FOCS} / {VTX} / {CNTR} / {e} ... {focus}/{vertex}/{center}/{eccentricity}
• {ASYM} ... {asymptote}
• {X-IN} / {Y-IN} ... { x -intercept}/{ y-intercept}
The following examples show how to use the above menus with various types of conic
section graphs.
5-11-17
Function Analysis

8/20/2019 _Casio_fx9860GSD_9860G_E
http://slidepdf.com/reader/full/casiofx9860gsd9860ge 273/595
20050401
u To calculate the focus, vertex and length of latus rectum
[G-SLV]-[FOCS]/[VTX]/[LEN]
○ ○ ○ ○ ○
Example To determine the focus, vertex and length of latus rectum for the
parabola X = (Y – 2)2 + 3
Use the following V-Window settings.
Xmin = –1, Xmax = 10, Xscale = 1
Ymin = – 5, Ymax = 5, Yscale = 1
m CONICS
w
bwcwdw6(DRAW)
!5(G-SLV)
1(FOCS)
(Calculates the focus.)
!5(G-SLV)
4(VTX)
(Calculates the vertex.)
!5(G-SLV)
5(LEN)
(Calculates the length of latus rectum.)
• When calculating two foci for an ellipse or hyperbolic graph, presse to calculate the
second focus. Pressingd returns to the first focus.
• When calculating two vertexes for a hyperbolic graph, presse to calculate the second
vertex. Pressingd returns to the first vertex.
• Pressinge when calculating the vertices of an ellipse will calculate the next value.
Pressingd will scroll back through previous values. An ellipse has four vertices.
5-11-18
Function Analysis

8/20/2019 _Casio_fx9860GSD_9860G_E
http://slidepdf.com/reader/full/casiofx9860gsd9860ge 274/595
20050401
u To calculate the center and radius [G-SLV]-[CNTR]/[RADS]
○ ○ ○ ○ ○
Example To determine the center and radius for the circle(X + 2)2 + (Y + 1)2 = 22
Use the following V-Window settings.
Xmin = –6.3, Xmax = 6.3, Xscale = 1
Ymin = –3.1, Ymax = 3.1, Yscale = 1 (initial defaults)
m CONICS
ccccw
-cw-bwcw6(DRAW)
!5(G-SLV)
1(CNTR)
(Calculates the center.)
!5(G-SLV)
2(RADS)
(Calculates the radius.)
5-11-19
Function Analysis

8/20/2019 _Casio_fx9860GSD_9860G_E
http://slidepdf.com/reader/full/casiofx9860gsd9860ge 275/595
20050401
u To calculate the x- and y-intercepts [G-SLV]-[X-IN]/[Y-IN]
○ ○ ○ ○ ○
Example To determine the x- and y-intercepts for the hyperbola(X – 3)2 (Y – 1)2
–––––––– – –––––––– = 122 22
Use the following V-Window settings.
Xmin = – 4, Xmax = 8, Xscale = 1
Ymin = – 5, Ymax = 5, Yscale = 1
m CONICS
cccccccw
cwcwdwbw6(DRAW)
!5(G-SLV)
2(X-IN)
(Calculates the x -intercept.)
!5(G-SLV)
3(Y-IN)
(Calculates the y-intercept.)
• Presse to calculate the second set of x -/ y-intercepts. Pressingd returns to the first
set of intercepts.
5-11-20
Function Analysis

8/20/2019 _Casio_fx9860GSD_9860G_E
http://slidepdf.com/reader/full/casiofx9860gsd9860ge 276/595
20050401
u To draw and analyze the axis of symmetry and directrix[G-SLV]-[SYM]/[DIR]
○ ○ ○ ○ ○
Example To draw the axis of symmetry and directrix for the parabola
X = 2(Y – 1)2 + 1
Use the following V-Window settings.
Xmin = –6.3, Xmax = 6.3, Xscale = 1
Ymin = –3.1, Ymax = 3.1, Yscale = 1 (initial defaults)
mCONICS
w
cwbwbw6(DRAW)
!5(G-SLV)
2(SYM)
(Draws the axis of symmetry.)
!5(G-SLV)
3(DIR)
(Draws the directrix.)
5-11-21
Function Analysis

8/20/2019 _Casio_fx9860GSD_9860G_E
http://slidepdf.com/reader/full/casiofx9860gsd9860ge 277/595
20050401
uTo draw and analyze the asymptotes [G-SLV]-[ASYM]
○ ○ ○ ○ ○
Example To draw the asymptotes for the hyperbola
(X – 1)2 (Y – 1)2
–––––––– – –––––––– = 122 22
Use the following V-Window settings.
Xmin = –6.3, Xmax = 6.3, Xscale = 1
Ymin = – 5, Ymax = 5, Yscale = 1
m CONICS
cccccccw
cwcwbwbw6(DRAW)
!5(G-SLV)5(ASYM)
(Draws the asymptotes.)
uTo calculate eccentricity [G-SLV]-[e]
○ ○ ○ ○ ○
Example To determine the eccentricity of the graph for ellipse
(X – 2)2 +
(Y – 2)2 = 1
42 22
Use the following V-Window settings.
Xmin = – 3, Xmax = 7, Xscale = 1
Ymin = – 1, Ymax = 5, Yscale = 1
m CONICS
ccccccw
ewcwcwcw6(DRAW)
!5(G-SLV)
6(g)1(e)
(Calculates eccentricity.)
# Certain V-Window parameters can produce
errors in values produced as graph analysis
results.# The message ”Not Found” appears on the
display when graph analysis is unable to
produce a result.
# The following can result in inaccurate analysis
results or may even make it impossible to obtain
a solution at all.- When the solution is tangent to the x -axis.
- When the solution is a point of tangency
between two graphs.
5-11-22
Function Analysis

8/20/2019 _Casio_fx9860GSD_9860G_E
http://slidepdf.com/reader/full/casiofx9860gsd9860ge 278/595
20050401
Chapter
Statistical Graphs andCalculationsThis chapter describes how to input statistical data into lists, how
to calculate the mean, maximum and other statistical values, how
to perform various statistical tests, how to determine the confidence
interval, and how to produce a distribution of statistical data.It also tells you how to perform regression calculations.
6-1 Before Performing Statistical Calculations
6-2 Calculating and Graphing Single-Variable
Statistical Data
6-3 Calculating and Graphing Paired-Variable
Statistical Data
6-4 Performing Statistical Calculations6-5 Tests
6-6 Confidence Interval
6-7 Distribution6-5 Distribution
Important!• This chapter contains a number of graph screen shots. In each case, new
data values were input in order to highlight the particular characteristics of
the graph being drawn. Note that when you try to draw a similar graph, the
unit uses data values that you have input using the List function. Because of
this, the graphs that appear on the screen when you perform a graphing
operation will probably differ somewhat from those shown in this manual.
6

8/20/2019 _Casio_fx9860GSD_9860G_E
http://slidepdf.com/reader/full/casiofx9860gsd9860ge 279/595
20050401
6-1 Before Performing Statistical Calculations
Entering the STAT mode from the Main Menu displays the List Editor screen.
You can use the List Editor screen to input statistical data and perform statistical calculations.
Usef,c,d ande to move
the highlighting around the lists.
Once you input data, you can use it to produce a graph and check for tendencies. You can
also use a variety of different regression calculations to analyze the data.
• For information about using the statistical data lists, see “3. List Function”.
k Inputting Data into Lists
○ ○ ○ ○ ○
Example To input the following two data groups
0.5, 1.2, 2.4, 4.0, 5.2
–2.1, 0.3, 1.5, 2.0, 2.4
a.fwb.cw
c.ewewf.cw
e
-c.bwa.dw
b.fwcwc.ew
Once data is input, you can use it for graphing and statistical calculations.
6-1-1Before Performing Statistical Calculations
# Except for complex numbers, calculation
results can be input as statistical data.
# You can use thef,c,d ande keys to
move the highlighting to any cell in the lists for
data input.

8/20/2019 _Casio_fx9860GSD_9860G_E
http://slidepdf.com/reader/full/casiofx9860gsd9860ge 280/595

8/20/2019 _Casio_fx9860GSD_9860G_E
http://slidepdf.com/reader/full/casiofx9860gsd9860ge 281/595
20050401
• Mark Type
This setting lets you specify the shape of the plot points on the graph.
u To display the general graph settings screen [GRPH]-[SET]
Pressing1(GRPH)6(SET) displays the general graph settings screen.
• The settings shown here are examples only. The settings on your general graph settings
screen may differ.
• StatGraph (statistical graph specification)
• {GPH1} / {GPH2} / {GPH3} ... graph {1}/{2}/{3}
• Graph Type (graph type specification)
• {Scat} / { xy} / {NPP} ... {scatter diagram}/{ xy line graph}/{normal probability plot}
• {Hist} / {Box} / {N·Dis} / {Brkn} ... {histogram}/{med-box graph}/{normal distribution curve}/
{broken line graph}• {X} / {Med} / {X^2} / {X^3} / {X^4} ... {linear regression graph}/{Med-Med graph}/{quadratic
regression graph}/{cubic regression graph}/{quartic regression graph}
• {Log} / {Exp} / {Pwr} / {Sin} / {Lgst} ... {logarithmic regression graph}/{exponential regression
graph}/{power regression graph}/{sinusoidal regression graph}/{logistic regression graph}
• XList ( x-axis data list)
• {LIST} ... {List 1 to 26}
• YList ( y-axis data list)
• {LIST} ... {List 1 to 26}• Frequency (number of times a value occurs)
• {1} ... {1-to-1 plot}
• {LIST} ... frequency data in {List 1 to 26}
• Mark Type (plot mark type)
• { } / {×} / {•} ... scatter diagram plot points
• Outliers (outliers specification)
• {On} / {Off} ... {display}/{do not display} Med-Box outliers
6-1-3 Before Performing Statistical Calculations

8/20/2019 _Casio_fx9860GSD_9860G_E
http://slidepdf.com/reader/full/casiofx9860gsd9860ge 282/595
20050401
2. Graph draw/non-draw status [GRPH]-[SEL]
The following procedure can be used to specify the draw (On)/non-draw (Off) status of each of
the graphs in the graph menu.
u To specify the draw/non-draw status of a graph
1. Pressing1(GRPH)4(SEL) displays the graph On/Off screen.
• Note that the StatGraph1 setting is for Graph 1 (GPH1 of the graph menu), StatGraph2
is for Graph 2, and StatGraph3 is for Graph 3.
2. Use the cursor keys to move the highlighting to the graph whose status you want to
change, and press the applicable function key to change the status.
• {On} / {Off} ... {On (draw)}/{Off (non-draw)}
• {DRAW} ... {draws all On graphs}
3. To return to the graph menu, pressJ.
6-1-4 Before Performing Statistical Calculations
# V-Window parameters are normally set
automatically for statistical graphing. If you
want to set V-Window parameters manually,
you must change the Stat Wind item to
“Manual”.
While the statistical data list is on the display,
perform the following procedure.
!m(SET UP)2(Man)
J(Returns to previous menu.)
Note that V-Window parameters are set
automatically for the following types of graphs
regardless of whether or not the Stat Wind
item is set to “Manual”.
1-Sample Z Test, 2-Sample Z Test, 1-Prop Z Test, 2-Prop Z Test, 1-Sample t Test, 2-Sample
t Test, χ2 Test, 2-Sample F Test ( x -axis only
disregarded).
# The default setting automatically uses List 1
data as x -axis (horizontal) values and List 2
data as y-axis (vertical) values. Each set of x/ydata is a point on the scatter diagram.

8/20/2019 _Casio_fx9860GSD_9860G_E
http://slidepdf.com/reader/full/casiofx9860gsd9860ge 283/595

8/20/2019 _Casio_fx9860GSD_9860G_E
http://slidepdf.com/reader/full/casiofx9860gsd9860ge 284/595
20050401
kMed-box Graph (MedBox)
This type of graph lets you see how a large number of data items are grouped within specific
ranges. A box encloses all the data in an area from the first quartile (Q1) to the third quartile(Q3), with a line drawn at the median (Med). Lines (called whiskers) extend from either end
of the box up to the minimum (minX) and maximum (maxX) of the data.
From the statistical data list, press1(GRPH) to display the graph menu, press6(SET),
and then change the graph type of the graph you want to use (GPH1, GPH2, GPH3) to
med-box graph.
To plot the data that falls outside the box, first specify “MedBox” as the Graph Type. Then, on
the same screen you use to specify the graph type, turn the Outliers item “On”, and draw the
graph.
6-2-2 Calculating and Graphing Single-Variable Statistical Data
minX
MedQ1 Q3 maxX

8/20/2019 _Casio_fx9860GSD_9860G_E
http://slidepdf.com/reader/full/casiofx9860gsd9860ge 285/595
20050401
kNormal Distribution Curve (N • Dis)
The normal distribution curve is graphed using the following normal distribution function.
y =1
(2 π) x σn
e–
2 x σn
2( x – x ) 2
XList specifies the list where the data is input, while Freq specifies the list where the data
frequency is input. 1 is specified for Freq when frequency is not specified.
kBroken Line Graph (Brkn)
Lines connect center points of a histogram bar.
XList specifies the list where the data is input, while Freq specifies the list where the data
frequency is input. 1 is specified for Freq when frequency is not specified.
6-2-3 Calculating and Graphing Single-Variable Statistical Data
⇒
w(Draw)
The display screen appears as shown above before the graph is drawn. At this point, you
can change the Start and Width values.

8/20/2019 _Casio_fx9860GSD_9860G_E
http://slidepdf.com/reader/full/casiofx9860gsd9860ge 286/595
20050401
kDisplaying the Calculation Results of a Drawn Single-Variable Graph
Single-variable statistics can be expressed as both graphs and parameter values. When
these graphs are displayed, the single-variable calculation results appear as shown belowwhen you press1(1VAR).
• Usec to scroll the list so you can view the items that run off the bottom of the screen.
The following describes the meaning of each of the parameters.
o ............. mean
Σ x ........... sum
Σ x 2 .......... sum of squares
x σn .......... population standard deviation
x σn–1 ........ sample standard deviation
n ............. number of data items
minX ....... minimum
Q1 .......... first quartile
Med ........ median
Q3 .......... third quartile
maxX ...... maximum
Mod ........ mode
Mod : n ... number of data mode items
Mod : F ... data mode frequency
• Press6(DRAW) to return to the original single-variable statistical graph.
6-2-4 Calculating and Graphing Single-Variable Statistical Data
# When Mod has multiple solutions, they are all
displayed.

8/20/2019 _Casio_fx9860GSD_9860G_E
http://slidepdf.com/reader/full/casiofx9860gsd9860ge 287/595
20050401
6-3-1Calculating and Graphing Paired-Variable Statistical Data
6-3 Calculating and Graphing Paired-Variable
Statistical Data
k Drawing a Scatter Diagram and xy Line Graph
Description
The following procedure plots a scatter diagram and connects the dots to produce an xy line
graph.
Set Up1. From the Main Menu, enter the STAT mode.
Execution
2. Input the data into a list.
3. Specify Scat (scatter diagram) or xy ( xy line graph) as the graph type, and then
execute the graph operation.
PressA,J or!J(QUIT) to return to the statistical data list.

8/20/2019 _Casio_fx9860GSD_9860G_E
http://slidepdf.com/reader/full/casiofx9860gsd9860ge 288/595
20050401
○ ○ ○ ○ ○
Example Input the two sets of data shown below. Next, plot the data on a
scatter diagram and connect the dots to produce an xy line graph.
0.5, 1.2, 2.4, 4.0, 5.2 ( xList)–2.1, 0.3, 1.5, 2.0, 2.4 ( yList)
Procedure
1m STAT
2 a.fwb.cw
c.ewewf.cw
e
-c.bwa.dw
b.fwcwc.ew
3 (Scatter diagram)1(GRPH)6(SET)c1(Scat)J
1(GPH1)
3 ( xy line graph)1(GRPH)6(SET)c2( xy)J
1(GPH1)
Result Screen
(Scatter diagram)
( xy line graph)
6-3-2 Calculating and Graphing Paired-Variable Statistical Data

8/20/2019 _Casio_fx9860GSD_9860G_E
http://slidepdf.com/reader/full/casiofx9860gsd9860ge 289/595
20050401
k Drawing a Regression Graph
Description
Use the following procedure to input paired-variable statistical data, perform a regressioncalculation using the data, and then graph the results.
Set Up
1. From the Main Menu, enter the STAT mode.
Execution
2. Input the data into a list, and plot the scatter diagram.
3. Select the regression type, execute the calculation, and display the regression
parameters.
4. Draw the regression graph.
6-3-3 Calculating and Graphing Paired-Variable Statistical Data
# You can perform trace on a regression graph.
You cannot perform trace scroll.

8/20/2019 _Casio_fx9860GSD_9860G_E
http://slidepdf.com/reader/full/casiofx9860gsd9860ge 290/595
20050401
○ ○ ○ ○ ○
Example Input the two sets of data shown below and plot the data on a scatter
diagram. Next, perform logarithmic regression on the data to display
the regression parameters, and then draw the corresponding
regression graph.
0.5, 1.2, 2.4, 4.0, 5.2 ( xList)
–2.1, 0.3, 1.5, 2.0, 2.4 ( yList)
Procedure
1m STAT
2 a.fwb.cw
c.ewewf.cwe
-c.bwa.dw
b.fwcwc.ew
1(GRPH)6(SET)c1(Scat)J
1(GPH1)
31(CALC)6(g)2(Log)
46(DRAW)
Result Screen
6-3-4 Calculating and Graphing Paired-Variable Statistical Data

8/20/2019 _Casio_fx9860GSD_9860G_E
http://slidepdf.com/reader/full/casiofx9860gsd9860ge 291/595
20050401
kkkkk Selecting the Regression Type
After you graph paired-variable statistical data, press1(CALC). Then you can use the
function menu at the bottom of the display to select from a variety of different types ofregression.
• {2VAR} ... {paired-variable statistical results}
• {X} / {Med} / {X^2} / {X^3} / {X^4} / {Log} / {Exp} / {Pwr} / {Sin} / {Lgst}
... {linear regression}/{Med-Med}/{quadratic regression}/{cubic regression}/{quartic
regression}/{logarithmic regression}/{exponential regression}/{power regression}/
{sinusoidal regression}/{logistic regression} calculation and graphing
kkkkkDisplaying Regression Calculation Results
Whenever you perform a regression calculation, the regression formula parameter (such as
a and b in the linear regression y = ax + b) calculation results appear on the display. You can
use these to obtain statistical calculation results.
Regression parameters are calculated as soon as you press a function key to select a
regression type, while a graph is on the display.
kkkkkGraphing Statistical Calculation ResultsWhile the parameter calculation result is on the display, you can graph the displayed
regression formula by pressing6(DRAW).
6-3-5 Calculating and Graphing Paired-Variable Statistical Data

8/20/2019 _Casio_fx9860GSD_9860G_E
http://slidepdf.com/reader/full/casiofx9860gsd9860ge 292/595
20050401
kkkkk Linear Regression Graph
Linear regression uses the method of least squares to plot a straight line that passes close to
as many data points as possible, and returns values for the slope and y-intercept( y-coordinate when x = 0) of the line.
The graphic representation of this relationship is a linear regression graph.
1(CALC)2(X)
6(DRAW)
The following is the linear regression model formula.
y = ax + b
a ............. regression coefficient (slope)
b ............. regression constant term ( y-intercept)
r ............. correlation coefficient
r 2 ............ coefficient of determination
MSe ........ mean square error
kkkkkMed-Med Graph
When it is suspected that there are a number of extreme values, a Med-Med graph can be
used in place of the least squares method. This is similar to linear regression, but it
minimizes the effects of extreme values.
1(CALC)3(Med)
6(DRAW)
The following is the Med-Med graph model formula.
y = ax + b
a ............. Med-Med graph slope
b ............. Med-Med graph y-intercept
6-3-6 Calculating and Graphing Paired-Variable Statistical Data
# Input a positive integer for frequency data.
Other types of values (decimals, etc.) cause
an error.

8/20/2019 _Casio_fx9860GSD_9860G_E
http://slidepdf.com/reader/full/casiofx9860gsd9860ge 293/595
20050401
kkkkkQuadratic/Cubic/Quartic Regression Graph
A quadratic/cubic/quartic regression graph represents connection of the data points of a
scatter diagram. It uses the method of least squares to draw a curve that passes close to asmany data points as possible. The formula that represents this is quadratic/cubic/quartic
regression.
Ex. Quadratic regression
1(CALC)4(X^2)
6(DRAW)
Quadratic regression
Model formula ..... y = ax 2 + bx + c
a ............. regression second coefficient
b ............. regression first coefficient
c ............. regression constant term ( y-intercept)
r 2 ............ coefficient of determination
MSe ........ mean square error
Cubic regression
Model formula ..... y = ax 3 + bx 2 + cx + d
a ............. regression third coefficient
b ............. regression second coefficient
c ............. regression first coefficient
d ............. regression constant term ( y-intercept)
r 2 ............ coefficient of determination
MSe ........ mean square error
Quartic regression
Model formula ..... y = ax 4 + bx 3 + cx 2 + dx + e
a ............. regression fourth coefficient
b ............. regression third coefficient
c ............. regression second coefficient
d ............. regression first coefficient
e ............. regression constant term ( y-intercept)
r 2 ............ coefficient of determination
MSe ........ mean square error
6-3-7 Calculating and Graphing Paired-Variable Statistical Data

8/20/2019 _Casio_fx9860GSD_9860G_E
http://slidepdf.com/reader/full/casiofx9860gsd9860ge 294/595
20050401
k Logarithmic Regression Graph
Logarithmic regression expresses y as a logarithmic function of x . The standard logarithmic
regression formula is y = a + b × In x , so if we say that X = In x , the formula corresponds tolinear regression formula y = a + bX.
1(CALC)6(g)2(Log)
6(DRAW)
The following is the logarithmic regression model formula.
y = a + b • ln x
a ............. regression constant termb ............. regression coefficient
r .............. correlation coefficient
r 2 ............ coefficient of determination
MSe ........ mean square error
k Exponential Regression Graph
Exponential regression expresses y as a proportion of the exponential function of x . The
standard exponential regression formula is y = a × ebx , so if we take the logarithms of both
sides we get In y = In a + bx . Next, if we say Y = In y, and A = In a, the formula corresponds
to linear regression formula Y = A + bx .
1(CALC)6(g)3(Exp)
6(DRAW)
The following is the exponential regression model formula.
y = a • ebx
a ............. regression coefficient
b ............. regression constant term
r .............. correlation coefficient
r 2 ............ coefficient of determination
MSe ........ mean square error
6-3-8 Calculating and Graphing Paired-Variable Statistical Data

8/20/2019 _Casio_fx9860GSD_9860G_E
http://slidepdf.com/reader/full/casiofx9860gsd9860ge 295/595
20050401
kkkkk Power Regression Graph
Power regression expresses y as a proportion of the power of x . The standard power
regression formula is y = a ×
x b
, so if we take the logarithm of both sides we get In y = In a +b × In x . Next, if we say X = In x , Y = In y, and A = In a, the formula corresponds to linear
regression formula Y = A + bX.
1(CALC)6(g)4(Pwr)
6(DRAW)
The following is the power regression model formula.
y = a • x b
a ............. regression coefficient
b ............. regression power
r .............. correlation coefficient
r 2 ............. coefficient of determination
MSe ........ mean square error
kkkkk Sinusoidal Regression Graph
Sinusoidal regression is best applied for cyclical data.The following is the sinusoidal regression model formula.
y = a·sin(bx + c) + d
While the statistical data list is on the display, perform the following key operation.
1(CALC)6(g)5(Sin)
6(DRAW)
Make sure that the angle unit setting of the calculator is Rad (radians) when drawing a
sinusoidal regression graph. The sinusoidal regression calculation is performed using
radians, so the graph will cannot be drawn correctly if the angle unit setting is something
else.
• Certain types of data may take a long time to calculate. This does not indicate malfunction.
6-3-9 Calculating and Graphing Paired-Variable Statistical Data
20060601

8/20/2019 _Casio_fx9860GSD_9860G_E
http://slidepdf.com/reader/full/casiofx9860gsd9860ge 296/595
20050401
kkkkk Logistic Regression Graph
Logistic regression is best applied for time-based phenomena in which there is a continual
increase until a saturation point is reached.The following is the logistic regression model formula.
y = c
1 + ae –bx
1(CALC)6(g)6(g)1(Lgst)
6(DRAW)
• Certain types of data may take a long time to calculate. This does not indicate malfunction.
kkkkkResidual Calculation
Actual plot points ( y-coordinates) and regression model distance can be calculated during
regression calculations.
While the statistical data list is on the display, recall the Setup screen to specify a LIST (“List
1” through “List 26”) for “Resid List”. Calculated residual data is stored in the specified list.
The vertical distance from the plots to the regression model will be stored in the list.
Plots that are higher than the regression model are positive, while those that are lower are
negative.
Residual calculation can be performed and saved for all regression models.
6-3-10 Calculating and Graphing Paired-Variable Statistical Data
# Any data already existing in the selected list iscleared. The residual of each plot is stored in
the same precedence as the data used as the
model.

8/20/2019 _Casio_fx9860GSD_9860G_E
http://slidepdf.com/reader/full/casiofx9860gsd9860ge 297/595
20050401
kkkkkDisplaying the Calculation Results of a Drawn Paired-Variable Graph
Paired-variable statistics can be expressed as both graphs and parameter values. When
these graphs are displayed, the paired-variable calculation results appear as shown belowwhen you press1(CALC)1(2VAR).
• Usec to scroll the list so you can view the items that run off the bottom of the screen.
o ............... mean of data stored in x ListΣ x ............. sum of data stored in x List
Σ x 2 ........... sum of squares of data
stored in x List
x σn ............ population standard
deviation of data stored in
x List
x σn-1 .......... sample standard deviation
of data stored in x List
n ............... number of data
p ............... mean of data stored in yList
Σ y ............. sum of data stored in yList
kkkkkCopying a Regression Graph Formula to the GRAPH Mode
You can copy regression formula calculation results to the GRAPH mode graph relation list,
and store and compare.
1. While a regression calculation result is on the display (see “Displaying Regression
Calculation Results” on page 6-3-5), press5(COPY).
• This will display the GRAPH mode graph relation list.*1
2. Usef andc to highlight the area to which you want to copy the regression formula
of the displayed result.
3. Pressw to save the copied graph formula and return to the previous regression
calculation result display.
6-3-11Calculating and Graphing Paired-Variable Statistical Data
Σ y2
...... sum of squares of data stored in yList yσn ...... population standard deviation of data
stored in yList
yσn-1 .... sample standard deviation of data
stored in yList
Σ xy ..... sum of the product of data stored in
x List and yList
minX ... minimum of data stored in x List
maxX.. maximum of data stored in x List
minY ... minimum of data stored in yList
maxY.. maximum of data stored in yList
*1You cannot edit regression formulas for graph
formulas in the GRAPH mode.

8/20/2019 _Casio_fx9860GSD_9860G_E
http://slidepdf.com/reader/full/casiofx9860gsd9860ge 298/595
20050401
kkkkkMultiple Graphs
You can draw more than one graph on the same display by using the procedure under
“Changing Graph Parameters” to set the graph draw (On)/non-draw (Off) status of two or allthree of the graphs to draw On, and then pressing6(DRAW)(see page 6-1-4). After
drawing the graphs, you can select which graph formula to use when performing single-
variable statistic or regression calculations.
1(CALC)
2(X)
• The text at the top of the screen indicates the currently selected graph (StatGraph1 =
Graph 1, StatGraph2 = Graph 2, StatGraph3 = Graph 3).
1. Pressc. The graph name at the top of the screen changes when you do.
2. When the graph you want to use is selected, pressw.
6-3-12 Calculating and Graphing Paired-Variable Statistical Data

8/20/2019 _Casio_fx9860GSD_9860G_E
http://slidepdf.com/reader/full/casiofx9860gsd9860ge 299/595
20050401
k Overlaying a Function Graph on a Statistical Graph
Description
You can overlay a paired-variable statistical graph with any type of function graph you want.
Set Up
1. From the Main Menu, enter the STAT mode.
Execution
2. Input the data into a list, and draw the statistical graph.
3. Display the Graph Function menu, and input the function you want to overlay on the
statistical graph.
4. Graph the function.
6-3-13 Calculating and Graphing Paired-Variable Statistical Data

8/20/2019 _Casio_fx9860GSD_9860G_E
http://slidepdf.com/reader/full/casiofx9860gsd9860ge 300/595
20050401
○ ○ ○ ○ ○
Example Input the two sets of data shown below. Next, plot the data on a
scatter diagram and overlay a function graph y = 2ln x.
0.5, 1.2, 2.4, 4.0, 5.2
–2.1, 0.3, 1.5, 2.0, 2.4
Procedure
1m STAT
2 a.fwb.cw
c.ewewf.cw
e
-c.bwa.dw
b.fwcwc.ew
1(GRPH)1(GPH1)
32(DefG)
cIvw(Register Y1 = 2In x )
46(DRAW)
Result Screen
6-3-14 Calculating and Graphing Paired-Variable Statistical Data
# You can also perform trace, etc. for drawnfunction graphs.
# Graphs of types other than rectangular
coordinate graphs cannot be drawn.
# PressingJ while inputting a function returnsthe expression to what it was prior to input.
Pressing!J(QUIT) clears the input
expression and returns to the statistical data list.

8/20/2019 _Casio_fx9860GSD_9860G_E
http://slidepdf.com/reader/full/casiofx9860gsd9860ge 301/595
20050401
6-4 Performing Statistical Calculations
All of the statistical calculations up to this point were performed after displaying a graph. The
following procedures can be used to perform statistical calculations alone.
uuuuu To specify statistical calculation data lists
You have to input the statistical data for the calculation you want to perform and specify
where it is located before you start a calculation. Display the statistical data and then press
2(CALC)6(SET).
The following is the meaning for each item.
1Var XList ............ location of single-variable statistic x values (XList)
1Var Freq ............ location of single-variable frequency values (Frequency)
2Var XList ............ location of paired-variable statistic x values (XList)
2Var YList ............ location of paired-variable statistic y values (YList)
2Var Freq ............ location of paired-variable frequency values (Frequency)
• Calculations in this section are performed based on the above specifications.
6-4-1Performing Statistical Calculations

8/20/2019 _Casio_fx9860GSD_9860G_E
http://slidepdf.com/reader/full/casiofx9860gsd9860ge 302/595
20050401
kkkkk Single-Variable Statistical Calculations
In the previous example under “Displaying the Calculation Results of a Drawn Single-
Variable Graph”, statistical calculation results were displayed after the graph was drawn.These were numeric expressions of the characteristics of variables used in the graphic
display.
These values can also be directly obtained by displaying the statistical data list and pressing
2(CALC)1(1VAR).
After this, pressingf orc scrolls the statistical calculation result display so you can view
variable characteristics.
For details on the meanings of these statistical values, see “Displaying the Calculation
Results of a Drawn Single-Variable Graph” (page 6-2-4).
kkkkk Paired-Variable Statistical Calculations
In the previous example under “Displaying the Calculation Results of a Drawn Paired-
Variable Graph”, statistical calculation results were displayed after the graph was drawn.
These were numeric expressions of the characteristics of variables used in the graphic
display.
These values can also be directly obtained by displaying the statistical data list and pressing
2(CALC)2(2VAR).
After this, pressingf orc scrolls the statistical calculation result display so you can view
variable characteristics.
For details on the meanings of these statistical values, see “Displaying the Calculation
Results of a Drawn Paired-Variable Graph” (page 6-3-11).
6-4-2 Performing Statistical Calculations

8/20/2019 _Casio_fx9860GSD_9860G_E
http://slidepdf.com/reader/full/casiofx9860gsd9860ge 303/595
20050401
kRegression Calculation
In the explanations from “Linear Regression Graph” to “Logistic Regression Graph,”
regression calculation results were displayed after the graph was drawn. Here, eachcoefficient value of the regression line or regression curve is expressed as a number.
You can directly determine the same expression from the data input screen.
Pressing2(CALC)3(REG) displays a function menu, which contains the following items.
• {X} / {Med} / {X^2} / {X^3} / {X^4} / {Log} / {Exp} / {Pwr} / {Sin} / {Lgst} ...
{linear regression}/{Med-Med}/{quadratic regression}/{cubic regression}/
{quartic regression}/{logarithmic regression}/{exponential regression}/
{power regression}/{sinusoidal regression}/{logistic regression} parameters
○ ○ ○ ○ ○
Example To display single-variable regression parameters
2(CALC)3(REG)1(X)
The meanings of the parameters that appear on this screen are the same as those for
“Linear Regression Graph” to “Logistic Regression Graph”.
uuuuu Calculation of the Coefficient of Determination (r2) and MSe
You can use the STAT mode to calculate the coefficient of determination (r2) for quadratic
regression, cubic regression, and quartic regression. The following types of MSe calculations
are also available for each type of regression.
6-4-3 Performing Statistical Calculations

8/20/2019 _Casio_fx9860GSD_9860G_E
http://slidepdf.com/reader/full/casiofx9860gsd9860ge 304/595
20050401
• Linear Regression ... MSe = Σ1
n – 2 i=1
n
( yi – (ax i+ b))2
• Quadratic Regression ... MSe = Σ1n – 3 i=1
n
( yi – (ax i + bx i+ c))22
• Cubic Regression ... MSe = Σ1
n – 4 i=1
n
( yi – (ax i3+ bx i + cx i +d ))22
• Quartic Regression ... MSe = Σ1
n – 5 i=1
n
( yi – (ax i4+ bx i3 + cx i + dx i
+ e))22
• Logarithmic Regression ... MSe = Σ1
n – 2 i=1
n
( yi – (a + b ln x i ))2
• Exponential Repression ... MSe = Σ1
n – 2 i=1
n
(ln yi – (lna + bx i ))2
• Power Regression ... MSe = Σ1
n – 2 i=1
n
(ln yi – (lna + b ln x i ))2
• Sin Regression ... MSe = Σ1
n – 2 i=1
n
( yi – (a sin (bx i + c) + d ))2
• Logistic Regression ... MSe = Σ1
n – 2 1 + ae-bx i C
i=1
n
yi –2
uuuuuEstimated Value Calculation for Regression Graphs
The STAT mode also includes a Y-CAL function that uses regression to calculate the
estimated y-value for a particular x -value after graphing a paired-variable statistical
regression.
The following is the general procedure for using the Y-CAL function.
1. After drawing a regression graph, press!5(G-SLV)1(Y-CAL) to enter the graph
selection mode, and then pressw.
If there are multiple graphs on the display, usef andc to select the graph you
want, and then pressw.
• This causes an x -value input dialog box to appear.
6-4-4 Performing Statistical Calculations

8/20/2019 _Casio_fx9860GSD_9860G_E
http://slidepdf.com/reader/full/casiofx9860gsd9860ge 305/595
20050401
2. Input the value you want for x and then pressw.
• This causes the coordinates for x and y to appear at the bottom of the display, and
moves the pointer to the corresponding point on the graph.
3. Pressingv or a number key at this time causes the x -value input dialog box to
reappear so you can perform another estimated value calculation if you want.
4. After you are finished, pressJ to clear the coordinate values and the pointer from
the display.
• The pointer does not appear if the calculated coordinates are not within the displayrange.
• The coordinates do not appear if “Off” is specified for the “Coord” item of the Setup
screen.
• The Y-CAL function can also be used with a graph drawn by using DefG feature.
uuuuu Regression Formula Copy Function from a Regression Calculation ResultScreen
In addition to the normal regression formula copy function that lets you copy the regressioncalculation result screen after drawing a statistical graph (such as Scatter Plot), the STAT
mode also has a function that lets you copy the regression formula obtained as the result of
a regression calculation. To copy a resulting regression formula, press6(COPY).
6-4-5 Performing Statistical Calculations

8/20/2019 _Casio_fx9860GSD_9860G_E
http://slidepdf.com/reader/full/casiofx9860gsd9860ge 306/595
20050401
k Estimated Value Calculation ( , )
After drawing a regression graph with the STAT mode, you can use the RUN • MAT mode to
calculate estimated values for the regression graph’s x and y parameters. ○ ○ ○ ○ ○
Example To perform a linear regression using the nearby data
and estimate the values of and when xi = 20 and
yi = 1000
1. From the Main Menu, enter the STAT mode.
2. Input data into the list and draw the linear regression graph.
3. From the Main Menu, enter the RUN • MAT mode.
4. Press the keys as follows.
ca(value of xi)
K5(STAT)2( )w
The estimated value is displayed for xi = 20.
baaa(value of yi)
1( )w
The estimated value is displayed for yi = 1000.
6-4-6 Performing Statistical Calculations
xi yi
10 1003
15 1005
20 1010
25 1011
30 1014
# You cannot obtain estimated values for a Med-
Med, quadratic regression, cubic regression,
quartic regression, sinusoidal regression, or
logistic regression graph.

8/20/2019 _Casio_fx9860GSD_9860G_E
http://slidepdf.com/reader/full/casiofx9860gsd9860ge 307/595
20050401
kNormal Probability Distribution Calculation
You can calculate normal probability distributions for single-variable statistics with the
RUN • MAT mode.PressK6(g)3(PROB)6(g) to display a function menu, which contains the following
items.
• {P(} / {Q(} / {R(} ... obtains normal probability {P(t )}/{Q(t )}/{R(t )} value
• { t(} ... {obtains normalized variate t ( x ) value}
• Normal probability P(t ), Q(t ), and R(t ), and normalized variate t ( x ) are calculated using
the following formulas.
Standard Normal Distribution
P (t ) Q (t ) R (t )
t t t 0 0 0
○ ○ ○ ○ ○
Example The following table shows the results of measurements of the height
of 20 college students. Determine what percentage of the students fall
in the range 160.5 cm to 175.5 cm. Also, in what percentile does the
175.5 cm tall student fall?
Class no. Height (cm) Frequency
1 158.5 1
2 160.5 1
3 163.3 2
4 167.5 2
5 170.2 3
6 173.3 4
7 175.5 2
8 178.6 2
9 180.4 2
10 186.7 1
6-4-7 Performing Statistical Calculations

8/20/2019 _Casio_fx9860GSD_9860G_E
http://slidepdf.com/reader/full/casiofx9860gsd9860ge 308/595
20050401
1. From the Main Menu, enter the STAT mode.
2. Input the height data into List 1 and the frequency data into List 2.
3. Perform the single-variable statistical calculations.*1
2(CALC)6(SET)
1(LIST)bw
c2(LIST)cw!J(QUIT)
2(CALC)1(1VAR)
4. Pressm, select the RUN • MAT mode, pressK6(g)3(PROB) to recall the
probability calculation (PROB) menu.
3(PROB)6(g)4(t ()bga.f)w
(Normalized variate t for 160.5cm) Result: –1.633855948
( –1.634)
4(t ()bhf.f)w
(Normalized variate t for 175.5cm) Result: 0.4963343361( 0.496)
1(P()a.ejg)-
1(P()-b.gde)w
(Percentage of total) Result: 0.638921
(63.9% of total)
3(R()a.ejg)w
(Percentile) Result: 0.30995(31.0 percentile)
6-4-8 Performing Statistical Calculations
*1You can obtain the normalized variate
immediately after performing single-variable
statistical calculations only.

8/20/2019 _Casio_fx9860GSD_9860G_E
http://slidepdf.com/reader/full/casiofx9860gsd9860ge 309/595
20050401
6-4-9 Performing Statistical Calculations
k Drawing a Normal Probability Distribution Graph
Description
You can draw a normal probability distribution graph using manual graphing with theRUN • MAT mode.
Set Up
1. From the Main Menu, enter the RUN • MAT mode.
Execution
2. Input the commands to draw a rectangular coordinate graph.
3. Input the probability value.

8/20/2019 _Casio_fx9860GSD_9860G_E
http://slidepdf.com/reader/full/casiofx9860gsd9860ge 310/595
20050401
6-4-10 Performing Statistical Calculations
○ ○ ○ ○ ○
Example To draw a normal probability P (0.5) graph.
Procedure
1m RUN • MAT
2!4(SKTCH)1(Cls)w
5(GRPH)1(Y=)
3K6(g)3(PROB)6(g)1(P()a.fw
Result Screen

8/20/2019 _Casio_fx9860GSD_9860G_E
http://slidepdf.com/reader/full/casiofx9860gsd9860ge 311/595
20050401
6-5 Tests
The Z Test provides a variety of different standardization-based tests. They make it possible
to test whether or not a sample accurately represents the population when the standarddeviation of a population (such as the entire population of a country) is known from previous
tests. Z testing is used for market research and public opinion research, that need to be
performed repeatedly.
1-Sample Z Test tests for the unknown population mean when the population standard
deviation is known.
2-Sample Z Test tests the equality of the means of two populations based on independent
samples when both population standard deviations are known.
1-Prop Z Test tests for an unknown proportion of successes.
2-Prop Z
Test tests to compare the proportion of successes from two populations.
The t Test tests the hypothesis when the population standard deviation is unknown. The
hypothesis that is the opposite of the hypothesis being proven is called the null hypothesis ,
while the hypothesis being proved is called the alternative hypothesis . The t -test is normally
applied to test the null hypothesis. Then a determination is made whether the null hypothesis
or alternative hypothesis will be adopted.
1-Sample t Test tests the hypothesis for a single unknown population mean when the
population standard deviation is unknown.
2-Sample t Test compares the population means when the population standard deviations
are unknown.
LinearReg t Test calculates the strength of the linear association of paired data.
χ 2 Test tests hypothesis concerning the proportion of samples included in each of a number
of independent groups. Mainly, it generates cross-tabulation of two categorical variables
(such as yes, no) and evaluates the independence of these variables. It could be used, for
example, to evaluate the relationship between whether or not a driver has ever been involved
in a traffic accident and that person’s knowledge of traffic regulations.
2-Sample F Test tests the hypothesis for the ratio of sample variances. It could be used, for
example, to test the carcinogenic effects of multiple suspected factors such as tobacco use,
alcohol, vitamin deficiency, high coffee intake, inactivity, poor living habits, etc.
ANOVA tests the hypothesis that the population means of the samples are equal when there
are multiple samples. It could be used, for example, to test whether or not different
combinations of materials have an effect on the quality and life of a final product.
One-Way ANOVA is used when there is one independent variable and one dependent
variable.
Two-Way ANOVA is used when there are two independent variables and one dependent
variable.
6-5-1
Tests

8/20/2019 _Casio_fx9860GSD_9860G_E
http://slidepdf.com/reader/full/casiofx9860gsd9860ge 312/595
20050401
The following pages explain various statistical calculation methods based on the principles
described above. Details concerning statistical principles and terminology can be found in
any standard statistics textbook.
On the initial STAT mode screen, press3(TEST) to display the test menu, which contains
the following items.
•3(TEST)1(Z) ... Z Tests (page 6-5-2)
2(t) ... t Tests (page 6-5-10)
3(CHI) ... χ2 Test (page 6-5-18)
4(F) ... 2-Sample F Test (page 6-5-20)
5(ANOV) ... ANOVA (page 6-5-22)
kkkkk Z Tests
uuuuu Z Test Common Functions
You can use the following graph analysis functions after drawing a Z Test result output graph.
•1(Z) ... Displays z score.
Pressing1(Z) displays the z score at the bottom of the display, and displays the pointer at
the corresponding location in the graph (unless the location is off the graph screen).Two points are displayed in the case of a two-tail test. Used ande to move the pointer.
PressJ to clear the z score.
•2(P) ... Displays p-value.
Pressing2(P) displays the p-value at the bottom of the display without displaying the
pointer.
PressJ to clear the p-value.
uuuuu 1-Sample Z Test
This test is used when the population standard deviation is known to test the hypothesis. The
1-Sample Z Test is applied to the normal distribution.
Z = o – 0
σ
µ
n
o : mean of sample
µ o : assumed population mean
σ : population standard deviation
n : size of sample
6-5-2
Tests
# The following V-Window settings are used for
drawing the graph.
Xmin = –3.2, Xmax = 3.2, Xscale = 1,
Ymin = –0.1, Ymax = 0.45, Yscale = 0.1
# Executing an analysis function automatically
stores the z and p values in alpha variables Z
and P, respectively.

8/20/2019 _Casio_fx9860GSD_9860G_E
http://slidepdf.com/reader/full/casiofx9860gsd9860ge 313/595
20050401
Perform the following key operations from the statistical data list.
3(TEST)
1(Z)
1(1-S)
The following shows the meaning of each item in the case of list data specification.
Data ............................ data type
µ .................................. population mean value test conditions (“G µ 0” specifies
two-tail test, “< µ 0” specifies lower one-tail test, “> µ 0”
specifies upper one-tail test.)
µ 0 ................................. assumed population mean
σ .................................. population standard deviation (σ > 0)
List .............................. list whose contents you want to use as data (List 1 to 26)
Freq............................. frequency (1 or List 1 to 26)
Save Res .................... list for storage of calculation results (None or List 1 to 26)
Execute ....................... executes a calculation or draws a graph
The following shows the meaning of parameter data specification items that are differentfrom list data specification.
o .................................. mean of sample
n .................................. size of sample (positive integer)
After setting all the parameters, usec to move the highlighting to “Execute” and then press
one of the function keys shown below to perform the calculation or draw the graph.
• 1(CALC) ... Performs the calculation.
• 6(DRAW) ... Draws the graph.
6-5-3
Tests

8/20/2019 _Casio_fx9860GSD_9860G_E
http://slidepdf.com/reader/full/casiofx9860gsd9860ge 314/595
20050401
Calculation Result Output Example
µ G11.4 ........................ direction of test
z .................................. z score
p .................................. p-value
o .................................. mean of sample
x σ n-1 ............................. sample standard deviation
(Displayed only for Data: List setting.)
n .................................. size of sample
• For details about graph screen function keys1(Z) and2(P), see “ Z Test
Common Functions” on page 6-5-2.
# [Save Res] does not save the µ condition in
line 2.
6-5-4
Tests

8/20/2019 _Casio_fx9860GSD_9860G_E
http://slidepdf.com/reader/full/casiofx9860gsd9860ge 315/595
20050401
uuuuu 2-Sample Z Test
This test is used when the standard deviations for two populations are known to test the
hypothesis. The 2-Sample Z
Test is applied to the normal distribution.
Z = o 1 – o 2
σ
n1
12
σ
n2
22
+
o 1 : mean of sample 1
o 2 : mean of sample 2
σ 1 : population standard deviation of sample 1
σ 2 : population standard deviation of sample 2
n1 : size of sample 1
n2 : size of sample 2
Perform the following key operations from the statistical data list.
3(TEST)1(Z)
2(2-S)
The following shows the meaning of each item in the case of list data specification.
Data ............................ data type
µ 1 ................................. population mean value test conditions (“G µ 2” specifies two-
tail test, “< µ 2” specifies one-tail test where sample 1 is
smaller than sample 2, “> µ 2” specifies one-tail test where
sample 1 is greater than sample 2.)
σ 1 ................................. population standard deviation of sample 1 (σ 1 > 0)
σ 2 ................................. population standard deviation of sample 2 (σ 2 > 0)
List(1) .......................... list whose contents you want to use as sample 1 data
(List 1 to 26)
List(2) .......................... list whose contents you want to use as sample 2 data
(List 1 to 26)
Freq(1) ........................ frequency of sample 1 (1 or List 1 to 26)
Freq(2) ........................ frequency of sample 2 (1 or List 1 to 26)
Save Res .................... list for storage of calculation results (None or List 1 to 26)
Execute ....................... executes a calculation or draws a graph
6-5-5
Tests

8/20/2019 _Casio_fx9860GSD_9860G_E
http://slidepdf.com/reader/full/casiofx9860gsd9860ge 316/595
20050401
The following shows the meaning of parameter data specification items that are different
from list data specification.
o 1 ................................. mean of sample 1
n1 ................................. size (positive integer) of sample 1
o 2 ................................. mean of sample 2
n2 ................................. size (positive integer) of sample 2
After setting all the parameters, usec to move the highlighting to “Execute” and then press
one of the function keys shown below to perform the calculation or draw the graph.
•1(CALC) ... Performs the calculation.
•6(DRAW) ... Draws the graph.
Calculation Result Output Example
µ 1Gµ 2 ........................... direction of test
z ................................... z score
p .................................. p-value
o 1 ................................. mean of sample 1
o 2 ................................. mean of sample 2
x 1σ n-1 ............................ standard deviation of sample 1
(Displayed only for Data: List setting.)
x 2σ n-1 ............................ standard deviation of sample 2(Displayed only for Data: List setting.)
n1 ................................. size of sample 1
n2 ................................. size of sample 2
• For details about graph screen function keys1(Z) and2(P), see “ Z Test
Common Functions” on page 6-5-2.
# [Save Res] does not save the µ 1 condition in
line 2.
6-5-6
Tests

8/20/2019 _Casio_fx9860GSD_9860G_E
http://slidepdf.com/reader/full/casiofx9860gsd9860ge 317/595
20050401
uuuuu 1-Prop Z Test
This test is used to test for an unknown proportion of successes. The 1-Prop Z Test is
applied to the normal distribution.
Z =n x
n p0(1– p0)
– p0 p0 : expected sample proportion
n : size of sample
Perform the following key operations from the statistical data list.
3(TEST)
1(Z)
3(1-P)
Prop ............................ sample proportion test conditions (“G p0” specifies two-tail
test, “< p0” specifies lower one-tail test, “> p0” specifies upper
one-tail test.)
p0 ................................. expected sample proportion (0 < p0 < 1)
x .................................. sample value ( x > 0 integer)
n .................................. size of sample (positive integer)
Save Res .................... list for storage of calculation results (None or List 1 to 26)
Execute ....................... executes a calculation or draws a graphAfter setting all the parameters, usec to move the highlighting to “Execute” and then press
one of the function keys shown below to perform the calculation or draw the graph.
• 1(CALC) ... Performs the calculation.
• 6(DRAW) ... Draws the graph.
Calculation Result Output Example
PropG0.5 .................... direction of test
z ................................... z score
p ..................................p-value
ˆ p ..................................estimated sample proportion
n ..................................size of sample
• For details about graph screen function keys1
(Z) and2
(P), see “ Z TestCommon Functions” on page 6-5-2.
# [Save Res] does not save the Prop condition
in line 2.
6-5-7
Tests

8/20/2019 _Casio_fx9860GSD_9860G_E
http://slidepdf.com/reader/full/casiofx9860gsd9860ge 318/595
20050401
uuuuu 2-Prop Z Test
This test is used to compare the proportion of successes. The 2-Prop Z Test is applied to
the normal distribution.
Z =n1
x 1n2
x 2–
p(1 – p )n1
1n2
1+
x 1 : data value of sample 1
x 2 : data value of sample 2
n1 : size of sample 1
n2 : size of sample 2
p : estimated sample proportion
Perform the following key operation from the statistical data list.
3(TEST)
1(Z)4(2-P)
p1 ................................. sample proportion test conditions (“G p2” specifies two-tail
test, “< p2” specifies one-tail test where sample 1 is smaller
than sample 2, “> p2” specifies one-tail test where sample 1
is greater than sample 2.)
x 1 ................................. data value ( x 1 > 0 integer) of sample 1
n1 ................................. size (positive integer) of sample 1
x 2 ................................. data value ( x 2 > 0 integer) of sample 2
n2 ................................. size (positive integer) of sample 2
Save Res .................... list for storage of calculation results (None or List 1 to 26)
Execute ....................... executes a calculation or draws a graph
After setting all the parameters, usec to move the highlighting to “Execute” and then press
one of the function keys shown below to perform the calculation or draw the graph.
•1(CALC) ... Performs the calculation.
•6(DRAW) ... Draws the graph.
6-5-8
Tests

8/20/2019 _Casio_fx9860GSD_9860G_E
http://slidepdf.com/reader/full/casiofx9860gsd9860ge 319/595
20050401
Calculation Result Output Example
p1> p2 ............................ direction of test
z .................................. z score
p .................................. p-value
ˆ p 1 ................................. estimated proportion of sample 1
ˆ p 2 ................................. estimated proportion of sample 2
ˆ p .................................. estimated sample proportion
n1 ................................. size of sample 1
n2 ................................. size of sample 2
• For details about graph screen function keys1(Z) and2 (P), see “ Z Test
Common Functions” on page 6-5-2.
6-5-9
Tests
# [Save Res] does not save the p1 condition in
line 2.

8/20/2019 _Casio_fx9860GSD_9860G_E
http://slidepdf.com/reader/full/casiofx9860gsd9860ge 320/595
20050401
kkkkk t Tests
uuuuu t Test Common Functions
You can use the following graph analysis functions after drawing a t Test result output graph.
•1(T) ... Displays t score.
Pressing1(T) displays the t score at the bottom of the display, and displays the pointer at the
corresponding location in the graph (unless the location is off the graph screen).
Two points are displayed in the case of a two-tail test. Used ande to move the pointer.
PressJ to clear the t score.
•2(P) ... Displays p-value.
Pressing2(P) displays the p-value at the bottom of the display without displaying the pointer.
PressJ to clear the p-value.
6-5-10
Tests
# The following V-Window settings are used for
drawing the graph.
Xmin = –3.2, Xmax = 3.2, Xscale = 1,
Ymin = –0.1, Ymax = 0.45, Yscale = 0.1
# Executing an analysis function automatically
stores the t and p values in alpha variables T
and P, respectively.

8/20/2019 _Casio_fx9860GSD_9860G_E
http://slidepdf.com/reader/full/casiofx9860gsd9860ge 321/595
20050401
uuuuu 1-Sample t Test
This test uses the hypothesis test for a single unknown population mean when the popula-
tion standard deviation is unknown. The 1-Sample t Test is applied to t -distribution.
t = o – 0µ
σ x n–1
n
o : mean of sample
µ 0 : assumed population mean
x σ n-1 : sample standard deviation
n : size of sample
Perform the following key operations from the statistical data list.
3(TEST)
2(t)
1(1-S)
The following shows the meaning of each item in the case of list data specification.
Data ............................ data type
µ .................................. population mean value test conditions (“G µ 0” specifies two-
tail test, “< µ 0” specifies lower one-tail test, “> µ 0” specifiesupper one-tail test.)
µ 0 ................................. assumed population mean
List .............................. list whose contents you want to use as data (List 1 to 26)
Freq............................. frequency (1 or List 1 to 26)
Save Res .................... list for storage of calculation results (None or List 1 to 26)
Execute ....................... executes a calculation or draws a graph
The following shows the meaning of parameter data specification items that are different
from list data specification.
o .................................. mean of sample
x σ n-1 ............................. sample standard deviation ( x σ n-1 > 0)
n .................................. size of sample (positive integer)
After setting all the parameters, usec to move the highlighting to “Execute” and then press
one of the function keys shown below to perform the calculation or draw the graph.
•1(CALC) ... Performs the calculation.
•6(DRAW) ... Draws the graph.
6-5-11
Tests

8/20/2019 _Casio_fx9860GSD_9860G_E
http://slidepdf.com/reader/full/casiofx9860gsd9860ge 322/595
20050401
Calculation Result Output Example
µ G 11.3 ...................... direction of test
t ................................... t score
p .................................. p-value
o .................................. mean of sample
x σ n-1 ............................. sample standard deviation
n .................................. size of sample
• For details about graph screen function keys1(T) and2(P), see “t Test
Common Functions” on page 6-5-10.
# [Save Res] does not save the µ condition in
line 2.
6-5-12
Tests

8/20/2019 _Casio_fx9860GSD_9860G_E
http://slidepdf.com/reader/full/casiofx9860gsd9860ge 323/595
20050401
uuuuu 2-Sample t Test
2-Sample t Test compares the population means when the population standard deviations
are unknown. The 2-Sample t Test is applied to t -distribution.
The following applies when pooling is in effect.
t = o 1 – o 2
n1
1 + n2
1 x p n–12σ
x p n–1 =σ n1 + n2 – 2
(n1–1) x 1 n–12 +(n2–1) x 2 n–1
2σ σ
df = n1 + n2 – 2
The following applies when pooling is not in effect.
t = o 1 – o 2
x 1 n–12σ
n1+ x 2 n–1
2σ
n2
df =1
C 2
n1–1+(1–C )2
n2–1
C = x 1 n–1
2σ
n1+ x 2 n–1
2σ
n2
x 1 n–12σ
n1
Perform the following key operations from the statistical data list.
3(TEST)
2(t)
2(2-S)
6-5-13
Tests
o 1 : mean of sample 1
o 2 : mean of sample 2
x 1σ n-1 : standard deviation of
sample 1
x 2σ n-1 : standard deviation of
sample 2
n1 : size of sample 1
n2 : size of sample 2
x pσ n-1 : pooled sample standarddeviation
df : degrees of freedom
o 1 : mean of sample 1
o 2 : mean of sample 2
x 1σ n-1 : standard deviation of
sample 1
x 2σ n-1 : standard deviation ofsample 2
n1 : size of sample 1
n2 : size of sample 2
df : degrees of freedom

8/20/2019 _Casio_fx9860GSD_9860G_E
http://slidepdf.com/reader/full/casiofx9860gsd9860ge 324/595
20050401
The following shows the meaning of each item in the case of list data specification.
Data ............................ data type
µ 1 ................................. sample mean value test conditions (“G
µ 2” specifies two-tailtest, “< µ 2” specifies one-tail test where sample 1 is smaller
than sample 2, “> µ 2” specifies one-tail test where sample 1 is
greater than sample 2.)
List(1) .......................... list whose contents you want to use as data of sample 1
(List 1 to 26)
List(2) .......................... list whose contents you want to use as data of sample 2
(List 1 to 26)
Freq(1) ........................ frequency of sample 1 (1 or List 1 to 26)
Freq(2) ........................ frequency of sample 2 (1 or List 1 to 26)
Pooled ......................... pooling On (in effect) or Off (not in effect)
Save Res .................... list for storage of calculation results (None or List 1 to 26)
Execute ....................... executes a calculation or draws a graph
The following shows the meaning of parameter data specification items that are different
from list data specification.
o 1 ................................. mean of sample 1
x 1σ n-1 ............................ standard deviation ( x 1σ n-1 > 0) of sample 1
n1 ................................. size (positive integer) of sample 1
o 2 ................................. mean of sample 2
x 2σ n-1 ............................ standard deviation ( x 2σ n-1 > 0) of sample 2
n2
................................. size (positive integer) of sample 2
After setting all the parameters, usec to move the highlighting to “Execute” and then press
one of the function keys shown below to perform the calculation or draw the graph.
•1(CALC) ... Performs the calculation.
•6(DRAW) ... Draws the graph.
6-5-14
Tests

8/20/2019 _Casio_fx9860GSD_9860G_E
http://slidepdf.com/reader/full/casiofx9860gsd9860ge 325/595
20050401
Calculation Result Output Example
µ 1Gµ 2 ........................... direction of test
t ................................... t score
p .................................. p-value
df ................................. degrees of freedom
o 1 ................................. mean of sample 1
o 2 ................................. mean of sample 2
x 1σ n-1 ............................ standard deviation of sample 1
x 2σ n-1 ............................ standard deviation of sample 2
x pσ n-1 ............................ pooled sample standard deviation (Displayed only when
Pooled: On setting.)
n1 ................................. size of sample 1
n2 ................................. size of sample 2
• For details about graph screen function keys1(T) and2(P), see “t TestCommon Functions” on page 6-5-10.
6-5-15
Tests
# [Save Res] does not save the µ 1 condition in
line 2.

8/20/2019 _Casio_fx9860GSD_9860G_E
http://slidepdf.com/reader/full/casiofx9860gsd9860ge 326/595
20050401
uuuuu LinearReg t Test
LinearReg t Test treats paired-variable data sets as ( x , y) pairs, and uses the method of
least squares to determine the most appropriate a, b coefficients of the data for theregression formula y = a + bx . It also determines the correlation coefficient and t value, and
calculates the extent of the relationship between x and y.
b = Σ( x – o )( y – p )i=1
n
Σ( x – o )2
i=1
na = p – b o t = r
n – 2
1 – r 2
a : intercept
b : slope of the line
n : size of sample (n > 3)
r : correlation coefficient
r 2 : coefficient of
determination
Perform the following key operations from the statistical data list.
3(TEST)
2(t)
3(REG)
The following shows the meaning of each item in the case of list data specification.
β & ρ ............................ p-value test conditions (“G 0” specifies two-tail test, “< 0”
specifies lower one-tail test, “> 0” specifies upper one-tail
test.)
XList ............................ list for x -axis data (List 1 to 26)
YList ............................ list for y-axis data (List 1 to 26)
Freq............................. frequency (1 or List 1 to 26)
Save Res .................... list for storage of calculation results (None or List 1 to 26)
Execute ....................... executes a calculation
After setting all the parameters, usec to move the highlighting to “Execute” and then press
the function key shown below to perform the calculation.
•1(CALC) ... Performs the calculation.
# You cannot draw a graph for LinearReg t
Test.
6-5-16
Tests

8/20/2019 _Casio_fx9860GSD_9860G_E
http://slidepdf.com/reader/full/casiofx9860gsd9860ge 327/595
20050401
# [Save Res] does not save the β & ρ
conditions in line 2.
# When the list specified by [Save Res] is the
same list specified by the [Resid List] item on
the Setup screen, only [Resid List] data is
saved in the list.
6-5-17
Tests
Calculation Result Output Example
β G 0 & ρ G 0 .............. direction of test
t ................................... t score
p .................................. p-value
df ................................. degrees of freedom
a .................................. constant term
b .................................. coefficient
s .................................. standard error
r .................................. correlation coefficient
r 2 ................................. coefficient of determination
Pressing6 (COPY) while a calculation result is on the display copies the regression formula
to the graph relation list.
When there is a list specified for the [Resid List] item on the Setup screen, regression formula
residual data is automatically saved to the specified list after the calculation is finished.

8/20/2019 _Casio_fx9860GSD_9860G_E
http://slidepdf.com/reader/full/casiofx9860gsd9860ge 328/595
20050401
# The matrix must be at least two lines by two
columns. An error occurs if the matrix has
only one line or one column.# Pressing1(Mat) while the “Observed” and
“Expected” parameter settings are highlighted
will display the Matrix (A to Z) setting screen.
6-5-18
Tests
# Pressing2('MAT) while setting parameters
enters the Matrix Editor, which you can use to
edit and view the contents of matrices.
kkkkk χ2 Test
χ2 Test sets up a number of independent groups and tests hypothesis related to the
proportion of the sample included in each group. The χ2
Test is applied to dichotomousvariables (variable with two possible values, such as yes/no).
Expected counts
F ij =
Σ x iji=1
k
×Σ x ij j=1
k
ΣΣi=1 j=1
x ij
χ2 = ΣΣ F iji=1
k ( x ij – F ij)2
j=1
Perform the following key operations from the statistical data list.
3(TEST)
3(CHI)
Next, specify the matrix that contains the data. The following shows the meaning of theabove item.
Observed .................... name of matrix (A to Z) that contains observed counts (all cells
positive integers)
Expected ..................... name of matrix (A to Z) that is for saving expected frequency
Save Res .................... list for storage of calculation results (None or List 1 to 26)
Execute ....................... executes a calculation or draws a graph

8/20/2019 _Casio_fx9860GSD_9860G_E
http://slidepdf.com/reader/full/casiofx9860gsd9860ge 329/595
20050401
# Pressing6('MAT) while a calculation
result is displayed enters the Matrix Editor,
which you can use to edit and view the
contents of matrices.
# The following V-Window settings are used fordrawing the graph.
Xmin = 0, Xmax = 11.5, Xscale = 2,
Ymin = –0.1, Ymax = 0.5, Yscale = 0.1
# Executing an analysis function automatically
stores the χ 2 and p values in alpha variables
C and P, respectively.
6-5-19
Tests
After setting all the parameters, usec to move the highlighting to “Execute” and then press
one of the function keys shown below to perform the calculation or draw the graph.
•1(CALC) ... Performs the calculation.
•6(DRAW) ... Draws the graph.
Calculation Result Output Example
χ 2 ................................. χ2 value
p .................................. p-value
df ................................. degrees of freedom
You can use the following graph analysis functions after drawing a graph.
•1(CHI) ... Displays χ 2 value.
Pressing1(CHI) displays the χ 2 value at the bottom of the display, and displays the pointer at
the corresponding location in the graph (unless the location is off the graph screen).PressJ to clear the χ 2 value.
•2(P) ... Displays p-value.
Pressing2(P) displays the p-value at the bottom of the display without displaying the pointer.
PressJ to clear the p-value.

8/20/2019 _Casio_fx9860GSD_9860G_E
http://slidepdf.com/reader/full/casiofx9860gsd9860ge 330/595
20050401
6-5-20
Tests
kkkkk 2-Sample F Test
2-Sample F Test tests the hypothesis for the ratio of sample variances. The F Test is
applied to the F distribution.
F = x 1 n–1
2σ
x 2 n–12σ
Perform the following key operations from the statistical data list.
3(TEST)
4(F)
The following is the meaning of each item in the case of list data specification.
Data ............................ data type
σ 1 ................................. population standard deviation test conditions (“G σ 2”
specifies two-tail test, “< σ 2” specifies one-tail test where
sample 1 is smaller than sample 2, “> σ 2” specifies one-tail
test where sample 1 is greater than sample 2.)List(1) .......................... list whose contents you want to use as data of sample 1
(List 1 to 26)
List(2) .......................... list whose contents you want to use as data of sample 2
(List 1 to 26)
Freq(1) ........................ frequency of sample 1 (1 or List 1 to 26)
Freq(2) ........................ frequency of sample 2 (1 or List 1 to 26)
Save Res .................... list for storage of calculation results (None or List 1 to 26)
Execute ....................... executes a calculation or draws a graph
The following shows the meaning of parameter data specification items that are different
from list data specification.
x 1σ n-1 ............................ standard deviation ( x 1σ n-1 > 0) of sample 1
n1 ................................. size (positive integer) of sample 1
x 2σ n-1 ............................ standard deviation ( x 2σ n-1 > 0) of sample 2n2 ................................. size (positive integer) of sample 2

8/20/2019 _Casio_fx9860GSD_9860G_E
http://slidepdf.com/reader/full/casiofx9860gsd9860ge 331/595
20050401
# [Save Res] does not save the σ 1 condition inline 2.
# V-Window settings are automatically
optimized for drawing the graph.
# Executing an analysis function automaticallystores the F and p values in alpha variables
F and P, respectively.
6-5-21
Tests
After setting all the parameters, usec to move the highlighting to “Execute” and then press
one of the function keys shown below to perform the calculation or draw the graph.
•1(CALC) ... Performs the calculation.
•6(DRAW) ... Draws the graph.
Calculation Result Output Example
σ 1Gσ 2 .......................... direction of test
F .................................. F value
p .................................. p-value
o 1 ................................. mean of sample 1 (Displayed only for Data: List setting.)
o 2 ................................. mean of sample 2 (Displayed only for Data: List setting.)
x 1σ n-1 ............................ standard deviation of sample 1
x 2σ n-1 ............................ standard deviation of sample 2
n1 ................................. size of sample 1
n2 ................................. size of sample 2
You can use the following graph analysis functions after drawing a graph.
•1(F) ... Displays F value.
Pressing1(F) displays the F value at the bottom of the display, and displays the pointer at the
corresponding location in the graph (unless the location is off the graph screen).
Two points are displayed in the case of a two-tail test. Used ande to move the pointer.
PressJ to clear the F value.
•2(P) ... Displays p-value.
Pressing2(P) displays the p-value at the bottom of the display without displaying the pointer.
PressJ to clear the p-value.

8/20/2019 _Casio_fx9860GSD_9860G_E
http://slidepdf.com/reader/full/casiofx9860gsd9860ge 332/595
20050401
*1 [Save Res] saves each vertical column of thetable into its own list. The leftmost column is
saved in the specified list, and each
subsequent column to the right is saved in
the next sequentially numbered list. Up to fivelists can be used for storing columns. You
can specify an first list number in the range of
1 to 22.
6-5-22
Tests
kkkkk ANOVA
ANOVA tests the hypothesis that the population means of the samples are equal when there
are multiple samples.One-Way ANOVA is used when there is one independent variable and one dependent
variable.
Two-Way ANOVA is used when there are two independent variables and one dependent
variable.
Perform the following key operations from the statistical data list.
3(TEST)
5(ANOV)
The following is the meaning of each item in the case of list data specification.
How Many ................... selects One-Way ANOVA or Two-Way ANOVA (number of
levels)
Factor A ....................... category list (List 1 to 26)
Dependnt .................... list to be used for sample data (List 1 to 26)
Save Res .................... first list for storage of calculation results (None or List 1 to
22)*1
Execute ....................... executes a calculation or draws a graph (Two-Way ANOVA only)
The following item appears in the case of Two-Way ANOVA only.
Factor B ...................... category list (List 1 to 26)
After setting all the parameters, usec to move the highlighting to “Execute” and then press
one of the function keys shown below to perform the calculation or draw the graph.
•1(CALC) ... Performs the calculation.
•6(DRAW) ... Draws the graph (Two-Way ANOVA only).
Calculation results are displayed in table form, just as they appear in science books.

8/20/2019 _Casio_fx9860GSD_9860G_E
http://slidepdf.com/reader/full/casiofx9860gsd9860ge 333/595
20050401
# Graphing is available with Two-Way ANOVAonly. V-Window settings are performed
automatically, regardless of Setup screen
settings.
# Using the Trace function automatically storesthe number of conditions to alpha variable A
and the mean value to variable M,
respectively.
6-5-23
Tests
Calculation Result Output Example
One-Way ANOVA
Line 1 (A) .................... Factor A df value, SS value, MS value, F value, p-value
Line 2 (ERR) ............... Error df value, SS value, MS value
Two-Way ANOVA
Line 1 (A) .................... Factor A df value, SS value, MS value, F value, p-value
Line 2 (B) .................... Factor B df value, SS value, MS value, F value, p-value
Line 3 (AB) .................. Factor A × Factor B df value, SS value, MS value, F value,
p-value
*Line 3 does not appear when there is only one observation
in each cell.
Line 4 (ERR) ............... Error df value, SS value, MS value
F .................................. F value
p .................................. p-value
df ................................. degrees of freedom
SS ................................ sum of squares
MS ............................... mean squares
With Two-Way ANOVA, you can draw Interaction Plot graphs. The number of graphs
depends on Factor B, while the number of X-axis data depends on the Factor A. The Y-axis
is the average value of each category.
You can use the following graph analysis function after drawing a graph.
•1(Trace) or!1(TRCE) ... Trace function
Pressingd ore moves the pointer on the graph in the corresponding direction. When
there are multiple graphs, you can move between graphs by pressingf andc.
PressJ to clear the pointer from the display.

8/20/2019 _Casio_fx9860GSD_9860G_E
http://slidepdf.com/reader/full/casiofx9860gsd9860ge 334/595
20050401
kkkkk ANOVA (Two-Way)
uuuuu Description
The nearby table shows measurement results for a metal product produced by a heat
treatment process based on two treatment levels: time (A) and temperature (B). The
experiments were repeated twice each under identical conditions.
Perform analysis of variance on the following null hypothesis, using a significance level of
5%.
Ho : No change in strength due to time
Ho : No change in strength due to heat treatment temperature
Ho : No change in strength due to interaction of time and heat treatment temperature
uuuuu Solution
Use two-way ANOVA to test the above hypothesis.
Input the above data as shown below.
List1={1,1,1,1,2,2,2,2}
List2={1,1,2,2,1,1,2,2}
List3={113,116,139,132,133,131,126,122}
Define List 3 (the data for each group) as Dependent. Define List 1 and List 2 (the factor
numbers for each data item in List 3) as Factor A and Factor B respectively.
Executing the test produces the following results.
• Time differential (A) level of significance P = 0.2458019517
The level of significance (p = 0.2458019517) is greater than the significance level (0.05),
so the hypothesis is not rejected.
• Temperature differential (B) level of significance P = 0.04222398836
The level of significance (p = 0.04222398836) is less than the significance level (0.05), so
the hypothesis is rejected.
• Interaction (A× B) level of significance P = 2.78169946e-3
The level of significance (p = 2.78169946e-3) is less than the significance level (0.05), so
the hypothesis is rejected.
The above test indicates that the time differential is not significant, the temperaturedifferential is significant, and interaction is highly significant.
B (Heat Treatment Temperature) B1 B2
A1 113 , 116
133 , 131
139 , 132
126 , 122A2
A (Time)
6-5-24
Tests

8/20/2019 _Casio_fx9860GSD_9860G_E
http://slidepdf.com/reader/full/casiofx9860gsd9860ge 335/595
20050401
uuuuu Input Example
uuuuu Results
6-5-25
Tests

8/20/2019 _Casio_fx9860GSD_9860G_E
http://slidepdf.com/reader/full/casiofx9860gsd9860ge 336/595
20050401
6-6 Confidence Interval
A confidence interval is a range (interval) that includes a statistical value, usually the
population mean.
A confidence interval that is too broad makes it difficult to get an idea of where the population
value (true value) is located. A narrow confidence interval, on the other hand, limits the
population value and makes it difficult to obtain reliable results. The most commonly used
confidence levels are 95% and 99%. Raising the confidence level broadens the confidence
interval, while lowering the confidence level narrows the confidence level, but it also
increases the chance of accidently overlooking the population value. With a 95% confidence
interval, for example, the population value is not included within the resulting intervals 5% of
the time.
When you plan to conduct a survey and then t test and Z test the data, you must also
consider the sample size, confidence interval width, and confidence level. The confidence
level changes in accordance with the application.
1-Sample Z Interval calculates the confidence interval for an unknown population mean
when the population standard deviation is known.
2-Sample Z Interval calculates the confidence interval for the difference between two
population means when the population standard deviations of two samples are known.
1-Prop Z Interval calculates the confidence interval for an unknown proportion of
successes.2-Prop Z Interval calculates the confidence interval for the difference between the propotion
of successes in two populations.
1-Sample t Interval calculates the confidence interval for an unknown population mean
when the population standard deviation is unknown.
2-Sample t Interval calculates the confidence interval for the difference between two
population means when both population standard deviations are unknown.
On the initial STAT mode screen, press4(INTR) to display the confidence interval menu,
which contains the following items.
•4(INTR)1(Z) ... Z intervals (page 6-6-3)
2(t) ... t intervals (page 6-6-8)
# There is no graphing for confidence interval
functions.
6-6-1
Confidence Interval

8/20/2019 _Casio_fx9860GSD_9860G_E
http://slidepdf.com/reader/full/casiofx9860gsd9860ge 337/595
20050401
uuuuu General Confidence Interval Precautions
Inputting a value in the range of 0 < C-Level < 1 for the C-Level setting sets you value you
input. Inputting a value in the range of 1< C-Level < 100 sets a value equivalent to your input
divided by 100.
# Inputting a value of 100 or greater, or a
negative value causes an error (Ma ERROR).
6-6-2
Confidence Interval

8/20/2019 _Casio_fx9860GSD_9860G_E
http://slidepdf.com/reader/full/casiofx9860gsd9860ge 338/595
20050401
kkkkk Z Interval
uuuuu 1-Sample Z Interval
1-Sample Z Interval calculates the confidence interval for an unknown population mean
when the population standard deviation is known.
The following is the confidence interval.
Left = o – Z α
2σ
n
Right = o + Z α
2σ
n
However, α is the level of significance. The value 100 (1 – α ) % is the confidence level.
When the confidence level is 95%, for example, inputting 0.95 produces 1 – 0.95 = 0.05 = α .
Perform the following key operations from the statistical data list.
4(INTR)
1(Z)
1(1-S)
The following shows the meaning of each item in the case of list data specification.
Data ............................ data type
C-Level ........................ confidence level (0 < C-Level < 1)
σ .................................. population standard deviation (σ > 0)
List .............................. list whose contents you want to use as sample data
(List 1 to 26)
Freq............................. sample frequency (1 or List 1 to 26)
Save Res .................... list for storage of calculation results (None or List 1 to 26)
Execute ....................... executes a calculation
The following shows the meaning of parameter data specification items that are different
from list data specification.
o .................................. mean of samplen .................................. size of sample (positive integer)
6-6-3
Confidence Interval

8/20/2019 _Casio_fx9860GSD_9860G_E
http://slidepdf.com/reader/full/casiofx9860gsd9860ge 339/595
20050401
After setting all the parameters, use c to move the highlighting to “Execute” and then press
the function key shown below to perform the calculation.
• 1(CALC) ... Performs the calculation.
Calculation Result Output Example
Left .............................. confidence interval lower limit (left edge)
Right ............................ confidence interval upper limit (right edge)
o .................................. mean of sample
x σ n-1 ............................. sample standard deviation
(Displayed only for Data: List setting.)
n .................................. size of sample
uuuuu 2-Sample Z Interval
2-Sample Z Interval calculates the confidence interval for the difference between two
population means when the population standard deviations of two samples are known.The following is the confidence interval. α is the level of significance. The value 100 (1 – α)
% is the confidence level.
Left = ( o 1 – o 2) – Z α
2
Right = ( o 1 – o 2) + Z α
2
n1
12
σ +
n2
22
σ
n1
12
σ +
n2
22
σ
o 1 : mean of sample 1
o 2 : mean of sample 2
σ 1 : population standard deviation
of sample 1
σ 2 : population standard deviation
of sample 2
n1 : size of sample 1
n2 : size of sample 2
Perform the following key operations from the statistical data list.
4(INTR)
1(Z)
2(2-S)
6-6-4
Confidence Interval

8/20/2019 _Casio_fx9860GSD_9860G_E
http://slidepdf.com/reader/full/casiofx9860gsd9860ge 340/595
20050401
The following shows the meaning of each item in the case of list data specification.
Data ............................ data type
C-Level ........................ confidence level (0 < C-Level < 1)
σ 1 ................................. population standard deviation of sample 1 (σ 1 > 0)
σ 2 ................................. population standard deviation of sample 2 (σ 2 > 0)
List(1) .......................... list whose contents you want to use as data of sample 1
(List 1 to 26)
List(2) .......................... list whose contents you want to use as data of sample 2(List 1 to 26)
Freq(1) ........................ frequency of sample 1 (1 or List 1 to 26)
Freq(2) ........................ frequency of sample 2 (1 or List 1 to 26)
Save Res .................... list for storage of calculation results (None or List 1 to 26)
Execute ....................... executes a calculation
The following shows the meaning of parameter data specification items that are different
from list data specification.
o 1 ................................. mean of sample 1
n1 ................................. size (positive integer) of sample 1
o 2................................. mean of sample 2
n2 ................................. size (positive integer) of sample 2
After setting all the parameters, use c to move the highlighting to “Execute” and then press
the function key shown below to perform the calculation.
•1(CALC) ... Performs the calculation.
Calculation Result Output Example
Left .............................. confidence interval lower limit (left edge)
Right ............................ confidence interval upper limit (right edge)
o 1 ................................. mean of sample 1
o 2 ................................. mean of sample 2
x 1σ n-1 ............................ standard deviation of sample 1
(Displayed only for Data: List setting.)
x 2σ n-1 ............................ standard deviation of sample 2
(Displayed only for Data: List setting.)
n1 ................................. size of sample 1
n2 ................................. size of sample 2
6-6-5
Confidence Interval

8/20/2019 _Casio_fx9860GSD_9860G_E
http://slidepdf.com/reader/full/casiofx9860gsd9860ge 341/595
20050401
uuuuu 1-Prop Z Interval
1-Prop Z Interval uses the number of data to calculate the confidence interval for an
unknown proportion of successes.
The following is the confidence interval. α is the level of significance. The value 100 (1 – α) %
is the confidence level.
Left = – Z α
2
Right = + Z
x n n
1n x
n x
1–
x n
α
2 n1
n x
n x
1–
n : size of sample
x : data
Perform the following key operations from the statistical data list.
4(INTR)
1(Z)
3(1-P)
Data is specified using parameter specification. The following shows the meaning of each
item.
C-Level ........................ confidence level (0 < C-Level < 1) x .................................. data (0 or positive integer)
n .................................. size of sample (positive integer)
Save Res .................... list for storage of calculation results (None or List 1 to 26)
Execute ....................... executes a calculation
After setting all the parameters, use c to move the highlighting to “Execute” and then press
the function key shown below to perform the calculation.
•1(CALC) ... Performs the calculation.
Calculation Result Output Example
Left .............................. confidence interval lower limit (left edge)
Right ............................ confidence interval upper limit (right edge)p .................................. estimated sample proportion
n .................................. size of sample
6-6-6
Confidence Interval

8/20/2019 _Casio_fx9860GSD_9860G_E
http://slidepdf.com/reader/full/casiofx9860gsd9860ge 342/595
20050401
uuuuu 2-Prop Z Interval
2-Prop Z Interval uses the number of data items to calculate the confidence interval for the
defference between the proportion of successes in two populations.
The following is the confidence interval. α is the level of significance. The value 100 (1 – α)
% is the confidence level.
Left = – – Z α
2
x 1n1
x 2n2 n1
n1
x 1 1– n1
x 1
+ n2
n2
x 2 1– n2
x 2
Right=
– +
Z
α
2
x 1
n1
x 2n2 n1
n1
x 1 1– n1
x 1
+
n2
n2
x 2 1– n2
x 2
n1, n2 : size of sample
x 1, x 2 : data
Perform the following key operations from the statistical data list.
4(INTR)
1(Z)
4(2-P)
Data is specified using parameter specification. The following shows the meaning of each
item.
C-Level ........................ confidence level (0 < C-Level < 1)
x 1 ................................. data value ( x 1 > 0) of sample 1
n1 ................................. size (positive integer) of sample 1
x 2 ................................. data value ( x 2 > 0) of sample 2
n2 ................................. size (positive integer) of sample 2
Save Res .................... list for storage of calculation results (None or List 1 to 26)
Execute ....................... executes a calculation
After setting all the parameters, use c to move the highlighting to “Execute” and then press
the function key shown below to perform the calculation.
•1(CALC) ... Performs the calculation.
Calculation Result Output Example
6-6-7
Confidence Interval

8/20/2019 _Casio_fx9860GSD_9860G_E
http://slidepdf.com/reader/full/casiofx9860gsd9860ge 343/595
20050401
Left .............................. confidence interval lower limit (left edge)
Right ............................ confidence interval upper limit (right edge)
p 1 ................................. estimated sample propotion for sample 1
p 2 ................................. estimated sample propotion for sample 2
n1 ................................. size of sample 1
n2 ................................. size of sample 2
kkkkk t Interval
uuuuu 1-Sample t Interval
1-Sample t Interval calculates the confidence interval for an unknown population meanwhen the population standard deviation is unknown.
The following is the confidence interval. α is the level of significance. The value 100 (1 – α) %
is the confidence level.
Left = o – t n – 1
α
2
Right = o + t n – 1
α
2
x n–1σ
n
x n–1σ
n
Perform the following key operations from the statistical data list.
4(INTR)
2(t)
1(1-S)
The following shows the meaning of each item in the case of list data specification.
Data ............................ data type
C-Level ........................ confidence level (0 < C-Level < 1)
List .............................. list whose contents you want to use as sample data
(List 1 to 26)
Freq............................. sample frequency (1 or List 1 to 26)
Save Res .................... list for storage of calculation results (None or List 1 to 26)
Execute ....................... executes a calculation
The following shows the meaning of parameter data specification items that are different
from list data specification.
6-6-8
Confidence Interval

8/20/2019 _Casio_fx9860GSD_9860G_E
http://slidepdf.com/reader/full/casiofx9860gsd9860ge 344/595
20050401
o .................................. mean of sample
x σ n-1 ............................. sample standard deviation ( x σ n-1 > 0)
n .................................. size of sample (positive integer)
After setting all the parameters, use c to move the highlighting to “Execute” and then press
the function key shown below to perform the calculation.
•1(CALC) ... Performs the calculation.
Calculation Result Output Example
Left .............................. confidence interval lower limit (left edge)
Right ............................ confidence interval upper limit (right edge)
o .................................. mean of sample
x σ n-1 ............................. sample standard deviation
n .................................. size of sample
uuuuu 2-Sample t Interval
2-Sample t Interval calculates the confidence interval for the difference between two
population means when both population standard deviations are unknown. The t interval is
applied to t distribution.
The following confidence interval applies when pooling is in effect. α is the level of significance.
The value 100 (1 – α) % is the confidence level.
Left = ( o 1 – o
2)– t
α
2
Right = ( o 1 – o 2)+ t α
2
n1+
n2
–2 n1
1+
n2
1 x p
n–1
2σ
n1+n2 –2 n1
1+ n2
1 x p n–12σ
x p n–1 =σ n1
+ n2 – 2
(n1–1) x 1 n–12+(n2–1) x 2 n–1
2σ σ
6-6-9
Confidence Interval

8/20/2019 _Casio_fx9860GSD_9860G_E
http://slidepdf.com/reader/full/casiofx9860gsd9860ge 345/595
20050401
The following confidence interval applies when pooling is not in effect. α is the level of
significance. The value 100 (1 – α) % is the confidence level.
Left = ( o 1 – o 2)– t df
α
2
Right = ( o 1 – o 2)+ t df
α
2
+n1
x 1 n–12σ
n2
x 2 n–12σ
+n1
x 1 n–12σ
n2
x 2 n–12σ
C =
df = 1
C 2
n1–1+(1–C )2
n2–1
+n1
x 1 n–12σ
n1
x 1 n–12σ
n2
x 2 n–12σ
Perform the following key operations from the statistical data list.
4(INTR)
2(t)
2(2-S)
The following shows the meaning of each item in the case of list data specification.
Data ............................ data type
C-Level ........................ confidence level (0 < C-Level < 1)
List(1) .......................... list whose contents you want to use as data of sample 1
(List 1 to 26)
List(2) .......................... list whose contents you want to use as data of sample 2
(List 1 to 26)Freq(1) ........................ frequency of sample 1 (1 or List 1 to 26)
Freq(2) ........................ frequency of sample 2 (1 or List 1 to 26)
Pooled ......................... pooling On (in effect) or Off (not in effect)
Save Res .................... list for storage of calculation results (None or List 1 to 26)
Execute ....................... executes a calculation
The following shows the meaning of parameter data specification items that are different
from list data specification.
6-6-10
Confidence Interval

8/20/2019 _Casio_fx9860GSD_9860G_E
http://slidepdf.com/reader/full/casiofx9860gsd9860ge 346/595
20050401
o 1 ................................. mean of sample 1
x 1σ n-1 ............................ standard deviation ( x 1σ n-1 > 0) of sample 1
n1 ................................. size (positive integer) of sample 1
o 2 ................................. mean of sample 2
x 2σ n-1 ............................ standard deviation ( x 2σ n-1 > 0) of sample 2
n2 ................................. size (positive integer) of sample 2
After setting all the parameters, use c to move the highlighting to “Execute” and then press
the function key shown below to perform the calculation.
•1(CALC) ... Performs the calculation.
Calculation Result Output Example
Left .............................. confidence interval lower limit (left edge)
Right ............................ confidence interval upper limit (right edge)
df ................................. degrees of freedom
o 1 ................................. mean of sample 1 o 2 ................................. mean of sample 2
x 1σ n-1 ............................ standard deviation of sample 1
x 2σ n-1 ............................ standard deviation of sample 2
x pσ n-1 ............................ pooled sample standard deviation
(Displayed only when Pooled: On setting.)
n1 ................................. size of sample 1
n2 ................................. size of sample 2
6-6-11
Confidence Interval

8/20/2019 _Casio_fx9860GSD_9860G_E
http://slidepdf.com/reader/full/casiofx9860gsd9860ge 347/595
20050401
6-7 Distribution
There is a variety of different types of distribution, but the most well-known is “normal
distribution,” which is essential for performing statistical calculations. Normal distribution is asymmetrical distribution centered on the greatest occurrences of mean data (highest
frequency), with the frequency decreasing as you move away from the center. Poisson
distribution, geometric distribution, and various other distribution shapes are also used,
depending on the data type.
Certain trends can be determined once the distribution shape is determined. You can
calculate the probability of data taken from a distribution being less than a specific value.
For example, distribution can be used to calculate the yield rate when manufacturing some
product. Once a value is established as the criteria, you can calculate normal probabilitywhen estimating what percent of the products meet the criteria. Conversely, a success rate
target (80% for example) is set up as the hypothesis, and normal distribution is used to
estimate the proportion of the products will reach this value.
Normal probability density calculates the probability density of normal distribution from a
specified x value.
Normal distribution probability calculates the probability of normal distribution data falling
between two specific values.
Inverse cumulative normal distribution calculates a value that represents the location
within a normal distribution for a specific cumulative probability.Student- t probability density calculates t probability density from a specified x value.
Student- t distribution probability calculates the probability of t distribution data falling
between two specific values.
Like t distribution, distribution probability can also be calculated for χ2, F, Binomial, Poisson,
and Geometric distributions.
On the initial STAT mode screen, press5 (DIST) to display the distribution menu, which
contains the following items.
• 5(DIST)1(NORM) ... Normal distribution (page 6-7-3)
2(t) ... Student-t distribution (page 6-7-7)
3(CHI) ... χ2 distribution (page 6-7-9)
4(F) ... F distribution (page 6-7-12)
5(BINM) ... Binomial distribution (page 6-7-16)
6(g)1(POISN) ... Poisson distribution (page 6-7-19)
6(g)2(GEO) ... Geometric distribution (page 6-7-21)
6-7-1
Distribution

8/20/2019 _Casio_fx9860GSD_9860G_E
http://slidepdf.com/reader/full/casiofx9860gsd9860ge 348/595
20050401
uuuuu Common Distribution Functions
After drawing a graph, you can use the P-CAL function to calculate an estimated p-value for
a particular x value.The following is the general procedure for using the P-CAL function.
1. After drawing a distribution graph, press!5(G-SLV)1(P-CAL) to display the x
value input dialog box.
2. Input the value you want for x and then pressw.
• This causes the x and p values to appear at the bottom of the display, and moves the
pointer to the corresponding point on the graph.
3. Pressingv or a number key at this time causes the x value input dialog box to
reappear so you can perform another estimated value calculation if you want.
4. After you are finished, pressJ to clear the coordinate values and the pointer from
the display.
# Executing an analysis function automatically
stores the x and p values in alpha variables X
and P, respectively.
6-7-2
Distribution

8/20/2019 _Casio_fx9860GSD_9860G_E
http://slidepdf.com/reader/full/casiofx9860gsd9860ge 349/595

8/20/2019 _Casio_fx9860GSD_9860G_E
http://slidepdf.com/reader/full/casiofx9860gsd9860ge 350/595

8/20/2019 _Casio_fx9860GSD_9860G_E
http://slidepdf.com/reader/full/casiofx9860gsd9860ge 351/595
20050401
Calculation Result Output Example
p .................................. normal distribution probability
z:Low........................... z:Low value (converted to standardize z score for lower
value)
z:Up............................. z:Up value (converted to standardize z score for upper value)
uuuuu Inverse Cumulative Normal Distribution
Inverse cumulative normal distribution calculates a value that represents the location within a
normal distribution for a specific cumulative probability.
f ( x )dx = p−∞∫ f ( x )dx = p
+∞
∫ f ( x )dx = p∫
Specify the probability and use this formula to obtain the integration interval.
Perform the following key operations from the statistical data list.
5(DIST)
1(NORM)
3(InvN)
Data is specified using parameter specification. The following shows the meaning of each
item.
Tail ............................... probability value tail specification (Left, Right, Central)
Area ............................ probability value (0 < Area < 1)
σ .................................. standard deviation (σ > 0)
µ .................................. mean
Save Res .................... list for storage of calculation results (None or List 1 to 26)
Execute ....................... executes a calculation
Tail: Leftupperboundary ofintegrationinterval
α = ?
Tail: Rightlowerboundary ofintegrationinterval
α = ?
Tail: Centralupper andlowerboundariesof integration
intervalα = ? β = ?
6-7-5
Distribution

8/20/2019 _Casio_fx9860GSD_9860G_E
http://slidepdf.com/reader/full/casiofx9860gsd9860ge 352/595
20050401
After setting all the parameters, usec to move the highlighting to “Execute” and then press
the function key shown below to perform the calculation.
•1(CALC) ... Performs the calculation.
Calculation Result Output Examples
x ....................................... inverse cumulative normal distribution
• When [Left] is selected for [Tail] :upper boundary of integration interval.
• When [Right] is selected for [Tail] :
lower boundary of integration interval.
• When [Central] is selected for [Tail] :
upper and lower boundaries of integration interval.
# There is no graphing for inverse cumulative
normal distribution.
6-7-6
Distribution

8/20/2019 _Casio_fx9860GSD_9860G_E
http://slidepdf.com/reader/full/casiofx9860gsd9860ge 353/595
20050401
kkkkk Student- t Distribution
uuuuu Student- t Probability Density
Student-t probability density calculates t probability density from a specified x value.
( x ) =
Γ
Γ
df π
– df +1
2
2df
2df + 1
df
x 21+
Perform the following key operations from the statistical data list.
5(DIST)
2(t)
1(tpd)
Data is specified using parameter specification. The following shows the meaning of each
item.
x .................................. data
df ................................. degrees of freedom (df > 0)
Save Res .................... list for storage of calculation results (None or List 1 to 26)
Execute ....................... executes a calculation or draws a graph
After setting all the parameters, usec to move the highlighting to “Execute” and then press
one of the function keys shown below to perform the calculation or draw the graph.
•1(CALC) ... Performs the calculation.
•6(DRAW) ... Draws the graph.
Calculation Result Output Example
p .................................. Student-t probability density
# Current V-Window settings are used for
graph drawing when the Setup screen's [Stat
Wind] setting is [Manual]. The V-Window
settings below are set automatically
when the [Stat Wind] setting is [Auto].
Xmin = –3.2, Xmax = 3.2, Xscale = 1,
Ymin = –0.1, Ymax = 0.45, Yscale = 0.1
6-7-7
Distribution

8/20/2019 _Casio_fx9860GSD_9860G_E
http://slidepdf.com/reader/full/casiofx9860gsd9860ge 354/595
20050401
uuuuu Student- t Distribution Probability
Student-t distribution probability calculates the probability of t distribution data falling
between two specific values.
p =
Γ
Γ
df π 2df
2df + 1
– df +1
2
df
x 21+ dx
a
b
∫ a : lower boundary
b : upper boundary
Perform the following key operations from the statistical data list.
5(DIST)
2(t)
2(tcd)
Data is specified using parameter specification. The following shows the meaning of each
item.
Lower .......................... lower boundary
Upper .......................... upper boundary
df ................................. degrees of freedom (df > 0)Save Res .................... list for storage of calculation results (None or List 1 to 26)
Execute ....................... executes a calculation
After setting all the parameters, usec to move the highlighting to “Execute” and then press
the function key shown below to perform the calculation.
•1(CALC) ... Performs the calculation.
# There is no graphing for Student-t distribution
probability.
6-7-8
Distribution

8/20/2019 _Casio_fx9860GSD_9860G_E
http://slidepdf.com/reader/full/casiofx9860gsd9860ge 355/595
20050401
Calculation Result Output Example
p .................................. Student-t distribution probability
t:Low ........................... t:Low value (input lower value)
t:Up ............................. t:Up value (input upper value)
kkkkk χ2
Distribution
uuuuu χ2 Probability Density
χ2 probability density calculates the probability density function for the χ2 distribution at a
specified x value.
( x ) =
Γ
1
2df
df
2 x e
21
df
2–1
x
2–
Perform the following key operations from the statistical data list.
5(DIST)
3(CHI)
1(Cpd)
Data is specified using parameter specification. The following shows the meaning of each
item.
x .................................. data
df ................................. degrees of freedom (positive integer)
Save Res .................... list for storage of calculation results (None or List 1 to 26)
Execute ....................... executes a calculation or draws a graph
After setting all the parameters, usec to move the highlighting to “Execute” and then press
one of the function keys shown below to perform the calculation or draw the graph.
•1(CALC) ... Performs the calculation.
•6(DRAW) ... Draws the graph.
6-7-9
Distribution

8/20/2019 _Casio_fx9860GSD_9860G_E
http://slidepdf.com/reader/full/casiofx9860gsd9860ge 356/595
20050401
Calculation Result Output Example
p .................................. χ2 probability density
# Current V-Window settings are used for
graph drawing when the Setup screen's [Stat
Wind] setting is [Manual]. The V-Window
settings below are set automatically
when the [Stat Wind] setting is [Auto].
Xmin = 0, Xmax = 11.5, Xscale = 2,
Ymin = -0.1, Ymax = 0.5, Yscale = 0.1
6-7-10
Distribution

8/20/2019 _Casio_fx9860GSD_9860G_E
http://slidepdf.com/reader/full/casiofx9860gsd9860ge 357/595
20050401
uuuuu χ2 Distribution Probability
χ2 distribution probability calculates the probability of χ2 distribution data falling between two
specific values.
p =
Γ
1
2df
df
2
x e dx 21
df
2–1
x
2–
a
b
∫ a : lower boundary
b : upper boundary
Perform the following key operations from the statistical data list.
5(DIST)
3(CHI)
2(Ccd)
Data is specified using parameter specification. The following shows the meaning of each
item.
Lower .......................... lower boundary
Upper .......................... upper boundary
df ................................. degrees of freedom (positive integer)
Save Res .................... list for storage of calculation results (None or List 1 to 26)Execute ....................... executes a calculation
After setting all the parameters, usec to move the highlighting to “Execute” and then press
the function key shown below to perform the calculation.
•1(CALC) ... Performs the calculation.
# There is no graphing for χ2 distribution
probability.
6-7-11
Distribution

8/20/2019 _Casio_fx9860GSD_9860G_E
http://slidepdf.com/reader/full/casiofx9860gsd9860ge 358/595
20050401
Calculation Result Output Example
p .................................. χ2 distribution probability
kkkkk F Distribution
uuuuu F
Probability DensityF probability density calculates the probability density function for the F distribution at a
specified x value.
Γ
n
2
x d
nn
2–1
2n
Γ 2
n + d
Γ 2d d
nx 1 +
n + d
2
( x ) =
–
Perform the following key operations from the statistical data list.
5(DIST)4(F)
1(Fpd)
Data is specified using parameter specification. The following shows the meaning of each
item.
x .................................. data
n:df .............................. numerator degrees of freedom (positive integer)d :df .............................. denominator degrees of freedom (positive integer)
Save Res .................... list for storage of calculation results (None or List 1 to 26)
Execute ....................... executes a calculation or draws a graph
After setting all the parameters, usec to move the highlighting to “Execute” and then press
one of the function keys shown below to perform the calculation or draw the graph.
• 1(CALC) ... Performs the calculation.
• 6(DRAW) ... Draws the graph.
6-7-12
Distribution

8/20/2019 _Casio_fx9860GSD_9860G_E
http://slidepdf.com/reader/full/casiofx9860gsd9860ge 359/595
20050401
Calculation Result Output Example
p .................................. F probability density
# V-Window settings for graph drawing are set
automatically when the Setup screen's [Stat
Wind] setting is [Auto]. Current V-Window
settings are used for graph drawing when the
[Stat Wind] setting is [Manual].
6-7-13
Distribution

8/20/2019 _Casio_fx9860GSD_9860G_E
http://slidepdf.com/reader/full/casiofx9860gsd9860ge 360/595
20050401
uuuuu F Distribution Probability
F distribution probability calculates the probability of F distribution data falling between two
specific values.
p =
Γ
n
2
dx x d
nn
2–1
2n
Γ 2
n + d
Γ 2d d
nx 1 +
n + d
2–
a
b
∫ a : lower boundary
b : upper boundary
Perform the following key operations from the statistical data list.
5(DIST)
4(F)
2(Fcd)
Data is specified using parameter specification. The following shows the meaning of each
item.
Lower .......................... lower boundary
Upper .......................... upper boundary
n:df .............................. numerator degrees of freedom (positive integer)
d :df .............................. denominator degrees of freedom (positive integer)
Save Res .................... list for storage of calculation results (None or List 1 to 26)
Execute ....................... executes a calculation
After setting all the parameters, usec to move the highlighting to “Execute” and then press
the function key shown below to perform the calculation.
•1(CALC) ... Performs the calculation.
# There is no graphing for F distribution
probability.
6-7-14
Distribution

8/20/2019 _Casio_fx9860GSD_9860G_E
http://slidepdf.com/reader/full/casiofx9860gsd9860ge 361/595
20050401
Calculation Result Output Example
p .................................. F distribution probability
6-7-15
Distribution

8/20/2019 _Casio_fx9860GSD_9860G_E
http://slidepdf.com/reader/full/casiofx9860gsd9860ge 362/595
20050401
kkkkk Binomial Distribution
uuuuu Binomial Probability
Binomial probability calculates a probability at a specified value for the discrete binomial
distribution with the specified number of trials and probability of success on each trial.
( x ) = nC x p x (1– p)n – x ( x = 0, 1, ·······, n) p : success probability
(0 < p < 1)
n : number of trials
Perform the following key operations from the statistical data list.
5(DIST)
5(BINM)
1(Bpd)
The following shows the meaning of each item when data is specified using list specification.
Data ............................ data type
List .............................. list whose contents you want to use as specified data
(List 1 to 26)
Numtrial ....................... number of trials p .................................. success probability (0 < p < 1)
Save Res .................... list for storage of calculation results (None or List 1 to 26)
Execute ....................... executes a calculation
The following shows the meaning of a parameter data specification item that is different from
list data specification.
x .................................. integer from 0 to n
After setting all the parameters, usec to move the highlighting to “Execute” and then press
the function key shown below to perform the calculation.
•1(CALC) ... Performs the calculation.
# There is no graphing for binomial distribution.
6-7-16
Distribution

8/20/2019 _Casio_fx9860GSD_9860G_E
http://slidepdf.com/reader/full/casiofx9860gsd9860ge 363/595
20050401
Calculation Result Output Example
p .................................. binomial probability
uuuuu Binomial Cumulative Density
Binomial cumulative density calculates a cumulative probability at a specified value for the
discrete binomial distribution with the specified number of trials and probability of success oneach trial.
Perform the following key operations from the statistical data list.
5 (DIST)
5 (BINM)
2 (Bcd)
The following shows the meaning of each item when data is specified using list specification.
Data ............................ data type
List .............................. list whose contents you want to use as specified data
(List 1 to 26)
Numtrial ....................... number of trials
p .................................. success probability (0 < p < 1)
Save Res .................... list for storage of calculation results (None or List 1 to 26)
Execute ....................... executes a calculation
The following shows the meaning of a parameter data specification item that is different from
list data specification.
x .................................. integer from 0 to n
6-7-17
Distribution

8/20/2019 _Casio_fx9860GSD_9860G_E
http://slidepdf.com/reader/full/casiofx9860gsd9860ge 364/595
20050401
After setting all the parameters, usec to move the highlighting to “Execute” and then press
the function key shown below to perform the calculation.
• 1(CALC) ... Performs the calculation.
Calculation Result Output Example
p ......................................... probability of success
6-7-18
Distribution

8/20/2019 _Casio_fx9860GSD_9860G_E
http://slidepdf.com/reader/full/casiofx9860gsd9860ge 365/595
20050401
kkkkk Poisson Distribution
uuuuu Poisson Probability
Poisson probability calculates a probability at a specified value for the discrete Poisson
distribution with the specified mean.
f ( x ) = x!
e – x µ µ
( x = 0, 1, 2, ···) µ : mean (µ > 0)
Perform the following key operations from the statistical data list.
5(DIST)
6(g)1(POISN)
1(Ppd)
The following shows the meaning of each item when data is specified using list specification.
Data ............................ data type
List .............................. list whose contents you want to use as specified data
(List 1 to 26)
µ .................................. mean (µ
> 0)Save Res .................... list for storage of calculation results (None or List 1 to 26)
Execute ....................... executes a calculation
The following shows the meaning of a parameter data specification item that is different from
list data specification.
x .................................. ( x > 0)
After setting all the parameters, usec to move the highlighting to “Execute” and then press
the function key shown below to perform the calculation.
•1(CALC) ... Performs the calculation.
Calculation Result Output Example
p .................................. Poisson probability
# There is no graphing for Poisson distribution.
6-7-19
Distribution

8/20/2019 _Casio_fx9860GSD_9860G_E
http://slidepdf.com/reader/full/casiofx9860gsd9860ge 366/595
20050401
uuuuu Poisson Cumulative Density
Poisson cumulative density calculates a cumulative probability at specified value for the
discrete Poisson distribution with the specified mean.
Perform the following key operations from the statistical data list.
5(DIST)
6(g)1(POISN)
2(Pcd)
The following shows the meaning of each item when data is specified using list specification.
Data ............................ data type
List .............................. list whose contents you want to use as specified data
(List 1 to 26)
µ .................................. mean (µ > 0)
Save Res .................... list for storage of calculation results (None or List 1 to 26)
Execute ....................... executes a caluculation
The following shows the meaning of a parameter data specification item that is different fromlist data specification.
x .................................. ( x > 0)
After setting all the parameters, usec to move the highlighting to “Execute” and then press
the function key shown below to perform the calculation.
•1(CALC) ... Performs the calculation.
Calculation Result Output Example
p .................................. Poisson cumulative probability
6-7-20
Distribution

8/20/2019 _Casio_fx9860GSD_9860G_E
http://slidepdf.com/reader/full/casiofx9860gsd9860ge 367/595
20050401
kkkkk Geometric Distribution
uuuuu Geometric Probability
Geometric probability calculates the probability at a specified value, and the number of the
trial on which the first success occurs, for the geometric distribution with a specified
probability of success.
f ( x ) = p(1– p) x – 1 ( x = 1, 2, 3, ···)
Perform the following key operations from the statistical data list.
5(DIST)
6(g)2(GEO)
1(Gpd)
The following shows the meaning of each item when data is specified using list specification.
Data ............................ data type
List .............................. list whose contents you want to use as specified data
(List 1 to 26)
p .................................. success probability (0 < p < 1)
Save Res .................... list for storage of calculation results (None or List 1 to 26)
Execute ....................... executes a calculation
The following shows the meaning of a parameter data specification item that is different from
list data specification.
x .................................. positive integer ( x > 1)
After setting all the parameters, usec to move the highlighting to “Execute” and then press
the function key shown below to perform the calculation.
•1(CALC) ... Performs the calculation.
Calculation Result Output Example
p .................................. geometric probability
6-7-21
Distribution
# There is no graphing for geometric distribu-
tion.
# Positive integer number is calculated whether
list data (Data:List) or x value (Data:variable)
is specified.

8/20/2019 _Casio_fx9860GSD_9860G_E
http://slidepdf.com/reader/full/casiofx9860gsd9860ge 368/595
20050401
uuuuu Geometric Cumulative Density
Geometric cumulative density calculates a cumulative probability at specified value, the
number of the trial on which the first success occurs, for the discrete geometric distributionwith the specified probability of success.
Perform the following key operations from the statistical data list.
5(DIST)
6(g)2(GEO)
2(Gcd)
The following shows the meaning of each item when data is specified using list specification.
Data ............................ data type
List .............................. list whose contents you want to use as specified data
(List 1 to 26)
p .................................. success probability (0 < p < 1)
Save Res .................... list for storage of calculation results (None or List 1 to 26)
Execute ....................... executes a calculation
The following shows the meaning of a parameter data specification item that is different fromlist data specification.
x .................................. positive integer ( x > 1)
After setting all the parameters, usec to move the highlighting to “Execute” and then press
the function key shown below to perform the calculation.
•1(CALC) ... Performs the calculation.
Calculation Result Output Example
p .................................. geometric cumulative probability
# Positive integer number is calculated whether
list data (Data:List) or x value (Data:variable)
is specified.
6-7-22
Distribution

8/20/2019 _Casio_fx9860GSD_9860G_E
http://slidepdf.com/reader/full/casiofx9860gsd9860ge 369/595
20050401
Financial Calculation (TVM)The TVM mode provides you with the tools to perform the followingtypes of financial calculations.
• Simple interest
• Compound interest
• Cash Flow (Investment appraisal)• Amortization• Interest rate conversion (annual percentage rate and effective
interest rate)
• Cost, selling price, margin
• Day/date calculations
7-1 Before Performing Financial Calculations
7-2 Simple Interest
7-3 Compound Interest
7-4 Cash Flow (Investment Appraisal)
7-5 Amortization
7-6 Interest Rate Conversion
7-7 Cost, Selling Price, Margin
7-8 Day/Date Calculations
Chapter
7

8/20/2019 _Casio_fx9860GSD_9860G_E
http://slidepdf.com/reader/full/casiofx9860gsd9860ge 370/595
20050401
7-1 Before Performing Financial Calculations
From the Main Menu, enter the TVM mode and display the Financial screen like the one
shown below.
Financial 1 screen Financial 2 screen
• {SMPL} … {simple interest}
• {CMPD} … {compound interest}
• {CASH} … {cash flow (investment appraisal)}
• {AMT} … {amortization}
• {CNVT} … {interest rate conversion}
• {COST} … {cost, selling price, margin}
• {DAYS} … {day/date calculations}
kkkkk Setup Items
uuuuu Payment
• {BGN}/{END} … Specifies {beginning of the period}/{end of the period} payment
uuuuu Date Mode
• {365}/{360} … Specifies calculation according to a {365-day}/{360-day} year
Note the following points regarding Setup screen settings whenever using the TVM mode.
• Drawing a financial graph while the Label item is turned on, displays the label CASH for thevertical axis (deposits, withdrawals), and TIME for the horizontal axis (frequency).
• The number of display digits applied in the TVM mode is different from the number of digits
used in other modes. The calculators automatically reverts to Norm 1 whenever you enter
the TVM mode, which cancels a Sci (number of significant digits) or Eng (engineering
notation) setting made in another mode.
7-1-1Before Performing Financial Calculations

8/20/2019 _Casio_fx9860GSD_9860G_E
http://slidepdf.com/reader/full/casiofx9860gsd9860ge 371/595
20050401
7-1-2 Before Performing Financial Calculations
kkkkkGraphing in the TVM Mode
After performing a financial calculation, you can use6 (GRPH) to graph the results as shown
below.
• Pressing1 (Trace) or!1 (TRCE) while a graph is on the display activates Trace,
which can be used to look up other financial values. In the case of simple interest, for
example, pressinge displays PV , SI , and SFV . Pressingd displays the same values inreverse sequence.
• Zoom, Scroll, and Sketch cannot be used in the TVM mode.
• Whether you should use a positive or a negative value for the present value (PV) or the
purchase price (PRC) depends on the type of calculation you are trying to perform.
• Note that graphs should be used only for reference purposes when viewing TVM mode
calculation results.
• Note that calculation results produced in this mode should be regarded as reference values
only.
• Whenever performing an actual financial transaction, be sure to check any calculation resultsobtained using this calculator with against the figures calculated by your financial institution.

8/20/2019 _Casio_fx9860GSD_9860G_E
http://slidepdf.com/reader/full/casiofx9860gsd9860ge 372/595
20050401
7-2 Simple Interest
This calculator uses the following formulas to calculate simple interest.
uuuuu Formula
365-day Mode SI' = n
365× PV × i
SI' = n
360× PV × i
I %100
i =
I %100
i =
SI : interest
n : number of interest
360-day Mode periods
PV : principal
I % : annual interest
SFV : principal plus interest
SI = –SI'
SFV = –(PV + SI' )
Press1(SMPL) from the Financial 1 screen to display the following input screen for simple
interest.
1(SMPL)
n .................................. number of interest periods (days)
I % ............................... annual interest rate
PV ............................... principal
After configuring the parameters, use one of the function menus noted below to perform the
corresponding calculation.
• {SI} … {simple interest}
• {SFV} … {simple future value}
• An error (Ma ERROR) occurs if parameters are not configured correctly.
7-2-1Simple Interest

8/20/2019 _Casio_fx9860GSD_9860G_E
http://slidepdf.com/reader/full/casiofx9860gsd9860ge 373/595
20050401
7-2-2 Simple Interest
Use the following function menus to maneuver between calculation result screens.
• {REPT} … {parameter input screen}
• {GRPH} … {draws graph}
After drawing a graph, you can press!1(TRCE) to turn on trace and read calculation
results along the graph.
Each press ofe while trace is turned on cycles the displayed value in the sequence:
present value (PV ) → simple interest (SI ) → simple future value (SFV ). Pressingd cycles
in the reverse direction.
PressJ to return to the parameter input screen.

8/20/2019 _Casio_fx9860GSD_9860G_E
http://slidepdf.com/reader/full/casiofx9860gsd9860ge 374/595
20050401
7-3 Compound Interest
This calculator uses the following standard formulas to calculate compound interest.
uuuuu Formula I
PV+PMT × + FV i(1+ i)n (1+ i)n
(1+ i × S )[(1+ i)n–1] 1 = 0 i =
100
I %
Here:
PV= –(PMT × + FV × ) β α
FV= –PMT ×
+P
α
PMT= – β PV + FV ×
α
n =
log{ } log(1+ i)
(1+ i × S) PMT +PVi
(1+ i × S) PMT –FVi
i(1+ i)n
(1+ i × S )[(1+ i)n–1]=α
(1+ i)n
1=β
F (i) = Formula I
+ (1+ i× S )[n(1+ i)–n–1
]+S
– nFV (1+ i)–n–1
ii
PMT (1+ i× S )[1– (1+ i)–n]
F (i)'= –
[+S [1–(1+ i)–n] ]
uuuuu Formula II ( I % = 0)
PV + PMT × n + FV = 0
Here:
PV = – (PMT × n + FV )
PV : present value
FV : future value
PMT : payment
n : number of compound periods I % : annual interest rate
i is calculated using Newton’s Method.
S = 0 assumed for end of term
S = 1 assumed for beginning of term
7-3-1Compound Interest

8/20/2019 _Casio_fx9860GSD_9860G_E
http://slidepdf.com/reader/full/casiofx9860gsd9860ge 375/595
20050401
FV = – (PMT × n + PV )
nPMT = –
PV+
FV
PMT n = –
PV + FV
• A deposit is indicated by a plus sign (+), while a withdrawal is indicated by a minus sign (–).
uuuuuConverting between the nominal interest rate and effective interest rate
The nominal interest rate ( I % value input by user) is converted to an effective interest rate
( I %') when the number of installments per year (P/Y ) is different from the number of
compound interest calculation periods (C/Y ). This conversion is required for installment
savings accounts, loan repayments, etc.
P/Y : installment
periods per year
C/Y : compounding
periods per year
When calculating n, PV , PMT , FV The following calculation is performed after conversion from the nominal interest rate to the
effective interest rate, and the result is used for all subsequent calculations.
i = I%' ÷100
When calculating I %
After I % is obtained, the following calculation is performed to convert to I %'.
I%' = I%
(1+ ) –1[C / Y ]
[P / Y ]
100
{ }×[C / Y ]×100
P/Y : installment
periods per year
C/Y : compoundingperiods per year
The value of I %' is returned as the result of the I % calculation.
7-3-2 Compound Interest
I%' = I%
(1+ ) –1
[C / Y ]
[P / Y ]
100 × [C / Y ]{ }×100

8/20/2019 _Casio_fx9860GSD_9860G_E
http://slidepdf.com/reader/full/casiofx9860gsd9860ge 376/595
20050401
Press2(CMPD) from the Financial 1 screen to display the following input screen for
compound interest.
2(CMPD)
n .................................. number of compound periods
I % ............................... annual interest rate
PV ............................... present value (loan amount in case of loan; principal in case
of savings)
PMT ............................ payment for each installment (payment in case of loan;
deposit in case of savings)
FV ............................... future value (unpaid balance in case of loan; principal plus
interest in case of savings)
P / Y .............................. installment periods per year
C / Y .............................. compounding periods per year
Important! Inputting Values
A period (n) is expressed as a positive value. Either the present value (PV ) or future value
(FV ) is positive, while the other (PV or FV ) is negative.
Precision
This calculator performs interest calculations using Newton’s Method, which produces
approximate values whose precision can be affected by various calculation conditions.
Because of this, interest calculation results produced by this calculator should be used
keeping the above limitation in mind or the results should be verified.
7-3-3 Compound Interest

8/20/2019 _Casio_fx9860GSD_9860G_E
http://slidepdf.com/reader/full/casiofx9860gsd9860ge 377/595
20050401
7-3-4 Compound Interest
After configuring the parameters, use one of the function menus noted below to perform the
corresponding calculation.
• {n} … {number of compound periods}
• {I%} … {annual interest rate}• {PV} … {present value} (Loan: loan amount; Savings: balance)
• {PMT} … {payment} (Loan: installment; Savings: deposit)
• {FV} … {future value} (Loan: unpaid balance; Savings: principal plus interest)
• {AMT} … {amortization screen}
• An error (Ma ERROR) occurs if parameters are not configured correctly.
Use the following function menus to maneuver between calculation result screens.
• {REPT} … {parameter input screen}
• {AMT} … {amortization screen}
• {GRPH} … {draws graph}
After drawing a graph, you can press!1(TRCE) to turn on trace and read calculation
results along the graph.
PressJ to return to the parameter input screen.

8/20/2019 _Casio_fx9860GSD_9860G_E
http://slidepdf.com/reader/full/casiofx9860gsd9860ge 378/595
20050401
7-4 Cash Flow (Investment Appraisal)
This calculator uses the discounted cash flow (DCF) method to perform investment appraisal
by totalling cash flow for a fixed period. This calculator can perform the following four typesof investment appraisal.
• Net present value ( NPV )
• Net future value ( NFV )
• Internal rate of return ( IRR)
• Payback period* (PBP)
* The payback period (PBP) can also be called the “discounted payback period” ( DPP).
When the annual interest rate ( I %) is zero, the PBP is called the “simple payback period”
(SPP).
A cash flow diagram like the one shown below helps to visualize the movement of funds.
CF 0
CF 1
CF 2 CF 3CF 4
CF 5CF 6
CF 7
With this graph, the initial investment amount is represented by CF 0. The cash flow one yearlater is shown by CF 1, two years later by CF 2, and so on.
Investment appraisal can be used to clearly determine whether an investment is realizing
profits that were originally targeted.
u NPV
NPV = CF 0 + + + + … +(1+ i)
CF 1
(1+ i )2
CF 2
(1+ i)3
CF 3
(1+ i)nCF n
i =
100
I %
n: natural number up to 254
u NFV
NFV = NPV × (1
+ i )n
u IRR
0 = CF 0 + + + + … +(1+ i )
CF 1
(1+ i)2
CF 2
(1+ i)3
CF 3
(1+ i)nCF n
In this formula, NPV = 0, and the value of IRR is equivalent to i × 100. It should be noted,
however, that minute fractional values tend to accumulate during the subsequent
calculations performed automatically by the calculator, so NPV never actually reaches
exactly zero. IRR becomes more accurate the closer that NPV approaches to zero.
7-4-1Cash Flow (Investment Appraisal)
20050601

8/20/2019 _Casio_fx9860GSD_9860G_E
http://slidepdf.com/reader/full/casiofx9860gsd9860ge 379/595
20050401
uuuuu PBP
n: Smallest positive integer that satisfies the conditions NPV n < 0, NPV n+1 > 0, or 0.
• Press3(CASH) from the Financial 1 screen to display the following input screen for Cash
Flow.
3(CASH)
I % ............................... interest rate (%)
Csh .............................. list for cash flow
If you have not yet input data into a list, press5('LIST) and input data into a list.
After configuring the parameters, use one of the function menus noted below to perform the
corresponding calculation.
• {NPV} … {net present value}
• {IRR} … {internal rate of return}
• {PBP} … {payback period}
• {NFV} … {net future value}
• {'LIST} … {inputs data into a list}
• {LIST} … {specifies a list for data input}
• An error (Ma ERROR) occurs if parameters are not configured correctly.
7-4-2 Cash Flow (Investment Appraisal)
20050601
PBP =
NPV n = Σ{
0 .................................. (CF 0 > 0)
n – NPV n
n
k = 0
NPV n+1 – NPV n
CF k
(1 + i)k
(Other than those above) ...

8/20/2019 _Casio_fx9860GSD_9860G_E
http://slidepdf.com/reader/full/casiofx9860gsd9860ge 380/595
20050401
Use the following function menus to maneuver between calculation result screens.
• {REPT} … {parameter input screen}
• {GRPH} … {draws graph}
After drawing a graph, you can press!1(TRCE) to turn on trace and read calculation
results along the graph.
PressJ to return to the parameter input screen.
7-4-3 Cash Flow (Investment Appraisal)
20050601

8/20/2019 _Casio_fx9860GSD_9860G_E
http://slidepdf.com/reader/full/casiofx9860gsd9860ge 381/595
20061001
7-5 Amortization
This calculator can be used to calculate the principal and interest portion of a monthly
installment, the remaining principal, and amount of principal and interest repaid up to anypoint.
u Formula
a: interest portion of installment PM1 ( INT )
b: principal portion of installment PM1 (PRN )c: balance of principal after installment PM2 ( BAL)
d : total principal from installment PM1 to payment of installment PM2 (ΣPRN )
e: total interest from installment PM1 to payment of installment PM2 (Σ INT )
*a + b = one repayment (PMT )
c
a
b
1 payment
Number of Payments
1 PM1 PM2 Last.............. ..................... ............
c
a
b
1 payment
Number of Payments
1 PM1 PM2 Last.............. ..................... ............
1 payment
Number of Payments
1 PM1 PM2 Last............... .................. ...............
d
e
1 payment
Number of Payments
1 PM1 PM2 Last............... .................. ...............
d
e
7-5-1
Amortization
20070101

8/20/2019 _Casio_fx9860GSD_9860G_E
http://slidepdf.com/reader/full/casiofx9860gsd9860ge 382/595
20061001
BAL0 = PV ( INT 1 = 0 and PRN 1 = PMT at beginning of installment term)
u Converting between the nominal interest rate and effective interest rate
The nominal interest rate ( I % value input by user) is converted to an effective interest rate
( I %' ) for installment loans where the number of installments per year is different from thenumber of compound interest calculation periods.
The following calculation is performed after conversion from the nominal interest rate to the
effective interest rate, and the result is used for all subsequent calculations.
Press4(AMT) from the Financial 1 screen to display the following input screen for
amortization.
4(AMT)
PM1 .............................. first installment of installments 1 through n
PM2 .............................. second installment of installments 1 through n
n .................................. installments
I % ................................ interest rate
PV ............................... principal
PMT ............................ payment for each installment
FV ............................... balance following final installment
P / Y .............................. installments per year
a : INT PM1 = I BALPM1–1 × i I × (PMT sign)
b : PRN PM1 = PMT + BALPM1–1× i
c : BALPM2 = BALPM2–1 + PRN PM2
d : Σ PRN = PRN PM1 + PRN PM1+1 + … + PRN PM2
e : Σ INT = INT PM1 + INT PM1+1 + … + INT PM2
PM2
PM1
PM2
PM1
a : INT PM1 = I BALPM1–1 × i I × (PMT sign)
b : PRN PM1 = PMT + BALPM1–1× i
c : BALPM2 = BALPM2–1 + PRN PM2
d : Σ PRN = PRN PM1 + PRN PM1+1 + … + PRN PM2
e : Σ INT = INT PM1 + INT PM1+1 + … + INT PM2
PM2
PM1
PM2
PM1
I%' = I%
(1+ ) –1
[C / Y ]
[P / Y ]
100 × [C / Y ]{ ×100 I%' = I%
(1+ ) –1
[C / Y ]
[P / Y ]
100 × [C / Y ]{ ×100
i = I%' ÷100i = I%' ÷100
7-5-2
Amortization
20070101

8/20/2019 _Casio_fx9860GSD_9860G_E
http://slidepdf.com/reader/full/casiofx9860gsd9860ge 383/595
20050401
7-5-3 Amortization
After configuring the parameters, use one of the function menus noted below to perform the
corresponding calculation.
• {BAL} … {balance of principal after installment PM2}
• {INT} … {interest portion of installment PM1}• {PRN} … {principal portion of installment PM1}
• {ΣINT} … {total interest paid from installment PM1 to installment PM2}
• {ΣPRN} … {total principal paid from installment PM1 to installment PM2}
• {CMPD} … {compound interest screen}
• An error (Ma ERROR) occurs if parameters are not configured correctly.
Use the following function menus to maneuver between calculation result screens.
• {REPT} … {parameter input screen}
• {CMPD} … {compound interest screen}
• {GRPH} … {draws graph}
After drawing a graph, you can press!1(TRCE) to turn on trace and read calculation
results along the graph.
The first press of!1(TRCE) displays INT and PRN when n = 1. Each press ofe
shows INT and PRN when n = 2, n = 3, and so on.
PressJ to return to the parameter input screen.

8/20/2019 _Casio_fx9860GSD_9860G_E
http://slidepdf.com/reader/full/casiofx9860gsd9860ge 384/595
20050401
7-6 Interest Rate Conversion
The procedures in this section describe how to convert between the annual percentage rate
and effective interest rate.
uuuuu Formula
EFF =n
APR/ 1001+ –1 × 100
n
APR =100
EFF 1+ –1 × n ×100
1n
Press5(CNVT) from the Financial 1 screen to display the following input screen for
interest rate conversion.
5(CNVT)
n ....................................... number of compoundings
I % ............................... interest rate
After configuring the parameters, use one of the function menus noted below to perform the
corresponding calculation.
• {'EFF} … {converts annual percentage rate to effective interest rate}
• {'APR} … {converts effective interest rate to annual percent rate}
• An error (Ma ERROR) occurs if parameters are not configured correctly.
Use the following function menu to maneuver between calculation result screens.
• {REPT} … {parameter input screen}
APR : annual percentage rate (%)
EFF : effective interest rate (%)
n : number of compoundings
7-6-1Interest Rate Conversion

8/20/2019 _Casio_fx9860GSD_9860G_E
http://slidepdf.com/reader/full/casiofx9860gsd9860ge 385/595
20050401
7-7 Cost, Selling Price, Margin
Cost, selling price, or margin can be calculated by inputting the other two values.
uuuuu Formula
CST = SEL100
MRG1–
SEL =
100 MRG
1–
CST
MRG(%) =SEL
CST 1– ×100
Press1(COST) from the Financial 2 screen to display the following input screen.
6(g)1(COST)
Cst ............................... cost
Sel ............................... selling price
Mrg .............................. margin
After configuring the parameters, use one of the function menus noted below to perform the
corresponding calculation.
• {COST} … {cost}
• {SEL} … {selling price}
• {MRG} … {margin}
• An error (Ma ERROR) occurs if parameters are not configured correctly.
Use the following function menu to maneuver between calculation result screens.
• {REPT} … {parameter input screen}
CST : cost
SEL : selling price
MRG : margin
7-7-1Cost, Selling Price, Margin

8/20/2019 _Casio_fx9860GSD_9860G_E
http://slidepdf.com/reader/full/casiofx9860gsd9860ge 386/595
20050401
7-8 Day/Date Calculations
You can calculate the number of days between two dates, or you can determine what date
comes a specific number of days before or after another date.
Press2(DAYS) from the Financial 2 screen to display the following input screen for day/
date calculation.
6(g)2(DAYS)
d1 ................................ date 1
d2 ................................ date 2
D ................................. number of days
To input a date, first highlight d1 or d2. Pressing a number key to input the month causes an
input screen like the one shown below to appear on the display.
7-8-1Day/Date Calculations
# The Setup screen can be used to specify
either a 365-day or 360-day year for financial
calculations. Day/date calculations are also
performed in accordance with the current
setting for number of days in the year, but the
following calculations cannot be performed
when the 360-day year is set. Attempting to do
so causes an error.
(Date) + (Number of Days)(Date) – (Number of Days)
# The allowable calculation range is January 1,
1901 to December 31, 2099.

8/20/2019 _Casio_fx9860GSD_9860G_E
http://slidepdf.com/reader/full/casiofx9860gsd9860ge 387/595
20050401
Input the month, day, and year, pressingw after each.
After configuring the parameters, use one of the function menus noted below to perform the
corresponding calculation.
• {PRD} … {number of days from d1 to d2 (d2 – d1)}
• {d1+D} … {d1 plus a number of days (d1 + D)}
• {d1–D} … {d1 minus a number of days (d1 – D)}
• An error (Ma ERROR) occurs if parameters are not configured correctly.
Use the following function menu to maneuver between calculation result screens.
• {REPT} … {parameter input screen}
360-day Date Mode Calculations
The following describes how calculations are processed when 360 is specified for the Date
Mode item in the Setup screen.
• If d1 is day 31 of a month, d1 is treated as day 30 of that month is used.
• If d2 is day 31 of a month, d2 is treated as day 1 of the following month, unless d1 is day
30.
7-8-2 Day/Date Calculations

8/20/2019 _Casio_fx9860GSD_9860G_E
http://slidepdf.com/reader/full/casiofx9860gsd9860ge 388/595
20050401
Programming8-1 Basic Programming Steps
8-2 PRGM Mode Function Keys
8-3 Editing Program Contents
8-4 File Management
8-5 Command Reference
8-6 Using Calculator Functions in Programs
8-7 PRGM Mode Command List
8-8 Program Library
Chapter
This unit comes with approximately 64 Kbytes of memory.
• You can check how much memory has been used and how much remains
by entering the MEMORY mode from the Main Menu, and then pressing1(MAIN). See “12-7 MEMORY Mode” for details.
8
20050601

8/20/2019 _Casio_fx9860GSD_9860G_E
http://slidepdf.com/reader/full/casiofx9860gsd9860ge 389/595
20050401
8-1 Basic Programming Steps
Description
Commands and calculations are executed sequentially, just like manual calculation
multistatements.
Set Up
1. From the Main Menu, enter the PRGM mode. When you do, a program list appears on
the display.
Selected program area
(usef andc to move)
Files are listed in the alphabetic sequence of their
names.
Execution
2. Register a file name.
3. Input the program.
4. Run the program.
8-1-1Basic Programming Steps
# If there are no programs stored in memory
when you enter the PRGM mode, the
message “No Programs” appears on the
display and only the NEW item (3) is shown
in the function menu.
# The values to the right of the program list
indicate the number of bytes used by each
program.
# A file name can be up to eight characterslong.
# The following are the characters you can use in
a file name:
A through Z, r , θ , spaces, [, ], {, }, ’, ”, ~,
0 through 9, ., +, –, ×, ÷
# Registering a file name uses 32 bytes of
memory.
# The file name input screen remains on the
display if you pressw without inputting a file
name.# To exit the file name input screen and return to
the program list without registering a file name,
pressJ.

8/20/2019 _Casio_fx9860GSD_9860G_E
http://slidepdf.com/reader/full/casiofx9860gsd9860ge 390/595
20050401
○ ○ ○ ○ ○
Example 1 To calculate the surface area (cm2) and volume (cm3) of three regular
octahedrons when the length of one side is 7, 10, and 15 cm,
respectively
Store the calculation formula under the file name OCTA.
A
The following are the formulas used for calculating surface area S
and volume V of a regular octahedron for which the length of one side
A is known.
Procedure
1m PRGM
23(NEW)OCTAw*1
3!J(PRGM)4(?)aav(A)6(g)5(:)*2
c*!x( )d*av(A)x6(g)5(^)
!x( )c/d*av(A)Md
JJ
41(EXE) orw
hw(Value of A)
w
w
wbaw
w
w
wbfw
w*3
8-1-2 Basic Programming Steps
2S = 2 3 A2, V = –––– A3
3
*1Press3(NEW) and the cursor changes form
to indicate alpha character input.
*2The following shows how the calculation of the
surface area and volume of a regular
octahedron would be calculated using a
manual calculation.
Surface Area S ...c*!x( )d*<value of A>xw
Volume V ............!x( )c/d*
<value of A>Mdw
*3Pressingw while the final result of a program
is on the display changes to the program list.
# You can also run a program while in the RUN
•
MAT mode by inputting: Prog ”<file name>”w.
# Pressingw while the final result of a program
executed using this method is on the display
re-executes the program.
# An error occurs if the program specified by Prog
”<file name>” cannot be found.
S when A = 7V when A = 7
S when A = 10V when A = 10
S when A = 15V when A = 15

8/20/2019 _Casio_fx9860GSD_9860G_E
http://slidepdf.com/reader/full/casiofx9860gsd9860ge 391/595
20050401
8-2 PRGM Mode Function Keys
• {NEW} ... {new program}
u When you are registering a file name
• {RUN} / {BASE} ... {general calculation}/{number base} program input
• {QQQQQ} ... {password registration}
• {SYBL} ... {symbol menu}
u When you are inputting a program ——1(RUN) … default• {TOP} / {BTM} ... {top}/{bottom} of program
• {SRC} ... {search}
• {MENU} ... {mode menu}
• {STAT} / {MAT} / {LIST} / {GRPH} / {DYNA} / {TABL} / {RECR}
... {statistic}/{matrix}/{list}/{graph}/ {Dynamic Graph}/{Table}/{recursion} menu
• {A↔a} ... {toggles between upper-case and lower-case input}
• {CHAR} ... {displays a screen for selecting various mathematical symbols, special
symbols, and accented characters}
• Pressing!J(PRGM) displays the following PRGM (PROGRAM) menu.
• {COM} ... {program command menu}
• {CTL} ... {program control command menu}
• {JUMP} ... {jump command menu}
• {?} / {^} ... {input}/{output} command
• {CLR} / {DISP} ... {clear}/{display} command menu
• {REL} ... {conditional jump relational operator menu}
• {I/O} ... {I/O control/transfer command menu}• {:} ... {separator for expressions and commands}
See “8-5 Command Reference” for full details on each of these commands.
• Pressing!m(SET UP) displays the mode command menu shown below.
• {ANGL} / {COOR} / {GRID} / {AXES} / {LABL} / {DISP} / {S/L} / {DRAW} / {DERV} / {BACK} / {FUNC} /
{SIML} / {S-WIN} / {LIST} / {LOCS} / {T-VAR} / {ΣDSP} / {RESID} / {CPLX} / {FRAC} / {Y •SPD}
See “Setup Screen Function Key Menus” on page 1-7-1 for details about each of these
commands.
8-2-1PRGM Mode Function Keys

8/20/2019 _Casio_fx9860GSD_9860G_E
http://slidepdf.com/reader/full/casiofx9860gsd9860ge 392/595
20050401
u When you are inputting a program ——2(BASE)*1
• {TOP} / {BTM} / {SRC}
• {MENU}
• {d~o} ... {decimal}/{hexadecimal}/{binary}/{octal} value input
• {LOG} ... {logical operators}
• {DISP} ... conversion of displayed value to {decimal}/{hexadecimal}/{binary}/{octal}
• {A↔a} / {CHAR}
• Pressing!J(PRGM) displays the following PRGM (PROGRAM) menu.
• {Prog} ... {program recall}
• {JUMP} / {?} / {^}
• {REL} ... {logical operator menu}
• {:} ... {separator for expressions and commands}
• Pressing!m(SET UP) displays the mode command menu shown below.
• {Dec} / {Hex} / {Bin} / {Oct}
• {EXE} / {EDIT}
... program {execute}/{edit}
• {NEW} ... {new program}
• {DEL} / {DEL·A}
... {specific program}/{all program} delete
• {SRC} / {REN}
... file name {search}/{change}
8-2-2 PRGM Mode Function Keys
*1Programs input after pressing2(BASE) are
indicated by B to the right of the file name.

8/20/2019 _Casio_fx9860GSD_9860G_E
http://slidepdf.com/reader/full/casiofx9860gsd9860ge 393/595
20050401
8-3-1Editing Program Contents
8-3 Editing Program Contents
kDebugging a Program
A problem in a program that keeps the program from running correctly is called a “bug,” and
the process of eliminating such problems is called “debugging.” Either of the following
symptoms indicates that your program contains bugs that require debugging.
• Error messages appearing when the program is run
• Results that are not within your expectations
uuuuu To eliminate bugs that cause error messages
An error message, like the one shown below, appears whenever something illegal occurs
during program execution.
When such a message appears, pressJ to display the place in the program where the errorwas caused. The cursor will be flashing at the location of the problem. Check the “Error
Message Table” (page α -1-1) for steps you should take to correct the situation.
• Note that pressingJ does not display the location of the error if the program is
password protected. Instead, it returns to the program list screen.
uuuuu To eliminate bugs that cause bad results
If your program produces results that are not what you normally expect, check the
contents of the program and make necessary changes.
1(TOP) .....Moves the cursor to the top of the
program
2(BTM) .....Moves the cursor to the bottom of
the program

8/20/2019 _Casio_fx9860GSD_9860G_E
http://slidepdf.com/reader/full/casiofx9860gsd9860ge 394/595
20050401
kUsing an Existing Program to Create a New Program
Sometimes you can input a new program by using a program already in memory as a base.
Simply recall the existing program, make the changes you need, and then execute it.
○ ○ ○ ○ ○
Example 2 To use the OCTA program (page 8-1-2) to create a program that
calculates the surface area (cm2) and volume (cm3) of regular
tetrahedrons when the length of one side is 7, 10, and 15 cm
Use TETRA as the file name.
The following are the formulas used for calculating surface area S
and volume V of a regular tetrahedron for which the length of one
side A is known.
Use the following key operations when inputting the program.
Length of One Side A ..!J(PRGM)4(?)aav(A)6(g)5(:)
Surface Area S ............!x( )d*av(A)x6(g)5(^)
Volume V .....................!x( )c/bc*av(A)Md
Compare this with the program for calculating the surface area and volume of a regular
octahedron.
Length of One Side A ..!J(PRGM)4(?)aav(A)6(g)5(:)
Surface Area S ............c*!x( )d*av(A)x6(g)5(^)
Volume V .....................!x( )c/d*av(A)Md
As you can see, you can produce the TETRA program by making the following changes in
the OCTA program.• Deletingc * (underlined using a wavy line above)
• Changingd tob c (underlined using a solid line above)
A
8-3-2 Editing Program Contents
2S = 3 A2, V = –––– A3
12

8/20/2019 _Casio_fx9860GSD_9860G_E
http://slidepdf.com/reader/full/casiofx9860gsd9860ge 395/595
20050401
8-3-3 Editing Program Contents
Now edit OCTA to produce the TETRA program.
1. Edit the program name.
6(g)2(REN)ATETRAw
2. Edit the program contents.
2(EDIT)
eeeeeeDD
cDbc
J
3. Try running the program.
1(EXE) orw
hw(Value of A)
w
wwbaw
w
w
wbfw
w

8/20/2019 _Casio_fx9860GSD_9860G_E
http://slidepdf.com/reader/full/casiofx9860gsd9860ge 396/595
20061001
8-3-4 Editing Program Contents
k Searching for Data Inside a Program
Example To search for the letter “A” inside the program named OCTA
1. Recall the program.
2. Press3(SRC) and input the data you want to find.
3(SRC)
av(A)
3. Pressw to begin the search. The contents of the program appear on the screen with
the cursor located at the first instance of the data you specified.*1
4. Each press ofw or1(SRC) causes the cursor to jump to the next instance of the
data you specified.*2
*1 The message “Not Found” appears when the
search data you specify cannot be found in
the program.
*2 If there are no more instances of the data you
specified, the search operation ends.
# You cannot specify the newline symbol (_) or
display command (^) for the search data.
# Once the contents of the program are on the
screen, you can use the cursor keys to move
the cursor to another location before searching
for the next instance of the data. Only the part
of the program starting from the current cursor
location is searched when you pressw.
# Once the search finds an instance of your
data, inputting characters or moving the cursor
causes the search operation to be cancelled.
# If you make a mistake while inputting characters
to search for, pressA to clear your input and
re-input from the beginning.
20070101

8/20/2019 _Casio_fx9860GSD_9860G_E
http://slidepdf.com/reader/full/casiofx9860gsd9860ge 397/595
20050401
8-4-1File Management
8-4 File Management
k Searching for a File
u To find a file using initial character search
○ ○ ○ ○ ○
Example To use initial character search to recall the program named OCTA
1. While the program list is on the display, press6(g)1(SRC) and input the initial
characters of the file you want to find.
6(g)1(SRC)
OCT
2. Pressw to search.
• The name that starts with the characters you input highlights.
# If there is no program whose file name starts
with the characters you input, the message
“Not Found” appears on the display. If this
happens, pressJ to clear the error message.

8/20/2019 _Casio_fx9860GSD_9860G_E
http://slidepdf.com/reader/full/casiofx9860gsd9860ge 398/595
20050401
8-4-2 File Management
kkkkk Editing a file name
○ ○ ○ ○ ○
Example To change the name of a file from TRIANGLE to ANGLE
1. While the program list is on the display, usef andc to move the highlighting to the
file whose name you want to edit and then press6(g)2(REN).
2. Make any changes you want.
DDD
3. Pressw to register the new name and return to the program list.
The program list is resorted according to the changes you made in the file name.
kkkkkDeleting a Program
u To delete a specific program
1. While the program list is on the display, usef
andc
to move the highlighting to thename of the program you want to delete.
2. Press4(DEL).
3. Press1(Yes) to delete the selected program or6(No) to abort the operation
without deleting anything.
# If the modifications you make result in a file
name that is identical to the name of a
program already stored in memory, the
message “Already Exists” appears. When thishappens, you can perform either of the
following two operations to correct the
situation.
- PressJ to clear the error and return to
the file name editing screen.
- PressA to clear the input file name and
input a new one.

8/20/2019 _Casio_fx9860GSD_9860G_E
http://slidepdf.com/reader/full/casiofx9860gsd9860ge 399/595
20050401
8-4-3 File Management
u To delete all programs
1. While the program list is on the display, press5(DEL • A).
2. Press1(Yes) to delete all the programs in the list or6(No) to abort the operation
without deleting anything.
• You also can delete all programs by entering the MEMORY mode from the Main Menu, and
then pressing1(MAIN) to display the memory information screen.
See “12-7 MEMORY Mode” for details.
kkkkkRegistering a password
When inputting a program, you can protect it with a password that limits access to theprogram contents to those who know the password.
• You do not need to input the password to run a program.
○ ○ ○ ○ ○
Example To create a program file under the name AREA and protect it with the
password CASIO
1. While the program list is on the display, press3(NEW) and input the file name of the
new program file.
3(NEW)
AREA
2. Press5(Q) and then input the password.
5(Q)
CASIO
# The password input procedure is identical to
that used for file name input.

8/20/2019 _Casio_fx9860GSD_9860G_E
http://slidepdf.com/reader/full/casiofx9860gsd9860ge 400/595

8/20/2019 _Casio_fx9860GSD_9860G_E
http://slidepdf.com/reader/full/casiofx9860gsd9860ge 401/595
20050401
8-5-1Command Reference
8-5 Command Reference
k Command Index
Break ...............................................................................................................8-5-6
ClrGraph ....................................................................................................... 8-5-12
ClrList ............................................................................................................8-5-12
ClrMat ............................................................................................................8-5-12
ClrText ...........................................................................................................8-5-12
DispF-Tbl, DispR-Tbl .....................................................................................8-5-13
Do~LpWhile.....................................................................................................8-5-5
DrawDyna..................................................................................................... 8-5-13
DrawFTG-Con, DrawFTG-Plt ........................................................................8-5-13
DrawGraph ................................................................................................... 8-5-13
DrawR-Con, DrawR-Plt .................................................................................8-5-13
DrawRΣ-Con, DrawRΣ-Plt .............................................................................8-5-14
DrawStat....................................................................................................... 8-5-14
DrawWeb.......................................................................................................8-5-14
Dsz ..................................................................................................................8-5-9
For~To~(Step~)Next........................................................................................8-5-4Getkey ...........................................................................................................8-5-15
Goto~Lbl ....................................................................................................... 8-5-10
If~Then~(Else~)IfEnd ......................................................................................8-5-4
Isz .................................................................................................................. 8-5-11
Locate ............................................................................................................8-5-16
OpenComport38k/CloseComport38k ........................................................... 8-5-17
Prog ................................................................................................................ 8-5-7
RclCapt......................................................................................................... 8-5-18
Receive ( / Send (..........................................................................................8-5-17
Receive38k/Send38k ................................................................................... 8-5-17
Return..............................................................................................................8-5-8
Stop ................................................................................................................ 8-5-8
While~WhileEnd ..............................................................................................8-5-6
? (Input Command) .........................................................................................8-5-2
^ (Output Command) .....................................................................................8-5-3
: (Multi-statement Command) ..........................................................................8-5-3
_ (Carriage Return) .......................................................................................8-5-3
’ (Comment Text Delimiter) ..............................................................................8-5-3
S(Jump Code) .............................................................................................. 8-5-11
=, ≠, >, <, ≥, ≤ (Relational Operators) ........................................................... 8-5-18

8/20/2019 _Casio_fx9860GSD_9860G_E
http://slidepdf.com/reader/full/casiofx9860gsd9860ge 402/595
20050401
8-5-2 Command Reference
The following are conventions that are used in this section when describing the various
commands.
Boldface Text ............... Actual commands and other items that always must be
input are shown in boldface.{Curly Brackets} ........... Curly brackets are used to enclose a number of items,
one of which must be selected when using a command.
Do not input the curly brackets when inputting a com-
mand.
[Square Brackets] ........ Square brackets are used to enclose items that are
optional. Do not input the square brackets when inputting
a command.
Numeric Expressions ... Numeric expressions (such as 10, 10 + 20, A) indicate
constants, calculations, numeric constants, etc.
Alpha Characters ......... Alpha characters indicate literal strings (such as AB).
kkkkk Basic Operation Commands
? (Input Command)
Function: Prompts for input of values for assignment to variables during program execution.
Syntax: ? → <variable name>, ”<prompt>” ? → <variable name>
Example: ? → A
Description:
• This command momentarily interrupts program execution and prompts for input of a value
or expression for assignment to a variable. If you do not specify a prompt, execution of this
command causes “?” to appear indicating the calculator is standing by for input. If a prompt
is specified, “<prompt>?” appears to prompt input. Up to 255 bytes of text can be used for a
prompt.
• Input in response to the input command must be a value or an expression, and the
expression cannot be a multi-statement.
• You can specify a list name, matrix name, function memory (fn), graph (Yn), etc. as a
variable name.

8/20/2019 _Casio_fx9860GSD_9860G_E
http://slidepdf.com/reader/full/casiofx9860gsd9860ge 403/595
20050401
8-5-3 Command Reference
^ (Output Command)
Function: Displays an intermediate result during program execution.
Description:• This command momentarily interrupts program execution and displays alpha character text
or the result of the calculation immediately before the command.
• The output command should be used at locations where you would normally press thew
key during a manual calculation.
: (Multi-statement Command)
Function: Connects two statements for sequential execution without stopping.
Description:
• Unlike the output command ( ), statements connected with the multi-statement command
are executed non-stop.
• The multi-statement command can be used to link two calculation expressions or two
commands.
• You can also use a carriage return indicated by _ in place of the multi-statement
command.
_____ (Carriage Return)
Function: Connects two statements for sequential execution without stopping.
Description:
• Operation of the carriage return is identical to that of the multi-statement command.
• You can create a blank line in a program by inputting a carriage return only. Using a carriage
return in place of the multi-statement command makes the displayed program easier to read.
’ (Comment Text Delimiter)
Function: Indicates comment text inserted inside a program.
Description: Anything following the apostrophe is treated as non-executable comment text.

8/20/2019 _Casio_fx9860GSD_9860G_E
http://slidepdf.com/reader/full/casiofx9860gsd9860ge 404/595
20050401
k Program Commands (COM)
If~Then~(Else~)IfEnd
Function: The Then-statement is executed only when the If-condition is true
(non-zero). The Else-statement is executed when the If-condition is false (0). The IfEnd-
statement is always executed following either the Then-statement or Else-statement.
Syntax:
Parameters: condition, numeric expression
Description:
(1) If ~ Then ~ IfEnd
• When the condition is true, execution proceeds with the Then-statement and then
continues with the statement following IfEnd.
• When the condition is false, execution jumps to the statement following IfEnd.
(2) If ~ Then ~ Else ~ IfEnd
• When the condition is true, execution proceeds with the Then-statement and then jumpsto the statement following IfEnd.
• When the condition is false, execution jumps to the Else-statement and then continues
with the statement following IfEnd.
For~To~(Step~)Next
Function: This command repeats everything between the For-statement and the Next-
statement. The starting value is assigned to the control variable with the first execution, and
the value of the control variable is changed according to the step value with each execution.
Execution continues until the value of the control variable exceeds the ending value.
Syntax:
Parameters:
• control variable name: A to Z
• starting value: value or expression that produces a value (i.e. sin x , A, etc.)
• ending value: value or expression that produces a value (i.e. sin x , A, etc.)• step value: numeric value (default: 1)
8-5-4 Command Reference
If <condition>_
:
^
Then <statement>_
:
^
<statement>numeric expression
_
:^
E lse <statement>
_
:^
<statement>
_
:^
IfEnd
For <starting value> → <control variable name> To <ending value>
Step <step value> Next_
:^

8/20/2019 _Casio_fx9860GSD_9860G_E
http://slidepdf.com/reader/full/casiofx9860gsd9860ge 405/595
20050401
8-5-5 Command Reference
Description:
• The default step value is 1.
• Making the starting value less than the ending value and specifying a positive step valuecauses the control variable to be incremented with each execution. Making the starting
value greater than the ending value and specifying a negative step value causes the control
variable to be decremented with each execution.
Do~LpWhile
Function: This command repeats specific commands as long as its condition is true (non-
zero).
Syntax:
Parameters: expression
Description:
• This command repeats the commands contained in the loop as long as its condition is true
(non-zero). When the condition becomes false (0), execution proceeds from the statement
following the LpWhile-statement.
• Since the condition comes after the LpWhile-statement, the condition is tested (checked)after all of the commands inside the loop are executed.
_ _
Do : <statement> : LpWhile <condition>
^ ^ numeric expression

8/20/2019 _Casio_fx9860GSD_9860G_E
http://slidepdf.com/reader/full/casiofx9860gsd9860ge 406/595
20050401
8-5-6 Command Reference
While~WhileEnd
Function: This command repeats specific commands as long as its condition is true (non-
zero).Syntax:
Parameters: expression
Description:
• This command repeats the commands contained in the loop as long as its condition is true
(non-zero). When the condition becomes false (0), execution proceeds from the statement
following the WhileEnd-statement.
• Since the condition comes after the While-statement, the condition is tested (checked)
before the commands inside the loop are executed.
kkkkk Program Control Commands (CTL)
Break
Function: This command breaks execution of a loop and continues from the next command
following the loop.
Syntax: Break
Description:
• This command breaks execution of a loop and continues from the next command following
the loop.
• This command can be used to break execution of a For-statement, Do-statement, and
While-statement.
_
:
^
_
:
^
While <condition> <statement> WhileEndnumeric expression

8/20/2019 _Casio_fx9860GSD_9860G_E
http://slidepdf.com/reader/full/casiofx9860gsd9860ge 407/595
20050401
8-5-7 Command Reference
Prog
Function: This command specifies execution of another program as a subroutine. In the
RUN
•
MAT mode, this command executes a new program.Syntax: Prog ”file name”
Example: Prog ”ABC”
Description:
• Even when this command is located inside of a loop, its execution immediately breaks the
loop and launches the subroutine.
• This command can be used as many times as necessary inside of a main routine to call up
independent subroutines to perform specific tasks.
• A subroutine can be used in multiple locations in the same main routine, or it can be called
up by any number of main routines.
Main Routine Subroutines
D
C E I J
Prog ”E” Prog ”I” Prog ”J”
A
Prog ”D”
Prog ”C”
Level 1 Level 2 Level 3 Level 4
• Calling up a subroutine causes it to be executed from the beginning. After execution of the
subroutine is complete, execution returns to the main routine, continuing from the state-
ment following the Prog command.
• A Goto~Lbl command inside of a subroutine is valid inside of that subroutine only. It cannot
be used to jump to a label outside of the subroutine.
• If a subroutine with the file name specified by the Prog command does not exist, an error
occurs.
• In the RUN
• MAT mode, inputting the Prog command and pressingw launches the
program specified by the command.

8/20/2019 _Casio_fx9860GSD_9860G_E
http://slidepdf.com/reader/full/casiofx9860gsd9860ge 408/595
20050401
8-5-8 Command Reference
Return
Function: This command returns from a subroutine.
Syntax: ReturnDescription:
Execution of the Return command inside a main routine causes execution of the program to
stop. Execution of the Return command within a subroutine terminates the subroutine and
returns to the program from which the subroutine was jumped to.
Stop
Function: This command terminates execution of a program.
Syntax: Stop
Description:
• This command terminates program execution.
• Execution of this command inside of a loop terminates program execution without an error
being generated.

8/20/2019 _Casio_fx9860GSD_9860G_E
http://slidepdf.com/reader/full/casiofx9860gsd9860ge 409/595
20050401
8-5-9 Command Reference
k Jump Commands (JUMP)
Dsz
Function: This command is a count jump that decrements the value of a control variable by
1, and then jumps if the current value of the variable is zero.
Syntax:
Parameters: variable name: A to Z, r , θ
[Example] Dsz B : Decrements the value assigned to variable B by 1.
Description:
This command decrements the value of a control variable by 1, and then tests (checks) it. If
the current value is non-zero, execution continues with the next statement. If the current
value is zero, execution jumps to the statement following the multi-statement command (:),
display command (^), or carriage return (_).
Variable Value ≠ 0_
Dsz <variable name> : <statement> : <statement>
^Variable Value = 0

8/20/2019 _Casio_fx9860GSD_9860G_E
http://slidepdf.com/reader/full/casiofx9860gsd9860ge 410/595
20050401
8-5-10 Command Reference
Goto~Lbl
Function: This command performs an unconditional jump to a specified location.
Syntax: Goto <label name> ~ Lbl <label name>
Parameters: label name: value (0 to 9), variable (A to Z, r , θ )
Description:
• This command consists of two parts: Goto n (where n is a parameter as described above)
and Lbl n (where n is the parameter referenced by Goto n). This command causes program
execution to jump to the Lbl-statement whose n parameter matches that specified by the
Goto-statement.
• This command can be used to loop back to the beginning of a program or to jump to any
location within the program.
• This command can be used in combination with conditional jumps and count jumps.
• If there is no Lbl-statement whose value matches that specified by the Goto-statement, an
error occurs.

8/20/2019 _Casio_fx9860GSD_9860G_E
http://slidepdf.com/reader/full/casiofx9860gsd9860ge 411/595
20061001
Isz
Function: This command is a count jump that increments the value of a control variable by
1, and then jumps if the current value of the variable is zero.
Syntax:
Variable Value ≠ 0
Isz <variable name> : <statement>
_
:
^
<statement>
Variable Value = 0
Parameters: variable name: A to Z, r , θ
[Example] Isz A : Increments the value assigned to variable A by 1.
Description:
This command increments the value of a control variable by 1, and then tests (checks) it.
If the current value is non-zero, execution continues with the next statement. If the current
value is zero, execution jumps to the statement following the multi-statement command (:),
display command (^), or carriage return (_).
⇒ (Jump Code)
Function: This code is used to set up conditions for a conditional jump. The jump is executed
whenever the conditions are false.
Syntax: True
<left side> <relational operator> <right side> ⇒ <statement>
_
:
^
<statement>
False
Parameters:
left side/right side: variable (A to Z, r , θ ), numeric constant, variable expression
(such as: A × 2)
relational operator: =, ≠, >, <, ≥, ≤ (page 8-5-18)
Description:
• The conditional jump compares the contents of two variables or the results of two
expressions, and a decision is made whether or not to execute the jump based on the
results of the comparison.
• If the comparison returns a true result, execution continues with the statement following
the ⇒ command. If the comparison returns a false result, execution jumps to the
statements following the multi-statement command (:), display command (^), or carriage
return (_).
8-5-11
Command Reference
20070101

8/20/2019 _Casio_fx9860GSD_9860G_E
http://slidepdf.com/reader/full/casiofx9860gsd9860ge 412/595
20050401
8-5-12 Command Reference
kkkkk Clear Commands (CLR)
ClrGraph
Function: This command clears the graph screen and returns View Window settings to their
INIT values.
Syntax: ClrGraph
Description: This command clears the graph screen during program execution.
ClrList
Function: This command deletes list data.
Syntax: ClrList <list name>
ClrList
Parameters: list name: 1 to 26, Ans
Description: This command deletes the data in the list specified by “list name”. All list data is
deleted if nothing is specified for “list name”.
ClrMat
Function: This command deletes matrix data.
Syntax: ClrMat <matrix name>
ClrMat
Parameters: matrix name: A to Z, Ans
Description: This command deletes the data in the matrix specified by “matrix name”. All
matrix data is deleted if nothing is specified for “matrix name”.
ClrText
Function: This command clears the text screen.
Syntax: ClrText
Description: This command clears text from the screen during program execution.

8/20/2019 _Casio_fx9860GSD_9860G_E
http://slidepdf.com/reader/full/casiofx9860gsd9860ge 413/595
20050401
8-5-13 Command Reference
kkkkk Display Commands (DISP)
DispF-Tbl, DispR-Tbl No parameters
Function: These commands display numeric tables.
Description:
• These commands generate numeric tables during program execution in accordance with
conditions defined within the program.
• DispF-Tbl generates a function table, while DispR-Tbl generates a recursion table.
DrawDyna No parameters
Function: This command executes a Dynamic Graph draw operation.
Description: This command draws a Dynamic Graph during program execution in
accordance with current Dynamic Graph parameters.
DrawFTG-Con, DrawFTG-Plt No parameters
Function: This command uses values in a generated table to graph a function.
Description:
• This command draws a function graph in accordance with current conditions.
• DrawFTG-Con produces a connect type graph, while DrawFTG-Plt produces a plot type
graph.
DrawGraph No parameters
Function: This command draws a graph.
Description: This command draws a graph in accordance with current conditions.
DrawR-Con, DrawR-Plt No parameters
Function: These commands use values in a generated table to graph a recursion
expression with an(bn or cn) as the vertical axis and n as the horizontal axis.
Description:
• These commands graph recursion expressions in accordance with current conditions, with
an(bn or cn) as the vertical axis and n as the horizontal axis.
• DrawR-Con produces a connect type graph, while DrawR-Plt produces a plot type graph.

8/20/2019 _Casio_fx9860GSD_9860G_E
http://slidepdf.com/reader/full/casiofx9860gsd9860ge 414/595
20050401
8-5-14 Command Reference
DrawRΣ-Con, DrawRΣ-Plt No parameters
Function: These commands use values in a generated table to graph a recursion
expression withΣan(
Σbn or
Σcn) as the vertical axis and n as the horizontal axis.
Description:
• These commands graph recursion expressions in accordance with current conditions, with
Σan(Σbn or Σcn) as the vertical axis and n as the horizontal axis.
• DrawRΣ-Con produces a connect type graph, while DrawRΣ-Plt produces a plot type
graph.
DrawStat
Function: This draws a statistical graph.Syntax: See “Using Statistical Calculations and Graphs in a Program” on page 8-6-9.
Description:
This command draws a statistical graph in accordance with current statistical graph
conditions.
DrawWeb
Function: This command graphs convergence/divergence of a recursion expression (WEB
graph).
Syntax: DrawWeb <recursion type>, <number of lines>
Example: DrawWeb an+1 (bn+1 or cn+1), 5
Description:
• This command graphs convergence/divergence of a recursion expression (WEB graph).
• Omitting the number of lines specification automatically specifies the default value 30.

8/20/2019 _Casio_fx9860GSD_9860G_E
http://slidepdf.com/reader/full/casiofx9860gsd9860ge 415/595
20050401
8-5-15 Command Reference
k Input/Output Commands (I/O)
Getkey
Function: This command returns the code that corresponds to the last key pressed.
Syntax: Getkey
Description:
• This command returns the code that corresponds to the last key pressed.
• A value of zero is returned if no key was pressed previous to executing this command.
• This command can be used inside of a loop.
78 68 58 48
77 67 57 47
6474 54 44
6373 53 43 33
6272 52 42 32
6171 51 41 31
76 66 56 46
75 65 55 45
36
35
26
25
79 69 59 49 39 29
2838 27
37

8/20/2019 _Casio_fx9860GSD_9860G_E
http://slidepdf.com/reader/full/casiofx9860gsd9860ge 416/595
20050401
8-5-16 Command Reference
Locate
Function: This command displays alpha-numeric characters at a specific location on the text
screen.Syntax: Locate <column number>, <line number>, <value>
Locate <column number>, <line number>, <numeric expression>
Locate <column number>, <line number>, ”<string>”
[Example] Locate 1, 1, ”AB”_
Parameters:
• line number: number from 1 to 7
• column number: number from 1 to 21
• value and numeric expression
• string: character string
Description:
• This command displays values (including variable contents) or text at a specific location on
the text screen. If there is a calculation input, that calculation result is displayed.
• The line is designated by a value from 1 to 7, while the column is designated by a value
from 1 to 21.
(1, 1) → ← (21, 1)
(1, 7) → ← (21, 7)
Example: Cls_
Locate 7, 1, ”CASIO FX”
This program displays the text “CASIO FX” in the center of the screen.
• In some cases, the ClrText command should be executed before running the above program.

8/20/2019 _Casio_fx9860GSD_9860G_E
http://slidepdf.com/reader/full/casiofx9860gsd9860ge 417/595
20050401
8-5-17 Command Reference
Receive ( / Send (
Function: This command receives data from and sends data to a connected device.
Syntax: Receive (<data>) / Send (<data>)Description:
• This command receives data from and sends data to a connected device.
• The following types of data can be received (sent) by this command.
• Individual values assigned to variables
• Matrix data (all values - individual values cannot be specified)
• List data (all values - individual values cannot be specified)
OpenComport38k/CloseComport38k
Function: Opens and closes the 3-pin COM port (serial).
Description: See the Receive38k/Send38k command below.
Receive38k/Send38k
Function: Executes data send and receive at a data rate of 38 kbps.
Syntax: Send38k <expression>
Receive38k <variable name>
<list name>
Description:
• The OpenComport38k command must be executed before this command is executed.
• The CloseComport38k command must be executed after this command is executed.
• If this command is executed when the communication cable is not connected, program
execution will continue without generating an error.

8/20/2019 _Casio_fx9860GSD_9860G_E
http://slidepdf.com/reader/full/casiofx9860gsd9860ge 418/595
20050401
8-5-18 Command Reference
k Conditional Jump Relational Operators (REL)
=, ≠, >, <, ≥, ≤
Function: These relational operators are used in combination with the conditional jump
command.
Syntax:
Parameters:
left side/right side: variable (A to Z, r , θ ), numeric constant, variable expression (such as: A ×
2)relational operator: =, ≠, >, <, ≥, ≤
k Other
RclCapt
Function: Displayed the contents specified by the capture memory number.
Syntax: RclCapt <capture memory number> .... (capture memory number: 1 to 20)
<left side> <relational operator> <right side>

8/20/2019 _Casio_fx9860GSD_9860G_E
http://slidepdf.com/reader/full/casiofx9860gsd9860ge 419/595
20050401
8-6 Using Calculator Functions in Programs
k Text Display
You can include text in a program by simply enclosing it between double quotation marks.
Such text appears on the display during program execution, which means you can add
labels to input prompts and results.
Program Display
”CASIO” CASIO
? → X ?
”X =” ? → X X = ?
• If the text is followed by a calculation formula, be sure to insert a display command (^)
between the text and calculation.
• Inputting more than 21 characters causes the text to move down to the next line. The
screen scrolls automatically if the text exceeds 21 characters.
• You can specify up to 255 bytes of text for a comment.
k Using Matrix Row Operations in a ProgramThese commands let you manipulate the rows of a matrix in a program.
• For this program, enter the RUN • MAT mode and then use the Matrix Editor to input the
matrix, and then enter the PRGM mode to input the program.
u To swap the contents of two rows (Swap)
○ ○ ○ ○ ○
Example 1 To swap the values of Row 2 and Row 3 in the following matrix:
1 2Matrix A = 3 4
5 6
The following is the syntax to use for this program.
Swap A, 2, 3_
Mat A
Executing this program produces the following result.
8-6-1Using Calculator Functions in Programs
Rows to be swapped
Matrix name

8/20/2019 _Casio_fx9860GSD_9860G_E
http://slidepdf.com/reader/full/casiofx9860gsd9860ge 420/595
20050401
u To calculate a scalar multiplication (`Row)
○ ○ ○ ○ ○
Example 2 To calculate the product of Row 2 of the matrix in Example 1 and thescalar 4
The following is the syntax to use for this program.
`Row 4, A, 2_
Mat A
Executing this program produces the following result.
u To calculate a scalar multiplication and add the results to another row(`Row+)
○ ○ ○ ○ ○
Example 3 To calculate the product of Row 2 of the matrix in Example 1 and the
scalar 4, then add the result to row 3
The following is the syntax to use for this program.
`Row+ 4, A, 2, 3_
Mat A
Executing this program produces the following result.
8-6-2 Using Calculator Functions in Programs
Row
Matrix name
Multiplier
Matrix name
Multiplier
Rows to be added
Row for which scalar multiplication is to be calculated.

8/20/2019 _Casio_fx9860GSD_9860G_E
http://slidepdf.com/reader/full/casiofx9860gsd9860ge 421/595
20050401
u To add two rows (Row+)
○ ○ ○ ○ ○
Example 4 To add Row 2 to Row 3 of the matrix in Example 1
The following is the syntax to use for this program.
Row+ A, 2, 3_
Mat A
Executing this program produces the following result.
kkkkk Using Graph Functions in a Program
You can incorporate graph functions into a program to draw complex graphs and to overlay
graphs on top of each other. The following shows various types of syntax you need to use when
programming with graph functions.
• View Window
View Window –5, 5, 1, –5, 5, 1_
• Graph function input
Y = Type_ .................... Specifies graph type.
”X2 – 3” → Y1_
• Graph draw operation
DrawGraph_
Example Program
1 ClrGraph_ 1 !J612J
2
View Window –10, 10, 2, –120, 150, 50_ 2
!31J3 Y = Type_ 3 4431
”X^4–X^3–24X2 + 4X + 80” @ Y1_ 4 J41JJ4
5 G SelOn 1_ 5 4411J
6 BrokenThickG 1_ 6 43
7 DrawGraph 7 !J622
Executing this program produces the result
shown here.
8-6-3 Using Calculator Functions in Programs
Matrix name
the row number to be added to the row number to be added

8/20/2019 _Casio_fx9860GSD_9860G_E
http://slidepdf.com/reader/full/casiofx9860gsd9860ge 422/595
20061001
8-6-4 Using Calculator Functions in Programs
u Syntax of other graphing functions
• V-Window
View Window <Xmin>, <Xmax>, <Xscale>, <Ymin>, <Ymax>, <Yscale>,<Tθ min>, <Tθ max>, <Tθ pitch>
StoV-Win <area of V-Win> .............. area: 1 to 6
RclV-Win <area of V-Win> ............. area: 1 to 6
• Zoom
Factor <X factor>, <Y factor>
ZoomAuto ........... Non-parameter
• Pict
StoPict <area of picture> ................ area: 1 to 20numeric expression
RclPict <area of picture> ................ area: 1 to 20numeric expression
• Sketch
PlotOn <X-coordinate>, <Y-coordinate>
PlotOff <X-coordinate>, <Y-coordinate>
PlotChg <X-coordinate>, <Y-coordinate>
PxlOn <line number>, <column number>
PxlOff <line number>, <column number>
PxlChg <line number>, <column number>
PxlTest( <line number>, <column number>[)]
Text <line number>, <column number>, ”<text>”
Text <line number>, <column number>, <expression>
SketchThick <Sketch or Graph statement>
SketchBroken <Sketch or Graph statement>
SketchDot <Sketch or Graph statement>SketchNormal <Sketch or Graph statement>
Tangent <function>, <X-coordinate>
Normal <function>, <X-coordinate>
Inverse <function>
Line
F-Line <X-coordinate 1>, <Y-coordinate 1>, <X-coordinate 2>, <Y-coordinate 2>
Circle <center point X-coordinate>, <center point Y-coordinate>, <radius R value>
Vertical <X-coordinate>
Horizontal <Y-coordinate>
20070101

8/20/2019 _Casio_fx9860GSD_9860G_E
http://slidepdf.com/reader/full/casiofx9860gsd9860ge 423/595
20050401
kkkkk Using Dynamic Graph Functions in a Program
Using Dynamic Graph functions in a program makes it possible to perform repeated Dynamic
Graph operations. The following shows how to specify the Dynamic Graph range inside aprogram.
• Dynamic Graph range
1 → D Start_
5 → D End_
1 → D pitch_
Example Program
ClrGraph_
View Window –5, 5, 1, –5, 5, 1_
Y = Type_
”AX + 1” → Y1_ 1 J41JJ1
2 D SelOn 1_ 2 451
3 D Var A_ 3 3
1 → 4 D Start_ 4 J51
5 → 5 D End_ 5 2
1 → 6 D pitch_ 6 37 DrawDyna 7 !J623
Executing this program produces the result
shown here.
↑
↓
8-6-5 Using Calculator Functions in Programs

8/20/2019 _Casio_fx9860GSD_9860G_E
http://slidepdf.com/reader/full/casiofx9860gsd9860ge 424/595
20050401
kkkkk Using Table & Graph Functions in a Program
Table & Graph functions in a program can generate numeric tables and perform graphing
operations. The following shows various types of syntax you need to use when programmingwith Table & Graph functions.
• Table range setting
1 → F Start_
5 → F End_
1 → F pitch_
• Numeric table generation
DispF-Tbl_
• Graph draw operation
Connect type: DrawFTG-Con_
Plot type: DrawFTG-Plt_
Example Program
ClrGraph_
ClrText_
View Window 0, 6, 1, –20, 106, 10_
Y = Type_”3X2 – 2” → Y1_
1 T SelOn 1_ 1 4611
0 → 2 F Start_ 2 J611
6 → 3 F End_ 3 2
1 → 4 F pitch_ 4 3
5 DispF-Tbl 5 !J6241
6 DrawFTG-Con 6 !J6242
Executing this program produces the results shown here.
Numeric Table Graph
8-6-6 Using Calculator Functions in Programs

8/20/2019 _Casio_fx9860GSD_9860G_E
http://slidepdf.com/reader/full/casiofx9860gsd9860ge 425/595
20050401
kkkkk Using Recursion Table & Graph Functions in a Program
Incorporating Recursion Table & Graph functions in a program lets you generate numeric
tables and perform graphing operations. The following shows various types of syntax youneed to use when programming with Recursion Table & Graph functions.
• Recursion formula input
an+1 Type_ .... Specifies recursion type.
”3an + 2” → an+1_
”4bn + 6” → bn+1_
• Table range setting
1 → R Start_
5 → R End_
1 → a0_
2 → b0_
1 → an Start_
3 → bn Start_
• Numeric table generation
DispR-Tbl_
• Graph draw operation
Connect type: DrawR-Con_, DrawRΣ-Con_
Plot type: DrawR-Plt_, DrawRΣ-Plt_
• Statistical convergence/divergence graph (WEB graph)
DrawWeb an+1, 10_
8-6-7 Using Calculator Functions in Programs

8/20/2019 _Casio_fx9860GSD_9860G_E
http://slidepdf.com/reader/full/casiofx9860gsd9860ge 426/595
20050401
8-6-8 Using Calculator Functions in Programs
Example Program
View Window 0, 1, 1, –0.2, 1, 1_
1an+1 Type_
2 3”–3an2 + 3an” → an+1_
0 → R Start_
6 → R End_
0.01 → a0_
0.01 → an Start_
8 DispR-Tbl
09 DrawWeb an+1, 30
Executing this program produces the results shown here.
Numeric Table Recursion graph
kkkkk Using List Sort Functions in a Program
These functions let you sort data in lists into ascending or descending order.
• Ascending order1 2
SortA (List 1, List 2, List 3)
Lists to be sorted (up to six can be specified) 1 431 2 K11
• Descending order3
SortD (List 1, List 2, List 3)
Lists to be sorted (up to six can be specified)
3 432
4
5
6
1 46232J
2 423 34 J62215 26 37 66618 !J62519 !J6252JJJ0 46243
7

8/20/2019 _Casio_fx9860GSD_9860G_E
http://slidepdf.com/reader/full/casiofx9860gsd9860ge 427/595
20050401
kkkkk Using Solve Calculation Function in a Program
The following is the syntax for using the Solve function in a program.
Solve( f ( x ), n, a, b)
Upper limit
Lower limit
Initial estimated value
Example Program
1Solve( 2X2 + 7X – 9, 1, 0, 1) 1K41
• In the function f ( x ), only X can be used as a variable in the expression. Other variables (Athrough Z, r , θ ) are treated as constants, and the value currently assigned to that variable
is applied during the calculation.
• Input of the closing parenthesis, lower limit a and upper limit b can be omitted.
kkkkk Using Statistical Calculations and Graphs in a Program
Including statistical calculations and graphing operations in a program lets you calculate and
graph statistical data.
u To set conditions and draw a statistical graph
Following “StatGraph”, you must specify the following graph conditions:
• Graph draw/non-draw status (DrawOn/DrawOff)
• Graph Type
• x -axis data location (list name)
• y-axis data location (list name)
• Frequency data location (list name)
• Mark Type
8-6-9 Using Calculator Functions in Programs
# Solutions obtained using Solve may includeerrors.
# You cannot use a differential, quadraticdifferential, integration, Σ , maximum/minimum
value or Solve calculation expressions inside of a
Solve calculation term.

8/20/2019 _Casio_fx9860GSD_9860G_E
http://slidepdf.com/reader/full/casiofx9860gsd9860ge 428/595
20050401
The graph conditions that are required depends on the graph type. See “Changing Graph
Parameters” (page 6-1-2).
• The following is a typical graph condition specification for a scatter diagram or xyLine
graph.S-Gph1 DrawOn, Scatter, List 1, List 2, 1, Square _
In the case of an xy line graph, replace “Scatter” in the above specification with “ xyLine”.
• The following is a typical graph condition specification for a normal probability plot.
S-Gph1 DrawOn, NPPlot, List 1, Square _
• The following is a typical graph condition specification for a single-variable graph.
S-Gph1 DrawOn, Hist, List 1, List 2 _
The same format can be used for the following types of graphs, by simply replacing “Hist”in the above specification with the applicable graph type.
Histogram: .....................................Hist
Median Box: ...................................MedBox*1
Normal Distribution: ....................... N-Dist
Broken Line: .................................. Broken
• The following is a typical graph condition specification for a regression graph.
S-Gph1 DrawOn, Linear, List 1, List 2, List 3 _
The same format can be used for the following types of graphs, by simply replacing “Linear”in the above specification with the applicable graph type.
Linear Regression: ........................ Linear
Med-Med: ......................................Med-Med
Quadratic Regression: ...................Quad
Cubic Regression: .........................Cubic
Quartic Regression: ....................... Quart
Logarithmic Regression: ................. Log
Exponential Regression:................ ExpPower Regression: ........................ Power
8-6-10 Using Calculator Functions in Programs
*1Outliers:OnS-Gph1 DrawOn, MedBox, List 1, 1, 1
Outliers:Off
S-Gph1 DrawOn, MedBox, List 1, 1, 0

8/20/2019 _Casio_fx9860GSD_9860G_E
http://slidepdf.com/reader/full/casiofx9860gsd9860ge 429/595
20050401
• The following is a typical graph condition specification for a sinusoidal regression graph.
S-Gph1 DrawOn, Sinusoidal, List 1, List 2 _
• The following is a typical graph condition specification for a logistic regression graph.S-Gph1 DrawOn, Logistic, List 1, List 2 _
Example Program
ClrGraph_
1
S-Wind Auto_
{1, 2, 3} → List 1_
{1, 2, 3} → List 2_2 3 4 5
S-Gph1 DrawOn, Scatter, List 1, List 2, 1, Square _
6
DrawStat
Executing this program produces the scatter
diagram shown here.
k Performing Statistical Calculations
• Single-variable statistical calculation
11-Variable List 1, List 2
Frequency data (Frequency)
x -axis data (XList)
14161
8-6-11Using Calculator Functions in Programs
1!m6631
24121J
311J
424J
5J4141
6!J621

8/20/2019 _Casio_fx9860GSD_9860G_E
http://slidepdf.com/reader/full/casiofx9860gsd9860ge 430/595
20050401
• Paired-variable statistical calculation
12-Variable List 1, List 2, List 3
Frequency data (Frequency)
y-axis data (YList)
x -axis data (XList)
14162
• Regression statistical calculation
1
LinearReg List 1, List 2, List 3 Calculation Frequency data (Frequency) type*
y-axis data (YList)
x -axis data (XList)
141661
* Any one of the following can be specified as the calculation type.
LinearReg .......... linear regression
Med-MedLine .... Med-Med calculation
QuadReg ........... quadratic regression
CubicReg........... cubic regression
QuartReg ........... quartic regression
LogReg .............. logarithmic regression
ExpReg ............. exponential regression
PowerReg ......... power regression
8-6-12 Using Calculator Functions in Programs
• Sinusoidal regression statistical calculation
SinReg List 1, List 2
• Logistic regression statistical calculation
LogisticReg List 1, List 2
y-axis data (YList)
x -axis data (XList)
y-axis data (YList)
x -axis data (XList)
20050601

8/20/2019 _Casio_fx9860GSD_9860G_E
http://slidepdf.com/reader/full/casiofx9860gsd9860ge 431/595
20050401
8-7-1
PRGM Mode Command List
8-7 PRGM Mode Command List
Level 2
List
L→M
Dim
Fill
Seq
Min
Max
Mean
Med
AugSum
Prod
Cuml
%
A
Mat
M→L
Det
Trn
Aug
Iden
Dim
Fill
i
Abs
Arg
Conj
ReP
ImP
'r∠
'a+bi
Solve
d/dx
d2 /dx2
dxFMin
FMax
Σ(
logab
x
y
sinh
cosh
tanh
sinh-1
cosh-1
tanh-1
X!
nPr
nCr
Ran#
P(
Q(
R(
t(
Abs
Int
Frac
RndIntg
RndFi
r
g
’”Pol(
Rec(
'DMS
m
n
p
f
k
M
G
T
P
E
Sto
Rcl
fn
And
OrNot
Rcl
RUN Program
Level 1
STAT
MAT
LIST
GRPH
DYNA
TABL
RECR
Level 2
DRAW
GRPH
List
MARK
CALC
Swap
×Rw
×Rw+
Rw+
Srt-A
Srt-D
SEL
TYPE
STYL
GMEM
OnOff
Var
TYPE
On
Off
TYPE
STYL
SEL+S
TYPE
n.an··
RANG
Level 3
On
Off
GPH1
GPH2
GPH3
Scat
xy
Hist
Box
N-DisBrkn
X
Med
X^2
X^3
X^4
Log
Exp
Pwr
Sin
NPP
Lgst
•
1VAR
2VAR
X
Med
X^2
X^3
X^4
Log
ExpPwr
Sin
Lgst
On
Off
Y=
r=
Parm
X=c
Y>
Y<
Y≥
Y≤
—
—
·····
······
Sto
Rcl
Y=
r=
Parm
Y=
r=
Parm
—
—
·····
······
On
Off
—
—
·····
······
an
an+1
an+2
n
anan+1
bn
bn+1
cn
cn+1
a0
a1
Command
DrawOn
DrawOff
S-Gph1_
S-Gph2_
S-Gph3_
Scatter
xyLine
Hist
MedBox
N-DistBroken
Linear
Med-Med
Quad
Cubic
Quart
Log
Exp
Power
Sinusoidal
NPPlot
Logistic
List_
Square
Cross
Dot
1-Variable_
2-Variable_
LinearReg_
Med-MedLine_
QuadReg_
CubicReg_
QuartReg_
LogReg_
ExpReg_PowerReg_
SinReg_
LogisticReg_
Swap_
*Row_
*Row+_Row+_
SortA(
SortD(
G_SelOn_
G_SelOff_
Y=Type
r=Type
ParamType
X=cType
Y>Type
Y<Type
Y Type
Y Type
NormalG_
ThickG_
BrokenThickG_
DotG_
StoGMEM_
RclGMEM_
D_SelOn_D_SelOff_
D_Var_
Y=Type
r=Type
ParamType
T_SelOn_
T_SelOff_
Y=Type
r=Type
ParamType
NormalG_
ThickG_
BrokenThickG_
DotG_
R_SelOn_
R_SelOff_
NormalG_
ThickG_
BrokenThickG_
DotG_
anType
an+1Type
an+2Type
n
anan+1
bn
bn+1
cn
cn+1
Sel_a0
Sel_a1
[F4](MENU) key
Level 1
LIST
MAT
CPLX
CALC
STAT
HYP
PROB
NUM
ANGL
ESYM
PICT
FMEM
LOGIC
CAPT
Level 3 Command
List_
List→Mat(
Dim_
Fill(
Seq(
Min(
Max(
Mean(
Median(
Augment(Sum_
Prod_
Cuml_
Percent_
AList_
Mat_
Mat→List(
Det_
Trn_
Augment(
Identity_
Dim_
Fill(
i
Abs_
Arg_
Conjg_
ReP_
ImP_
'r∠
'a+bi
Solve(
d/dx(
d2 /dx2(
(FMin(
FMax(
Σ(
logab(
x
y
sinh_
cosh_
tanh_
sinh-1_
cosh-1_
tanh-1_
!
P
C
Ran#_
P(
Q(
R(
t(
Abs_
Int_
Frac_
RndIntg_
RndFix(
r
g
Pol(
Rec(
'DMS
m
n
p
f
k
M
G
T
P
E
StoPict_
RclPict_
fn
_And_
_Or_Not_
RclCapt_
∫ ∫
µ µ
[OPTN] key
θ θ

8/20/2019 _Casio_fx9860GSD_9860G_E
http://slidepdf.com/reader/full/casiofx9860gsd9860ge 432/595
20050401
Level 1
V-WIN
FACT
STAT
GRPH
DYNA
TABL
RECR
EQUA
TVM
Level 2
X
Y
T,
R-X
R-Y
R-T,
Xfct
Yfct
X
Y
GRPH
PTS
Y
r
Xt
Yt
X
Strt
End
Pitch
Strt
End
Pitch
Reslt
FORM
RANG
Reslt
S-Rlt
S-Cof
P-Rlt
P-Cof
n
I%
PV
PMT
FV
P/Y
C/Y
Level 3
min
max
scaldot
min
max
scal
min
max
ptch
min
max
scal
dot
min
max
scal
min
max
ptch
n
x
Σx
Σx2
xσn
xσn-1
minX
maxX
y
Σy
Σy2
Σxy
yσn
yσn-1
minY
maxY
a
b
c
d
e
r
r2
MSe
Q1
Med
Q3
Mod
Strt
Pitch
x1
y1
x2
y2
x3y3
an
an+1
an+2
bn
bn+1
bn+2
cn
cn+1
cn+2
Strt
End
a0
a1
a2
b0
b1
b2
c0
c1
c2
anSt
bnSt
cnSt
Command
Xmin
Xmax
XsclXdot
Ymin
Ymax
Yscl
T min
T max
T ptch
RightXmin
RightXmax
RightXscl
RightXdot
RightYmin
RightYmax
RightYscl
RightT min
RightT max
RightT ptch
Xfct
Yfct
n
x
Σx
Σx2
xσn
xσn-1
minX
maxX
y
Σy
Σy2
Σxy
yσn
yσn-1
minY
maxY
a
b
c
d
e
r
r2
MSe
Q1
Med
Q3
Mod
H_Start
H_pitch
x1
y1
x2
y2
x3
y3
Y
r
Xt
Yt
X
D_Start
D_End
D_pitch
F_Start
F_End
F_pitch
F_Result
an
an+1
an+2
bn
bn+1
bn+2
cn
cn+1
cn+2
R_Start
R_End
a0
a1
a2
b0
b1
b2
c0
c1
c2
anStart
bnStart
cnStart
R_Result
Sim_Result
Sim_Coef
Ply_Result
Ply_Coef
n
I%
PV
PMT
FV
P/Y
C/Y
[VARS] key
θ θ
θ
θ
θ θ
θ
θ
Level 1
ANGL
COOR
GRID
AXES
LABL
DISP
S/L
DRAW
DERV
BACK
FUNC
SIML
S-WIN
LIST
LOCS
T-VAR
Σ DSP
RESID
CPLX
FRAC
Y•SPD
Level 2
Deg
Rad
GraOn
Off
On
Off
On
Off
On
Off
Fix
Sci
Norm
ENG
—
—
·····
······
Con
Plot
On
Off
None
Pict
OnOff
On
Off
Auto
Man
File
On
Off
Rang
List
On
Off
None
List
Real
a+bi
r∠
d/c
ab/c
Norm
High
Level 3
On
Off
Eng
Command
Deg
Rad
GraCoordOn
CoordOff
GridOn
GridOff
AxesOn
AxesOff
LabelOn
LabelOff
Fix_
Sci_
Norm_
EngOn
EngOff
Eng
S-L-Normal
S-L-Thick
S-L-Broken
S-L-Dot
G-Connect
G-Plot
DerivOn
DerivOff
BG-None
BG-Pict_
FuncOnFuncOff
SimulOn
SimulOff
S-WindAuto
S-WindMan
File_
LocusOn
LocusOff
VarRange
VarList_
Σ dispOn
Σ dispOff
Resid-None
Resid-List_
Real
a+bi
r∠
d/c
ab/c
Y=DrawSpeedNorm
Y=DrawSpeedHigh
[SHIFT] [MENU] (SET UP) key
Level 1
COM
CTL
JUMP
?
^
CLR
DISP
REL
I/O
:
Level 2
If
Then
ElseI-End
For
To
Step
Next
Whle
WEnd
Do
Lp-W
Prog
Rtrn
Brk
Stop
Lbl
Goto
⇒
Isz
Dsz
Text
Grph
List
Mat
StatGrph
Dyna
F-Tbl
R-Tbl
=
≠
>
<
≥
≤
Lcte
Gtky
Send
Recv
S38k
R38k
Open
Close
Level 3
Tabl
G-Con
G-Plt
Tabl
Web
an-Cn
Σa-Cn
an-Pl
Σa-Pl
Command
If_
Then_
Else_IfEnd
For_
_To_
_Step_
Next
While_
WhileEnd
Do
LpWhile_
Prog_
Return
Break
Stop
Lbl_
Goto_
⇒
Isz_
Dsz_
?
^
ClrText
ClrGraph
ClrList_
ClrMat_
DrawStatDrawGraph
DrawDyna
DispF-Tbl
DrawFTG-Con
DrawFTG-Plt
DispR-Tbl
DrawWeb_
DrawR-Con
DrawR Σ-Con
DrawR-Plt
DrawR Σ -Plt
=
≠
>
<
Locate_
Getkey
Send(
Receive(
Send38k_
Receive38k_
OpenComport38k
CloseComport38k:
[SHIFT] [VARS] (PRGM) key
θ θ
8-7-2
PRGM Mode Command List

8/20/2019 _Casio_fx9860GSD_9860G_E
http://slidepdf.com/reader/full/casiofx9860gsd9860ge 433/595
20050401
Level 1
d~o
LOG
DISP
Level 2
d
h
b
o
Neg
Not
and
or
xor
xnor
'Dec
'Hex
'Bin
'
Oct
Level 3 Command
d
h
b
o
Neg_
Not_
and
or
xor
xnor
'Dec
'Hex
'Bin
'
Oct
Level 1
Dec
Hex
Bin
Oct
Level 2 Level 3
Command
Dec
Hex
Bin
Oct
[SHIFT][MENU](SET UP) key
BASE Program
[F4](MENU) key
Level 1
Prog
JUMP
?
^
REL
:
Level 2
Lbl
Goto
⇒
lsz
Dsz
=
≠
>
<
≥
≤
Level 3 Command
Prog_
Lbl_
Goto_
⇒
lsz_
Dsz_
?
^
=
≠
>
<
:
[SHIFT][VARS](PRGM) key
Level 1
ZOOM
V-WIN
SKTCH
Level 2
Fact
Auto
V-Win
Sto
Rcl
Cls
Tang
Norm
Inv
GRPH
PLOT
LINE
Crcl
Vert
Hztl
Text
PIXL
Test
STYL
Level 3
Y=
r=
Parm
X=c
G- dxY>
Y<
Y≥
Y≤
Plot
Pl-On
Pl-Off
Pl-Chg
Line
F-Line
On
Off
Chg
—
—
·····
······
Command
Factor_
ZoomAuto
ViewWindow_
StoV-Win_
RclV-Win_
Cls
Tangent_
Normal_
Inverse_
Graph_Y=
Graph_r=
Graph(X,Y)=(
Graph_X=
Graph_Graph_Y>
Graph_Y<
Graph_Y
Graph_Y
Plot_
PlotOn_
PlotOff_
PlotChg_
Line
F-Line_
Circle_
Vertical_
Horizontal_
Text_
PxlOn_
PxlOff_
PxlChg_
PxlTest(
SketchNormal_
SketchThick_
SketchBroken_
SketchDot_
[SHIFT] key
∫ ∫
8-7-3
PRGM Mode Command List

8/20/2019 _Casio_fx9860GSD_9860G_E
http://slidepdf.com/reader/full/casiofx9860gsd9860ge 434/595
20050401
8-8-1
Program Library
Description
This program continually divides a natural number by factors until all its prime factors are
produced.
Purpose
This program accepts input of natural number A, and divides it by B (2, 3, 5, 7....) to find the
prime factors of A.
• If a division operation does not produce a remainder, the result of the operation is
assigned to A.
• The above procedure is repeated until B > A.
○ ○ ○ ○ ○
Example
440730 = 2 × 3 × 3 × 5 × 59 × 83
Program Name Prime Factorization
8-8 Program Library
• Be sure to check how many bytes of unused memory are remaining before attempting to
perform any programming.

8/20/2019 _Casio_fx9860GSD_9860G_E
http://slidepdf.com/reader/full/casiofx9860gsd9860ge 435/595
20050401
8-8-2
Program Library
egcw
w
ww
w

8/20/2019 _Casio_fx9860GSD_9860G_E
http://slidepdf.com/reader/full/casiofx9860gsd9860ge 436/595

8/20/2019 _Casio_fx9860GSD_9860G_E
http://slidepdf.com/reader/full/casiofx9860gsd9860ge 437/595
20050401
8-8-4
Program Library
Example 1 Example 2
fw
baw
bf
w
fw
baw
ca
w

8/20/2019 _Casio_fx9860GSD_9860G_E
http://slidepdf.com/reader/full/casiofx9860gsd9860ge 438/595
20050401
8-8-5
Program Library
Description
This program displays a number table of the following values based on input of the foci of an
ellipse, the sum of the distance between the loci and foci, and the pitch (step size) of X.
Y1: Coordinate values of upper half of ellipse
Y2: Coordinate values of lower half of ellipse
Y3: Distances between right focus and loci
Y4: Distances between left focus and loci
Y5: Sum of Y3 and Y4
Next, the program plots the foci and values in Y1 and Y2.
Purpose
This program shows that the sums of the
distances between the loci and two foci of an
ellipse are equal.
Program Name Ellipse

8/20/2019 _Casio_fx9860GSD_9860G_E
http://slidepdf.com/reader/full/casiofx9860gsd9860ge 439/595
20050401
8-8-6
Program Library
wba
wb
w
w
d

8/20/2019 _Casio_fx9860GSD_9860G_E
http://slidepdf.com/reader/full/casiofx9860gsd9860ge 440/595
20050401
Description
This program draws an angle at the coordinate defined by an input vertex, and then rotates itto a specified angle around the vertex.
Purpose
This program demonstrates coordinate transformation using a matrix.
Important!
Deg must be set as the angle unit for this program.
Program Name Rotation
8-8-7
Program Library

8/20/2019 _Casio_fx9860GSD_9860G_E
http://slidepdf.com/reader/full/casiofx9860gsd9860ge 441/595
20061001
8-8-8
Program Library
dw fcde...
fcde... w
wfcde
... daw
wfcde...
w
20070101

8/20/2019 _Casio_fx9860GSD_9860G_E
http://slidepdf.com/reader/full/casiofx9860gsd9860ge 442/595
20050401
Description
This program calculates the interior angles and surface area of a triangle defined by input
coordinates for angles A, B, and C.
Purpose
This program calculates the interior angles and surface area of a triangle defined by
coordinates for angles A, B, and C.
Important!
Inputting the same coordinates for any two angles (A, B, C) causes an error.
Program Name Interior Angles and Surface Area of a Triangle
8-8-9
Program Library

8/20/2019 _Casio_fx9860GSD_9860G_E
http://slidepdf.com/reader/full/casiofx9860gsd9860ge 443/595
20050401
8-8-10
Program Library
b
awaw
bwaw
aw!x( )d
w

8/20/2019 _Casio_fx9860GSD_9860G_E
http://slidepdf.com/reader/full/casiofx9860gsd9860ge 444/595
20050401
9
Chapter
SpreadsheetThe Spreadsheet application provides you with powerful, take-along-anywhere spreadsheet capabilities.
9-1 Spreadsheet Overview
9-2 File Operations and Re-calculation
9-3 Basic Spreadsheet Screen Operations
9-4 Inputting and Editing Cell Data
9-5 S • SHT Mode Commands
9-6 Statistical Graphs
9-7 Using the CALC Function
9-8 Using Memory in the S • SHT Mode

8/20/2019 _Casio_fx9860GSD_9860G_E
http://slidepdf.com/reader/full/casiofx9860gsd9860ge 445/595
20050401
9-1 Spreadsheet Overview
This section describes the Spreadsheet application screen, and provides basic information
about its menus and commands.
kkkkkUsing the S • SHT Mode
On the Main Menu, select the S • SHT icon.
• This will enter the S • SHT mode and display a spreadsheet.
• The first time you enter the S • SHT mode, the calculator will automatically create a filenamed “SHEET” for the displayed spreadsheet.
kkkkk Spreadsheet Screen Configuration
A spreadsheet consists of a “cells” and their contents as shown below.
9-1-1Spreadsheet Overview
• Each cell can contain a value, expression, text, or a formula. Formulas can contain areference to a specific cell or a range of cells.
• Each cell has a unique name, consisting of its column letter and row number. The name ofthe cell where the cell cursor is located in the above example is “A1”.
File nameShows as many charactersas possible of the file name.
Edit boxShows the contents of the cell where thecell cursor is currently located. Whenmultiple cells are selected, the edit boxindicates the selected cell range.
Row numbers(1 to 999)
Column letters (A to Z)
Cell cursor
Function menu

8/20/2019 _Casio_fx9860GSD_9860G_E
http://slidepdf.com/reader/full/casiofx9860gsd9860ge 446/595
20050401
kkkkk S • SHT Mode Function Menu
• {FILE} … {displays the FILE submenu}
• {NEW} … {creates a new spreadsheet file}• {OPEN} … {displays a list of previously saved spreadsheet files}
You can select a file on this list and open it or delete it.
• {SV
•
AS} … {saves the displayed spreadsheet under a new name (Save As)}
• {RECAL} … {recalculates the formulas included in the displayed spreadsheet}
• {EDIT} … {displays the EDIT submenu}
• {CUT} / {PASTE} …1(CUT) specifies you want to cut the currently selected cell(s).
This causes the1 function key function to change to (PASTE), soyou can move the cell cursor to another location and press
1(PASTE) to paste the cells you cut. Performing the pasteoperation causes the original cells to be cleared.
• {COPY} …2(COPY) specifies you want to copy the currently selected cell(s). This
causes the1 function key function to change to (PASTE), so you canmove the cell cursor to another location and press1(PASTE) to paste thecells you copied. Performing the paste operation does not affect the original
cells.
• {CELL} … {recalls the contents of the currently selected cell (one only) for editing}
• {JUMP} … {displays a JUMP submenu}
• {GO} … {displays a dialog box for making the cell cursor jump to a particular cell}
• {TOP↑} … {causes the cell cursor to jump to line 1 of the column where the cell
cursor is located}
• {TOP←} … {causes the cell cursor to jump to column A of the line where the cellcursor is located}
• {BOT↓} … {causes the cell cursor to jump to last line of the column where the cell
cursor is located}
• {BOT→} … {causes the cell cursor to jump to column Z of the line where the cellcursor is located}
9-1-2 Spreadsheet Overview

8/20/2019 _Casio_fx9860GSD_9860G_E
http://slidepdf.com/reader/full/casiofx9860gsd9860ge 447/595
20050401
• {SEQ} … {generates a numeric sequence the same way as the “Seq(” command (page
3-2-3)}The sequence starts from a specified cell, and can be configured to proceedin a line-wise or column-wise direction. The direction is the one specified by
the “Move” setting on the Setup screen (page 1-7-5).
• {FILL} … {displays a screen for entering a formula, expression, value, or text, which isthen filled into the all of the currently selected cells}
• {SRT • A} … {sorts ascending (A, B, C...) the currently selected row or column of cells}
• {SRT • D} … {sorts descending (Z, Y, X...) the currently selected row or column of cells}
• {DEL} … {displays the DEL submenu}
• {ROW} … {deletes the entire row(s) of the currently selected cell(s), and shifts anythingbelow upwards}
• {COL} … {deletes the entire column(s) of the currently selected cell(s), and shiftsanything to the right leftwards}
• {ALL} … {deletes the contents of all of the cells in the currently displayed spreadsheet}
• {INS} … {displays the INS submenu}
• {ROW} … {inserts the same number of rows as the currently selected rows, above theselected rows}
• {COL} … {inserts the same number of columns as the currently selected columns, to theright of the selected columns}
• {CLR} … {clears the contents of the currently selected cell(s)}
• {GRPH} … {displays a graph menu that is identical to the one used in the STAT mode}{GPH1} / {GPH2} / {GPH3} / {SEL} / {SET}Some of the functions on the menu that appears when you press6(SET)
here are different from those that appear when you press6(SET) in theSTAT mode.
• {CALC} … {displays a CALC (statistical calculation) menu that is identical to the one used
in the STAT mode}{1VAR} / {2VAR} / {REG} / {SET}Some of the functions on the menu that appears when you press6(SET)
here are different from those that appear when you press6(SET) in theSTAT mode. See “9-7 Using the CALC Function” for more information.
9-1-3 Spreadsheet Overview

8/20/2019 _Casio_fx9860GSD_9860G_E
http://slidepdf.com/reader/full/casiofx9860gsd9860ge 448/595
20050401
• {STO} … {displays the STO submenu}
• {VAR} … {assigns the contents of a cell to a variable}
• {LIST} … {saves the contents of a range of cells as a list}
• {FILE} … {saves the contents of a range of cells as a file}
• {MAT} … {saves the contents of a range of cells as a matrix}
• {RCL} … {displays the RCL submenu}
• {LIST} … {imports data from a list into the spreadsheet}
• {FILE} … {imports data from a file into the spreadsheet}
• {MAT} … {imports data from a matrix into the spreadsheet}
uData Input Function Menu
• {GRAB} … {enters the Grab mode for inputting sell references}For details, see “To reference a particular cell” (page 9-4-6).
• {$} … {inputs the absolute reference command ($) into a cell}
• {:} … {inputs the cell range command (:) into a cell}
• {If} … {inputs the “CellIf(” S • SHT mode command}
• {CEL} … {displays a submenu for inputting the following S • SHT mode commands}“CellMin(”, “CellMax(”, “CellMean(”, “CellMedian(”, “CellSum(”, “CellProd(”
• {REL} … {displays a submenu for inputting the following relational operators}“=”, “≠”, “>”, “<”, “≥”, “≤”
9-1-4 Spreadsheet Overview
# For details about the S • SHT modecommands you can access with4(If) and
5(CEL), see “9-5 S • SHT Mode
Commands”.

8/20/2019 _Casio_fx9860GSD_9860G_E
http://slidepdf.com/reader/full/casiofx9860gsd9860ge 449/595
20050401
9-2-1File Operations and Re-calculation
9-2 File Operations and Re-calculation
This section explains the various operations you can perform with S • SHT mode files. It also
tells you how to re-calculate the formulas in a spreadsheet.
kkkkk Spreadsheet File Operations
u To create a new file
1. In the S • SHT mode, press1(FILE)1(NEW).
• This displays a dialog box for inputting a file
name.
2. Enter up to eight characters for the
Spreadsheet file name, and then pressw.
• This will display a blank spreadsheet.
# If the file name you enter in step 2 is the nameof a spreadsheet file already stored in
memory, the calculator will open that file
instead of creating a new one.

8/20/2019 _Casio_fx9860GSD_9860G_E
http://slidepdf.com/reader/full/casiofx9860gsd9860ge 450/595
20050401
9-2-2 File Operations and Re-calculation
u To open a file
1. In the S • SHT mode, press1(FILE)2(OPEN).
• This will display a list of existing spreadsheetfiles.
2. Usef andc to highlight the name of the file you want to open.
3. Pressw.
• This will open the spreadsheet you selected in step 2.
u To delete a file
1. In the S • SHT mode, press1(FILE)2(OPEN).
• This will display a list of existing spreadsheet files.
2. Usef andc to highlight the name of the file you want to delete.
3. Press1(DEL).
4. In response to the confirmation message that appears, press1(Yes) to delete the file,or6(No) to cancel the delete operation without doing anything.
5. To return to the spreadsheet from the file list, pressJ.
# If you delete the currently open file, the
calculator will automatically close its screen
and then automatically generate a new file named
“SHEET”, and display its blank spreadsheet.

8/20/2019 _Casio_fx9860GSD_9860G_E
http://slidepdf.com/reader/full/casiofx9860gsd9860ge 451/595
20050401
9-2-3 File Operations and Re-calculation
u To save a file under a new name (Save As)
1. In the S • SHT mode, press1(FILE)3(SV • AS).
• This will display a dialog box for entering a file name.2. Enter up to eight characters for the file name, and then pressw.
kkkkkAbout Auto Save
The S • SHT mode has an Auto Save feature that automatically saves any changes to make
to a spreadsheet file as you edit it. This means you do not need to perform any manual save
operation.
kkkkkRecalculating a Formula
Use the following procedure to recalculate the formulas in a spreadsheet.
u To re-execute all of the formulas in a spreadsheet
While the spreadsheet is on the display, press1(FILE)4(RECAL).
• This will re-execute all of the formulas and display the updated results in the applicable
cells.
# If a file already exists with the same file name
you input in step 2, a message will appear
asking if you want to replace the existing file
with the new one.
Press1(Yes) to replace the existing file with
the new one, or6(No) to return to the
spreadsheet without saving.
# Using Auto Calc
When “On” is selected for the “Auto Calc” setting
on the Setup screen (page 1-7-5), all of the
formulas in a spreadsheet are executed and cell
values are update automatically whenever the
spreadsheet file is opened, whenever the
spreadsheet is edited, etc. The initial default
setting for “Auto Calc” is “On”.
Formulas in a spreadsheet are not executed
automatically if “Off” is selected for “Auto Calc”.
In this case, you need to press1(FILE)
4(RECAL) to re-execute formulas and update
cell values when you want.# The expressions in all cells are re-calculated
when “Auto Calc” is “On”. This can cause the
calculation to take longer.
20050601

8/20/2019 _Casio_fx9860GSD_9860G_E
http://slidepdf.com/reader/full/casiofx9860gsd9860ge 452/595

8/20/2019 _Casio_fx9860GSD_9860G_E
http://slidepdf.com/reader/full/casiofx9860gsd9860ge 453/595
20050401
u To move the cell cursor using the JUMP command
To move the cell cursor toDo this:
here:A particular cell 1. Press2(EDIT)4(JUMP)1(GO).
2. On the “Go To Cell” dialog box that appears, enter the
name of the destination cell (A1 to Z999).3. Pressw.
Line 1 of current column Press2(EDIT)4(JUMP)2(TOP↑).
Column A of current line Press2(EDIT)4(JUMP)3(TOP←).
Bottom line of current column Press2(EDIT)4(JUMP)4(BOT↓).
Column Z of current line Press2(EDIT)4(JUMP)5(BOT→
).
uSpecifying Cell Cursor Movement when Inputting Cell Data
Under the initial default setup, the cell cursor moves down to the next line when you pressthew to finalize input into a spreadsheet cell. You can use the “Move” setting on the
Setup screen to change this to rightward movement if you want. For details, see “1-7 Usingthe Setup Screen”.
kkkkk Selecting Cells
Before performing any operation in a cell, you must first select it. You can select a single cell,a range of cells, all the cells in a row or column, or all of the cells in the spreadsheet.
u To select a single cell
Use the cursor keys or the JUMP command to move the cell cursor to the cell you want.
• See “Moving the Cell Cursor” (page 9-3-1) for more information.
# The EDIT function key menu will remain onthe display after the cell cursor jumps to the
destination cell. To return to page 1 of the
function menu, pressJ.
9-3-2 Basic Spreadsheet Screen Operations

8/20/2019 _Casio_fx9860GSD_9860G_E
http://slidepdf.com/reader/full/casiofx9860gsd9860ge 454/595
20050401
u To select an entire line
While the cell cursor is located in any cell of Column A, press thed key. This will selectthe entire line where the cell cursor is located.
If the cell cursor is located at cell A1, for example, pressingd will select all of line 1 (A1
to Z1). The edit box will show “A1:Z1”.
9-3-3 Basic Spreadsheet Screen Operations
u To select an entire column
While the cell cursor is located in any cell of Line 1, press thef key. This will select theentire column where the cell cursor is located.
If the cell cursor is located at cell A1, for example, pressingf will select all of column 1
(A1 to A999). The edit box will show “A1:A999”.
u To select all of the cells in a spreadsheet
Perform either of the following two operations.
• While all of the cells of Column A are selected, pressd.
• While all of the cells of Line 1 are selected, pressf.
When all cells are selected, the edit box will show the file name of the currently openspreadsheet.
• For this example, the file name of the spreadsheet is “SHEET”.

8/20/2019 _Casio_fx9860GSD_9860G_E
http://slidepdf.com/reader/full/casiofx9860gsd9860ge 455/595
20050401
u To select a range of cells
1. Move the cell cursor to the start cell of the rangeyou want to select.
2. Press!i(CLIP).
• This will cause the cell cursor to change fromhighlighting to a thick-line boundary.
• As you move the cell cursor, the edit box will show
the range of cells that are currently selected.
3. Use the cursor keys to move the cell cursor tothe end cell of the range you want to select.
Selected cells are highlighted.
• To cancel cell selection, pressJ. If you do, the cell cursor will be located at the endcell of the range you selected.
9-3-4 Basic Spreadsheet Screen Operations
# Pressing!i(CLIP) while an entire line isselected, that line will be the selection range
start point. You can use thef andc
cursor keys to select additional lines.
# Pressing!i(CLIP) while an entire columnis selected, that column will be the selection
range start point. You can use thed ande
cursor keys to select additional columns.

8/20/2019 _Casio_fx9860GSD_9860G_E
http://slidepdf.com/reader/full/casiofx9860gsd9860ge 456/595
20050401
9-4 Inputting and Editing Cell Data
This section explains how to input and edit formulas, text, and other spreadsheet cell data. It
covers how to copy, insert, and delete cells.Note that the S • SHT mode does not support complex number data.
kkkkkBasic Cell Data Input
You need to enter the edit mode in order to input data into a cell. There are two differentmethods you can use to enter the edit mode, and the method you should use depends onwhether you want to input new data or edit the cell’s existing data.
When you want to do this: Use this method:
Replace the cell’s current contents with Select the cell and then start inputting.your new input.
Retain the cell’s current contents to edit or Select the cell and then press2(EDIT)add to it. 3(CELL). Next, edit the cell contents as
desired.
9-4-1Inputting and Editing Cell Data
Normally, the contents of the cellwhere the cell cursor is located aredisplayed flush right in the edit box(input and editing disabled).
In the edit mode, the cell’s contentschange to flush left, to indicate thatinput and editing are enabled.
⇒

8/20/2019 _Casio_fx9860GSD_9860G_E
http://slidepdf.com/reader/full/casiofx9860gsd9860ge 457/595
20050401
u To replace a cell’s current contents with new input
1. Move the cell cursor to the cell where you want to input data.
2. Input the desired data.Use the calculator’s keys to input values, math expressions, or text, and the function
menus to input commands.
• The calculator enters the edit mode as soon as you start input, so your input appearsflush left in the edit box.
• The input cursor is located at the current
input position. You can move the inputcursor using the left and right cursor keys.
Input cursor
3. After everything is the way you want, pressw.
• Pressingw will cause the cell cursor to move to the next cell. You can specifymovement to the next line or to the next column using the “Move” setting on the Setupscreen (page 1-7-5).
• If “Auto Calc” is turned on (page 1-7-5), all of the formulas in the spreadsheet will be
re-calculated when you pressw.
• To cancel data input, pressJ. This will return the cell contents to what they were
before you started inputting data.
u To edit the current contents of a cell
1. Move the cell cursor to the cell where you want to edit data.
• This will display the contents of the cell,flush right, in the edit box.
9-4-2 Inputting and Editing Cell Data

8/20/2019 _Casio_fx9860GSD_9860G_E
http://slidepdf.com/reader/full/casiofx9860gsd9860ge 458/595
20050401
2. Press2(EDIT)3(CELL).
• This will enter the edit mode, which is indicated by
the cell contents in the edit box changing to flush
left. The input cursor also will appear to the left ofthe first character of the edit box.
3. Edit the data in the edit box.
4. After everything is the way you want, pressw.
• If “Auto Calc” is turned on (page 1-7-5), all of the formulas in the spreadsheet will bere-calculated when you pressw.
• To cancel data input, pressJ. This will return the cell contents to what they were
before you started editing them.
kkkkk Inputting a Formula
A formula is an expression that the S • SHT mode calculates and evaluates when you input it,
when data related to the formula is changed, etc.
A formula always starts with an equal sign (=), and can contain any one of the following.
• Values
• Mathematical expressions
• Cell references
• Calculator built-in function commands (page 2-4-1)
• S • SHT mode commands (page 9-5-1)
If “Auto Calc” is turned on (page 1-7-5), formulas are calculated dynamically wheneverrelated values are changed, and the latest result is always displayed in the spreadsheet.
The following shows a simple example where a formula in cell B5 calculates the average ofthe values in cells B1 through B3.
9-4-3 Inputting and Editing Cell Data

8/20/2019 _Casio_fx9860GSD_9860G_E
http://slidepdf.com/reader/full/casiofx9860gsd9860ge 459/595
20050401
u Formula Input Example
In this example, we will input the 60 into cell A1, and then input the following formulas intothe indicated cells: B1: =sin(A1), B2: =cos(A1), B3: =tan(A1), B4: =B1/B2
We will also show that the values produced by B3 and B4 are the same even if we changethe value of A1, so sin ( x ) ÷ cos ( x ) = tan ( x ) holds true.
Note • This example assumes that the calculator is configured as follows.
The “Move” setting on the Setup screen (page 1-7-5) is “Low” (initial default).The “Angle” setting on the Setup screen is “Deg”.
• This example also uses cell referencing. For more information about cell referencing, see
page 9-4-5.
u To input formulas
1. Move the cell cursor to cell A1, and then inputgaw.
2. Move the cell cursor to cell B1, and then input the following.
!.(=)sav(A)bw
• Pressingw will cause the cell cursor to move to cell B2.
3. Perform the following procedures to input the formulas for cells B2 through B4.
!.(=)cav(A)bw!.(=)tav(A)bw!.(=)al(B)b/al(B)cw
4. Move the cell cursor to cell A1, and then inputdaw.
• This will cause the updated values to appear in cells B1 through B4, based on re-
calculation using the new value you input in cell A1. Since the values produced by B3and B4 are the same even if we change the value of A1, sin ( x ) ÷ cos ( x ) = tan ( x )holds true.
9-4-4 Inputting and Editing Cell Data

8/20/2019 _Casio_fx9860GSD_9860G_E
http://slidepdf.com/reader/full/casiofx9860gsd9860ge 460/595
20050401
9-4-5 Inputting and Editing Cell Data
kkkkkUsing Cell References
A cell reference is a symbol that references the value of one cell for use by another cell. If
you input “=A1+B1” into cell C2, for example, the Spreadsheet will add the current value ofcell A1 to the current value of cell B1, and display the result in cell C2.
There are two types of cell references: relative and absolute. It is very important that youunderstand the difference between relative and absolute cell references. Otherwise, your
spreadsheet may not produce the results you expect.
Relative Cell References
A relative cell reference is one that changes according to its location on the spreadsheet.The cell reference “=A1” in cell C2, for example, is a reference to the cell located “two
columns to the left and one cell up” from the current cell (C2, in this case). If we copy the
contents of cell C2 and paste them into cell D12, for example, the cell reference willchange automatically to “=B11”, because B11 is two columns to the left and one cell up
from cell D12.Be sure to remember that relative cell references always change dynamically in this waywhenever you move them using copy and paste.
Important! When you copy a relative cell reference from the edit box, it is copied to the clipboard astext and pasted “as-is” without changing. If “=A1” is in cell C2 and you copy “=A1” from
the edit box and paste it into cell D12, for example, D12 will also be “=A1”.
Absolute Cell References
An absolute cell reference is the one that does not change, regardless of where it islocated or where it is copied to or moved to. You can make both the row and column of a
cell reference absolute, or you can make only the row or only the column of a cellreference absolute, as described below.
This cell reference: Does this:
$A$1 Always refers to column A, row 1
$A1 Always refers to column A, but the row changesdynamically when moved, as with a relative cell reference
A$1 Always refers to row 1, but the column changesdynamically when moved, as with a relative cell reference
Let’s say, for example, that a reference to cell A1 is in cell C1. The following shows whateach of the above cell references would become if the contents of cell C1 were copied tocell D12.
$A$1 → $A$1$A1 → $A12A$1 → B$1

8/20/2019 _Casio_fx9860GSD_9860G_E
http://slidepdf.com/reader/full/casiofx9860gsd9860ge 461/595
20050401
9-4-6 Inputting and Editing Cell Data
kkkkkReferencing a Particular Cell
The following procedure shows how to reference A1 (which contains the value 3) and
perform the calculation A1 × 2.
u To reference a particular cell
1. Move the cell cursor to cell A2, and then input
!.(=).
2. Press1(GRAB).
• This enters the Grab mode, which changes
the function menu to the function describedbelow. The Grab mode function menumakes it easier to move the cursor around
the spreadsheet.
To move the cell cursor to here: Press this key:
A specific cell 2(GO)
Line 1 of current column 3(TOP↑)
Column A of current line 4(TOP←)
Bottom line of current column 5(BOT↓)
Column Z of current line 6(BOT→)
3. Pressf to move the cell cursor to cell A1.
4. Press1(SET).
• This inputs the reference to cell A1.
# Instead of using the GRAB command(1(GRAB) in step 2), you could also type in
the necessary letter and number manually, if
you want. In place of steps 2 through 4 in the
above procedure, you could inputav(A)bto type “A1” if you want. For more information, see
“Formula Input Example” (page 9-4-4).

8/20/2019 _Casio_fx9860GSD_9860G_E
http://slidepdf.com/reader/full/casiofx9860gsd9860ge 462/595
20050401
9-4-7 Inputting and Editing Cell Data
5. Next, input*c.
6. Pressw to store the formula.
Result of A1 × 2
kkkkkReferencing a Range of Cells
You can reference a range of cells to obtain their sum, mean, etc.
The following procedure input a formula to determine the sum of cells A6 through B7, and
inputs the result in cell A4. This procedure assumes that cells A6 through B7 already containthe values shown below.
u To reference a range of cells
1. Move the cell cursor to cell A4, and then input!.(=).2. Perform the following key operation to input the sum command.
5(CEL)5(Sum)
• “CellSum(’’ is a S • SHT mode command. See “9-5 S • SHT Mode Commands” for
more information.3. PressJ1(GRAB).
• This enters the Grab mode.
4. Use the cursor keys to move the cell cursor to the
first cell of the range you want to select (A6 in this
example).
A B
6 1 2
7 3 4
20050901

8/20/2019 _Casio_fx9860GSD_9860G_E
http://slidepdf.com/reader/full/casiofx9860gsd9860ge 463/595
20050401
9-4-8 Inputting and Editing Cell Data
5. Press!i(CLIP).
• This will cause the cell cursor to change from
highlighting to a thick-line boundary.
6. Use the cursor keys to move the cell cursor to the
last cell of the range you want to select (B7 in this
example).
• You can use the function menu keys2 through6 for cell cursor movement.
Available functions are those described in step 2 under “To reference a particular cell”
(page 9-4-6).
7. To register the range of cells, press1(SET).
• This will input the cell range (A6:B7).
8. Pressw to store the formula.
# Instead of using the “CLIP” command
(!i(CLIP) in step 5) to select a range of
cells, you could also use the “GRAB”
command and the “:” command. To use this
method perform the following steps in place of
steps 3 through 7 in the above procedure.
3. Press1(GRAB) to enter the Grab
mode.
4. Move the cell cursor to the first cell of the range
(A6), and then press1(SET).
• This will exit the Grab mode and input a
reference to cell A6.
5. Press3(:).
6. Press1(GRAB) to re-enter the Grab mode.7. Move the cell cursor to the last cell of the range
(B7), and then press1(SET).
• This will input the cell range (A6:B7).
Indicates the sum of the values in cells A6 through B7.
20050901

8/20/2019 _Casio_fx9860GSD_9860G_E
http://slidepdf.com/reader/full/casiofx9860gsd9860ge 464/595
20050401
9-4-9 Inputting and Editing Cell Data
kkkkk Inputting the Absolute Reference Symbol ($)
You can input the absolute reference symbol at the current cursor position by pressing the
2($) key of the edit mode function menu. See “Absolute Cell References” (page 9-4-5) formore information.
u To input the absolute reference symbol
○ ○ ○ ○ ○
Example To input =$A$1 into cell C1
1. Move the cell cursor to cell C1, and then input!.(=).
2. Press2($).
3. Press1(GRAB) to enter the Grab mode, and move the cell cursor to cell A1.
4. Press1(SET).
5. Press thed key to move the cursor to the left of“1”.
6. Press2($).
7. To register the formula, pressw.

8/20/2019 _Casio_fx9860GSD_9860G_E
http://slidepdf.com/reader/full/casiofx9860gsd9860ge 465/595
20050401
9-4-10 Inputting and Editing Cell Data
kkkkk Inputting a Constant
An expression or value that you input without an equal (=) in front of it is called a “constant”,
because the value is not affected by anything outside of the cell where it is located.If you input a math expression as a constant, the cell shows its result. A “Syntax ERROR” willoccur if an expression uses an incomplete or illegal syntax, or if its result is a list or matrix.
The following table shows various types of constants and the results they display.
Constant Displayed Result
2005 2005
7+3 10
sin 30 0.5
sin X+1 *1 1.5
AX *1*2 60
dim {1,2,3} 3
1=0 0
1>0 1
sin Syntax ERROR
{1,2,3} Syntax ERROR
*1When 30 is assigned to variable X and 2 is
assigned to variable A. *2
A character string like AX is treated as a series ofvariables (page 2-2-1).
To have a character string treated as text, start it
with a quote mark (").

8/20/2019 _Casio_fx9860GSD_9860G_E
http://slidepdf.com/reader/full/casiofx9860gsd9860ge 466/595
20050401
9-4-11Inputting and Editing Cell Data
kkkkk Inputting Text
A text string starting with a quote mark (") is treated as text, and displayed as-is. The quote
mark (") is not displayed as part of the text.
kkkkkGenerating a Numeric Sequence in a Spreadsheet
The following shows how to generate a numeric sequence (same procedure as the Seqcommand on page 3-2-3) and input the result automatically into a series of cells, startingfrom the cell you specify.
u To generate a numeric sequence in a spreadsheet
○ ○ ○ ○ ○
Example To generate a numeric sequence starting from cell A1 using thefollowing parameters
Function: f ( x ) = X2
Variable: X
Starting Value: 1
Ending Value: 15
Increment: 7
1. Move the cell cursor to the cell from which you want the generated sequence to be
input.
2. Press2(EDIT)5(SEQ).
• This will display a dialog box like the one shownto the right.
This is the cell you selected in step 1.
You can input a total of 249 bytes into the Expr, Var, Start, End, and Incre items of the
Sequence dialog box.
Up to six characters can be displayed by the cell.
If the text cannot fit into a single cell, itextends into the next cell to the right,when the cell to the right is empty.

8/20/2019 _Casio_fx9860GSD_9860G_E
http://slidepdf.com/reader/full/casiofx9860gsd9860ge 467/595
20050401
9-4-12 Inputting and Editing Cell Data
3. Enter the required items to generate the sequence.
• The following describes the required input items.
Item Description
Expr Function f ( x ) for generating the sequence
Var Name of the variable in the function f ( x )Even if a function has only one variable, its name must be defined here.
Start The starting value (Start), ending value (End) and pitch (Incre) of the
values assigned to the variable specified by Var
Specifying Start: 1, End: 15, and Incre: 7, for example, will generate asequence by assigning the following values to the variable: 1, 8, 15.
• Use thef andc cursor keys to move between items, and input the required datafor each one. The following shows how the screen should appear after your input the
data required for this example.
4. After inputting data for all the items, press6(EXE) or thew key.
• This will cause the values of the generatedsequence to be input into the spreadsheetstarting from the cell you selected in step 1.
End
Incre
# If any cell that is within the range of cells
where sequence values are input alreadycontains data, the existing data is replaced
with the sequence values.
# Sequence values are input into cells either line-
wise or column-wise, depending on the “Move”setting on the Setup screen. The initial default
setting is line-wise (top to bottom). For details,
see “1-7 Using the Setup Screen”.

8/20/2019 _Casio_fx9860GSD_9860G_E
http://slidepdf.com/reader/full/casiofx9860gsd9860ge 468/595
20050401
kkkkk Filling a Range of Cells with the Same Content
You can use the following procedure to fill a range of cells with the same formula,
expression, value, or text.
u To fill a range of cells with the same content
○ ○ ○ ○ ○
Example To use the “FILL” command to fill cells A2 through B3 with the formula
= A1+1
The A1 cell name of the formula is a relative reference. This means theformula is = A1+1 in cell A2, = A2+1 in cell A3, etc.In this example, it is assumed that 1 is already input into cell A1, and 2 is
input into cell B1.
1. Select the range of cells from A2 through B3.
• See “To select a range of cells” (page 9-3-4) for more information.
2. Press2(EDIT)6(g)1(FILL).
• This displays the Fill dialog box.
This is the range of cells you selected in step 1.
3. While the “Formula” line is highlighted, enter the content you want to be filled into eachof the cells in the selected range.
• Here we will enter “=A1+1”.
9-4-13 Inputting and Editing Cell Data

8/20/2019 _Casio_fx9860GSD_9860G_E
http://slidepdf.com/reader/full/casiofx9860gsd9860ge 469/595

8/20/2019 _Casio_fx9860GSD_9860G_E
http://slidepdf.com/reader/full/casiofx9860gsd9860ge 470/595
20050401
9-4-15 Inputting and Editing Cell Data
kkkkkCut and Paste
You can use the procedures in this section to cut the data in one location of a spreadsheet
and paste in another location. You can cut the contents of a single cell or a range of cells.
uHow cut and paste affects cell references
The cut and paste operation has special rules that govern how cell references (page 9-4-5)
within the cells being cut and pasted are handled. There are actually two different sets ofrules to cover the following two conditions.
• When cells within the cut area are referencing cells that are outside the cut area
• When cells within the cut area are referencing cells that are also within the cut area
• When a cell within the cut area is referencing a cell that is outside the cut area
In this case all cell references are treated as absolute cell references, no matter whattype they actually are (absolute or relative).
○ ○ ○ ○ ○
Example Let’s say we have a spreadsheet that contains the following data:A1: 4, B1: =A1+1, C1: =B1+2.
Cut B1:C1 (left screen) and paste the data in B2:C2 (right screen).
Since the expression in cell B1 references cell A1, which is outside the cut
area (B1:C1), the A1 reference is pasted unchanged (like an absolute cellreference) into cell C2.
⇒

8/20/2019 _Casio_fx9860GSD_9860G_E
http://slidepdf.com/reader/full/casiofx9860gsd9860ge 471/595
20050401
• When a cell within the cut area is referencing a cell that also is within the cut area
In this case all cell references are treated as relative cell references, no matter what type
they actually are (absolute or relative).
○ ○ ○ ○ ○
Example Let’s say we have a spreadsheet that contains the following data:A1: 4, B1: =A1+1, C1: = $B$1+2.
Cut B1:C1 (left screen) and paste the data in B2:C2 (right screen).
Since the expression in cell C1 references cell B1, which is also inside thecut area (B1:C1), the $B$1 reference changes to $B$2 (like a relative cell
reference) when pasted into cell C2, even though it is an absolute cellreference.
u To cut and paste spreadsheet data
1. Select the cell(s) you want to cut.
• See “To select a single cell” (page 9-3-2) and “To select a range of cells” (page 9-3-4)for more information.
2. Press2(EDIT)1(CUT).
• This selects the data and enters the paste mode, which causes the1 function keymenu to change to (PASTE).
• You can exit the paste mode at any time during the following steps by pressingJ.
9-4-16 Inputting and Editing Cell Data
# For more information about absolute and
relative cell references, see “Using Cell
References” on page 9-4-5.
⇒

8/20/2019 _Casio_fx9860GSD_9860G_E
http://slidepdf.com/reader/full/casiofx9860gsd9860ge 472/595
20050401
3. Use the cursor keys to move the cell cursor to the cell from which you want to paste the
data.
• If you selected a range of cells in step 1, the cell you select with the cell cursor will be
the upper left cell of the paste range. If you cut the A1:B2 range of cells, locating thecell cursor at cell C1 will paste the cells at C1:D2.
4. Press1(PASTE).
• This will clear the data from the cell(s) you selected in step 1 and paste it at thelocation you selected in step 3.
kkkkkCopy and Paste
You can use the procedures in this section to copy the data in one location of a spreadsheet
and paste in another location. You can copy the contents of a single cell or of a range ofcells. Once you copy data, you can paste it multiple times in different locations.
u To copy and paste spreadsheet data
1. Select the cell(s) you want to copy.
• See “To select a single cell” (page 9-3-2) and “To select a range of cells” (page 9-3-4)
for more information.
2. Press2(EDIT)2(COPY).
• This selects the data and enters the paste mode, which causes the1 function keymenu to change to (PASTE).
• You can exit the paste mode at any time during the following steps by pressingJ.
9-4-17 Inputting and Editing Cell Data
# If any cell in the paste area already contains
data, the existing data is replaced by the
pasted data.
# If pasted data includes a formula, the formula
is always re-executed when you paste it. Thisis true regardless of whether the “Auto Calc”
feature on the Setup screen (page 1-7-5) is on
or off.
# If there are any relative cell references
contained in the data you are pasting, they are
handled in accordance with standard relative
cell reference rules. See “Relative Cell
References” (page 9-4-5) for more information.

8/20/2019 _Casio_fx9860GSD_9860G_E
http://slidepdf.com/reader/full/casiofx9860gsd9860ge 473/595
20050401
3. Use the cursor keys to move the cell cursor to the cell from which you want to paste the
data.
• If you selected a range of cells in step 1, the cell you select with the cell cursor will be
the upper left cell of the paste range. If you copy the A1:B2 range of cells, locating thecell cursor at cell C1 will paste the cells at C1:D2.
4. Press1(PASTE).
• This will paste the data in the cells you selected in step 1 at the location you selectedin step 3.
5. The calculator will remain in the paste mode, so you could repeat steps 3 and 4 topaste the same data at other locations, if you want.
6. After you are finish pasting the data where you want, pressJ to exit the paste mode.
9-4-18 Inputting and Editing Cell Data
# If any cell in the paste area already contains
data, the existing data is replaced by the
pasted data.
# If a copy and paste operation causes a
relative cell reference to become an illegal
reference, the illegal reference will be
replaced by “?” in the cell where it is pasted.Let’s say, for example, that you copy the
contents of cell A3 (=A1+A2) and paste it in
cell B2.
When the A1 relative cell reference in A3 (which
effectively means “two cells up”) is pasted into
cell B2, it becomes an illegal reference because
there is no cell located two cells up from cell B2.
This will cause the cell reference to change to
“B?” when it is pasted in cell B2, and “ERROR”
will be displayed in place of the cell B2 contents.
# If “On” is selected for the “Auto Calc” setting on
the Setup screen (page 1-7-5), “ERROR” will
appear as soon as the data is pasted. If “Auto
Calc” is turned off, the contents of the cell will
not be performed when they are pasted, so the
destination cell (B2) will display the same data
as the original source cell (A3) until the contents
of the spreadsheet are re-calculated and
updated.⇓

8/20/2019 _Casio_fx9860GSD_9860G_E
http://slidepdf.com/reader/full/casiofx9860gsd9860ge 474/595
20050401
kkkkk Sorting Spreadsheet Data
Spreadsheet data can be sorted column-wise or line-wise. You can select either ascending
sort or descending sort.Important! • Sorting can be performed only when the selected range of cells contains all constants.
u To sort spreadsheet data
1. Select the series of cells in a single row or a single column that you want to sort.
• See “To select a range of cells” (page 9-3-4) for more information.
2. Use the function menu to select the type of sort you want to perform.
Ascending:2(EDIT)6(g)2(SRT•A)Descending:2(EDIT)6(g)3(SRT•D)
• Selecting a sort type will sort the data.
kkkkkDeleting and Inserting Cells
You can delete an individual cell, or an entire line or column of cells. You can also insert aline or column of blank cells when you need to.
u To delete an entire line or column of cells
1. Select one or more cells inside the line(s) or column(s) you want to delete.
9-4-19 Inputting and Editing Cell Data
# Data sorting is supported only for a single line
or a single column of data. Attempting toperform a sort operation when multiple lines or
multiples columns are selected will cause a
“Range ERROR”.
# A “Syntax ERROR” will occur if the data you are
trying to sort contains a formula or text.
This cell selection can be used todelete lines 1 and 2 or columns Aand B.
You could also select the entire lineor column to be deleted.In this case, pressing3(DEL) instep 2 below will instantly delete theentire line or column, withoutdisplaying the DEL submenu.
2. Press3(DEL) to display the DEL submenu.

8/20/2019 _Casio_fx9860GSD_9860G_E
http://slidepdf.com/reader/full/casiofx9860gsd9860ge 475/595
20050401
3. Use the DEL submenu to perform the operation you want.
When you want to do this: Press this key:
Delete the entire row(s) of the currently selected cell(s), and shiftanything below upwards.
1(ROW)
Delete the entire column(s) of the currently selected cell(s), and
shift anything to the right leftwards.
2(COL)
• To exit the DEL submenu without deleting anything, pressJ instead of a function
key.
u To delete the contents of all the cells in a spreadsheet
1. Press3(DEL)3(ALL).
2. In response to the confirmation message that appears, press1(Yes) to delete the
data, or6(No) to cancel the delete operation without deleting anything.
• After deleting all data, the blank spreadsheet screen will appear with the cell cursor
located at cell A1.
9-4-20 Inputting and Editing Cell Data
⇒
⇒
20050601

8/20/2019 _Casio_fx9860GSD_9860G_E
http://slidepdf.com/reader/full/casiofx9860gsd9860ge 476/595
20050401
u To insert lines or columns of blank cells
1. Select one or more cells to specify how many lines or columns you want to insert.
• Selection rules are the same as those for line and column deletion. See step 1 under“To delete an entire line or column of cells” (page 9-4-19) for more information.
2. Press4(INS) to display the INS submenu.
3. Use the INS submenu to perform the operation you want.
When you want to do this: Press this key:
Insert the same number of rows as the currently selected rows,above the selected rows.
1(ROW)
Insert the same number of columns as the currently selected
columns, above the selected columns.
2(COL)
• To exit the INS submenu without inserting anything, pressJ instead of a functionkey.
• A Range ERROR occurs if a line or column insert operation causes the current cells
to exceed the range of A1:Z999.
kkkkkClearing Cell Contents
Perform the following procedure when you want to clear the contents of specific cells.
u To clear cell contents
1. Select the cell(s) whose contents you want to clear.
2. Press5(CLR).
• This will clear the contents of the currently selected cells.
9-4-21Inputting and Editing Cell Data
⇒
⇒

8/20/2019 _Casio_fx9860GSD_9860G_E
http://slidepdf.com/reader/full/casiofx9860gsd9860ge 477/595
20050401
9-5 S • SHT Mode Commands
This section explains how to use the S • SHT mode commands.
u To input a S • SHT mode command
1. Select the cells where you want to input the formula that contains the S • SHT mode
command.
2. Press2(EDIT)3(CELL) or!.(=) to enter the edit mode.
•2(EDIT)3(CELL) can be used if the selected cell already contains data.
3. Press the function menu key for the command you want to input.
To input this command: Press this key: For details:
CellIf( (Condition) 4(If) Page 9-5-2
CellMin( (Minimum of Cells) 5(CEL)1(Min) Page 9-5-2
CellMax( (Maximum of Cells) 5(CEL)2(Max) Page 9-5-3
CellMean( (Mean of Cells) 5(CEL)3(Mean) Page 9-5-3
CellMedian( (Median of Cells) 5(CEL)4(Med) Page 9-5-3
CellSum( (Sum of Cells) 5(CEL)5(Sum) Page 9-5-4
CellProd( (Product of Cells) 5(CEL)6(Prod) Page 9-5-4
4. Input the other parameters.
• The additional parameters you need to input depend on the command you are using.
For details, see “S • SHT Mode Command Reference” on page 9-5-2.
9-5-1S • SHT Mode Commands

8/20/2019 _Casio_fx9860GSD_9860G_E
http://slidepdf.com/reader/full/casiofx9860gsd9860ge 478/595
20050401
kkkkk S • SHT Mode Command Reference
This section provides details about the function and syntax of each command, as well as
practical examples of how to use them. Note that you can omit anything enclosed inbrackets ([ ]) in the Syntax of each command.
uuuuu CellIf(
Function: Returns expression 1 when the equation or inequality is true, and expression 2
when it is false.
Syntax: CellIf( equation, expression 1, expression 2 [ ) ]
CellIf( inequality, expression 1, expression 2 [ ) ]
Example: If the value in cell A1 is greater than the value in cell B1, input the value of cellA1 into cell A2. Otherwise, input the value of cell B1 into cell A2.
uuuuu CellMin(
Function: Returns the lowest value contained in the range of specified cells.
Syntax: CellMin( start cell : end cell [ ) ]
Example: To determine the lowest value in the block whose upper left corner is located at
A3 and whose lower right corner is located at C5, and input the result in cell A1:
9-5-2 S • SHT Mode Commands

8/20/2019 _Casio_fx9860GSD_9860G_E
http://slidepdf.com/reader/full/casiofx9860gsd9860ge 479/595
20050401
uuuuu CellMax(
Function: Returns the greatest value contained in the range of specified cells.
Syntax: CellMax( start cell : end cell [ ) ]Example: To determine the greatest value in the block whose upper left corner is located
at A3 and whose lower right corner is located at C5, and input the result in cell
A1:
uuuuu CellMean(
Function: Returns the mean of the values contained in the range of specified cells.
Syntax: CellMean( start cell : end cell [ ) ]
Example: To determine the mean of the values in the block whose upper left corner is
located at A3 and whose lower right corner is located at C5, and input the result
in cell A1:
uuuuu CellMedian(
Function: Returns the median of the values contained in the range of specified cells.
Syntax: CellMedian( start cell : end cell [ ) ]
Example: To determine the median of the values in the block whose upper left corner is
located at A3 and whose lower right corner is located at C5, and input the resultin cell A1:
9-5-3 S • SHT Mode Commands

8/20/2019 _Casio_fx9860GSD_9860G_E
http://slidepdf.com/reader/full/casiofx9860gsd9860ge 480/595
20050401
uuuuu CellSum(
Function: Returns the sum of the values contained in the range of specified cells.
Syntax: CellSum( start cell : end cell [ ) ]Example: To determine the sum of the values in the block whose upper left corner is
located at A3 and whose lower right corner is located at C5, and input the result
in cell A1:
uuuuu CellProd(
Function: Returns the product of the values contained in the range of specified cells.
Syntax: CellProd( start cell : end cell [ ) ]
Example: To determine the product of the values in cells B3 through B5, and input the
result in cell A1:
9-5-4 S • SHT Mode Commands

8/20/2019 _Casio_fx9860GSD_9860G_E
http://slidepdf.com/reader/full/casiofx9860gsd9860ge 481/595
20050401
9-6-1Statistical Graphs
9-6 Statistical Graphs
This section explains how to graph the data in a spreadsheet.
kkkkkOverview
Except for selection of the data to be graphed, the graph operations you can use in the
S • SHT mode are basically the same as those in the STAT mode. This section explains the
differences between the S • SHT mode graph functions and the STAT mode graph
functions.
kkkkkUsing the Graph MenuPress6(g)1(GRPH) to display the GRPH submenu.
The functions on the GRPH submenu are the same as those that appear when you press
1(GRPH) in the STAT mode List Editor. The following explains each function and where
you need to go to find out more for them.
Key Description Go here for more details:
1(GPH1)
2(GPH2)
3(GPH3)
4(SEL)
6(SET)
The functions of function menu keys1 through4 are basically the same as the STAT
mode function menu. Some of the functions on the menu that appears when you press
6(SET) here are different from those that appear when you press6(SET) in the STAT
mode. For details about the differences, see “Configuring Graph Parameter Settings” on
page 9-6-2.
Draws a graph in accordance with
StatGraph1 settings (see6(SET) below).
Draws a graph in accordance withStatGraph2 settings (see6(SET) below).
Draws a graph in accordance with
StatGraph3 settings (see6(SET) below).
Displays a screen for selecting the graph
parameter setup (StatGraph1, StatGraph2,
or StatGraph3). You can also use the screen
to specify simultaneous drawing of multiple
graphs.
Displays a screen for configuring graphparameter settings (data to be graphed,
graph type, etc.) The setting screen lets you
configure separate settings for StatGraph1,
StatGraph2, and StatGraph3.
"Changing Graph
Parameters" (page 6-1-2)
“Changing GraphParameters” (page 6-1-2)
“2. Graph draw/non-draw
status” (page 6-1-4)
“1. General graphsettings” (page 6-1-2)
“Configuring Graph
Parameter Settings” (page
9-6-2)

8/20/2019 _Casio_fx9860GSD_9860G_E
http://slidepdf.com/reader/full/casiofx9860gsd9860ge 482/595
20050401
9-6-2 Statistical Graphs
kkkkkConfiguring Graph Parameter Settings
Pressing6(SET) on the GRPH submenu displays a graph settings screen like the one
shown below.
In the STAT mode, you can graph data input with the List Editor. In the S • SHT mode, you
can graph the data input into the spreadsheet cells. Because of this, the purpose of S • SHT
mode graph settings is to select the range of cells that contain the data to be graphed. The
purpose of STAT mode settings, on the other hand, is to specify the number of the list (List 1through List 26) where the data to be graphed is located.
The following describes the Spreadsheet graph settings you can configure on the graph
settings screen.
uXCellRange (range x-axis data cells)
• {Cell} … {the specified cell range data corresponds to x -axis data}
uYCellRange (range y-axis data cells)
• {Cell} … {the specified cell range data corresponds to y-axis data}
u Frequency (number of times a value occurs)• {1} … {specifies 1 as the frequency of the values in the cell ranges specified by
XCellRange and YCellRange}
• {Cell} … {range of cells that specify the frequency for each cell specified by XCellRange
and YCellRange}
For example, if XCellRange = A3:A5, YCellRange = B3:B5, and Frequency =
C3:C5, the frequency of A3 and B3 will be the value in C3, the frequency of A4
and B4 will be C4, and so on.
For information on other settings, see “1. General graph settings” on page 6-1-2.

8/20/2019 _Casio_fx9860GSD_9860G_E
http://slidepdf.com/reader/full/casiofx9860gsd9860ge 483/595
20050401
9-6-3 Statistical Graphs
kkkkkGraphing Statistical Data
The following shows an actual example of how to graph statistical data in the S • SHT mode.
It also explains various methods you can use to specify the range of cells that contains thegraph data.
u To graph statistical data
○ ○ ○ ○ ○
Example: Input the following data into a spreadsheet, and then draw a scatter
diagram.
1. Input the statistical data into a spreadsheet.
• Here, we will input the above data into the
cell range A1:B5.
2. Select the cell ranges you want to graph.
• Here we will select the range A1:B5.
3. Press6(g)1(GRPH) to display the GRPH submenu.
4. Press6(SET).
• This displays the StatGraph1 settings screen.
The first column of cells you selected in step 2
will be displayed for XCellRange, while thesecond column will be displayed for YCellRange.
• You can change the XCellRange and YCellRange settings manually, if you want. For
details, see “Configuring Range Settings for Graph Data Cells” (page 9-6-5).
A 155B 165
Height
2325.5
C 180 27
D 185 28
E 170 25
Shoe Size

8/20/2019 _Casio_fx9860GSD_9860G_E
http://slidepdf.com/reader/full/casiofx9860gsd9860ge 484/595
20050401
9-6-4 Statistical Graphs
5. Configure the graph setup settings.
• For information about configuring the Graph Type and Mark Type settings, see
“1. General graph settings” on page 6-1-2, “6-2 Calculating and Graphing
Single-Variable Statistical Data”, and “6-3 Calculating and Graphing Paired-VariableStatistical Data”.
• For information about configuring the Frequency setting, see “Configuring the
Frequency Setting” (page 9-6-6).
6. After all of the settings are the way you want, pressJ to exit the graph settings
screen.
7. Press1(GPH1).
• This will draw a graph in accordance with
the StatGraph1 settings.

8/20/2019 _Casio_fx9860GSD_9860G_E
http://slidepdf.com/reader/full/casiofx9860gsd9860ge 485/595
20050401
9-6-5 Statistical Graphs
kkkkkConfiguring Range Settings for Graph Data Cells
The XCellRange and YCellRange settings on the graph settings screen are configured
automatically in accordance with the cells you select on the spreadsheet. You can use theprocedure below to change these settings manually, if you want.
Note that the automatic XCellRange and YCellRange settings always specify a series of
lines in a specific column. With manual settings, you can specify a series of lines in a specific
column, or a series of columns in a specific line.
u To change the XCellRange and YCellRange settings manually
1. Press6(SET) on the GRPH submenu to display the graph settings screen.
2. Use thef andc cursor keys to move the
highlighting to XCellRange.
3. Press1(CELL) or simply input something.
• Pressing1(CELL) will display the current XCellRange setting (A3:A5 in this
example) with an input cursor, so you can edit it.
• If you simply input something, the current cell range setting will be replaced by what
you input.
• The function menu will change to the colon (:).
4. Input or edit the cell range.
• To input the colon, press1(:).
5. After the XCellRange setting is the way you want, pressJc to move to the
YCellRange setting, and then perform steps 3 through 4 to configure its setting.
6. After all the settings are the way you want, pressJ.

8/20/2019 _Casio_fx9860GSD_9860G_E
http://slidepdf.com/reader/full/casiofx9860gsd9860ge 486/595
20050401
9-6-6 Statistical Graphs
kkkkkConfiguring the Frequency Setting
The frequency is a value that specifies how many times each of the statistical data items is
repeated. A value of 1 is the initial default for this setting. With this setting, each data item ( x )or data pair ( x , y) is represented as one point on the graph.
In cases where there is a large amount of data, however, plotting one point per data item ( x )
or data pair ( x , y) can cause the graph to become cluttered and difficult to read. If this
happens, you can specify a frequency value for each data item, which will reduce the
number of plots of very frequent data items and make the graph easier to read.
u To specify the frequency of each data item
1. Input the frequency values on the spreadsheet.
• For this example, input the frequency values forthe example data on page 9-6-3.
Frequency column (C)
2. Press6(SET) on the GRPH submenu to display the graph settings screen.
3. Use thef andc cursor keys to move the highlighting to Frequency.
4. Press2(CELL).
• This enables cell range input for the Frequency setting. The function menu will
change to the colon (:).
5. Input the range of the cells that specify the frequencies (C1:C5 in this example).
• To input the colon (:), press1(:).
6. After the setting is the way you want, pressJ.

8/20/2019 _Casio_fx9860GSD_9860G_E
http://slidepdf.com/reader/full/casiofx9860gsd9860ge 487/595
20050401
9-7-1Using the CALC Function
9-7 Using the CALC Function
This section explains how to use the CALC function to perform statistical calculations on
spreadsheet data.
kkkkkOverview
Except for selection of the data, the statistical calculation operations you can use in the
S • SHT mode are basically the same as those in the STAT mode. This section explains the
differences between the S • SHT mode statistical calculation functions and the STAT mode
statistical calculation functions.
uDisplaying the CALC Submenu
Press6(g)2(CALC) to display the CALC submenu.
The functions on the CALC submenu are the same as those that appear when you press
2(CALC) in the STAT mode List Editor. The following explains each function and where
you need to go to find out more for them.
Key Description Go here for more details:
1(1VAR)
2(2VAR)
3(REG)
6(SET)
The functions of function menu keys1 through3 are basically the same as the STAT
mode function menu. The settings you can configure with6(SET) are different from
those in the STAT mode.
Press to perform single-variable statistical
calculations.Press to perform paired-variable statistical
calculations.
Press to perform regression calculations.
Displays a screen for specifying data to be
used for the statistical calculations performed
by pressing1(1VAR),2(2VAR), and
3(REG).
“Single-Variable Statistical
Calculations” (page 6-4-2)“Paired-Variable Statistical
Calculations” (page 6-4-2)
“Regression Calculation”
(page 6-4-3)
“Configuring Statistical
Calculation Data Settings”
(page 9-7-2)

8/20/2019 _Casio_fx9860GSD_9860G_E
http://slidepdf.com/reader/full/casiofx9860gsd9860ge 488/595
20050401
9-7-2 Using the CALC Function
kkkkkConfiguring Statistical Calculation Data Settings
To execute a statistical calculation in the S • SHT mode, you need to input the data on the
spreadsheet and define the range of cells where the data is located as statistical calculationcells. To define statistical calculation cells, press6(SET) on the CALC submenu and
settings screen shown below.
The following explains the each of the items on this screen.
u 1Var XCell ( x-variable cell range for single-variable statistical calculations)
• {Cell} … {specifies the cell range of x -variable values for single-variable statistical
calculations}
u 1Var Freq (value frequency)
• {1} … {specifies 1 as the frequency of the values in the cell range specified 1Var XCell}
• {Cell} … {range of cells that specify the frequency for each cell specified by 1Var XCell}
u 2Var XCell ( x-variable cell range for paired-variable statistical calculations)
• {Cell} … {specifies the cell range of x -variable values for paired-variable statistical
calculations}
u 2Var YCell ( y-variable cell range for paired-variable statistical calculations)
• {Cell} … {specifies the cell range of y-variable values for paired-variable statistical
calculations}
u 2Var Freq (value frequency)
• {1} … {specifies 1 as the frequency of the values in the cell range specified 2Var XCell
and 2Var YCell}
• {Cell} … {range of cells that specify the frequency for each cell specified by 2Var XCell
and 2Var YCell}

8/20/2019 _Casio_fx9860GSD_9860G_E
http://slidepdf.com/reader/full/casiofx9860gsd9860ge 489/595
20050401
9-7-3 Using the CALC Function
kkkkk Executing a Statistical Calculation
The following shows an actual example of how to perform a statistical calculation in the
S • SHT mode.
u To execute a statistical calculation
○ ○ ○ ○ ○
Example To input the data shown below into a spreadsheet, and then to perform
paired-variable statistical calculations and regression calculations
1. Input the statistical data into a spreadsheet.
• Here, we will input data in the A1:B5 range, and the frequency values in the C1:C5
range.
2. Select the range of cells where you input the data (A1:B5).
3. Press6(g)2(CALC) to display the CALC submenu.4. Press6(SET) to display the statistical calculation settings screen.
• The first column of cells you selected in step 2 will be displayed for 1Var XCell, while
the second column will be displayed for 2Var YCell.
• You can change the cell ranges manually using the same procedures as those for the
graphing cell range settings. See “To change the XCellRange and YCellRange
settings manually” (page 9-6-5) for more information.
5. Use thef andc cursor keys to move the highlighting to 2Var Freq.
6. Press2(CELL).
• This enables cell range input for the Frequency setting. The function menu willchange to the colon (:).
7. Input the range of cells for the frequency values (C1:C5).
• To input the colon (:), press1(:).
8. After the settings are the way you want, pressw.
A 155
B 165
Height
23
25.5C 180 27
D 185 28
E 170 25
Shoe Size
1
22
1
3
Frequency

8/20/2019 _Casio_fx9860GSD_9860G_E
http://slidepdf.com/reader/full/casiofx9860gsd9860ge 490/595
20050401
9-7-4 Using the CALC Function
9. PressJ2(2VAR).
• This will display the paired-variable statistical
calculation result list. You can use the up and
down cursor keys to scroll the result screen.
• For information about the meaning of each of the values on the result screen, see
“Displaying the Calculation Results of a Drawn Paired-Variable Graph” on page
6-3-11.
10. PressJ3(REG)1(X).
• This will display the linear regression coefficients
for the original data.
• For information about the meaning of each of the coefficient values on this screen,
see “Linear Regression Graph” on page 6-3-6.
11. PressJ to return to the spreadsheet screen.

8/20/2019 _Casio_fx9860GSD_9860G_E
http://slidepdf.com/reader/full/casiofx9860gsd9860ge 491/595
20050401
9-8-1Using Memory in the S • SHT Mode
9-8 Using Memory in the S • SHT Mode
This section explains how to save spreadsheet data to memory, and how to import memory
data into a spreadsheet.
kkkkk Saving Spreadsheet Data
You can assign spreadsheet data to a variable, or save it to List Memory, File Memory, or
Mat Memory.
kkkkkAssigning Spreadsheet Data to a Variable
You can use the following procedure to assign the contents of a single cell to a variable (A to
Z, r , or θ ).
u To assign the contents of a cell to a variable
1. Move the cell cursor to the cell whose data you want to assign to a variable.
2. Press6(g)3(STO)1(VAR).
• The “Cell” setting will show the name of the cell
you selected in step 1.
3. Pressc to move the highlighting to “Var Name”.
4. Input the variable name (A to Z, r , or θ ), and then pressw.
5. Press6(EXE) or thew key to assign the data to the variable.
• If the variable you select already has data assigned to it, the new data will replace the
existing data.
# With all types of memory, saving a cell thatincludes a formula will save the calculation
result.
# If the cell you select is empty, contains text, orhas ERROR displayed for it, an error will occur
when you perform step 5 of the above
procedure.

8/20/2019 _Casio_fx9860GSD_9860G_E
http://slidepdf.com/reader/full/casiofx9860gsd9860ge 492/595
20050401
9-8-2 Using Memory in the S • SHT Mode
kkkkk Saving Spreadsheet Data to List Memory
You can use the following procedure to select a series of cells in a particular column or row
and save their data to List Memory (List 1 through List 26).
u To save the contents of a range of cells to List Memory
1. Select the range of cells whose data you want to save in List Memory.
• You can select a series of cells in a column or a series of cells in a line. Selecting any
other configuration of cells will cause an error.
2. Press6(g)3(STO)2(LIST).
• The “Cell Range” setting will show the range of
cells you selected in step 1.
3. Pressc to move the highlighting to “List [1~26]”.
4. Enter a list number in the range of 1 to 26, and then pressw.
5. Press6(EXE) or thew key to save the data in the List Memory.
• If the List Memory you select already has data assigned to it, the new data will replace
the existing data.
kkkkk Saving Spreadsheet Data to File Memory
You can use the following procedure to select a range of cells and save their data to FileMemory (File 1 through File 6). Data is saved sequentially from left to right, line by line, and
each column is saved as a File Memory list (List 1 through List 26).
The following shows how spreadsheet data in the range of A1:C3 is saved to File 6.
# The value in any cell that is empty, containstext, or has ERROR displayed is changed to 0
when you perform step 5 of the above
procedure.
⇒
Spreadsheet File Memory
File6
List2 List3List1
2 31
5 64
8 97

8/20/2019 _Casio_fx9860GSD_9860G_E
http://slidepdf.com/reader/full/casiofx9860gsd9860ge 493/595
20061001
9-8-3 Using Memory in the S • SHT Mode
u To save the contents of a range of cells to File Memory
1. Select the range of cells whose data you want to save in File Memory.
2. Press6(g)3(STO)3(FILE).• The “Cell Range” setting will show the range of cells
you selected in step 1.
3. Pressc to move the highlighting to “File [1~6]”.
4. Enter a file number in the range of 1 to 6, and then pressw.
5. Press6(EXE) or thew key to save the data in the File Memory.
• If the File Memory you select already has data assigned to it, the new data will replace
the existing data.
k Saving Spreadsheet Data to Mat Memory
You can use the following procedure to save the contents of a range of cells to Mat Memory
(A to Z).
u To save the contents of a range of cells to Mat Memory
1. Select the range of cells whose data you want to save in Mat Memory.
2. Press6(g)3(STO)4(MAT).
• The “Cell Range” setting will show the range of cellsyou selected in step 1.
3. Pressc to move the highlighting to “Mat Name”.
4. Input the Mat Memory name (A to Z) where you want to save the data.
5. Press6(EXE) or thew key to save the data in the Mat Memory.
• If the Mat Memory you select already has data assigned to it, the new data will
replace the existing data.
# The value in any cell that is empty, contains
text, or has ERROR displayed is changed
to 0 when you perform step 5 of the above
procedure.
20070101

8/20/2019 _Casio_fx9860GSD_9860G_E
http://slidepdf.com/reader/full/casiofx9860gsd9860ge 494/595
20050401
kkkkkRecalling Data from Memory
The procedures in this section explain how to recall data from List Memory, File Memory, and
Mat Memory, and input it into a spreadsheet starting from a specific cell. It also explains howto use variables in spreadsheet constants and formulas.
Note
When recalling List Memory, File Memory, or Mat Memory data, an error will occur if the
recalled data runs outside the allowable range of the spreadsheet (A1:Z999).
Recalling a 2-line by 4-column matrix from Mat Memory starting from spreadsheet cell X2,
for example, will cause the matrix to run outside the range of the spreadsheet as shown
below, which will cause an error.
The above also applies when pasting data into a spreadsheet.
kkkkkRecalling Data from List Memory
Use the procedure in this section to select a List Memory (List 1 through List 26) and input it
into a spreadsheet. The data is input into the spreadsheet either line-wise or column-wise,depending on the current “Move” setting on the Setup screen.
Note
The initial default “Move” setting is line-wise (top to bottom) data input. If you want to perform
column-wise (left to right) input, change the “Move” setting. For details, see “1-7 Using the
Setup Screen”.
u To recall data from a List Memory to a spreadsheet
1. On the spreadsheet, select the first cell of the range where you want the recalled data
to be input.
2. Press6(g)4(RCL)1(LIST) to display a data recall screen like the one shown
below.
• The “1st Cell” setting will show the name of the
cell you selected in step 1.
3. Input the List number (1 to 26) of the List Memory whose data you want to recall, and
then pressw.
4. Press6(EXE) or thew key to recall the data.
9-8-4 Using Memory in the S • SHT Mode
Area required by the matrix(shaded) runs off thespreadsheet, so an erroroccurs.

8/20/2019 _Casio_fx9860GSD_9860G_E
http://slidepdf.com/reader/full/casiofx9860gsd9860ge 495/595
20050401
u To recall data from a File Memory to a spreadsheet
1. On the spreadsheet, select the upper left cell of the range where you want the recalled
data to be input.
2. Press6(g)4(RCL)2(FILE) to display a data recall screen like the one shown
below.
• The “1st Cell” setting will show the name of the
cell you selected in step 1.
3. Input the File number (1 to 6) of the File Memory whose data you want to recall, and
then pressw.
4. Press6(EXE) or thew key to recall the data.
u To recall data from a Mat Memory to a spreadsheet
1. On the spreadsheet, select the upper left cell of the range where you want the recalled
data to be input.
2. Press6(g)4(RCL)3(MAT) to display a data recall screen like the one shown
below.
• The “1st Cell” setting will show the name of the
cell you selected in step 1.
3. Input the name (A to Z) of the Mat Memory whose data you want to recall, and then
pressw.
4. Press6(EXE) or thew key to recall the data.
u To use a variable in a spreadsheet
You can include variable names (A to Z) in constants or formulas you input into
spreadsheet cells. When you do, the value currently assigned to the applicable variable to
be recalled.
If 1 is assigned to variable A and 2 is assigned to variable B, for example, inputting =A+B
into cell A1 will cause 3 to be displayed for cell A1.
9-8-5 Using Memory in the S • SHT Mode

8/20/2019 _Casio_fx9860GSD_9860G_E
http://slidepdf.com/reader/full/casiofx9860gsd9860ge 496/595
20050401
eActivityAn eActivity is both a documentation tool and a student notebook.
As a documentation tool, a teacher can create electronic examples
and practice problems with accompanying text, mathematicalexpressions, graphs, and tables.
eActivities also provide the student the means to explore problems,
document their learning and problem solving by entering notes, and
share their learning by saving their work to a file.
10-1 eActivity Overview
10-2 Working with eActivity Files
10-3 Inputting and Editing eActivity File Data
10-4 Using Matrix Editor and List Editor
10-5 eActivity File Memory Usage Screen
Chapter
10

8/20/2019 _Casio_fx9860GSD_9860G_E
http://slidepdf.com/reader/full/casiofx9860gsd9860ge 497/595
20050401
10-1 eActivity Overview
eActivity lets you input and edit text, mathematical expressions, and application data, and
save your input in a file called an “eActivity”.
kkkkkUsing the e • ACT Mode
On the Main Menu, select the e • ACT icon.
• This displays a file list screen like the ones shown below.
kkkkk File List Function Menu
The following describes the functions of the file list function menu.
• {OPEN} ... {opens the eActivity file or folder that is currently selected on the file list}
• {NEW} ... {creates a new eActivity file}
• {DEL} ... {deletes the eActivity file that is currently selected on the file list}
• {SRC} ... {starts a file search operation}
• {SD} / {SMEM} ... {changes the memory area} (fx-9860G SD only)
When the file list currently shows Storage Memory contents, the menu
for this function key is “SD” (for switching to SD card contents). When
SD card contents are displayed, the function key menu is “SMEM” (for
switching to Storage Memory contents).
10-1-1eActivity Overview
When there are no files stored
in the e • ACT mode
When there are files stored in
the e • ACT mode
# When there are no eActivity files, only the2(NEW) and6(SD/SMEM) function keys
are displayed.
# 128 Kbytes or more of free storage memory isrequired to enter the e • ACT mode the first time.
A Memory ERROR will occur if there is not
enough free memory available.
20050601

8/20/2019 _Casio_fx9860GSD_9860G_E
http://slidepdf.com/reader/full/casiofx9860gsd9860ge 498/595
20050401
kkkkkWorkspace Screen Function Menu
Opening an eActivity file displays a workspace screen that shows the current contents of the
eActivity.
The sample below shows the parts that make up the eActivity workspace. Note that not all of
the eActivity can be displayed in a single screen. The heavy line in the example shows what
is currently on the display, while the lighter line shows the part of the eActivity that is not
displayed. You can view all of the parts of the eActivity by scrolling the screen contents
upwards and downwards.
You can use the workspace screen in insert text, formulas, application data strips, and other
data into an eActivity.
10-1-2 eActivity Overview
The content of the workspace function menu depends on the line (or strip) that is currently
selected.
Stop line
Text lines
Math lines
Strip

8/20/2019 _Casio_fx9860GSD_9860G_E
http://slidepdf.com/reader/full/casiofx9860gsd9860ge 499/595
20050401
kkkkk Text Line Function Menu
• {FILE} … {displays the FILE submenu}
• {SAVE} … {saves the file you are editing, overwriting the previous (unedited) version}• {SV • AS} … {saves the file you are editing under a new name (Save As)}
• {OPT} … {performs Storage Memory or SD card garbage collection}
For more information, see “Optimizing the Storage Memory or SD Card
Memory” (page 12-7-17).
• {CAPA} … {displays the size of the currently open eActivity file and how much memory
is available for use by the current file}
• {STRP} … {inserts a strip}
• {TEXT} … {changes the current line from a text line to a math line}
• {CHAR} … {displays a screen for selecting various mathematical symbols, specialsymbols, and accented characters}
• {A↔a} … {toggles between upper-case and lower-case input}
This function is available only during alpha input (page 1-1-3)
• {JUMP} … {displays the JUMP submenu}
• {TOP} … {moves the cursor to the top of the file}
• {BTM} … {moves the cursor to the bottom of the file}
• {DEL • L} … {deletes the line that is currently selected or where the cursor is located}
• {INS} … {displays an insert submenu for inserting a new line above the line that is
currently selected or where the cursor is located}
• {TEXT} … {inserts a text line}
• {CALC} … {inserts a math line}
• {STOP} … {inserts a stop line}
• {MATH} … {displays a MATH menu for natural input of matrices and mathematical
functions}
For more information, see “Using the MATH Menu” (page 1-3-10).
• {'MAT} … {displays the Matrix Editor (page 2-8-2)}
• {'LIST} … {displays the List Editor (page 6-1-1)}
10-1-3 eActivity Overview

8/20/2019 _Casio_fx9860GSD_9860G_E
http://slidepdf.com/reader/full/casiofx9860gsd9860ge 500/595
20050401
kkkkkMath Line and Stop Line Function Menu
• {FILE} … Same as {FILE} under “Text Line Function Menu” (page 10-1-3).
• {STRP} … Same as {STRP} under “Text Line Function Menu” (page 10-1-3).• {CALC} … {changes the current line from a math line to a text line}
• {MATH} … {displays a MATH menu for natural input of matrices and mathematical
functions}
For more information, see “Using the MATH Menu” (page 1-3-10).
• {INS} … Same as {INS} under “Text Line Function Menu” (page 10-1-3).
• {JUMP} … Same as {JUMP} under “Text Line Function Menu” (page 10-1-3).
• {DEL • L} … {deletes the line that is currently selected or where the cursor is located}
Note that deleting a math line deletes both the input expression and the
result.• {'MAT} … {displays the Matrix Editor (page 2-8-2)}
• {'LIST} … {displays the List Editor (page 6-1-1)}
10-1-4 eActivity Overview

8/20/2019 _Casio_fx9860GSD_9860G_E
http://slidepdf.com/reader/full/casiofx9860gsd9860ge 501/595
20050401
10-1-5 eActivity Overview
kkkkk Strip Function Menu
• {FILE} … Same as {FILE} under “Text Line Function Menu” (page 10-1-3) except for
{SIZE}.• {SIZE} … {displays the size of the strip that is currently selected or where the cursor is
currently located}
• {STRP} … Same as {STRP} under “Text Line Function Menu” (page 10-1-3).
• {INS} … {inserts a new line above the currently selected strip}
• {TEXT} … {inserts a text line}
• {CALC} … {inserts a math line}
• {STOP} … {inserts a stop line}
• {CHAR} … Same as {CHAR} under “Text Line Function Menu” (page 10-1-3).
• {A↔a} … Same as {A↔a} under “Text Line Function Menu” (page 10-1-3).
• {JUMP} … Same as {JUMP} under “Text Line Function Menu” (page 10-1-3).
• {DEL • L} … {deletes the strip that is currently selected or where the cursor is located}
• {'MAT} … {displays the Matrix Editor (page 2-8-2)}
• {'LIST} … {displays the List Editor (page 6-1-1)}
kkkkkBasic eActivity File Operations
This section provides an overview of the following eActivity operations.
• Creating a new eActivity file
• Inputting text, numeric expressions, strips, and other data
• Accessing applications from a strip and using the application’s screen
• Saving an eActivity file
This overview is explained using the following example problem:
• Solve 2 x 2 + x – 3 = 0 (extract the roots of y = 2 x 2 + x – 3).
• Graph y = 2 x 2 + x – 3 and confirm the above solution.• Use G-SLV to extract the roots on the graph screen.

8/20/2019 _Casio_fx9860GSD_9860G_E
http://slidepdf.com/reader/full/casiofx9860gsd9860ge 502/595
20050401
10-1-6 eActivity Overview
1. From the main menu, enter the e • ACT mode.
2. Create a new eActivity file.
1. Press2(NEW).
2. On the dialog box that appears, enter up to eight characters for the eActivity file name,and then pressw.
• This will display a blank workspace screen with a text line cursor (for text line input).
Text line cursor
3. Use the text line to input to type in comments, information about the eActivity
problem, etc.
1. Here we will input the text shown below.
• Note that a text line does not perform auto word wrapping, so you need to insertcarriage returns manually where you want them by pressingw.
2. After inputting all of the text you want, pressw.
• This will cause the cursor to move from the end of the text to the beginning of the next
line.
4. Use math lines to enter the expression (2 x2 + x – 3 = 0) and solve it.
For this example, we will use the Solve function, configuring it with the following settings.
Initial Estimated Value: 0
Lower Limit: 0
Upper Limit: 10
For details about using the Solve function, see page 8-6-9.
1. First, press3(TEXT) to change to a math line.
Math line cursor

8/20/2019 _Casio_fx9860GSD_9860G_E
http://slidepdf.com/reader/full/casiofx9860gsd9860ge 503/595
20050401
10-1-7 eActivity Overview
2. Specify the Solve calculation, and then enter the function.
AK4(CALC)1(Solve)
cvx+v-d,
3. Input the initial estimate value, the lower limit, and the upper limit.
a,a,ba)
4. Pressw to solve for x .
• This will display the solution ( x = 1) and move thecursor to the beginning of the next line.
5. PressJ twice to close the option (OPTN) menu.
5. Now to draw a graph, insert a Graph strip into the eActivity.
1. Press2(STRP).
• This will display a dialog box with a list of
insertable strips.
2. On the list, select “Graph”, and then pressw.
• This will insert a Graph strip, ready for you to
input a title.
3. Type a title for the list (“Graph draw” for this
example), and then pressw.
• This will register the title and highlight the strip.
20050601

8/20/2019 _Casio_fx9860GSD_9860G_E
http://slidepdf.com/reader/full/casiofx9860gsd9860ge 504/595
20050401
10-1-8 eActivity Overview
6. Graph the expression using the Graph strip.
1. While the “Graph draw” Graph strip you created in step 5 is selected, pressw.
• This will display a graph screen.
2. Press!6(G↔T) to display the Graph Editor screen.
3. In line Y1, input the function ( y = 2 x 2 + x – 3) you want to graph.
4. Press6(DRAW) to graph the function.
• This will display a graph screen. Since the graph intersects the x -axis at –1.5 and 1,
we can conclude that the solution ( x = 1) obtained in step 4 is valid. The –1.5 valuewas not included as a solution because we specified a lower limit of 0.
• The graph drawn here is stored in the strip we created in step 5.
5. To return to the eActivity workspace screen, press!a(').
7. Use G-SLV to extract the roots on the graph screen.
1. Select the Graph strip we created in step 5, and then pressw.
• This will display the graph screen and draw the graph we drew in step 6.
2. Use G-SLV to extract the roots of y = 2 x 2 + x – 3.
!5(G-SLV)1(ROOT) .. (Extracts first root.)
e ......................................... (Extracts next root.)
• For details about using G-SLV, see page 5-11-9.
3. To return to the eActivity workspace screen, press!a(').
8. Save the eActivity file.
• Press1(FILE)1(SAVE) to save the file. This will save the file you are editing by
replacing the currently stored version (if any).

8/20/2019 _Casio_fx9860GSD_9860G_E
http://slidepdf.com/reader/full/casiofx9860gsd9860ge 505/595
20050401
10-2 Working with eActivity Files
This section explains the different file operations you can perform from the eActivity file list
screen.
k Selecting a Memory Area to Display its Files
Pressing the6 function key toggles the eActivity list between Storage Memory and the SD
card loaded in the card slot.
When the6 function key menu is “SD”, it means that Storage Memory files are currently
listed. When the menu is “SMEM”, it means that SD card files are listed.
k eActivity File Operations
u To create a new file
1. While the file list screen is displayed, use the6 function key to select the memory
area (Storage Memory or SD card) where you want to create the new file.
• If the eActivity workspace screen is displayed, press theJ key to display the file
list. Then perform step 1.
2. If you want to create the file in a specific folder, usef andc to highlight the folder
you want, and then press1(OPEN) orw.
10-2-1Working with eActivity Files
Storage Memory file list SD card file list
Folder name

8/20/2019 _Casio_fx9860GSD_9860G_E
http://slidepdf.com/reader/full/casiofx9860gsd9860ge 506/595
20050401
• You do not need to open a folder if you want to create the new file in the Storage
Memory or SD card root directory.
• For information about creating a new folder, see “Creating a Folder in Storage
Memory or on an SD Card” (page 12-7-5).3. Press2(NEW).
• This displays a dialog box for inputting a file name.
4. Enter up to eight characters for the eActivity file
name, and then pressw.
• This displays a blank workspace screen.
• The following are the characters you can use in a file name:
A through Z, {, }, ’, ~, 0 through 9
u To open a file
1. While the file list screen is displayed, use the6 function key to select the memory
area (Storage Memory or SD card) that contains the file you want to open.
2. If the file you want to open is in a folder, usef andc to highlight the folder, and
then press1(OPEN) orw.
3. Usef andc to highlight the file you want to open, and then press1(OPEN) or
w*1.
• This will open the file.
10-2-2 Working with eActivity Files
*1If a memory error occurs in step 3, deletecapture memory contents and clipboard data,
or try moving the data to your computer’s hard
disk or an SD card.
Cursor

8/20/2019 _Casio_fx9860GSD_9860G_E
http://slidepdf.com/reader/full/casiofx9860gsd9860ge 507/595

8/20/2019 _Casio_fx9860GSD_9860G_E
http://slidepdf.com/reader/full/casiofx9860gsd9860ge 508/595
20050401
10-3 Inputting and Editing eActivity File Data
The following shows the type of eActivity file data you can input and edit.
10-3-1
Inputting and Editing eActivity File Data
Text line
A text line can be used to input characters, numbers, and expressions as non-executable
text.
Math lines
Math lines let you perform calculations in an eActivity. When you input a mathematical
expression, the result appears, right justified, in the next line. You can perform the same
operations as the ones you use in the RUN • MAT mode while “Math” is selected as the Input
Mode.
Stop line
A stop line can be used to stop calculation at a particular point.
StripA strip can be used to embed data from Graph, Conics Graph, Spreadsheet, and other
applications into an eActivity. There is also a Notes strip, which can be used to insert data
from Notes, which is the eActivity text editor.
Stop line
Text lines
Math lines
Strip

8/20/2019 _Casio_fx9860GSD_9860G_E
http://slidepdf.com/reader/full/casiofx9860gsd9860ge 509/595
20050401
kkkkkNavigating around the eActivity Workspace Screen
u To scroll the eActivity workspace screen vertically
The workspace screen can be scrolled line-by-line, or screen-by-screen.
• Pressingf while the cursor is in the top line of the workspace screen will scroll one line
upwards. Pressingc while the cursor is in the bottom line will scroll one line
downwards.
• To scroll screen-by-screen, press!f or!c.
u To jump to the top or the bottom of the eActivity workspace screen• To jump to the top of the screen, press6(g)1(JUMP)1(TOP).
• To jump to the bottom of the screen, press6(g)1(JUMP)2(BTM).
kkkkkUsing a Text Line
A text line can be used to input characters, numbers, and expressions as non-executable
text.
u To input into a text line
1. On the eActivity workspace screen, change the line where the cursor is currently
located into a text line, or insert a new text line.
• “To change the current line into a text line” (page 10-3-3)
• “To insert a text line” (page 10-3-3)
2. Input the text or expression you want into the text line.
• “Inputting and Editing Text Line Contents” (page 10-3-4)
10-3-2
Inputting and Editing eActivity File Data

8/20/2019 _Casio_fx9860GSD_9860G_E
http://slidepdf.com/reader/full/casiofx9860gsd9860ge 510/595
20050401
10-3-3
Inputting and Editing eActivity File Data
u To change the current line into a text line
1. On the eActivity workspace screen, check the menu of the3 function key.
• If the3 key menu is “TEXT”, it means that the current line is already a text line. Inthis case, you can input text in the line without performing step 2, below.
• If the3 key menu is “CALC”, it means that the current line is a math line. Perform
step 2, below, to change it to a text line.
2. Press3(CALC) to change the math line to a text line.
• You cannot use the above procedure to change to a text line while a strip is selected. In
this case, you need to perform the procedure under “To insert a text line” or move the
cursor to a line that is not a strip.
u To insert a text lineTo insert a text line while the cursor is
Perform this key operation:located here:
In a text line 6(g)3(INS)1(TEXT)
In a math line 5(INS)1(TEXT)
In a strip 3(INS)1(TEXT)
The text line is inserted above the line or the strip where the cursor is currently located.
Text line cursor
3 key menu becomes “TEXT”.

8/20/2019 _Casio_fx9860GSD_9860G_E
http://slidepdf.com/reader/full/casiofx9860gsd9860ge 511/595
20050401
10-3-4
Inputting and Editing eActivity File Data
u Inputting and Editing Text Line Contents
• You can input up to 255 bytes of text into a text line. Scroll arrows (]') will appear on
the left and right sides of the text line to let you know there is additional text that does not
fit within the text line display area. In this case, you can use the left and right cursor keys
to scroll the text.
• The5(A↔a) function key toggles between upper-case and lower-case input. This
function is available only during alpha input (page 1-1-3). The text line cursor is “ ” while
upper-case input is selected, and “ ” during lower-case input.
• You can input a carriage return into a text line by pressingw. Note that there is no
return display symbol.
• To clear all of the text in the text line where the cursor is located, press theA key.
kUsing Math Lines
A math line lets you input a calculation into an eActivity file, and then perform the same
calculations you use in the RUN • MAT mode while “Math” is selected as the Input Mode.
Math lines always have two parts: an input expression and a result.
eActivity calculations are different from RUN • MAT mode calculations as described below.
• When you input a mathematical expression into an eActivity, the Input Mode (page
1-3-8) always changes to “Math”, regardless of the calculator’s current input mode
setting.
• You can input stop lines in an eActivity.
# When you input a mathematical expression
into a text line, the Input Mode (page 1-3-8)
always changes to “Math”, regardless of the
calculator’s current input mode setting.
# Pressing6(g)4(MATH) displays the MATH
submenu. You can use this menu for natural
input of matrices, differentials, integrals, etc. For
details about input using the MATH menu, see“Using the MATH Menu” (page 1-3-10).
# Any mathematical expression you input into a
text line is non-executable.

8/20/2019 _Casio_fx9860GSD_9860G_E
http://slidepdf.com/reader/full/casiofx9860gsd9860ge 512/595
20061001
10-3-5
Inputting and Editing eActivity File Data
u To input a calculation formula into an eActivity
1. On the eActivity workspace screen, change the line where the cursor is currently
located into a math line, or insert a new math line.
• “To change the current line into a math line” below
• “To insert a math line” (page 10-3-6)
2. Input the expression.
Example:s$!E(π)cg
• “Inputting and Editing Math Line Contents”
(page 10-3-6)
Math line cursor
3. To obtain the result of the calculation and display
it, pressw.
u To change the current line into a math line
1. On the eActivity workspace screen, check the menu of the3 function key.• If the3 key menu is “CALC”, it means that the current line is already a math line. In
this case, you can input an expression in the line without performing step 2, below.
• If the3 key menu is “TEXT”, it means that the current line is a text line. Perform step
2, below, to change it to a math line.
2. Press3(TEXT) to change the text line to a math line.
Math line cursor
This will cause the3 key menu to
change to “CALC”.
# You cannot use the above procedure to
change to a math line while a strip is selected.
In this case, you need to perform the
procedure under “To insert a math line” or move the
cursor to a line that is not a strip.
20070101

8/20/2019 _Casio_fx9860GSD_9860G_E
http://slidepdf.com/reader/full/casiofx9860gsd9860ge 513/595
20050401
10-3-6
Inputting and Editing eActivity File Data
u To insert a math line
To insert a math line while the cursor isPerform this key operation:
located here:
In a math line 5(INS)2(CALC)
In a text line 6(g)3(INS)2(CALC)
In a strip 3(INS)2(CALC)
The math line is inserted above the line or the strip where the cursor is currently located.
u Inputting and Editing Math Line Contents
Math line content input and editing can be performed using the same procedures you use in
the RUN • MAT mode while “Math” is selected as the Input Mode (on the Setup screen).
kUsing Stop Lines
Any time you change the expression in any math line of an eActivity that contains more than
one math line, pressingw will cause all of the math lines to be recalculated.
Recalculation can take some time if there is a large number of math lines or if the math lines
include complex calculations.
To avoid having to wait for all the expressions to be recalculated each time you make a
change, you can insert a stop line below the math line(s) you are editing. Then when you
pressw the calculator will re-calculate the math lines up to the stop line and then stop
automatically.
u To insert a stop line
To insert a stop line while the cursor isPerform this key operation:
located here:
In a math line 5(INS)3(STOP)
In a text line 6(g)3(INS)3(STOP)
In a strip 3(INS)3(STOP)
The stop line is inserted above the line or the strip where the cursor is currently located.

8/20/2019 _Casio_fx9860GSD_9860G_E
http://slidepdf.com/reader/full/casiofx9860gsd9860ge 514/595
20050401
10-3-7
Inputting and Editing eActivity File Data
uStop Line Example
The following screen shows how you can use stop lines to group calculation steps.
A: Substituting a value ( here) for θ in the expression in line 1 executes (sinθ )2 + (cosθ )2
in line 3, and displays the result in line 4 (1). In this example, substituting any value in line
1 and pressingw will produce a result of 1.
If we wanted to test various values for θ without recalculating all of the math lines
underneath it, we could insert a stop line at the location shown above. Then, each time
we change the value of θ and pressw, the calculator will re-calculate (sinθ )2 + (cosθ )2
and then stop.
B: These math lines are not required to test various values for θ .
A
B
π
6

8/20/2019 _Casio_fx9860GSD_9860G_E
http://slidepdf.com/reader/full/casiofx9860gsd9860ge 515/595
20050401
k Inserting a Strip
A strip can be used to embed data from Graph, Conics Graph, Spreadsheet, and other
applications into an eActivity. Note that only one application screen (either the Graph screenor Graph Editor screen in the case of GRAPH mode data, for example) can be used in each
strip.
A strip consists of a title field on the left, and a screen name field on the right.
Using thef andc keys to move the highlighting to a strip and then pressingw willdisplay the applicable application screen.
The data used to perform operations on an application screen called up from a strip
(functions used for graphing, etc.) is stored in the strip’s data memory. Because of this, anydata stored in the strip is available whenever you call up the application from there or even if
you switch the strip to another application.
10-3-8
Inputting and Editing eActivity File Data
# Though the applicable application screen fills
the display when you call up an application
from a strip, eActivity continues running in the
background. It is important to keep in mind
that any operation you perform within the
application is an eActivity operation.
# Any data you input on an application screencalled up from a data strip is stored in the data
strip’s data memory, not in an application data
file.
# Separate data is stored in each strip’s data
memory, so if you create multiple strips that are
associated with the same application screen,
the application screen for each strip will produce
its own unique results.
Title Field
You can input a strip title
up to 16 characters long.
Screen Name Field
This is the name of the screen
that the strip contains.

8/20/2019 _Casio_fx9860GSD_9860G_E
http://slidepdf.com/reader/full/casiofx9860gsd9860ge 516/595
20050401
u To insert a strip
1. Move the cursor to the location where you want to
insert the strip.
2. Press2(STRP).
• This will display a dialog box with a list of
insertable strips.
3. Usef andc to highlight the name of the strip for the type of data you want to
embed.
When you want to embed this type of data: Select this type of strip:
RUN • MAT mode calculation screen Run (Math)*1
GRAPH mode Graph screen Graph
GRAPH mode Graph Editor screenGraph Editor(Graph relation list)
TABLE mode Table Editor screenTable Editor
(Table relation list)
CONICS mode Conics Graph screen Conics Graph
CONICS mode Conics Editor screen Conics Editor
STAT mode Stat Graph screen Stat Graph
STAT mode List Editor screen List Editor
EQUA mode Solver screen SolverRECUR mode Recur Editor screen Recur Editor
Notes screen*2 Notes
RUN • MAT mode Matrix Editor screen Matrix Editor
EQUA mode Simul Equation screen Simul Equation
EQUA mode Poly Equation screen Poly Equation
10-3-9
Inputting and Editing eActivity File Data
*1Run starts up in the Math input mode. *2Notes is an application that can be called up from
eActivity only. See “Using Notes” (page 10-3-18)
for more information.

8/20/2019 _Casio_fx9860GSD_9860G_E
http://slidepdf.com/reader/full/casiofx9860gsd9860ge 517/595
20050401
When you want to embed this type of data: Select this type of strip:
DYNA mode Dynamic Graph screen Dynamic Graph
TVM mode Financial screen FinancialS • SHT mode Spreadsheet screen SpreadSheet
4. Pressw.
• The strip is inserted above the line or the strip
where the cursor is currently located.
5. Pressd ore to display the text input cursor,
and then enter up to 16 characters for the strip title.• The text cursor will also appear if you start to input
text without pressingd ore first.
6. Pressw to assign the title to the strip.
10-3-10
Inputting and Editing eActivity File Data
# Pressing thew key while a strip is
highlighted (selected) as shown in steps 4 and6 above will display the applicable application
screen. For details, see “To call up an
application from a strip” (page 10-3-12).

8/20/2019 _Casio_fx9860GSD_9860G_E
http://slidepdf.com/reader/full/casiofx9860gsd9860ge 518/595
20050401
10-3-11
Inputting and Editing eActivity File Data
u To change the title of a strip
1. Usef andc to highlight the strip whose title you
want to change.
2. Input the new title.
• Pressd ore to display the text input cursor, and then edit the current title.
• If you press a character key without pressing the
d ore key first, the current title will be cleared
and the character will be input.
3. After making sure the title is the way you want, pressw.
• PressingJ will cancel title input without changing the current title.

8/20/2019 _Casio_fx9860GSD_9860G_E
http://slidepdf.com/reader/full/casiofx9860gsd9860ge 519/595
20050401
u To call up an application from a strip
1. Use thef andc cursor keys to move the
highlighting to the strip whose associated
application you want to call up.
2. Pressw.
• The application screen will be blank the first time
you call it up after inserting a strip.
3. Input data, graph, and perform any other operations you want on the application
screen.
• Operations you can perform on an application screen that you call up from an
eActivity strip are the same as those you can normally perform while the application is
running. For details about using each application, see the section of this User’s Guide
that explains that application’s mode.
• Also see “Practical Strip Examples” (page 10-3-13) for more information.
u To toggle between the eActivity workspace screen and the applicationscreen called up from a strip
Press!a(').
• This will toggle between the two screens, displaying one in the front and sending the other
to the back.
10-3-12
Inputting and Editing eActivity File Data
# If you select a Conics Graph strip and pressw without inputting any graph data, the
Conics Editor screen appears in place of the
Conics Graph screen.

8/20/2019 _Casio_fx9860GSD_9860G_E
http://slidepdf.com/reader/full/casiofx9860gsd9860ge 520/595
20050401
u To switch from an application screen called up from a strip to anotherapplication screen
Press!,(,).
• On the application list that appears, usef andc to
highlight the name of the screen to which you want to
switch, and then pressw.
k Practical Strip Examples
This section provides real-life examples of how to insert strips into the eActivity workspace
screen, how to call up an application screen from a strip, and how to input data.
uGraph Strip Example
This example shows how to create a Graph strip to graph the function y = x 2.
Things to remember...
• Though the graph screen is called up from the Graph strip, you need to switch to the Graph
Editor screen to input the function.
u To create a Graph strip
1. On the eActivity workspace screen, press2(STRP), select “Graph” from the strip list
that appears, and then pressw.
• This will insert a Graph strip.
2. Input the strip title, and then pressw.
• Here we will input “Graph draw”.
10-3-13
Inputting and Editing eActivity File Data
# For an actual example about how to switchapplications, see “Table Editor Strip Example”
(page 10-3-15).
# Even after using!,(,) to switch a stripto another application, you can still use
!a(') to toggle between the eActivity
workspace screen and the application screen.

8/20/2019 _Casio_fx9860GSD_9860G_E
http://slidepdf.com/reader/full/casiofx9860gsd9860ge 521/595
20050401
3. Pressw to call up the graph screen.
• Since you have not input any data yet, the graph screen that appears will be blank.
4. Press!6(G↔T) to display the Graph Editor screen.
• This will display the current Graph strip’s Graph relation list. Since this list isindependent of the GRAPH mode Graph relation list, it will be blank because this is a
new Graph strip.
5. Input the function you want to graph (Y1 = X2 in
this example).
6. Press6(DRAW) to graph the function.
• This will display the graph screen with a
graph of the function you input on the Graph
Editor screen.
7. To return to the eActivity workspace screen, press
!a(').
8. Pressw again to call up the graph screen.
• This will re-graph the function you input in step 5.
10-3-14
Inputting and Editing eActivity File Data
# You can also paste a previously copiedfunction from the clipboard into a graph screen
called up from a Graph strip. Note, however,
that a graph produced by pasting the function
is not stored in the memory of the Graph strip. Formore information, see “Using Copy and Paste to
Draw a Graph” (page 10-3-16).

8/20/2019 _Casio_fx9860GSD_9860G_E
http://slidepdf.com/reader/full/casiofx9860gsd9860ge 522/595
20050401
u Table Editor Strip Example
In this example, we use a Table Editor strip to input the function y = x 2, and reference “List 1”
of the List Editor for the x -variable range to generate a number table.
Things to remember...
• Use the Table Editor to input the function y = x 2.
• Setup Table Editor (using the Setup screen) to reference “List 1” for the x -variable and
generate the numeric table.
• Call up the List Editor to input the data to be used as the range of the x -variable into List 1.
u To create a Table Editor strip
1. On the eActivity workspace screen, press2(STRP), select “Table Editor” from thestrip list that appears, and then pressw.
• This will insert a Table Editor strip.
2. Input the strip title, and then pressw.
• Here we will input “Table create”.
3. Pressw to call up the Table Editor screen.• This will display a blank Table Editor screen.
4. Input the function you want to use to generate
the table (Y1 = X2 in this example).
5. Press!m(SET UP) to display the Setup screen.
• This will display the Table Editor Setup screen, with the “Variable” item highlighted.6. Press2(LIST). On the dialog box that appears, input “1” and then pressw.
• Specify List 1 as the variable for generating the number table.
7. PressJ to close the Setup screen.
10-3-15
Inputting and Editing eActivity File Data

8/20/2019 _Casio_fx9860GSD_9860G_E
http://slidepdf.com/reader/full/casiofx9860gsd9860ge 523/595
20050401
8. Call up the List Editor screen (page 6-1-1).
• Press!,(,) to display the application list, select List Editor, and then pressw.
9. Input the values into List 1.
10. Return to the Table Editor screen.
• Press!,(,) to display the application list, select Table Editor, and then press
w.
11. When the Table Editor screen appears, pressw.
• This generates the number table for the function
y = x
2
using the values in List 1 as the x -variablerange.
12. To return to the eActivity workspace screen, press!a(').
kUsing Copy and Paste to Draw a Graph
You can paste a previously copied function from the clipboard into a graph screen called up
from a Graph strip. If you do, however, the pasted data will not be reflected in the function
stored in the memory of the Graph strip. Use copy and paste when you need a quick,
temporary look at the graph produced by a function.
10-3-16
Inputting and Editing eActivity File Data
# After returning to the eActivity workspace
screen in step 12, you can pressw to
display the Table Editor screen, which willcontain the function you input. Pressingw
while the Table Editor screen is on the display
will return to the number table in step 11.
# As you can see in this example all data and
settings related to the application screen called
up from a strip are stored in strip memory.

8/20/2019 _Casio_fx9860GSD_9860G_E
http://slidepdf.com/reader/full/casiofx9860gsd9860ge 524/595
20050401
u To use copy and paste to draw a graph
1. Perform steps 1 through 7 under “To create a
Graph strip” (page 10-3-13) to create a Graph
strip with the title “Graph draw”.
• After completing step 7, check to make sure
the Graph strip is highlighted on the eActivity
workspace screen. If it isn’t, use thef and
c cursor keys to move the highlighting to
the Graph strip.
2. Press3(INS)1(TEXT) to input a text line.
3. Enter the following expression into the text line: Y = X2 – 1.
4. Use thef andc cursor keys to move the cursor to the expression you just input
(Y = X2 – 1), and copy it to the clipboard.
• See “To specify the copy range” (page 1-3-5) for details about how to copy text to the
clipboard.
5. Use thef andc cursor keys to move the
highlighting to the Graph strip, and then pressw.
• This will graph the function currently stored in
“Graph draw ” strip memory.
6. Press!j(PASTE).
• This will graph the function that is on the
clipboard (Y = X2 – 1).
7. To return to the eActivity workspace screen, press!a(').
8. Pressw again to call up the graph screen.
• This will re-graph the function currently stored in “Graph draw” strip memory.
10-3-17
Inputting and Editing eActivity File Data
# Though the above example uses an
expression that was copied from the eActivity
workspace screen, you can also copy an
expression from another application and then paste
it into eActivity.

8/20/2019 _Casio_fx9860GSD_9860G_E
http://slidepdf.com/reader/full/casiofx9860gsd9860ge 525/595
20050401
kUsing Notes
Notes is a text editor that can be used only in eActivity. You can call up the Notes screen
from a Notes strip on the eActivity workspace screen.
You can perform the following operations on a Notes screen.
u Input and edit text
Text is input at the current cursor position on the Notes screen. Input, editing, cursor
movement, and vertical screen scrolling operations are all identical to those you can perform
in an eActivity text line. For details about these operations, see “Inputting and Editing Text
Line Contents” (page 10-3-4) and “To scroll the eActivity workspace screen vertically”
(page 10-3-2). Note, however, that function menu assignments for Notes are different from
those used for text lines. See “Notes Screen Function Menu” below for more information.
u Copy and paste text
Use!i(CLIP) to copy text and!j(PASTE) to paste it. For more information, see
“Using the Clipboard for Copy and Paste” (page 1-3-5).
uNotes Screen Function Menu
The following describes the function menu of the Notes screen.
• {JUMP} … {displays a JUMP menu that you can use to jump to the top (1(TOP)) or the
bottom (2(BTM)) of the data}
• {DEL • L} … {deletes the line where the cursor is located}
• {INS} … {inserts one new line above the line where the cursor is currently located}
• {MATH} … {displays a MATH menu for natural input of matrices and mathematicalfunctions}
For more information, see “Using the MATH Menu” (page 1-3-10).
• {CHAR} … {displays a screen for selecting various mathematical symbols, special
symbols, and accented characters}
• {A↔a} … {toggles between upper-case and lower-case input}
10-3-18
Inputting and Editing eActivity File Data

8/20/2019 _Casio_fx9860GSD_9860G_E
http://slidepdf.com/reader/full/casiofx9860gsd9860ge 526/595
20050401
kDeleting an eActivity Line or Strip
Use the following procedure to delete a line or strip from the eActivity workspace screen.
Remember that deleting a math line deletes both the expression line and the result line.
u To delete a line or strip
1. Use thef andc cursor keys to move the
highlighting to the strip you want to delete.
2. Press6(g)2(DEL • L).
3. In response to the confirmation message that
appears, press1(Yes) to delete the line or strip,
or6(No) to cancel the delete operation withoutdoing anything.
10-3-19
Inputting and Editing eActivity File Data

8/20/2019 _Casio_fx9860GSD_9860G_E
http://slidepdf.com/reader/full/casiofx9860gsd9860ge 527/595
20050401
k Saving an eActivity File
After inputting or editing data on the eActivity workspace screen, you can save it to a file
under a new name (Save As) or you can replace the previously saved version of the file youare working on (Save). In the case of Save As, both the previous version and the new
version of the file are saved.
u To replace the existing file with the new version
On the eActivity workspace screen, press1(FILE)1(SAVE).
u To save a file under a new name (Save As)
1. Press1(FILE)2(SV • AS).
• This displays a dialog box for inputting a file name.
2. Enter up to eight characters for the eActivity file name, and then pressw.
• This will create a new file with the name you input in the same memory area (Storage
Memory or SD card) where the original file is located.
10-3-20
Inputting and Editing eActivity File Data
# If you pressJ to quit eActivity while there
are unsaved edits on the screen, a message
will appear asking you if you want to save
first. When this message appears, you can
any one of the following.
• Press1(Yes) key to save your edits and
replace the previously saved version of the
file.• Press6(No) to exit without saving.
• PressA to return to the eActivity
workspace screen.
# If a file already exists with the same file name
you input in step 2, a message will appear
asking if you want to replace the existing file
with the new one. Press1(Yes) to replace the
existing file, or6(No) to cancel the save
operation and return to the file name input
dialog box in step 1.

8/20/2019 _Casio_fx9860GSD_9860G_E
http://slidepdf.com/reader/full/casiofx9860gsd9860ge 528/595
20061001
10-4 Using Matrix Editor and List Editor
In addition to the strip operation for calling up application screens within eActivity (page
10-3-12), you can also use the eActivity function menu to call up Matrix Editor and List Editor.
k Calling Up Matrix Editor
You can call up Matrix Editor to input a matrix into a math line on the eActivity workspace
screen.
Note
The data you create by calling up the Matrix Editor using the procedure below can be
used in the calculation line on the eActivity workspace screen only. It is different from and
independent of data you create by calling up the Matrix Editor from a strip or from the
RUN • MAT mode.
u To call up Matrix Editor
Perform one of the following operations on the eActivity workspace screen.
To call up Matrix Editor while the cursor is
located here:Perform this key operation:
In a text line 6(g)6(g)1('MAT)
In a math line 6(g
)3('
MAT)In a strip 6(g)3('MAT)
u To return to the eActivity workspace screen from Matrix Editor
PressJ.
u To use Matrix Editor
Matrix Editor operations are identical to those you perform when you call it up from the
RUN • MAT mode. For more information, see “2-8 Matrix Calculations”.
u To perform matrix calculations using a matrix stored with Matrix Editor
Use the same procedures as those you use in the RUN • MAT mode to use an existing
Matrix Editor matrix on the eActivity workspace screen. For details see “Inputting and Editing
Matrices” (page 2-8-2), “Matrix Cell Operations” (page 2-8-5), and “Modifying Matrices Using
Matrix Commands” (page 2-8-10).
10-4-1
Using Matrix Editor and List Editor
20070101

8/20/2019 _Casio_fx9860GSD_9860G_E
http://slidepdf.com/reader/full/casiofx9860gsd9860ge 529/595
20050401
kCalling Up List Editor
You can call up List Editor to input a list into a math line on the eActivity workspace screen.
Note
The data you create by calling up the List Editor using the procedure below can be used in
the calculation line on the eActivity workspace screen only. It is different from and
independent of data you create by calling up the List Editor from a strip or from the
RUN • MAT mode.
u To call up List Editor
Perform one of the following operations on the eActivity workspace screen.
To call up List Editor while the cursor is Perform this key operation:located here:
In a text line 6(g)6(g)2('LIST)
In a math line 6(g)4('LIST)
In a strip 6(g)4('LIST)
u To return to the eActivity workspace screen from List Editor
PressJ.
u To use List Editor
List Editor operations are identical to those you perform when you call it up from the STAT
mode.
See “3. List Function” and “Inputting Data into Lists” (page 6-1-1) for information about
inputting data to List Editor and performing List Editor calculations.
10-4-2 Using Matrix Editor and List Editor
# The function menu arrangement when you
call up List Editor from the eActivity
workspace screen is slightly different from the
function menu arrangement when you call it
up from the STAT mode. The functions,
however, are identical.
Initial Function Menu
1(TOOL) Function Submenu

8/20/2019 _Casio_fx9860GSD_9860G_E
http://slidepdf.com/reader/full/casiofx9860gsd9860ge 530/595
20050401
10-5-1eActivity File Memory Usage Screen
10-5 eActivity File Memory Usage Screen
The size of an eActivity file is limited. You can use the eActivity file memory usage screen to
check the current size and how much more memory is available for the eActivity file you areworking on. You can also display the size of the strip that is currently highlighted or where
the cursor is currently located.
u To display the eActivity memory usage screen
1. On the eActivity workspace screen, press
1(FILE)4(CAPA).
• This will display a screen like the one shown to
the right, which shows the current size of theeActivity file (Total Data Size) and how much
main memory is available for storage of additional
data (Free Bytes).
2. To exit the memory usage screen, pressJ.
• The maximum allowable size for a single eActivity file is approximately 30,000 bytes. The
actual maximum size depends on capture memory and clipboard use. The actual maximum
file size may be less than 30,000 bytes may be less, depending on how capture memory
and the clipboard are used.
u To display the strip memory usage screen
1. Usef andc to move the highlighting to the strip whose memory usage you want to
view.
2. Press1(FILE)5(SIZE).
• This will display the memory usage screen for the
currently selected strip.
3. To exit the memory usage screen, pressJ.

8/20/2019 _Casio_fx9860GSD_9860G_E
http://slidepdf.com/reader/full/casiofx9860gsd9860ge 531/595
20050401
System Settings MenuUse the system settings menu to view system information and
make system settings. The system settings menu lets you do the
following.
• Make contrast settings
• Make Auto Power Off settings
• Specify the system language• View the operating system and application versions
• Reset the calculator
11-1 Using the System Settings Menu
11-2 System Settings
11-3 Version List
11-4 Reset
Chapter
11
20060601

8/20/2019 _Casio_fx9860GSD_9860G_E
http://slidepdf.com/reader/full/casiofx9860gsd9860ge 532/595
20050401
11-1-1Using the System Settings Menu
11-1 Using the System Settings Menu
From the Main Menu, enter the SYSTEM mode and display the following menu items.
•1( ) ... {display contrast adjustment}
•2(APO) ... {Auto Power Off time setting}•3(LANG) ... {system language}
•4(VER) ... {version}
•5(RSET) ... {system reset operations}
20060601

8/20/2019 _Casio_fx9860GSD_9860G_E
http://slidepdf.com/reader/full/casiofx9860gsd9860ge 533/595
20061001
11-2 System Settings
k Contrast AdjustmentUse the (Contrast) item to adjust display contrast.
While the initial SYSTEM mode screen is displayed, press1( ) to display the Contrast
Adjustment screen.
• Thee cursor key makes display contrast darker.
• Thed cursor key makes display contrast lighter.
•1(INIT) returns display contrast to its initial default.
PressingJ or!J(QUIT) returns to the initial SYSTEM mode screen.
You can adjust contrast while any screen is on the display by pressing! and thene or
d. To exit contrast adjustment, press! again.
k APO Settings
You can specify either six minutes or 60 minutes as the Auto Power Off trigger time. The
initial default setting is six minutes.
While the initial SYSTEM mode screen is displayed, press2(APO) to display the Auto
Power Off Setting screen.
•1(6) ... 6 minutes
•2(60) ... 60 minutes
PressingJ or!J(QUIT) returns to the initial SYSTEM mode screen.
11-2-1System Settings
20070101

8/20/2019 _Casio_fx9860GSD_9860G_E
http://slidepdf.com/reader/full/casiofx9860gsd9860ge 534/595
20061001
k System Language Setting
Use LANG to specify the display language for built-in applications. You can also use add-ins
to install various other languages.
u To select the Message Language
1. From the initial SYSTEM mode screen, press3(LANG) to display the Message
Language selection screen.
2. Use thef andc cursor keys to select the language you want, and then press
1(SEL).
3. The pop up window appears using the language you selected. Check the contents and
then pressJ.
PressJ or!J(QUIT) to return to the initial SYSTEM mode screen.
u To select the Menu Language
1. From the initial SYSTEM mode screen, press3(LANG) to display the Message
Language selection screen.
2. Press6(MENU).
3. Use thef andc cursor keys to select the language you want, and then press
1(SEL).
4. The pop up window appears using the language you selected. Check the contents and
then pressJ.
• Press6(MSG) to return to the Message Language selection screen.
PressJ or!J(QUIT) to return to the initial SYSTEM mode screen.
11-2-2 System Settings
20070101

8/20/2019 _Casio_fx9860GSD_9860G_E
http://slidepdf.com/reader/full/casiofx9860gsd9860ge 535/595
20050401
11-3-1
Version List
11-3 Version List
The Version list shows the following items.
• Operating system version
• Add-in application versions
• Add-in message data versions
• Add-in menu data versions
• User name
You can register the user name you want.
uuuuu To display version information1. On the initial SYSTEM mode screen, press4(VER) to display the Version List.
2. Usef andc to scroll the screen. The contents of the list are shown below.Operating system version
Add-in application names and versions*1
Message languages and versions
Menu languages and versions
User name
PressJ or!J(QUIT) to return to the initial SYSTEM mode screen.
*1 Only installed add-ins are displayed.
20050901
# The operating system version that actually
appears depends on the calculator model.
20060601

8/20/2019 _Casio_fx9860GSD_9860G_E
http://slidepdf.com/reader/full/casiofx9860gsd9860ge 536/595
20050401
uuuuu To register a user name
1. While the Version list is displayed, press1(NAME) to display the user name input
screen.
2. Input up to eight characters for the user name you want.
3. After inputting the name, pressw to register it, and return to the Version list.
• If you want to cancel user name input and return to the Version list without registering
a name, pressJ.
11-3-2
Version List
20060601

8/20/2019 _Casio_fx9860GSD_9860G_E
http://slidepdf.com/reader/full/casiofx9860gsd9860ge 537/595
20050401
11-4 Reset
1. While the initial SYSTEM mode screen is displayed, press5(RSET) to display the
Reset Screen 1.
•1(STUP) ... {setup initialization}
•2(MAIN) ... {main memory data clear}
•3(ADD) ... {add-in application clear}
•4(SMEM) ... {storage memory data clear}
•5(A&S) ... {add-in application and storage memory data clear}
Pressing6(g) on the above screen displays the Reset Screen 2 shown below.
•1(M&S) ... {main memory data and storage memory data clear}
•2(ALL) ... {all memory clear}
•3(SD) ... {SD card format}
The following table shows the functions of the function keys. You can use the function
keys to delete the specific data you want.
Function Key Functions
11-4-1
Reset
Initialize
Setup
Information
Delete Main
Memory Data
Delete
Add-in
Applications
Delete StorageMemory Data
(Excluding Add-in
Applications)
Format
SD Card
1(STUP)
2(MAIN)
3(ADD)
4(SMEM)
5(A&S)
6(g)1(M&S)
6(g)2(ALL)
6(g)3(SD)
20050901

8/20/2019 _Casio_fx9860GSD_9860G_E
http://slidepdf.com/reader/full/casiofx9860gsd9860ge 538/595
20050401
11-4-2
Reset
2. Press the function key that corresponds to the reset operation you want to perform.
3. In response to the confirmation message that appears, press1(Yes) to perform the
reset operation you specified, or6(No) to cancel.
Screen produced when
2 (MAIN) is pressed in step 2.
4. A message appears to let you know when the reset operation is complete.
• For all memory clear: PressJ to restart the calculator and return to the Main Menu.
• Other: PressJ to clear the message.
Screen produced when
2 (MAIN) is pressed in step 2.
20050901

8/20/2019 _Casio_fx9860GSD_9860G_E
http://slidepdf.com/reader/full/casiofx9860gsd9860ge 539/595

8/20/2019 _Casio_fx9860GSD_9860G_E
http://slidepdf.com/reader/full/casiofx9860gsd9860ge 540/595
20061001
12-1-1Connecting Two Units
12-1 Connecting Two Units
The following procedure describes how to connect two units with the connecting cable that
comes equipped as a standard accessory.
u To connect two units
1. Check to make sure that the power of both units is off.
2. Connect the two units using the cable.
3. Perform the following steps on both units to specify 3PIN as the cable type.
(1) From the Main Menu, enter the LINK mode.
(2) Press4(CABL). This displays the cable type selection screen.
(3) Press2
(3PIN).
Cable
# Models that are supported for this
configuration are shown below.
fx-9860G SD
fx-9860G
20070101

8/20/2019 _Casio_fx9860GSD_9860G_E
http://slidepdf.com/reader/full/casiofx9860gsd9860ge 541/595

8/20/2019 _Casio_fx9860GSD_9860G_E
http://slidepdf.com/reader/full/casiofx9860gsd9860ge 542/595
20050401
12-3 Performing a Data Communication
Operation
From the Main Menu, enter the LINK mode. The following data communication main menu
appears on the display.
• {TRAN} ... {displays the data send screen}
• {RECV} ... {displays the data receive screen}
• {CABL} ... {displays the cable type selection screen}
• {WAKE} ... {displays the wakeup setting screen}
• {CAPT} ... {displays the image transfer setting screen}
Communication parameters are fixed at the following settings.
• 3-pin serial port
• Speed (BPS): 9600 bps max. (Connected with CFX-9850 series)
115200 bps max. (Connected with another fx-9860G SD/fx-9860G)• Parity (PARITY): NONE
• USB port
• Communication speed is in accordance with USB standards.
12-3-1Performing a Data Communication Operation

8/20/2019 _Casio_fx9860GSD_9860G_E
http://slidepdf.com/reader/full/casiofx9860gsd9860ge 543/595
20050401
kkkkk Performing a Data Transfer Operation
Connect the two units and then perform the following procedures.
Receiving unit
To set up the calculator to receive data, press2(RECV) while the data communication
main menu is displayed.
The calculator enters a data receive standby mode and waits for data to arrive. Actual data
receive starts as soon as data is sent from the sending unit.
Sending unit
To set up the calculator to send data, press1(TRAN) while the data communication main
menu is displayed.
This displays the send data type selection screen.
• {MAIN} ... {main memory data}
• {SMEM} ... {storage memory data}
12-3-2 Performing a Data Communication Operation

8/20/2019 _Casio_fx9860GSD_9860G_E
http://slidepdf.com/reader/full/casiofx9860gsd9860ge 544/595
20050401
12-3-3 Performing a Data Communication Operation
Pressing1(MAIN) or2(SMEM) displays a screen for specifying the data selection
method.
• {SEL} ... {selects new data}
• {CRNT} ... {automatically selects previously selected data*1}
u To send selected data items (Example: To send user data)
Press1(SEL) or2(CRNT) to display a data item selection screen.
• {SEL} ... {selects data item where cursor is located}
• {ALL} ... {selects all data}
• {TRAN} ... {sends selected data items}
Use thef andc cursor keys to move the cursor to the data item you want to select and
press1(SEL) to select it. Currently selected data items are marked with “'”. Pressing
6(TRAN) sends all the selected data items.
• To deselect a data item, move the cursor to it and press1(SEL) again.
Only items that contain data appear on the data item selection screen. If there are too many
data items to fit on a single screen, the list scrolls when you move the cursor to the bottom
line of the items on the screen.
*1The previously selected data memory is
cleared whenever you perform either of thefollowing operations.
- Change the type of transfer data
- Change to another mode
When1(MAIN) is pressed When2(SMEM) is pressed

8/20/2019 _Casio_fx9860GSD_9860G_E
http://slidepdf.com/reader/full/casiofx9860gsd9860ge 545/595
20050401
uTo execute a send operation
After selecting the data items to send, press6(TRAN). A message appears to confirm that
you want to execute the send operation.
•1(Yes) ... sends data
•6(No) ... returns to data selection screen
Press1(Yes) to send the data.
• You can interrupt a data operation at any time by pressingA.
The following shows what the displays of the sending and receiving units look like after the
data communication operation is complete.
Sending Unit Receiving Unit
PressJ to return to the data communication main menu.
12-3-4 Performing a Data Communication Operation
# Add-in applications, add-in languages, and
add-in menus are stored in the receiver’s
storage memory.
# A commercial add-in application cannot be
transferred.

8/20/2019 _Casio_fx9860GSD_9860G_E
http://slidepdf.com/reader/full/casiofx9860gsd9860ge 546/595
20050401
12-3-5 Performing a Data Communication Operation
k Specifying the Cable Type
Use the following procedure to specify the cable type for data communication.
1. On the data communication main menu, press
4(CABL).
This displays the cable type selection screen.
• {USB} ... {USB cable}
• {3PIN} ... {3-pin cable}
2. Press1(USB) or2(3PIN) to select the cable type and return to the data
communication main menu.
kkkkkConfiguring the Receiver’s Wakeup Feature
When Wakeup is turned on the receiver, the receiver turns on automatically when data
transfer starts.
When communicating between two calculators (3PIN selected as the cable type), the
receiver enters the receive mode automatically after it wakes up. When communication is
with a computer (USB selected as the cable type), connecting the USB cable to a computer
and then to the calculator (while the calculator is turned off) will cause the calculator to turnon and enter the receive mode.
1. On the receiver’s data communication main menu,
press5(WAKE).
This displays the Wakeup setting screen.
• {On} ... {turns Wakeup on}
• {Off} ... {turns Wakeup off}
2. Press1(On).
This turns on Wakeup and returns of the data communication main menu.
3. Turn off the receiver.
4. Connect the receiver to the sender.
5. Starting a send operation on the sender causes the receiver to turn on automatically
and performs the data transfer operation.

8/20/2019 _Casio_fx9860GSD_9860G_E
http://slidepdf.com/reader/full/casiofx9860gsd9860ge 547/595
20050401
12-4 Data Communications Precautions
The following are the types of data items that can be sent.
Data Item Contents Overwrite
Check *1
<PROGRAM> Program group
Program names Program contents (All programs are listed.) Yes
<MATRIX> Matrix group
MAT n Matrix memory (A to Z, and Ans) contents Yes
<LISTFILE> List file group
LIST n List memory (1 to 26, and Ans) contents Yes
LIST FILE n List file memory (1 to 6) contents Yes
Y=DATAGraph expressions, graph draw/non-draw
Nostatus, V-Window contents, zoom factors
<G-MEM> Graph memory group
G-MEM n Graph memory (1 to 20) contents Yes
<V-WIN> V-Window memory group
V-WIN n V-Window memory contents No
<PICTURE> Picture memory group
PICT n Picture (graph) memory (1 to 20) data No
DYNA MEM Dynamic Graph functions Yes
EQUATION Equation calculation coefficient values No
ALPHA MEM Alpha memory contents No
<F-MEM> Function memory group
F-MEM n Function memory contents No
STAT Stat result data No
TABLE Table data No
FINANCIAL Financial data No
<S-SHEET> Spreadsheet group
Spreadsheet data Spreadsheet dataYes
names (All spreadsheet data are listed.)
RECURSION Recursion data No
12-4-1
Data Communications Precautions
20050601

8/20/2019 _Casio_fx9860GSD_9860G_E
http://slidepdf.com/reader/full/casiofx9860gsd9860ge 548/595
20050401
•1(YES) ... {replaces the receiving unit’s existing data with the new data}•6(NO) ... {skips to next data item}
Note the following precautions whenever you perform data communications.
• An error occurs whenever you try to send data to a receiving unit that is not yet standing
by to receive data. When this happens, pressJ to clear the error and try again, after
setting up the receiving unit to receive data.
• An error occurs whenever the receiving unit does not receive any data approximately sixminutes after it is set up to receive data. When this happens, pressJ to clear the error.
• An error occurs during data communications if the cable becomes disconnected, if the
parameters of the two units do not match, or if any other communications problem
occurs. When this happens, pressJ to clear the error, then correct the problem before
trying data communications again. If data communications are interrupted by theJ key
operation or an error, any data successfully received up to the interruption will be in the
memory of the receiving unit.
• An error occurs if the receiving unit memory becomes full during data communications.When this happens, pressJ to clear the error and delete unneeded data from the
receiving unit to make room for the new data, and then try again.
12-4-2
Data Communications Precautions
Data item name
Data Item Contents Overwrite
Check *1
<CAPTURE> Capture memory group
CAPT n Capture memory (1 to 20) data No
SETUP Setup data No
OS and data shared by applications (clipboard,SYSTEM replay, history, etc.), which is not included in No
the above
Add-in application Add-in application dataNo
names (All add-in applications are listed.)
*1 No overwrite check: If the receiving unit already contains the same type of data, the
existing data is overwritten with the new data.With overwrite check: If the receiving unit already contains the same type of data, a
message appears to ask if the existing data should be overwritten with the new data.

8/20/2019 _Casio_fx9860GSD_9860G_E
http://slidepdf.com/reader/full/casiofx9860gsd9860ge 549/595
20061001
12-4-3
Data Communications Precautions
k Exchanging Data with another Model Calculator
• The graph line style data of this calculator is interchangeable with the line color data of
the CFX-9850.
• Sending the following type of data to a CFX-9850 will cause an error.
✗ All List, G-Mem, Pict, or F-Mem data, except for data numbers 1 through 6
CFX-9850 supports up to six List, G-Mem, Pict, and F-Mem data items only.
✗ More than 255 cells of List data
CFX-9850 supports up to 255 List cells only.
✗ Any List data that contains a complex number
CFX-9850 does not support complex number input.
• Attempting to send any of the following types of data to a CFX-9850 will not cause an
error, but the data will not be stored in CFX-9850 memory.
Table setting data
Recursion data
Financial data
Spreadsheet data
Add-in application data
Hard copy memory
Setup data
• Sending V-Window x -dot data to the CFX-9850 will cause the data to become corrupted.
20070101

8/20/2019 _Casio_fx9860GSD_9860G_E
http://slidepdf.com/reader/full/casiofx9860gsd9860ge 550/595
20050401
12-5 Image Transfer
k Transferring Images to a Computer
Use the following procedure to capture calculator screen images to a computer. Perform this
procedure using FA-124 software running on the computer.
1. Use the USB cable to connect the calculator to the computer.
2. On the calculator, press6(CAPT).
This displays the image transfer setting screen.
• {Mem} ... {turns off image transfer}
• {PC} ... {turns on manual image transfer}
• {OHP} ... {turns on auto image transfer}
3. Press2(PC).
This turns on manual image transfer and returns to the data communication main
menu.
4. On the calculator, display the screen you want to transfer.5. Use FA-124 to perform the transfer operation.
6. On the calculator, press!h(CAPTURE).
7. The screen data is sent to the computer.
12-5-1Image Transfer
# Selecting “PC” (turns on manual image
transfer) automatically disables screen
capture.
# The following types of screen images cannot be
transferred to another calculator or computer
using auto image transfer.
- The screen displayed during data transfer- The screen displayed during a calculation
- The screen displayed after reset is performed
- The low battery screen

8/20/2019 _Casio_fx9860GSD_9860G_E
http://slidepdf.com/reader/full/casiofx9860gsd9860ge 551/595
20050401
kAuto Image Transfer to an OHP Unit
The following procedure sends the screen of this calculator to an OHP unit at fixed intervals.
1. Use the USB cable to connect the calculator to the OHP unit.2. On the calculator’s data communication main menu, press6(CAPT).
3. Press3(OHP).
This turns on auto image transfer and returns of the data communication main menu.
4. Display the image you want to send.
5. The displayed image is sent automatically to the OHP unit.
6. To continue with auto image transfer, return to step 4.
7. To stop auto image transfer, press6(CAPT)1(Mem) on the data communication
main menu.
See the User’s Guide that comes with the OHP unit for information about connecting the
OHP unit and how to use the calculator while the OHP unit is attached.
12-5-2 Image Transfer
20050901

8/20/2019 _Casio_fx9860GSD_9860G_E
http://slidepdf.com/reader/full/casiofx9860gsd9860ge 552/595
20050401
12-5-3 Image Transfer
kConnecting to a Projector
You can connect the calculator to a CASIO projector and project calculator screen contents
onto a screen.
uConnectable Projectors (As of January 2007)
XJ-S35
• You can also connect the calculator to a YP-100 Multifunctional Presentation Kit and
project from the projectors other than the model shown above.
u
To project calculator screen contents from a projector1. On the calculator, enter the LINK mode and configure the “Wakeup” and “Capture”
settings as shown below.
2. Use the USB cable that comes with the calculator to connect to the projector (or
YP-100 unit).
uPrecautions when Connecting
• Be sure to configure the calculator’s “Wakeup” and “Capture” settings before connecting.
• An hourglass figure may remain projected on the screen after you connect the calculator
to a projector (or YP-100). If this happens, performing some operation on the calculator
will restore normal display.
• If the calculator stops operating normally, disconnect the USB cable and then reconnect
it. If this does not correct the problem, disconnect the USB cable, turn the projector (or
YP-100) off and then back on, and then reconnect the USB cable.
20061201

8/20/2019 _Casio_fx9860GSD_9860G_E
http://slidepdf.com/reader/full/casiofx9860gsd9860ge 553/595
20050401
12-6-1Add-ins
12-6 Add-ins
Add-in capabilities let you install separately available applications and other software to tailor
the calculator to suit your particular needs.Add-ins are installed from a computer using the data communication described on page
12-3-1.
The following are the types of software that can be installed as add-ins.
uuuuu Add-in Application
After you install an application, its icon appears in the Main Menu, and you can run it just as
you would a built-in application.
uuuuu Built-in Application Upgrades
These are upgrades for the applications that are pre-programmed in the calculator’s ROM.
uuuuu On-screen Message Language Data
This data is required to display on-screen messages in other languages. Installing this data
causes all on-screen messages to appear in the corresponding language.
uuuuu Function Menu Language Data
This data is required to display function menus in other languages. Installing this datacauses function menus to appear in the corresponding language.

8/20/2019 _Casio_fx9860GSD_9860G_E
http://slidepdf.com/reader/full/casiofx9860gsd9860ge 554/595
20050401
12-7-1MEMORY Mode
12-7 MEMORY Mode
This calculator has two separate memory areas: a “main memory” and a “storage memory.”
The main memory is a work area where you can perform input data, perform calculationsand run programs. Data in the main memory is relatively safe, but it can be deleted when
batteries go dead or when you perform a full reset.
The storage memory uses “flash memory,” so data is safe even when power is interrupted.
Normally, you would use the storage memory for data you need to store securely for long
periods and load it into the main memory only when you need it.
Use the MEMORY mode to transfer data between the main memory, storage memory and
SD card, and to perform other memory management operations.
From the Main Menu, select the MEMORY icon to enter the MEMORY mode and display its
initial screen.
• {MAIN} ... {displays main memory information}
• {SMEM} ... {displays storage memory information}
• {SD} ... {displays SD card memory information} (fx-9860G SD only)
• {BKUP} ... {main memory backup}
• {OPT} ... {storage memory, SD card optimization}

8/20/2019 _Casio_fx9860GSD_9860G_E
http://slidepdf.com/reader/full/casiofx9860gsd9860ge 555/595
20050401
kMemory Information Screen
Press1(MAIN) to display current main memory use information.
Press2(SMEM) to display current storage memory use information.
Press3(SD) to display current SD card memory use information.
• Use the cursorf andc keys to move the highlighting and check the number of bytes
used by each type of data.
• Line 7 shows how many bytes of memory are currently unused in the currently selected
memory (main, storage, or SD card).
• The first time you store data to the storage memory, the calculator will reserve a
management memory area automatically, which will reduce the “Free” value by 65535
bytes.
• On the main memory screen, < > indicates a data group. On the storage memory and SDcard screens, [ ] indicates folders.
12-7-2 MEMORY Mode

8/20/2019 _Casio_fx9860GSD_9860G_E
http://slidepdf.com/reader/full/casiofx9860gsd9860ge 556/595
20050401
Moving the highlighting to a data group or folder and pressingw will display the data group
or folder contents. PressingJ will return to the previous screen.
When the contents of a storage memory or SD card folder are displayed, the first line of the
screen shows the name of the folder.
uThe following data can be checked.
Main Memory
Data Name Contents
ALPHA MEM Alpha letter variables
<MATRIX> Matrix group
MAT n (n = A to Z, and Ans) Matrix
<LISTFILE> List file group
LIST n (n = 1 to 26, and Ans) List memory contents
LIST FILE n (n = 1 to 6) List File
STAT Stat result data
Y=DATA Graph expression
<G-MEM> Graph memory group
G-MEM n (n = 1 to 20) Graph memory
<V-WIN> V-Window memory group
V-WIN n (n = 1 to 6) V-Window memory
<PICTURE> Picture memory group
PICT n (n = 1 to 20) Picture memory
DYNA MEM Dynamic Graph memory
TABLE Table dataEQUATION Equation data
FINANCIAL Financial data
12-7-3 MEMORY Mode
Folder name
(Blank when the root
folder is displayed.)
w→
←
J

8/20/2019 _Casio_fx9860GSD_9860G_E
http://slidepdf.com/reader/full/casiofx9860gsd9860ge 557/595
20050401
Data Name Contents
<CAPTURE> Capture memory group
CAPTn
(n
= 1 to 20) Capture memoryCONICS Conics setting data
<PROGRAM> Program group
Each program name Programs
<S-SHEET> Spreadsheet group
Each spreadsheet name Spreadsheet data
Each add-in application name Application-specific data
<F-MEM> Function memory group
F-MEM n (n = 1 to 20) Function memory
SETUP Setup data
SYSTEMOS and data shared by applications (clipboard, replay,
history, etc.), which is not included in the above
Storage Memory, SD Card*1
Data Name Contents
Data items listed in the Main Memory table that has
*.g1m file names been copied to storage memory or an SD card.The names of these files have the extension “.g1m”.
eActivity data names eActivity data stored in storage memory or on an SDcard.
Add-in software namesAdd-in applications, add-in languages, and add-in(Applications, languages,menus stored in storage memory or on an SD card.menus)
Folder names Enclosed in square brackets ([ ]).
Unknown Area that is unusable due to writing error, etc.
12-7-4 MEMORY Mode
*1“No Data” is displayed when there is no datain storage memory or on the SD card. The
message “No Card” indicates there is no SD
card loaded in the calculator.

8/20/2019 _Casio_fx9860GSD_9860G_E
http://slidepdf.com/reader/full/casiofx9860gsd9860ge 558/595
20050401
kCreating a Folder in Storage Memory or on an SD Card
Use the following procedure to create and rename folders in storage memory and on an SD
card.
u To create a new folder
1. While storage memory or SD card memory data is on the display, press4(MK • F) to
display the folder name input screen.
2. Input up to eight characters for the name you want
to give to the folder.
• Only the following characters are supported: A through Z, {, }, ’, ~, 0 through 9
Inputting any invalid character will cause an “Invalid Name” error.
• An “Invalid Name” also occurs if the name you input is already being used by an
existing file.
• To cancel folder creation, pressJ.
3. Pressw to create the folder and return to the
storage memory or SD card memory information
screen.
12-7-5 MEMORY Mode

8/20/2019 _Casio_fx9860GSD_9860G_E
http://slidepdf.com/reader/full/casiofx9860gsd9860ge 559/595
20050401
u To rename a folder
1. On the storage memory or SD card memory information screen, select the folder you
want to rename.
2. Press5(RN • F) to display the rename folder screen.
3. Input up to eight characters for the name you want
to give to the folder.
• Only the following characters are supported: A through Z, {, }, ’, ~, 0 through 9
Inputting any invalid character will cause an “Invalid Name” error.
• An “Invalid Name” also occurs if the name you input is already being used by an
existing file.
• To cancel folder creation, pressJ.
4. Pressw to rename the folder and return to the
storage memory or SD card memory information
screen.
k Selecting Data
You can use the following procedures to select data for copy and deletion.
• Press1(SEL) to select the currently highlighted item, which is indicated by the black
selection pointer (') appearing next to it. Pressing1(SEL) again will deselect the item,
causing the selection pointer to disappear.
12-7-6
MEMORY Mode
→
1(SEL)
←
20060601

8/20/2019 _Casio_fx9860GSD_9860G_E
http://slidepdf.com/reader/full/casiofx9860gsd9860ge 560/595
20050401
• You can select multiple files, if you want.
• Selecting a group or folder also selects everything inside of it. Deselecting a group or folder
deselects all of its contents.
• If you select one or more individual items inside of a data group or folder, the black
selection pointer (') appears next to each item, while a white selection pointer (g)
appears next to the group or folder name.
• The current data selection is maintained when any of the following operations is performed.
Save/load execution
Search execution
• Returning to the MEMORY mode initial screen deselects all currently selected items.
12-7-7 MEMORY Mode
1(SEL)→
w
→
J
→

8/20/2019 _Casio_fx9860GSD_9860G_E
http://slidepdf.com/reader/full/casiofx9860gsd9860ge 561/595
20050401
kCopying Data
You can copy data between main memory, storage memory, and the SD card.
u To copy from main memory to storage memory
Note
• The following procedure saves the selected data into a single file. You assign a name to
the file, which is stored in storage memory.
1. On the main memory data information screen, select the data you want to copy.
2. Press2(COPY).
• This displays the storage memory/SD card
selection screen (fx-9860G SD only).*1
3. Pressb to select storage memory (fx-9860G SD
only).*2
• This displays the folder selection screen.
4. Select the folder to which you want to copy the data.
• This displays the file name input screen.
5. Input the file name you want to give to the file.
• To cancel the copy operation, pressJ.
6. Pressw.
• This copies the data.
7. The message “Complete!” appears when the copy operation is complete. PressingJ
will return to the MEMORY mode initial screen.
12-7-8 MEMORY Mode
*1Copying data from the storage memory or an
SD card causes one of the screens shown
below to appear (fx-9860G SD only).
The file name input screen does not appear when
you copy data from storage memory or/and SD
card to main memory.*2To copy to the SD card, pressc. The “No Card”
error message will appear if there is no SD card
loaded in the calculator.
Pressingb selects main memory and
copies the data, without displaying the folder
selection screen.

8/20/2019 _Casio_fx9860GSD_9860G_E
http://slidepdf.com/reader/full/casiofx9860gsd9860ge 562/595
20061001
Copying a *.g1m file to main memory restores the file to its original (non-g1m) type. Copying
a *.g1m file to an SD card copies it as a *.g1m file.
k Error Checks During Data Copy
The following error checks are performed while a data copy operation is being executed.
Low battery check
The calculator performs low battery check before starting the data copy operation. If the
battery is at Level 1, a low battery error occurs and the copy operation is not performed.
Available memory check
The calculator checks to see if there is enough free memory available to store the copied
data.A “Memory Full” error occurs if there is not enough memory available.
A “Too Many Data” error occurs when the number of data items is too great.
A “Fragmentation ERROR” occurs when there is enough free memory available, but a
garbage collection operation is required.
If a “Fragmentation ERROR” occurs, perform the optimization procedure (page 12-7-17).
Overwrite check
The calculator checks to see if there is any existing data at the copy destination with the
same name as the data being copied.
An overwrite confirmation message appears if there is data with the same name.
•1(Yes) ... overwrites the existing data with the new data
•6(No) ... advances to the next data item without copying the data with the same name
• PressingA will cancel the copy operation and return to the MEMORY mode initial screen.
12-7-9
MEMORY Mode
20070101

8/20/2019 _Casio_fx9860GSD_9860G_E
http://slidepdf.com/reader/full/casiofx9860gsd9860ge 563/595
20050401
Overwrite check is performed for the following types of data only. All other types of data are
copied, without checking for data files with the same name.
• Programs
• Matrices• List files
• Graph memories
• Dynamic Graph memories
• Spreadsheet data
Overwrite check is performed for data of the same type only. If different types of data have
the same name, the copy operation is performed without regard to the data with the same
name.
Overwrite check applies only to the destination of the copy operation.
Type mismatch error check
eActivity data, add-in applications, add-in languages, add-in menus, and backup data cannot
be copied to main memory. Attempting to do so will cause a type mismatch error.
12-7-10 MEMORY Mode

8/20/2019 _Casio_fx9860GSD_9860G_E
http://slidepdf.com/reader/full/casiofx9860gsd9860ge 564/595
20050401
kkkkkDeleting Files
Use the procedures in this section to delete main memory, storage memory, and SD card
data.
u To delete a main memory file
1. On the initial MEMORY mode screen press1(MAIN).
• This displays a list of files that are in the main memory.
2. Select the file(s) you want to delete. You can select multiple files, if you want.
3. Press6(DEL).
• Press1(Yes) to delete the file.
• Press6(No) to cancel the delete operation.
u To delete a storage memory file
1. On the initial MEMORY mode screen press2(SMEM).• This displays a list of files that are in the storage memory.
2. Select the file(s) you want to delete. You can select multiple files, if you want.
3. Press6(DEL).
• Press1(Yes) to delete the file.
• Press6(No) to cancel the delete operation.
u To delete SD card files (fx-9860G SD only)
1. On the initial MEMORY mode screen press3(SD).
• This displays a list of files that are in the SD card.
2. Select the file(s) you want to delete. You can select multiple files, if you want.
3. Press6(DEL).
• Press1(Yes) to delete the file.
• Press6(No) to cancel the delete operation.
12-7-11MEMORY Mode

8/20/2019 _Casio_fx9860GSD_9860G_E
http://slidepdf.com/reader/full/casiofx9860gsd9860ge 565/595
20050401
kkkkk Searching for a File
Use the following procedures to search for a specific file in the main memory or storage
memory or on the SD card.
u To search for a file in the main memory *1
○ ○ ○ ○ ○
Example To search for all files in the main memory whose names begin with the
letter “R”
1. On the initial MEMORY mode screen press1(MAIN).
• This displays a list of files that are in the main memory.
2. Press3(SRC).
• Input the letter “R” for the keyword.
• The first file name that begins with the letter “R” appears highlighted on display.
12-7-12 MEMORY Mode
*1 You can input up to eight characters for the
keyword.
# The message “Not Found” appears if there are no
file names that match your keyword.

8/20/2019 _Casio_fx9860GSD_9860G_E
http://slidepdf.com/reader/full/casiofx9860gsd9860ge 566/595
20050401
u To search for a file in the storage memory
○ ○ ○ ○ ○
Example To search for all files in the storage memory whose names begin withthe letter “S”
1. On the initial MEMORY mode screen press2(SMEM).
• This displays a list of files that are in the storage memory.
2. Press3(SRC).
• Input the letter “S” for the keyword.
• The first file name that begins with the letter “S” appears highlighted on display.
u To search for a file in the SD card (fx-9860G SD only)
○ ○ ○ ○ ○
Example To search for all files in the SD card whose names begin with the letter
“R”
1. On the initial MEMORY mode screen press3(SD).
• This displays a list of files that are in the SD card.
2. Press3(SRC).
• Input the letter “R” for the keyword.
• The first file name that begins with the letter “R” appears highlighted on display.
12-7-13 MEMORY Mode
# The message “Not Found” appears if there
are no file names that match your keyword.

8/20/2019 _Casio_fx9860GSD_9860G_E
http://slidepdf.com/reader/full/casiofx9860gsd9860ge 567/595
20050401
kBacking Up Main Memory Data
You can back up all the data in the main memory and store it in the storage memory or on
the SD card. Later you can restore the backed up data to the main memory when necessary.
u To back up main memory data
1. On the initial MEMORY mode screen press
4(BKUP).
2. Press1(SAVE).
This displays the save location selection screen
(fx-9860G SD only).
•b ... storage memory
•c ... SD card
3. Pressb orc (fx-9860G SD only).
This displays a folder selection screen.
4. Usef andc to select the folder where you want to save the data.
5. Pressw to start the backup.
12-7-14 MEMORY Mode
# Backup data is saved in a file named
BACKUP.g1m.

8/20/2019 _Casio_fx9860GSD_9860G_E
http://slidepdf.com/reader/full/casiofx9860gsd9860ge 568/595
20050401
The message “Complete!” appears when the backup operation is finished.
PressJ to return to the screen displayed in step 1.
The following message appears if there is already backup data in the storage memory.
Press1(Yes) to back up the data, or6(No) to cancel the backup operation.
A “Memory Full” occurs when there is not enough space available in the storage memory to
complete the backup operation.
u To restore backup data to the main memory
1. On the initial MEMORY mode screen press4(BKUP).
• On the screen that appears, you can confirm whether or not there is backup data in
the storage memory.
2. Press2(LOAD).
This displays the restore source data selection
screen (fx-9860G SD only).
•b ... Restore from storage memory
•c ... Restore from SD card
3. Pressb orc (fx-9860G SD only).
This displays the folder selection screen.
4. Usef andc to select a folder.
12-7-15 MEMORY Mode

8/20/2019 _Casio_fx9860GSD_9860G_E
http://slidepdf.com/reader/full/casiofx9860gsd9860ge 569/595
20050401
12-7-16 MEMORY Mode
5. Pressw.*1
• A message appears to confirm whether or not
you really want to restore the backed up data.
Press1(Yes) to restore the data and delete any data currently in the area.
Press6(No) to cancel the data backup operation.
The message “Complete!” appears when the restore operation is finished.
PressJ to return to the screen displayed in step 1.
*1The message “No Data” will appear if there is
no backup data stored in memory. Pressing
J will return the screen in step 1.

8/20/2019 _Casio_fx9860GSD_9860G_E
http://slidepdf.com/reader/full/casiofx9860gsd9860ge 570/595
20050401
12-7-17
MEMORY Mode
kOptimizing the Storage Memory or SD Card Memory
Storage memory or SD card memory can become fragmented after many store and load
operations. Fragmentation can cause blocks of memory to become unavailable for datastorage. Because of this, you should periodically perform the storage memory or SD card
optimization procedure, which rearranges the data in the storage memory or SD card and
makes memory usage more economical.
u To optimize the storage memory
1. On the initial MEMORY mode screen press
5(OPT) to optimize the storage memory.
2. Select the memory you want to optimize (fx-9860G
SD only).
•b ... storage memory
•c ... SD card
3. Pressb orc to start optimization.
The message “Complete!” appears when the optimize operation is complete.
PressJ to return to the initial MEMORY mode screen.
# In some cases, the amount of free memory
capacity may be unchanged when you checkit after performing the optimization procedure.
This does not indicate any problem with the
calculator.

8/20/2019 _Casio_fx9860GSD_9860G_E
http://slidepdf.com/reader/full/casiofx9860gsd9860ge 571/595

8/20/2019 _Casio_fx9860GSD_9860G_E
http://slidepdf.com/reader/full/casiofx9860gsd9860ge 572/595
20050401
13-1 Using an SD Card
Important!
• Always turn off the calculator before inserting or removing an SD card.
• Note that a card needs to be oriented correctly (proper side must be facing upwards, the
proper end must be inserted) when inserting it into the calculator. Trying to force card into
the slot while it is oriented incorrectly can damage the card and slot.
uRemoving the Dummy Card
• Your calculator is shipped from the factory with a dummy card inserted in the SD card slot.
Before using an SD card, first use the procedure under “To remove the SD card” on page
13-1-2 to remove the dummy card.
u To insert an SD card
1. Orient the SD card so its back is facing upwards (in the same direction as the
calculator keyboard).
2. Carefully insert the SD card into the calculator's SD card slot.
13-1-1Using an SD Card
Front Back
Important!
• Never insert anything other an SD cards into the SD card slot. Doing so can damage the
calculator.
• Should water or any foreign matter ever get into the SD card slot, immediately turn off the
calculator, remove its batteries, and contact your original retailer or nearest CASIO
authorized service center.

8/20/2019 _Casio_fx9860GSD_9860G_E
http://slidepdf.com/reader/full/casiofx9860gsd9860ge 573/595
20050401
13-1-2 Using an SD Card
u To remove the SD card
1. Press in on the SD card and then release it.
• This will cause the card to pop part way out of the slot.2. Grasp the SD card with your fingers and pull it out of the slot.
Important!
• Never remove the SD card while data is being transferred to it. Doing so not only stops the
data you are transferring to the card from being saved, it can also corrupt SD card
contents.
• Exerting undue force when removing an SD card can damage the card slot or the card.

8/20/2019 _Casio_fx9860GSD_9860G_E
http://slidepdf.com/reader/full/casiofx9860gsd9860ge 574/595
20050401
13-2 Formatting an SD Card
• Use the procedure under “11-4 Reset” to format an SD card.
13-2-1Formatting an SD Card

8/20/2019 _Casio_fx9860GSD_9860G_E
http://slidepdf.com/reader/full/casiofx9860gsd9860ge 575/595
20050401
13-3 SD Card Precautions during Use
• SD card problems can normally be corrected by reformatting the card. However, it is
always a good idea to take along more than one SD card to avoid data storage problems.
• Card formatting (initialization) is recommended before using a new SD card for the first
time.
• If an SD card has been formatted on a computer or other device, you can use it as-is
without reformatting. A computer or other device also will be able use an SD card that has
been formatted with the calculator.
• Never perform any of the following operations while the SD card is being accessed.
- Removing the SD card
- Connecting or disconnecting a USB cable
- Turning off the calculator
- When connected to a computer, exiting the FA-124 software or shutting down the
computer
• Note that an SD card needs to be oriented correctly (proper side must be facing upwards,
the proper end must be inserted) when inserting it into the calculator. Trying to force an SD
card into the slot when it is oriented incorrectly can damage the card and slot.
• Use of certain SD cards while calculator battery power is low can cause the display to go
blank without displaying the low battery warning message. If this happens, replace the
batteries.
kRecommended SD Card Types
Toshiba
SD-NA032MT SD-NA064MT SD-NA128MT SD-NA256MT
SD-NA512MT SD-FA128MT SD-FA256MT
SanDisk
SDSDB-64-J60 SDSDB-128-J60 SDSDB-256-J60
SDSDB-512-J60 SDSDH-256-903 SDSDH-512-903
For detailed information (specifications, features, etc.) about the SD card, contact the SD
card manufacturer.
13-3-1SD Card Precautions during Use

8/20/2019 _Casio_fx9860GSD_9860G_E
http://slidepdf.com/reader/full/casiofx9860gsd9860ge 576/595
20050401
Appendix1 Error Message Table
2 Input Ranges
3 Specifications4 Key Index
5 P Button (In case of hang up)
6 Power Supply
α

8/20/2019 _Casio_fx9860GSD_9860G_E
http://slidepdf.com/reader/full/casiofx9860gsd9860ge 577/595
20050401
Meaning
• Illegal syntax
• Attempt to input an illegal
command
• Calculation result exceeds the
display range.
• Calculation is outside the input
range of a function.
• Mathematical error (division by
zero, etc.)• Sufficient precision could not be
obtained for Σ calculation,
differential calculation, etc.
• Solution could not be obtained
for equation calculation, etc.
1 No corresponding Lbl n forGoto n.
2 No program stored in program
area Prog ”file name”.
• Nesting of subroutines by Prog
”file name” exceeds 10 levels.
• Execution of calculations thatexceed the capacity of thestack for numeric values orstack for commands.
Message
Syntax ERROR
Ma ERROR
Go ERROR
Nesting ERROR
Stack ERROR
Countermeasure
• PressJ to display the errorand make necessary correc-tions.
• Check input values and makecorrections to ensure thatvalues are within allowablelimits.
1 Correctly input a Lbl n to corres-pond to the Goto n , or deletethe Goto n if not required.
2 Store a program in program
area Prog ”file name”, or deletethe Prog ”file name” if notrequired.
• Ensure that Prog ”file name” isnot used to return fromsubroutines to main routine. Ifused, delete any unnecessaryProg ”file name”.
• Trace the subroutine jumpdestinations and ensure that no
jumps are made back to theoriginal program area. Ensurethat returns are made correctly.
• Simplify the formulas to keepstacks within 10 levels for thenumeric values and 26 levelsfor the commands.
• Divide the formula into two ormore parts.
α -1-1Error Message Table
1 Error Message Table

8/20/2019 _Casio_fx9860GSD_9860G_E
http://slidepdf.com/reader/full/casiofx9860gsd9860ge 578/595
20050401
MeaningMessage Countermeasure
α -1-2 Error Message Table
MemoryERROR
ArgumentERROR
DimensionERROR
Range ERROR
ConditionERROR
Non-RealERROR
ComplexNumber In List
Can’t Solve!Adjust initialvalue orbounds. Thentry again
• Operation or memory storageoperation exceeds remaining
memory capacity.
• Incorrect argument specificationfor a command that requires anargument.
• Illegal dimension used duringmatrix or list calculations.
1 Input of an improper V-Windowvalue.
2 V-Window range settingsexceeded when a graph isredrawn.
3 Input of an improper value on therange screen and use of thatvalue for execution.
4 The spreadsheet cell range wasexceeded by paste, recall, orother cell operation.
• Execution of a calculation orfunction before all conditionsrequired for execution are met.
• Calculation that produces acomplex number when Real isspecified for the Complex Mode
setting on the Setup screen, eventhough the argument is a realnumber.
• List containing complex numberused in a calculation or operationfor which complex number data isinvalid.
• A Solve calculation could notobtain a solution within thespecified range.
• Keep the number of memoriesyou use within the currently
specified number of memories.• Simplify the data you are trying
to store to keep it within theavailable memory capacity.
• Delete no longer needed datato make room for the new data.
• Correct the argument.
• Check the matrix or listdimension.
1 Change the V-Window value soit is within range.
2 Redraw using the propersettings.
3 Input a proper range value.
4 Repeat the procedure takingcare that the cell range is notexceeded.
• Check the conditions and makeany necessary corrections.
• Change the Complex Modesetting to something other thanReal.
• Change all data in the list toreal numbers.
• Change the specified range.• Correct the input expression.

8/20/2019 _Casio_fx9860GSD_9860G_E
http://slidepdf.com/reader/full/casiofx9860gsd9860ge 579/595
20050401
α -1-3 Error Message Table
MeaningMessage Countermeasure
No Variable
Com ERROR
TransmitERROR
ReceiveERROR
Memory Full
Time Out
Circular ERROR
PleaseReconnect
Too Many Data
FragmentationERROR
Invalid Name
• No variable specified within agraph function being used for
Dynamic Graph.• No variable within a Solve
equation.
• Problem with cable connectionor parameter setting duringprogram data communications.
• Problem with cable connectionor parameter setting during data
communications.
• Problem with cable connectionor parameter setting during datacommunications.
• Memory of receiving unitbecame full during programdata communications.
• A Solve calculation or integra-tion calculation was unable tosatisfy convergence conditions.
• There is a circular reference(such as “=A1” in cell A1) in thespreadsheet.
• The connection was droppedfor some reason while updatingthe operating system.
• The number of data items is toolarge.
• Memory must be optimizedbefore any more data can bestored.
• The file name you inputincludes invalid characters.
• Specify a variable for the graphfunction.
• Input a Solve equation thatincludes a variable.
• Check to make sure there isnothing wrong with the cableconnection, and that parametersare configured correctly.
• Check to make sure there isnothing wrong with the cable
connection, and that parametersare configured correctly.
• Check to make sure there isnothing wrong with the cableconnection, and that parametersare configured correctly.
• Delete some data stored in thereceiving unit and try again.
• If you are performing a Solvecalculation, try changing to theinitial default estimated value.
• If you are performing anintegration calculation, trychanging to a larger tol value.
• Change cell contents toremove the circular references.
• Reconnect and try again.
• Delete unneeded data.
• Optimize memory.
• Use the correct characters toinput a valid file name.

8/20/2019 _Casio_fx9860GSD_9860G_E
http://slidepdf.com/reader/full/casiofx9860gsd9860ge 580/595
20050401
α -1-4 Error Message Table
MeaningMessage Countermeasure
Invalid Type
StorageMemory Full
No Card*
SD Card Full*
Invalid file nameor folder name.*
Invalid Card*
Card isprotected*
Data ERROR
Card ERROR*
Data isprotected*
• An illegal data type is specified.
• The storage memory is full.
• There is no SD card loaded inthe calculator.
• The SD card is full.
• Data or folders that aresupported by this calculatorcannot be found on the SD card.
• A card that is not compatiblewith the calculator is loaded.
• The SD card is write protected.
• A data error occurred.
• An SD card error occurred.
• The Read Only attribute of theSD card loaded in the calculatorhas been turned on using acomputer, etc.
• Specify valid data.
• Delete unneeded data.
• Load an SD card.
• Delete unneeded data.
• Replace the card with one thatcontains data/folders that aresupported by this calculator.
• Replace the card with acompatible card.
• Remove write protection.
• Check to make sure you arewriting correct type of data andtry again.
• Remove and correctly insertthe SD card and try again. Ifthis error occurs again,re-format the SD card.
• Turn off the SD card’s ReadOnly attribute.
* fx-9860G SD only

8/20/2019 _Casio_fx9860GSD_9860G_E
http://slidepdf.com/reader/full/casiofx9860gsd9860ge 581/595
20061001
α -2-1
Input Ranges
2 Input Ranges
FunctionInput range for real
number solutions
Internal
digits Precision Notes
sin x
cos x
tan x
(DEG) | x| < 9 × (109)°
(RAD) | x| < 5 × 10⁷πrad
(GRA) | x| < 1 × 10¹⁰
grad
15 digits
As a rule,
precision is
±1 at the
10th digit.*
However, for tan x:
| x| ≠ 90(2n+1): DEG
| x| ≠ π /2(2n+1): RAD
| x| ≠ 100(2n+1): GRA
sin–1 x
cos–1 x
tan–1 x
| x| < 1
" "
| x| < 1 × 10100
sinh xcosh x
tanh x
| x| < 230.9516564
" "
Important! • sinh and tanh become
singular points when x = 0.In this vicinity, errorsbecome cumulative andaccuracy deteriorates.
| x| < 1 ×10100
sinh–1 x
cosh–1 x
tanh–1 x
| x| < 1 × 10100
" "1< x < 1 × 10100
| x| < 1
log x
In x1 × 10
–99 < x < 1 × 10
100
" "• Complex numbers can be
used as arguments.
10 x
e x
–1 × 10100
< x < 100
" " • Complex numbers can beused as arguments.
–1 × 10100
< x < 230.2585092
' x
x2
0 < x < 1 × 10100
" " • Complex numbers can beused as arguments.
| x| < 1 × 1050
1/ x
3' x
| x| < 1 × 10100
, x ≠ 0
" " • Complex numbers can beused as arguments.
| x| < 1 × 10100
x! 0 < x < 69
( x is an integer) " "
nPr
nCr
Result < 1 × 10100
n, r (n and r are integers)0 < r < n, n < 1 × 10
10" "
20070101

8/20/2019 _Casio_fx9860GSD_9860G_E
http://slidepdf.com/reader/full/casiofx9860gsd9860ge 582/595
20050401
α -2-2 Input Ranges
Pol ( x , y)
Rec
(r ,θ )
° ’ ”
←
° ’ ”
^( x y)
x y
ab /c
15 digits
"
"
"
"
"
As a rule,
precision is±1 at the
10th digit.*
"
"
"
"
"
However, for tanθ :
|θ | ≠ 90(2n+1): DEG
|θ | ≠ π /2(2n+1): RAD
|θ | ≠ 100(2n+1): GRA
|r | < 1 × 10100
(DEG) |θ | < 9 × (109)°
(RAD) |θ | < 5 × 10⁷π rad
(GRA) |θ | < 1 × 10¹⁰grad
|a|, b, c < 1 × 10100
0 < b, c
| x | < 1 × 10100
Sexagesimal display:
| x | < 1 × 10⁷
x > 0:
–1 × 10100 < y log x < 100
x = 0 : y > 0
x < 0 :
(m, n are integers)
However;
–1 × 10100 < y log | x | < 100
y > 0 : x ≠ 01–1 × 10100 < –– log y < 100 x
y = 0 : x > 0
y < 0 : x = 2n+1,
(m ≠ 0; m, n are integers)
However;1–1 × 10100 < –– log | y| < 100 x
Total of integer, numerator
and denominator must be
within 10 digits (includes
division marks).
*For a single calculation, calculation error is ±1 at the 10th digit. (In the case of exponential display,
calculation error is ±1 at the last significant digit.) Errors are cumulative in the case of consecutive
calculations, which can also cause them to become large. (This is also true of internal consecutive
calculations that are performed in the case of ^( x y), x y, x !, 3 x , nPr , nCr , etc.)
In the vicinity of a function’s singular point and point of inflection, errors are cumulative and may
become large.
FunctionInput range for realnumber solutions
Internaldigits
Precision Notes
< 1 × 10100 x 2 + y2
• Complex numbers can be
used as arguments.
• Complex numbers can beused as arguments.
m y = n, ––––2n+1
2n+1––––
m

8/20/2019 _Casio_fx9860GSD_9860G_E
http://slidepdf.com/reader/full/casiofx9860gsd9860ge 583/595
20050401
α -2-3 Input Ranges
Function
Binary,
octal,decimal,
hexadecimal
calculation
Input range
Values fall within following ranges after conversion:
DEC: –2147483648 < x < 2147483647BIN: 1000000000000000 < x < 1111111111111111 (negative)
0 < x < 111111111111111 (0, positive)
OCT: 20000000000 < x < 37777777777 (negative)
0 < x < 17777777777 (0, positive)
HEX: 80000000 < x < FFFFFFFF (negative)
0 < x < 7FFFFFFF (0, positive)

8/20/2019 _Casio_fx9860GSD_9860G_E
http://slidepdf.com/reader/full/casiofx9860gsd9860ge 584/595
20061001
α -3-1Specifications
3 Specifications
Variables: 28
Calculation range:
±1 × 10–99
to ±9.999999999 × 1099
and 0. Internal operations use 15-digit mantissa.
Exponential display range: Norm 1: 10–2
> | x |, | x | > 1010
Norm 2: 10–9
> | x |, | x | > 1010
Program capacity: 63000 bytes (max.)
Storage memory capacity: 1.5MB (max.)
Power supply:
Main: Four AAA-size batteries (LR03 (AM4))
Back-up: One CR2032 lithium battery
Power consumption: 0.7 W
Approximate battery life
Main:LR03 (AM4): 300 hours (continuous display of main menu)
220 hours continuous operation (5 minutes calculation, 55 minutes display)
90 hours when an SD card is used (fx-9860G SD only)
1 year (unused with power off)
• Any of the following can shorten battery life.
- Certain SD card types or frequent SD card access
- Sequential program calculation execution
- Certain battery types
Back-up: 5 years
Auto power off:
Power is automatically turned off approximately six minutes or 60 minutes after last operation.
Ambient temperature range: 0 °C to 40 °C
Dimensions: 24 mm (H) × 92.5 mm (W) × 184.5 mm (D)
1" (H) × 35
/ 8" (W) × 71
/ 4" (D)
20070101

8/20/2019 _Casio_fx9860GSD_9860G_E
http://slidepdf.com/reader/full/casiofx9860gsd9860ge 585/595
20050401
α -3-2 Specifications
Weight: fx-9860G SD
Approx. 265 g (including batteries)
fx-9860G
Approx. 260 g (including batteries)
Data Communications
3-pin serial port
Method: Start-stop (asynchronous), half-duplex
Transmission speed (BPS):
115200 bits/second (normal)
9600 bits/second (When connected to CFX-9850/fx-7400 series; Send/Receive
commands)
38400 bits/second (Send38k/Receive38k commands)
<115200 bits/second>
Parity: EVEN
Bit length: 8 bits
Stop bit:
Send: 1 bit
Receive: 1 bit
Includes parity (None) 1-bit
X ON/X OFF Control: None
<9600, 38400 bits/second>
Parity: None
Bit length: 8 bits
Stop bit:
Send: 3 bitsReceive: 2 bits
Includes parity (None) 1-bit
X ON/X OFF Control: None
USB portIn accordance with USB 1.1 standards

8/20/2019 _Casio_fx9860GSD_9860G_E
http://slidepdf.com/reader/full/casiofx9860gsd9860ge 586/595
20050401
α -4-1Key Index
4 Key Index
G↔T
6
Key Primary Function Combined with!Combined with
Key Primary Function Combined withCombined with
a
!a
Trace
1
Zoom
2
V-Window
Sketch
3 Selects 3rd function menu item.Displays V-Windowparameter input screen.
Performs sketch operation.
Shows the Setup screen.
4Selects 4th function menu item.
G-Solv
5Performs G-Solve operation.Selects 5th function menu item.
Selects 6th function menu item.Switches display betweengraph and text screens.
!Activates shift functions of other
keys and function menus.
SET UP
K
PRGM
J
Displays option menu.
m Returns to the Main Menu.
Press after entering value tocalculate square.
A -LOCK
aAllows entry of alphanumericcharacters shown in red.
Locks entry of alpha-numeric characters.
Press before entering valueto calculate square root.
r
x
Displays the variable data menu.Displays program commandmenu.
Enterscharacter r .
θ
M
Press between two values tomake second value exponent offirst.
Press between enteringLinear Input Mode:
values for X & Y to show x throot of y.
Enterscharacter .θ
QUIT
JBack steps to the previous screen
without making any changes.
Returns directly to initial
Math Input Mode:Enters ( ) in naturalinput format.
screen of the mode.
x
Selects 1st function menu item. Performs trace operation.
Selects 2nd function menu item. Performs zoom operation.
Scrolls one screen up inthe e •ACT or RUN • MAT (Math input mode) mode.
fMoves cursor upward. Scrolls screen.Switches to previous function intrace mode.
w

8/20/2019 _Casio_fx9860GSD_9860G_E
http://slidepdf.com/reader/full/casiofx9860gsd9860ge 587/595
20050401
α -4-2 Key Index
(
H
F
Key Primary Function Combined with!Combined witha
eMoves cursor to right. Scrollsscreen. Press afterw to displaycalculation from beginning.
A
vAllows input of variable X, θ , and
T.Enters letter A.
10 x B
lPress before entering value tocalculate common logalithm.
Press before entering
Makes contrast lighter.
Makes contrast darker.
Enters the operator (∠) forcomplex number polarformat input.
exponent value of 10.Enters letter B.
e x C
sin–1 D
cos–1 E
tan–1
F
IPress before entering value tocalculate natural logarithm.
Press before enteringexponent value of e.
Enters letter C.
sPress before entering value tocalculate sine.
Press before entering valueto calculate inverse sine.
Enters letter D.
cPress before entering value tocalculate cosine.
Press before entering valueto calculate inverse cosine.
Enters letter E.
tPress before entering value tocalculate tangent.
Press before entering valueto calculate inverse tangent.
Enters letter F.
G
$
Linear input mode:Press between entering fraction values.Math input mode:Enters an improper fraction ( )in natural input format.
Converts fraction to decimal.
Inputs a mixed fraction.(Enabled only for the Mathinput mode.)
Enters letter G.
Enters letter H.
I( Enters open parenthesis informula. Press before entering valueto calculate cube root. Enters letter I.
x–1 J
)Enters close parenthesis informula.
Press after entering value tocalculate reciprocal.
Transitions from an applicationlaunched from an eActivity toanother application. (Enabledonly in an eActivity.)
Toggles between an eActivityand the screen of an application
launched from the eActivity.(Enabled only in an eActivity.)
Enters letter J.
K
, Enters comma. Enters letter K.
L
a
Assigns value to an Alpha memory
name. Enters letter L.
3
Converts between animproper fraction andmixed fraction.
dMoves cursor to left. Scrollsscreen. Press afterw to displaycalculation from end.
∠
Scrolls one screen down in
the e •ACT or RUN • MAT (Math input mode) mode.c
Moves cursor downward. Scrolls
screen. Switches to next function intrace mode.
Captures the current screento Capture memory.
MCAPTURE
h Enters number 7. Enters letter M.
(

8/20/2019 _Casio_fx9860GSD_9860G_E
http://slidepdf.com/reader/full/casiofx9860gsd9860ge 588/595
20050401
α -4-3 Key Index
Key Primary Function Combined with!Combined witha
INS
D
Insert mode:Backspace function.Overwrite mode:Deletes the character at the cursorposition.
OFF
oTurns power on.Clears the display.
Turns power off.
Linear input mode:Toggles between the insertmode and overwrite mode.Math input mode:With natural input, inserts afunction into an existing ex-pression (see page 1-3-13).
Displays the catalog function list.
Pastes the character stringthat is on the clipboard.
P
e Enters number 4. Enters letter P.
Q
f Enters number 5. Enters letter Q.
R
g Enters number 6. Enters letter R.
{ S
*Multiplication function. Enters open curly bracket. Enters letter S.
} T
/Division function. Enters close curly bracket.
Inputs List command.
Inputs Mat command.
Enters letter T.
UList
Mat
bEnters number 1. Enters letter U.
V
c Enters number 2. Enters letter V.
W
d Enters number 3. Enters letter W.
[ X
+
Addition function.
Specifies positive value.Enters open bracket. Enters letter X.
] Y
-Subtraction function.Specifies negative value.
Enters close bracket.
Inputs imaginary numberunit.
Enters letter Y.
i Z
aEnters number 0. Enters letter Z.
= SPACE
.Enters decimal point. Enters character =.
Enters a blank
Enters doublequotation mark.
space.
π ”
EEnables entry of exponent.
Inputs value of pi.Enters pi symbol.
Ans
-Enter before value to specify asnegative.
Recalls most recentcalculation result.
_
w Displays result of calculation. Inputs a new line.
O
jEnters number 9. Enters letter O.
Changes the shape of the
cursor to indicate that theclipboard function is enabled.
NCLIP
PASTE
CATALOG
i Enters number 8. Enters letter N.

8/20/2019 _Casio_fx9860GSD_9860G_E
http://slidepdf.com/reader/full/casiofx9860gsd9860ge 589/595
20050401
α -5-1P Button (In case of hang up)
5 P Button (In case of hang up)
Pressing the P button resets the calculator to its initial defaults.
Warning!
Never perform this operation unless you want to totally clear the memory of the calculator. Ifyou need the data currently stored in memory, be sure to write it down somewhere before
performing the P button operation.
• Pressing the P button while a calculation operation is being performed (while the
calculator is performing a calculation internally) deletes all data in memory.
• You can also reset the calculator using front panel key operations (see 11-4 Reset). Use
the P button to reset only while the front panel keys are disabled for some reason.
P button

8/20/2019 _Casio_fx9860GSD_9860G_E
http://slidepdf.com/reader/full/casiofx9860gsd9860ge 590/595
20050401
α -6-1Power Supply
6 Power Supply
This calculator is powered by four AAA-size (LR03 (AM4)) batteries. In addition, it uses a
single CR2032 lithium battery as a back up power supply for the memory.
If the following message appears on the display, immediately turn off the calculator and
replace main batteries as instructed.
If you try to continue using the calculator, it will automatically turn off in order to protect
memory contents. You will not be able to turn power back on until you replace batteries.
Be sure to replace the main batteries at least once every one year, no matter how much you
use the calculator during that time.
The batteries that come with this calculator discharge slightly during shipment and storage.
Because of this, they may require replacement sooner than the normal expected battery life.
Warning!
Main memory contents will be deleted if you remove both the main power supply and thememory back up batteries at the same time. If you ever remove both batteries, correctly
reload them and then perform the reset operation.

8/20/2019 _Casio_fx9860GSD_9860G_E
http://slidepdf.com/reader/full/casiofx9860gsd9860ge 591/595
20050401
kReplacing Batteries
Precautions:
Incorrectly using batteries can cause them to burst or leak, possibly damaging the interior ofthe calculator. Note the following precautions:
• Be sure that the positive (+) and negative (–) poles of each battery are facing in the proper
directions.
• Never mix batteries of different types.
• Never mix old batteries and new ones.
• Never leave dead batteries in the battery
compartment.
• Remove the batteries if you do not plan
to use the calculator for long periods. • Never try to recharge the batteries
supplied with the calculator.
• Do not expose batteries to direct heat,
let them become shorted, or try to take
them apart.
(Should a battery leak, clean out the battery compartment of the calculator immediately,
taking care to avoid letting the battery fluid come into direct contact with your skin.)
Keep batteries out of the reach of small children. If swallowed, consult with a physicianimmediately.
uTo replace the main power supply batteries
• Never remove the main power supply and the memory back up batteries from the calcula-
tor at the same time.
• Never turn on the calculator while the main power supply batteries are removed or not
loaded correctly. Doing so can cause memory data to be deleted and malfunction of the
calculator. If mishandling of batteries causes such problems, correctly load batteries andthen perform the RESET operation to resume normal operation.
• Be sure to replace all four batteries with new ones.
Turning off the calculator while editing an eActivity and then changing batteries can cause
the data you are editing to be deleted. Be sure to save the eActivity data before turning
off the calculator and changing batteries.
α -6-2 Power Supply
20060601

8/20/2019 _Casio_fx9860GSD_9860G_E
http://slidepdf.com/reader/full/casiofx9860gsd9860ge 592/595
20050401
1. Press!o(OFF) to turn off the calculator.
Warning!
• Be sure to turn the calculator off before replacing batteries. Replacing batteries withpower on will cause data in memory to be deleted.
2. Making sure that you do not accidently press theo key, slide the case onto the
calculator and then turn it over.
3. Remove the back cover from the calculator by
1
pulling with your finger at the point marked1.
4. Remove the four old batteries.
5. Load a new set of four batteries, making sure that
their positive (+) and negative (–) ends are facing inthe proper directions.
6. Replace the back cover.
7. Turn the calculator front side up and slide off its case.
Next, presso to turn on power.
α -6-3 Power Supply
# Power supplied by memory back up battery
while the main power supply batteries are
removed for replacement retains memory
contents.
# Do not leave the calculator without main power
supply batteries loaded for long periods.
Doing so can cause deletion of data stored in
memory.# If the figures on the display appear too light and
hard to see after you turn on power, adjust the
contrast.

8/20/2019 _Casio_fx9860GSD_9860G_E
http://slidepdf.com/reader/full/casiofx9860gsd9860ge 593/595
20050401
uTo replace the memory back up battery
• Before replacing the memory back up battery, check to make sure the main batteries
are not dead.
• Never remove the main power supply and the memory back up batteries from the
calculator at the same time.
• Be sure to replace the back up power supply battery at least once 5 years, regardless of
how much you use the calculator during that time. Failure to do so can cause data in
memory to be deleted.
1. Press!o(OFF) to turn off the calculator.
Warning!
• Be sure to turn the calculator off before replacing battery. Replacing battery withpower on will cause data in memory to be deleted.
2. Making sure that you do not accidently press theo key, slide the case onto the
calculator and then turn it over.
3. Remove the back cover from the calculator by 1
pulling with your finger at the point marked1.
4. Remove screwi on the back of the calculator, and
remove the back up battery compartment cover.
5. Insert a thin, pointed non-metal object (such as a
toothpick) into the hole makedj and remove the oldbattery.
α -6-4 Power Supply
AB

8/20/2019 _Casio_fx9860GSD_9860G_E
http://slidepdf.com/reader/full/casiofx9860gsd9860ge 594/595
20050401
6. Wipe off the surfaces of a new battery with a soft,
dry cloth. Load it into the calculator so that its positive
(+) side is facing up.
7. Install the back up battery compartment cover onto the
calculator and secure it in place with the screw.
Next, replace the back cover.
8. Turn the calculator front side up and slide off its case.
Next, presso to turn on power.
kAbout the Auto Power Off Function
Calculator power turns off automatically if you do not perform any operation within the Auto
Power Off trigger time you specify. You can specify either six minutes or 60 minutes as the
trigger time (see “APO Settings” on page 11-2-1). To restore power, presso.
α -6-5 Power Supply

8/20/2019 _Casio_fx9860GSD_9860G_E
http://slidepdf.com/reader/full/casiofx9860gsd9860ge 595/595


