Cashmore Oaklea
60
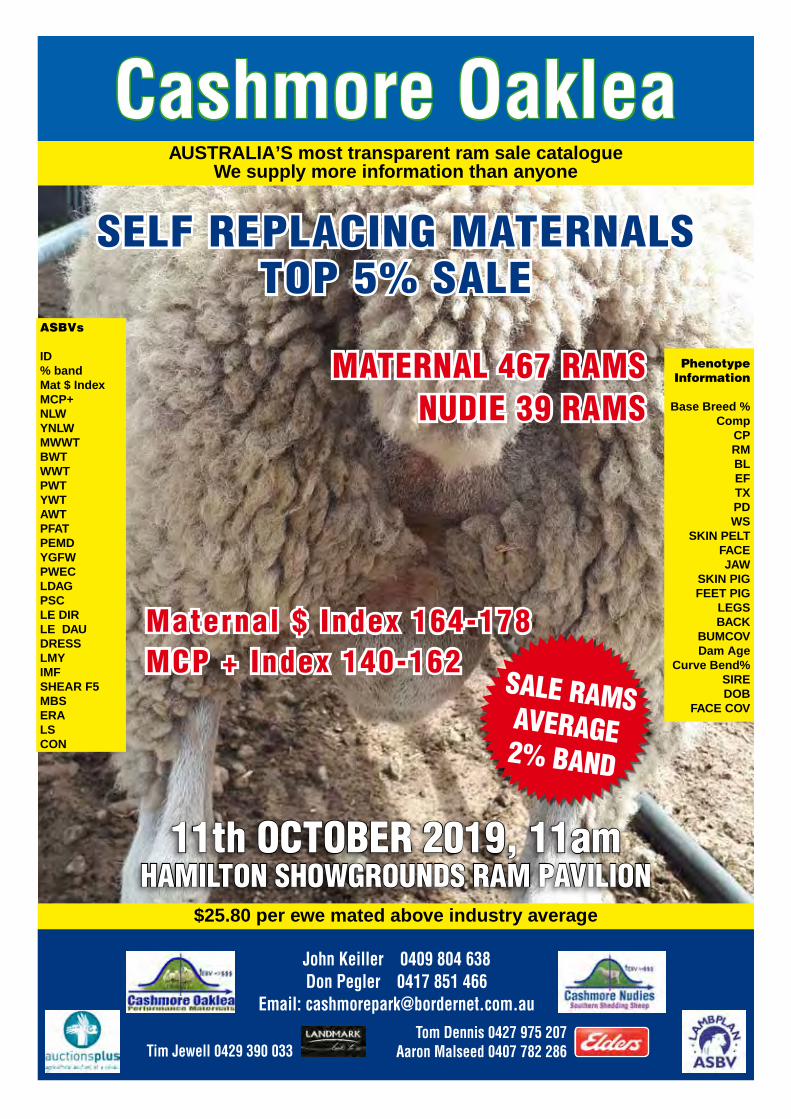
SELF REPLACING MATERNALS TOP 5% SALE Cashmore Oaklea ASBVs ID % band Mat $ Index MCP+ NLW YNLW MWWT BWT WWT PWT YWT AWT PFAT PEMD YGFW PWEC LDAG PSC LE DIR LE DAU DRESS LMY IMF SHEAR F5 MBS ERA LS CON AUSTRALIA’S most transparent ram sale catalogue We supply more information than anyone $25.80 per ewe mated above industry average Phenotype Information Base Breed % Comp CP RM BL EF TX PD WS SKIN PELT FACE JAW SKIN PIG FEET PIG LEGS BACK BUMCOV Dam Age Curve Bend% SIRE DOB FACE COV 11 th OCTOBER 2019, 11 am HAMILTON SHOWGROUNDS RAM PAVILION SALE RAMS AVERAGE 2% BAND Maternal $ Index 164-178 MCP + Index 140-162 MATERNAL 467 RAMS NUDIE 39 RAMS John Keiller 0409 804 638 Don Pegler 0417 851 466 Email: [email protected] Tim Jewell 0429 390 033 Tom Dennis 0427 975 207 Aaron Malseed 0407 782 286
Transcript of Cashmore Oaklea
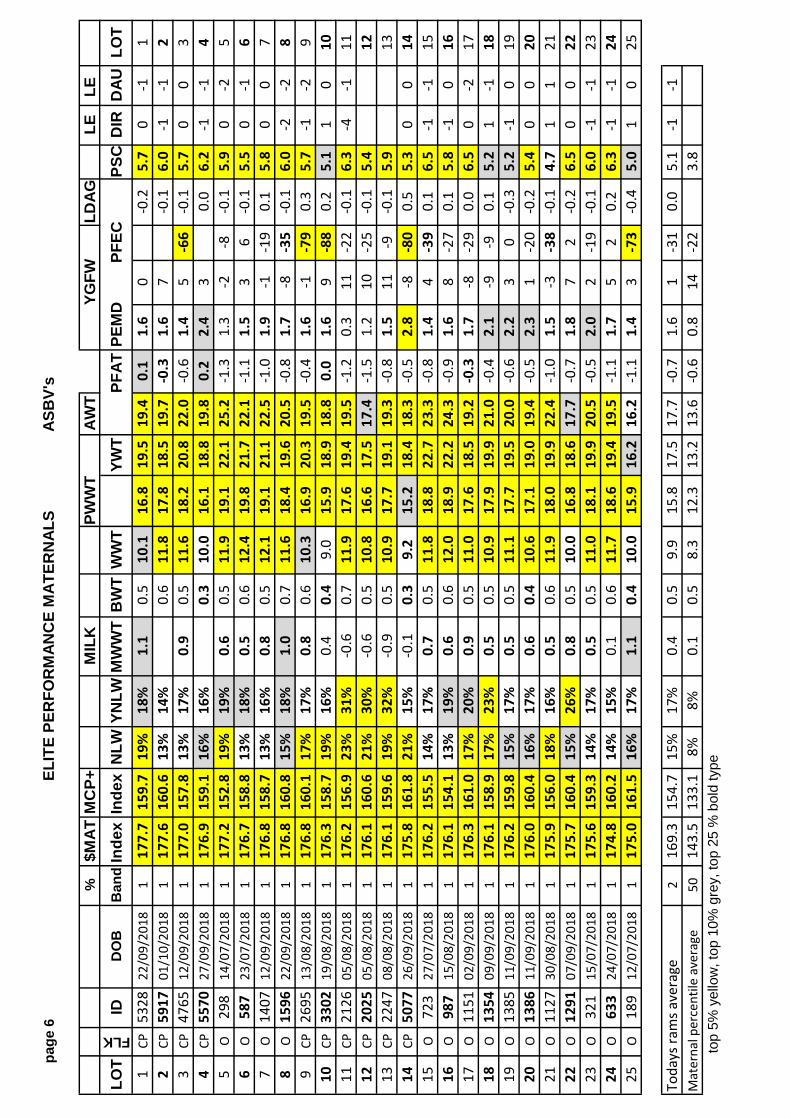
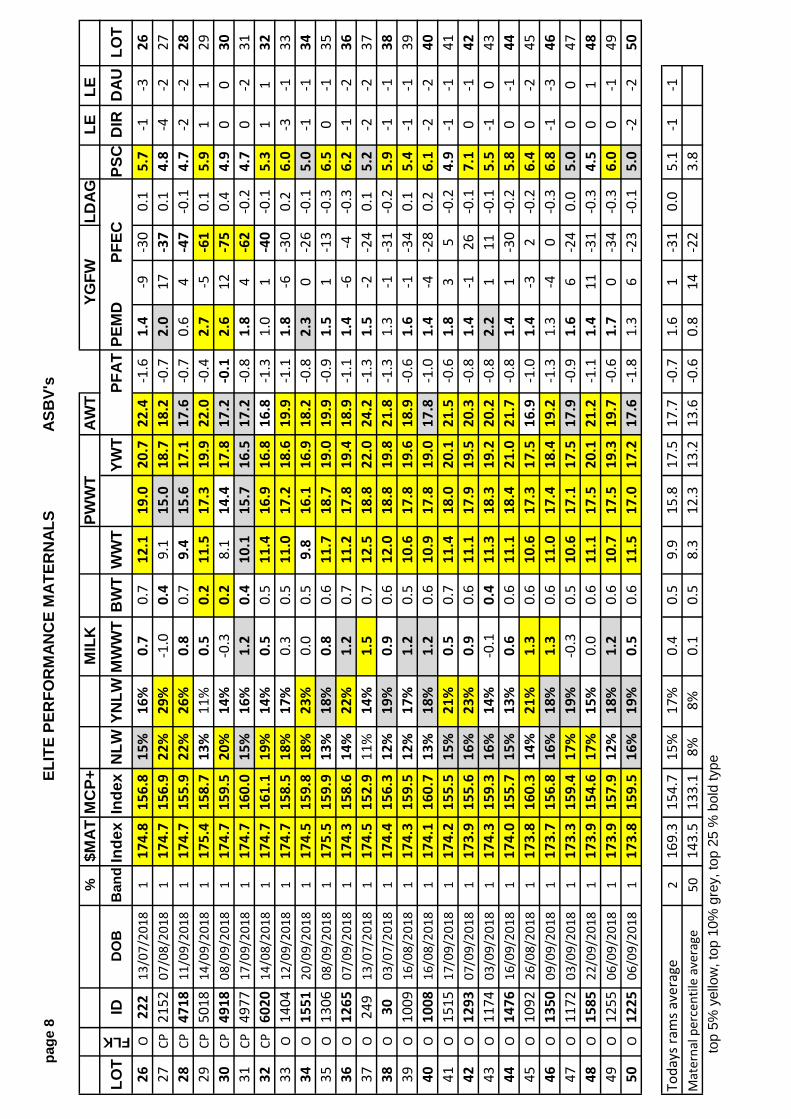
SELF REPLACING MATERNALSTOP 5% SALE
Cashmore Oaklea
ASBVs
ID% bandMat $ IndexMCP+NLWYNLWMWWTBWTWWTPWTYWTAWTPFATPEMDYGFWPWECLDAGPSCLE DIRLE DAUDRESSLMYIMFSHEAR F5MBSERALSCON
AUSTRALIA’S most transparent ram sale catalogue We supply more information than anyone
$25.80 per ewe mated above industry average
Phenotype Information
Base Breed %Comp
CPRMBLEFTXPDWS
SKIN PELTFACEJAW
SKIN PIGFEET PIG
LEGSBACK
BUMCOVDam Age
Curve Bend%SIREDOB
FACE COV
11th OCTOBER 2019, 11amHAMILTON SHOWGROUNDS RAM PAVILION
SALE RAMS AVERAGE 2% BAND
Maternal $ Index 164-178MCP + Index 140-162
MATERNAL 467 RAMSNUDIE 39 RAMS
John Keiller 0409 804 638Don Pegler 0417 851 466
Email: [email protected]
Tim Jewell 0429 390 033Tom Dennis 0427 975 207
Aaron Malseed 0407 782 286
Welcome to the 2019 Cashmore Oaklea Ram Sale VENDORS:
Cashmore Park John and Brigita Keiller, 114 Wilmots Rd, Cashmore, VIC, 3305 Ph: (03) 55265274, Mobile: 0409 804 638, Office: (03) 55265248 [email protected] www.cashmorepark.com.au
Oaklea Don and Ann Pegler, PO Box 1018, Mt Gambier, SA, 5290 Mobile: 0417 851 466 [email protected] www.oaklea.com.au AGENT REBATES: A Rebate of 3% to outside agents in attendance and settle on clients behalf within 7 days. Other process at principal’s discretion. SEMEN INTERESTS: Rams sold by Cashmore Oaklea are physical ownership only. Semen may be collected by you but only used within your own flock. If the need to collect semen arises Cashmore Oaklea will do so at our expense at a time that is convenient to the owner. HEALTH: Cashmore Oaklea commenced Gudair Vaccinations in 2003 to all sheep and rams are third generation approved vaccinates. SA now requires sheep entering that state to be from tested flocks. Cashmore Park has conducted a pooled Fecal 350 test twice, tested negative and has full access to all states. The Oaklea rams are free to enter Victoria, via the ram shed and then return to SA. Sheep health statements will be available on the day of the sale and are also included at the back of this catalogue. Ovine Brucellosis Free Accredited Flock # 3353 AUCTIONS PLUS will be operating on the first 100 and last 39 lots. CATALOGUE ASSISTANCE: This catalogue is also listed on our websites, the Ram Select site and the Lambplan web page where you can view pedigrees and accuracies. It can also be emailed in excel or PDF format. RAM SELECTION ASSISTANCE: For ram selection assistance please contact Don or John who will be happy to help. RUN DATE: EBV’s have been generated from the 1/9/2019 Maternal data sets. DISCLAIMER: The information in this catalogue is true and correct to the best of our knowledge and supplied in good faith. All recommendations are made without guarantee and Cashmore Oaklea disclaim any liability in connection with the use of this information. SALE RAMS: This year we are offering 467 Performance Maternal rams all in the top 5 percentile on Maternal $ index and averaging the top 2 percentile band. Artificial insemination, embryo transfer and our expanding seedstock flock is allowing growth in supply, performance and type. By using the computer mating tool, MateSel we can provide rams with a diverse background and low inbreeding coefficients which cover a large range of traits suitable for most market specifications.
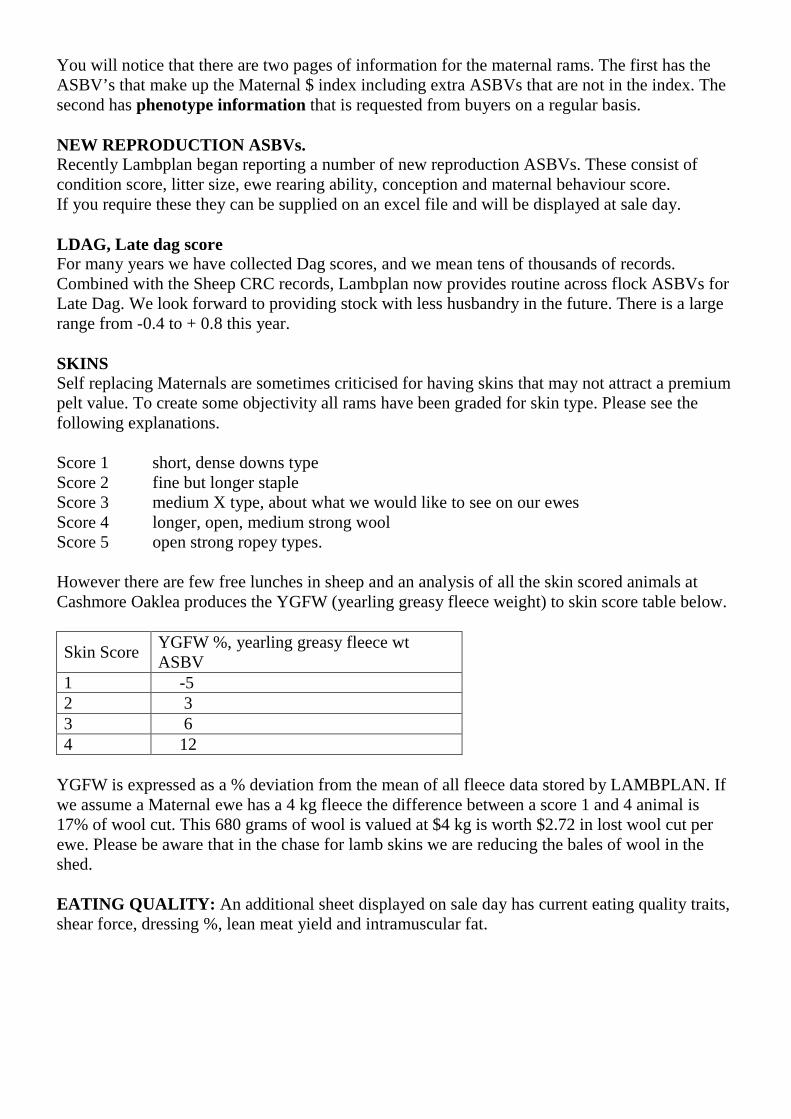
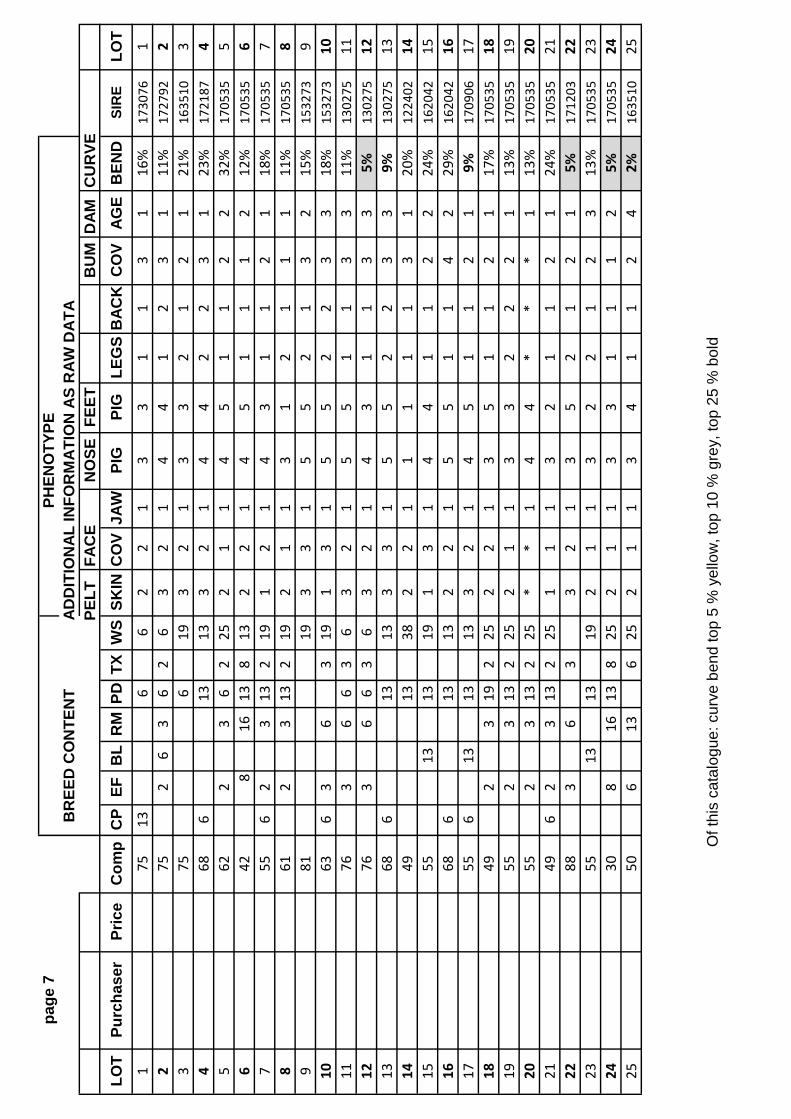
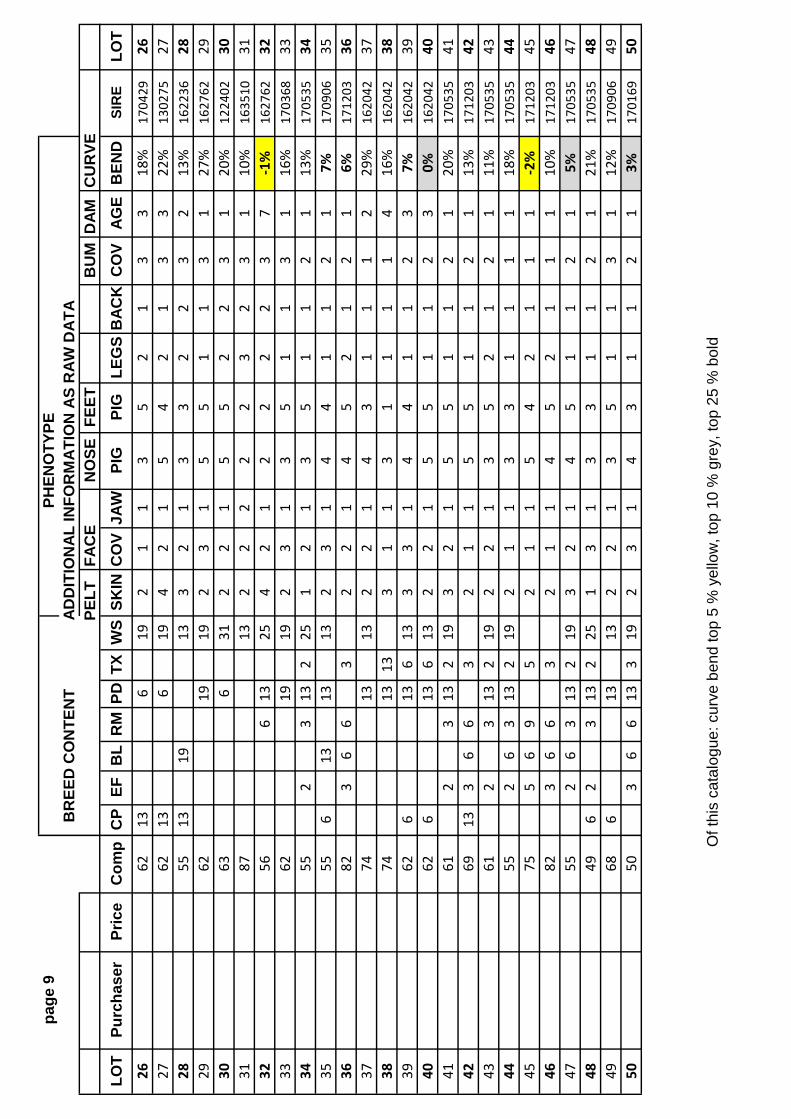
You will notice that there are two pages of information for the maternal rams. The first has the ASBV’s that make up the Maternal $ index including extra ASBVs that are not in the index. The second has phenotype information that is requested from buyers on a regular basis. NEW REPRODUCTION ASBVs. Recently Lambplan began reporting a number of new reproduction ASBVs. These consist of condition score, litter size, ewe rearing ability, conception and maternal behaviour score. If you require these they can be supplied on an excel file and will be displayed at sale day. LDAG, Late dag score For many years we have collected Dag scores, and we mean tens of thousands of records. Combined with the Sheep CRC records, Lambplan now provides routine across flock ASBVs for Late Dag. We look forward to providing stock with less husbandry in the future. There is a large range from -0.4 to + 0.8 this year. SKINS Self replacing Maternals are sometimes criticised for having skins that may not attract a premium pelt value. To create some objectivity all rams have been graded for skin type. Please see the following explanations. Score 1 short, dense downs type Score 2 fine but longer staple Score 3 medium X type, about what we would like to see on our ewes Score 4 longer, open, medium strong wool Score 5 open strong ropey types. However there are few free lunches in sheep and an analysis of all the skin scored animals at Cashmore Oaklea produces the YGFW (yearling greasy fleece weight) to skin score table below.
Skin Score YGFW %, yearling greasy fleece wt ASBV
1 -5 2 3 3 6 4 12
YGFW is expressed as a % deviation from the mean of all fleece data stored by LAMBPLAN. If we assume a Maternal ewe has a 4 kg fleece the difference between a score 1 and 4 animal is 17% of wool cut. This 680 grams of wool is valued at $4 kg is worth $2.72 in lost wool cut per ewe. Please be aware that in the chase for lamb skins we are reducing the bales of wool in the shed. EATING QUALITY: An additional sheet displayed on sale day has current eating quality traits, shear force, dressing %, lean meat yield and intramuscular fat.
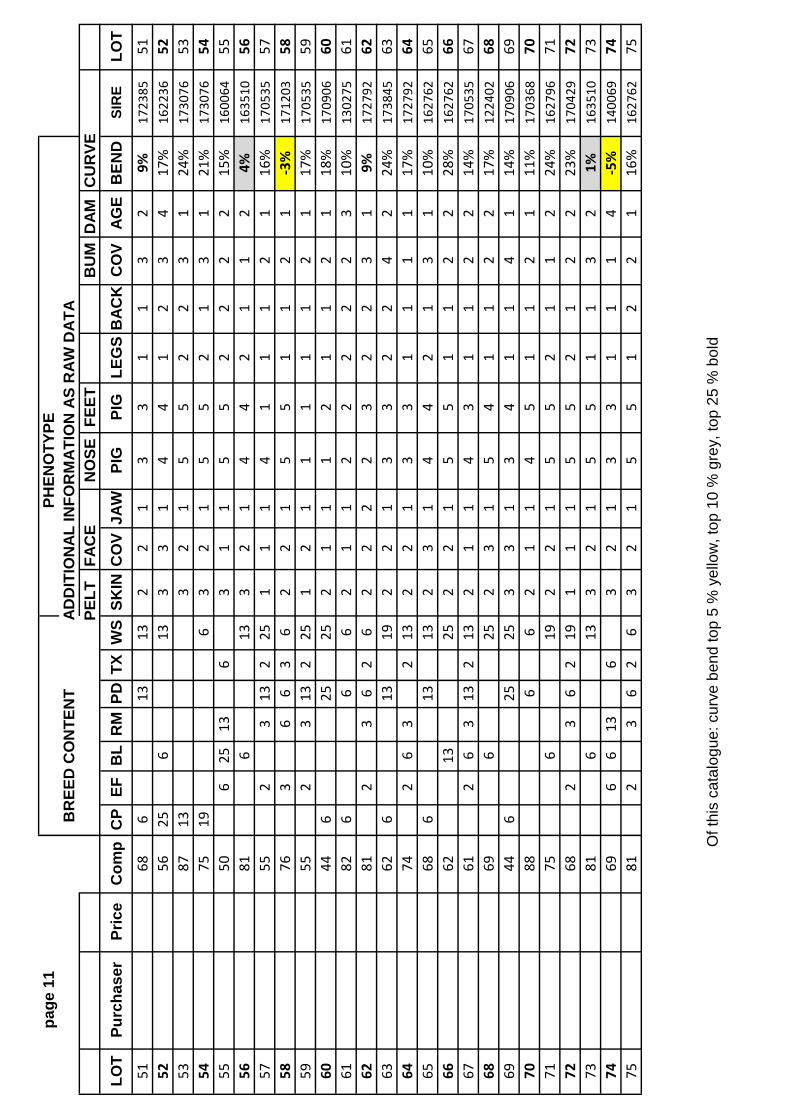
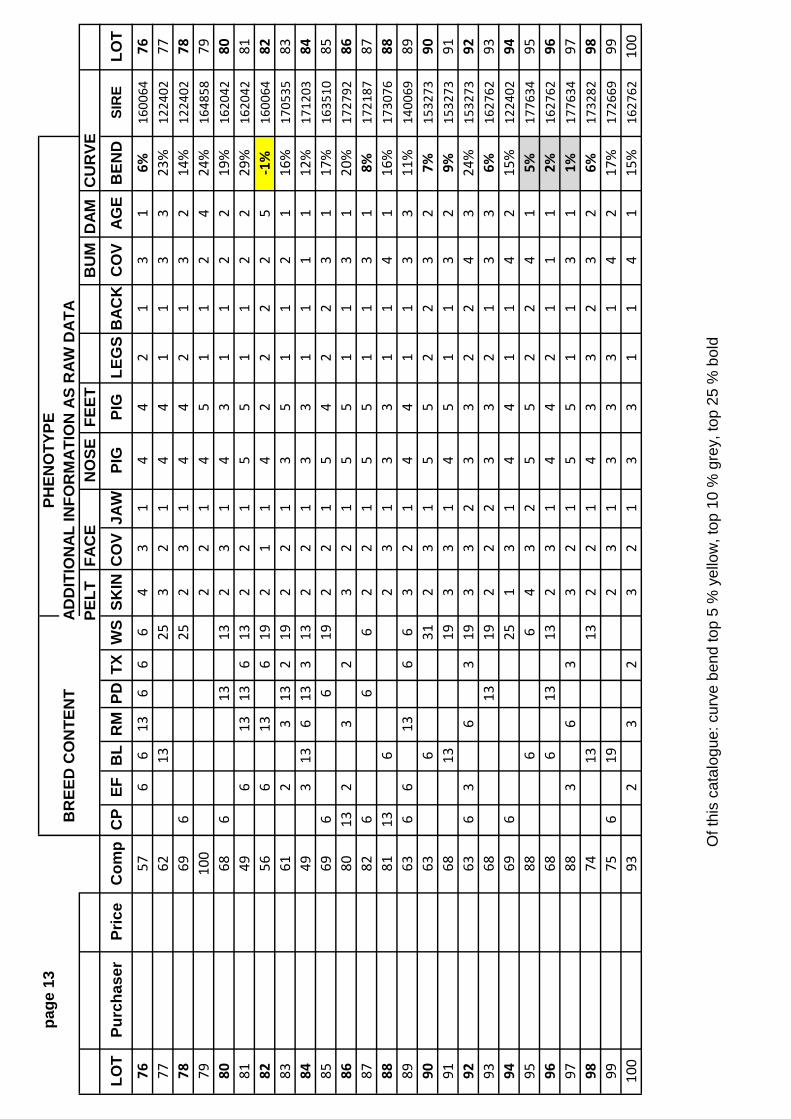
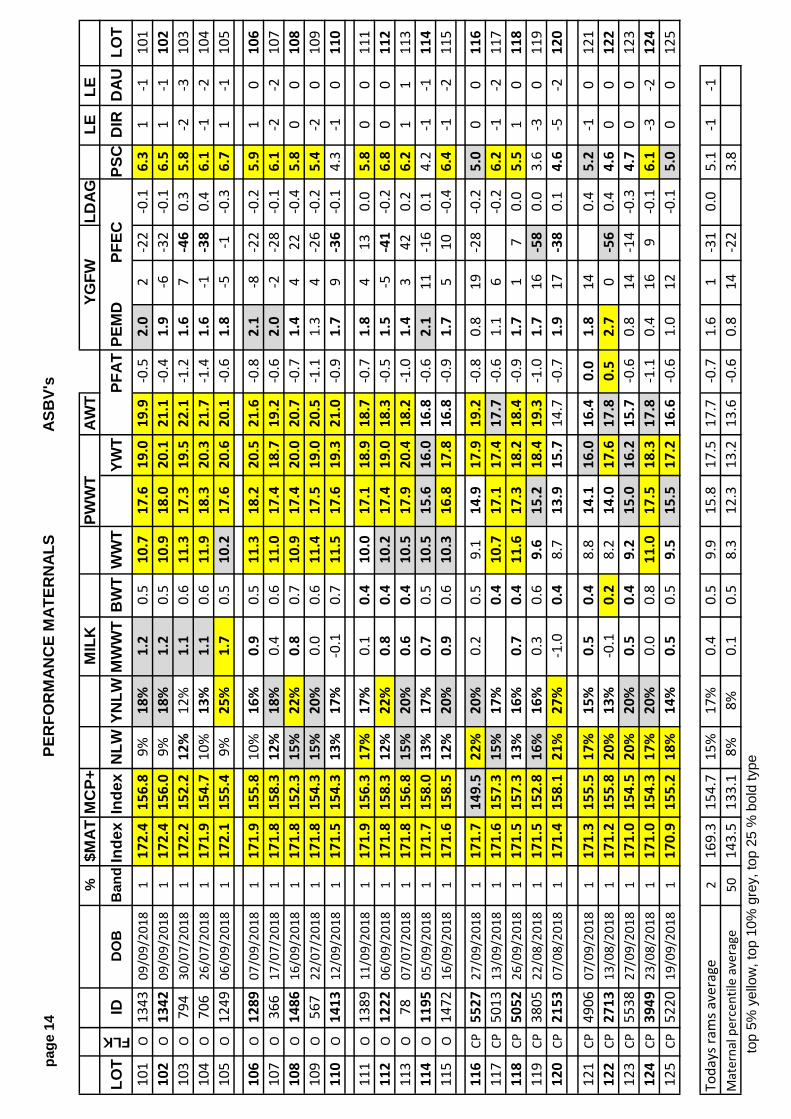
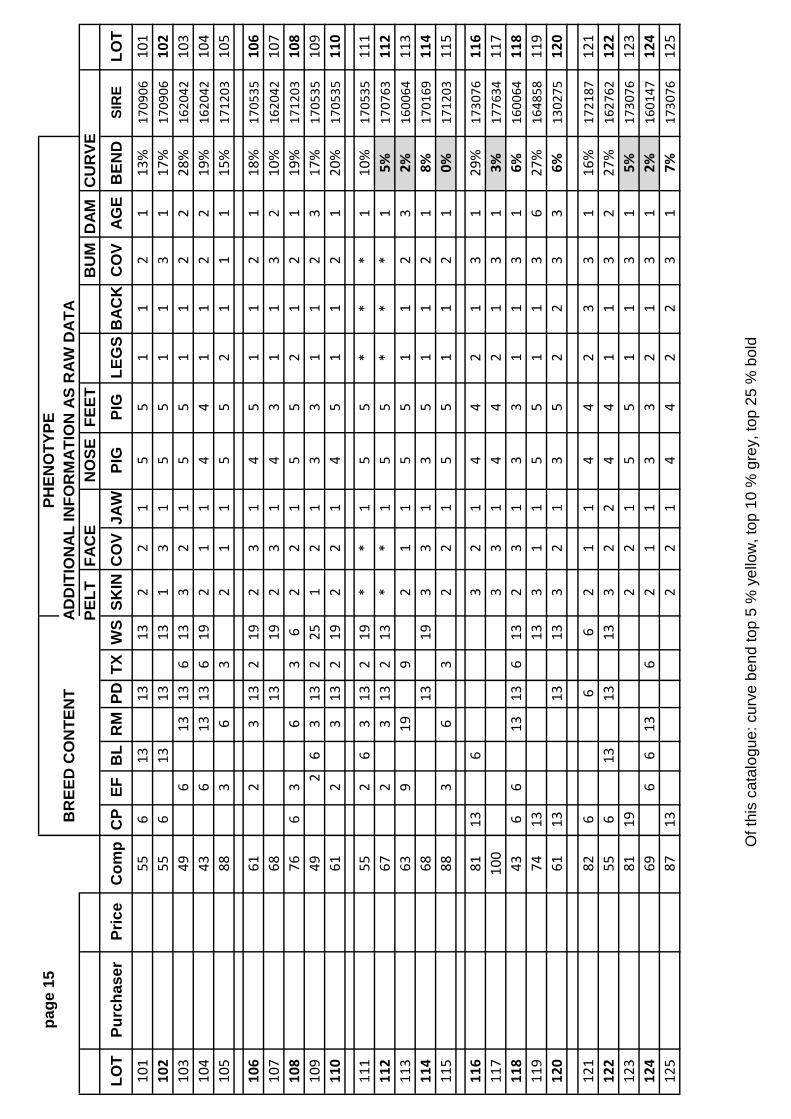
VISUAL SCORES MLA and AWI have produced an excellent booklet titled “Visual Sheep Scores” which has a system for classifying the sheep phenotype, i.e. what it looks like. All rams have been scored and at this stage raw data is supplied. We envisage that with more data to hand we can provide this information in ASBV form which is much more powerful. To save time in the ram shed please obtain the sale catalogue in excel format and as an example, if you require dark noses, sort on SPIG, skin pigment and then just look at these in the shed. This initiative has come from you the customer so please forward feedback. Already we have found it an excellent piece of data to assist in sorting and lotting. It should be just as useful at home studying the catalogue to save time and increase purchase value on sale day. CURVE BEND % This information comes in the form of a simple ratio and we stress that it is not an ASBV. Don and I sometimes field comments that sheep are getting too large and heavy, however we have found very few clients are actually using the adult weight ASBV to make their sheep smaller! There is a current attempt by breeders to bend the growth curve downward which simply means a sheep grows fast to a required weight/stage of life then growth slows so it does not become large with high maintenance requirements in later life. It is somewhat hard looking at the difference between Post weaning weight and Adult weight and judging the growth curve of an animal. To assist this the ratio allows us to see that a 50 % percentile PWWT animal is 9.2 and at Adult 10.9. The animal adds 18 % to its PWWT weight EBV to get to its Adult weight. Animals below this number exhibit a slowing growth curve after post weaning stage. Our better animals have high early growth and a moderate ewe weight. LAMBING EASE DIRECT AND DAUGHTERS Lambing ease direct and lamb ease daughters ASBVs are also offered. Please read the explanations in the back of the catalogue. We continue to make gains in this area with our ewes being very easy lambing.
PERFORMANCE RECORDING COMPOSITES: WHY DO WE USE THEM? Cashmore and Oaklea Composites are based on sound genetic and economic principles. First and foremost they are performance recorded which is our guarantee that the genes we supply to you will improve each year. In the past 5 years, this has averaged 3.16 index points per year. Our second goal is to make the animals as composite as possible, resulting in hybrid vigor, or heterosis. Heterosis produces a level of performance above the average of the base parents. It comes at no cost, and has a larger effect on fitness or female related traits, such as number of lambs weaned and milk yield. In these traits the increase can be as high as 12 % while in growth and carcass traits it may be 8 %. At these levels it adds substantially to the performance of the animal and farm profits. The reason we run composites is to quickly access and multiply up new genes that may be required if market specifications change. A good example of this is value based lamb payment systems requiring better muscled carcasses. If you are a pure breeder you need to search within your breed to find better muscled animals. As composite breeders Cashmore Oaklea simply acquires these genes from elsewhere and multiplies them through our flocks. This open approach allows us, as the seedstock breeder, to find genes and deliver them to you, our clients, much faster.

MATERNAL COMPOSITES: We continue to source genes from other maternal breeders and from the best families from the following breeds, Coopworth, East Friesian, Finn, Border Leicester, South African Meat Merino, Texel, Poll Dorset, White Suffolk, Merino, Corridale, NZ Romney and Perendale. All have been identified from Lambplan ASBV’s and New Zealand’s sheep improvement program. These genes have been used by AI and ET after using the Mate Sel computer program to allocate matings. This has resulted in more accurate ASBV’s and faster use of the best new genes in the program. We continue to expand our program with 6000 maternal lambs tagged at birth in 2019. EARLY LAMBING FLOCKS i.e. (April - May) This is a requirement where the seasonal pattern of pasture growth is earlier and growing season shorter than that experienced in higher rainfall southern areas. Early lambing may require a percentage of “pink nose” in the mix as these breeds show a wider breeding season. You may also select rams from either flock that have an early date of birth, DOB. NUDIES In 2003 we commenced breeding self replacing easy care sheep with wool shedding ability, high parasite resistance and tough feet. Our aim is to have sheep with similar characteristics to our Maternals with the benefits of no wool. Grading sheep up from our maternal flock to increase genetic diversity and add greater performance has increased ewe numbers to 1000. Only the best rams are offered each year with attention to type and structure slowing performance a little but ensuring a robust animal comes out of the program. The Nudies are run with all the other seedstock in the same contemporary groups so we get a valid performance comparison. HOW TO USE THIS CATALOGUE Ear tag number Oaklea Maternal 1 to 1999 Cashmore Maternal 2001 to 6555 Cashmore Nudie 7502 to 8483
FLK O = Oaklea, CP = Cashmore Park ID Rams are identified with 4 digit Lambplan codes that will allow you to obtain
updates on EBV’s at any stage in the animal’s life. Add 150099201818 to maternal rams Ids for the Lambplan number. Search the Lambplan website and enter their tag number. http://www.sheepgenetics.org.au/lambplan/
INDEX Calculated from some ASBV’s and market returns for meat, wool and extra lambs it
gives an estimated value of the animals performance. For Maternals each Maternal $ index point returns $1 per ewe mated.
For each Maternal Carcass Plus point returns $1 per ewe mated. PERCENTILE BAND %
50% value is where there are equal numbers of animals above and below this point

EBV’s These are the actual genetic differences between animals and are expressed in the units for that trait. The base year is 1990 when the 50% decile was 0.0 for all EBV’s
NLW Number of lambs weaned. A ram with NLW 12% is 12 % better for weaning extra
lambs than the base year of 0. YNLW Number of lambs weaned % for a one year old ewe. MWWT Maternal weaning weight ( Kg ) ( milk ), The ability of the ewe to feed and care for
the lamb above its own growth genes. BWT Birth weight ( Kg ) . Use negative or low figures for maiden ewes. WWT Weaning weight at 100 days. ( Kg ) Fast early growth. Keep this high for lambs
suckers sold directly off ewes. PWWT Post weaning weight at 225 days. ( Kg ) A ram with 5 kg PWWT will be 5 kg
heavier at eight months of age. YWT Yearling weight at 365 days. ( Kg ) Used for heavy export lambs grown over a
longer period of time. AWT Adult weight at 2 years. ( Kg ) To reduce mature weight in ewes look for a lower
figure here. PFAT Post weaning fat depth at 225 days (mm) Check lamb kill sheets to decide if you
need to alter fat levels. PEMD Post weaning eye muscle depth at 225 days (mm) YGFW Yearling greasy fleece weight. Expressed as a %. Increase this for more wool
weight. PFEC Post weaning faecal worm egg count, expressed as a %, the more negative the more
tolerant/resistant to worms. LDAG Late Dag score with lower better. A ram with a minus one is one dag score less than
breed average in year 2000. PSC Post weaning scrotal circumference. ( cm ) Rams with large testes have daughters
with earlier puberty that also have more lambs. LE-DIR Lambing ease direct, expressed as a %, This is the rams genetic ability to produce
easily born lambs with a positive number desirable. LE-DAU Lambing ease daughters, expressed as a %, This is a rams ability to produce
daughters that lamb easily with a positive number desirable.
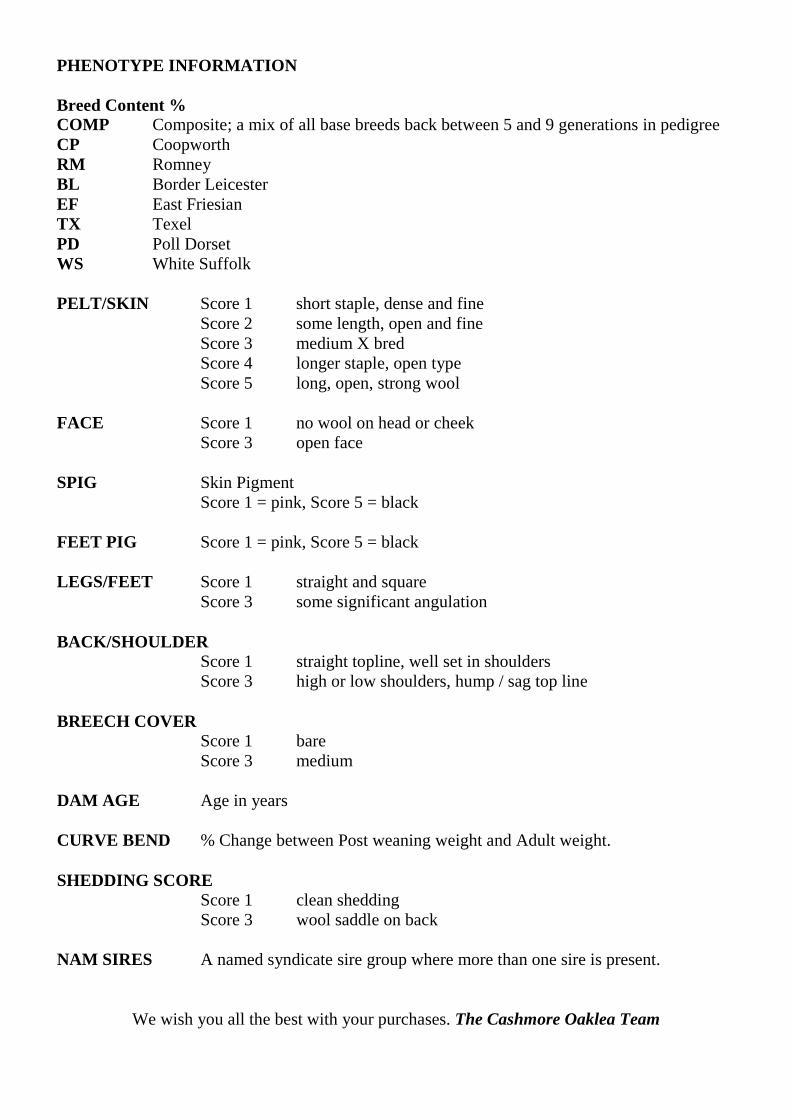
PHENOTYPE INFORMATION Breed Content % COMP Composite; a mix of all base breeds back between 5 and 9 generations in pedigree CP Coopworth RM Romney BL Border Leicester EF East Friesian TX Texel PD Poll Dorset WS White Suffolk PELT/SKIN Score 1 short staple, dense and fine Score 2 some length, open and fine Score 3 medium X bred Score 4 longer staple, open type Score 5 long, open, strong wool FACE Score 1 no wool on head or cheek Score 3 open face SPIG Skin Pigment
Score 1 = pink, Score 5 = black FEET PIG Score 1 = pink, Score 5 = black LEGS/FEET Score 1 straight and square Score 3 some significant angulation BACK/SHOULDER
Score 1 straight topline, well set in shoulders Score 3 high or low shoulders, hump / sag top line
BREECH COVER
Score 1 bare Score 3 medium DAM AGE Age in years CURVE BEND % Change between Post weaning weight and Adult weight. SHEDDING SCORE
Score 1 clean shedding Score 3 wool saddle on back NAM SIRES A named syndicate sire group where more than one sire is present.
We wish you all the best with your purchases. The Cashmore Oaklea Team
page
6EL
ITE
PER
FOR
MAN
CE
MAT
ERN
ALS
ASB
V's
%$M
ATM
CP+
MIL
KPW
WT
AWT
YGFW
LDAG
LELE
LO
T
FLK
IDD
OB
Ban
dIn
dex
Inde
xN
LWYN
LWM
WW
TB
WT
WW
TYW
TPF
ATPE
MD
PFEC
PSC
DIR
DAU
LOT
1CP
5328
22/0
9/20
181
177.
715
9.7
19%
18%
1.1
0.5
10.1
16.8
19.5
19.4
0.1
1.6
0-0
.25.
70
-11
2CP
5917
01/1
0/20
181
177.
616
0.6
13%
14%
0.6
11.8
17.8
18.5
19.7
-0.3
1.6
7-0
.16.
0-1
-12
3CP
4765
12/0
9/20
181
177.
015
7.8
13%
17%
0.9
0.5
11.6
18.2
20.8
22.0
-0.6
1.4
5-6
6-0
.15.
70
03
4CP
5570
27/0
9/20
181
176.
915
9.1
16%
16%
0.3
10.0
16.1
18.8
19.8
0.2
2.4
30.
06.
2-1
-14
5O
298
14/0
7/20
181
177.
215
2.8
19%
19%
0.6
0.5
11.9
19.1
22.1
25.2
-1.3
1.3
-2-8
-0.1
5.9
0-2
56
O58
723
/07/
2018
117
6.7
158.
813
%18
%0.
50.
612
.419
.821
.722
.1-1
.11.
53
6-0
.15.
50
-16
7O
1407
12/0
9/20
181
176.
815
8.7
13%
16%
0.8
0.5
12.1
19.1
21.1
22.5
-1.0
1.9
-1-1
90.
15.
80
07
8O
1596
22/0
9/20
181
176.
816
0.8
15%
18%
1.0
0.7
11.6
18.4
19.6
20.5
-0.8
1.7
-8-3
5-0
.16.
0-2
-28
9CP
2695
13/0
8/20
181
176.
816
0.1
17%
17%
0.8
0.6
10.3
16.9
20.3
19.5
-0.4
1.6
-1-7
90.
35.
7-1
-29
10CP
3302
19/0
8/20
181
176.
315
8.7
19%
16%
0.4
0.4
9.0
15.9
18.9
18.8
0.0
1.6
9-8
80.
25.
11
010
11CP
2126
05/0
8/20
181
176.
215
6.9
23%
31%
-0.6
0.7
11.9
17.6
19.4
19.5
-1.2
0.3
11-2
2-0
.16.
3-4
-111
12CP
2025
05/0
8/20
181
176.
116
0.6
21%
30%
-0.6
0.5
10.8
16.6
17.5
17.4
-1.5
1.2
10-2
5-0
.15.
412
13CP
2247
08/0
8/20
181
176.
115
9.6
19%
32%
-0.9
0.5
10.9
17.7
19.1
19.3
-0.8
1.5
11-9
-0.1
5.9
1314
CP50
7726
/09/
2018
117
5.8
161.
821
%15
%-0
.10.
39.
215
.218
.418
.3-0
.52.
8-8
-80
0.5
5.3
00
1415
O72
327
/07/
2018
117
6.2
155.
514
%17
%0.
70.
511
.818
.822
.723
.3-0
.81.
44
-39
0.1
6.5
-1-1
1516
O98
715
/08/
2018
117
6.1
154.
113
%19
%0.
60.
612
.018
.922
.224
.3-0
.91.
68
-27
0.1
5.8
-10
1617
O11
5102
/09/
2018
117
6.3
161.
017
%20
%0.
90.
511
.017
.618
.519
.2-0
.31.
7-8
-29
0.0
6.5
0-2
1718
O13
5409
/09/
2018
117
6.1
158.
917
%23
%0.
50.
510
.917
.919
.921
.0-0
.42.
1-9
-90.
15.
21
-118
19O
1385
11/0
9/20
181
176.
215
9.8
15%
17%
0.5
0.5
11.1
17.7
19.5
20.0
-0.6
2.2
30
-0.3
5.2
-10
1920
O13
8611
/09/
2018
117
6.0
160.
416
%17
%0.
60.
410
.617
.119
.019
.4-0
.52.
31
-20
-0.2
5.4
00
2021
O11
2730
/08/
2018
117
5.9
156.
018
%16
%0.
50.
611
.918
.019
.922
.4-1
.01.
5-3
-38
-0.1
4.7
11
2122
O12
9107
/09/
2018
117
5.7
160.
415
%26
%0.
80.
510
.016
.818
.617
.7-0
.71.
87
2-0
.26.
50
022
23O
321
15/0
7/20
181
175.
615
9.3
14%
17%
0.5
0.5
11.0
18.1
19.9
20.5
-0.5
2.0
2-1
9-0
.16.
0-1
-123
24O
633
24/0
7/20
181
174.
816
0.2
14%
15%
0.1
0.6
11.7
18.6
19.4
19.5
-1.1
1.7
52
0.2
6.3
-1-1
2425
O18
912
/07/
2018
117
5.0
161.
516
%17
%1.
10.
410
.015
.916
.216
.2-1
.11.
43
-73
-0.4
5.0
10
25
Toda
ys ra
ms a
vera
ge2
169.
315
4.7
15%
17%
0.4
0.5
9.9
15.8
17.5
17.7
-0.7
1.6
1-3
10.
05.
1-1
-1M
ater
nal p
erce
ntile
ave
rage
5014
3.5
133.
18%
8%0.
10.
58.
312
.313
.213
.6-0
.60.
814
-22
3.8
top
5% y
ello
w, t
op 1
0% g
rey,
top
25 %
bol
d ty
pe
page
7PH
ENO
TYPE
BR
EED
CO
NTE
NT
ADD
ITIO
NAL
INFO
RM
ATIO
N A
S R
AW D
ATA
PELT
FA
CE
NO
SEFE
ETB
UM
DAM
CU
RVE
LOT
Purc
hase
rPr
ice
Com
pC
PEF
BL
RM
PDTX
WS
SKIN
CO
VJA
WPI
GPI
GLE
GS
BAC
KC
OV
AGE
BEN
DSI
RE
LOT
175
136
62
21
33
11
31
16%
1730
761
275
26
36
26
32
14
41
23
111
%17
2792
23
756
193
21
33
21
21
21%
1635
103
468
613
133
21
44
22
31
23%
1721
874
562
23
62
252
11
45
11
22
32%
1705
355
642
816
138
132
21
45
11
12
12%
1705
356
755
62
313
219
12
14
31
12
118
%17
0535
78
612
313
219
21
13
12
11
111
%17
0535
89
8119
33
15
52
13
215
%15
3273
910
636
36
319
13
15
52
23
318
%15
3273
1011
763
66
36
32
15
51
13
311
%13
0275
1112
763
66
36
32
14
31
13
35%
1302
7512
1368
613
133
31
55
22
33
9%13
0275
1314
4913
382
21
11
11
31
20%
1224
0214
1555
1313
191
31
44
11
22
24%
1620
4215
1668
613
132
21
55
11
42
29%
1620
4216
1755
613
1313
32
14
51
12
19%
1709
0617
1849
23
192
252
21
35
11
21
17%
1705
3518
1955
23
132
252
11
33
22
21
13%
1705
3519
2055
23
132
25*
*1
44
**
*1
13%
1705
3520
2149
62
313
225
11
13
21
12
124
%17
0535
2122
883
63
32
13
52
12
15%
1712
0322
2355
1313
192
11
32
21
23
13%
1705
3523
2430
816
138
252
11
33
11
12
5%17
0535
2425
506
136
252
11
34
11
24
2%16
3510
25
Of t
his
cata
logu
e: c
urve
ben
d to
p 5
% y
ello
w, t
op 1
0 %
gre
y, to
p 25
% b
old
page
8EL
ITE
PER
FOR
MAN
CE
MAT
ERN
ALS
ASB
V's
%$M
ATM
CP+
MIL
KPW
WT
AWT
YGFW
LDAG
LELE
LO
T
FLK
IDD
OB
Ban
dIn
dex
Inde
xN
LWYN
LWM
WW
TB
WT
WW
TYW
TPF
ATPE
MD
PFEC
PSC
DIR
DAU
LOT
26O
222
13/0
7/20
181
174.
815
6.8
15%
16%
0.7
0.7
12.1
19.0
20.7
22.4
-1.6
1.4
-9-3
00.
15.
7-1
-326
27CP
2152
07/0
8/20
181
174.
715
6.9
22%
29%
-1.0
0.4
9.1
15.0
18.7
18.2
-0.7
2.0
17-3
70.
14.
8-4
-227
28CP
4718
11/0
9/20
181
174.
715
5.9
22%
26%
0.8
0.7
9.4
15.6
17.1
17.6
-0.7
0.6
4-4
7-0
.14.
7-2
-228
29CP
5018
14/0
9/20
181
175.
415
8.7
13%
11%
0.5
0.2
11.5
17.3
19.9
22.0
-0.4
2.7
-5-6
10.
15.
91
129
30CP
4918
08/0
9/20
181
174.
715
9.5
20%
14%
-0.3
0.2
8.1
14.4
17.8
17.2
-0.1
2.6
12-7
50.
44.
90
030
31CP
4977
17/0
9/20
181
174.
716
0.0
15%
16%
1.2
0.4
10.1
15.7
16.5
17.2
-0.8
1.8
4-6
2-0
.24.
70
-231
32CP
6020
14/0
8/20
181
174.
716
1.1
19%
14%
0.5
0.5
11.4
16.9
16.8
16.8
-1.3
1.0
1-4
0-0
.15.
31
132
33O
1404
12/0
9/20
181
174.
715
8.5
18%
17%
0.3
0.5
11.0
17.2
18.6
19.9
-1.1
1.8
-6-3
00.
26.
0-3
-133
34O
1551
20/0
9/20
181
174.
515
9.8
18%
23%
0.0
0.5
9.8
16.1
16.9
18.2
-0.8
2.3
0-2
6-0
.15.
0-1
-134
35O
1306
08/0
9/20
181
175.
515
9.9
13%
18%
0.8
0.6
11.7
18.7
19.0
19.9
-0.9
1.5
1-1
3-0
.36.
50
-135
36O
1265
07/0
9/20
181
174.
315
8.6
14%
22%
1.2
0.7
11.2
17.8
19.4
18.9
-1.1
1.4
-6-4
-0.3
6.2
-1-2
3637
O24
913
/07/
2018
117
4.5
152.
911
%14
%1.
50.
712
.518
.822
.024
.2-1
.31.
5-2
-24
0.1
5.2
-2-2
3738
O30
03/0
7/20
181
174.
415
6.3
12%
19%
0.9
0.6
12.0
18.8
19.8
21.8
-1.3
1.3
-1-3
1-0
.25.
9-1
-138
39O
1009
16/0
8/20
181
174.
315
9.5
12%
17%
1.2
0.5
10.6
17.8
19.6
18.9
-0.6
1.6
-1-3
40.
15.
4-1
-139
40O
1008
16/0
8/20
181
174.
116
0.7
13%
18%
1.2
0.6
10.9
17.8
19.0
17.8
-1.0
1.4
-4-2
80.
26.
1-2
-240
41O
1515
17/0
9/20
181
174.
215
5.5
15%
21%
0.5
0.7
11.4
18.0
20.1
21.5
-0.6
1.8
35
-0.2
4.9
-1-1
4142
O12
9307
/09/
2018
117
3.9
155.
616
%23
%0.
90.
611
.117
.919
.520
.3-0
.81.
4-1
26-0
.17.
10
-142
43O
1174
03/0
9/20
181
174.
315
9.3
16%
14%
-0.1
0.4
11.3
18.3
19.2
20.2
-0.8
2.2
111
-0.1
5.5
-10
4344
O14
7616
/09/
2018
117
4.0
155.
715
%13
%0.
60.
611
.118
.421
.021
.7-0
.81.
41
-30
-0.2
5.8
0-1
4445
O10
9226
/08/
2018
117
3.8
160.
314
%21
%1.
30.
610
.617
.317
.516
.9-1
.01.
4-3
2-0
.26.
40
-245
46O
1350
09/0
9/20
181
173.
715
6.8
16%
18%
1.3
0.6
11.0
17.4
18.4
19.2
-1.3
1.3
-40
-0.3
6.8
-1-3
4647
O11
7203
/09/
2018
117
3.3
159.
417
%19
%-0
.30.
510
.617
.117
.517
.9-0
.91.
66
-24
0.0
5.0
00
4748
O15
8522
/09/
2018
117
3.9
154.
617
%15
%0.
00.
611
.117
.520
.121
.2-1
.11.
411
-31
-0.3
4.5
01
4849
O12
5506
/09/
2018
117
3.9
157.
912
%18
%1.
20.
610
.717
.519
.319
.7-0
.61.
70
-34
-0.3
6.0
0-1
4950
O12
2506
/09/
2018
117
3.8
159.
516
%19
%0.
50.
611
.517
.017
.217
.6-1
.81.
36
-23
-0.1
5.0
-2-2
50
Toda
ys ra
ms a
vera
ge2
169.
315
4.7
15%
17%
0.4
0.5
9.9
15.8
17.5
17.7
-0.7
1.6
1-3
10.
05.
1-1
-1M
ater
nal p
erce
ntile
ave
rage
5014
3.5
133.
18%
8%0.
10.
58.
312
.313
.213
.6-0
.60.
814
-22
3.8
top
5% y
ello
w, t
op 1
0% g
rey,
top
25 %
bol
d ty
pe
page
9PH
ENO
TYPE
BR
EED
CO
NTE
NT
ADD
ITIO
NAL
INFO
RM
ATIO
N A
S R
AW D
ATA
PELT
FA
CE
NO
SEFE
ETB
UM
DAM
CU
RVE
LOT
Purc
hase
rPr
ice
Com
pC
PEF
BL
RM
PDTX
WS
SKIN
CO
VJA
WPI
GPI
GLE
GS
BAC
KC
OV
AGE
BEN
DSI
RE
LOT
2662
136
192
11
35
21
33
18%
1704
2926
2762
136
194
21
54
21
33
22%
1302
7527
2855
1319
133
21
33
22
32
13%
1622
3628
2962
1919
23
15
51
13
127
%16
2762
2930
636
312
21
55
22
31
20%
1224
0230
3187
132
22
22
32
31
10%
1635
1031
3256
613
254
21
22
22
37
-1%
1627
6232
3362
1919
23
13
51
13
116
%17
0368
3334
552
313
225
12
13
51
12
113
%17
0535
3435
556
1313
132
31
44
11
21
7%17
0906
3536
823
66
32
21
45
21
21
6%17
1203
3637
7413
132
21
43
11
12
29%
1620
4237
3874
1313
31
13
11
11
416
%16
2042
3839
626
136
133
31
44
11
23
7%16
2042
3940
626
136
132
21
55
11
23
0%16
2042
4041
612
313
219
32
15
51
12
120
%17
0535
4142
6913
36
63
21
15
51
12
113
%17
1203
4243
612
313
219
22
13
52
12
111
%17
0535
4344
552
63
132
192
11
33
11
11
18%
1705
3544
4575
56
95
21
15
42
11
1-2
%17
1203
4546
823
66
32
11
45
21
11
10%
1712
0346
4755
26
313
219
32
14
51
12
15%
1705
3547
4849
62
313
225
13
13
31
12
121
%17
0535
4849
686
1313
22
13
51
13
112
%17
0906
4950
503
66
133
192
31
43
11
21
3%17
0169
50
Of t
his
cata
logu
e: c
urve
ben
d to
p 5
% y
ello
w, t
op 1
0 %
gre
y, to
p 25
% b
old

page
10
ELIT
E PE
RFO
RM
ANC
E M
ATER
NAL
SAS
BV'
s
%$M
ATM
CP+
MIL
KPW
WT
AWT
YGFW
LDAG
LELE
LO
T
FLK
IDD
OB
Ban
dIn
dex
Inde
xN
LWYN
LWM
WW
TB
WT
WW
TYW
TPF
ATPE
MD
PFEC
PSC
DIR
DAU
LOT
51CP
2884
16/0
8/20
181
173.
916
1.0
17%
12%
1.1
0.4
10.1
16.0
16.8
17.4
-0.3
2.1
-12
-60
0.3
6.0
0-2
5152
CP22
7208
/08/
2018
117
3.7
156.
223
%18
%0.
10.
58.
013
.914
.816
.30.
11.
517
-59
0.3
5.2
-2-2
5253
CP51
2515
/09/
2018
117
4.5
150.
020
%19
%1.
10.
610
.316
.619
.420
.6-1
.30.
021
-0.3
5.5
00
5354
CP47
9113
/09/
2018
117
4.5
152.
322
%19
%0.
80.
49.
615
.717
.819
.0-1
.20.
518
-30
-0.2
5.5
0-2
5455
CP25
8413
/08/
2018
117
4.4
158.
018
%23
%0.
40.
410
.016
.218
.718
.5-0
.42.
43
290.
25.
81
055
56CP
2976
18/0
8/20
181
174.
416
1.5
13%
18%
0.8
0.3
9.4
15.4
15.4
15.9
-0.6
1.9
14-7
5-0
.44.
71
056
57O
1418
13/0
9/20
181
173.
715
7.0
15%
14%
0.3
0.5
11.2
17.9
19.7
20.8
-1.0
1.8
-1-2
5-0
.34.
70
057
58O
1271
07/0
9/20
181
173.
016
2.1
12%
20%
1.4
0.6
11.1
17.4
17.7
16.9
-1.0
1.9
-14
1-0
.36.
61
-258
59O
1333
09/0
9/20
181
173.
515
6.8
15%
16%
0.5
0.5
10.6
17.3
19.5
20.3
-0.8
1.8
1-4
00.
04.
70
059
60O
1599
22/0
9/20
181
173.
215
8.1
12%
13%
0.7
0.5
11.7
18.3
19.7
21.6
-0.4
2.3
-12
-38
-0.2
5.6
-1-2
6061
CP22
2007
/08/
2018
117
3.0
156.
321
%27
%-0
.30.
510
.616
.116
.617
.7-1
.60.
96
-24
0.0
5.1
-3-1
6162
CP47
8312
/09/
2018
117
3.4
157.
512
%13
%0.
511
.317
.018
.318
.6-0
.11.
47
-0.2
5.6
-1-1
6263
CP46
3104
/09/
2018
117
3.3
155.
619
%16
%0.
30.
38.
714
.816
.518
.40.
12.
29
-42
0.0
5.6
0-2
6364
CP59
4302
/10/
2018
117
3.2
154.
815
%16
%0.
90.
710
.916
.918
.919
.8-0
.21.
38
-29
-0.1
5.7
-1-1
6465
CP52
4119
/09/
2018
117
3.2
159.
318
%17
%0.
70.
49.
815
.616
.917
.2-0
.41.
8-6
-51
0.0
5.2
00
6566
CP35
4921
/08/
2018
117
3.1
157.
118
%10
%0.
30.
39.
315
.017
.919
.2-0
.42.
71
-67
0.4
4.6
0-1
6667
O76
028
/07/
2018
117
3.0
156.
514
%14
%0.
20.
611
.417
.619
.520
.1-0
.91.
78
-22
-0.2
4.8
-20
6768
O70
526
/07/
2018
117
2.9
156.
020
%20
%-0
.30.
59.
215
.318
.917
.9-0
.91.
310
-73
0.3
5.3
-1-1
6869
O13
4809
/09/
2018
117
2.8
157.
38%
9%1.
50.
613
.019
.019
.621
.7-1
.11.
8-8
-27
-0.1
5.4
-1-2
6970
O13
2509
/09/
2018
117
2.5
156.
915
%18
%0.
30.
510
.617
.118
.819
.0-0
.71.
73
-14
-0.1
6.2
-3-1
7071
O10
1718
/08/
2018
117
2.7
152.
815
%15
%1.
20.
811
.017
.019
.221
.1-1
.11.
30
-30
-0.1
5.2
-3-3
7172
O55
522
/07/
2018
117
2.6
155.
314
%14
%0.
70.
611
.117
.219
.921
.1-0
.72.
0-4
-38
0.1
5.6
-2-2
7273
CP46
0431
/08/
2018
117
2.9
159.
416
%22
%0.
70.
49.
715
.414
.915
.6-1
.71.
15
-72
-0.5
4.7
10
7374
CP25
1710
/08/
2018
117
2.8
159.
416
%19
%0.
90.
811
.116
.415
.815
.6-1
.41.
09
-11
-0.3
5.4
-10
7475
CP59
2601
/10/
2018
117
2.7
159.
912
%11
%0.
40.
210
.816
.818
.919
.5-0
.62.
8-7
-61
0.3
5.7
10
75
Toda
ys ra
ms a
vera
ge2
169.
315
4.7
15%
17%
0.4
0.5
9.9
15.8
17.5
17.7
-0.7
1.6
1-3
10.
05.
1-1
-1M
ater
nal p
erce
ntile
ave
rage
5014
3.5
133.
18%
8%0.
10.
58.
312
.313
.213
.6-0
.60.
814
-22
3.8
top
5% y
ello
w, t
op 1
0% g
rey,
top
25 %
bol
d ty
pe
page
11
PHEN
OTY
PEB
REE
D C
ON
TEN
TAD
DIT
ION
AL IN
FOR
MAT
ION
AS
RAW
DAT
APE
LT
FAC
EN
OSE
FEET
BU
MD
AMC
UR
VELO
TPu
rcha
ser
Pric
eC
omp
CP
EFB
LR
MPD
TXW
SSK
INC
OV
JAW
PIG
PIG
LEG
SB
ACK
CO
VAG
EB
END
SIR
ELO
T51
686
1313
22
13
31
13
29%
1723
8551
5256
256
133
31
44
12
34
17%
1622
3652
5387
133
21
55
22
31
24%
1730
7653
5475
196
32
15
52
13
121
%17
3076
5455
506
2513
63
11
55
22
22
15%
1600
6455
5681
613
32
14
42
11
24%
1635
1056
5755
23
132
251
11
41
11
21
16%
1705
3557
5876
36
63
62
21
55
11
21
-3%
1712
0358
5955
23
132
251
21
11
11
21
17%
1705
3559
6044
625
252
11
12
11
21
18%
1709
0660
6182
66
62
11
22
22
23
10%
1302
7561
6281
23
62
62
22
23
22
31
9%17
2792
6263
626
1319
22
13
32
24
224
%17
3845
6364
742
63
213
22
13
31
11
117
%17
2792
6465
686
1313
23
14
42
13
110
%16
2762
6566
6213
252
21
55
11
22
28%
1627
6266
6761
26
313
213
21
14
31
12
214
%17
0535
6768
696
252
31
54
11
22
17%
1224
0268
6944
625
253
31
34
11
41
14%
1709
0669
7088
66
21
14
51
12
111
%17
0368
7071
756
192
21
55
21
12
24%
1627
9671
7268
23
62
191
11
55
21
22
23%
1704
2972
7381
613
32
15
51
13
21%
1635
1073
7469
66
136
32
13
31
11
4-5
%14
0069
7475
812
36
26
32
15
51
22
116
%16
2762
75
Of t
his
cata
logu
e: c
urve
ben
d to
p 5
% y
ello
w, t
op 1
0 %
gre
y, to
p 25
% b
old

page
12
ELIT
E PE
RFO
RM
ANC
E M
ATER
NAL
SAS
BV'
s
%$M
ATM
CP+
MIL
KPW
WT
AWT
YGFW
LDAG
LELE
LO
T
FLK
IDD
OB
Ban
dIn
dex
Inde
xN
LWYN
LWM
WW
TB
WT
WW
TYW
TPF
ATPE
MD
PFEC
PSC
DIR
DAU
LOT
76CP
5696
27/0
9/20
181
172.
715
7.1
14%
15%
0.6
0.6
10.7
16.6
17.7
17.6
-1.1
1.7
1823
-0.1
5.4
00
7677
CP31
0816
/08/
2018
117
2.6
157.
417
%13
%-0
.50.
49.
616
.419
.020
.2-0
.82.
5-2
-76
0.2
5.4
0-1
7778
CP30
7018
/08/
2018
117
2.5
159.
618
%11
%0.
00.
47.
613
.717
.915
.50.
12.
814
-69
0.2
4.6
-1-2
7879
O64
725
/07/
2018
117
2.5
153.
814
%11
%1.
40.
710
.616
.819
.920
.8-1
.01.
5-2
-57
-0.3
4.7
-5-3
7980
O80
931
/07/
2018
117
2.4
155.
413
%19
%0.
60.
510
.717
.219
.020
.6-0
.31.
90
-27
0.1
4.8
-1-1
8081
O79
530
/07/
2018
117
2.4
153.
911
%11
%1.
10.
511
.117
.019
.221
.8-0
.52.
33
-35
0.0
5.4
-2-3
8182
O19
03/0
7/20
181
172.
215
8.0
18%
26%
0.7
0.4
9.8
15.8
17.2
15.7
-1.2
1.5
440
-0.1
5.6
00
8283
O15
1617
/09/
2018
117
2.4
156.
615
%20
%0.
50.
59.
716
.017
.818
.6-0
.52.
05
-41
-0.1
4.6
00
8384
O11
4201
/09/
2018
117
2.3
156.
714
%19
%1.
00.
510
.617
.017
.919
.0-0
.62.
1-4
190.
25.
30
-184
85CP
5514
27/0
9/20
181
172.
515
6.0
12%
14%
0.6
0.5
12.0
18.1
19.1
21.1
-1.2
1.4
0-6
1-0
.35.
51
085
86CP
4794
13/0
9/20
181
172.
515
1.5
19%
18%
0.5
0.4
9.6
16.0
18.1
19.3
-0.4
0.8
19-1
8-0
.25.
8-1
-186
87CP
5484
24/0
9/20
181
172.
515
7.7
14%
15%
0.4
8.9
14.8
15.6
15.9
0.0
2.0
18-0
.25.
20
-187
88CP
6231
06/1
0/20
181
172.
415
1.4
17%
21%
1.2
0.6
9.9
16.2
18.6
18.8
-1.2
0.4
18-2
0-0
.35.
00
088
89CP
2048
05/0
8/20
181
172.
315
7.5
13%
19%
0.4
0.7
11.0
16.5
17.4
18.4
-0.8
1.7
6-4
7-0
.25.
2-1
089
90CP
3618
21/0
8/20
181
172.
216
1.1
13%
12%
-0.2
0.5
10.0
16.5
18.4
17.7
-0.1
2.4
2-7
30.
35.
50
090
91CP
2960
17/0
8/20
181
172.
215
8.1
21%
21%
-0.1
0.4
7.0
13.1
15.6
14.3
0.6
2.0
16-5
80.
44.
00
-191
92CP
3303
19/0
8/20
181
172.
215
2.7
19%
16%
0.4
0.4
8.3
14.7
18.4
18.2
-0.2
1.3
18-6
50.
24.
71
-192
93CP
3583
21/0
8/20
181
172.
116
1.3
15%
15%
0.5
0.3
9.6
14.7
15.1
15.6
-0.3
2.5
-1-6
30.
14.
60
-193
94CP
3071
18/0
8/20
181
172.
115
8.5
18%
12%
0.0
0.4
7.9
14.1
18.7
16.3
0.5
2.6
10-6
60.
34.
9-1
-294
95CP
4767
12/0
9/20
181
171.
915
5.8
12%
18%
1.1
0.6
11.0
16.7
16.9
17.5
-1.2
0.8
18-0
.15.
40
095
96CP
5640
28/0
9/20
181
171.
916
2.0
14%
11%
0.8
0.3
9.1
14.2
14.9
14.4
-0.4
2.7
4-6
00.
14.
50
-196
97CP
5368
23/0
9/20
181
171.
815
8.4
14%
15%
0.3
0.4
10.4
16.0
16.6
16.1
-1.0
1.6
200.
05.
51
097
98CP
4417
26/0
8/20
181
171.
716
0.0
16%
21%
0.3
0.4
8.5
14.7
15.3
15.5
0.8
2.1
-2-7
7-0
.13.
30
-198
99CP
4588
31/0
8/20
181
171.
715
7.8
20%
16%
-0.7
0.3
7.9
13.7
15.4
16.0
0.9
2.7
15-4
60.
14.
41
199
100
CP62
9108
/10/
2018
117
1.6
157.
213
%15
%1.
10.
410
.415
.316
.517
.6-1
.12.
11
-53
0.2
5.0
10
100
Toda
ys ra
ms a
vera
ge2
169.
315
4.7
15%
17%
0.4
0.5
9.9
15.8
17.5
17.7
-0.7
1.6
1-3
10.
05.
1-1
-1M
ater
nal p
erce
ntile
ave
rage
5014
3.5
133.
18%
8%0.
10.
58.
312
.313
.213
.6-0
.60.
814
-22
3.8
top
5% y
ello
w, t
op 1
0% g
rey,
top
25 %
bol
d ty
pe
page
13
PHEN
OTY
PEB
REE
D C
ON
TEN
TAD
DIT
ION
AL IN
FOR
MAT
ION
AS
RAW
DAT
APE
LT
FAC
EN
OSE
FEET
BU
MD
AMC
UR
VELO
TPu
rcha
ser
Pric
eC
omp
CP
EFB
LR
MPD
TXW
SSK
INC
OV
JAW
PIG
PIG
LEG
SB
ACK
CO
VAG
EB
END
SIR
ELO
T76
576
613
66
64
31
44
21
31
6%16
0064
7677
6213
253
21
44
11
33
23%
1224
0277
7869
625
23
14
42
13
214
%12
2402
7879
100
22
14
51
12
424
%16
4858
7980
686
1313
23
14
31
12
219
%16
2042
8081
496
1313
613
22
15
51
12
229
%16
2042
8182
566
136
192
11
42
22
25
-1%
1600
6482
8361
23
132
192
21
35
11
21
16%
1705
3583
8449
313
613
313
22
13
31
11
112
%17
1203
8485
696
619
22
15
42
23
117
%16
3510
8586
8013
23
23
21
55
11
31
20%
1727
9286
8782
66
62
21
55
11
31
8%17
2187
8788
8113
62
31
33
11
41
16%
1730
7688
8963
66
136
63
21
44
11
33
11%
1400
6989
9063
631
23
15
52
23
27%
1532
7390
9168
1319
33
14
51
13
29%
1532
7391
9263
63
63
193
32
33
22
43
24%
1532
7392
9368
1319
22
23
32
13
36%
1627
6293
9469
625
13
14
41
14
215
%12
2402
9495
886
64
32
55
22
41
5%17
7634
9596
686
1313
23
14
42
11
12%
1627
6296
9788
36
33
21
55
11
31
1%17
7634
9798
7413
132
21
43
32
32
6%17
3282
9899
756
192
31
33
31
42
17%
1726
6999
100
932
32
32
13
31
14
115
%16
2762
100
Of t
his
cata
logu
e: c
urve
ben
d to
p 5
% y
ello
w, t
op 1
0 %
gre
y, to
p 25
% b
old
page
14
PER
FOR
MAN
CE
MAT
ERN
ALS
ASB
V's
%$M
ATM
CP+
MIL
KPW
WT
AWT
YGFW
LDAG
LELE
LO
T
FLK
IDD
OB
Ban
dIn
dex
Inde
xN
LWYN
LWM
WW
TB
WT
WW
TYW
TPF
ATPE
MD
PFEC
PSC
DIR
DAU
LOT
101
O13
4309
/09/
2018
117
2.4
156.
89%
18%
1.2
0.5
10.7
17.6
19.0
19.9
-0.5
2.0
2-2
2-0
.16.
31
-110
110
2O
1342
09/0
9/20
181
172.
415
6.0
9%18
%1.
20.
510
.918
.020
.121
.1-0
.41.
9-6
-32
-0.1
6.5
1-1
102
103
O79
430
/07/
2018
117
2.2
152.
212
%12
%1.
10.
611
.317
.319
.522
.1-1
.21.
67
-46
0.3
5.8
-2-3
103
104
O70
626
/07/
2018
117
1.9
154.
710
%13
%1.
10.
611
.918
.320
.321
.7-1
.41.
6-1
-38
0.4
6.1
-1-2
104
105
O12
4906
/09/
2018
117
2.1
155.
49%
25%
1.7
0.5
10.2
17.6
20.6
20.1
-0.6
1.8
-5-1
-0.3
6.7
1-1
105
106
O12
8907
/09/
2018
117
1.9
155.
810
%16
%0.
90.
511
.318
.220
.521
.6-0
.82.
1-8
-22
-0.2
5.9
10
106
107
O36
617
/07/
2018
117
1.8
158.
312
%18
%0.
40.
611
.017
.418
.719
.2-0
.62.
0-2
-28
-0.1
6.1
-2-2
107
108
O14
8616
/09/
2018
117
1.8
152.
315
%22
%0.
80.
710
.917
.420
.020
.7-0
.71.
44
22-0
.45.
80
010
810
9O
567
22/0
7/20
181
171.
815
4.3
15%
20%
0.0
0.6
11.4
17.5
19.0
20.5
-1.1
1.3
4-2
6-0
.25.
4-2
010
911
0O
1413
12/0
9/20
181
171.
515
4.3
13%
17%
-0.1
0.7
11.5
17.6
19.3
21.0
-0.9
1.7
9-3
6-0
.14.
3-1
011
0
111
O13
8911
/09/
2018
117
1.9
156.
317
%17
%0.
10.
410
.017
.118
.918
.7-0
.71.
84
130.
05.
80
011
111
2O
1222
06/0
9/20
181
171.
815
8.3
12%
22%
0.8
0.4
10.2
17.4
19.0
18.3
-0.5
1.5
-5-4
1-0
.26.
80
011
211
3O
7807
/07/
2018
117
1.8
156.
815
%20
%0.
60.
410
.517
.920
.418
.2-1
.01.
43
420.
26.
21
111
311
4O
1195
05/0
9/20
181
171.
715
8.0
13%
17%
0.7
0.5
10.5
15.6
16.0
16.8
-0.6
2.1
11-1
60.
14.
2-1
-111
411
5O
1472
16/0
9/20
181
171.
615
8.5
12%
20%
0.9
0.6
10.3
16.8
17.8
16.8
-0.9
1.7
510
-0.4
6.4
-1-2
115
116
CP55
2727
/09/
2018
117
1.7
149.
522
%20
%0.
20.
59.
114
.917
.919
.2-0
.80.
819
-28
-0.2
5.0
00
116
117
CP50
1313
/09/
2018
117
1.6
157.
315
%17
%0.
410
.717
.117
.417
.7-0
.61.
16
-0.2
6.2
-1-2
117
118
CP50
5226
/09/
2018
117
1.5
157.
313
%16
%0.
70.
411
.617
.318
.218
.4-0
.91.
71
70.
05.
51
011
811
9CP
3805
22/0
8/20
181
171.
515
2.8
16%
16%
0.3
0.6
9.6
15.2
18.4
19.3
-1.0
1.7
16-5
80.
03.
6-3
011
912
0CP
2153
07/0
8/20
181
171.
415
8.1
21%
27%
-1.0
0.4
8.7
13.9
15.7
14.7
-0.7
1.9
17-3
80.
14.
6-5
-212
0
121
CP49
0607
/09/
2018
117
1.3
155.
517
%15
%0.
50.
48.
814
.116
.016
.40.
01.
814
0.4
5.2
-10
121
122
CP27
1313
/08/
2018
117
1.2
155.
820
%13
%-0
.10.
28.
214
.017
.617
.80.
52.
70
-56
0.4
4.6
00
122
123
CP55
3827
/09/
2018
117
1.0
154.
520
%20
%0.
50.
49.
215
.016
.215
.7-0
.60.
814
-14
-0.3
4.7
00
123
124
CP39
4923
/08/
2018
117
1.0
154.
317
%20
%0.
00.
811
.017
.518
.317
.8-1
.10.
416
9-0
.16.
1-3
-212
412
5CP
5220
19/0
9/20
181
170.
915
5.2
18%
14%
0.5
0.5
9.5
15.5
17.2
16.6
-0.6
1.0
12-0
.15.
00
012
5
Toda
ys ra
ms a
vera
ge2
169.
315
4.7
15%
17%
0.4
0.5
9.9
15.8
17.5
17.7
-0.7
1.6
1-3
10.
05.
1-1
-1M
ater
nal p
erce
ntile
ave
rage
5014
3.5
133.
18%
8%0.
10.
58.
312
.313
.213
.6-0
.60.
814
-22
3.8
top
5% y
ello
w, t
op 1
0% g
rey,
top
25 %
bol
d ty
pe
page
15
PHEN
OTY
PEB
REE
D C
ON
TEN
TAD
DIT
ION
AL IN
FOR
MAT
ION
AS
RAW
DAT
APE
LT
FAC
EN
OSE
FEET
BU
MD
AMC
UR
VELO
TPu
rcha
ser
Pric
eC
omp
CP
EFB
LR
MPD
TXW
SSK
INC
OV
JAW
PIG
PIG
LEG
SB
ACK
CO
VAG
EB
END
SIR
ELO
T10
155
613
1313
22
15
51
12
113
%17
0906
101
102
556
1313
131
31
55
11
31
17%
1709
0610
210
349
613
136
133
21
55
11
22
28%
1620
4210
310
443
613
136
192
11
44
11
22
19%
1620
4210
410
588
36
32
11
55
21
11
15%
1712
0310
5
106
612
313
219
23
14
51
12
118
%17
0535
106
107
6813
192
31
43
11
32
10%
1620
4210
710
876
63
63
62
21
55
21
21
19%
1712
0310
810
949
26
313
225
12
13
31
12
317
%17
0535
109
110
612
313
219
22
14
51
12
120
%17
0535
110
111
552
63
132
19*
*1
55
**
*1
10%
1705
3511
111
267
23
132
13*
*1
55
**
*1
5%17
0763
112
113
639
199
21
15
51
12
32%
1600
6411
311
468
1319
33
13
51
12
18%
1701
6911
411
588
36
32
21
55
11
21
0%17
1203
115
116
8113
63
21
44
21
31
29%
1730
7611
611
710
03
31
44
21
31
3%17
7634
117
118
436
613
136
132
31
33
11
31
6%16
0064
118
119
7413
133
11
55
11
36
27%
1648
5811
912
061
1313
133
21
35
22
33
6%13
0275
120
121
826
66
21
14
42
33
116
%17
2187
121
122
556
1313
133
22
44
11
32
27%
1627
6212
212
381
192
21
55
11
31
5%17
3076
123
124
696
613
62
11
33
21
31
2%16
0147
124
125
8713
22
14
42
23
17%
1730
7612
5
Of t
his
cata
logu
e: c
urve
ben
d to
p 5
% y
ello
w, t
op 1
0 %
gre
y, to
p 25
% b
old

page
16
PER
FOR
MAN
CE
MAT
ERN
ALS
ASB
V's
%$M
ATM
CP+
MIL
KPW
WT
AWT
YGFW
LDAG
LELE
LO
T
FLK
IDD
OB
Ban
dIn
dex
Inde
xN
LWYN
LWM
WW
TB
WT
WW
TYW
TPF
ATPE
MD
PFEC
PSC
DIR
DAU
LOT
126
CP20
4705
/08/
2018
117
2.2
159.
413
%19
%0.
40.
811
.316
.817
.017
.7-0
.31.
8-1
-41
-0.2
5.6
-10
126
127
CP58
6103
/10/
2018
117
1.9
156.
415
%11
%0.
39.
215
.517
.818
.90.
42.
73
0.1
5.8
00
127
128
CP30
1716
/08/
2018
117
1.9
159.
315
%14
%-0
.10.
28.
815
.718
.317
.6-0
.22.
51
-71
0.3
5.9
1-1
128
129
CP54
2624
/09/
2018
117
1.5
156.
421
%15
%0.
40.
58.
213
.715
.615
.4-0
.31.
78
-52
0.3
5.3
0-2
129
130
CP51
8421
/09/
2018
117
1.2
155.
316
%23
%1.
00.
49.
315
.518
.617
.9-0
.31.
7-4
-32
-0.2
5.2
11
130
131
O10
5120
/08/
2018
117
2.1
157.
112
%22
%1.
30.
811
.717
.618
.619
.4-0
.61.
3-1
3-3
6-0
.24.
7-2
-113
113
2O
1406
12/0
9/20
181
172.
016
2.0
16%
14%
0.2
0.4
9.7
15.1
15.3
14.9
-1.1
2.2
1-4
80.
74.
60
013
213
3O
1479
16/0
9/20
181
171.
915
9.2
15%
18%
-0.1
0.5
10.8
17.6
18.4
18.7
-0.9
2.0
-7-1
60.
05.
30
113
313
4O
1123
29/0
8/20
181
171.
815
4.4
12%
16%
0.9
0.6
11.5
18.0
20.0
21.4
-1.2
1.4
-4-4
00.
25.
7-2
-213
413
5O
1105
28/0
8/20
181
171.
415
5.6
17%
28%
-0.1
0.5
9.3
15.5
17.7
17.8
-0.8
1.8
3-2
3-0
.14.
80
113
5
136
O16
611
/07/
2018
117
1.4
155.
218
%17
%1.
20.
69.
915
.418
.216
.9-0
.91.
21
-23
0.0
5.2
-1-2
136
137
O13
02/0
7/20
181
171.
215
0.7
17%
20%
1.5
0.4
10.0
16.2
18.9
20.2
-0.9
0.9
-3-2
9-0
.25.
00
-113
713
8O
232
13/0
7/20
181
171.
015
5.5
15%
23%
0.8
0.6
11.1
17.8
18.4
19.2
-0.9
1.2
-10
4-0
.15.
40
-213
813
9O
7907
/07/
2018
117
1.1
158.
114
%19
%0.
60.
410
.417
.519
.116
.9-1
.01.
64
480.
25.
71
113
914
0O
193
12/0
7/20
181
171.
015
4.2
14%
20%
1.0
0.5
10.5
16.9
18.3
19.3
-0.9
1.5
-27
-0.1
5.3
0-1
140
141
O80
831
/07/
2018
117
1.4
151.
414
%15
%0.
50.
611
.717
.721
.121
.9-0
.81.
16
-37
0.2
5.9
-2-1
141
142
O10
7023
/08/
2018
117
1.0
151.
512
%17
%1.
10.
611
.718
.019
.621
.7-1
.40.
82
-41
-0.3
5.6
00
142
143
O14
0512
/09/
2018
117
1.2
160.
117
%15
%0.
20.
49.
415
.016
.115
.7-1
.02.
2-2
-52
0.3
4.6
00
143
144
O12
1705
/09/
2018
117
1.0
152.
919
%22
%0.
10.
59.
615
.517
.818
.7-1
.31.
35
-33
0.0
5.6
-2-1
144
145
O12
0205
/09/
2018
117
0.9
157.
712
%20
%0.
80.
510
.517
.419
.418
.2-0
.81.
9-7
180.
06.
60
-114
5
146
CP52
2119
/09/
2018
117
1.4
157.
114
%10
%0.
50.
410
.415
.917
.118
.4-0
.62.
14
-59
0.1
5.0
00
146
147
CP38
0722
/08/
2018
117
1.3
161.
013
%11
%0.
20.
410
.115
.515
.616
.9-0
.62.
9-4
-51
0.2
5.0
-1-1
147
148
CP58
3501
/10/
2018
117
1.2
159.
414
%14
%0.
50.
410
.115
.515
.215
.7-0
.31.
86
-48
-0.1
5.7
10
148
149
CP52
6320
/09/
2018
117
0.9
157.
214
%11
%0.
60.
39.
715
.317
.418
.2-0
.52.
5-3
-67
0.2
5.0
-1-1
149
150
CP51
5116
/09/
2018
117
0.9
152.
316
%20
%0.
50.
611
.117
.721
.821
.9-0
.11.
4-1
2-2
90.
26.
40
015
0
Toda
ys ra
ms a
vera
ge2
169.
315
4.7
15%
17%
0.4
0.5
9.9
15.8
17.5
17.7
-0.7
1.6
1-3
10.
05.
1-1
-1M
ater
nal p
erce
ntile
ave
rage
5014
3.5
133.
18%
8%0.
10.
58.
312
.313
.213
.6-0
.60.
814
-22
3.8
top
5% y
ello
w, t
op 1
0% g
rey,
top
25 %
bol
d ty
pe

page
17
PHEN
OTY
PEB
REE
D C
ON
TEN
TAD
DIT
ION
AL IN
FOR
MAT
ION
AS
RAW
DAT
APE
LT
FAC
EN
OSE
FEET
BU
MD
AMC
UR
VELO
TPu
rcha
ser
Pric
eC
omp
CP
EFB
LR
MPD
TXW
SSK
INC
OV
JAW
PIG
PIG
LEG
SB
ACK
CO
VAG
EB
END
SIR
ELO
T12
663
66
136
63
21
22
22
33
6%14
0069
126
127
616
23
132
131
21
11
11
11
22%
1721
8712
712
869
313
21
22
22
33
13%
1224
0212
812
988
66
33
11
12
12
112
%17
2669
129
130
946
32
21
22
13
115
%15
1160
130
131
886
61
21
24
11
11
10%
1700
7613
113
242
23
192
322
21
11
31
21
-1%
1705
3513
213
355
23
132
252
21
11
21
31
7%17
0535
133
134
7413
132
21
21
11
12
19%
1620
4213
413
581
613
12
11
12
12
115
%17
0076
135
136
816
133
21
54
11
25
10%
1627
9613
613
762
613
191
11
42
11
15
25%
1620
4213
713
855
26
313
219
**
15
5*
**
48%
1705
3513
813
963
919
92
21
55
12
23
-4%
1600
6413
914
067
33
62
19*
*1
22
**
*3
14%
1705
3514
0
141
496
1313
613
31
14
51
12
224
%16
2042
141
142
6113
1313
23
13
11
12
521
%16
2042
142
143
422
319
232
31
14
51
12
15%
1705
3514
314
482
66
63
11
51
21
31
20%
1703
6814
414
582
36
36
22
15
51
12
14%
1712
0314
5
146
506
613
252
21
33
22
21
16%
1627
6214
614
768
613
133
22
43
12
33
9%16
2762
147
148
946
33
25
51
13
12%
1726
6914
814
956
619
193
21
55
22
41
19%
1627
6214
915
094
61
21
33
11
21
24%
1511
6015
0
Of t
his
cata
logu
e: c
urve
ben
d to
p 5
% y
ello
w, t
op 1
0 %
gre
y, to
p 25
% b
old
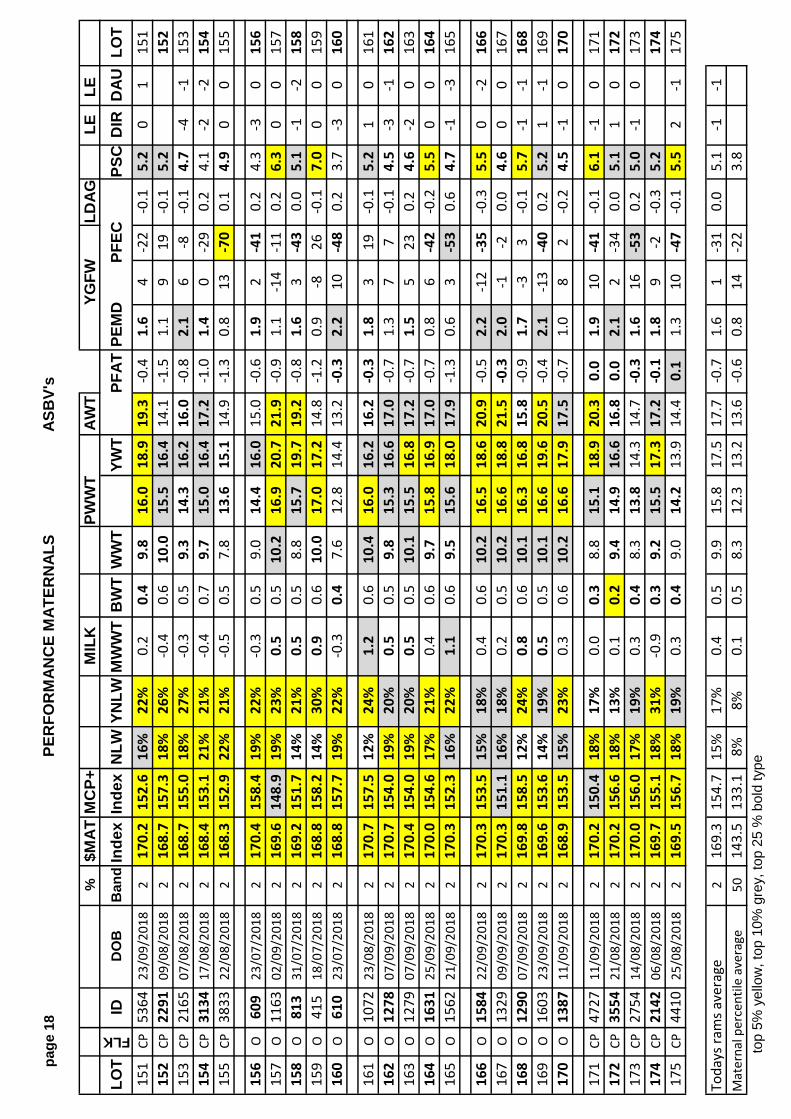
page
18
PER
FOR
MAN
CE
MAT
ERN
ALS
ASB
V's
%$M
ATM
CP+
MIL
KPW
WT
AWT
YGFW
LDAG
LELE
LO
T
FLK
IDD
OB
Ban
dIn
dex
Inde
xN
LWYN
LWM
WW
TB
WT
WW
TYW
TPF
ATPE
MD
PFEC
PSC
DIR
DAU
LOT
151
CP53
6423
/09/
2018
217
0.2
152.
616
%22
%0.
20.
49.
816
.018
.919
.3-0
.41.
64
-22
-0.1
5.2
01
151
152
CP22
9109
/08/
2018
216
8.7
157.
318
%26
%-0
.40.
610
.015
.516
.414
.1-1
.51.
19
19-0
.15.
215
215
3CP
2165
07/0
8/20
182
168.
715
5.0
18%
27%
-0.3
0.5
9.3
14.3
16.2
16.0
-0.8
2.1
6-8
-0.1
4.7
-4-1
153
154
CP31
3417
/08/
2018
216
8.4
153.
121
%21
%-0
.40.
79.
715
.016
.417
.2-1
.01.
40
-29
0.2
4.1
-2-2
154
155
CP38
3322
/08/
2018
216
8.3
152.
922
%21
%-0
.50.
57.
813
.615
.114
.9-1
.30.
813
-70
0.1
4.9
00
155
156
O60
923
/07/
2018
217
0.4
158.
419
%22
%-0
.30.
59.
014
.416
.015
.0-0
.61.
92
-41
0.2
4.3
-30
156
157
O11
6302
/09/
2018
216
9.6
148.
919
%23
%0.
50.
510
.216
.920
.721
.9-0
.91.
1-1
4-1
10.
26.
30
015
715
8O
813
31/0
7/20
182
169.
215
1.7
14%
21%
0.5
0.5
8.8
15.7
19.7
19.2
-0.8
1.6
3-4
30.
05.
1-1
-215
815
9O
415
18/0
7/20
182
168.
815
8.2
14%
30%
0.9
0.6
10.0
17.0
17.2
14.8
-1.2
0.9
-826
-0.1
7.0
00
159
160
O61
023
/07/
2018
216
8.8
157.
719
%22
%-0
.30.
47.
612
.814
.413
.2-0
.32.
210
-48
0.2
3.7
-30
160
161
O10
7223
/08/
2018
217
0.7
157.
512
%24
%1.
20.
610
.416
.016
.216
.2-0
.31.
83
19-0
.15.
21
016
116
2O
1278
07/0
9/20
182
170.
715
4.0
19%
20%
0.5
0.5
9.8
15.3
16.6
17.0
-0.7
1.3
77
-0.1
4.5
-3-1
162
163
O12
7907
/09/
2018
217
0.4
154.
019
%20
%0.
50.
510
.115
.516
.817
.2-0
.71.
55
230.
24.
6-2
016
316
4O
1631
25/0
9/20
182
170.
015
4.6
17%
21%
0.4
0.6
9.7
15.8
16.9
17.0
-0.7
0.8
6-4
2-0
.25.
50
016
416
5O
1562
21/0
9/20
182
170.
315
2.3
16%
22%
1.1
0.6
9.5
15.6
18.0
17.9
-1.3
0.6
3-5
30.
64.
7-1
-316
5
166
O15
8422
/09/
2018
217
0.3
153.
515
%18
%0.
40.
610
.216
.518
.620
.9-0
.52.
2-1
2-3
5-0
.35.
50
-216
616
7O
1329
09/0
9/20
182
170.
315
1.1
16%
18%
0.2
0.5
10.2
16.6
18.8
21.5
-0.3
2.0
-1-2
0.0
4.6
00
167
168
O12
9007
/09/
2018
216
9.8
158.
512
%24
%0.
80.
610
.116
.316
.815
.8-0
.91.
7-3
3-0
.15.
7-1
-116
816
9O
1603
23/0
9/20
182
169.
615
3.6
14%
19%
0.5
0.5
10.1
16.6
19.6
20.5
-0.4
2.1
-13
-40
0.2
5.2
1-1
169
170
O13
8711
/09/
2018
216
8.9
153.
515
%23
%0.
30.
610
.216
.617
.917
.5-0
.71.
08
2-0
.24.
5-1
017
0
171
CP47
2711
/09/
2018
217
0.2
150.
418
%17
%0.
00.
38.
815
.118
.920
.30.
01.
910
-41
-0.1
6.1
-10
171
172
CP35
5421
/08/
2018
217
0.2
156.
618
%13
%0.
10.
29.
414
.916
.616
.80.
02.
12
-34
0.0
5.1
10
172
173
CP27
5414
/08/
2018
217
0.0
156.
017
%19
%0.
30.
48.
313
.814
.314
.7-0
.31.
616
-53
0.2
5.0
-10
173
174
CP21
4206
/08/
2018
216
9.7
155.
118
%31
%-0
.90.
39.
215
.517
.317
.2-0
.11.
89
-2-0
.35.
217
417
5CP
4410
25/0
8/20
182
169.
515
6.7
18%
19%
0.3
0.4
9.0
14.2
13.9
14.4
0.1
1.3
10-4
7-0
.15.
52
-117
5
Toda
ys ra
ms a
vera
ge2
169.
315
4.7
15%
17%
0.4
0.5
9.9
15.8
17.5
17.7
-0.7
1.6
1-3
10.
05.
1-1
-1M
ater
nal p
erce
ntile
ave
rage
5014
3.5
133.
18%
8%0.
10.
58.
312
.313
.213
.6-0
.60.
814
-22
3.8
top
5% y
ello
w, t
op 1
0% g
rey,
top
25 %
bol
d ty
pe

page
19
PHEN
OTY
PEB
REE
D C
ON
TEN
TAD
DIT
ION
AL IN
FOR
MAT
ION
AS
RAW
DAT
APE
LT
FAC
EN
OSE
FEET
BU
MD
AMC
UR
VELO
TPu
rcha
ser
Pric
eC
omp
CP
EFB
LR
MPD
TXW
SSK
INC
OV
JAW
PIG
PIG
LEG
SB
ACK
CO
VAG
EB
END
SIR
ELO
T15
194
62
21
55
11
31
21%
1511
6015
115
263
625
62
21
33
11
37
-9%
1302
7515
215
363
631
32
14
41
13
412
%13
0275
153
154
5513
1319
32
14
41
13
315
%15
3273
154
155
5031
613
32
13
31
13
410
%17
3601
155
156
7525
22
15
42
12
54%
1627
9615
615
710
01
11
45
11
22
29%
1601
3015
715
894
63
11
55
11
13
22%
1648
5815
815
981
62
38
22
13
51
13
3-1
3%17
0763
159
160
7525
22
14
41
12
53%
1627
9616
0
161
883
63
31
15
51
11
12%
1712
0316
116
275
66
133
21
35
11
21
11%
1703
6816
216
375
66
132
11
55
11
11
11%
1703
6816
316
488
66
21
15
51
13
17%
1704
8516
416
568
613
132
21
55
11
22
15%
1620
4216
5
166
626
1319
22
15
51
11
127
%17
0906
166
167
484
613
425
22
13
31
12
129
%17
0535
167
168
883
63
22
15
41
12
1-3
%17
1203
168
169
566
1919
22
15
52
12
124
%17
0906
169
170
886
61
21
25
11
11
6%17
0076
170
171
7513
66
33
25
32
22
134
%17
2187
171
172
6113
1313
32
14
41
11
213
%16
2762
172
173
7513
66
33
24
42
24
27%
1622
3617
317
468
613
133
31
33
22
33
11%
1302
7517
417
575
62
63
26
32
13
32
23
21%
1726
6917
5
Of t
his
cata
logu
e: c
urve
ben
d to
p 5
% y
ello
w, t
op 1
0 %
gre
y, to
p 25
% b
old

page
20
PER
FOR
MAN
CE
MAT
ERN
ALS
ASB
V's
%$M
ATM
CP+
MIL
KPW
WT
AWT
YGFW
LDAG
LELE
LO
T
FLK
IDD
OB
Ban
dIn
dex
Inde
xN
LWYN
LWM
WW
TB
WT
WW
TYW
TPF
ATPE
MD
PFEC
PSC
DIR
DAU
LOT
176
CP35
2421
/08/
2018
216
9.5
154.
919
%17
%-0
.10.
58.
814
.918
.217
.3-0
.91.
8-2
-48
0.0
5.7
-1-2
176
177
CP26
6812
/08/
2018
216
9.4
157.
220
%14
%-0
.10.
37.
313
.115
.413
.9-0
.31.
910
-78
0.3
4.4
0-2
177
178
CP32
7821
/08/
2018
216
9.3
153.
217
%13
%0.
20.
69.
716
.120
.520
.3-0
.52.
1-1
3-5
30.
25.
0-2
-217
817
9CP
2412
08/0
8/20
182
169.
115
4.4
18%
20%
0.0
0.3
9.0
14.8
17.6
17.0
-0.7
1.8
3-3
40.
44.
91
117
918
0CP
5160
16/0
9/20
182
169.
115
5.0
17%
14%
0.3
0.2
8.1
13.7
16.6
16.7
0.4
2.5
0-5
50.
44.
71
118
0
181
CP50
2614
/09/
2018
216
8.8
154.
117
%15
%0.
40.
37.
713
.315
.716
.00.
32.
49
0.0
5.3
-1-1
181
182
CP50
2514
/09/
2018
216
8.6
153.
717
%16
%0.
40.
37.
913
.616
.316
.50.
42.
45
0.0
5.4
-2-1
182
183
CP59
3502
/10/
2018
216
8.6
153.
917
%19
%0.
60.
39.
113
.916
.216
.6-0
.72.
0-3
-48
0.2
4.2
00
183
184
CP23
0708
/08/
2018
216
8.5
157.
018
%11
%-0
.40.
49.
915
.514
.815
.1-1
.31.
39
-32
0.1
5.6
10
184
185
CP27
3014
/08/
2018
216
8.2
154.
919
%16
%0.
30.
610
.216
.315
.915
.5-1
.00.
51
3-0
.16.
20
-118
5
186
CP61
5205
/10/
2018
117
1.1
151.
019
%14
%0.
30.
49.
215
.320
.021
.0-0
.81.
9-2
-64
0.5
5.1
00
186
187
CP32
8021
/08/
2018
217
0.8
159.
918
%14
%-0
.10.
58.
414
.114
.114
.30.
02.
29
-62
0.2
4.5
-20
187
188
CP46
6205
/09/
2018
217
0.8
153.
618
%17
%0.
30.
59.
515
.618
.718
.3-0
.31.
46
0.0
5.4
00
188
189
CP59
2501
/10/
2018
217
0.4
152.
717
%18
%0.
70.
59.
414
.715
.618
.0-0
.61.
69
-37
-0.1
4.8
-1-2
189
190
CP49
2708
/09/
2018
217
0.2
153.
919
%12
%0.
50.
37.
813
.516
.716
.7-0
.22.
09
-67
0.2
5.6
1-1
190
191
CP26
6912
/08/
2018
216
8.5
156.
720
%14
%-0
.20.
37.
313
.015
.614
.0-0
.51.
94
-79
0.3
4.5
0-2
191
192
CP37
1821
/08/
2018
216
8.3
158.
816
%19
%0.
20.
37.
913
.514
.214
.20.
42.
5-7
-76
-0.1
4.5
10
192
193
CP28
3815
/08/
2018
216
8.3
157.
117
%19
%-0
.20.
27.
413
.515
.014
.90.
02.
3-1
-85
0.2
4.1
21
193
194
CP26
4911
/08/
2018
216
8.2
155.
622
%15
%-0
.30.
16.
411
.414
.213
.30.
72.
610
-60
0.0
4.3
10
194
195
CP21
4707
/08/
2018
216
8.9
158.
016
%17
%-0
.20.
69.
114
.215
.214
.8-0
.51.
97
-72
0.0
4.5
-10
195
196
CP52
6220
/09/
2018
216
9.2
154.
013
%13
%0.
30.
49.
516
.318
.518
.4-0
.61.
38
-64
-0.4
5.0
10
196
197
CP22
0507
/08/
2018
216
8.9
160.
113
%12
%-0
.20.
710
.315
.816
.215
.0-0
.61.
76
-68
-0.2
4.4
-10
197
198
CP47
7612
/09/
2018
216
8.8
157.
715
%17
%0.
20.
27.
913
.614
.514
.40.
22.
39
-64
-0.3
4.2
10
198
199
CP34
4520
/08/
2018
216
8.2
155.
216
%19
%-0
.30.
58.
914
.917
.215
.8-0
.61.
410
-65
0.3
4.5
0-1
199
200
CP29
4817
/08/
2018
217
0.8
152.
015
%18
%1.
10.
310
.516
.718
.620
.4-0
.60.
8-4
-72
0.1
5.0
30
200
Toda
ys ra
ms a
vera
ge2
169.
315
4.7
15%
17%
0.4
0.5
9.9
15.8
17.5
17.7
-0.7
1.6
1-3
10.
05.
1-1
-1M
ater
nal p
erce
ntile
ave
rage
5014
3.5
133.
18%
8%0.
10.
58.
312
.313
.213
.6-0
.60.
814
-22
3.8
top
5% y
ello
w, t
op 1
0% g
rey,
top
25 %
bol
d ty
pe

page
21
PHEN
OTY
PEB
REE
D C
ON
TEN
TAD
DIT
ION
AL IN
FOR
MAT
ION
AS
RAW
DAT
APE
LT
FAC
EN
OSE
FEET
BU
MD
AMC
UR
VELO
TPu
rcha
ser
Pric
eC
omp
CP
EFB
LR
MPD
TXW
SSK
INC
OV
JAW
PIG
PIG
LEG
SB
ACK
CO
VAG
EB
END
SIR
ELO
T17
687
132
21
33
21
33
16%
1740
1617
617
769
625
33
15
42
23
26%
1224
0217
717
863
631
32
25
51
22
326
%17
4016
178
179
626
136
133
21
54
22
32
15%
1600
6417
918
074
1313
23
14
42
23
122
%16
2762
180
181
766
66
63
21
44
11
21
20%
1721
8718
118
276
66
66
32
15
51
12
122
%17
2187
182
183
8013
23
23
11
55
21
31
19%
1627
6218
318
469
63
136
33
31
33
21
33
-2%
1726
6818
418
575
613
64
21
55
21
34
-5%
1726
6818
5
186
876
23
23
31
43
23
31
37%
1627
6218
618
762
136
613
33
13
32
13
42%
1622
3618
718
881
136
32
15
52
23
117
%17
3076
188
189
802
133
22
32
44
11
21
22%
1727
9218
919
081
136
32
25
51
13
124
%17
2385
190
191
696
252
31
55
42
32
8%12
2402
191
192
6813
192
31
44
11
32
5%17
3282
192
193
823
63
63
21
33
21
33
10%
1732
8219
319
468
1913
22
13
32
13
317
%17
2384
194
195
626
613
133
21
33
22
23
4%14
0069
195
196
816
133
21
55
22
31
13%
1635
1019
619
762
613
613
32
14
41
23
3-5
%14
0069
197
198
8713
32
14
41
13
15%
1635
1019
819
969
625
43
14
42
14
37%
1532
7319
920
081
613
22
13
31
12
222
%16
4460
200
Of t
his
cata
logu
e: c
urve
ben
d to
p 5
% y
ello
w, t
op 1
0 %
gre
y, to
p 25
% b
old

page
22
PER
FOR
MAN
CE
MAT
ERN
ALS
ASB
V's
%$M
ATM
CP+
MIL
KPW
WT
AWT
YGFW
LDAG
LELE
LO
T
FLK
IDD
OB
Ban
dIn
dex
Inde
xN
LWYN
LWM
WW
TB
WT
WW
TYW
TPF
ATPE
MD
PFEC
PSC
DIR
DAU
LOT
201
CP61
2604
/10/
2018
216
9.9
158.
015
%14
%0.
80.
49.
714
.916
.916
.6-0
.52.
3-1
2-6
20.
34.
70
-120
120
2CP
4874
10/0
9/20
182
169.
815
5.2
18%
14%
0.1
0.4
9.5
15.7
19.1
18.4
-0.7
1.5
-8-7
90.
45.
20
-220
220
3CP
2161
07/0
8/20
182
169.
715
6.0
10%
13%
0.4
0.9
11.9
17.6
18.6
19.0
-0.9
1.2
7-6
30.
15.
4-1
020
320
4CP
3959
23/0
8/20
182
169.
715
8.2
16%
16%
0.1
0.5
9.1
15.1
16.5
16.3
0.1
2.0
-4-7
50.
15.
80
-120
420
5CP
2697
13/0
8/20
182
169.
315
5.2
19%
20%
-0.1
0.5
8.5
14.5
16.5
17.6
0.1
2.1
-8-7
90.
24.
3-1
-120
5
206
O83
302
/08/
2018
217
0.8
156.
818
%15
%0.
60.
48.
814
.817
.416
.7-0
.91.
7-5
-77
0.5
4.9
-1-3
206
207
O28
614
/07/
2018
217
0.2
157.
819
%16
%0.
30.
48.
814
.315
.514
.4-1
.11.
45
-62
0.2
4.2
0-1
207
208
O43
619
/07/
2018
216
9.7
154.
813
%20
%0.
60.
69.
414
.816
.517
.2-0
.71.
89
-65
-0.2
3.8
-3-3
208
209
O43
719
/07/
2018
217
0.3
155.
514
%22
%0.
60.
58.
514
.116
.116
.3-0
.52.
010
-58
0.0
4.4
-3-3
209
210
O15
310
/07/
2018
216
9.0
159.
023
%22
%-0
.60.
47.
513
.114
.512
.9-0
.52.
0-3
-51
0.3
6.1
-2-2
210
211
O80
731
/07/
2018
217
0.6
152.
714
%15
%0.
50.
611
.117
.119
.820
.4-0
.51.
36
-29
0.1
5.8
-2-1
211
212
O22
613
/07/
2018
217
0.5
154.
27%
9%1.
30.
611
.217
.518
.721
.1-0
.72.
22
-38
-0.1
4.6
-1-2
212
213
O15
2118
/09/
2018
216
9.2
154.
211
%16
%0.
60.
510
.917
.319
.319
.2-0
.81.
53
-18
0.1
5.6
-1-2
213
214
O13
2108
/09/
2018
216
8.8
151.
511
%12
%1.
00.
611
.116
.818
.520
.5-0
.61.
42
-47
-0.1
5.2
-2-5
214
215
O14
0112
/09/
2018
216
8.2
154.
27%
14%
1.3
0.6
11.9
19.1
21.3
21.7
-0.7
1.9
-21
-11
-0.1
6.7
0-1
215
216
O39
617
/07/
2018
216
9.4
147.
114
%16
%1.
00.
510
.516
.521
.022
.6-0
.71.
23
-43
0.4
5.3
0-2
216
217
O83
07/0
7/20
182
168.
515
4.4
10%
18%
0.9
0.5
10.8
17.4
18.8
19.8
-1.4
2.0
-13
-80.
25.
6-1
-221
721
8O
108
09/0
7/20
182
168.
314
6.9
16%
17%
0.9
0.6
10.6
16.3
19.1
21.6
-0.6
0.8
-2-4
60.
15.
30
-221
821
9O
214
12/0
7/20
182
168.
215
5.6
8%14
%0.
40.
611
.918
.519
.320
.1-0
.61.
9-7
-12
0.1
5.2
-2-2
219
220
O74
728
/07/
2018
216
8.1
148.
98%
10%
0.8
0.5
11.7
17.8
20.9
23.3
-0.9
1.8
2-3
90.
15.
8-1
-222
0
221
CP22
8408
/08/
2018
216
9.8
155.
212
%18
%1.
00.
510
.816
.115
.317
.4-1
.41.
15
-51
-0.5
4.7
00
221
222
CP42
1224
/08/
2018
217
0.8
153.
413
%11
%0.
10.
611
.617
.920
.221
.0-0
.31.
58
-9-0
.16.
30
022
222
3CP
2473
10/0
8/20
182
169.
615
5.4
12%
9%0.
40.
610
.717
.218
.018
.0-1
.71.
111
-41
0.0
5.5
0-2
223
224
CP56
3428
/09/
2018
216
9.4
157.
912
%15
%0.
70.
411
.317
.017
.817
.6-0
.72.
0-9
-30.
15.
71
022
422
5CP
2620
10/0
8/20
182
169.
115
5.7
11%
16%
1.3
0.8
10.7
16.1
16.0
16.4
-1.0
1.6
624
-0.1
4.3
0-1
225
Toda
ys ra
ms a
vera
ge2
169.
315
4.7
15%
17%
0.4
0.5
9.9
15.8
17.5
17.7
-0.7
1.6
1-3
10.
05.
1-1
-1M
ater
nal p
erce
ntile
ave
rage
5014
3.5
133.
18%
8%0.
10.
58.
312
.313
.213
.6-0
.60.
814
-22
3.8
top
5% y
ello
w, t
op 1
0% g
rey,
top
25 %
bol
d ty
pe
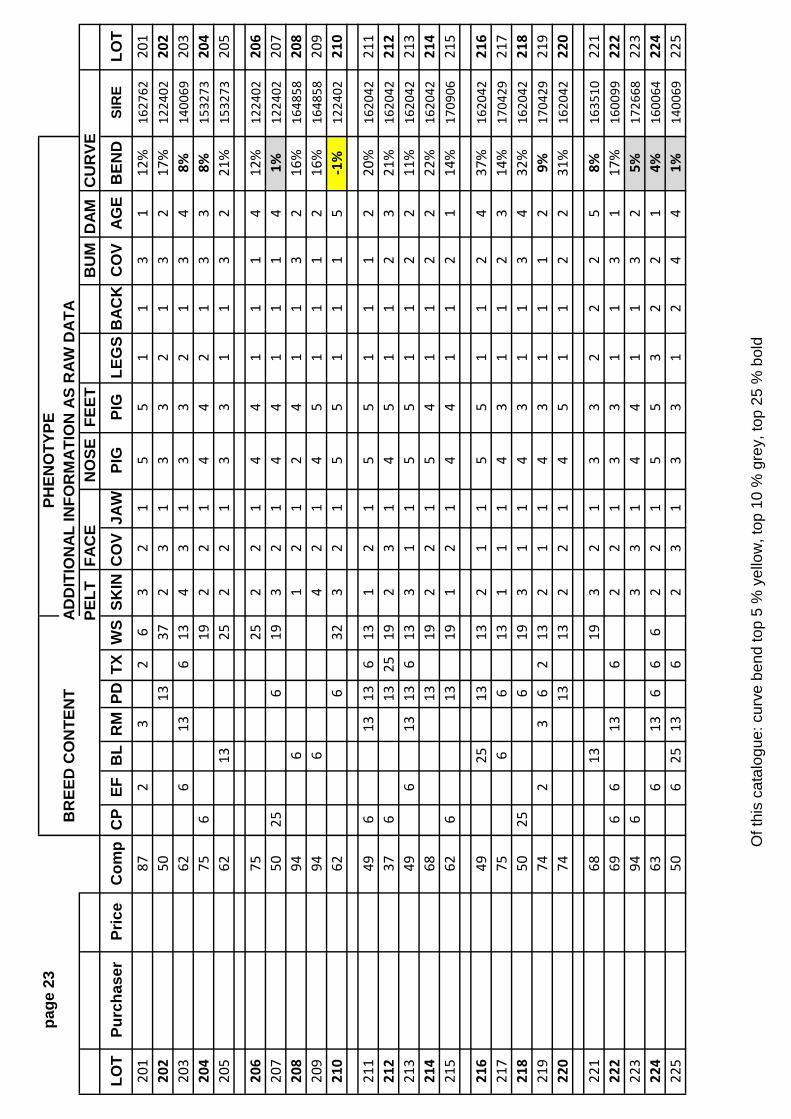
page
23
PHEN
OTY
PEB
REE
D C
ON
TEN
TAD
DIT
ION
AL IN
FOR
MAT
ION
AS
RAW
DAT
APE
LT
FAC
EN
OSE
FEET
BU
MD
AMC
UR
VELO
TPu
rcha
ser
Pric
eC
omp
CP
EFB
LR
MPD
TXW
SSK
INC
OV
JAW
PIG
PIG
LEG
SB
ACK
CO
VAG
EB
END
SIR
ELO
T20
187
23
26
32
15
51
13
112
%16
2762
201
202
5013
372
31
33
21
32
17%
1224
0220
220
362
613
613
43
13
32
13
48%
1400
6920
320
475
619
22
14
42
13
38%
1532
7320
420
562
1325
22
13
31
13
221
%15
3273
205
206
7525
22
14
41
11
412
%12
2402
206
207
5025
619
32
14
41
11
41%
1224
0220
720
894
61
21
24
11
32
16%
1648
5820
820
994
64
21
45
11
12
16%
1648
5820
921
062
632
32
15
51
11
5-1
%12
2402
210
211
496
1313
613
12
15
51
11
220
%16
2042
211
212
376
1325
192
31
45
11
23
21%
1620
4221
221
349
613
136
133
11
55
11
22
11%
1620
4221
321
468
1319
22
15
41
12
222
%16
2042
214
215
626
1319
12
14
41
12
114
%17
0906
215
216
4925
1313
21
15
51
12
437
%16
2042
216
217
756
613
11
14
31
12
314
%17
0429
217
218
5025
619
31
14
31
13
432
%16
2042
218
219
742
36
213
21
14
31
11
29%
1704
2921
922
074
1313
22
14
51
12
231
%16
2042
220
221
6813
193
21
33
22
25
8%16
3510
221
222
696
613
62
21
33
11
31
17%
1600
9922
222
394
63
31
44
11
32
5%17
2668
223
224
636
136
66
22
15
53
22
14%
1600
6422
422
550
625
136
23
13
31
24
41%
1400
6922
5
Of t
his
cata
logu
e: c
urve
ben
d to
p 5
% y
ello
w, t
op 1
0 %
gre
y, to
p 25
% b
old

page
24
PER
FOR
MAN
CE
MAT
ERN
ALS
ASB
V's
%$M
ATM
CP+
MIL
KPW
WT
AWT
YGFW
LDAG
LELE
LO
T
FLK
IDD
OB
Ban
dIn
dex
Inde
xN
LWYN
LWM
WW
TB
WT
WW
TYW
TPF
ATPE
MD
PFEC
PSC
DIR
DAU
LOT
226
CP58
6703
/10/
2018
217
0.8
156.
913
%21
%0.
30.
410
.116
.117
.217
.8-0
.71.
73
-57
-0.4
4.8
11
226
227
CP20
8006
/08/
2018
217
0.8
162.
012
%16
%0.
20.
811
.517
.016
.116
.1-0
.52.
1-2
-15
-0.2
4.7
-1-1
227
228
CP51
9921
/09/
2018
217
0.7
156.
512
%15
%1.
20.
510
.415
.815
.116
.8-1
.11.
27
-60
-0.5
4.6
0-1
228
229
CP58
3902
/10/
2018
216
8.5
150.
715
%17
%0.
40.
49.
916
.018
.419
.70.
01.
42
-32
-0.1
5.6
10
229
230
CP20
9307
/08/
2018
216
8.6
153.
417
%15
%0.
50.
710
.915
.615
.617
.3-1
.01.
13
-23
-0.1
4.3
0-1
230
231
CP29
5517
/08/
2018
216
9.2
156.
312
%15
%0.
10.
410
.416
.818
.017
.8-0
.51.
54
-50
-0.4
5.2
0-1
231
232
CP51
1515
/09/
2018
216
9.0
151.
812
%9%
0.9
0.5
10.1
16.0
18.5
19.0
-0.7
1.4
12-4
70.
25.
60
-223
223
3CP
6204
06/1
0/20
182
168.
615
1.2
15%
17%
0.7
0.5
10.6
16.5
17.7
19.4
-0.4
1.2
2-7
-0.2
5.7
01
233
234
CP21
4907
/08/
2018
216
8.5
154.
514
%12
%0.
80.
810
.916
.817
.218
.2-1
.01.
4-5
-16
0.3
4.3
-1-1
234
235
CP29
5017
/08/
2018
216
8.5
157.
611
%9%
-0.1
0.7
11.4
17.4
18.2
17.4
-1.4
1.4
6-4
6-0
.25.
5-1
-123
5
236
CP57
1329
/09/
2018
216
8.8
152.
914
%11
%0.
60.
49.
615
.818
.318
.2-1
.01.
36
-53
0.1
5.8
10
236
237
CP54
5225
/09/
2018
216
8.5
155.
412
%13
%1.
30.
69.
916
.117
.116
.7-0
.91.
5-2
-90.
45.
51
-123
723
8CP
6540
19/1
0/20
182
168.
415
4.9
15%
18%
-0.1
0.4
9.8
16.1
17.9
18.0
-0.7
2.0
-3-1
7-0
.15.
31
023
823
9CP
6110
04/1
0/20
182
168.
315
4.6
13%
18%
0.7
0.5
10.2
16.5
17.7
18.2
-1.4
1.3
-11
-57
-0.3
5.0
0-2
239
240
CP60
6722
/09/
2018
216
8.1
155.
512
%17
%0.
70.
59.
815
.918
.017
.0-0
.12.
0-4
-16
-0.1
5.3
01
240
241
CP56
8529
/09/
2018
217
0.2
154.
016
%20
%0.
30.
39.
515
.417
.117
.2-1
.01.
213
-37
-0.5
4.4
10
241
242
CP55
0026
/09/
2018
216
9.6
156.
216
%16
%0.
37.
913
.614
.615
.40.
32.
412
-0.1
5.2
-10
242
243
CP45
2327
/08/
2018
216
8.6
159.
916
%15
%0.
00.
27.
512
.311
.812
.30.
13.
213
-36
-0.1
4.7
20
243
244
CP34
7020
/08/
2018
216
8.3
154.
117
%15
%0.
30.
59.
114
.916
.617
.0-0
.41.
7-2
-49
0.3
4.4
10
244
245
CP30
9419
/08/
2018
216
8.3
149.
220
%23
%0.
70.
47.
812
.916
.516
.3-0
.91.
313
-29
0.0
4.4
12
245
246
O14
9216
/09/
2018
216
9.1
161.
011
%14
%0.
50.
510
.615
.815
.915
.0-0
.82.
4-4
-16
0.2
4.4
-10
246
247
O14
1112
/09/
2018
216
9.0
156.
98%
16%
1.7
0.7
11.0
16.3
16.0
16.5
-1.5
1.6
0-1
6-0
.34.
60
-224
724
8O
1376
10/0
9/20
182
168.
615
4.6
9%15
%1.
20.
711
.718
.319
.419
.8-1
.31.
3-1
0-2
7-0
.25.
1-1
-124
824
9O
1431
13/0
9/20
182
168.
615
7.5
13%
16%
-0.1
0.5
9.9
15.6
15.9
16.7
-0.9
2.5
2-2
8-0
.14.
5-2
-224
925
0O
1620
24/0
9/20
182
168.
415
8.9
12%
13%
0.2
0.4
10.1
14.9
14.2
15.1
-1.2
2.4
5-3
9-0
.13.
6-1
-125
0
Toda
ys ra
ms a
vera
ge2
169.
315
4.7
15%
17%
0.4
0.5
9.9
15.8
17.5
17.7
-0.7
1.6
1-3
10.
05.
1-1
-1M
ater
nal p
erce
ntile
ave
rage
5014
3.5
133.
18%
8%0.
10.
58.
312
.313
.213
.6-0
.60.
814
-22
3.8
top
5% y
ello
w, t
op 1
0% g
rey,
top
25 %
bol
d ty
pe
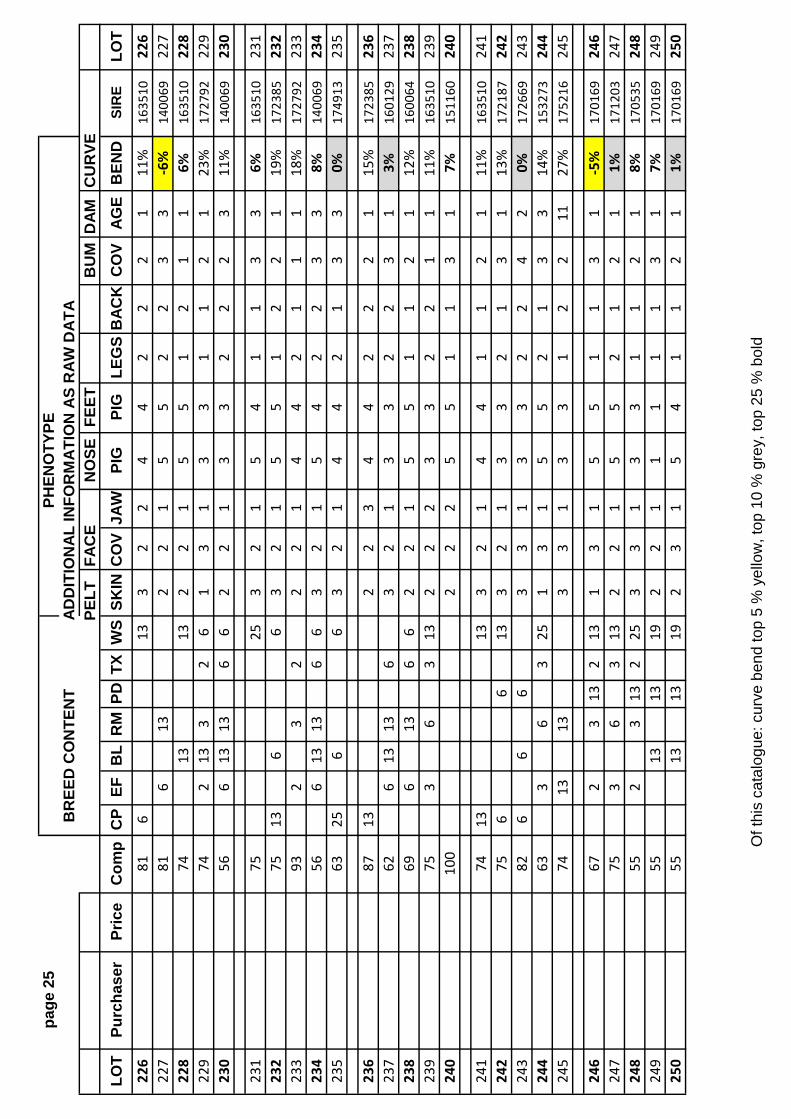
page
25
PHEN
OTY
PEB
REE
D C
ON
TEN
TAD
DIT
ION
AL IN
FOR
MAT
ION
AS
RAW
DAT
APE
LT
FAC
EN
OSE
FEET
BU
MD
AMC
UR
VELO
TPu
rcha
ser
Pric
eC
omp
CP
EFB
LR
MPD
TXW
SSK
INC
OV
JAW
PIG
PIG
LEG
SB
ACK
CO
VAG
EB
END
SIR
ELO
T22
681
613
32
24
42
22
111
%16
3510
226
227
816
132
21
55
22
33
-6%
1400
6922
722
874
1313
22
15
51
21
16%
1635
1022
822
974
213
32
61
31
33
11
21
23%
1727
9222
923
056
613
136
62
21
33
22
23
11%
1400
6923
0
231
7525
32
15
41
13
36%
1635
1023
123
275
136
63
21
55
12
21
19%
1723
8523
223
393
23
22
21
44
21
11
18%
1727
9223
323
456
613
136
63
21
54
22
33
8%14
0069
234
235
6325
66
32
14
42
13
30%
1749
1323
5
236
8713
22
34
42
22
115
%17
2385
236
237
626
1313
63
21
33
22
31
3%16
0129
237
238
696
136
62
21
55
11
21
12%
1600
6423
823
975
36
313
22
23
32
21
111
%16
3510
239
240
100
22
25
51
13
17%
1511
6024
0
241
7413
133
21
44
11
21
11%
1635
1024
124
275
66
133
21
33
21
31
13%
1721
8724
224
382
66
63
31
33
22
42
0%17
2669
243
244
633
63
251
31
55
21
33
14%
1532
7324
424
574
1313
33
13
31
22
1127
%17
5216
245
246
672
313
213
13
15
51
13
1-5
%17
0169
246
247
753
63
132
21
55
21
21
1%17
1203
247
248
552
313
225
33
13
31
12
18%
1705
3524
824
955
1313
192
21
11
11
31
7%17
0169
249
250
5513
1319
23
15
41
12
11%
1701
6925
0
Of t
his
cata
logu
e: c
urve
ben
d to
p 5
% y
ello
w, t
op 1
0 %
gre
y, to
p 25
% b
old
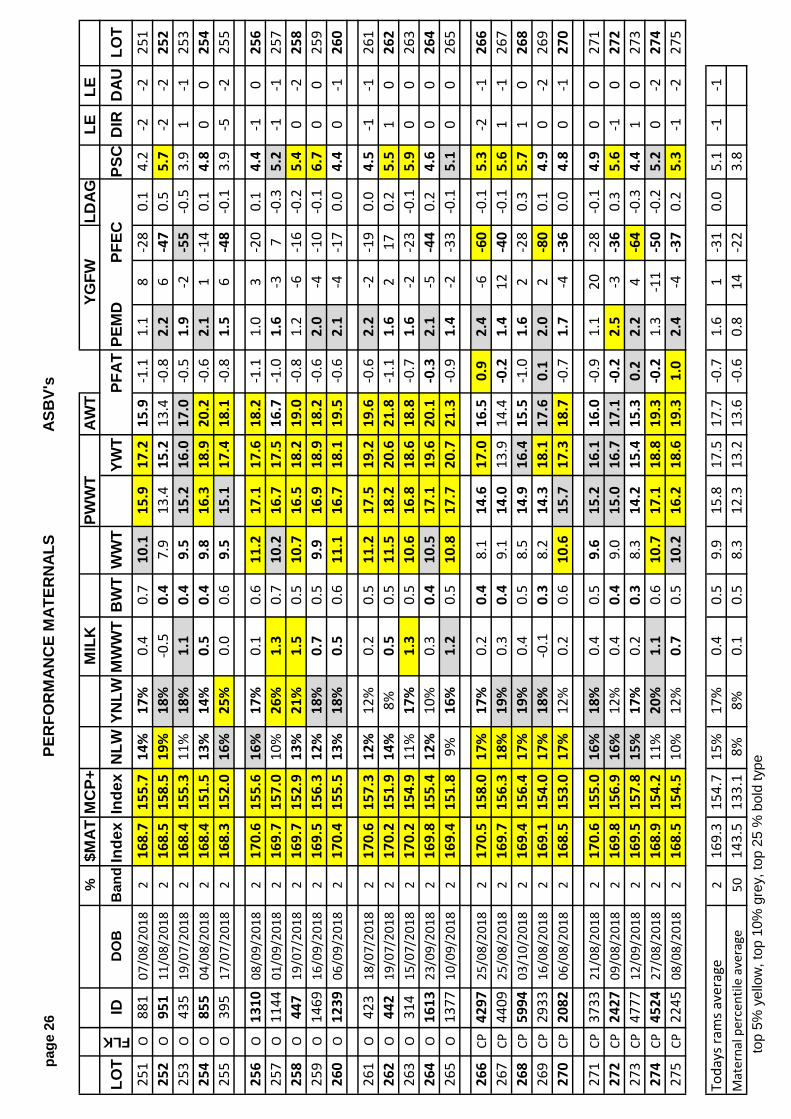
page
26
PER
FOR
MAN
CE
MAT
ERN
ALS
ASB
V's
%$M
ATM
CP+
MIL
KPW
WT
AWT
YGFW
LDAG
LELE
LO
T
FLK
IDD
OB
Ban
dIn
dex
Inde
xN
LWYN
LWM
WW
TB
WT
WW
TYW
TPF
ATPE
MD
PFEC
PSC
DIR
DAU
LOT
251
O88
107
/08/
2018
216
8.7
155.
714
%17
%0.
40.
710
.115
.917
.215
.9-1
.11.
18
-28
0.1
4.2
-2-2
251
252
O95
111
/08/
2018
216
8.5
158.
519
%18
%-0
.50.
47.
913
.415
.213
.4-0
.82.
26
-47
0.5
5.7
-2-2
252
253
O43
519
/07/
2018
216
8.4
155.
311
%18
%1.
10.
49.
515
.216
.017
.0-0
.51.
9-2
-55
-0.5
3.9
1-1
253
254
O85
504
/08/
2018
216
8.4
151.
513
%14
%0.
50.
49.
816
.318
.920
.2-0
.62.
11
-14
0.1
4.8
00
254
255
O39
517
/07/
2018
216
8.3
152.
016
%25
%0.
00.
69.
515
.117
.418
.1-0
.81.
56
-48
-0.1
3.9
-5-2
255
256
O13
1008
/09/
2018
217
0.6
155.
616
%17
%0.
10.
611
.217
.117
.618
.2-1
.11.
03
-20
0.1
4.4
-10
256
257
O11
4401
/09/
2018
216
9.7
157.
010
%26
%1.
30.
710
.216
.717
.516
.7-1
.01.
6-3
7-0
.35.
2-1
-125
725
8O
447
19/0
7/20
182
169.
715
2.9
13%
21%
1.5
0.5
10.7
16.5
18.2
19.0
-0.8
1.2
-6-1
6-0
.25.
40
-225
825
9O
1469
16/0
9/20
182
169.
515
6.3
12%
18%
0.7
0.5
9.9
16.9
18.9
18.2
-0.6
2.0
-4-1
0-0
.16.
70
025
926
0O
1239
06/0
9/20
182
170.
415
5.5
13%
18%
0.5
0.6
11.1
16.7
18.1
19.5
-0.6
2.1
-4-1
70.
04.
40
-126
0
261
O42
318
/07/
2018
217
0.6
157.
312
%12
%0.
20.
511
.217
.519
.219
.6-0
.62.
2-2
-19
0.0
4.5
-1-1
261
262
O44
219
/07/
2018
217
0.2
151.
914
%8%
0.5
0.5
11.5
18.2
20.6
21.8
-1.1
1.6
217
0.2
5.5
10
262
263
O31
415
/07/
2018
217
0.2
154.
911
%17
%1.
30.
510
.616
.818
.618
.8-0
.71.
6-2
-23
-0.1
5.9
00
263
264
O16
1323
/09/
2018
216
9.8
155.
412
%10
%0.
30.
410
.517
.119
.620
.1-0
.32.
1-5
-44
0.2
4.6
00
264
265
O13
7710
/09/
2018
216
9.4
151.
89%
16%
1.2
0.5
10.8
17.7
20.7
21.3
-0.9
1.4
-2-3
3-0
.15.
10
026
5
266
CP42
9725
/08/
2018
217
0.5
158.
017
%17
%0.
20.
48.
114
.617
.016
.50.
92.
4-6
-60
-0.1
5.3
-2-1
266
267
CP44
0925
/08/
2018
216
9.7
156.
318
%19
%0.
30.
49.
114
.013
.914
.4-0
.21.
412
-40
-0.1
5.6
1-1
267
268
CP59
9403
/10/
2018
216
9.4
156.
417
%19
%0.
40.
58.
514
.916
.415
.5-1
.01.
62
-28
0.3
5.7
10
268
269
CP29
3316
/08/
2018
216
9.1
154.
017
%18
%-0
.10.
38.
214
.318
.117
.60.
12.
02
-80
0.1
4.9
0-2
269
270
CP20
8206
/08/
2018
216
8.5
153.
017
%12
%0.
20.
610
.615
.717
.318
.7-0
.71.
7-4
-36
0.0
4.8
0-1
270
271
CP37
3321
/08/
2018
217
0.6
155.
016
%18
%0.
40.
59.
615
.216
.116
.0-0
.91.
120
-28
-0.1
4.9
00
271
272
CP24
2709
/08/
2018
216
9.8
156.
916
%12
%0.
40.
49.
015
.016
.717
.1-0
.22.
5-3
-36
0.3
5.6
-10
272
273
CP47
7712
/09/
2018
216
9.5
157.
815
%17
%0.
20.
38.
314
.215
.415
.30.
22.
24
-64
-0.3
4.4
10
273
274
CP45
2427
/08/
2018
216
8.9
154.
211
%20
%1.
10.
610
.717
.118
.819
.3-0
.21.
3-1
1-5
0-0
.25.
20
-227
427
5CP
2245
08/0
8/20
182
168.
515
4.5
10%
12%
0.7
0.5
10.2
16.2
18.6
19.3
1.0
2.4
-4-3
70.
25.
3-1
-227
5
Toda
ys ra
ms a
vera
ge2
169.
315
4.7
15%
17%
0.4
0.5
9.9
15.8
17.5
17.7
-0.7
1.6
1-3
10.
05.
1-1
-1M
ater
nal p
erce
ntile
ave
rage
5014
3.5
133.
18%
8%0.
10.
58.
312
.313
.213
.6-0
.60.
814
-22
3.8
top
5% y
ello
w, t
op 1
0% g
rey,
top
25 %
bol
d ty
pe

page
27
PHEN
OTY
PEB
REE
D C
ON
TEN
TAD
DIT
ION
AL IN
FOR
MAT
ION
AS
RAW
DAT
APE
LT
FAC
EN
OSE
FEET
BU
MD
AMC
UR
VELO
TPu
rcha
ser
Pric
eC
omp
CP
EFB
LR
MPD
TXW
SSK
INC
OV
JAW
PIG
PIG
LEG
SB
ACK
CO
VAG
EB
END
SIR
ELO
T25
181
613
23
12
11
12
20%
1627
9625
125
250
613
625
33
12
51
11
20%
1224
0225
225
387
132
11
32
11
12
12%
1635
1025
325
461
23
132
192
21
35
11
22
24%
1705
3525
425
594
64
11
55
11
13
20%
1648
5825
5
256
552
63
132
192
11
31
11
21
7%17
0535
256
257
946
12
12
21
12
10%
1700
7625
725
861
1313
132
11
12
11
23
15%
1620
4225
825
975
313
63
22
13
11
13
18%
1712
0325
926
056
619
193
21
24
11
21
16%
1709
0626
0
261
612
313
219
11
11
11
11
412
%17
0535
261
262
435
913
525
22
11
11
12
320
%17
0535
262
263
496
1313
192
11
33
11
14
12%
1620
4226
326
449
23
192
252
11
11
11
11
17%
1705
3526
426
555
23
132
252
11
44
11
11
20%
1705
3526
5
266
756
613
32
11
22
23
213
%16
4858
266
267
756
26
32
63
21
22
22
32
3%17
2669
267
268
696
613
63
21
11
11
41
4%16
0129
268
269
636
313
21
22
22
22
23%
1224
0226
927
082
135
32
11
12
23
420
%11
0449
270
271
7413
26
32
42
12
22
23
36%
1622
3627
127
256
613
252
31
11
11
32
14%
1740
1627
227
387
132
21
22
22
21
8%16
3510
273
274
746
23
213
22
22
22
22
212
%17
2434
274
275
3750
131
11
22
12
33
19%
1104
4927
5
Of t
his
cata
logu
e: c
urve
ben
d to
p 5
% y
ello
w, t
op 1
0 %
gre
y, to
p 25
% b
old
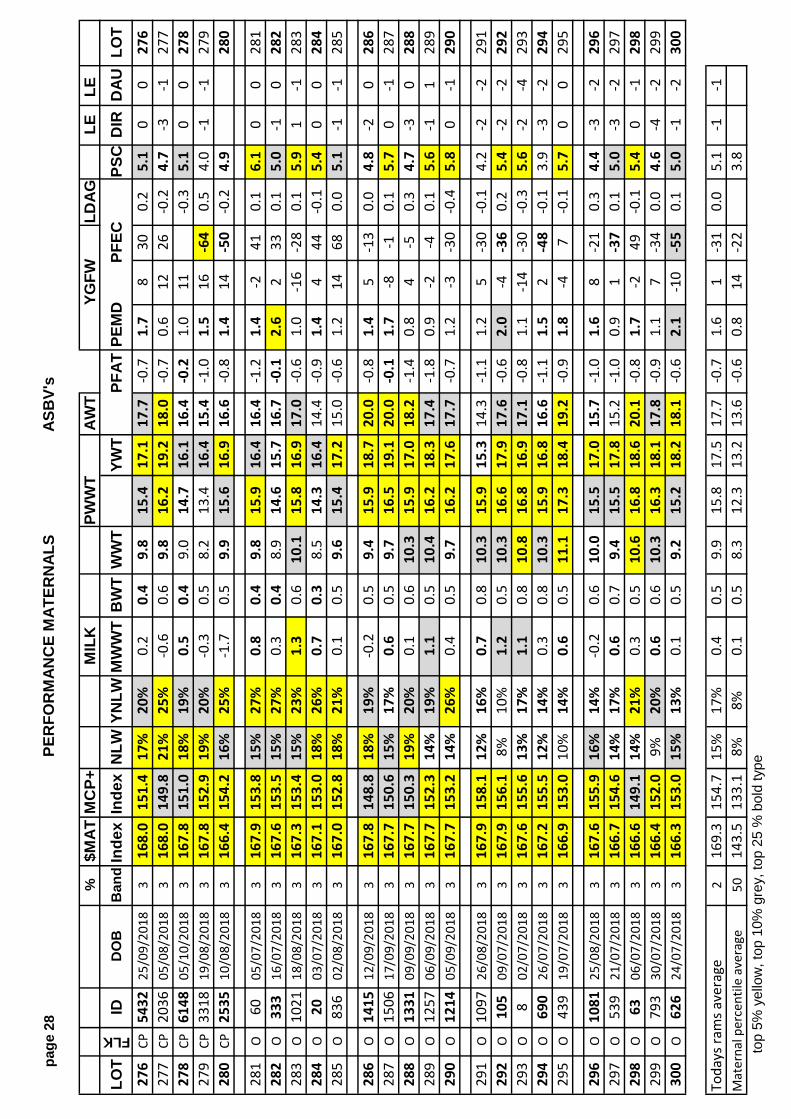
page
28
PER
FOR
MAN
CE
MAT
ERN
ALS
ASB
V's
%$M
ATM
CP+
MIL
KPW
WT
AWT
YGFW
LDAG
LELE
LO
T
FLK
IDD
OB
Ban
dIn
dex
Inde
xN
LWYN
LWM
WW
TB
WT
WW
TYW
TPF
ATPE
MD
PFEC
PSC
DIR
DAU
LOT
276
CP54
3225
/09/
2018
316
8.0
151.
417
%20
%0.
20.
49.
815
.417
.117
.7-0
.71.
78
300.
25.
10
027
627
7CP
2036
05/0
8/20
183
168.
014
9.8
21%
25%
-0.6
0.6
9.8
16.2
19.2
18.0
-0.7
0.6
1226
-0.2
4.7
-3-1
277
278
CP61
4805
/10/
2018
316
7.8
151.
018
%19
%0.
50.
49.
014
.716
.116
.4-0
.21.
011
-0.3
5.1
00
278
279
CP33
1819
/08/
2018
316
7.8
152.
919
%20
%-0
.30.
58.
213
.416
.415
.4-1
.01.
516
-64
0.5
4.0
-1-1
279
280
CP25
3510
/08/
2018
316
6.4
154.
216
%25
%-1
.70.
59.
915
.616
.916
.6-0
.81.
414
-50
-0.2
4.9
280
281
O60
05/0
7/20
183
167.
915
3.8
15%
27%
0.8
0.4
9.8
15.9
16.4
16.4
-1.2
1.4
-241
0.1
6.1
00
281
282
O33
316
/07/
2018
316
7.6
153.
515
%27
%0.
30.
48.
914
.615
.716
.7-0
.12.
62
330.
15.
0-1
028
228
3O
1021
18/0
8/20
183
167.
315
3.4
15%
23%
1.3
0.6
10.1
15.8
16.9
17.0
-0.6
1.0
-16
-28
0.1
5.9
1-1
283
284
O20
03/0
7/20
183
167.
115
3.0
18%
26%
0.7
0.3
8.5
14.3
16.4
14.4
-0.9
1.4
444
-0.1
5.4
00
284
285
O83
602
/08/
2018
316
7.0
152.
818
%21
%0.
10.
59.
615
.417
.215
.0-0
.61.
214
680.
05.
1-1
-128
5
286
O14
1512
/09/
2018
316
7.8
148.
818
%19
%-0
.20.
59.
415
.918
.720
.0-0
.81.
45
-13
0.0
4.8
-20
286
287
O15
0617
/09/
2018
316
7.7
150.
615
%17
%0.
60.
59.
716
.519
.120
.0-0
.11.
7-8
-10.
15.
70
-128
728
8O
1331
09/0
9/20
183
167.
715
0.3
19%
20%
0.1
0.6
10.3
15.9
17.0
18.2
-1.4
0.8
4-5
0.3
4.7
-30
288
289
O12
5706
/09/
2018
316
7.7
152.
314
%19
%1.
10.
510
.416
.218
.317
.4-1
.80.
9-2
-40.
15.
6-1
128
929
0O
1214
05/0
9/20
183
167.
715
3.2
14%
26%
0.4
0.5
9.7
16.2
17.6
17.7
-0.7
1.2
-3-3
0-0
.45.
80
-129
0
291
O10
9726
/08/
2018
316
7.9
158.
112
%16
%0.
70.
810
.315
.915
.314
.3-1
.11.
25
-30
-0.1
4.2
-2-2
291
292
O10
509
/07/
2018
316
7.9
156.
18%
10%
1.2
0.5
10.3
16.6
17.9
17.6
-0.6
2.0
-4-3
60.
25.
4-2
-229
229
3O
802
/07/
2018
316
7.6
155.
613
%17
%1.
10.
810
.816
.816
.917
.1-0
.81.
1-1
4-3
0-0
.35.
6-2
-429
329
4O
690
26/0
7/20
183
167.
215
5.5
12%
14%
0.3
0.8
10.3
15.9
16.8
16.6
-1.1
1.5
2-4
8-0
.13.
9-3
-229
429
5O
439
19/0
7/20
183
166.
915
3.0
10%
14%
0.6
0.5
11.1
17.3
18.4
19.2
-0.9
1.8
-47
-0.1
5.7
00
295
296
O10
8125
/08/
2018
316
7.6
155.
916
%14
%-0
.20.
610
.015
.517
.015
.7-1
.01.
68
-21
0.3
4.4
-3-2
296
297
O53
921
/07/
2018
316
6.7
154.
614
%17
%0.
60.
79.
415
.517
.815
.2-1
.00.
91
-37
0.1
5.0
-3-2
297
298
O63
06/0
7/20
183
166.
614
9.1
14%
21%
0.3
0.5
10.6
16.8
18.6
20.1
-0.8
1.7
-249
-0.1
5.4
0-1
298
299
O79
330
/07/
2018
316
6.4
152.
09%
20%
0.6
0.6
10.3
16.3
18.1
17.8
-0.9
1.1
7-3
40.
04.
6-4
-229
930
0O
626
24/0
7/20
183
166.
315
3.0
15%
13%
0.1
0.5
9.2
15.2
18.2
18.1
-0.6
2.1
-10
-55
0.1
5.0
-1-2
300
Toda
ys ra
ms a
vera
ge2
169.
315
4.7
15%
17%
0.4
0.5
9.9
15.8
17.5
17.7
-0.7
1.6
1-3
10.
05.
1-1
-1M
ater
nal p
erce
ntile
ave
rage
5014
3.5
133.
18%
8%0.
10.
58.
312
.313
.213
.6-0
.60.
814
-22
3.8
top
5% y
ello
w, t
op 1
0% g
rey,
top
25 %
bol
d ty
pe
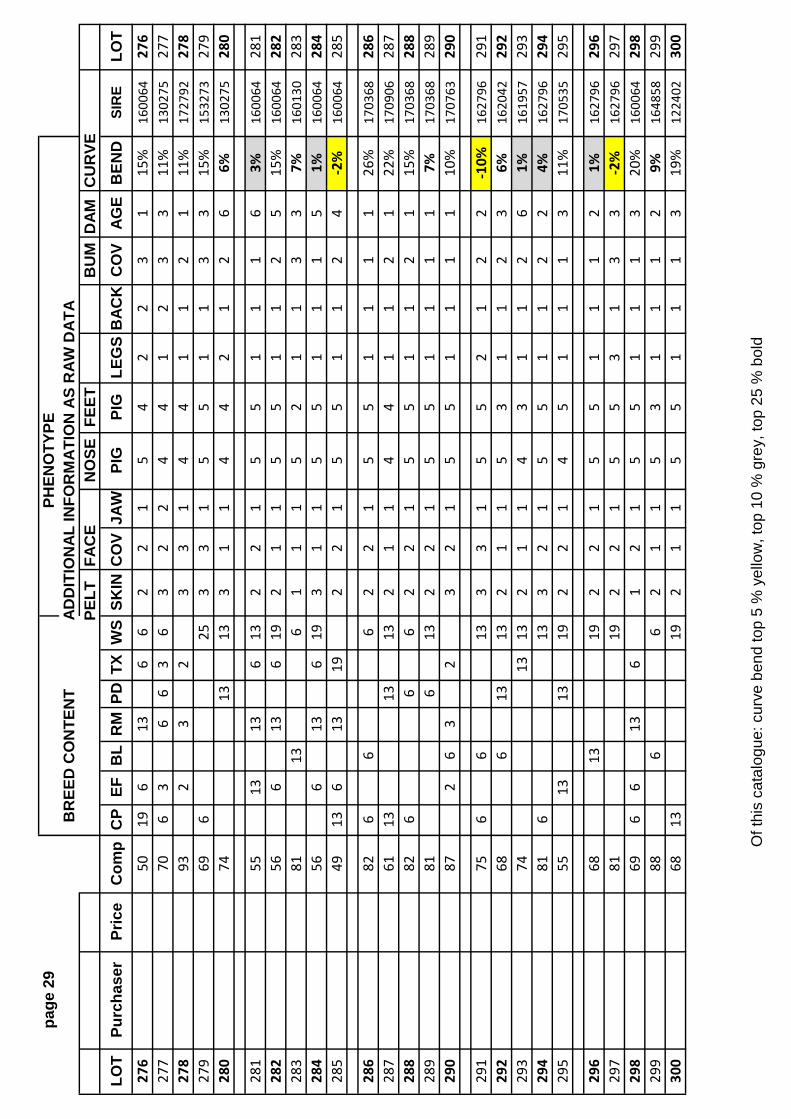
page
29
PHEN
OTY
PEB
REE
D C
ON
TEN
TAD
DIT
ION
AL IN
FOR
MAT
ION
AS
RAW
DAT
APE
LT
FAC
EN
OSE
FEET
BU
MD
AMC
UR
VELO
TPu
rcha
ser
Pric
eC
omp
CP
EFB
LR
MPD
TXW
SSK
INC
OV
JAW
PIG
PIG
LEG
SB
ACK
CO
VAG
EB
END
SIR
ELO
T27
650
196
136
62
21
54
22
31
15%
1600
6427
627
770
63
66
36
32
24
41
23
311
%13
0275
277
278
932
32
33
14
41
12
111
%17
2792
278
279
696
253
31
55
11
33
15%
1532
7327
928
074
1313
31
14
42
12
66%
1302
7528
0
281
5513
136
132
21
55
11
16
3%16
0064
281
282
566
136
192
11
55
11
25
15%
1600
6428
228
381
136
11
15
21
13
37%
1601
3028
328
456
613
619
31
15
51
11
51%
1600
6428
428
549
136
1319
22
15
51
12
4-2
%16
0064
285
286
826
66
22
15
51
11
126
%17
0368
286
287
6113
1313
21
14
41
12
122
%17
0906
287
288
826
66
22
15
51
12
115
%17
0368
288
289
816
132
21
55
11
11
7%17
0368
289
290
872
63
23
21
55
11
11
10%
1707
6329
0
291
756
613
33
15
52
12
2-1
0%16
2796
291
292
686
1313
21
15
31
12
36%
1620
4229
229
374
1313
21
14
31
12
61%
1619
5729
329
481
613
32
15
51
12
24%
1627
9629
429
555
1313
192
21
45
11
13
11%
1705
3529
5
296
6813
192
21
55
11
12
1%16
2796
296
297
8119
22
15
53
13
3-2
%16
2796
297
298
696
613
61
21
55
11
13
20%
1600
6429
829
988
66
21
15
31
11
29%
1648
5829
930
068
1319
21
15
51
11
319
%12
2402
300
Of t
his
cata
logu
e: c
urve
ben
d to
p 5
% y
ello
w, t
op 1
0 %
gre
y, to
p 25
% b
old

page
30
PER
FOR
MAN
CE
MAT
ERN
ALS
ASB
V's
%$M
ATM
CP+
MIL
KPW
WT
AWT
YGFW
LDAG
LELE
LO
T
FLK
IDD
OB
Ban
dIn
dex
Inde
xN
LWYN
LWM
WW
TB
WT
WW
TYW
TPF
ATPE
MD
PFEC
PSC
DIR
DAU
LOT
301
CP41
2423
/08/
2018
316
7.7
154.
017
%12
%-0
.10.
610
.516
.718
.118
.3-0
.71.
4-7
-17
0.0
6.4
-1-1
301
302
CP42
5325
/08/
2018
316
7.8
154.
115
%19
%0.
30.
49.
915
.917
.917
.0-1
.01.
60
10.
15.
80
130
230
3CP
2422
07/0
8/20
183
166.
415
4.5
13%
20%
0.1
0.5
10.8
16.8
17.6
16.0
-1.1
1.0
527
-0.2
6.7
0-1
303
304
CP64
0913
/10/
2018
316
6.4
152.
514
%19
%-0
.30.
510
.517
.018
.218
.9-0
.71.
1-5
-50
-0.3
5.6
00
304
305
CP60
8622
/10/
2018
316
7.8
153.
713
%11
%1.
30.
510
.715
.616
.518
.1-0
.91.
6-1
2-5
60.
15.
130
5
306
CP51
2015
/09/
2018
316
8.0
157.
59%
16%
0.4
0.4
10.2
16.5
18.9
17.5
0.0
2.3
-3-3
7-0
.15.
41
030
630
7CP
5410
24/0
9/20
183
167.
715
2.0
11%
14%
0.7
0.5
10.7
16.3
17.1
19.4
-1.0
1.5
2-5
6-0
.34.
70
-130
730
8CP
6277
08/1
0/20
183
166.
915
6.4
10%
18%
0.7
0.6
10.2
15.8
17.2
16.6
-0.4
2.2
-6-2
90.
14.
6-1
-130
830
9CP
3896
22/0
8/20
183
166.
715
5.7
10%
17%
0.1
0.7
10.2
16.4
16.5
17.1
-0.8
1.9
3-3
4-0
.25.
3-3
-330
931
0CP
5722
30/0
9/20
183
166.
615
5.2
11%
17%
0.5
0.4
10.1
16.1
16.7
16.5
-0.5
2.1
118
-0.1
5.6
10
310
311
CP53
7723
/09/
2018
216
8.6
147.
318
%17
%0.
50.
510
.216
.520
.222
.0-0
.61.
1-5
-0.2
5.9
00
311
312
CP26
9413
/08/
2018
316
7.7
148.
712
%15
%0.
30.
69.
915
.819
.421
.3-0
.32.
08
-47
-0.3
4.5
-4-3
312
313
CP54
7225
/09/
2018
316
7.6
148.
514
%15
%0.
70.
610
.416
.719
.120
.6-0
.31.
03
-23
-0.1
5.3
00
313
314
CP61
3004
/10/
2018
316
7.1
148.
913
%20
%0.
60.
510
.116
.520
.221
.6-0
.51.
9-1
0-3
30.
15.
2-2
-131
431
5CP
6555
02/1
0/20
183
166.
515
0.3
13%
17%
0.4
0.4
11.6
17.3
18.9
20.9
-1.2
1.7
-13
4-0
.16.
21
031
5
316
O12
4606
/09/
2018
316
7.3
152.
611
%16
%1.
30.
811
.717
.417
.818
.8-1
.80.
9-9
-5-0
.15.
2-3
-231
631
7O
1125
30/0
8/20
183
167.
115
3.9
12%
20%
1.3
0.4
9.7
15.9
16.9
16.8
-0.7
1.3
-8-2
9-0
.35.
31
031
731
8O
1587
22/0
9/20
183
167.
015
1.5
12%
17%
0.4
0.5
10.4
16.4
17.7
20.0
-0.2
2.0
-8-2
30.
14.
81
031
831
9O
1251
06/0
9/20
183
166.
915
2.8
15%
14%
0.5
0.5
11.4
16.1
16.0
17.1
-1.6
1.1
11
0.3
4.8
-20
319
320
O61
624
/07/
2018
316
6.8
156.
911
%19
%0.
70.
510
.316
.216
.015
.2-1
.31.
1-2
-41
-0.4
4.6
0-2
320
321
O49
820
/07/
2018
316
7.0
151.
611
%23
%0.
90.
59.
315
.217
.717
.6-0
.51.
42
-54
-0.2
4.6
-20
321
322
O69
826
/07/
2018
316
6.9
154.
916
%11
%0.
40.
37.
813
.615
.515
.4-0
.62.
3-1
-58
0.5
5.4
-1-3
322
323
O25
313
/07/
2018
316
6.9
154.
417
%20
%0.
80.
58.
313
.915
.113
.5-0
.80.
74
-56
0.0
5.1
11
323
324
O76
428
/07/
2018
316
7.6
152.
321
%18
%0.
10.
47.
813
.417
.215
.5-0
.31.
56
-45
0.4
4.1
-3-4
324
325
O75
528
/07/
2018
316
7.5
156.
714
%18
%0.
30.
38.
814
.715
.815
.2-0
.21.
8-3
-61
-0.4
4.6
00
325
Toda
ys ra
ms a
vera
ge2
169.
315
4.7
15%
17%
0.4
0.5
9.9
15.8
17.5
17.7
-0.7
1.6
1-3
10.
05.
1-1
-1M
ater
nal p
erce
ntile
ave
rage
5014
3.5
133.
18%
8%0.
10.
58.
312
.313
.213
.6-0
.60.
814
-22
3.8
top
5% y
ello
w, t
op 1
0% g
rey,
top
25 %
bol
d ty
pe

page
31
PHEN
OTY
PEB
REE
D C
ON
TEN
TAD
DIT
ION
AL IN
FOR
MAT
ION
AS
RAW
DAT
APE
LT
FAC
EN
OSE
FEET
BU
MD
AMC
UR
VELO
TPu
rcha
ser
Pric
eC
omp
CP
EFB
LR
MPD
TXW
SSK
INC
OV
JAW
PIG
PIG
LEG
SB
ACK
CO
VAG
EB
END
SIR
ELO
T30
175
619
23
23
32
24
210
%17
4016
301
302
566
136
192
31
44
11
34
7%16
0064
302
303
696
613
63
21
44
21
33
-5%
1600
6430
330
475
36
313
22
13
32
21
111
%16
3510
304
305
816
23
26
22
14
41
13
116
%16
2762
305
306
946
23
23
31
14
16%
1525
7730
630
769
66
193
21
33
12
31
19%
1635
1030
730
810
02
21
43
12
31
5%15
1160
308
309
756
136
23
15
51
13
34%
1619
5730
931
075
613
62
31
55
22
11
2%16
0064
310
311
6813
613
32
13
32
23
134
%17
3076
311
312
946
31
13
31
23
234
%16
4858
312
313
876
23
22
22
43
21
11
23%
1727
9231
331
475
66
133
21
33
11
31
31%
1511
6031
431
563
613
66
62
11
54
12
21
21%
1600
6431
5
316
886
63
21
55
11
21
8%17
0368
316
317
672
313
213
21
15
51
11
15%
1707
6331
731
862
613
192
31
45
11
31
22%
1709
0631
831
968
613
132
11
55
21
31
6%17
0368
319
320
8119
21
15
31
11
2-6
%16
3510
320
321
946
31
15
41
11
316
%16
4858
321
322
506
136
252
21
52
11
32
13%
1224
0232
232
374
29
213
22
14
51
11
7-3
%17
0763
323
324
6931
33
15
41
12
216
%12
2402
324
325
8713
22
15
51
11
23%
1635
1032
5
Of t
his
cata
logu
e: c
urve
ben
d to
p 5
% y
ello
w, t
op 1
0 %
gre
y, to
p 25
% b
old
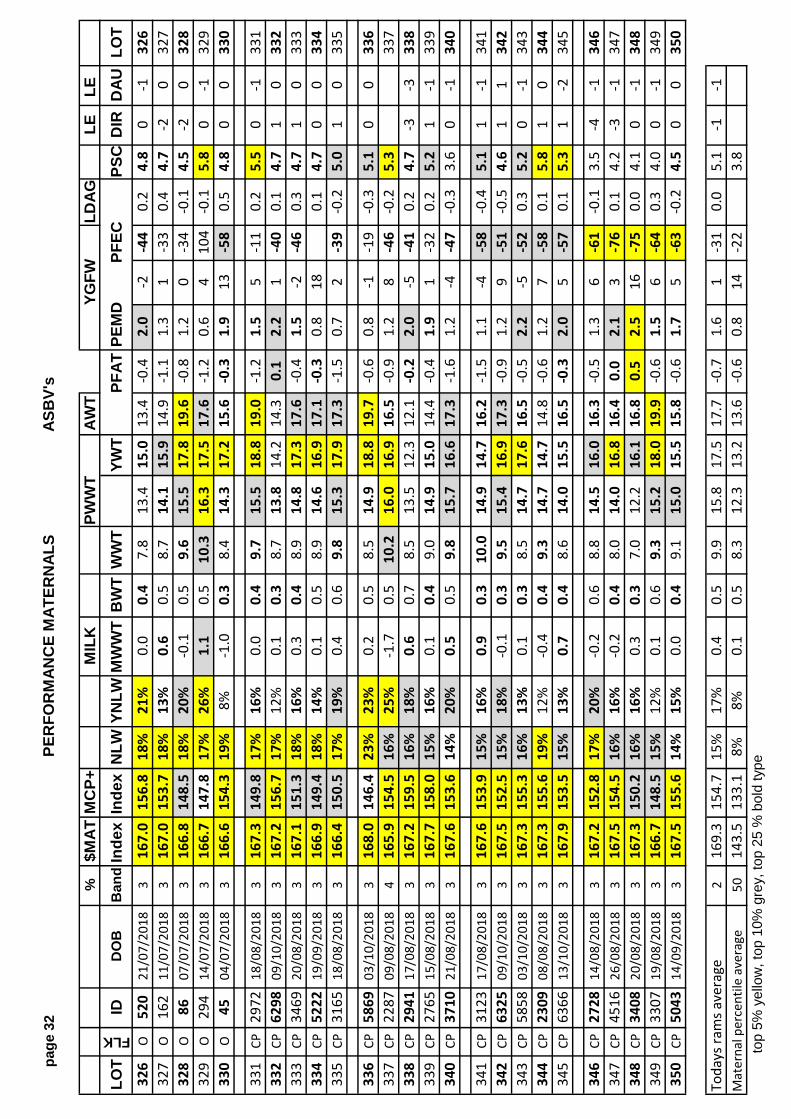
page
32
PER
FOR
MAN
CE
MAT
ERN
ALS
ASB
V's
%$M
ATM
CP+
MIL
KPW
WT
AWT
YGFW
LDAG
LELE
LO
T
FLK
IDD
OB
Ban
dIn
dex
Inde
xN
LWYN
LWM
WW
TB
WT
WW
TYW
TPF
ATPE
MD
PFEC
PSC
DIR
DAU
LOT
326
O52
021
/07/
2018
316
7.0
156.
818
%21
%0.
00.
47.
813
.415
.013
.4-0
.42.
0-2
-44
0.2
4.8
0-1
326
327
O16
211
/07/
2018
316
7.0
153.
718
%13
%0.
60.
58.
714
.115
.914
.9-1
.11.
31
-33
0.4
4.7
-20
327
328
O86
07/0
7/20
183
166.
814
8.5
18%
20%
-0.1
0.5
9.6
15.5
17.8
19.6
-0.8
1.2
0-3
4-0
.14.
5-2
032
832
9O
294
14/0
7/20
183
166.
714
7.8
17%
26%
1.1
0.5
10.3
16.3
17.5
17.6
-1.2
0.6
410
4-0
.15.
80
-132
933
0O
4504
/07/
2018
316
6.6
154.
319
%8%
-1.0
0.3
8.4
14.3
17.2
15.6
-0.3
1.9
13-5
80.
54.
80
033
0
331
CP29
7218
/08/
2018
316
7.3
149.
817
%16
%0.
00.
49.
715
.518
.819
.0-1
.21.
55
-11
0.2
5.5
0-1
331
332
CP62
9809
/10/
2018
316
7.2
156.
717
%12
%0.
10.
38.
713
.814
.214
.30.
12.
21
-40
0.1
4.7
10
332
333
CP34
6920
/08/
2018
316
7.1
151.
318
%16
%0.
30.
48.
914
.817
.317
.6-0
.41.
5-2
-46
0.3
4.7
10
333
334
CP52
2219
/09/
2018
316
6.9
149.
418
%14
%0.
10.
58.
914
.616
.917
.1-0
.30.
818
0.1
4.7
00
334
335
CP31
6518
/08/
2018
316
6.4
150.
517
%19
%0.
40.
69.
815
.317
.917
.3-1
.50.
72
-39
-0.2
5.0
10
335
336
CP58
6903
/10/
2018
316
8.0
146.
423
%23
%0.
20.
58.
514
.918
.819
.7-0
.60.
8-1
-19
-0.3
5.1
00
336
337
CP22
8709
/08/
2018
416
5.9
154.
516
%25
%-1
.70.
510
.216
.016
.916
.5-0
.91.
28
-46
-0.2
5.3
337
338
CP29
4117
/08/
2018
316
7.2
159.
516
%18
%0.
60.
78.
513
.512
.312
.1-0
.22.
0-5
-41
0.2
4.7
-3-3
338
339
CP27
6515
/08/
2018
316
7.7
158.
015
%16
%0.
10.
49.
014
.915
.014
.4-0
.41.
91
-32
0.2
5.2
1-1
339
340
CP37
1021
/08/
2018
316
7.6
153.
614
%20
%0.
50.
59.
815
.716
.617
.3-1
.61.
2-4
-47
-0.3
3.6
0-1
340
341
CP31
2317
/08/
2018
316
7.6
153.
915
%16
%0.
90.
310
.014
.914
.716
.2-1
.51.
1-4
-58
-0.4
5.1
1-1
341
342
CP63
2509
/10/
2018
316
7.5
152.
515
%18
%-0
.10.
39.
515
.416
.917
.3-0
.91.
29
-51
-0.5
4.6
11
342
343
CP58
5803
/10/
2018
316
7.3
155.
316
%13
%0.
10.
38.
514
.717
.616
.5-0
.52.
2-5
-52
0.3
5.2
0-1
343
344
CP23
0908
/08/
2018
316
7.3
155.
619
%12
%-0
.40.
49.
314
.714
.714
.8-0
.61.
27
-58
0.1
5.8
10
344
345
CP63
6613
/10/
2018
316
7.9
153.
515
%13
%0.
70.
48.
614
.015
.516
.5-0
.32.
05
-57
0.1
5.3
1-2
345
346
CP27
2814
/08/
2018
316
7.2
152.
817
%20
%-0
.20.
68.
814
.516
.016
.3-0
.51.
36
-61
-0.1
3.5
-4-1
346
347
CP45
1626
/08/
2018
316
7.5
154.
516
%16
%-0
.20.
48.
014
.016
.816
.40.
02.
13
-76
0.1
4.2
-3-1
347
348
CP34
0820
/08/
2018
316
7.3
150.
216
%16
%0.
30.
37.
012
.216
.116
.80.
52.
516
-75
0.0
4.1
0-1
348
349
CP33
0719
/08/
2018
316
6.7
148.
515
%12
%0.
10.
69.
315
.218
.019
.9-0
.61.
56
-64
0.3
4.0
0-1
349
350
CP50
4314
/09/
2018
316
7.5
155.
614
%15
%0.
00.
49.
115
.015
.515
.8-0
.61.
75
-63
-0.2
4.5
00
350
Toda
ys ra
ms a
vera
ge2
169.
315
4.7
15%
17%
0.4
0.5
9.9
15.8
17.5
17.7
-0.7
1.6
1-3
10.
05.
1-1
-1M
ater
nal p
erce
ntile
ave
rage
5014
3.5
133.
18%
8%0.
10.
58.
312
.313
.213
.6-0
.60.
814
-22
3.8
top
5% y
ello
w, t
op 1
0% g
rey,
top
25 %
bol
d ty
pe

page
33
PHEN
OTY
PEB
REE
D C
ON
TEN
TAD
DIT
ION
AL IN
FOR
MAT
ION
AS
RAW
DAT
APE
LT
FAC
EN
OSE
FEET
BU
MD
AMC
UR
VELO
TPu
rcha
ser
Pric
eC
omp
CP
EFB
LR
MPD
TXW
SSK
INC
OV
JAW
PIG
PIG
LEG
SB
ACK
CO
VAG
EB
END
SIR
ELO
T32
669
625
22
12
21
12
40%
1224
0232
632
781
193
21
53
11
16
5%16
2796
327
328
5613
312
31
35
11
25
26%
1620
4232
832
963
66
136
62
11
55
11
15
8%16
0064
329
330
633
66
319
32
15
41
12
310
%12
2402
330
331
566
613
613
32
14
32
33
322
%16
0064
331
332
766
66
61
31
55
11
21
4%17
2669
332
333
633
63
252
31
55
11
33
19%
1532
7333
333
481
136
22
15
52
13
116
%17
3076
334
335
7413
26
32
32
15
41
14
213
%17
2434
335
336
8713
31
15
51
22
132
%17
3076
336
337
7413
133
21
44
22
36
3%13
0275
337
338
696
253
31
33
11
33
-11%
1740
1633
833
969
625
32
14
42
14
3-3
%15
3273
339
340
6213
252
21
33
22
32
10%
1635
1034
0
341
816
133
21
32
22
23
9%16
3510
341
342
8119
32
15
52
12
112
%16
3510
342
343
623
613
313
32
14
31
13
112
%12
2402
343
344
696
313
63
33
13
31
13
30%
1726
6834
434
575
196
31
14
42
23
118
%17
2385
345
346
7525
32
13
41
13
212
%16
4858
346
347
802
32
133
22
33
11
32
17%
1648
5834
734
888
66
33
14
41
13
238
%17
2384
348
349
566
1325
33
14
41
13
331
%15
3273
349
350
816
133
21
54
12
31
6%16
3510
350
Of t
his
cata
logu
e: c
urve
ben
d to
p 5
% y
ello
w, t
op 1
0 %
gre
y, to
p 25
% b
old

page
34
PER
FOR
MAN
CE
MAT
ERN
ALS
ASB
V's
%$M
ATM
CP+
MIL
KPW
WT
AWT
YGFW
LDAG
LELE
LO
T
FLK
IDD
OB
Ban
dIn
dex
Inde
xN
LWYN
LWM
WW
TB
WT
WW
TYW
TPF
ATPE
MD
PFEC
PSC
DIR
DAU
LOT
351
CP31
3617
/08/
2018
316
7.7
152.
012
%13
%0.
60.
510
.015
.817
.818
.5-0
.91.
36
-66
-0.2
3.8
-1-1
351
352
CP30
4417
/08/
2018
316
7.8
155.
114
%10
%0.
10.
69.
114
.715
.916
.5-0
.72.
09
-66
0.2
4.4
-1-1
352
353
CP65
0815
/10/
2018
316
7.5
151.
112
%17
%0.
90.
49.
915
.917
.719
.0-0
.91.
2-1
-61
-0.5
4.9
00
353
354
CP59
0401
/10/
2018
316
7.2
150.
812
%17
%0.
80.
49.
414
.916
.117
.9-1
.01.
411
-60
-0.3
4.2
0-1
354
355
CP32
3620
/08/
2018
316
7.0
153.
112
%10
%0.
70.
39.
014
.917
.217
.8-0
.42.
11
-73
-0.3
3.7
10
355
356
CP38
5022
/08/
2018
216
8.2
154.
514
%16
%0.
80.
49.
014
.816
.716
.2-0
.81.
83
-32
0.2
4.5
0-2
356
357
CP22
1107
/08/
2018
316
7.2
156.
111
%12
%0.
60.
59.
915
.515
.817
.10.
42.
4-7
-35
0.0
5.3
-1-2
357
358
CP36
9222
/08/
2018
316
6.9
158.
513
%13
%0.
20.
59.
414
.715
.213
.80.
12.
04
-31
-0.2
5.2
1-1
358
359
CP59
8103
/10/
2018
316
6.7
154.
814
%15
%1.
10.
48.
814
.014
.314
.4-0
.41.
52
-54
0.2
4.7
10
359
360
CP51
6316
/09/
2018
316
6.5
152.
713
%9%
0.8
0.3
8.8
13.8
14.7
15.9
-0.1
2.1
13-0
.14.
91
136
0
361
O25
113
/07/
2018
316
7.7
153.
412
%9%
0.1
0.5
11.5
17.9
19.2
20.4
-0.9
1.8
-5-1
8-0
.25.
3-1
-136
136
2O
738
27/0
7/20
183
167.
415
1.7
10%
14%
0.1
0.6
10.2
16.9
20.3
20.4
-0.3
1.8
3-5
1-0
.14.
8-3
-236
236
3O
446
19/0
7/20
183
167.
115
2.2
12%
21%
1.5
0.6
10.2
15.6
16.2
16.6
-1.0
1.1
09
-0.1
5.0
-2-3
363
364
O10
3820
/08/
2018
316
6.7
156.
019
%31
%0.
50.
68.
814
.814
.713
.2-0
.80.
7-1
3-8
-0.2
6.5
-1-1
364
365
O15
610
/07/
2018
316
6.7
152.
215
%19
%-0
.30.
89.
916
.316
.918
.0-1
.01.
53
-3-0
.34.
8-2
036
5
366
CP51
0414
/09/
2018
316
8.0
149.
315
%15
%-0
.10.
610
.716
.820
.321
.1-1
.11.
05
-64
-0.1
4.9
-3-1
366
367
CP23
7312
/08/
2018
316
7.9
154.
821
%15
%0.
00.
27.
011
.714
.013
.20.
12.
115
-61
0.3
4.7
1-1
367
368
CP61
2704
/10/
2018
316
7.9
156.
715
%13
%0.
80.
39.
014
.116
.115
.7-0
.42.
4-1
1-6
20.
44.
50
036
836
9CP
3106
16/0
8/20
183
167.
115
4.5
16%
17%
0.4
0.5
8.8
14.3
16.7
16.6
0.0
2.1
-10
-61
0.1
4.3
-3-2
369
370
CP35
2521
/08/
2018
316
6.6
153.
818
%16
%-0
.10.
68.
214
.316
.815
.6-0
.51.
60
-53
0.1
5.2
-3-2
370
371
CP48
6110
/09/
2018
216
8.5
152.
513
%18
%0.
60.
49.
715
.618
.019
.2-0
.61.
8-3
-64
-0.3
4.6
-1-1
371
372
CP58
8704
/10/
2018
216
8.4
157.
113
%8%
0.0
0.3
9.3
15.0
16.7
16.9
0.3
2.6
1-5
80.
25.
51
037
237
3CP
4250
25/0
8/20
183
168.
015
9.3
12%
12%
0.3
0.2
9.1
14.6
16.7
14.7
-0.4
2.5
1-6
10.
15.
20
137
337
4CP
2716
13/0
8/20
183
167.
915
0.9
14%
18%
1.1
0.4
9.8
14.1
14.4
16.6
-1.7
1.0
16-6
6-0
.44.
3-1
-237
437
5CP
4147
23/0
8/20
183
167.
115
1.6
14%
11%
0.4
0.3
9.8
15.3
17.9
19.2
0.0
2.0
-5-6
00.
35.
20
037
5
Toda
ys ra
ms a
vera
ge2
169.
315
4.7
15%
17%
0.4
0.5
9.9
15.8
17.5
17.7
-0.7
1.6
1-3
10.
05.
1-1
-1M
ater
nal p
erce
ntile
ave
rage
5014
3.5
133.
18%
8%0.
10.
58.
312
.313
.213
.6-0
.60.
814
-22
3.8
top
5% y
ello
w, t
op 1
0% g
rey,
top
25 %
bol
d ty
pe
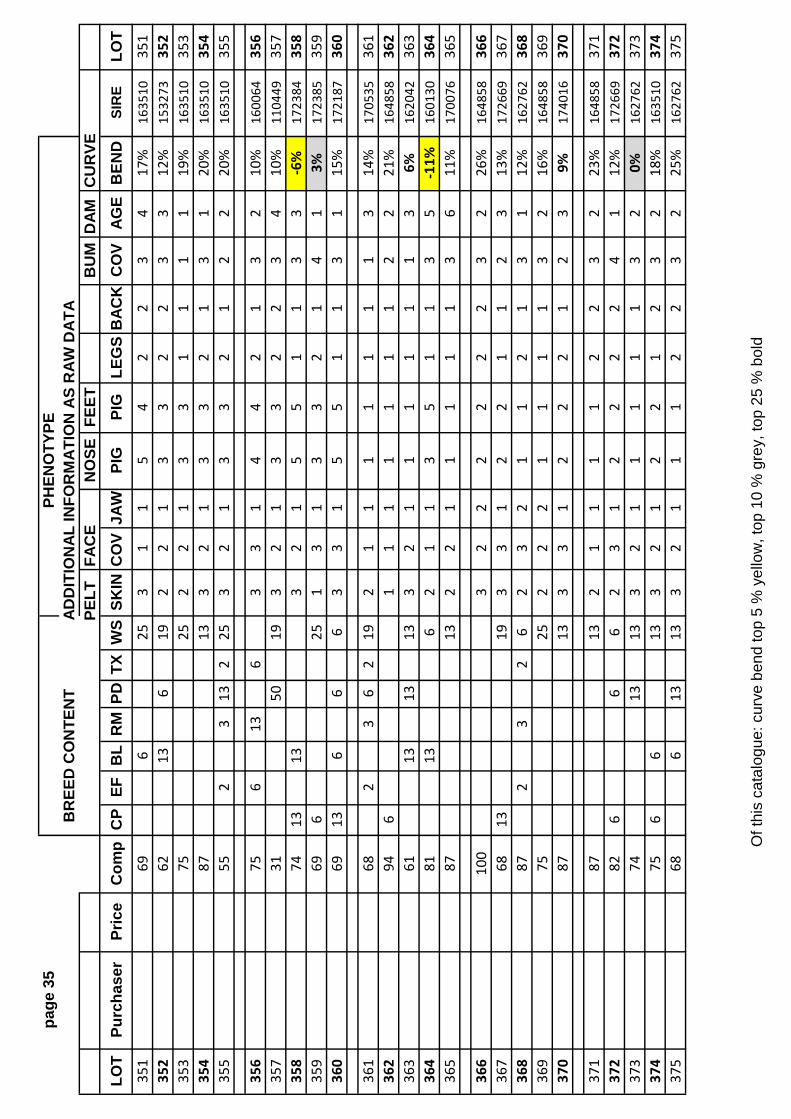
page
35
PHEN
OTY
PEB
REE
D C
ON
TEN
TAD
DIT
ION
AL IN
FOR
MAT
ION
AS
RAW
DAT
APE
LT
FAC
EN
OSE
FEET
BU
MD
AMC
UR
VELO
TPu
rcha
ser
Pric
eC
omp
CP
EFB
LR
MPD
TXW
SSK
INC
OV
JAW
PIG
PIG
LEG
SB
ACK
CO
VAG
EB
END
SIR
ELO
T35
169
625
31
15
42
23
417
%16
3510
351
352
6213
619
22
13
32
23
312
%15
3273
352
353
7525
22
13
31
11
119
%16
3510
353
354
8713
32
13
32
13
120
%16
3510
354
355
552
313
225
32
13
32
12
220
%16
3510
355
356
756
136
33
14
42
13
210
%16
0064
356
357
3150
193
21
33
22
34
10%
1104
4935
735
874
1313
32
15
51
13
3-6
%17
2384
358
359
696
251
31
33
21
41
3%17
2385
359
360
6913
66
63
31
55
11
31
15%
1721
8736
0
361
682
36
219
21
11
11
11
314
%17
0535
361
362
946
11
11
11
12
221
%16
4858
362
363
6113
1313
32
11
11
11
36%
1620
4236
336
481
136
21
13
51
13
5-1
1%16
0130
364
365
8713
22
11
11
13
611
%17
0076
365
366
100
32
22
22
23
226
%16
4858
366
367
6813
193
31
22
11
23
13%
1726
6936
736
887
23
26
23
21
12
13
112
%16
2762
368
369
7525
22
21
11
13
216
%16
4858
369
370
8713
33
12
22
12
39%
1740
1637
0
371
8713
21
11
12
23
223
%16
4858
371
372
826
66
23
12
22
24
112
%17
2669
372
373
7413
133
21
11
11
32
0%16
2762
373
374
756
613
32
12
21
23
218
%16
3510
374
375
686
1313
32
11
12
23
225
%16
2762
375
Of t
his
cata
logu
e: c
urve
ben
d to
p 5
% y
ello
w, t
op 1
0 %
gre
y, to
p 25
% b
old
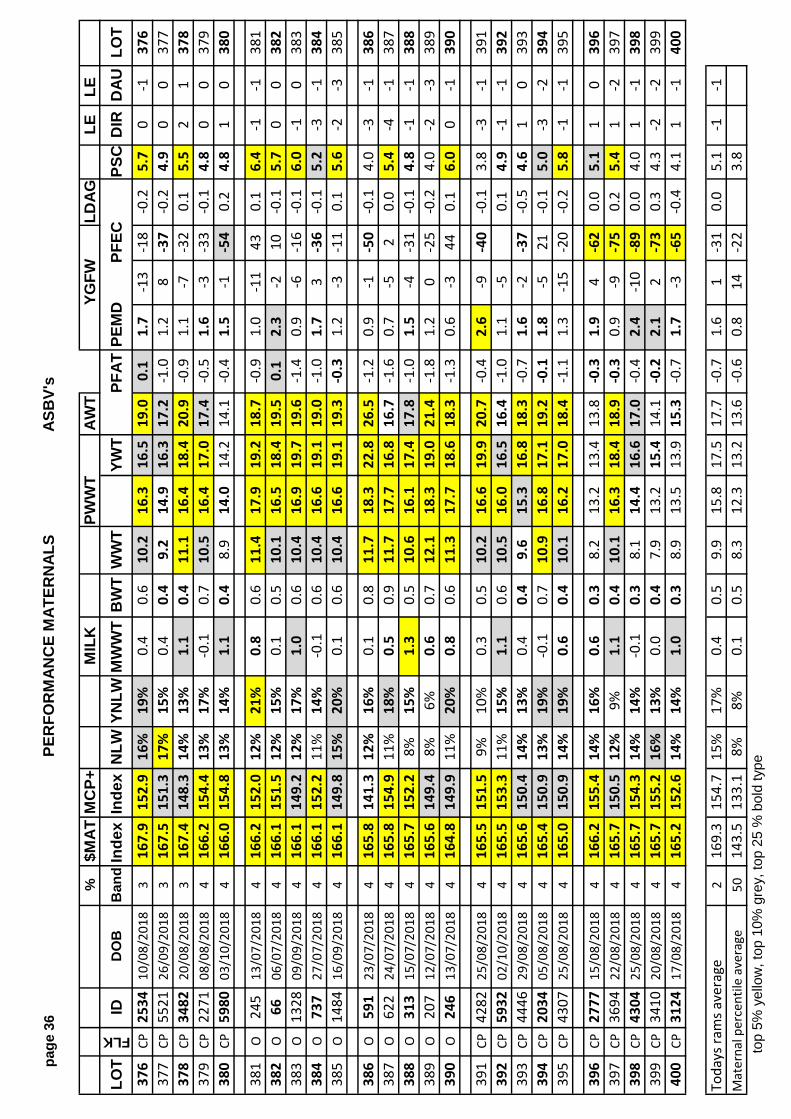
page
36
PER
FOR
MAN
CE
MAT
ERN
ALS
ASB
V's
%$M
ATM
CP+
MIL
KPW
WT
AWT
YGFW
LDAG
LELE
LO
T
FLK
IDD
OB
Ban
dIn
dex
Inde
xN
LWYN
LWM
WW
TB
WT
WW
TYW
TPF
ATPE
MD
PFEC
PSC
DIR
DAU
LOT
376
CP25
3410
/08/
2018
316
7.9
152.
916
%19
%0.
40.
610
.216
.316
.519
.00.
11.
7-1
3-1
8-0
.25.
70
-137
637
7CP
5521
26/0
9/20
183
167.
515
1.3
17%
15%
0.4
0.4
9.2
14.9
16.3
17.2
-1.0
1.2
8-3
7-0
.24.
90
037
737
8CP
3482
20/0
8/20
183
167.
414
8.3
14%
13%
1.1
0.4
11.1
16.4
18.4
20.9
-0.9
1.1
-7-3
20.
15.
52
137
837
9CP
2271
08/0
8/20
184
166.
215
4.4
13%
17%
-0.1
0.7
10.5
16.4
17.0
17.4
-0.5
1.6
-3-3
3-0
.14.
80
037
938
0CP
5980
03/1
0/20
184
166.
015
4.8
13%
14%
1.1
0.4
8.9
14.0
14.2
14.1
-0.4
1.5
-1-5
40.
24.
81
038
0
381
O24
513
/07/
2018
416
6.2
152.
012
%21
%0.
80.
611
.417
.919
.218
.7-0
.91.
0-1
143
0.1
6.4
-1-1
381
382
O66
06/0
7/20
184
166.
115
1.5
12%
15%
0.1
0.5
10.1
16.5
18.4
19.5
0.1
2.3
-210
-0.1
5.7
00
382
383
O13
2809
/09/
2018
416
6.1
149.
212
%17
%1.
00.
610
.416
.919
.719
.6-1
.40.
9-6
-16
-0.1
6.0
-10
383
384
O73
727
/07/
2018
416
6.1
152.
211
%14
%-0
.10.
610
.416
.619
.119
.0-1
.01.
73
-36
-0.1
5.2
-3-1
384
385
O14
8416
/09/
2018
416
6.1
149.
815
%20
%0.
10.
610
.416
.619
.119
.3-0
.31.
2-3
-11
0.1
5.6
-2-3
385
386
O59
123
/07/
2018
416
5.8
141.
312
%16
%0.
10.
811
.718
.322
.826
.5-1
.20.
9-1
-50
-0.1
4.0
-3-1
386
387
O62
224
/07/
2018
416
5.8
154.
911
%18
%0.
50.
911
.717
.716
.816
.7-1
.60.
7-5
20.
05.
4-4
-138
738
8O
313
15/0
7/20
184
165.
715
2.2
8%15
%1.
30.
510
.616
.117
.417
.8-1
.01.
5-4
-31
-0.1
4.8
-1-1
388
389
O20
712
/07/
2018
416
5.6
149.
48%
6%0.
60.
712
.118
.319
.021
.4-1
.81.
20
-25
-0.2
4.0
-2-3
389
390
O24
613
/07/
2018
416
4.8
149.
911
%20
%0.
80.
611
.317
.718
.618
.3-1
.30.
6-3
440.
16.
00
-139
0
391
CP42
8225
/08/
2018
416
5.5
151.
59%
10%
0.3
0.5
10.2
16.6
19.9
20.7
-0.4
2.6
-9-4
0-0
.13.
8-3
-139
139
2CP
5932
02/1
0/20
184
165.
515
3.3
11%
15%
1.1
0.6
10.5
16.0
16.5
16.4
-1.0
1.1
-50.
14.
9-1
-139
239
3CP
4446
29/0
8/20
184
165.
615
0.4
14%
13%
0.4
0.4
9.6
15.3
16.8
18.3
-0.7
1.6
-2-3
7-0
.54.
61
039
339
4CP
2034
05/0
8/20
184
165.
415
0.9
13%
19%
-0.1
0.7
10.9
16.8
17.1
19.2
-0.1
1.8
-521
-0.1
5.0
-3-2
394
395
CP43
0725
/08/
2018
416
5.0
150.
914
%19
%0.
60.
410
.116
.217
.018
.4-1
.11.
3-1
5-2
0-0
.25.
8-1
-139
5
396
CP27
7715
/08/
2018
416
6.2
155.
414
%16
%0.
60.
38.
213
.213
.413
.8-0
.31.
94
-62
0.0
5.1
10
396
397
CP36
9422
/08/
2018
416
5.7
150.
512
%9%
1.1
0.4
10.1
16.3
18.4
18.9
-0.3
0.9
-9-7
50.
25.
41
-239
739
8CP
4304
25/0
8/20
184
165.
715
4.3
14%
14%
-0.1
0.3
8.1
14.4
16.6
17.0
-0.4
2.4
-10
-89
0.0
4.0
1-1
398
399
CP34
1020
/08/
2018
416
5.7
155.
216
%13
%0.
00.
47.
913
.215
.414
.1-0
.22.
12
-73
0.3
4.3
-2-2
399
400
CP31
2417
/08/
2018
416
5.2
152.
614
%14
%1.
00.
38.
913
.513
.915
.3-0
.71.
7-3
-65
-0.4
4.1
1-1
400
Toda
ys ra
ms a
vera
ge2
169.
315
4.7
15%
17%
0.4
0.5
9.9
15.8
17.5
17.7
-0.7
1.6
1-3
10.
05.
1-1
-1M
ater
nal p
erce
ntile
ave
rage
5014
3.5
133.
18%
8%0.
10.
58.
312
.313
.213
.6-0
.60.
814
-22
3.8
top
5% y
ello
w, t
op 1
0% g
rey,
top
25 %
bol
d ty
pe

page
37
PHEN
OTY
PEB
REE
D C
ON
TEN
TAD
DIT
ION
AL IN
FOR
MAT
ION
AS
RAW
DAT
APE
LT
FAC
EN
OSE
FEET
BU
MD
AMC
UR
VELO
TPu
rcha
ser
Pric
eC
omp
CP
EFB
LR
MPD
TXW
SSK
INC
OV
JAW
PIG
PIG
LEG
SB
ACK
CO
VAG
EB
END
SIR
ELO
T37
624
1350
132
11
11
11
14
17%
1104
4937
637
775
136
62
21
22
22
31
15%
1730
7637
737
868
1913
12
12
21
11
627
%16
4460
378
379
639
199
32
11
11
23
36%
1400
6937
938
094
62
32
22
22
31
1%17
2385
380
381
636
613
66
11
15
51
12
44%
1600
6438
138
256
66
1313
62
11
55
11
22
18%
1600
6438
238
388
66
31
15
51
11
116
%17
0368
383
384
100
21
13
41
11
214
%16
4858
384
385
6813
191
31
55
11
22
17%
1620
4238
5
386
886
63
21
55
11
22
45%
1648
5838
638
794
66
22
13
41
12
4-6
%17
0076
387
388
496
1313
192
11
55
11
24
10%
1620
4238
838
968
23
62
192
21
51
11
14
17%
1705
3538
939
063
66
136
62
21
45
11
24
3%16
0064
390
391
7413
131
22
55
11
32
25%
1648
5839
139
256
613
66
132
21
42
22
31
2%16
0031
392
393
756
613
32
13
32
22
220
%16
3510
393
394
386
506
32
13
32
23
314
%11
0449
394
395
8713
32
13
32
13
313
%16
4858
395
396
886
63
31
54
22
42
4%17
2385
396
397
946
31
15
52
13
216
%16
4460
397
398
6813
193
11
54
22
22
18%
1732
8239
839
975
252
32
33
22
32
7%12
2402
399
400
816
133
21
33
22
33
13%
1635
1040
0
Of t
his
cata
logu
e: c
urve
ben
d to
p 5
% y
ello
w, t
op 1
0 %
gre
y, to
p 25
% b
old

page
38
PER
FOR
MAN
CE
MAT
ERN
ALS
ASB
V's
%$M
ATM
CP+
MIL
KPW
WT
AWT
YGFW
LDAG
LELE
LO
T
FLK
IDD
OB
Ban
dIn
dex
Inde
xN
LWYN
LWM
WW
TB
WT
WW
TYW
TPF
ATPE
MD
PFEC
PSC
DIR
DAU
LOT
401
O75
428
/07/
2018
416
6.0
153.
015
%19
%0.
30.
38.
814
.817
.116
.6-0
.31.
5-5
-63
-0.4
4.6
00
401
402
O15
410
/07/
2018
416
5.9
154.
120
%19
%-0
.60.
48.
113
.315
.014
.4-0
.71.
70
-56
0.6
4.6
-2-2
402
403
O82
602
/08/
2018
416
5.6
154.
018
%17
%-0
.20.
47.
412
.915
.714
.0-0
.51.
93
-68
0.5
4.7
-2-3
403
404
O34
116
/07/
2018
416
5.1
152.
022
%24
%-1
.00.
47.
813
.016
.114
.5-0
.71.
46
-61
0.5
4.4
-2-1
404
405
O21
813
/07/
2018
416
4.9
153.
812
%19
%-0
.20.
59.
815
.216
.016
.7-0
.81.
8-2
-62
0.1
3.9
-3-1
405
406
CP35
7121
/08/
2018
416
5.9
154.
519
%20
%-0
.20.
27.
012
.613
.113
.5-0
.11.
85
-77
-0.2
4.2
21
406
407
CP39
8524
/08/
2018
416
5.3
154.
017
%15
%0.
50.
26.
611
.914
.913
.8-0
.22.
6-1
-59
0.4
3.8
11
407
408
CP23
6911
/08/
2018
416
5.2
148.
618
%19
%0.
30.
69.
114
.918
.017
.7-1
.10.
8-3
-53
-0.1
4.0
-2-2
408
409
CP40
8224
/08/
2018
416
5.2
151.
917
%16
%0.
00.
57.
813
.515
.715
.4-0
.21.
74
-59
0.0
4.5
-1-1
409
410
CP43
8301
/09/
2018
416
4.8
150.
015
%18
%-0
.30.
410
.416
.418
.018
.4-1
.60.
6-2
-64
-0.4
4.7
0-1
410
411
O85
304
/08/
2018
416
6.2
154.
312
%21
%0.
60.
59.
414
.614
.114
.2-1
.21.
211
-23
-0.4
4.0
00
411
412
O62
424
/07/
2018
416
6.2
156.
815
%15
%0.
60.
58.
714
.514
.213
.5-0
.71.
5-4
-32
0.1
4.6
0-1
412
413
O12
1005
/09/
2018
416
5.1
153.
411
%24
%1.
00.
39.
415
.516
.816
.0-0
.71.
2-1
2-4
4-0
.25.
92
141
341
4O
1410
12/0
9/20
184
164.
815
1.9
12%
21%
0.3
0.6
10.0
16.2
17.2
16.3
-0.7
1.3
631
-0.2
4.7
-20
414
415
O13
6710
/09/
2018
416
5.8
150.
712
%22
%0.
50.
410
.617
.018
.718
.4-0
.60.
9-1
5-0
.45.
61
141
5
416
O34
04/0
7/20
184
166.
215
1.3
9%20
%1.
40.
59.
916
.017
.817
.3-0
.91.
74
46-0
.16.
00
-141
641
7O
3604
/07/
2018
416
5.5
156.
411
%20
%0.
00.
410
.015
.715
.215
.0-1
.11.
5-1
-47
-0.4
4.5
-1-1
417
418
O45
819
/07/
2018
416
5.2
153.
316
%25
%-0
.10.
49.
114
.515
.515
.2-0
.81.
8-1
60.
44.
3-1
041
841
9O
1082
25/0
8/20
184
165.
015
1.3
16%
26%
-0.4
0.5
9.1
15.7
17.8
17.3
-0.3
1.4
-5-1
50.
25.
90
141
942
0O
336
16/0
7/20
184
164.
815
3.2
10%
24%
1.2
0.6
10.0
15.5
16.4
15.7
-1.1
1.3
-7-2
1-0
.24.
2-1
042
0
421
O85
004
/08/
2018
416
6.1
154.
014
%17
%-0
.20.
58.
715
.217
.316
.9-0
.31.
9-2
-54
-0.2
5.7
-3-1
421
422
O21
012
/07/
2018
416
5.8
155.
915
%12
%0.
60.
48.
213
.614
.613
.5-0
.92.
11
-31
0.2
3.9
00
422
423
O67
025
/07/
2018
416
5.7
160.
512
%16
%0.
20.
610
.015
.414
.712
.9-1
.02.
1-9
-16
0.0
4.2
-1-1
423
424
O24
813
/07/
2018
416
5.4
154.
110
%14
%0.
80.
39.
615
.316
.315
.3-1
.01.
99
7-0
.24.
91
-142
4
Toda
ys ra
ms a
vera
ge2
169.
315
4.7
15%
17%
0.4
0.5
9.9
15.8
17.5
17.7
-0.7
1.6
1-3
10.
05.
1-1
-1M
ater
nal p
erce
ntile
ave
rage
5014
3.5
133.
18%
8%0.
10.
58.
312
.313
.213
.6-0
.60.
814
-22
3.8
top
5% y
ello
w, t
op 1
0% g
rey,
top
25 %
bol
d ty
pe
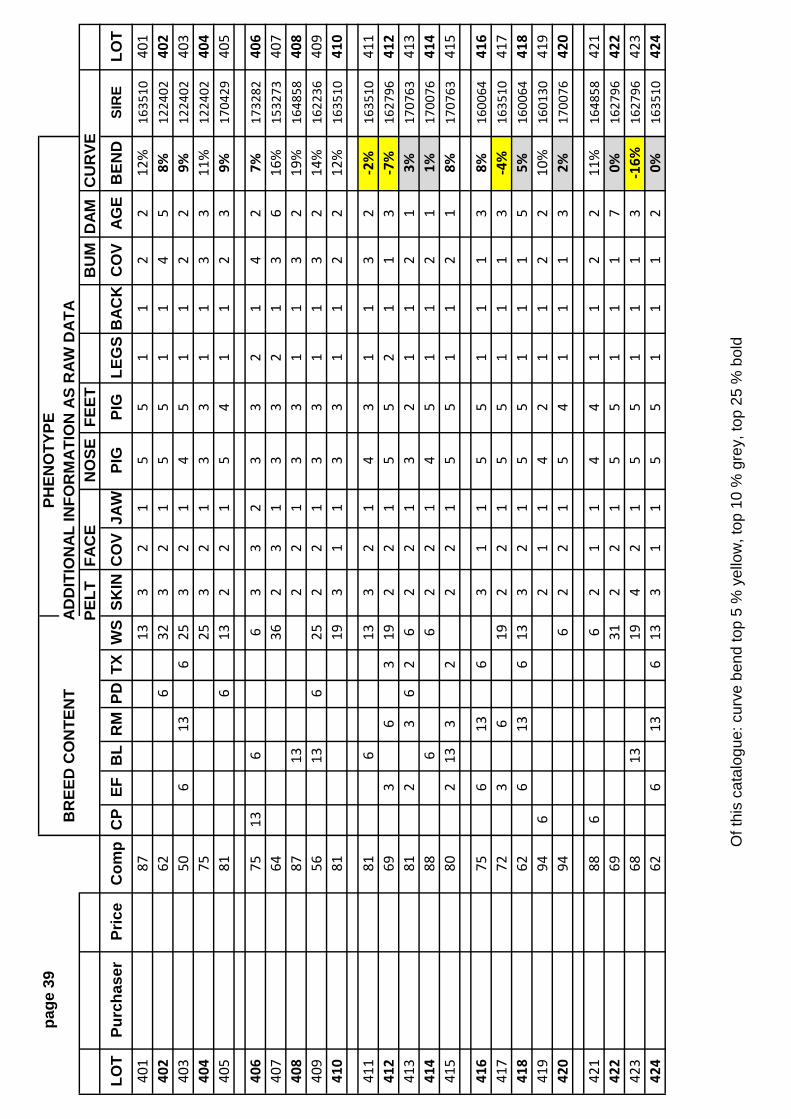
page
39
PHEN
OTY
PEB
REE
D C
ON
TEN
TAD
DIT
ION
AL IN
FOR
MAT
ION
AS
RAW
DAT
APE
LT
FAC
EN
OSE
FEET
BU
MD
AMC
UR
VELO
TPu
rcha
ser
Pric
eC
omp
CP
EFB
LR
MPD
TXW
SSK
INC
OV
JAW
PIG
PIG
LEG
SB
ACK
CO
VAG
EB
END
SIR
ELO
T40
187
133
21
55
11
22
12%
1635
1040
140
262
632
32
15
51
14
58%
1224
0240
240
350
613
625
32
14
51
12
29%
1224
0240
340
475
253
21
33
11
33
11%
1224
0240
440
581
613
22
15
41
12
39%
1704
2940
5
406
7513
66
33
23
32
14
27%
1732
8240
640
764
362
31
33
21
36
16%
1532
7340
740
887
132
21
33
11
32
19%
1648
5840
840
956
136
252
21
33
11
32
14%
1622
3640
941
081
193
11
33
11
22
12%
1635
1041
0
411
816
133
21
43
11
32
-2%
1635
1041
141
269
36
319
22
15
52
11
3-7
%16
2796
412
413
812
36
26
22
13
21
12
13%
1707
6341
341
488
66
22
14
51
12
11%
1700
7641
441
580
213
32
22
15
51
12
18%
1707
6341
5
416
756
136
31
15
51
11
38%
1600
6441
641
772
36
192
21
55
11
13
-4%
1635
1041
741
862
613
613
32
15
51
11
55%
1600
6441
841
994
62
11
42
11
22
10%
1601
3041
942
094
62
21
54
11
13
2%17
0076
420
421
886
62
11
44
11
22
11%
1648
5842
142
269
312
21
55
11
17
0%16
2796
422
423
6813
194
21
55
11
13
-16%
1627
9642
342
462
613
613
31
15
51
11
20%
1635
1042
4
Of t
his
cata
logu
e: c
urve
ben
d to
p 5
% y
ello
w, t
op 1
0 %
gre
y, to
p 25
% b
old
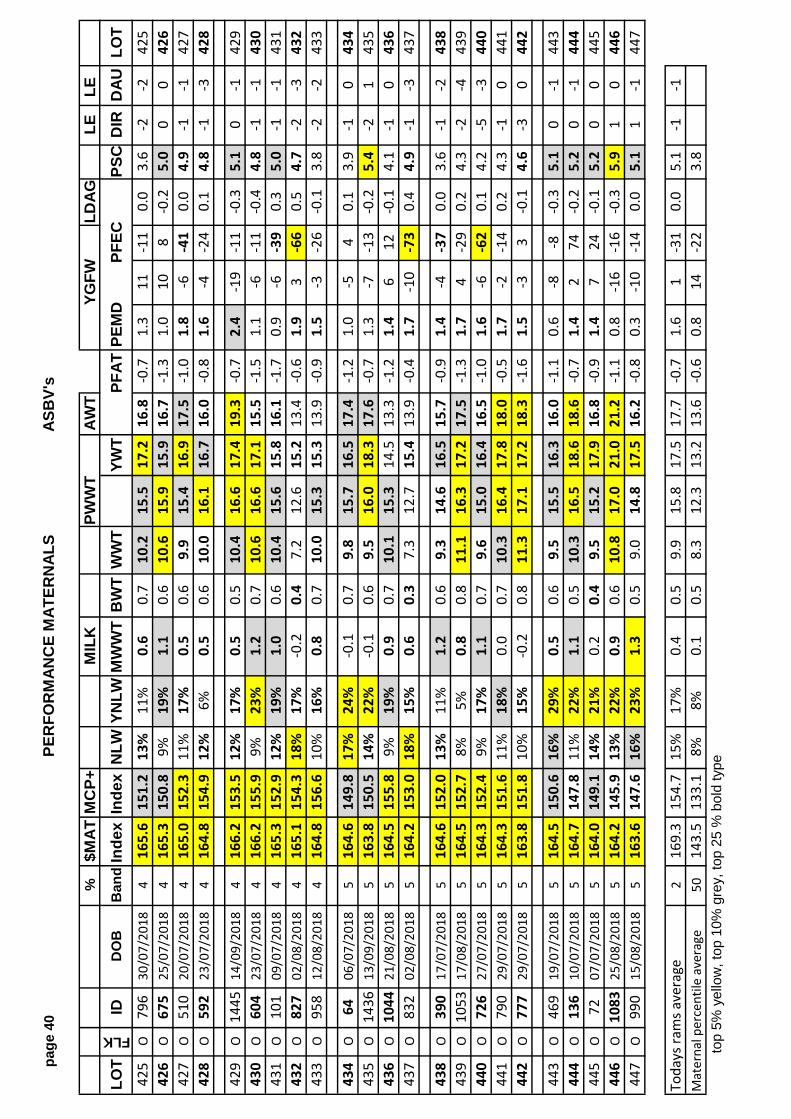
page
40
PER
FOR
MAN
CE
MAT
ERN
ALS
ASB
V's
%$M
ATM
CP+
MIL
KPW
WT
AWT
YGFW
LDAG
LELE
LO
T
FLK
IDD
OB
Ban
dIn
dex
Inde
xN
LWYN
LWM
WW
TB
WT
WW
TYW
TPF
ATPE
MD
PFEC
PSC
DIR
DAU
LOT
425
O79
630
/07/
2018
416
5.6
151.
213
%11
%0.
60.
710
.215
.517
.216
.8-0
.71.
311
-11
0.0
3.6
-2-2
425
426
O67
525
/07/
2018
416
5.3
150.
89%
19%
1.1
0.6
10.6
15.9
15.9
16.7
-1.3
1.0
108
-0.2
5.0
00
426
427
O51
020
/07/
2018
416
5.0
152.
311
%17
%0.
50.
69.
915
.416
.917
.5-1
.01.
8-6
-41
0.0
4.9
-1-1
427
428
O59
223
/07/
2018
416
4.8
154.
912
%6%
0.5
0.6
10.0
16.1
16.7
16.0
-0.8
1.6
-4-2
40.
14.
8-1
-342
8
429
O14
4514
/09/
2018
416
6.2
153.
512
%17
%0.
50.
510
.416
.617
.419
.3-0
.72.
4-1
9-1
1-0
.35.
10
-142
943
0O
604
23/0
7/20
184
166.
215
5.9
9%23
%1.
20.
710
.616
.617
.115
.5-1
.51.
1-6
-11
-0.4
4.8
-1-1
430
431
O10
109
/07/
2018
416
5.3
152.
912
%19
%1.
00.
610
.415
.615
.816
.1-1
.70.
9-6
-39
0.3
5.0
-1-1
431
432
O82
702
/08/
2018
416
5.1
154.
318
%17
%-0
.20.
47.
212
.615
.213
.4-0
.61.
93
-66
0.5
4.7
-2-3
432
433
O95
812
/08/
2018
416
4.8
156.
610
%16
%0.
80.
710
.015
.315
.313
.9-0
.91.
5-3
-26
-0.1
3.8
-2-2
433
434
O64
06/0
7/20
185
164.
614
9.8
17%
24%
-0.1
0.7
9.8
15.7
16.5
17.4
-1.2
1.0
-54
0.1
3.9
-10
434
435
O14
3613
/09/
2018
516
3.8
150.
514
%22
%-0
.10.
69.
516
.018
.317
.6-0
.71.
3-7
-13
-0.2
5.4
-21
435
436
O10
4421
/08/
2018
516
4.5
155.
89%
19%
0.9
0.7
10.1
15.3
14.5
13.3
-1.2
1.4
612
-0.1
4.1
-10
436
437
O83
202
/08/
2018
516
4.2
153.
018
%15
%0.
60.
37.
312
.715
.413
.9-0
.41.
7-1
0-7
30.
44.
9-1
-343
7
438
O39
017
/07/
2018
516
4.6
152.
013
%11
%1.
20.
69.
314
.616
.515
.7-0
.91.
4-4
-37
0.0
3.6
-1-2
438
439
O10
5317
/08/
2018
516
4.5
152.
78%
5%0.
80.
811
.116
.317
.217
.5-1
.31.
74
-29
0.2
4.3
-2-4
439
440
O72
627
/07/
2018
516
4.3
152.
49%
17%
1.1
0.7
9.6
15.0
16.4
16.5
-1.0
1.6
-6-6
20.
14.
2-5
-344
044
1O
790
29/0
7/20
185
164.
315
1.6
11%
18%
0.0
0.7
10.3
16.4
17.8
18.0
-0.5
1.7
-2-1
40.
24.
3-1
044
144
2O
777
29/0
7/20
185
163.
815
1.8
10%
15%
-0.2
0.8
11.3
17.1
17.2
18.3
-1.6
1.5
-33
-0.1
4.6
-30
442
443
O46
919
/07/
2018
516
4.5
150.
616
%29
%0.
50.
69.
515
.516
.316
.0-1
.10.
6-8
-8-0
.35.
10
-144
344
4O
136
10/0
7/20
185
164.
714
7.8
11%
22%
1.1
0.5
10.3
16.5
18.6
18.6
-0.7
1.4
274
-0.2
5.2
0-1
444
445
O72
07/0
7/20
185
164.
014
9.1
14%
21%
0.2
0.4
9.5
15.2
17.9
16.8
-0.9
1.4
724
-0.1
5.2
00
445
446
O10
8325
/08/
2018
516
4.2
145.
913
%22
%0.
90.
610
.817
.021
.021
.2-1
.10.
8-1
6-1
6-0
.35.
91
044
644
7O
990
15/0
8/20
185
163.
614
7.6
16%
23%
1.3
0.5
9.0
14.8
17.5
16.2
-0.8
0.3
-10
-14
0.0
5.1
1-1
447
Toda
ys ra
ms a
vera
ge2
169.
315
4.7
15%
17%
0.4
0.5
9.9
15.8
17.5
17.7
-0.7
1.6
1-3
10.
05.
1-1
-1M
ater
nal p
erce
ntile
ave
rage
5014
3.5
133.
18%
8%0.
10.
58.
312
.313
.213
.6-0
.60.
814
-22
3.8
top
5% y
ello
w, t
op 1
0% g
rey,
top
25 %
bol
d ty
pe
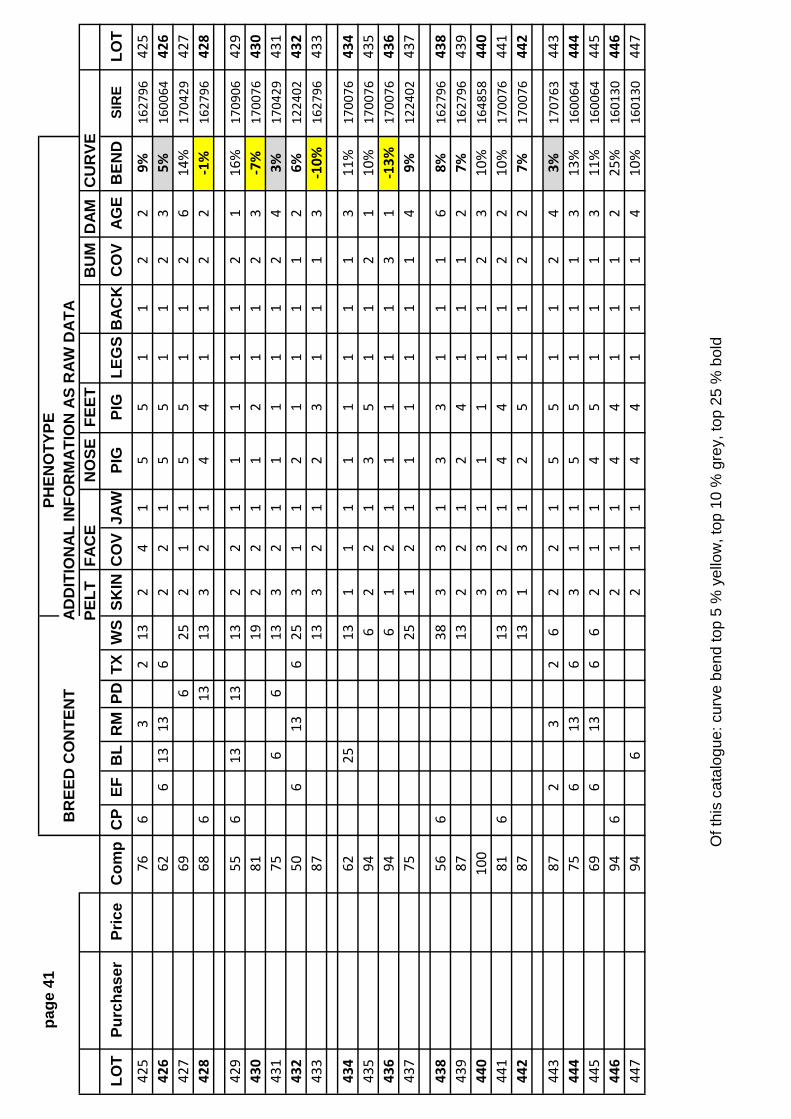
page
41
PHEN
OTY
PEB
REE
D C
ON
TEN
TAD
DIT
ION
AL IN
FOR
MAT
ION
AS
RAW
DAT
APE
LT
FAC
EN
OSE
FEET
BU
MD
AMC
UR
VELO
TPu
rcha
ser
Pric
eC
omp
CP
EFB
LR
MPD
TXW
SSK
INC
OV
JAW
PIG
PIG
LEG
SB
ACK
CO
VAG
EB
END
SIR
ELO
T42
576
63
213
24
15
51
12
29%
1627
9642
542
662
613
136
22
15
51
12
35%
1600
6442
642
769
625
21
15
51
12
614
%17
0429
427
428
686
1313
32
14
41
12
2-1
%16
2796
428
429
556
1313
132
21
11
11
21
16%
1709
0642
943
081
192
21
12
11
23
-7%
1700
7643
043
175
66
133
21
11
11
24
3%17
0429
431
432
506
136
253
11
21
11
12
6%12
2402
432
433
8713
32
12
31
11
3-1
0%16
2796
433
434
6225
131
11
11
11
13
11%
1700
7643
443
594
62
21
35
11
21
10%
1700
7643
543
694
61
21
11
11
31
-13%
1700
7643
643
775
251
21
11
11
14
9%12
2402
437
438
566
383
31
33
11
16
8%16
2796
438
439
8713
22
12
41
11
27%
1627
9643
944
010
03
31
11
11
23
10%
1648
5844
044
181
613
32
14
41
12
210
%17
0076
441
442
8713
13
12
51
12
27%
1700
7644
2
443
872
32
62
21
55
11
24
3%17
0763
443
444
756
136
31
15
51
11
313
%16
0064
444
445
696
136
62
11
45
11
13
11%
1600
6444
544
694
62
11
44
11
12
25%
1601
3044
644
794
62
11
44
11
14
10%
1601
3044
7
Of t
his
cata
logu
e: c
urve
ben
d to
p 5
% y
ello
w, t
op 1
0 %
gre
y, to
p 25
% b
old
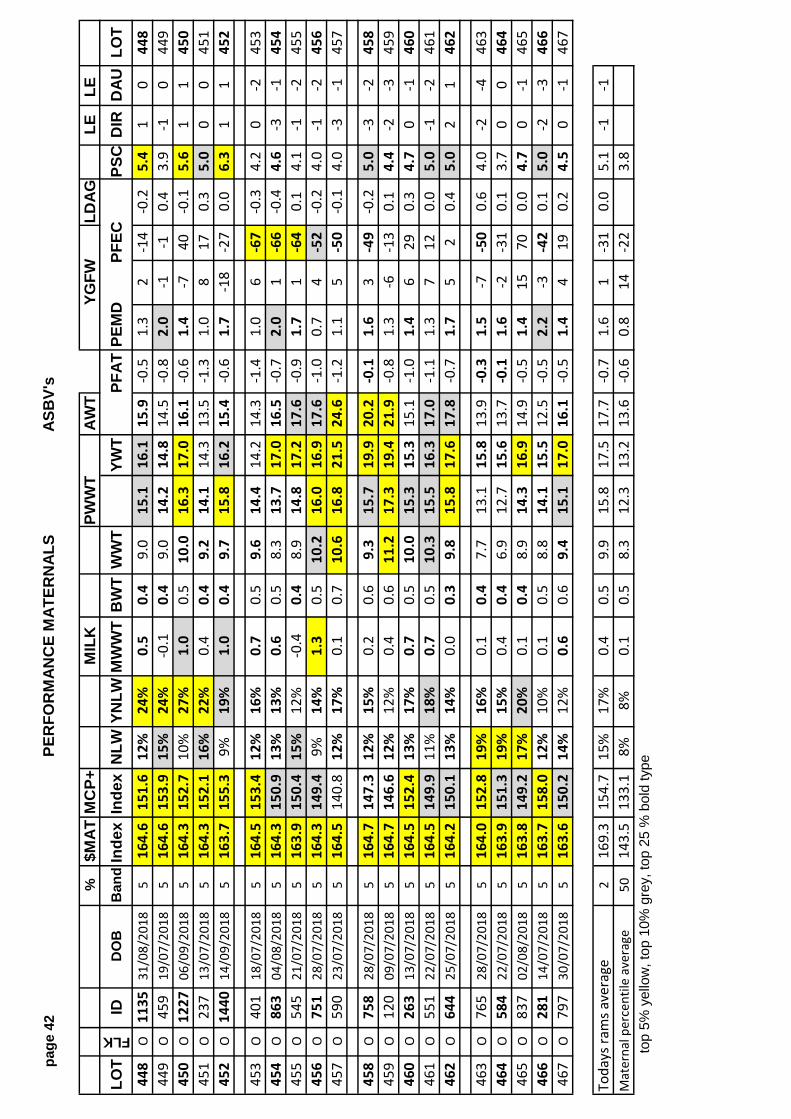
page
42
PER
FOR
MAN
CE
MAT
ERN
ALS
ASB
V's
%$M
ATM
CP+
MIL
KPW
WT
AWT
YGFW
LDAG
LELE
LO
T
FLK
IDD
OB
Ban
dIn
dex
Inde
xN
LWYN
LWM
WW
TB
WT
WW
TYW
TPF
ATPE
MD
PFEC
PSC
DIR
DAU
LOT
448
O11
3531
/08/
2018
516
4.6
151.
612
%24
%0.
50.
49.
015
.116
.115
.9-0
.51.
32
-14
-0.2
5.4
10
448
449
O45
919
/07/
2018
516
4.6
153.
915
%24
%-0
.10.
49.
014
.214
.814
.5-0
.82.
0-1
-10.
43.
9-1
044
945
0O
1227
06/0
9/20
185
164.
315
2.7
10%
27%
1.0
0.5
10.0
16.3
17.0
16.1
-0.6
1.4
-740
-0.1
5.6
11
450
451
O23
713
/07/
2018
516
4.3
152.
116
%22
%0.
40.
49.
214
.114
.313
.5-1
.31.
08
170.
35.
00
045
145
2O
1440
14/0
9/20
185
163.
715
5.3
9%19
%1.
00.
49.
715
.816
.215
.4-0
.61.
7-1
8-2
70.
06.
31
145
2
453
O40
118
/07/
2018
516
4.5
153.
412
%16
%0.
70.
59.
614
.414
.214
.3-1
.41.
06
-67
-0.3
4.2
0-2
453
454
O86
304
/08/
2018
516
4.3
150.
913
%13
%0.
60.
58.
313
.717
.016
.5-0
.72.
01
-66
-0.4
4.6
-3-1
454
455
O54
521
/07/
2018
516
3.9
150.
415
%12
%-0
.40.
48.
914
.817
.217
.6-0
.91.
71
-64
0.1
4.1
-1-2
455
456
O75
128
/07/
2018
516
4.3
149.
49%
14%
1.3
0.5
10.2
16.0
16.9
17.6
-1.0
0.7
4-5
2-0
.24.
0-1
-245
645
7O
590
23/0
7/20
185
164.
514
0.8
12%
17%
0.1
0.7
10.6
16.8
21.5
24.6
-1.2
1.1
5-5
0-0
.14.
0-3
-145
7
458
O75
828
/07/
2018
516
4.7
147.
312
%15
%0.
20.
69.
315
.719
.920
.2-0
.11.
63
-49
-0.2
5.0
-3-2
458
459
O12
009
/07/
2018
516
4.7
146.
612
%12
%0.
40.
611
.217
.319
.421
.9-0
.81.
3-6
-13
0.1
4.4
-2-3
459
460
O26
313
/07/
2018
516
4.5
152.
413
%17
%0.
70.
510
.015
.315
.315
.1-1
.01.
46
290.
34.
70
-146
046
1O
551
22/0
7/20
185
164.
514
9.9
11%
18%
0.7
0.5
10.3
15.5
16.3
17.0
-1.1
1.3
712
0.0
5.0
-1-2
461
462
O64
425
/07/
2018
516
4.2
150.
113
%14
%0.
00.
39.
815
.817
.617
.8-0
.71.
75
20.
45.
02
146
2
463
O76
528
/07/
2018
516
4.0
152.
819
%16
%0.
10.
47.
713
.115
.813
.9-0
.31.
5-7
-50
0.6
4.0
-2-4
463
464
O58
422
/07/
2018
516
3.9
151.
319
%15
%0.
40.
46.
912
.715
.613
.7-0
.11.
6-2
-31
0.1
3.7
00
464
465
O83
702
/08/
2018
516
3.8
149.
217
%20
%0.
10.
48.
914
.316
.914
.9-0
.51.
415
700.
04.
70
-146
546
6O
281
14/0
7/20
185
163.
715
8.0
12%
10%
0.1
0.5
8.8
14.1
15.5
12.5
-0.5
2.2
-3-4
20.
15.
0-2
-346
646
7O
797
30/0
7/20
185
163.
615
0.2
14%
12%
0.6
0.6
9.4
15.1
17.0
16.1
-0.5
1.4
419
0.2
4.5
0-1
467
Toda
ys ra
ms a
vera
ge2
169.
315
4.7
15%
17%
0.4
0.5
9.9
15.8
17.5
17.7
-0.7
1.6
1-3
10.
05.
1-1
-1M
ater
nal p
erce
ntile
ave
rage
5014
3.5
133.
18%
8%0.
10.
58.
312
.313
.213
.6-0
.60.
814
-22
3.8
top
5% y
ello
w, t
op 1
0% g
rey,
top
25 %
bol
d ty
pe
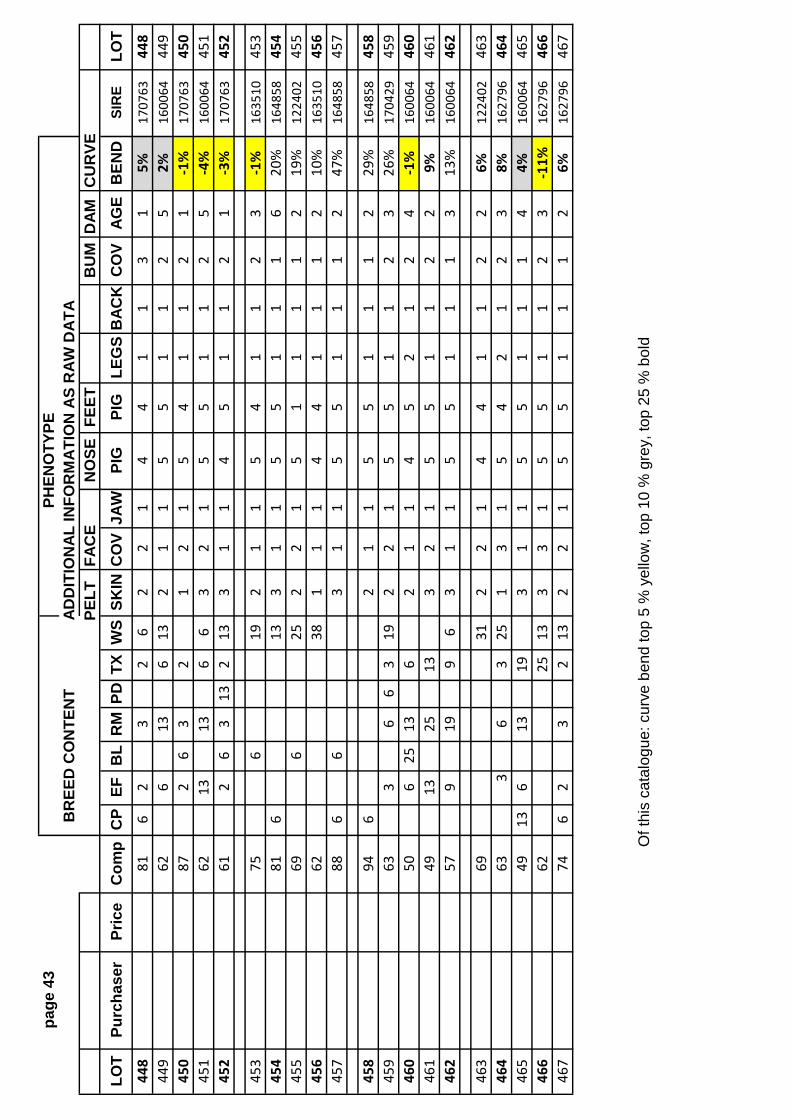
page
43
PHEN
OTY
PEB
REE
D C
ON
TEN
TAD
DIT
ION
AL IN
FOR
MAT
ION
AS
RAW
DAT
APE
LT
FAC
EN
OSE
FEET
BU
MD
AMC
UR
VELO
TPu
rcha
ser
Pric
eC
omp
CP
EFB
LR
MPD
TXW
SSK
INC
OV
JAW
PIG
PIG
LEG
SB
ACK
CO
VAG
EB
END
SIR
ELO
T44
881
62
32
62
21
44
11
31
5%17
0763
448
449
626
136
132
11
55
11
25
2%16
0064
449
450
872
63
21
21
54
11
21
-1%
1707
6345
045
162
1313
66
32
15
51
12
5-4
%16
0064
451
452
612
63
132
133
11
45
11
21
-3%
1707
6345
2
453
756
192
11
54
11
23
-1%
1635
1045
345
481
613
31
15
51
11
620
%16
4858
454
455
696
252
21
51
11
12
19%
1224
0245
545
662
381
11
44
11
12
10%
1635
1045
645
788
66
31
15
51
11
247
%16
4858
457
458
946
21
15
51
11
229
%16
4858
458
459
633
66
319
22
15
51
12
326
%17
0429
459
460
506
2513
62
11
45
21
24
-1%
1600
6446
046
149
1325
133
21
55
11
22
9%16
0064
461
462
579
199
63
11
55
11
13
13%
1600
6446
2
463
6931
22
14
41
12
26%
1224
0246
346
463
36
325
13
15
42
12
38%
1627
9646
446
549
136
1319
31
15
51
11
44%
1600
6446
546
662
2513
33
15
51
12
3-1
1%16
2796
466
467
746
23
213
22
15
51
11
26%
1627
9646
7
Of t
his
cata
logu
e: c
urve
ben
d to
p 5
% y
ello
w, t
op 1
0 %
gre
y, to
p 25
% b
old
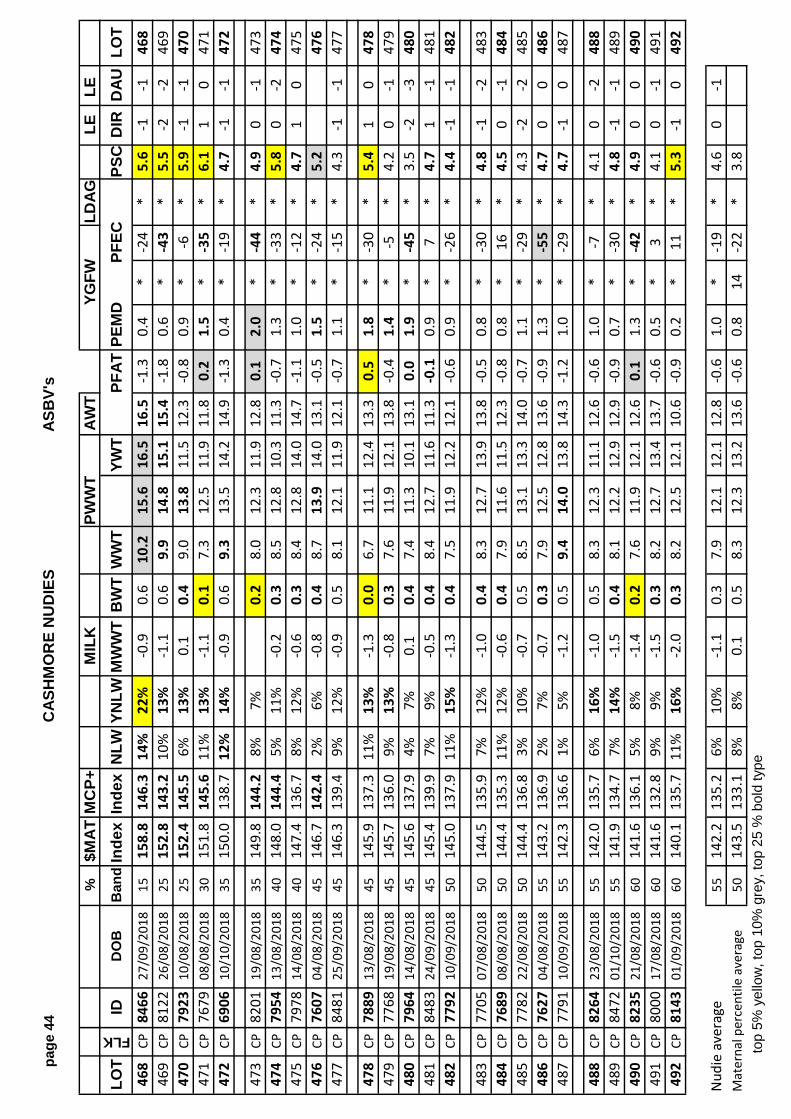
page
44
CAS
HM
OR
E N
UD
IES
ASB
V's
%$M
ATM
CP+
MIL
KPW
WT
AWT
YGFW
LDAG
LELE
LO
T
FLK
IDD
OB
Ban
dIn
dex
Inde
xN
LWYN
LWM
WW
TB
WT
WW
TYW
TPF
ATPE
MD
PFEC
PSC
DIR
DAU
LOT
468
CP84
6627
/09/
2018
1515
8.8
146.
314
%22
%-0
.90.
610
.215
.616
.516
.5-1
.30.
4*
-24
*5.
6-1
-146
846
9CP
8122
26/0
8/20
1825
152.
814
3.2
10%
13%
-1.1
0.6
9.9
14.8
15.1
15.4
-1.8
0.6
*-4
3*
5.5
-2-2
469
470
CP79
2310
/08/
2018
2515
2.4
145.
56%
13%
0.1
0.4
9.0
13.8
11.5
12.3
-0.8
0.9
*-6
*5.
9-1
-147
047
1CP
7679
08/0
8/20
1830
151.
814
5.6
11%
13%
-1.1
0.1
7.3
12.5
11.9
11.8
0.2
1.5
*-3
5*
6.1
10
471
472
CP69
0610
/10/
2018
3515
0.0
138.
712
%14
%-0
.90.
69.
313
.514
.214
.9-1
.30.
4*
-19
*4.
7-1
-147
2
473
CP82
0119
/08/
2018
3514
9.8
144.
28%
7%0.
28.
012
.311
.912
.80.
12.
0*
-44
*4.
90
-147
347
4CP
7954
13/0
8/20
1840
148.
014
4.4
5%11
%-0
.20.
38.
512
.810
.311
.3-0
.71.
3*
-33
*5.
80
-247
447
5CP
7978
14/0
8/20
1840
147.
413
6.7
8%12
%-0
.60.
38.
412
.814
.014
.7-1
.11.
0*
-12
*4.
71
047
547
6CP
7607
04/0
8/20
1845
146.
714
2.4
2%6%
-0.8
0.4
8.7
13.9
14.0
13.1
-0.5
1.5
*-2
4*
5.2
476
477
CP84
8125
/09/
2018
4514
6.3
139.
49%
12%
-0.9
0.5
8.1
12.1
11.9
12.1
-0.7
1.1
*-1
5*
4.3
-1-1
477
478
CP78
8913
/08/
2018
4514
5.9
137.
311
%13
%-1
.30.
06.
711
.112
.413
.30.
51.
8*
-30
*5.
41
047
847
9CP
7768
19/0
8/20
1845
145.
713
6.0
9%13
%-0
.80.
37.
611
.912
.113
.8-0
.41.
4*
-5*
4.2
0-1
479
480
CP79
6414
/08/
2018
4514
5.6
137.
94%
7%0.
10.
47.
411
.310
.113
.10.
01.
9*
-45
*3.
5-2
-348
048
1CP
8483
24/0
9/20
1845
145.
413
9.9
7%9%
-0.5
0.4
8.4
12.7
11.6
11.3
-0.1
0.9
*7
*4.
71
-148
148
2CP
7792
10/0
9/20
1850
145.
013
7.9
11%
15%
-1.3
0.4
7.5
11.9
12.2
12.1
-0.6
0.9
*-2
6*
4.4
-1-1
482
483
CP77
0507
/08/
2018
5014
4.5
135.
97%
12%
-1.0
0.4
8.3
12.7
13.9
13.8
-0.5
0.8
*-3
0*
4.8
-1-2
483
484
CP76
8908
/08/
2018
5014
4.4
135.
311
%12
%-0
.60.
47.
911
.611
.512
.3-0
.80.
8*
16*
4.5
0-1
484
485
CP77
8222
/08/
2018
5014
4.4
136.
83%
10%
-0.7
0.5
8.5
13.1
13.3
14.0
-0.7
1.1
*-2
9*
4.3
-2-2
485
486
CP76
2704
/08/
2018
5514
3.2
136.
92%
7%-0
.70.
37.
912
.512
.813
.6-0
.91.
3*
-55
*4.
70
048
648
7CP
7791
10/0
9/20
1855
142.
313
6.6
1%5%
-1.2
0.5
9.4
14.0
13.8
14.3
-1.2
1.0
*-2
9*
4.7
-10
487
488
CP82
6423
/08/
2018
5514
2.0
135.
76%
16%
-1.0
0.5
8.3
12.3
11.1
12.6
-0.6
1.0
*-7
*4.
10
-248
848
9CP
8472
01/1
0/20
1855
141.
913
4.7
7%14
%-1
.50.
48.
112
.212
.912
.9-0
.90.
7*
-30
*4.
8-1
-148
949
0CP
8235
21/0
8/20
1860
141.
613
6.1
5%8%
-1.4
0.2
7.6
11.9
12.1
12.6
0.1
1.3
*-4
2*
4.9
00
490
491
CP80
0017
/08/
2018
6014
1.6
132.
89%
9%-1
.50.
38.
212
.713
.413
.7-0
.60.
5*
3*
4.1
0-1
491
492
CP81
4301
/09/
2018
6014
0.1
135.
711
%16
%-2
.00.
38.
212
.512
.110
.6-0
.90.
2*
11*
5.3
-10
492
Nud
ie a
vera
ge55
142.
213
5.2
6%10
%-1
.10.
37.
912
.112
.112
.8-0
.61.
0*
-19
*4.
60
-1M
ater
nal p
erce
ntile
ave
rage
5014
3.5
133.
18%
8%0.
10.
58.
312
.313
.213
.6-0
.60.
814
-22
*3.
8to
p 5%
yel
low
, top
10%
gre
y, to
p 25
% b
old
type
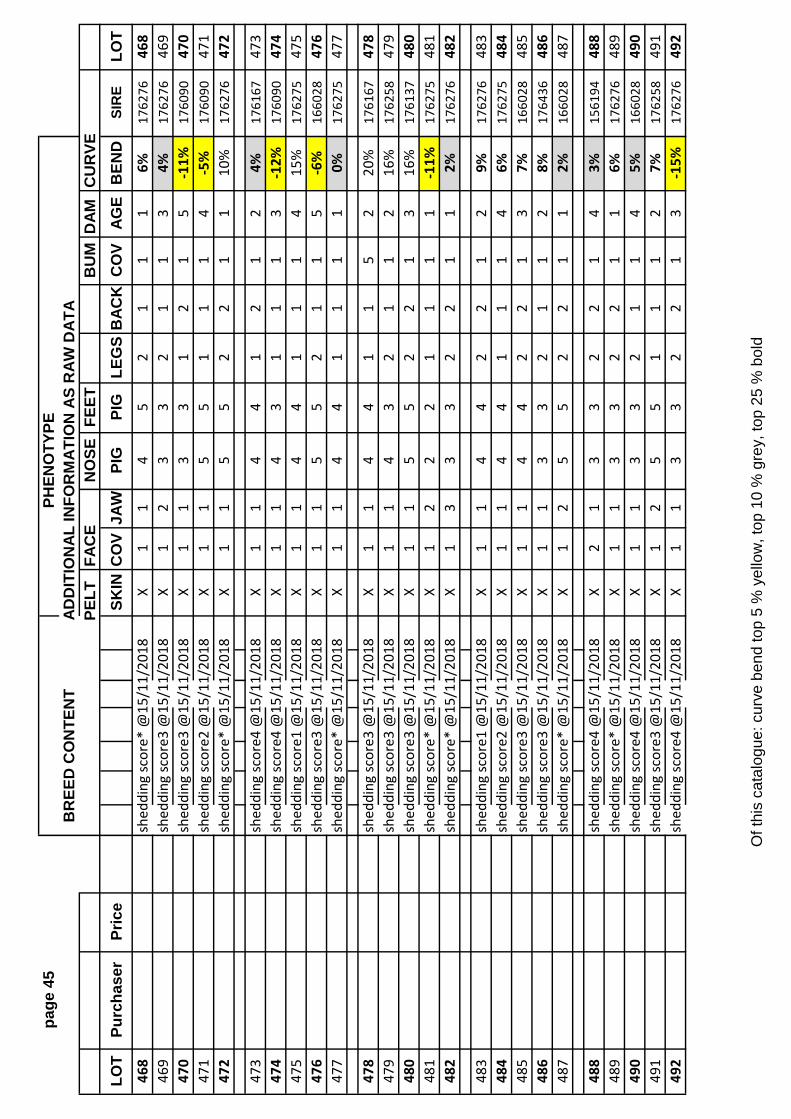
page
45
PHEN
OTY
PEB
REE
D C
ON
TEN
TAD
DIT
ION
AL IN
FOR
MAT
ION
AS
RAW
DAT
APE
LT
FAC
EN
OSE
FEET
BU
MD
AMC
UR
VELO
TPu
rcha
ser
Pric
eSK
INC
OV
JAW
PIG
PIG
LEG
SB
ACK
CO
VAG
EB
END
SIR
ELO
T46
8sh
eddi
ng sc
ore*
@15
/11/
2018
X1
14
52
11
16%
1762
7646
846
9sh
eddi
ng sc
ore3
@15
/11/
2018
X1
23
32
11
34%
1762
7646
947
0sh
eddi
ng sc
ore3
@15
/11/
2018
X1
13
31
21
5-1
1%17
6090
470
471
shed
ding
scor
e2 @
15/1
1/20
18X
11
55
11
14
-5%
1760
9047
147
2sh
eddi
ng sc
ore*
@15
/11/
2018
X1
15
52
21
110
%17
6276
472
473
shed
ding
scor
e4 @
15/1
1/20
18X
11
44
12
12
4%17
6167
473
474
shed
ding
scor
e4 @
15/1
1/20
18X
11
43
11
13
-12%
1760
9047
447
5sh
eddi
ng sc
ore1
@15
/11/
2018
X1
14
41
11
415
%17
6275
475
476
shed
ding
scor
e3 @
15/1
1/20
18X
11
55
21
15
-6%
1660
2847
647
7sh
eddi
ng sc
ore*
@15
/11/
2018
X1
14
41
11
10%
1762
7547
7
478
shed
ding
scor
e3 @
15/1
1/20
18X
11
44
11
52
20%
1761
6747
847
9sh
eddi
ng sc
ore3
@15
/11/
2018
X1
14
32
11
216
%17
6258
479
480
shed
ding
scor
e3 @
15/1
1/20
18X
11
55
22
13
16%
1761
3748
048
1sh
eddi
ng sc
ore*
@15
/11/
2018
X1
22
21
11
1-1
1%17
6275
481
482
shed
ding
scor
e* @
15/1
1/20
18X
13
33
22
11
2%17
6276
482
483
shed
ding
scor
e1 @
15/1
1/20
18X
11
44
22
12
9%17
6276
483
484
shed
ding
scor
e2 @
15/1
1/20
18X
11
44
11
14
6%17
6275
484
485
shed
ding
scor
e3 @
15/1
1/20
18X
11
44
22
13
7%16
6028
485
486
shed
ding
scor
e3 @
15/1
1/20
18X
11
33
21
12
8%17
6436
486
487
shed
ding
scor
e* @
15/1
1/20
18X
12
55
22
11
2%16
6028
487
488
shed
ding
scor
e4 @
15/1
1/20
18X
21
33
22
14
3%15
6194
488
489
shed
ding
scor
e* @
15/1
1/20
18X
11
33
22
11
6%17
6276
489
490
shed
ding
scor
e4 @
15/1
1/20
18X
11
33
21
14
5%16
6028
490
491
shed
ding
scor
e3 @
15/1
1/20
18X
12
55
11
12
7%17
6258
491
492
shed
ding
scor
e4 @
15/1
1/20
18X
11
33
22
13
-15%
1762
7649
2
Of t
his
cata
logu
e: c
urve
ben
d to
p 5
% y
ello
w, t
op 1
0 %
gre
y, to
p 25
% b
old

page
46
CAS
HM
OR
E N
UD
IES
ASB
V's
%$M
ATM
CP+
MIL
KPW
WT
AWT
YGFW
LDAG
LELE
LO
T
FLK
IDD
OB
Ban
dIn
dex
Inde
xN
LWYN
LWM
WW
TB
WT
WW
TYW
TPF
ATPE
MD
PFEC
PSC
DIR
DAU
LOT
493
CP75
8907
/08/
2018
6513
9.1
136.
11%
4%-0
.80.
48.
012
.612
.411
.4-0
.51.
1*
-19
*4.
049
349
4CP
8025
16/0
8/20
1870
137.
613
6.1
4%6%
-1.2
0.2
7.3
11.0
8.8
9.3
-0.2
1.5
*7
*4.
81
049
449
5CP
8217
19/0
8/20
1870
137.
012
6.8
9%13
%-0
.70.
37.
611
.011
.112
.9-0
.90.
2*
4*
4.3
0-2
495
496
CP79
2510
/08/
2018
7013
6.9
127.
85%
8%-1
.10.
47.
511
.211
.614
.4-0
.81.
0*
-34
*3.
70
-249
649
7CP
7991
16/0
8/20
1870
136.
413
1.1
4%7%
-1.4
0.3
6.7
10.9
11.3
12.7
-0.3
1.4
*-6
1*
4.2
10
497
498
CP76
0007
/08/
2018
7013
6.3
126.
84%
7%-0
.60.
26.
610
.511
.013
.5-0
.80.
8*
-51
*4.
01
049
849
9CP
7609
05/0
8/20
1870
136.
212
9.4
9%10
%-2
.00.
37.
011
.110
.712
.8-0
.60.
9*
-24
*4.
41
149
950
0CP
7502
20/0
4/20
1875
134.
912
9.8
1%6%
0.4
7.2
11.2
10.2
11.5
-0.7
0.8
*-2
1*
4.2
500
501
CP79
4713
/08/
2018
7513
3.7
126.
61%
5%-1
.10.
58.
011
.911
.713
.6-0
.40.
9*
10*
3.8
-3-2
501
502
CP79
3311
/08/
2018
7513
3.6
130.
47%
9%-2
.40.
36.
811
.211
.911
.10.
41.
1*
-1*
4.4
01
502
503
CP78
0609
/08/
2018
8013
3.0
125.
18%
9%-1
.60.
26.
29.
510
.912
.20.
31.
4*
10*
2.8
10
503
504
CP77
6519
/08/
2018
8013
1.3
124.
44%
8%-1
.40.
27.
010
.711
.512
.2-0
.90.
5*
-8*
3.9
10
504
505
CP79
8715
/08/
2018
8013
0.4
126.
12%
11%
-1.6
0.2
7.0
10.5
11.3
11.4
-0.6
0.9
*-1
6*
4.7
0-1
505
506
CP81
0420
/08/
2018
8512
9.9
126.
11%
3%-1
.30.
47.
510
.910
.911
.3-0
.71.
0*
10*
3.7
00
506
Nud
ie a
vera
ge55
142.
213
5.2
6%10
%-1
.10.
37.
912
.112
.112
.8-0
.61.
0*
-19
*4.
60
-1M
ater
nal p
erce
ntile
ave
rage
5014
3.5
133.
18%
8%0.
10.
58.
312
.313
.213
.6-0
.60.
814
-22
*3.
8to
p 5%
yel
low
, top
10%
gre
y, to
p 25
% b
old
type

page
47
PHEN
OTY
PEB
REE
D C
ON
TEN
TAD
DIT
ION
AL IN
FOR
MAT
ION
AS
RAW
DAT
APE
LT
FAC
EN
OSE
FEET
BU
MD
AMC
UR
VELO
TPu
rcha
ser
Pric
eSK
INC
OV
JAW
PIG
PIG
LEG
SB
ACK
CO
VAG
EB
END
SIR
ELO
T49
3sh
eddi
ng sc
ore3
@15
/11/
2018
X1
15
51
11
5-1
0%16
6028
493
494
shed
ding
scor
e4 @
15/1
1/20
18X
11
44
11
14
-15%
1760
9049
449
5sh
eddi
ng sc
ore4
@15
/11/
2018
X1
14
41
21
218
%17
6090
495
496
shed
ding
scor
e3 @
15/1
1/20
18X
11
33
22
13
28%
1762
7549
649
7sh
eddi
ng sc
ore4
@15
/11/
2018
X1
14
42
11
316
%17
6436
497
498
shed
ding
scor
e2 @
15/1
1/20
18X
12
44
11
14
29%
1764
3649
849
9sh
eddi
ng sc
ore3
@15
/11/
2018
X1
13
31
11
516
%16
6174
499
500
shed
ding
scor
e3 @
15/1
1/20
18X
11
55
11
14
2%N
AM08
050
050
1sh
eddi
ng sc
ore3
@15
/11/
2018
X1
13
31
11
514
%16
6028
501
502
shed
ding
scor
e2 @
15/1
1/20
18X
11
55
11
13
-1%
1762
7550
2
503
shed
ding
scor
e3 @
15/1
1/20
18X
11
55
22
12
28%
1762
7550
350
4sh
eddi
ng sc
ore4
@15
/11/
2018
X1
13
31
11
214
%17
6030
504
505
shed
ding
scor
e4 @
15/1
1/20
18X
11
44
11
12
9%15
6194
505
506
shed
ding
scor
e1 @
15/1
1/20
18X
11
55
11
15
4%17
6275
506
Of t
his
cata
logu
e: c
urve
ben
d to
p 5
% y
ello
w, t
op 1
0 %
gre
y, to
p 25
% b
old

Sh
eep
Gen
etic
s |
L
AM
BP
LAN
|
M
ERIN
OS
ELEC
T
|
KID
PLA
N PERC
ENTI
LE R
EPO
RT 1
/9/2
019
BW
TM
WW
TW
WT
PW
TA
WT
PEM
DP
FAT
PW
ECY
GFW
YN
LWN
LWP
SC
DR
ESS
Top
valu
e-0
.53
15
.62
1.6
28
.45
.73
.6-9
14
2.1
35
%2
9%
8.5
5.1
Top
1%0
.01
.81
1.6
17
.32
0.1
3.3
1-7
43
1.7
25
%2
0%
63
.6To
p 5%
0.2
1.3
10
.61
5.7
17
.92
.40
.4-5
92
7.7
20
%1
7%
5.2
2.9
Top
10%
0.2
1.1
10
.11
4.9
16
.92
0.1
-51
25
.51
7%
15
%4
.82
.5To
p 20
%0
.30
.79
.41
3.9
15
.71
.5-0
.2-3
92
2.6
13
%1
2%
4.4
2To
p 30
%0.
40.
58.
913
.214
.71.
2-0
.4-3
219
.811
%10
%4.
11.
7To
p 40
%0.
50.
38.
512
.513
.90.
9-0
.5-2
515
.69%
9%3.
81.
4To
p 50
%0.
50.
18
11.9
13.1
0.7
-0.7
-19
10.6
7%7%
3.5
1.1
Top
60%
0.6
-0.1
7.4
11.1
12.2
0.4
-0.8
-12
6.8
6%5%
3.2
0.9
Top
70%
0.6
-0.4
6.7
1011
.20.
2-1
-53.
74%
4%2.
90.
7To
p 80
%0.
7-0
.65.
68.
59.
9-0
.1-1
.25
0.6
3%2%
2.3
0.5
Top
90%
0.8
-14.
36.
48
-0.4
-1.5
19-3
.30%
-1%
1.7
0.3
Bot
tom
val
ue1.
2-3
.3-3
.5-4
.2-3
-2.6
-417
7-2
9.4
-19%
-21%
-7.9
-1.6
LMY
IMF
SH
EAR
F5M
BS
YC
SC
SY
CO
NC
ON
YLS
LSY
ERA
ERA
MA
T$M
CP
+
Top
valu
e8
.31
.3-3
.5-0
.30
.90
.58
0.3
10
.10
.37
0.3
60
.11
0.0
81
95
17
8.7
Top
1%6
.80
.3-0
.8-0
.20
.56
0.3
40
.21
0.0
70
.26
0.2
60
.08
0.0
61
72
15
8.9
Top
5%5
.90
.10
.4-0
.10
.45
0.2
50
.18
0.0
60
.21
0.2
10
.07
0.0
41
65
15
2.2
Top
10%
5.5
0.0
1.1
-0.1
0.3
80
.21
0.1
70
.05
0.1
80
.18
0.0
60
.04
16
11
48
.5To
p 20
%4
.9-0
.11
.9-0
0.3
20
.17
0.1
50
.04
0.1
50
.15
0.0
50
.03
15
51
43
.5To
p 30
%4.
5-0
.22.
40.
010.
260.
140.
130.
030.
120.
120.
040.
0215
113
9.4
Top
40%
4.2
-0.3
2.9
0.03
0.21
0.12
0.11
0.03
0.1
0.1
0.03
0.02
147
136.
1To
p 50
%3.
9-0
.33.
30.
050.
150.
10.
090.
030.
080.
080.
030.
0114
313
3.1
Top
60%
3.5
-0.4
3.7
0.08
0.1
0.08
0.07
0.02
0.06
0.05
0.02
0.01
140
129.
9To
p 70
%2.
9-0
.54.
10.
10.
050.
060.
040.
010.
030.
010.
010
135
126.
4To
p 80
%2.
2-0
.64.
60.
130
0.04
0.02
00.
01-0
.03
00
130
121.
6To
p 90
%1.
1-0
.85.
20.
18-0
.06
0-0
.01
-0.0
1-0
.02
-0.0
7-0
.01
-012
111
3.9
Bot
tom
val
ue-2
.3-1
.516
0.45
-0.4
7-0
.34
-0.2
4-0
.05
-0.1
4-0
.22
-0.0
7-0
8582
.6

Understanding LAMBPLANMaternal ASBVs
Rams with more positiveASBVs for post weaningweight (PWT) produce
lambs that grow quickerand reach target weightsin a shorter time. Thisram will produce lambsthat are, on average,1.25kg heavier than aram with a 0 ASBV for
PWT.
Rams with more positiveASBVs for eye muscledepth (EMD) produce
lambs that have a higherlean meat yield. This
ram will produce lambsthat have a 0.2mm
deeper eye muscle thana ram with a 0 EMD
ASBV.
Rams with a higherclean fleece weight(CFW) ASBV will
produce progeny that cutmore wool. This ram willproduce progeny that, on average, cut 2.5%more wool than a ram
with an ASBV of 0.
Rams with morepositive ASBVs formaternal weaning weight (MWT) willproduce daughters
which will weanheavier lambs. This
ASBV reflects acombination of thedaughter’s ability to
milk and provide a better maternal
environment.
Rams with a morepositive number of
lambs weaned (NLW)ASBV will sire daughters
that wean a higherpercentage of lambs.
This ram with an ASBVof 4 will sire daughterswhich, on average, willwean 2% more lambs.
Rams with higher scrotal circumference(SC) ASBVs will sire
daughters that are, onaverage, more fertile.
Sheep Genetics is a joint program of Meat & Livestock Australia Limited ABN 39 081 678 364 and Australian Wool Innovation Limited ABN 12 095 165 558
WWT(kg)
MWT(kg)
PWT(kg)
FAT(mm)
EMD(mm)
NLW(%)
CFW(%)
SC(cm)
WEC (%)
INDEX
0.851
1.053
2.561
-0.445
0.438
433
537
0.644
-1037
105.6
For more information contact Sheep Genetics Ph: 02 6773 2948 Fax: 02 6773 [email protected] www.sheepgenetics.org.au
Understanding LAMBPLANMaternal ASBVs
Rams with more positiveASBVs for post weaningweight (PWT) produce
lambs that grow quickerand reach target weightsin a shorter time. Thisram will produce lambsthat are, on average,1.25kg heavier than aram with a 0 ASBV for
PWT.
Rams with more positiveASBVs for eye muscledepth (EMD) produce
lambs that have a higherlean meat yield. This
ram will produce lambsthat have a 0.2mm
deeper eye muscle thana ram with a 0 EMD
ASBV.
Rams with a higherclean fleece weight(CFW) ASBV will
produce progeny that cutmore wool. This ram willproduce progeny that, on average, cut 2.5%more wool than a ram
with an ASBV of 0.
Rams with morepositive ASBVs formaternal weaning weight (MWT) willproduce daughters
which will weanheavier lambs. This
ASBV reflects acombination of thedaughter’s ability to
milk and provide a better maternal
environment.
Rams with a morepositive number of
lambs weaned (NLW)ASBV will sire daughters
that wean a higherpercentage of lambs.
This ram with an ASBVof 4 will sire daughterswhich, on average, willwean 2% more lambs.
Rams with higher scrotal circumference(SC) ASBVs will sire
daughters that are, onaverage, more fertile.
WWT(kg)
MWT(kg)
PWT(kg)
FAT(mm)
EMD(mm)
NLW(%)
CFW(%)
SC(cm)
WEC (%)
INDEX
0.851
1.053
2.561
-0.445
0.438
433
537
0.644
-1037
105.6
Rams with a more positive weaning
weight (WWT) will, on average, produce
lambs that grow quicker to weaning.
This ram will produce lambs that are, on
average, 0.4kg heavier than a ram with a 0
ASBV for WWT.
Worm egg count (WEC) ASBVs estimate
an animal’s genetic potential for resisting worm burdens. Lower
WEC ASBVs are desirable. This ram
will, on average, sire progeny that have 10% fewer eggs/gram than a ram with an ASBV
of 0.
Rams with a more negative ASBV for fat
will produce lambs that are leaner, at the
same weight. This ram will produce
lambs that are, on average, 0.2mm leaner
at the GR site when compared to a ram
with a FAT ASBV of 0.
An index is a guide to the value of a ram for a particular market. Rams with higher indexes will
produce lambs that are more suited to that
particular breeding objective. In many
cases the indexes used for maternal breeds are
in $ terms.
• An ASBV of 0 is the average of the 1990 drop.
• Note: A useful rule of thumb for converting ram ASBVs into lamb production differences is to simply halve the ASBV (as rams contribute half the genetics of the lamb).
• Accuracy - published as a percentage, is a re ection of the amount of effective information that is available to calculate the ASBV. All ASBVs are now published with accuracies. The higher the percentage, the closer the ASBV is to the true breeding value of the animal. Breeding values without accuracies are Flock Breeding Values (FBVs) and can only be compared within the ock.
Trait
ASBVAcc
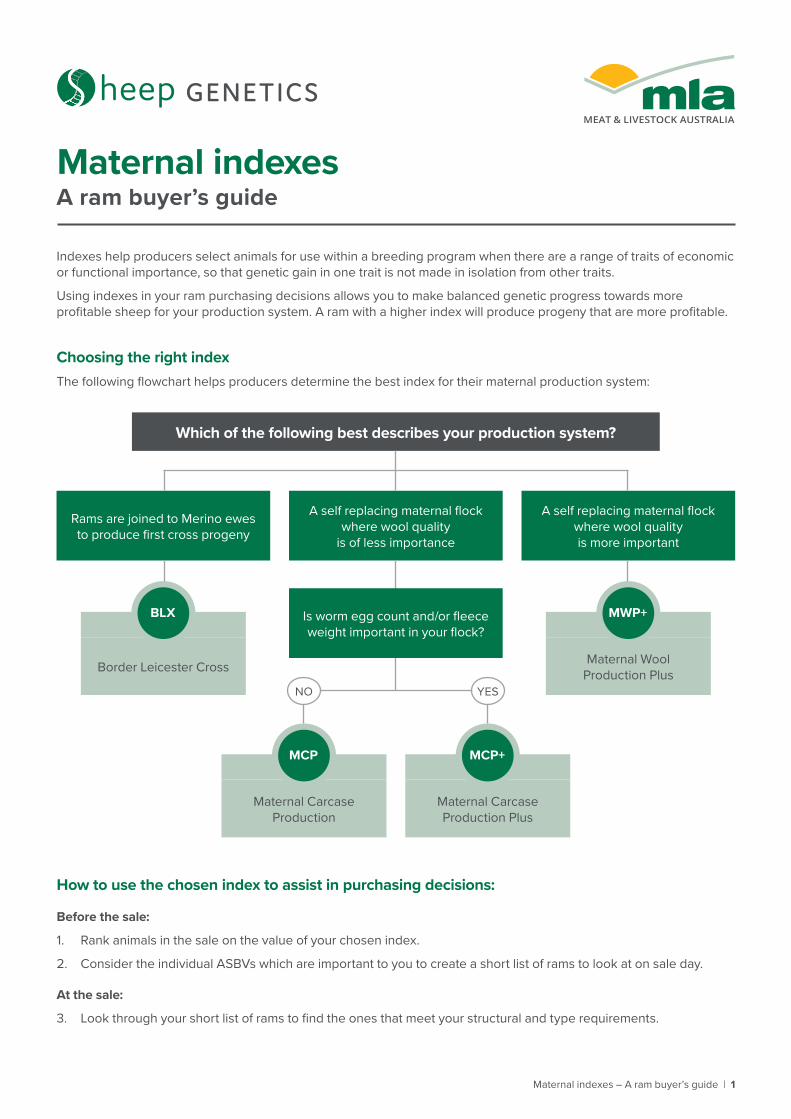
Maternal indexes – A ram buyer’s guide | 1
Maternal indexesA ram buyer’s guide
How to use the chosen index to assist in purchasing decisions:
Before the sale:
1. Rank animals in the sale on the value of your chosen index.
2. Consider the individual ASBVs which are important to you to create a short list of rams to look at on sale day.
At the sale:
3. Look through your short list of rams to find the ones that meet your structural and type requirements.
Indexes help producers select animals for use within a breeding program when there are a range of traits of economic or functional importance, so that genetic gain in one trait is not made in isolation from other traits.
Using indexes in your ram purchasing decisions allows you to make balanced genetic progress towards more profitable sheep for your production system. A ram with a higher index will produce progeny that are more profitable.
Choosing the right indexThe following flowchart helps producers determine the best index for their maternal production system:
Which of the following best describes your production system?
Rams are joined to Merino ewes to produce first cross progeny
A self replacing maternal flock where wool quality
is of less importance
A self replacing maternal flock where wool quality is more important
Border Leicester Cross
BLX
Maternal Wool Production Plus
MWP+
Maternal Carcase Production Plus
MCP+
Maternal Carcase Production
MCP
Is worm egg count and/or fleece weight important in your flock?
YESNO
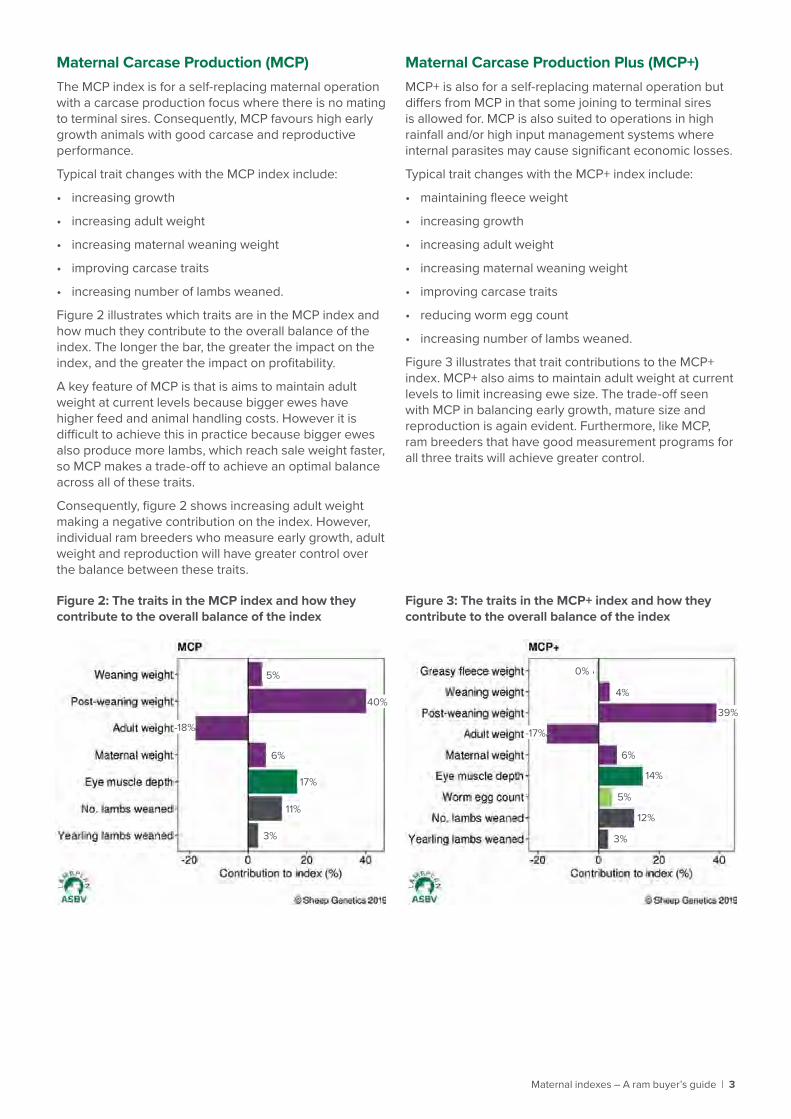
Maternal indexes – A ram buyer’s guide | 3
Maternal Carcase Production (MCP)The MCP index is for a self-replacing maternal operation with a carcase production focus where there is no mating to terminal sires. Consequently, MCP favours high early growth animals with good carcase and reproductive performance.
Typical trait changes with the MCP index include:
• increasing growth
• increasing adult weight
• increasing maternal weaning weight
• improving carcase traits
• increasing number of lambs weaned.
Figure 2 illustrates which traits are in the MCP index and how much they contribute to the overall balance of the index. The longer the bar, the greater the impact on the index, and the greater the impact on profitability.
A key feature of MCP is that is aims to maintain adult weight at current levels because bigger ewes have higher feed and animal handling costs. However it is difficult to achieve this in practice because bigger ewes also produce more lambs, which reach sale weight faster, so MCP makes a trade-off to achieve an optimal balance across all of these traits.
Consequently, figure 2 shows increasing adult weight making a negative contribution on the index. However, individual ram breeders who measure early growth, adult weight and reproduction will have greater control over the balance between these traits.
Figure 2: The traits in the MCP index and how they contribute to the overall balance of the index
Maternal Carcase Production Plus (MCP+)MCP+ is also for a self-replacing maternal operation but differs from MCP in that some joining to terminal sires is allowed for. MCP is also suited to operations in high rainfall and/or high input management systems where internal parasites may cause significant economic losses.
Typical trait changes with the MCP+ index include:
• maintaining fleece weight
• increasing growth
• increasing adult weight
• increasing maternal weaning weight
• improving carcase traits
• reducing worm egg count
• increasing number of lambs weaned.
Figure 3 illustrates that trait contributions to the MCP+ index. MCP+ also aims to maintain adult weight at current levels to limit increasing ewe size. The trade-off seen with MCP in balancing early growth, mature size and reproduction is again evident. Furthermore, like MCP, ram breeders that have good measurement programs for all three traits will achieve greater control.
0%
4%
6%
5%
3%
14%
12%
39%
-17%
5%
6%
3%
17%
11%
40%
-18%
Figure 3: The traits in the MCP+ index and how they contribute to the overall balance of the index

The Maternal Carcase Production + (MCP+) index is similar to the Maternal Carcase Production (MCP) index, with the addition of both wool and worm egg count. This index targets self-replacing production systems where maintaining adult weight and fleece weights are seen as important at the same time as improving carcase traits. A slight increase in clean fleece weight is expected. This index aims to reduce WEC as it is assumed in the index most enterprises are located in high rainfall areas and/or high input management systems. The contribution of each trait to economic gain is expressed in the graph along with the predicted genetic gain over 10 years.
For more information contact Sheep Genetics Ph: 02 8055 1818 Fax: 02 8055 1850 [email protected] www.sheepgenetics.org.au Sheep Genetics is a joint program of Meat & Livestock Australia Limited ABN 39 081 678 364 and Australian Wool Innovation Limited ABN 12 095 165 558
LAMBPLAN Maternal Indexes Maternal Carcase Production+ (MCP+)
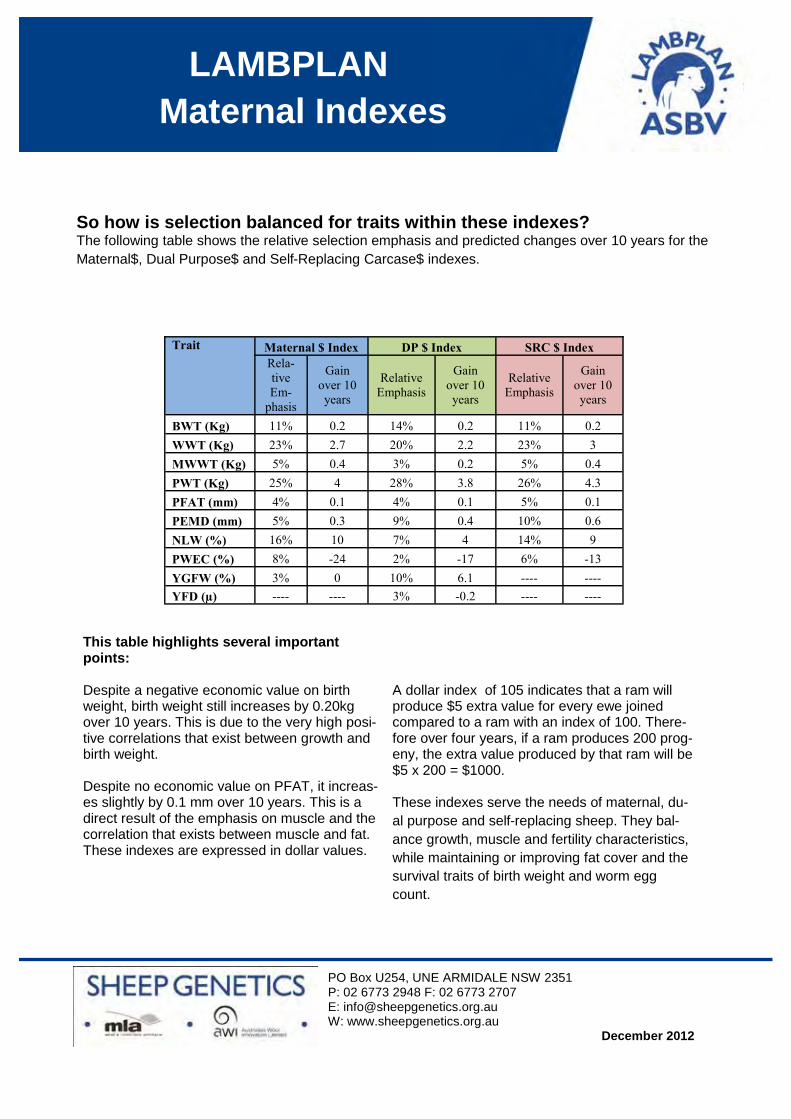
So how is selection balanced for traits within these indexes? The following table shows the relative selection emphasis and predicted changes over 10 years for the Maternal$, Dual Purpose$ and Self-Replacing Carcase$ indexes.
PO Box U254, UNE ARMIDALE NSW 2351 P: 02 6773 2948 F: 02 6773 2707 E: [email protected] W: www.sheepgenetics.org.au December 2012
LAMBPLAN Maternal Indexes
Trait Maternal $ Index DP $ Index SRC $ Index Rela-tive Em-
phasis
Gain over 10 years
Relative Emphasis
Gain over 10 years
Relative Emphasis
Gain over 10 years
BWT (Kg) 11% 0.2 14% 0.2 11% 0.2 WWT (Kg) 23% 2.7 20% 2.2 23% 3 MWWT (Kg) 5% 0.4 3% 0.2 5% 0.4 PWT (Kg) 25% 4 28% 3.8 26% 4.3 PFAT (mm) 4% 0.1 4% 0.1 5% 0.1 PEMD (mm) 5% 0.3 9% 0.4 10% 0.6 NLW (%) 16% 10 7% 4 14% 9 PWEC (%) 8% -24 2% -17 6% -13 YGFW (%) 3% 0 10% 6.1 ---- ---- YFD (µ) ---- ---- 3% -0.2 ---- ----
This table highlights several important points: Despite a negative economic value on birth weight, birth weight still increases by 0.20kg over 10 years. This is due to the very high posi-tive correlations that exist between growth and birth weight. Despite no economic value on PFAT, it increas-es slightly by 0.1 mm over 10 years. This is a direct result of the emphasis on muscle and the correlation that exists between muscle and fat. These indexes are expressed in dollar values.
A dollar index of 105 indicates that a ram will produce $5 extra value for every ewe joined compared to a ram with an index of 100. There-fore over four years, if a ram produces 200 prog-eny, the extra value produced by that ram will be $5 x 200 = $1000. These indexes serve the needs of maternal, du-al purpose and self-replacing sheep. They bal-ance growth, muscle and fertility characteristics, while maintaining or improving fat cover and the survival traits of birth weight and worm egg count.
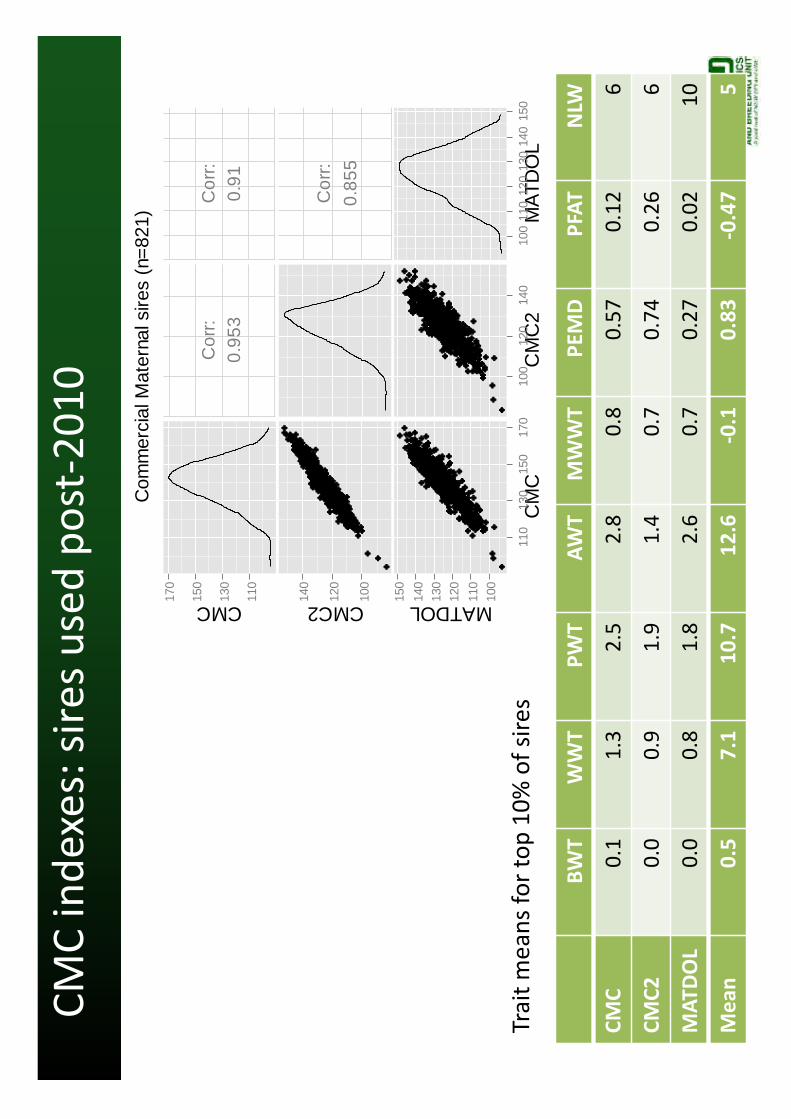
CMC
inde
xes:
sire
s use
d po
st-2
010
Com
mer
cial
Mat
erna
l sire
s (n
=821
)
CMC CMC2 MATDOLC
MC
CM
C2
MAT
DO
L
110
130
150
170
Cor
r:0.
953
Cor
r:0.
91
100
120
140
Cor
r:0.
855
100
110
120
130
140
150
110
130
150
170
100
120
140
100
110
120
130
140
150
BWT
WW
T PW
T AW
T M
WW
T PE
MD
PFAT
N
LW
CMC
0.1
1.3
2.5
2.8
0.8
0.57
0.
12
6
CMC2
0.
0 0.
9 1.
9 1.
4 0.
7 0.
74
0.26
6
MAT
DOL
0.0
0.8
1.8
2.6
0.7
0.27
0.
02
10
Mea
n 0.
5 7.
1 10
.7
12.6
-0
.1
0.83
-0
.47
5
Trai
t mea
ns fo
r top
10%
of s
ires
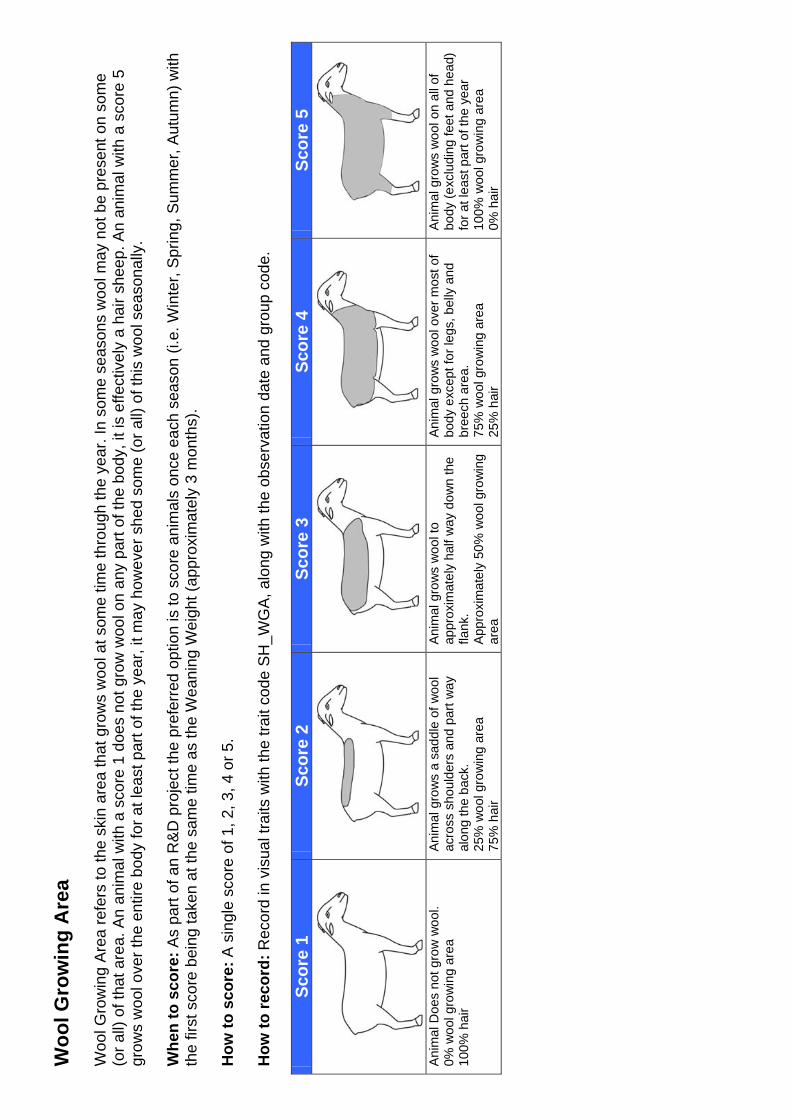
Woo
l Gro
win
g A
rea
Woo
l Gro
win
g Ar
ea re
fers
to th
e sk
in a
rea
that
gro
ws
woo
l at s
ome
time
thro
ugh
the
year
. In
som
e se
ason
s w
ool m
ay n
ot b
e pr
esen
t on
som
e (o
r all)
of t
hat a
rea.
An
anim
al w
ith a
sco
re 1
doe
s no
t gro
w w
ool o
n an
y pa
rt of
the
body
, it i
s ef
fect
ivel
y a
hair
shee
p. A
n an
imal
with
a s
core
5
grow
s w
ool o
ver t
he e
ntire
bod
y fo
r at l
east
par
t of t
he y
ear,
it m
ay h
owev
er s
hed
som
e (o
r all)
of t
his
woo
l sea
sona
lly.
Whe
n to
sco
re: A
s pa
rt of
an
R&D
pro
ject
the
pref
erre
d op
tion
is to
sco
re a
nim
als
once
eac
h se
ason
(i.e
. Win
ter,
Sprin
g, S
umm
er, A
utum
n) w
ithth
e fir
st s
core
bei
ng ta
ken
at th
e sa
me
time
as th
e W
eani
ng W
eigh
t (ap
prox
imat
ely
3 m
onth
s).
How
to s
core
: A s
ingl
e sc
ore
of 1
, 2, 3
, 4 o
r 5.
How
to re
cord
: Rec
ord
in v
isua
l tra
its w
ith th
e tra
it co
de S
H_W
GA,
alo
ng w
ith th
e ob
serv
atio
n da
te a
nd g
roup
cod
e.
Scor
e 1
Scor
e 2
Scor
e 3
Scor
e 4
Scor
e 5
Anim
al D
oes
not g
row
woo
l. 0%
woo
l gro
win
g ar
ea
100%
hai
r
Anim
al g
row
s a
sadd
le o
f woo
l ac
ross
sho
ulde
rs a
nd p
art w
ay
alon
g th
e ba
ck.
25%
woo
l gro
win
g ar
ea
75%
hai
r
Anim
al g
row
s w
ool t
o ap
prox
imat
ely
half
way
dow
n th
e fla
nk.
Appr
oxim
atel
y 50
% w
ool g
row
ing
area
Anim
al g
row
s w
ool o
ver m
ost o
f bo
dy e
xcep
t for
legs
, bel
ly a
nd
bree
ch a
rea.
75
% w
ool g
row
ing
area
25
% h
air
Anim
al g
row
s w
ool o
n al
l of
body
(exc
ludi
ng fe
et a
nd h
ead)
fo
r at l
east
par
t of t
he y
ear
100%
woo
l gro
win
g ar
ea
0% h
air
Hai
r Typ
e
Hai
r Typ
e re
fers
to th
e le
ngth
and
coa
rsen
ess
of th
e ha
ir th
at g
row
s on
the
anim
al p
artic
ular
ly in
the
area
s no
t cov
ered
in w
ool.
Whe
n to
sco
re: A
s pa
rt of
an
R&D
pro
ject
the
pref
erre
d op
tion
is to
sco
re a
nim
als
once
eac
h se
ason
(i.e
. Win
ter,
Sprin
g, S
umm
er, A
utum
n) a
t th
e sa
me
time
as W
ool G
row
ing
Area
is b
eing
ass
esse
d.
How
to s
core
: A s
ingl
e sc
ore
of 1
, 3 o
r 5.
How
to re
cord
: Rec
ord
in v
isua
l tra
its w
ith th
e tra
it co
de S
H_H
air,
alon
g w
ith th
e ob
serv
atio
n da
te a
nd g
roup
cod
e.
Scor
e 1
Scor
e 3
Scor
e 5
Shor
t fin
e ha
ir, le
ss th
an 1
.5cm
in
leng
th
Med
ium
hai
r, ap
prox
imat
ely
1.5
to 2
.5cm
in le
ngth
Lo
ng c
ours
e ha
ir, g
reat
er th
an
2.5c
m in
leng
th
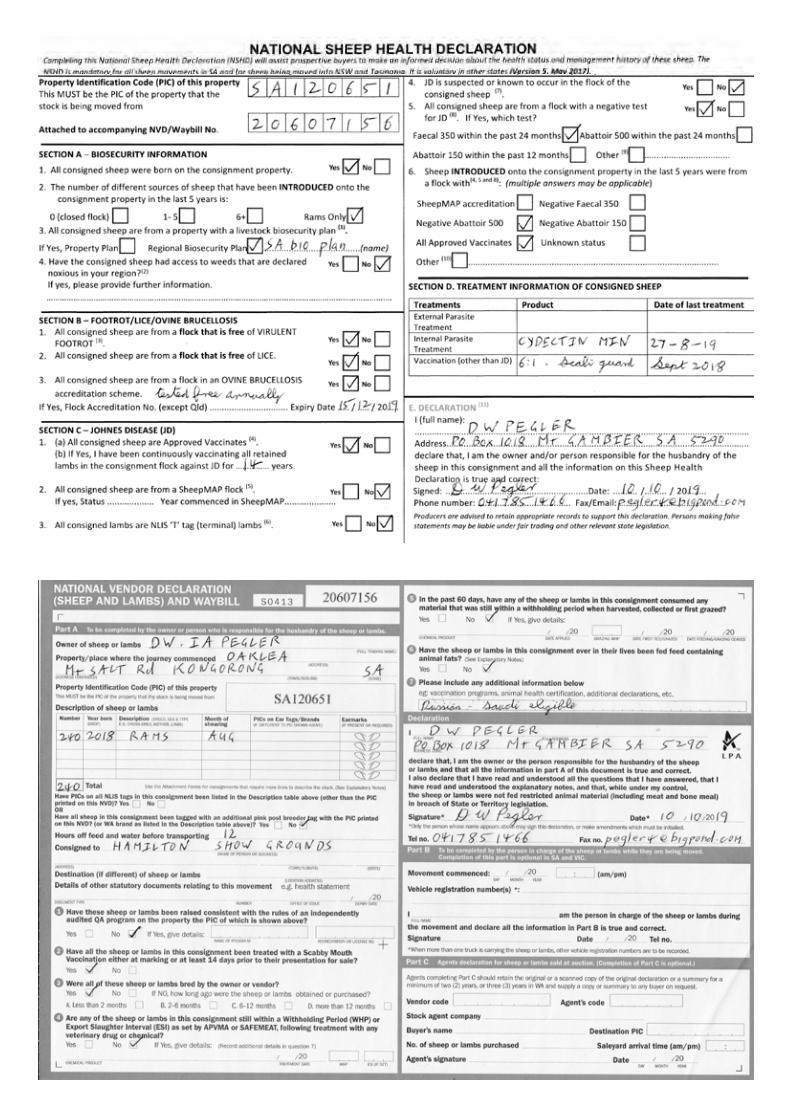

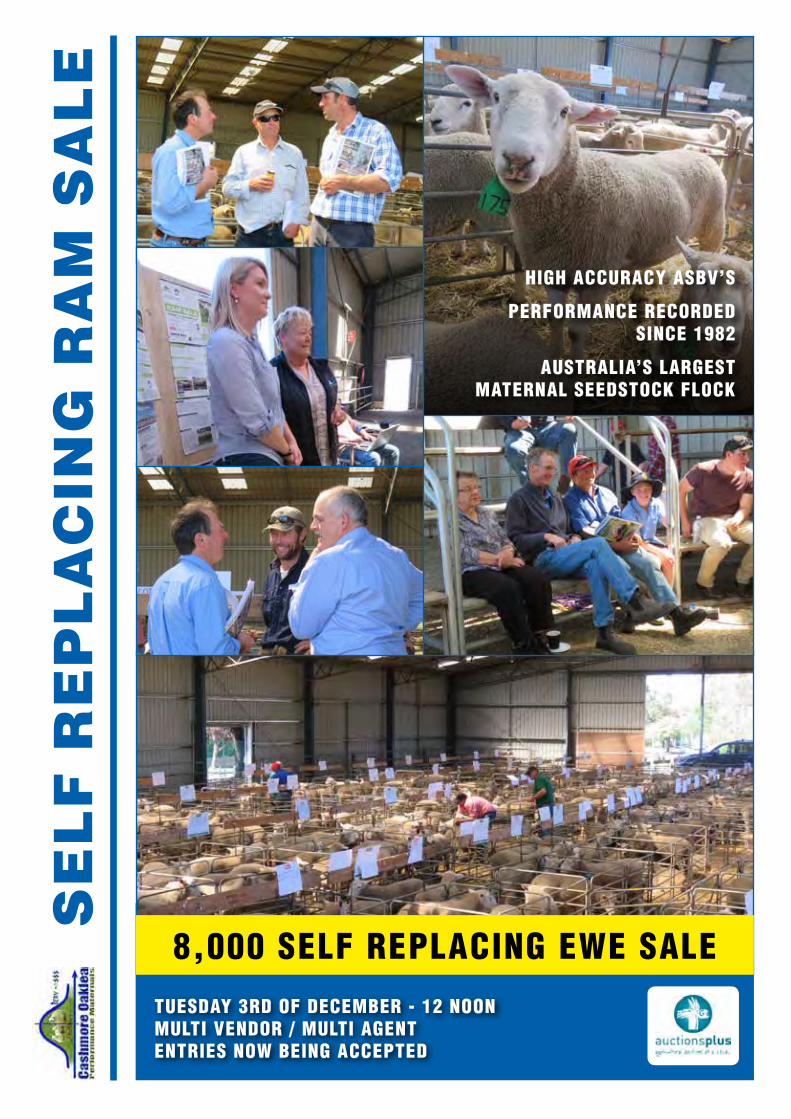
TUESDAY 3RD OF DECEMBER - 12 NOONMULTI VENDOR / MULTI AGENTENTRIES NOW BEING ACCEPTED
SE
LF
RE
PL
AC
ING
RA
M S
AL
E
HIGH ACCURACY ASBV’S
PERFORMANCE RECORDED SINCE 1982
AUSTRALIA’S LARGEST MATERNAL SEEDSTOCK FLOCK
8,000 SELF REPLACING EWE SALE