CASHEWNUT PRODUCTION AND MARKETING IN MKURANGA …
120
CASHEWNUT PRODUCTION AND MARKETING IN MKURANGA DISTRICT, TANZANIA BY SHIJA LYELLA LUSENDAMILA A DISSERTATION SUBMITTED IN PARTIAL FULFILMENT OF THE REQUIREMENTS FOR THE DEGREE OF MASTER OF SCIENCE IN AGRICULTURAL ECONOMICS OF SOKOINE UNIVERSITY OF AGRICULTURE. MOROGORO, TANZANIA. 2010
Transcript of CASHEWNUT PRODUCTION AND MARKETING IN MKURANGA …
CASHEWNUT PRODUCTION AND MARKETING IN MKURANGA
DISTRICT, TANZANIA
BY
SHIJA LYELLA LUSENDAMILA
A DISSERTATION SUBMITTED IN PARTIAL FULFILMENT OF THE
REQUIREMENTS FOR THE DEGREE OF MASTER OF SCIENCE IN
AGRICULTURAL ECONOMICS OF SOKOINE UNIVERSITY OF
AGRICULTURE. MOROGORO, TANZANIA.
2010
ABSTRACT
This study analysed the performance of cashewnut production and marketing in
Mkuranga District. More specifically, the study dealt with identifying major
problems affecting cashewnut production and marketing, profitability of cashewnuts
and its competing crop enterprises. In addition, an analysis of factors influencing
buyers’ net profit was done. The survey was conducted using a sample of 120
households, 24 traders and four secretaries of primary cooperatives. A structured
interview, personal observation and key informants were methods used to collect the
primary data. On the other hand secondary data were obtained from key
organizations in the industry. Tools of data analysis included descriptive statistics,
gross margin, as well as regression and correlation analyses. The results of analysis
in this study showed that low prices, unreliable markets, high input costs, pests and
diseases were the most important constraints. The highest and lowest gross margin
obtained from cashewnuts were 159 054 Tshs/ha and 82 110 Tshs/ha for coconut,
respectively. The results of correlation analysis showed that selling price was
positively correlated with market margin (r = 66.5%; P = 0.003). The regression
results indicated that education, selling price, and transport cost significantly (P <
0.05) affected the traders’ net profit, whilst buying price, and trading experience,
were not significant (P < 0.05). The existing marketing system actors comprised of
producers, agents, collectors, cooperatives, traders and consumers. Generally,
cashewnuts marketing system was seen to be inefficient and underdeveloped. Thus,
cashew development interventions should be directed to both production
technological gaps and marketing problems. The study recommends the use of
ii

warehouse receipts system, designated buying posts and improvement of research
and extension services in cashew industry.
iii

DECLARATION
I, SHIJA LYELLA LUSENDAMILA, do hereby declare to the Senate of Sokoine
University of Agriculture that this dissertation is my own original work has neither
been submitted nor being concurrently submitted for degree award in any other
Institution.
Shija Lyella Lusendamila Date(MSc. Candidate)
The above declaration is confirmed
Dr. R.M.J. Kadigi Date(Supervisor)
iv

COPYRIGHT
No part of this dissertation may be reproduced, stored in any retrieval system, or
transmitted in any form or by any means without prior written permission of the
author or Sokoine University of Agriculture in that behalf.
v

ACKNOWLEDGEMENTS
The completion of this study would not have been possible without the considerable
support from a number of individuals. I thank them all.
My profound gratitude first goes to my supervisor Dr. Reuben, M.J. Kadigi, for his
useful guidance and constructive criticisms during the whole period of the study. I
am also indebted to the Belgium Technical Cooperation (BTC) for its generous
financial support, which has enabled me to accomplish my MSc studies at SUA.
I also wish to extend my appreciation to all staff of Department of Agriculture in
Mkuranga District for allowing me to use their computer and motorbike during data
collection. I am grateful to the extension workers of the Mkuranga District Council
who assisted me in data collection. Sincere thanks are also extended to the
interviewed farmers in Mkuranga District for their time and acceptance to be
interviewed by me.
My heartfelt thanks are also due to all the staff of the Department of Agricultural
Economics and Agribusiness for their academic support during the MSc studies at
SUA. To my MSc class mates, it has been a bundle of experiences with excitement
and challenges shared among different cultures. I thank you all.
Finally, I thank my lovely wife Margaret Shija, for her encouragement and advices
during the entire period of my MSc studies at SUA.
vi

DEDICATION
I dedicate this dissertation to my father the late Lyella Maseselo and mother Mary
Lyella who made a lot of effort in laying down the foundation for my education.
TABLE OF CONTENTS
vii

ABSTRACT..................................................................................................................ii
DECLARATION.........................................................................................................iv
COPYRIGHT...............................................................................................................v
ACKNOWLEDGEMENTS.......................................................................................vi
DEDICATION............................................................................................................vii
TABLE OF CONTENTS..........................................................................................viii
LIST OF TABLES....................................................................................................xiii
LIST OF FIGURES...................................................................................................xv
LIST OF PLATES.....................................................................................................xvi
LIST OF APPENDICES..........................................................................................xvii
LIST OF ACRONOMS AND ABBREVIATIONS...............................................xviii
CHAPTER ONE..........................................................................................................1
1.0 INTRODUCTION..............................................................................................1
1.1 Background..........................................................................................................1
1.2 Problem Statement and Justification....................................................................3
1.3 Objectives of the Study........................................................................................4
1.3.1 General objective.....................................................................................4
1.3.2 Specific objectives...................................................................................4
1.3.3 Research questions...................................................................................5
1.4 Organization of the Dissertation..........................................................................5
CHAPTER TWO.........................................................................................................6
viii

2.0 LITERATURE REVIEW......................................................................................6
2.1 The Agricultural Sector in Tanzania....................................................................6
2.1.1 Agricultural sector policies..................................................................................6
2.2 The World Cashew Economy..............................................................................7
2.3 Cashewnut Production in Tanzania......................................................................8
2.3.1 Cashewnut production in the Coast region..............................................9
2.3.2 Cashewnut production trends in Mkuranga District..............................10
2.4 Farmers Incentives for Crop Production............................................................10
2.5 Utilization of Cashewnut Products....................................................................11
2.6 Agricultural Marketing Node and Inter Sectoral Linkages................................12
2.6.1 Research and extension services............................................................12
2.6.2 Agricultural marketing cooperatives (AMCOs)....................................13
2.6.3 Agricultural finance and credit availability...........................................14
2.6.4 Market information................................................................................16
2.6.5 Market infrastructure.............................................................................17
2.6.6 Grades and standards.............................................................................17
2.6.7 Availability of agricultural inputs..........................................................17
2.6.8 Prices of agricultural products...............................................................19
2.6.9 Marketing of agricultural commodities.................................................19
2.7 The Cashewnuts Marketing in Tanzania............................................................21
2.7.1 Cashewnuts marketing: historical perspectives.....................................21
2.7.2 Marketing channels for cashewnuts.......................................................21
2.7.3 Cashewnuts marketing performance......................................................24
2.7.4 Cashewnut quality control.....................................................................25
ix

2.7.5 Processing of raw cashewnuts...............................................................27
2.7.6 Pricing mechanisms for cashewnuts......................................................27
2.7.6 Cashewnut marketing costs....................................................................28
2.7.7 Cashewnuts marketing margins.............................................................29
2.8 Review of Analytical Techniques......................................................................29
2.8.1 Gross margin analysis............................................................................29
2.8.1.1 Limitations of the gross margin (GM) analysis.......................31
2.8.2 Determinants of net profit......................................................................31
2.8.2.1 Limitations of using OLS estimation procedure......................32
CHAPTER THREE...................................................................................................34
3.0 METHODOLOGY..............................................................................................34
3.1 Overview............................................................................................................34
3.2 Conceptual Framework of the Study.................................................................34
3.3 Description of the Study Area............................................................................36
3.3.1 Geographical location............................................................................36
3.3.2 Climate and vegetation..........................................................................36
3.3.3 Human population..................................................................................37
3.3.4 Agro-ecological zones...........................................................................37
3.4 Study Design......................................................................................................38
3.5 Sampling Techniques.........................................................................................38
3.5.1 Sample size............................................................................................38
3.5.2 Types and sources of data......................................................................39
3.5.3 Data collection.......................................................................................40
x

3.5.3.1 Primary data collection............................................................40
3.5.3.2 Secondary data collection........................................................41
3.6 Data Analysis.....................................................................................................41
3.6.1 Gross margin analysis............................................................................42
3.6.2 Correlation analysis...............................................................................42
3.6.3 Regression analysis................................................................................43
3.6.3.1 Problems of parameter estimation...........................................44
CHAPTER FOUR......................................................................................................46
4.0 RESULTS AND DISCUSSION.......................................................................46
4.1 Overview............................................................................................................46
4.2 Socio-economic Characteristics of the Sample Households..............................46
4.2.1 Gender of the heads of households........................................................46
4.2.2 Age of the heads of households.............................................................46
4.2.3 Marital status of heads of households....................................................47
4.2.4 Size of household...................................................................................48
4.2.5 Education level of the heads of households...........................................48
4.2.6 Employment status.................................................................................48
4.2.7 Other sources of income........................................................................48
4.2.8 Poverty level..........................................................................................50
4.2.9 Ownership of household assets..............................................................51
4.3 Crop Production and Marketing Issues..............................................................53
4.3.1 Land acquisition.....................................................................................53
4.3.2 Labour use and allocation......................................................................54
xi

4.3.3 Farm activities........................................................................................55
4.3.4 Farmers’ organization and availability of support services...................56
4.3.5 Factors affecting cashewnuts marketing................................................60
4.4 Profitability Analysis for Crop Enterprises........................................................66
4.5 Problems Encountered in Cashewnut Production and Marketing.....................69
4.6 Cashewnut Marketing........................................................................................71
4.6.1 Cashewnut selling..................................................................................71
4.6.2 Transportation of cashewnuts................................................................72
4.6.3 Cashewnut storage facilities..................................................................72
4.6.4 Sources of finance..................................................................................73
4.6.5 Cashewnut marketing channels..............................................................75
4.6.6 Correlation analysis...............................................................................79
4.6.7 Regression analysis................................................................................80
5.0 CONCLUSION AND POLICY IMPLICATIONS........................................82
5.1 Conclusion.........................................................................................................82
5.2 Policy Implications............................................................................................83
5.2.1 Producer price........................................................................................83
5.2.2 Cashewnut production...........................................................................84
5.2.3 Cashewnut marketing.............................................................................84
REFERENCES...........................................................................................................86
APPENDICES............................................................................................................98
xii

LIST OF TABLES
Table 1: Distribution of respondents by wards and villages.................................39
Table 2: Type of information gathered from secondary sources............................41
Table 3: Socio-economic characteristics of the sample households......................47
Table 4: Distribution of households by other sources of income..........................49
Table 5: Distribution of households by wealth status............................................51
Table 6: Distribution of assets by wealth category (%).........................................52
Table 7: Distribution of households by land acquisition methods.........................54
Table 8: Sources of labour for the sample households..........................................55
Table 9: Distribution of crop enterprises by farm size and yields.........................55
Table 10: Distribution of households by sources of credit......................................56
Table 11: Information on credit for farm operations, 2007/08................................58
Table 12: Provision of extension services................................................................59
Table 13: Distribution of household by category of buyers.....................................61
Table 14: Cashewnut selling price and distance to markets....................................61
Table 15: Propositions on improving cashewnut pricing.........................................63
Table 16: Mode of payment.....................................................................................63
Table 17: Distribution of households by selling places...........................................64
Table 18: Sources of market information................................................................65
Table 19: Exploitative tricks used by traders...........................................................66
Table 20: GM for maize, cashewnut, coconuts and cassava for 2007/08................67
Table 21: Labour requirements by crops (man-days/ha).........................................68
Table 22: Cashewnut production and marketing constraints...................................69
xiii

Table 23: Means of cashewnuts transportation........................................................72
Table 24: Distribution of traders by sources of credit.............................................73
Table 25: Reasons for not getting access to credits.................................................74
Table 26: Buyer categories by volume of cashewnut traded...................................79
Table 27: Determinants of net profit margin in cashewnut marketing....................81
xiv

LIST OF FIGURES
Figure 1: Cashewnut production trend in Tanzania from 1997/98 - 2007/08
(Source: CBT, 2008)..................................................................................8
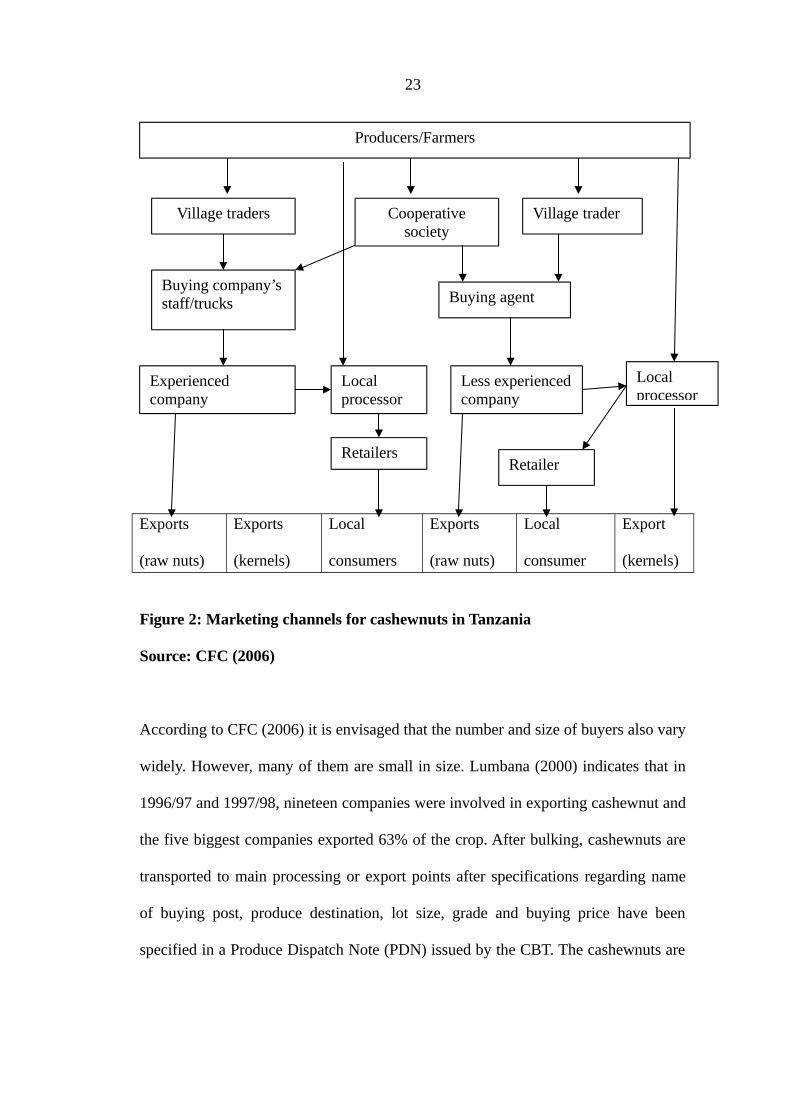
Figure 2: Marketing channels for cashewnuts in Tanzania.....................................23
Figure 3: Average producer and export prices for raw cashewnuts in Tanzania
from 1991-2007 (Source: CBT, 2008).....................................................25
Figure 4: Conceptual framework for the study.......................................................35
Figure 5: Marketing channels for cashewnuts in the study area.............................77
xv

LIST OF PLATES
Plate 1: Good quality cashewnuts...........................................................................26
Plate 2: Whole cashewnuts and pieces....................................................................26
xvi

LIST OF APPENDICES
Appendix 1: Questionnaire for cashewnuts farmers and traders................................98
Appendix 2: Correlation between prices and marketing margin..............................105
xvii

LIST OF ACRONYMS AND ABBREVIATIONS
AEC Agricultural Extension CentreAMCOs Agricultural Marketing CooperativesBET Board of External TradeBTC Belgium Technical CooperationCATA Cashewnut Authority of TanzaniaCBT Cashew Board of TanzaniaCFC Common Fund for CommodityCTAHR College of Tropical Agriculture and Human ResourcesDALDO District Agriculture and Livestock Development OfficerDED District Executive DirectorFAO Food and Agriculture Organization of United NationsFINCA Foundation for International Community AssistantFoB Free on BoardGDP Gross Domestic ProductGm/ha Gross margin per hectareHH HouseholdIMF International Monetary FundIFAD International Fund for Agriculture DevelopmentITF Input Trust FundLDC Least Development CountriesLEISA Low External Input and Sustainable AgricultureMAFC Ministry of Agriculture, Food security and Cooperatives MDB Marketing Development BureauMt Metric tonsNGOs Non Government OrganizationsPMD Powdery Mildew DiseasePDN Product Dispatch NotePPD Plant Protection DivisionPRIDE Promotion of Rural Initiative DevelopmentSACCOS Saving and Credit Cooperative SocietySEDA Small Enterprise Development AssociationSNAL Sokoine National Agriculture LibrarySPSS Statistical Package for Social ScienceSSA Sub-Saharan AfricaSUA Sokoine University of AgricultureTCMB Tanzania Cashewnut Marketing BoardTshs Tanzanian ShillingsURT United Republic of TanzaniaWB World Bank
xviii

xix

CHAPTER ONE
1.0 INTRODUCTION
1.1 Background
Identifying markets for agricultural products including cashewnuts, is often
considered a critical element in the effort to increase farm income, generate
additional employment and reduce post harvest loses in Africa (Mutakubwa, 2007).
In Tanzania agriculture is considered as the backbone of the national’s economy,
whereby about 80% of the population depend on agriculture (URT, 2001). However,
agricultural production and marketing problems, such as limited access to farm
inputs by smallholder farmers have affected the agricultural industry since
liberalization policies were operationalised in Tanzania in 1990s (Lumbana, 2000).
In general improvement of farm yield requires that farmers are able to buy inputs,
use improved technologies like appropriate farm inputs and implements which in
turn depend on the level of income generated from farming (Gabagambi, 1998). The
performance of marketing systems for both farm produce and inputs is also equally
important. Thus, linking rural producers to lucrative markets could help
commercializing the smallholder farming systems in Tanzania. Arguably, under
favourable marketing channels more efficient interregional trade within the country
can accelerate aggregate production, since it encourages farmers to increase
production (Gebreselassie and Sharp, 2007; Mwalili, 2008).
Cashewnut is one of the traditional export crops in Tanzania, in which its marketing
systems have been affected by market reform policies which occurred in the mid
1

1990s (Chachage and Nyoni, 2001). It is generally argued that the liberalization
policy in the country has not benefited cashewnut producers in the country. In
Mkuranga District for example, a downward trend of production is reported and this
is associated with lack of both reliable factor and produce markets (Kaoneka, 2006).
Mitchell (2004) reported that farmers in Mkuranga district are not satisfied with the
performance of cashewnut marketing and do complain of being exploited by private
traders. Moreover, the cashewnut cooperatives have failed to perform their key roles
namely: timely distribution of inputs, buying of crops and dissemination of
agricultural information to farmers (Mole, 2000). Rweyemamu (2002) reported that
cashewnuts markets are partially competitive and that farmers might be receiving
disadvantageous prices for their nuts.
In order to meet their desired production and marketing systems requirements, an
institutional innovation is needed to provide input credit to farmers through
successful enforcement of interlocking contracts to finance the production system.
This can be achieved through the use of traders association, formal or informal credit
sources and farmer’s organizations.
Another challenge is to overturn the culture of loan default which is predominant
amongst loan beneficiaries inhibiting the expansion in provision of seasonal credit
(Masambu et al., 2007).
2

1.2 Problem Statement and Justification
Cashewnut is among the major cash crops in Tanzania. However, market prices have
been reported to show downward trends which discourage smallholder farmers to
increase production (Fig.1 and 3). Among the factors contributing to this is poor
performance of the marketing channels for crops (Shoo, 1997; Lumbana, 2000;
Mitchell, 2004; CFC, 2006). In Mkuranga District, for example, cashewnut has been
the most important traditional and cash crop but the marketing systems for the crop
are poorly performing characterised by low producer prices.
Other constraints reported by other studies are low productivity of the crop, weak
institutional framework and lack of standards which are harmonized with
international markets (Jaffee, 1995; Mkude, 2003; CFC, 2006; Kaoneka, 2006).
These are attributed to the collapse of the former marketing system following the
trade liberalization policies. Moreover, the problem of mismanaged cooperatives has
caused farmers to sell their produce to different channels such as private traders.
Being accustomed to marketing through the regulated and much formalized
cooperatives and parastatal boards, for the majority of farmers, selling produce
through a network of buyers is a new phenomenon. Additionally, trade liberalization
policies have resulted in the entry of new actors such as cooperatives, farmers’ group,
financial institutions, Non Governmental Organizations (NGOs), government
agencies and private traders on the scene. To date not much is known about the
performance of the different participants in the marketing channel of cashewnut,
particularly in Mkuranga District.
3

Most of the studies done so far on agricultural marketing provide generalized
information related to the outputs and profit margins, a generalization which might
be erroneous. As recommended by Limbu (1993), cited by Gabagambi (1998) case
study analyses are essential for establishing specific areas for tackling agricultural
marketing problems and confers promising solutions.
This study analysed the performance of cashewnut production and marketing in
Mkuranga District, examining whether cooperatives and other buyers provide
adequate incentives to cashew farmers. The study also identified the major problems
affecting the cashew industry in the district.
1.3 Objectives of the Study
1.3.1 General objective
The main objective of this study was to analyse the performance of cashewnut
production and marketing systems in Mkuranga district.
1.3.2 Specific objectives
i. To analyse profitability of cashewnut and its competing farm enterprises.
ii. To identify the problems affecting cashewnut production and marketing.
iii. To determine factors influencing the performance of marketing systems for
cashewnut in the study area.
4

1.3.3 Research questions
i. What are the costs and benefits accrued by different actors in the marketing
channels for cashewnut?
ii. What are the problems in cashewnut production and marketing?
iii. What are the determinants of performance in the marketing channels for
cashewnut in the study area?
1.4 Organization of the Dissertation
This dissertation bn is organised into five chapters. The first chapter presents an
introduction to the study. The second chapter provides a review of the relevant
literature. Chapter three describes the theory and methodological frameworks of the
study. Chapter four presents the findings of the study and a discussion of the results.
Chapter five wind up the dissertation by presenting some concluding remarks and
policy recommendations.
5

CHAPTER TWO
2.0 LITERATURE REVIEW
2.1 The Agricultural Sector in Tanzania
The agricultural sector in Tanzania plays an important role in the economy of the
country and has high potential to advance the country’s objectives of economic
growth and poverty reduction. It contributes significantly in terms of aggregate
growth, exports, employment and linkages with other sectors. The sector still
contributes the most to the gross domestic product (GDP). However, the said
contribution has been fluctuating; for instance there was a decline from 48.9% and
48.2% in 1999 and 2000, respectively. It further declined to 48.1% and 47.5% in
2001 and 2002, respectively. Agricultural products contribute well over half of
Tanzania’s exports. Judging from the sector’s recent performance relative to growth
targets for effective poverty eradication the overall performance of the agricultural
sector is rather unimpressive. The overall agriculture GDP has grown at 3.3% per
year since 1985 where as the GPD for the six main food crops is growing at 3.5% per
year, and that of export crops have grown at 5.4% (MAFC, 2006). The same author
concluded that components like livestock (4.8%) and forestry recorded lower
performance. It implies that changes in productivity show a stagnant trend.
2.1.1 Agricultural sector policies
The current agricultural policy includes the liberalization of all agricultural markets
and removal of state monopolies and withdrawal of government from production
projects (URT, 1997). Others are the decentralization of agricultural extension and
transfer of administrative and implementation responsibility to district councils and
6

government’s continued responsibility for regulation (URT, 2001). These policies are
broadly entrenched as a guide to government activity in the agricultural sector but
they are not yet fully implemented and, thus, further action or cessation of action is
required to enable the beneficial impact to be fully realized by farmers at the micro-
level.
2.2 The World Cashew Economy
According to CFC (2006) cashewnuts is the largest single export item for the Least
Developed Countries (LDCs), having accounted for 53% of the total LDC exports of
fresh and dried fruit and nut in value over the last five years. Other exports consisted
of fresh and dried tropical fruits: melons, papaya, pineapples, avocado, guava and
mangoes (30% of LDC exports), fresh and dried grapes 7%, other fresh and dried
temperate fruits 5%, banana 4% and citrus fruits 1%.
India is the world’s leading exporter of cashewnuts. Its shipments account for 65%
and consist of both local cashewnut and raw imported products mostly from African
countries and Vietnam (CFC, 2006). Among the LDCs, Tanzania is the biggest
cashewnut producing country representing 11% of the world’s exports. Its main
export destinations are India, China and Singapore. Other major African exporters of
cashewnuts supplying the Indian processors are Guinea Bissau, Nigeria, Cote
d’Ivoire and Benin in West Africa, as well as Kenya, Mozambique and Madagascar
in East Africa. Kaoneka (2006) reported that the largest decline in LDC cashewnut
production and export of edible nuts in 2001/02 season (Fig. 1) resulted from severe
drought in Tanzania.
7

2.3 Cashewnut Production in Tanzania
In terms of global production Tanzania ranks fourth after India, Nigeria and Brazil
URT, 2006). Over the last decade Tanzanian cashewnut production has shown
considerable fluctuation (Fig.1).
Figure 1: Cashewnut production trend in Tanzania from 1997/98 - 2007/08
(Source: CBT, 2008)
In the last eleven years, overall production was highest in 2000/01 season whereby
121 379 metric tons (Mt) were produced and lowest was 64 441Mt in 2001/02. There
was also increase in production for the year 2002/03 season (82 064 Mt). In 2003/04
were 76 770Mt and decreased to 66 708Mt in 2005/06. Also, production increased to
69 259 Mt and 75 887 Mt in 2006/07 and 2007/08 respectively (Fig. 1). The average
production over the 11-year period was 86 219 Mt.
8

Various factors are responsible for the decline in cashewnut production. Shomari
(1990) indicates that villagilization policy of Tanzanian government in the 1970s
which moved people from their original settlements to communal villages
contributed to some extent to the decline in cashewnut production, since most farms
were left unattended when the villagers moved to new settlements. However, Sijaona
(2002) reports that low yields in the 1980s were associated with factors such as poor
crop husbandry, pests and diseases and low producer prices, which discouraged many
farmers from investing in cashew cultivation.
In the early 1990s, trade liberalization policies, combined with improved crop
husbandry, improved tree stock and more investment in research activities resulted in
an improvement in both cashewnut production and the cashew industry (MDB,
1992). Currently, small scale farmers are the majority of cashewnut production in
Tanzania, in mono-or mixed production systems (Topper et al., 1998). The
government is actively supporting farmers in upgrading their current farming
systems and practices in order to improve the condition of the trees and maximize the
agronomic potential. Current yields are about 5kg per tree, but under optimum
conditions, yields of 25 kg per tree can be realised (Poulton, 1998).
2.3.1 Cashewnut production in the Coast region
According to the Regional Commissioner’s office (2008) total production in the
region increased steadily to 9 638.6 Mt and 12172 Mt in the 2002/03 and 2003/04
seasons, respectively, and then dropped in the 2004/05 season to 10 563 Mt. In
2005/06, 13 829 Mt were produced, which decreased to 6 623.5 Mt in 2006/07.
9

2.3.2 Cashewnut production trends in Mkuranga District
The economy of the district depends on agriculture, mainly production of
cashewnuts. About 80% of income generated in the district comes from cashewnut
production. Records available in the office of District Agricultural and Livestock
Development Officer (DALDO) showed that production of cashewnut increased
from 5396 Mt in 2002/03 to 8100 Mt in 2003/04 season following availability of
sulphur powder that was sold at an affordable price. However, production dropped in
the 2004/05 season to 5400 Mt due to excessive rainfall. The said production
increased in the 2005/06 and 2007/08 seasons to 6064 Mt and 8000 Mt, respectively.
2.4 Farmers Incentives for Crop Production
Like several other cash crops, production of cashewnuts is influenced by various
internal and external factors. However, most of these factors are external, including:
market price of the product, climatic conditions; competition amongst the local
buying agents; quality; disease; pests and fire outbreaks.
Price plays a major role in determining production of cashewnuts. Higher prices act
as an incentive to farmers and vice versa (Jones and Muthuura, 1989). As far as the
climatic conditions are concerned, the better the weather during the flowering season,
the better the harvest. When there is deficit in rainfall or sunshine, the quality of
cashewnuts is lowered. Local buying agents play a vital role in the cashewnut supply
chain in Tanzania, and there is the tendency for production to increase whenever
there are many agents trying to secure supplies (Rweyemamu, 2002). The agents
penetrate in the villages’ production areas and become source of supplies.
10

Competition, especially when export prices are attractive, tends to develop between
established buyers and local firms (Chachage and Nyoni, 2001). Pests and diseases
lower production and harvest. Bush burnings, occur especially during the dry season,
and coincide with the harvesting season. Whenever such fire outbreaks do occur,
cashew farms are affected (Mkude, 2003).
2.5 Utilization of Cashewnut Products
Cashewnuts production is one of several livelihood strategies that smallholders
employ to meet their economic and social needs in a changing socio economic and
demographic environment (Behrens, 1996). Livelihood strategies can be defined as
the range of activities adopted and choices made by smallholders in pursuit of
household economic and social security (Mitchell, 2004). Shoo (1997) and WB
(2000) pointed out that due to its unique physical and chemical properties,
cashewnuts is used in numerous food products such as roasted and salted nuts, ice
creams, cakes, chocolates and appetizer to cocktail drinks. Apart from being a source
of useful products for food, medicine and by products applications, cashew trees give
a useful shade, while ornamental and alley trees are suitable for the control of soil
erosion, particularly for the protection of water shades and dams.
Cashewnut is rich in minerals like calcium, phosphorus and iron (Nayar, 1998). It has
a very low content of carbohydrates, as low as 1% of soluble sugar hence does not
add to obesity and helps control diabetes. It is an excellent nerve tonic, a steady
stimulant and a body builder.
11

2.6 Agricultural Marketing Node and Inter Sectoral Linkages
A marketing node is defined as any point in the marketing chain where an exchange
and/or transformation of agricultural commodities take place (Mwalili, 2008). There
are many areas to which agricultural production and marketing activities are inter
linked. Among these areas include market institutions, agricultural input availability,
price of agricultural products and agricultural marketing.
Torero and Gulati (2004) reports that market institutions play five roles in
strengthening markets for commodities produced, bought and sold by small scale
farmers, the said roles are: reducing transaction costs; managing risks; building
social capital; enabling collective action and redressing missing markets. Market
institutions include research and extension services, Agricultural marketing
cooperatives (AMCOs), Agricultural finance and credit, market information, Physical
infrastructures, grades and standards (Akiyama et al., 2001).
2.6.1 Research and extension services
Extension and research provide farmers with knowledge and skills important for
production and marketing of agricultural commodities (Mole, 2000). For example in
Tanzania, the provision of these services is fixed in the agricultural extension system
whereby the costs of such services mostly are paid by Government (URT, 2001).
Following market liberalization in the mid 1980s, the private sector has been
increasingly participating in the provision of extension services. Such services are
use and sale of agricultural inputs and marketing of cash crops like tobacco, coffee,
cotton and cashewnuts (Shepherd, 2004). However, to the most of farmers
12

availability and access to extension services are rather difficult after the said market
liberalization, for the majority of these farmers do lack capital to pay for the services
provided by the private sector (Wangwe and Lwakatare, 2004).
In view of the resource constraints faced by most farmers in rural areas, attractive
production options are largely seen as those that enable them to use their land, labour
and capital in a better way (Duncan and Jones, 1993). Agricultural research and
extension services have a central role in facilitating this through the development of
appropriate production recommendations and the transfer of new technology to
farmers (Mole, 2000). For instance, improved agriculture depends heavily on the
input of research through development of higher yield potentials of crops/livestock
which can provide high return to producers (Ehirim, 2004).
2.6.2 Agricultural marketing cooperatives (AMCOs)
Cooperatives as one of the marketing agents are of great importance to smallholder
producers in articulating farmers’ need and promoting collective actions on
overcoming problems in commodity and capital markets (Msuya, 2003). In addition
to this, cooperatives also play a major role in facilitating job creation, economic
growth and social development (MDB, 1992). Ranging from small scale to multi-
million dollar businesses across the world, cooperatives are estimated to employ
more than 100 million both women and men, and have more than 800 million
individual members. According to Gregory (1995), cooperatives mainly operate in
agricultural marketing and supply, finance, wholesale and retailing, health care and
insurance.
13

In view of cashewnut marketing, Lumbana (2000) suggests that development of local
cashewnut market place, and/or improving farmer bargaining power through group
selling actions, as well as market awareness activities, as opposed to each farmer
‘’selling in the store’’, could provide incentives to on-farm storage and the
development of larger markets with economies of scale. Golleti and Babu (1995)
reported that cooperatives would help to prevent a few resourceful and ‘’monopoly
like’’, trader groups or individuals from trying to act together to pay lower prices to
uninformed farmers.
2.6.3 Agricultural finance and credit availability
Finance is defined as monetary support for an enterprise, whilst credit is defined as a
transaction between two parties in which one (the creditor or lender) supplies money,
goods, services or securities in return for promised future payment by the other (the
debtor or borrower). Such transactions normally include payment of interest to the
lender (Sacedorti, 2005). Existing literature shows that credit plays a vital role in
reactivation, expansion and enhancement of modernization of trade. Small and micro
enterprises require assistance for start up capital, capital for leasehold and working
capital (Vicent, 2005).
Generally, there are three sources of credit/finance to agricultural enterprises
categorized as formal (commercial banks), semi formal such as Micro finance
institutions e.g. Promotion of Rural Initiative Development (PRIDE) Tanzania, Small
Enterprise Development Association (SEDA), Foundation for International
Community Assistance (FINCA), Non Governmental Organizations (NGOs), and
14

Cooperatives, and informal sources which are mutual support group, and individuals
(Ledgerwood, 2002).
According to Onumah (2002) the basic reason in providing credit to producers is that
most of smallholder producers lack assets (movable and fixed) and that they have
low capital which restrains their ability to use capital intensive technologies in
agricultural production. Gabrekidan (2006) noted that agricultural credit removes
financial compels, which confront the small rural farmers. It provides an incentive
for the farmers to purchase and adopt improved technologies which will increase
levels of public and private sector investment at all levels of agricultural activities,
including primary production, marketing, input supply and processing.
Lending to agriculture by Banks and financial institutions has dramatically declined
following economic liberalization both in scope and outreach (Masambu et al.,
2007). Furthermore, most small farmers and other rural entrepreneurs experience
great difficulty in accessing urban based Banks due to their dispersed location and
general poor rural infrastructure. Philip (2001) reports that the problems of financing
agricultural production and marketing are associated with the nature of the
development of financial markets and biases in credit allocation that favours more
urban dwellers.
According to IFAD (2001) it is evident that most of rural producers could manage to
borrow from formal credit sources, but that they prefer to use informal sources of
finance due to lower transaction costs compared to formal sources. For example
15

Masambu et al. (2007) show that the use of formal credit is rare at peasant farm
level. On average less than one percent of the total formal credit goes to peasant
farmers. A follow up survey conducted in 2002 indicated that only between 6%-8%
of the total rural credit demands were met by existing formal financial sources IFAD
(2002), cited by Brown (2007). Moshi (2003) indicates that due to inadequate access
to formal financial services, agricultural traders, processors and producers have been
relying on informal /and or semi formal financial sources. Experience has shown that
institutional weaknesses in developing countries, coupled with a failure of
governments to provide an appropriate legal environment, has led the banking sector
to move out of agricultural finance. These shortcomings must be addressed.
2.6.4 Market information
Market information is crucial to producers, wholesalers and consumers to help them
make decisions on what and whether to buy and sell. In general, information is
required on prices, traded or available quantities, forecasts of future supplies and
demand, and general market conditions (LEISA, 2007). According to Ramatu et al.
(2000) information must be relevant, accurate and timely and reflecting all sectors of
the market, especially consumer demand. Such information can be used by traders to
shift to those goods having high consumer demand (Kaoneka, 2006). Mukhebi
(2004) reported that an effective market information system reduces risks to traders,
eventually reducing market margins.
16

2.6.5 Market infrastructure
A well-developed and maintained rural infrastructure is essential for agricultural
growth and overall rural development. Investments in rural roads, transportation,
storage, rural markets, communication and stock auction markets are critical to
stimulating increased agricultural production (URT, 2001). Furthermore, roads
occupy a pivotal position in the integration of markets and the national economy
(Rates, 2003). Poor rural roads limit farmers’ access to markets for inputs and
produce. They also increase cost of the transporting inputs and output, reducing the
net income of farmers, suppliers and traders (Orr, 1999).
2.6.6 Grades and standards
Uniform measurements are established and maintained. These measurements could
be in terms of quality or quantity (Mwalili, 2008). For example, standardization of
cashewnuts may be based on weight per bag, percent of damaged kernels, moisture
contents, and percent of foreign material. Other bases of standards are used
depending on type of good, e.g. fat content, size, and colour (MAFC, 2006).
2.6.7 Availability of agricultural inputs
Eric and Christopher (2003) noted that liberalization of agricultural marketing
ensures greater efficiency. Hence producers can expect to get timely and adequate
supply of agricultural inputs, and receive the payment for the sales of the
commodities on time. Rweyemamu (2002) indicated that after implementation of the
Economic Recovery Program the increase in farm inputs prices became higher
17
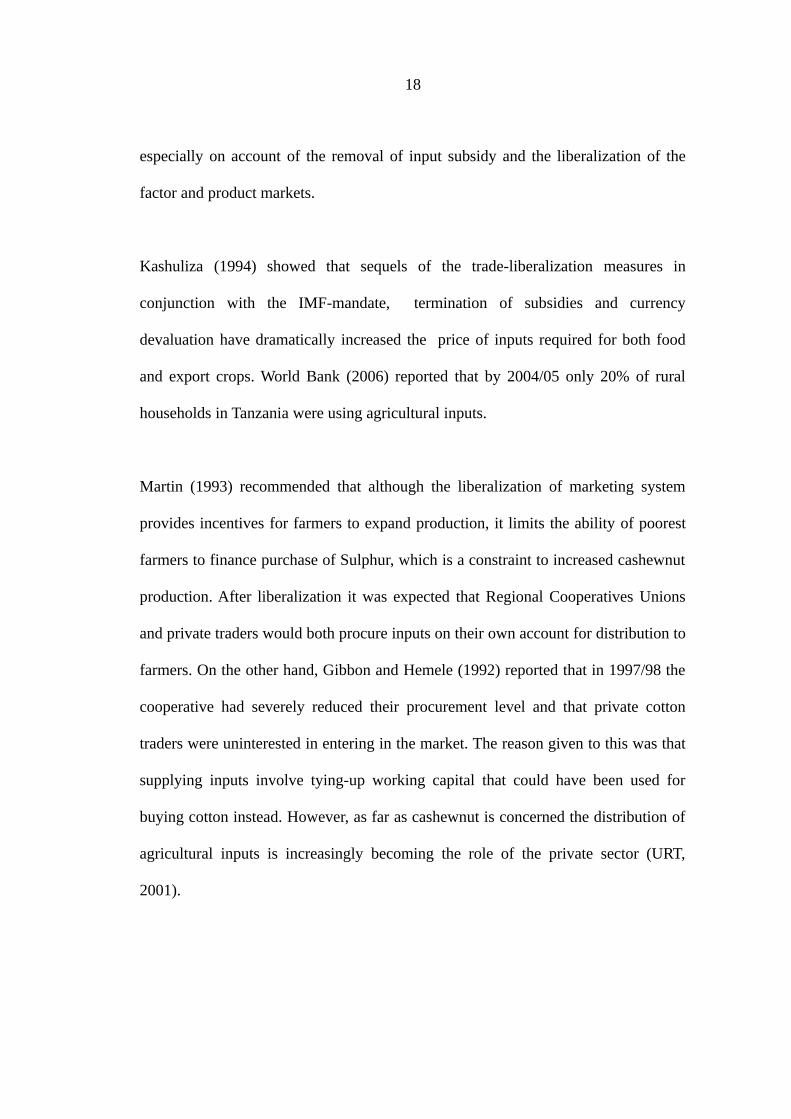
especially on account of the removal of input subsidy and the liberalization of the
factor and product markets.
Kashuliza (1994) showed that sequels of the trade-liberalization measures in
conjunction with the IMF-mandate, termination of subsidies and currency
devaluation have dramatically increased the price of inputs required for both food
and export crops. World Bank (2006) reported that by 2004/05 only 20% of rural
households in Tanzania were using agricultural inputs.
Martin (1993) recommended that although the liberalization of marketing system
provides incentives for farmers to expand production, it limits the ability of poorest
farmers to finance purchase of Sulphur, which is a constraint to increased cashewnut
production. After liberalization it was expected that Regional Cooperatives Unions
and private traders would both procure inputs on their own account for distribution to
farmers. On the other hand, Gibbon and Hemele (1992) reported that in 1997/98 the
cooperative had severely reduced their procurement level and that private cotton
traders were uninterested in entering in the market. The reason given to this was that
supplying inputs involve tying-up working capital that could have been used for
buying cotton instead. However, as far as cashewnut is concerned the distribution of
agricultural inputs is increasingly becoming the role of the private sector (URT,
2001).
18

2.6.8 Prices of agricultural products
Producer prices are among the most important and effective tools for influencing
agricultural production (Eric and Christopher, 2003). Chachage and Nyoni (2001)
argued that the decrease in cashewnut production in Mtwara and Lindi regions in the
1970s was due to a fall in price of the crop, in favour of food crops which were
progressively being produced in large quantities in these regions. Poulton (1998)
argued that although there has been an increase in nominal producer prices for a
number of crops, following market liberalization, devaluation and persisted inflation
have more than wiped out the gains. He further argued that producer prices have
fallen both in absolute term and as a percentage of the Free on Board (FoB) price.
According to Banda (1995), farmers are unable to negotiate price with traders who
come to their villages. They only decide whether or not to sell at the price provided
and have to reach this decision without knowing FOB price or traders marketing
costs. Furthermore, Katinila et al. (1995) found that each buyer had a different price
in different districts. Sometimes within the same district, buyers purchase cashewnuts
using different prices. The difference in prices of cashewnut may be due to
accessibility of the village by buyers, cashewnut quality, and the intensity of
competition in the respective village.
2.6.9 Marketing of agricultural commodities
Since the adoption of the new economic reform in 1990s, Sub-Saharan Africa (SSA)
agricultural markets have been reformed and prices of commodities are determined
through market mechanisms (Onumah, 2002). However, due to the weak bargaining
power of producers, and harvest fluctuations, the price free notion of markets has
19

been found to affect small holder farmers (LEISA, 2007). Agricultural product
markets for instance in Tanzania are mainly characterized by seasonal supply and
shortages which in turn affect the marketing behaviour of rural farmers, traders and
consumers (URT, 2007).
Rates (2003) revealed that firms, individual traders and cooperatives in Tanzania
perform marketing functions such as collecting, transporting, processing, retailing
and exporting of agricultural products. It was further noted by Colander (2004) that
market can potentially contribute to development of crops or any other commodities
in two ways. First, it can provide a way to allocate resources ensuring the highest
value of production, and secondly, it can stimulate growth by promoting
technological innovation.
Msuya (2003) showed that marketing of produce has direct relationship with the
farmer’s income. He furthermore noted that timely marketing and finding the right
buyers who pay at the right time is important in the whole cycle of farming. On the
other hand Gabagambi (1998), cited by Silomba (2000) concluded that there should
therefore be no doubt that the creation of a prosperous and equitable agricultural
sector depends on the efficiency of agricultural commodities marketing. This is
supported by Massawe (2007) who reports that the lack of agricultural marketing
makes rural people to be food insecure even if food production at a particular time is
satisfactory.
20

2.7 The Cashewnuts Marketing in Tanzania
2.7.1 Cashewnuts marketing: historical perspectives
In Tanzania, single channel marketing for the cashew crop through the government
was practiced in the 1960s and 1970s. This was undertaken by the Tanzanian
National Agricultural Products Board, later reconstituted as the Cashewnut Authority
of Tanzania (CATA) in 1973, and eventually replaced by the Tanzanian Cashewnut
Marketing Board (TCMB) in 1985. Cooperative Unions collected cashewnuts from
primary societies for sale to CATA/ TCMB (Jaffee, 1995). Chachage and Nyoni
(1992) showed that liberalization started in early 1990s where TCMB was
transformed into the Cashewnut Board of Tanzania (CBT) with highly restricted
functions. These included licensing, provision of market information, regulation and
promotion of the quality, marketing and export of raw and processed cashewnuts and
strategic planning on cashewnuts. Private companies were allowed to enter into crop
marketing. An enormous upsurge of competition between the cooperative unions and
private traders in cashewnut marketing ensured, leading to an improved price regime
for cashewnut producers.
2.7.2 Marketing channels for cashewnuts
Marketing channels facilitate the flow of cashewnuts from producers to consumers
(Abbott and Makeham, 1990). A variety of well established, although informal,
marketing channels exist in Tanzania for distribution and sale of cashewnuts in both
the domestic and export markets (DAIPESA, 2003). Apart from the growers, the
participants in cashewnut activities are the assembly traders, commission agents,
regional traders, exporters, wholesalers, and retailers (Fig. 2). In this case
21

government agencies play a supportive role, such as collecting and publicizing
market information, issuing licenses to traders, and generally regulating fair trading
practices (Mitchell, 2004). In his study on the improvement of the price of cashewnut
in Mkuranga District, Kaoneka (2006) reports that cashewnuts are being bought at all
sorts of posts including the primary societies offices, village godowns, shops and in
farmers’ residences. In terms of the spatial distribution of these places, the southern
cashew growing areas (namely Lindi and Mtwara) use more of the formal selling
places while the northern areas (e.g. Tanga and Coast region) use more informal
cashewnut selling places.
According to CFC (2006) it is envisaged that the number and size of buyers also vary
widely. However, many of them are small in size. Lumbana (2000) shows that in
1996/97 and 1997/98, nineteen companies were involved in exporting cashewnut and
the five biggest companies exported 63% of the crop. After bulking, cashewnuts are
transported to main processing or export points after specifications regarding name
of buying post, produce destination, lot size, grade and buying price have been
specified in a Produce Dispatch Note (PDN) issued by the CBT. The cashewnuts are
either exported raw to India or processed locally. Most (90%) of cashewnuts
produced in Tanzania are exported raw mainly to India (CBT, 2007).
22
Exports
(raw nuts)
Exports
(kernels)
Local
consumers
Exports
(raw nuts)
Local
consumer
Export
(kernels)
Figure 2: Marketing channels for cashewnuts in Tanzania
Source: CFC (2006)
According to CFC (2006) it is envisaged that the number and size of buyers also vary
widely. However, many of them are small in size. Lumbana (2000) indicates that in
1996/97 and 1997/98, nineteen companies were involved in exporting cashewnut and
the five biggest companies exported 63% of the crop. After bulking, cashewnuts are
transported to main processing or export points after specifications regarding name
of buying post, produce destination, lot size, grade and buying price have been
specified in a Produce Dispatch Note (PDN) issued by the CBT. The cashewnuts are
Producers/Farmers
Village traders Cooperativesociety
Village trader
Buying company’sstaff/trucks Buying agent
Experienced company
Local processor
Less experiencedcompany
Local processor
RetailersRetailer
23

either exported raw to India or processed locally. Most (90%) of cashewnuts
produced in Tanzania are exported raw mainly to India (CBT, 2007).
2.7.3 Cashewnuts marketing performance
The producer’s price is a function of many considerations and influences, the most
important of which are production cost structures, the international cashewnut supply
and demand dynamics, the domestic market situations, the effectiveness of regulation
mechanism and the tax structure on the agricultural sector (Sijaona, 2002). Average
producer prices for raw cashewnut in Tanzania have been increasing since
1990/1993, after liberalization of cashewnut marketing. However, comparatively the
average Producer price offered to farmer is not increasing in the same proportional as
the export price rate (Kaoneka, 2006). It can be noted that the average producer price
of cashewnut increased substantially in 1994/95 after liberalization of the agricultural
marketing system. The price continued to improve steadily and reached a record
level of Tshs 600 (US$ 0.67) per kg in 1999/2000 (Fig. 3). However, the producer
price fell drastically in the following market season (2000/01) due to decline in the
world market prices of kernels caused by over supply of cashewnuts (Katinila et al.,
2001). From 2002/03 to 2006/07 season, the price was increasing at the positive
trend, with the export price at a greater magnitude than producer price.
24
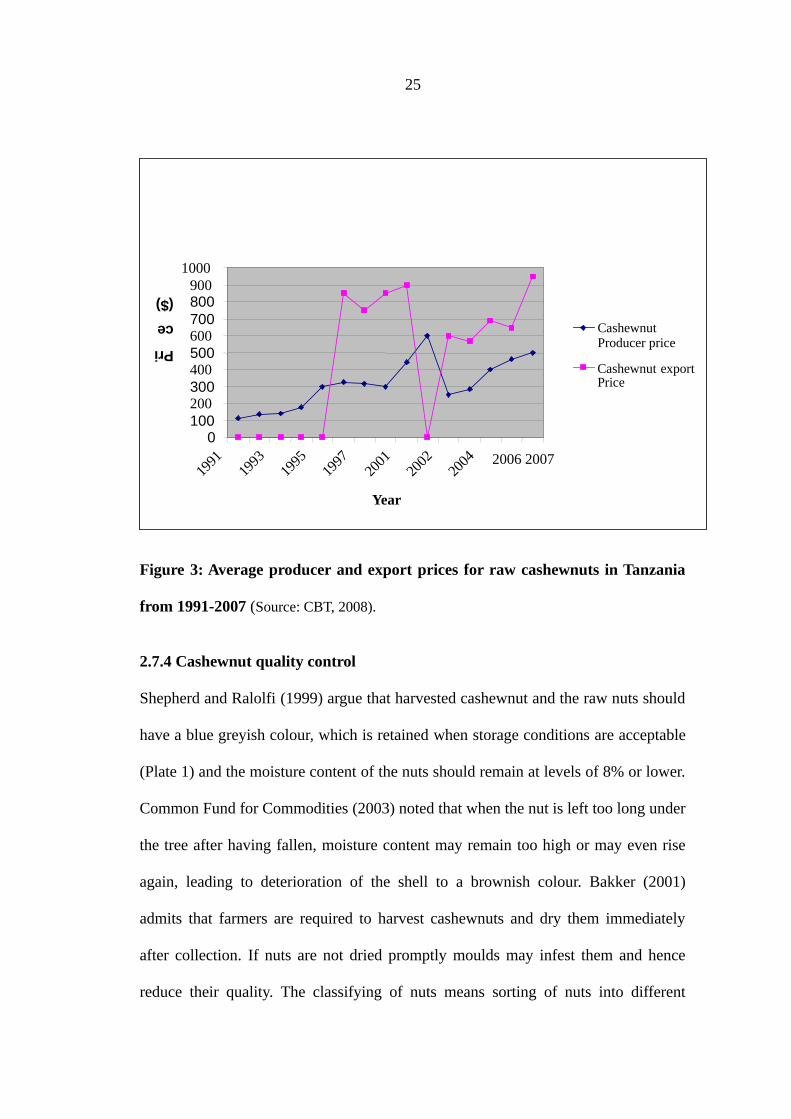
Figure 3: Average producer and export prices for raw cashewnuts in Tanzania
from 1991-2007 (Source: CBT, 2008).
2.7.4 Cashewnut quality control
Shepherd and Ralolfi (1999) argue that harvested cashewnut and the raw nuts should
have a blue greyish colour, which is retained when storage conditions are acceptable
(Plate 1) and the moisture content of the nuts should remain at levels of 8% or lower.
Common Fund for Commodities (2003) noted that when the nut is left too long under
the tree after having fallen, moisture content may remain too high or may even rise
again, leading to deterioration of the shell to a brownish colour. Bakker (2001)
admits that farmers are required to harvest cashewnuts and dry them immediately
after collection. If nuts are not dried promptly moulds may infest them and hence
reduce their quality. The classifying of nuts means sorting of nuts into different
0100200300400500600700800900
1000
1991
1993
1995
1997
2001
2002
2004
Year
CashewnutProducer price
Cashewnut exportPrice
Pri
ce
($)
2006 2007
25

qualities, the purpose is to increase the total revenue, on a level that the add value
and earn extra revenue that exceed the extra costs (usually labour costs) necessary to
create that added value.
However, grading cashewnuts using the old system (i.e. on the basis of colour and
size) is no longer practical because of the presence of Powdery Mildew Disease
(PMD) and pests (which discolour the nuts) and (because of) the existence of large
white nuts with under grade kernels (CFC, 2006). Instead, at present the new way of
cutting and testing is preferred, whereby kernels are cut and graded by considering
physical integrity of the product such as percentage of broken pieces (Plate 2).
Plate 1: Good quality cashewnuts
Plate 2: Whole cashewnuts and pieces
26

2.7.5 Processing of raw cashewnuts
The processing of cashewnut involves many steps including cleaning and grading,
humidifying, roasting, shelling, drying, peeling off the testa, sorting of whole and
broken kernels (Plate 2) and grading into the international standards, based on size
and colour (URT, 2006). According to Porto (2005), the exportation of raw nuts
supports developments elsewhere rather than in the area of production. This is
because cashewnut is one of the crops with high price in the world market, but that
producers are earning little from the sale of their produce.
Rweyemamu (2002) admits that although several cashewnuts factories were built in
the southern regions, large amounts of unprocessed cashewnuts are shipped from the
Mtwara port to India every year. Mwalili (2008) added that the continuation of
unprocessed export of cashewnuts, mainly to India, can be seen as an unsatisfactory
development for a number of reasons. Firstly, there is a loss of added value in
relation to employment opportunities and the up and down streams of effects that
would result from local processing. Secondly, there is a possible loss of profit as
processed commodities fetch premium price compared to unprocessed goods.
2.7.6 Pricing mechanisms for cashewnuts
Normally the indicative price for the cashewnut is the prevailing price of the same
crop at the world market (CBT, 2007). As it is the case with all other traded products,
market forces, i.e. demand and supply forces, determine the magnitude of fall and /or
rise in the price of cashewnut. In Tanzania pricing is done based on unprocessed
cashewnut, which is contrary to pricing at the world market where at it is based on
27

processed cashewnuts (URT, 2001). This is because raw cashewnut is traded both
domestically and in the export market. The estimation of producer price is done at
the domestic market to get the equivalent price. The indicative price is announced by
the Cashewnuts Board of Tanzania (CBT) just before the beginning of the cashewnut
marketing season, which officially begins on 1st October, of each year.
Usually the indicative price is announced after a stakeholders’ meeting involving the
CBT management, officials from the Ministry of Agriculture, Food and
Cooperatives, managers of existing co operative societies in the districts where
cashewnut is grown, District Executive Directors (DEDs) from the districts where
cashewnut is grown, officials from the Board of External Trade (BET), District
Agricultural Development and Livestock Officers from the districts where cashew is
grown, companies dealing with cashewnut business, and cashewnut farmer’s
organizations. In determining the indicative price the farmer’s production costs (e.g.
input cost, labour) and buyer costs (e.g. transaction costs, administrative costs, levy,
and shipment) are computed. The indicative price is set for the cashewnut standard
grade. The price for one kilogram of under grade cashewnut is obtained by
calculating 80% of the standard grade, the indicative price is announced by the CBT,
through Government media (radio, newspapers, and Television) (CBT, 2008).
2.7.6 Cashewnut marketing costs
It has been reported by Mitchell (2004) that there are several costs which are
involved in the cashewnut marketing chain in Tanzania. At farm level, the costs
involved are those of production including labour charges, input costs, and storage.
28
All these are incurred within the farm. According to Banda (1995) for FoB price, all
the costs involved from the farm gate to the point of export are included; among
them is transport from the farm gate to the first point of sale (28.5%), levy paid to the
government (8.5%), handling costs (20.7%), marketing costs (18%), and adjustment
for currency overvaluation (6.3%) and shipping costs (18%).
2.7.7 Cashewnuts marketing margins
The marketing margins for cashewnut measure the share of the final cashew selling
price that is captured by a particular agent in the marketing channel; including costs
and, sometimes, additional net incomes (Kikoka et al., 1997; Alli and Lashari, 2001).
Variability of cashewnut prices in Tanzania is higher at the farm gate level than at the
wholesale and retail levels. Meanwhile, the variation in gross marketing margin is
higher than that of cashewnut prices at the farm, wholesale, and retail levels
(Chachage and Nyoni, 2001). This implies that, traders face as much or more
uncertainty in profit margins as farmers. Alli and Lashari (2001) note that the
assessment on whether the pricing mechanisms are fair or not can be done by looking
into the distribution of returns to different participants in the marketing chain
compared to the costs they incur in the marketing process.
2.8 Review of Analytical Techniques
2.8.1 Gross margin analysis
Gross margin (GM) is an analytical method that has been widely used in estimating
economic profitability of farm productivity in different locations. Johnsen (2003)
29

defines gross margin as the difference between total revenue and total cost of
production.
Gross margin is a good measure for comparing the economic and productive
efficiency of similar-sized farms. More importantly, it represents the minimum break
even price that a farm must generate to stay in business. Even if a farm was to lose
money, a positive gross margin would enable it to continue to operate, at least in the
short run. But it is not a good measure of a farm’s true profitability or a farm’s long-
term viability (CTAHR, 1998). Its main advantage is that it does not involve tedious
calculations and is within the comprehension of any farmer. It is also more flexible in
accommodating personal expectation and limitation of the given condition (Ehirim,
2004).
It is worth noting that due to limited resources rational farmers tend to allocates their
resources more to those enterprises that have more economic benefits. It was useful
to compare the gross margin of cashewnut to other competing crops particularly
maize, cassava and coconut in the study area, in order to establish the relative
economic profitability of cashewnuts and its competing farm enterprises. Producers
tend to allocate more resources to enterprises giving higher returns per unit of
resource used. Thus more returns guarantee future production of a particular crop as
transferable resources are switched from low paying enterprises to the higher paying
ones.
30

2.8.1.1 Limitations of the gross margin (GM) analysis
According to Ferris and Malcolm (2000), the GM analysis has the following major
limitations:
i. GM is not a profit figure. Fixed costs have to be covered by the GM before
arriving at a profit figure,
ii. GM can vary widely from one year to another year. This is due to differences
in market price, supply conditions affected by weather conditions and
efficiencies.
However, Phiri (1991) argue that although gross margin is not a good measure of
profitability, it remains the most effective measure of resources use efficiency in
small scale farming.
2.8.2 Determinants of net profit
Various factors could be responsible for observed net profit in cashewnut marketing.
Eze (2007) asserts that net profit may arise from socio-economic factors, like buying
prices, selling prices, marketing costs, experience in business, age and education
level of the trader. In this study, the estimated net profit was related to different
predictors using data from cashewnut traders. Gujarati (1995) reported that the
parameters are estimated to give a "best fit" of the data. Further, he argued that most
commonly the best fit is evaluated by using the ordinary least squares (OLS) method.
A regression analysis can be used for prediction, making inference, and modelling of
causal relationships. These uses of regression rely heavily on the underlying
31

assumptions. According to Gujarati (1995), the classical assumptions for regression
analysis, among others, include:
i. The sample is representative of the population for the inference prediction,
ii. The error is a random variable with a mean of zero conditional on the
explanatory variables,
iii. The predictors are linearly independent, and
iv. The variance of the error is constant across observations (homoscedasticity).
In this study, a linear regression model was adopted to determine the factors that
influence net profit margins in the study area.
2.8.2.1 Limitations of using OLS estimation procedure
Mukras (1993) observed three limitations of OLS in estimation models:
i. Although parameter estimates for econometric models can be obtained by
OLS, they are generally biased,
ii. With non-linear models, variances of the parameter estimates can not be
obtained easily and estimates do not have well behaved statistical properties
that lend themselves to statistical theory,
iii. Testing of parameter is not possible because the sampling distributions of the
parameter estimates are in most cases unknown.
However, OLS estimation technique is simple to use, eloquent and gives the best
estimator and it does not require the knowledge of the probability distribution of
underlying population being studied. Of all estimation rules, ordinary square
32

estimation (OLSE) leads to best linear unbiased estimator and hence its popularity in
applied econometrics (Gujarati, 1995).
33

CHAPTER THREE
3.0 METHODOLOGY
3.1 Overview
This chapter explains the conceptual framework and methodological approach used
in this study. The chapter also presents a description of the study area, research
design, types and sources of data collected, the sampling procedures, sample size and
tools of data analysis used in the study.
3.2 Conceptual Framework of the Study
Fig. 4: describes the conceptual framework for this study. The framework is based on
the understanding that the main factor that determines the household’s cashewnut
production and marketing is the ability of the household to produce the crop. Access
to credit is also considered as an important factor which enables the producer to
purchase and use improved technologies like improved seed nuts, pesticides and
farm tools such as motorized blowers. Farmers may use many channels to sell their
produce, e.g. through cooperatives or private buyers using officially designated
purchasing stations.
34

Figure 4: Conceptual framework for the study
Farmers demand several farm inputs for cashewnut production, which are normally
supplied by both private and public sectors, these include seed, fertilizer, pesticide,
technology just to mention a few. While some factors are relatively well supplied
under market mechanisms, others have involved the government’s participation and
other supporting programs. Four main support services are needed in cashewnut
production; technology transfer, either from the Agricultural Extension Centre (AEC)
F
A
R
M
E
R
S
Supporting factorsTechnologies from Research institutes e.g. Naliendele, SUA, AEC, PPDMarket support e.g. Marketing information
Inputs
-Improved seed,
pesticides, fertilizers,
from cooperatives and
private traders.
-Financial inputs from
financial Institutions
e.g. Micro finance,
commercial banks
Outcomes
-Increased production
-Improved post harvesting
processing e.g.
Drying – Grading – packing
-Improved marketing channels in
selling Produces
e.g. Farmer – Purchasing stations
Government system
-Government agencies e.g. CBT. ITF
-Agricultural extension services
-Farmers association and purchasers
Improved income of household livelihood and,
reduce poverty
35

located at Ministry and District levels, Plant Protection Division (PPD) or directly
from the research institutions and universities like Sokoine University; credit support
for purchase of fertilizer and pesticide; input support e.g. in form of high yielding
varieties/seeds from the government; and other market supports such as provision of
market information for both local and international trades. Access to these support
services determine to a large extent the level of production and marketing
performance in the marketing channels of cashewnuts.
3.3 Description of the Study Area
3.3.1 Geographical location
Mkuranga district is one of the six districts in the Coast Region. The district is
located in the Coast Region between latitude 056 o and 337 o South of the equator
and between longitudes 538 o and 8239 o east of the meridian of Greenwich. It is
bordered in the north by the Dar es Salaam city, in the West by the Rufiji district and
in the East by the Indian Ocean. Other districts that make up the Coast region are
Bagamoyo, Kibaha, Kisarawe, Mafia and Rufiji (Mkuranga District Council, 2007).
3.3.2 Climate and vegetation
The climatic condition is conducive for human settlement and agriculture. The
Mkuranga district experiences dual rainfall, firstly the short rains (vuli) with effect
from September to December and, secondly the long rains (masika) from March to
June. Normally the long rains are more reliable and evenly distributed than the short
rains. Rainfall ranges from 800mm to 100mm. The average Temperature is Co28
per annum. There are different types of soils in the district, namely sandy and loamy
36
soils in Mkamba, Mkuranga and Kisiju divisions, and black clay soils in the
Shungubweni division. The vegetation found in the district includes the Coast forests
(mangroves), miombo woodland and swampy vegetation (Mkuranga District
Council, 2007).
3.3.3 Human population
Based on the census conducted in 2002, Mkuranga District has a population of 187
428 people of whom 91 714 are males and 95 714 are females. The number of
household are 42 937 having an average size of 4.4 people. Data from the population
census also indicates that the population density for Mkuranga District is 27 people
per km2 (Mkuranga District Council, 2007).
3.3.4 Agro-ecological zones
Geographically, the Mkuranga district has three distinct agro-ecological zones, which
are coastline zone, upland zone, and low-lying basins and valleys which are found in
both the coastline zone and upland area. The livelihoods of the people and the
economy of the district at large depend mainly agriculture. It is estimated that about
97% of the total households are engaged in agricultural production. Cultivated
perennial crops are cashewnuts, coconut and a variety of citrus fruits, pineapples,
mangoes, paw paws and watermelons. Food crops include cassava, paddy, maize,
sweet potatoes and legumes. The average farm size cultivated by small holder
farmers ranges from half an acre to two acres. There are no plantations/estates run by
commercial farmers. Therefore, the type and scale of agriculture in this district is
37

purely subsistence. About 80% of the income generated in the district is through
cashewnut production (Mkuranga District Council, 2007).
3.4 Study Design
The study used a non-experimental design whereby a cross-sectional survey was
employed during November and December 2008. This design was used on the basis
that it allows collection of data on different units of respondents at one point in time.
The design has greater degree of accuracy and precision in social science studies.
3.5 Sampling Techniques
3.5.1 Sample size
During the first stage sampling, the study employed a purposive sampling technique,
whereby one district of Mkuranga was selected because it is the major producer of
cashewnuts in the Coast region. A random sampling method was used to select
cashew producing wards in the district. The sample wards and their respective
villages in parentheses included the Mkuranga (Kiparang’anda A and Hoyoyo),
Mwarusembe (Bigwa and Kiziko), Kimanzichana (Kimanzichana and
Kiimbwanindi) as well as Tambani (Miseko and Mwanambaya). The sample villages
from each ward were also selected using the random sampling technique. In each
village a simple random sampling was used to select cashewnut farmers. The sample
traders and cooperative officials were selected using a purposive sampling technique.
These included, traders/exporters, rural collectors, rural agents and cooperative
officials. Table 1 shows the number and distribution of respondents by wards and
38

villages in the study area. A total of 148 respondents were selected for the study,
constituting 120 farmers, 24 traders and four officials of primary cooperatives.
Table 1: Distribution of respondents by wards and villages
Ward Village Respondents TotalFarmers Traders Cooperatives
Kimanzichana Kimanzichana 15 3 1 19Kiimbwanindi 15 3 - 18
Mkuranga Kiparang’anda 15 3 1 19Hoyoyo 15 3 - 18
Mwarusembe Bigwa 15 3 1 19Kiziko 15 3 - 18
Tambani Miseko 15 3 - 18Mwanambaya 15 3 1 19
Total 120 24 4 148
3.5.2 Types and sources of data
The types of data used in this study included both primary and secondary
information. The primary data were collected through informal and formal surveys.
Informal surveys were carried out to get in-depth understanding of issues related to
cashew cultivation. The formal surveys involved personal interviews using a pre-
tested questionnaire.
The questionnaire contained both open and closed ended questions (Appendix 1).
The questionnaire was designed to include both quantitative and qualitative data on
smallholder cashew growers and traders. It contained two main parts, with the first
part comprising of basic questions for household. These included the household
identification questions; farm activities; farm resources, inputs used; farm output and
marketing arrangements; farm related credit/loans; farmers’ organization and support
39

services received. The second part constituted questions to be administered to traders
and it was divided into four sections namely: traders’ basic information and trading
practices; marketing costs; traders’ access to credit/loans availability; and problems
that traders face.
3.5.3 Data collection
3.5.3.1 Primary data collection
Prior to the main survey a pre-testing was done in mid October 2008 in order to test
the validity of questionnaire during which a total number of ten households were
interviewed in Tambani and Kizapala villages. A preliminary survey was also used to
establish the sampling frame, determine the approximate time required in completing
a questionnaire, and conducting a situation analysis of the study area.
Primary data were collected using a questionnaire, interviews, observation, and focus
group discussion (FGD). The questionnaire was administered by the researcher, with
the help of village extension agents responsible for each village and two trained
enumerators.
3.5.3.2 Secondary data collection
Secondary data were collected from different sources including office records and
published reports/papers from District Council, Sokoine National Agriculture Library
(SNAL) and websites, reports from the Ministry of Agriculture, Food and Co-
operatives and Cashewnut Board of Tanzania (CBT) (Table 2).
40

Table 2: Type of information gathered from secondary sources
Source Information gatheredCBT, BoT Data on production, marketing, producer
prices, and export prices.
DALDO, RC –offices Description of the study area, data on
production and marketing trends in
Mkuranga district.
PCSs, ITF, Traders Marketing costs, inputs and data on
inputs and loan to farmers
Electronic General cashewnut information
3.6 Data Analysis
The collected data from the primary sources were verified, coded and analyzed using
the Statistical Package for Social Science (SPSS). The descriptive analysis was done
and the information was summarised using frequencies, percentages, means, standard
deviation, correlation and a regression model.
3.6.1 Gross margin analysis
The gross margin analysis was used to analyse profitability and the profit margins
were calculated by deducting variable costs from total or gross revenue. The
estimation of average variable costs for inputs like fertilizers, seeds/cuttings, labour
and transport was based on current prices. For all crops enterprises, gross margins
were calculated based on the formula below:
41

iii TVCTRGM (1)
Where: iGM = Gross margin of crop i Tshs per hectare
iTR = Total Revenue from sale of crop i Tshs per hectare
iTVC = Total variable cost Tshs per hectare for crop i
3.6.2 Correlation analysis
The correlation analysis was done to test to what extent marketing margin is
statistically associated with prices (i.e. buying and selling prices). It aimed at testing
as to whether or not price changes were passed to the other market level. This was
done by running simple regression model as given below:
(2)
Where; marketing margin in Tshs
= buying or sell prices in Tshs
degree to which buying and selling prices influence marketing margin of
a commodity at a given marketing level in Tshs
= an error term.
42

3.6.3 Regression analysis
A multiple linear regression analysis was used to assess the determinants of
profitability in cashewnut production and marketing. The following model was used:
iii (3)
Where: = dependent variable
i = degree to which predictor variables affect dependent variables at given
market level
i = independent variable
= constant
i = a random error term
Presenting the independent variables for the model in equation 3 above, the model
becomes:
(4)
Where: = profitability as measured from the net profit margin in Tshs
= constant
1 = buying price in Tshs
2 = selling price in Tshs
3 = transaction cost in Tshs
4 = experience of the trader in years
5 = education level of the trader in years
i 5544332211
43

1 5 = coefficients of predictors and
i = a random error term
Variables such as buying price and transport cost were expected to have negative
influence on net profit because they do increase the cost incurred by traders in
business and hence reduce profit. On the other hand, experience, selling price and
education of the traders may positively influence net profit because they can enhance
business diversification and ability to take business risks for better profit.
3.6.3.1 Problems of parameter estimation
Problems of parameter estimation often emanated from violation of the basic
assumptions of the linear regression model. The commonest problems encountered in
the regression analysis include multicollinearity, heteroscedasticity, and
autocorrelation. However the commonest problem in linear multiple regression
models is multicollinearity (Gujarati, 1995). Multicollinearity refers to a situation
where it becomes difficult to identify the separate effect of independent variables on
the dependent variable due to the existence of strong relationship among independent
variables. Thus, confluence analysis was used to identify the collinear variables (total
cashewnut traded in kg and buying price) by regressing the dependent variable on
each explanatory variable separately and keeping the useful and superfluous
variables while discarding the detrimental variable (total cashewnut traded in kg)
which affected considerably the sign or values of some coefficients.
44

CHAPTER FOUR
4.0 RESULTS AND DISCUSSION
4.1 Overview
This chapter presents results of analysis and discussion of the study findings. The
chapter is divided into seven sections. The first section presents socio-economic
characteristics of sample cashew growers. This is followed by a section of results and
discussion related to cashew production and marketing issues, the factors affecting
cashewnut marketing, farmers’ organization and support services, profitability of
cashewnut and other farm enterprises. Issues related to trading practices and
determinants of profitability are also discussed.
45

4.2 Socio-economic Characteristics of the Sample Households
The respondent’s gender, age, marital status, education level, household size and
occupation were used to describe the characteristics of sample households (Table 3).
4.2.1 Gender of the heads of households
The majority (83.3%) of sampled farmer’s households producing cashewnuts were
headed by males (Table 3). Only 16.7% were female headed households.
4.2.2 Age of the heads of households
The distribution of the age of head of households is presented in Table 3. The
majority (52.5%) of household age had the age between 19 and 50 years, implying
that majority of household head were within the active working age group.
Table 3: Socio-economic characteristics of the sample households
Variable Frequency PercentAge distribution:Above 50 years 51 42.519-50 years 63 52.515-18 years 5 4.210-14 Years 1 0.8Total 120 100.0Education level:Primary education 65 54Non formal education 25 20.8Adult education 21 17.5Secondary education 9 7.5Total 120 100.0Gender of respondent:Male 100 83.3Female 20 16.7Total 120 100.0Marital status:Married 97 80.8
46

Single 10 8.3Divorce 5 4.2Separated 2 1.7Widow 6 5.0Total 120 100.0Employment status:Farming 88 73.3Employees 8 6.7Own business 6 5.0Others 18 15.0Total 120 100.0Household size:1-3 29 15.84-7 86 71.7>7 5 2.5Total 120 100.0
4.2.3 Marital status of heads of households
It was also observed that the majority of household heads (80.8%) were married
(Table 3). This implies that married individuals have family obligations, they engage
in cashewnut farming activities in order to generate cash income to meet various
family needs and requirements.
4.2.4 Size of household
The survey result indicates that the majority (71.7%) of households have family size
ranging from 4 to 7 members (Table 3). The average family size was 8 people. The
reason for higher household size could be that, most of males in the study area marry
more than one wife and thus have more children per average household.
4.2.5 Education level of the heads of households
Table 3 shows that the majority of households head have attained a primary level of
education and could read and write, with exceptional of only 20.8% who reported not
to have attained any formal education. Roughly it shows that the formal education
attained by the majority of farmers 61.7% could be explained by the adoption of
47
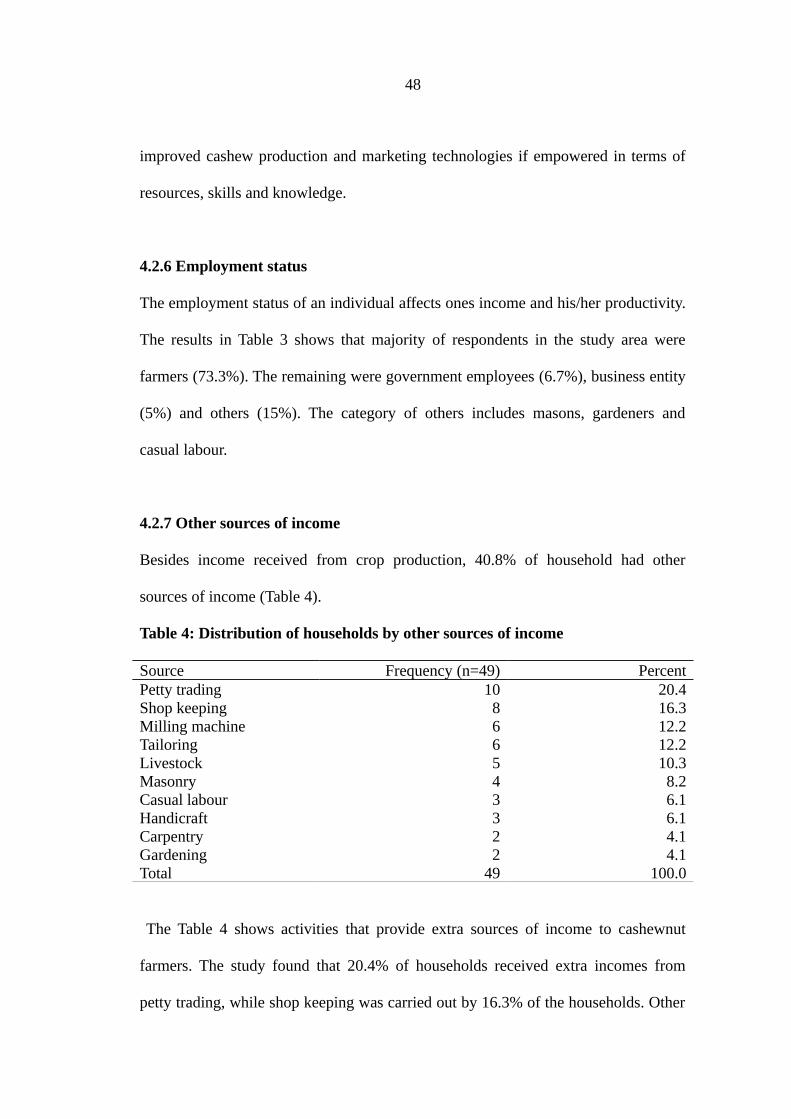
improved cashew production and marketing technologies if empowered in terms of
resources, skills and knowledge.
4.2.6 Employment status
The employment status of an individual affects ones income and his/her productivity.
The results in Table 3 shows that majority of respondents in the study area were
farmers (73.3%). The remaining were government employees (6.7%), business entity
(5%) and others (15%). The category of others includes masons, gardeners and
casual labour.
4.2.7 Other sources of income
Besides income received from crop production, 40.8% of household had other
sources of income (Table 4).
Table 4: Distribution of households by other sources of income
Source Frequency (n=49) PercentPetty trading 10 20.4Shop keeping 8 16.3Milling machine 6 12.2Tailoring 6 12.2Livestock 5 10.3Masonry 4 8.2Casual labour 3 6.1Handicraft 3 6.1Carpentry 2 4.1Gardening 2 4.1Total 49 100.0
The Table 4 shows activities that provide extra sources of income to cashewnut
farmers. The study found that 20.4% of households received extra incomes from
petty trading, while shop keeping was carried out by 16.3% of the households. Other
48
activities undertaken were milling and tailoring (12.2%) each, livestock keeping
(10.3%), masonry (8.2%), casual labour and handicraft (6.1%) each, carpentry and
gardening (4.1%) each. The findings in this study highlight the relatively diversified
nature of rural livelihood; it is implied that sources of income other than agriculture
played important roles in contributing to social economic development of the people
in Mkuranga District. However, most of them were characterised by small number of
households.
4.2.8 Poverty level
Observation and discussion with knowledgeable people and local authorities carried
out at all levels indicated that a rich person in the society of Mkuranga district was
seen to own 10ha of land and above, other indicators were: motorbike ownership,
motorized blower, a good iron sheet roofed house, ability to save money, household
assets capital and amenities, produce enough food the year around and surplus to
support others, contribute for various village development activities. Furthermore,
the haves were able to consume three meals per day as well as being able to pay
school fees for his /her children and footing bills for health services.
The medium person was envisaged to have five hectares and above but less than
10ha, an un-cemented iron roofed house, own bicycle as a transport means, two
meals a day, and able to pay his/her children’s school fees in community schools.
Furthermore, he/she was able to produce enough food for about eight month of the
year.
The poor person might keep poultry, had land below five hectares, could possess a
wooden constructed and grass thatched house or hut, afford two or one meal a day
49

and, was said to face food shortage for about five to seven months. On the other
hand, a poor individual could not afford to pay for his/her children’s education and
may need support from local authorities.
Table 5 shows distribution of households by wealth status and indicates that there
were a few (7.5%) of the households in the rich group, around 27.5% placed in
medium group while the poor constituted (65%).
Table 5: Distribution of households by wealth status
Wealth status: Frequency PercentPoor 78 65.0Medium 33 27.5Rich 9 7.5Total 120 100.0
These results implies that majority of households were poor, which might be
attributed to the fact that the majority of farmers have less output to sell due to
subsistence production and/or they sold produce at low prices which rendered very
low returns and, therefore, remained poor, as so succinctly reported by Gregory
(1995) in Peru.
4.2.9 Ownership of household assets
The potential for ownership assets to contribute to the wealth indicator was explored
by comparing the relative distribution of each asset to different wealth status (Table
6).
50

Table 6: Distribution of assets by wealth category (%)
Type of assets Wealth statusRich (n = 9) Medium (n = 33) Poor (n = 78)
Car 0 0 0Motorbike 66 0 0Radio 55 42 26Table 100 82 29Wardrobe 89 85 5Chairs 100 76 33Wooded bed 89 67 15Modern mattress 100 58 47Refrigerator 2 0 0Mobile phone 89 18 0Sewing machine 44 3 0Charcoal stove 100 82 0Kerosene stove 67 6 0Local stove-mafiga 33 100 100Tractor 0 0 0Bush knife 100 100 94Hand hoe 100 100 86Axes 89 100 83Blower 22 0 0Spade 100 88 23Iron roofed house 100 100 0Makuti thatched 0 0 100Cemented house 100 79 2Cattle 11 0 0Sheep/goats 0 24 6Poultry 55 48 61
It was found that assets such as motorbike, motorized blower, cattle and refrigerator
were more indicative of wealth than others as seen in the distribution across the
wealth categories only owned by rich households, while grass thatched houses were
51
owned by poor household’s category conferring a clear indication of wealth category
(Table 6).
Further analysis of ownership assets showed that majority of rich and medium
households owned mobile phone, sewing machine, kerosene stove, cemented and
iron roofed house, though at different magnitude. The ownership of hand hoe, local
stove, bush knife, axe, was higher amongst wealth categories. This suggests that
majority of households in the study area depended merely on simple technologies in
their economic activities probably due to lack of capital. The study findings also
showed that farming activities were done by hand hoe and other simple tools since
no household among all categories reported to own a tractor/car. Thus, based on the
distribution of assets across wealth categories, these assets were selected as an
indicator of the households’ wealth status as they appear to be very expensive to the
majority of poor people. Such assets include: ownership of blower, mobile phone,
motorbike, cattle, refrigerator and, corrugated iron roofed and painted house.
4.3 Crop Production and Marketing Issues
4.3.1 Land acquisition
The average total land owned by households was 0.77ha for cashewnut, 0.91ha for
cassava, 0.69ha for coconut and 0.75ha for maize. Table 7 presents the various
models of land acquisition from the sample households in Mkuranga District. The
field data showed that the majority 56.6% of households’ plots of land were offered
by village authorities, 29.2% by inheritance, and only 14.2% acquired land through
purchase.
52

Table 7: Distribution of households by land acquisition methods
Mode of land acquisition Frequency PercentGiven by village government 68 56.6Inherited 35 29.2Bought 17 14.2Total 120 100.0
4.3.2 Labour use and allocation
Labour is one of the most important resources in smallholder agriculture. It’s
availability in smallholder agriculture determines not only the size of economic
activity that a farmer can engage in but also the scope of improvement of production
of farm produces. Most of households (62.5%) used family labour in managing their
cashewnut fields, while 37.5% used both family and hired labour; no farmer
employed hired labour (Table 8).
In the informal interview most of respondents claimed that during weeding and
application of pesticides labour becomes a problem because the same operations are
also done on the other crops. However, labour for cashewnuts harvesting was not a
problem since it is effected during the dry seasons, when farmers had less field work.
Table 8: Sources of labour for the sample households
Type of labour Frequency PercentFamily labour 75 62.5Hired 0 0.0Both 45 37.5Total 120 100.0
53

4.3.3 Farm activities
Cashewnut production in the study area was characterised by low level of
technology, such as hand hoes, axes and bush knives, low input use and, hence, low
outputs. Cultivation was done on small plots. On average the households had less
than one hectare for each crop (i.e. maize, cashewnuts, coconut, cassava) with low
average yields (Table 9).The low yields can be attributed to several reasons ranging
from the poor technology in place to low use of inputs, implying that farmers in the
study area were predominantly smallholders.
Table 9: Distribution of crop enterprises by farm size and yields
Enterprises Total (Ha)
cultivated/crop
Average farm
size (Ha)/HH
Average yields
(kg/HH)
Average yields
(kg/Ha/HH)Cassava 108.9 0.91 726.089 797.6Cashewnuts 92.4 0.77 731.5 950Maize 90.2 0.75 1037.25 1383Coconuts 82.2 0.69 480.102 695.8
4.3.4 Farmers’ organization and availability of support services
Credit services to cashew farmers are required to enable them buy agricultural inputs
like agrochemicals, farm implements and tools. In analyzing sources of agricultural
finance it was observed that there were diverse sources (Table 10). The sources of
finance that were found to be available in the study area include own savings, Input
Trust Fund (ITF), relatives and friends, Saving and Credit Cooperative Societies
(SACCOs) and micro-finance institutions, Foundation for International Community
Assistant (FINCA) and Promotion of Rural Initiative Development (PRIDE). The
majority of cashewnut farmers (76.7%) use own saving for their farm operations,
54

others include Input trust fund (9.2%), relative and friends (7.5%), SACCOs (5%)
and Microfinance institutions (1.7%) each (Table 10).
Table 10: Distribution of households by sources of credit
Sources Frequency PercentOwn saving 92 76.7SACCOs 6 5.0Relatives & Friends 9 7.5MFI 2 1.7ITF 11 9.2Total 120 100.0
Furthermore, the financial landscape in the study area was comprised of three main
providers, including informal financial institutions, semi formal financial institutions
and government credit programs (Input Trust Fund). About 107 (89.1%) of the
respondents used informal financial sources for their agricultural activities, followed
by the government through farmers’ ITF 11 (9.2%) while the rest of respondents 2
(1.7%) secured from semi formal financial sources. These sources of finance
provided credit both in kind and cash. ITF provides in kind credit in form of
pesticides, fertilizers, blowers and bags, while other sources provide in cash. The
credits provided support in farm clearing, purchase of seeds, farm tools, pesticides,
harvesting and transport services. Farmers were obliged to pay the entire loan with
an interest of 10-20% in a single season depending on the sources involved. The
inaccessibility of credit institutions in the study area has necessitated the farmers to
use their own savings and/or informal sources to finance farm operations.
Furthermore, in the 2007/08 season, there were no any formal financial institutions
operating in the study area. From these findings it can be noted that informal sources
55

had been established to be important in the study area as alternative financial sources
in agricultural production. This is in line with the study conducted by Philip (2001)
who also found that informal sources of credit played big a role in both dairy and
sugarcane production in Tanzania.
All respondents were asked how much money was received as credit (Table 11).
Table 11: Information on credit for farm operations, 2007/08
Variable Number Weighted
PercentAmount of credit received (Tshs) n=28
30 000 – 50 000 6 21.460 000 – 100 000 8 28.6150 000 – 200 000 12 42.9Above 200 000 2 7.1Total weighted 28 100Access to credit N=120No 92 76.7Yes 28 23.3Total 120 100.0Condition required for loan n=28No condition 5 17.9Farm record 9 32.1Collateral 10 35.7Others 4 14.3Total weighted 28 100.0
56

The majority (76.7%) of respondents did not take loan for their farm operations, the
rest 23.3% of respondents did. Those who took loan reported that the amount of
credit ranged from Tshs 30 000 to Tshs 200 000. A few (7.1%) of the respondents had
received more than Tshs 200 000, implying that chances of getting financial credits
seem to be narrow for the majority of farmers a factor which lowers their capacity to
produce more agricultural outputs.
Other supports to cashew farmers included extension services. Extension services are
important in raising productivity of the agricultural sector because it bridges the gap
between the available technology and farmers’ practices through the provision of
technical advice, information and training. These, facilitate farmers’ ability to adopt
new technologies and crop varieties, which would benefit their production and
incomes. The study indicated that 60.8% of the farmers had received extension
advices from extension workers while 39.2% did not (Table 12).
Table 12: Provision of extension services
Frequency PercentYes 73 60.8No 47 39.2Total 120 100
However, the study showed that the extension services provided, mostly by the
government agencies did not have any notable impact on encouraging the farmers to
properly manage their cashew fields due to lack of resources to buy required inputs.
They were also observed to be less useful in providing market information and
educating the farmers on methods to improve market information and productivity. It
57

was also noted that there was only one Subject Matter Specialist-Cashewnut in the
whole district. This implied that there was lack of effective cashewnut extension
services in the study area. Other means of getting farm knowledge like news papers,
agricultural news letters, posters, were not available. However, about 41% of
respondents owned radios. In this case information dissemination of agricultural
package through radio broadcasting could be feasible.
In response to the problem of inadequate extension services, the Naliendele Research
Institute had started a programme tailored to providing extension services to
cashewnuts growers. This programme provides inputs like improved seed nuts,
sulphur and blowers in kind. This could be effective rather than providing technical
packages.
4.3.5 Factors affecting cashewnuts marketing
The study revealed six factors which affected cashewnut marketing including
categories of buyers, selling prices, mode of payments, selling places, access of
market information and lastly exploitative marketing tricks.
The findings in this study revealed that 34.2% of the households sold their nuts to
cashewnut traders, 32.5% to cooperatives, 23.3% to village agents, and 10% to
village collectors. The implication of these results is that farmers in the study area
had mainly four outlets for the sale of their products as shown in Table 13. Further
analysis of cashewnut buyers show that export companies dominated cashewnut
58

business. This could be due to the fact that cashewnut trading activities require large
capital outlay for possible operations.
Table 13: Distribution of household by category of buyers
Category of buyers: Frequency PercentLarge traders 41 34.2Cooperatives 39 32.5
Village agents 28 23.3Village collectors 12 10.0
Total 120 100.0
Furthermore, there were variations in selling prices of cashewnuts sold in 2007/08.
The minimum price was Tshs 250 per kg and the maximum was Tshs 610 per kg. The
mean price was Tshs 400 per kg. According to the indicative price given by CBT for
the 2007/08 season, the price for standard grade was Tshs 610 per kg and under grade
was Tshs 488 per kg. It is important to note that the maximum price received by
farmers for standard grade was equal to the indicative price. However, the under
grade was underpaid less than the indicative price during that season (Table14). From
these results it can be observed that the price paid in the study area was different
among farmers and within localities, implying that cashewnut producers had less
bargaining power in marketing their nuts.
Table 14: Cashewnut selling price and distance to markets
Variable Mean Maximum Minimum Std. deviationSelling price (Tshs) 400 610 250 92.71954Distance to markets (km) 3.7 15 0.5 3.01843
59

The price setting procedure of cashewnuts was negotiated and agreed upon by the
Tanzania Cashewnut Council. The Council is made up of representatives from the
Ministry of Agriculture, CBT, local government authorities, farmers association and
traders. The prices reached are referred to as indicative. A number of factors are
considered before reaching this price, such as the world market price. The price is
officially announced by CBT just before marketing cashewnuts begins. After the
announcement of the indicative price traders are allowed to buy nuts at any amount
above it. As reported earlier in this study cashewnuts prices offered by different
buyers in Mkuranga District were almost the same.
Table 15 provides summary of the views given by cashew growers on how they
thought the pricing policy could be improved. The majority of farmers (47.5%)
believed that full farmers’ participation in the pricing exercise was necessary to
ensure fairness in pricing. That means more farmers representatives should be
included amongst the price setters. Although farmers had some representatives
during pricing process, those representatives could not influence decisions reached
during price setting.
60

Table 15: Propositions on improving cashewnut pricing
Views Frequency Weighted Percent
Fully farmers participation 67 35.1Government monitor the exercise 49 25.6Indicative prices be adhered to 42 22.0Under grade be avoided 21 11.0Training of farmers on proper grading 12 6.3Total-weighted 191 100.0
The analysis of terms of payment indicated that both cash and credit systems were
used (Table 16). About 24% of households sold their nuts on credit basis to some
cashew buyers. Payments on this system were made twice per selling season, first, in
the middle and second at the end of selling season. However, credit payment
arrangements were perceived to be bad and unsatisfactory compared to cash
payments which are preferably good and satisfactory. This finding implies that cash
payment is the motive for both farmers and traders while trading.
Table 16: Mode of payment
Mode Frequency PercentCash 91 76Credit 29 24Total 120 100
The majority of household (39.2%) sold their produce at their homestead (Table17).
Table 17: Distribution of households by selling places
Selling place Frequency Percent At home 47 39.2At cooperatives 38 31.7At buyers collection place 35 29.2Total 120 100.0
61

The arrangements were attributed to the increase in private traders who appointed
agents (most of them based in cashew producing areas). The price paid by agents at
homestead or shops was pre-determined by buyers and were usually below the
indicative prices. This arrangement provided room for manoeuvring which
occasioned low pricing of cashewnuts. The difference in price was also determined
by the distance where the produce was to be purchased. The more the distance the
lower the price, since there was more transaction costs faced by buyers. The study
established that the mean distance of the market centre from farmers’ homesteads
was 3.7km, where as the maximum distance were 15km, and the minimum was
0.5km (Table 14). This justified that there were variation in distances where the
business was carried out though not very far from farmers’ vicinity.
The results in Table 18 study indicate that the majority of respondents (34.2%), that
is, farmers accessed market information by direct visit to the market place. The study
further showed that most of respondents either directly or through their fellows
accessed the information on prices announced by the CBT at the time of harvest, in
most cases through government radio and Television broadcasts. However, the
information received had not been useful to farmers because they had to sell at prices
set by traders instead of the rates announced by CBT (Table 14). This was attributed
to lack of common agreements among farmers on the selling price versus household
cash needs pressurising farmers to sell their produce devoid group action, for
cashewnut was the major source of income in the study area.
Table 18: Sources of market information
62

Source Frequency PercentVisit market 41 34.2Middlemen 33 27.5Friends 21 17.5Radio 16 13.3Others 9 7.5Total 120 100
Moreover, the study found different exploitative tricks which were used by traders in
buying cashewnuts from farmers (Table 19). The majority of farmers 47.5%
complained about undercut pricing and 36.7% of farmers noted use of
unstandardized measuring facilities in measuring nuts. A few respondents (15.8%)
reported no problems. This implies exploitation of farmers in the sector, apparently
involving using unstandardized measuring equipments, conducting business in
unregistered areas difficult to monitor, same giving room for unfair business and low
pricing.
Table 19: Exploitative tricks used by traders
Frequency PercentUndercut pricing 57 47.5Unstandardized measuring facilities 44 36.7Others 19 15.8Total 120 100.0
4.4 Profitability Analysis for Crop Enterprises
Farmers in Mkuranga District produce various food and cash crops in addition to
cashewnuts. In this study three major crops that compete with cashewnuts in resource
use were included. These were coconuts, maize and cassava. Using the gross margin
analysis the gross margins for cashew and other crops were calculated. The prices
and output used in the calculation of gross margins were those of 2007/08. The
63

detailed calculations of the gross margins for the mentioned crops are shown in
Tables 9; 20 and 21.
Table 20: GM for maize, cashewnut, coconuts and cassava for 2007/08
Item Maize Cashewnuts Coconuts CassavaAverage yearly yield (kg/ha) 1 383 950 695.8 797.6Average price per kg (Tshs) 112 400 188 194Gross income 154 896 380 000 130 810 154 734Variable costs (Tshs/ha)Seeds/Cuttings 5000 0 0 2750
Fertilizer 21 000 0 0 0Labour 39 000 37 500 27 000 33 000Sulphur 0 113 636 0 02oil/Petrol 0 20 110 0 0Blower hiring 0 18 000 0 0Ropes 0 0 7200 0Other costs 3 600 31 700 14 500 25 000Total variable costs 68 600 220 946 48 700 60 750Gross margins (Tshs/ha) 86 296 159 054 82 110 93 984Return to labour (Tshs) per man-day 1 463 2 485 2 219 1 382
64

Table 21: Labour requirements by crops (man-days/ha)
Operations Cashewnuts Maize Cassava CoconutsField clearing 15 14 18 11Ploughing 0 12 14 0Planting 0 4 6 0Weeding 0 14 18 0Sulphur dusting 9 0 0 0Pruning 9 0 0 0Harvesting 19 8 5 16Crop haulage and marketing 12 7 7 10Total man-days 64 59 68 37
Results from Table 20 indicate that maize, cashewnuts, coconuts and cassava are
profitable ventures in the study area with gross margins per hectare of Tshs 86 296;
159 054; 82 110 and 93 984, respectively. Cashewnut had relatively higher gross
margin (Tshs/ha) compared to other crops, followed by cassava, maize and coconut.
According to these findings, total gross margins (income) from all crops was Tshs
421 444, implying that 20.5% of household income was generated from maize,
cashewnuts 37.7%, coconut 19.5% and cassava 22.3% respectively. Further analysis
of gross margins (Tshs/ha) indicates that maize, coconut and cassava being sold at
low prices, their prices would have to increase about twice as much in order for them
to overtake cashewnut in profitability. Hence, if gross margin was the only criterion
for income generation, then it could be aptly to state that cashewnut is the first most
important crop in terms of income generation and benefits in the study area. That a
clear indication that cashewnut enterprise is more profitable as it yields higher gross
65
margin, thus a desirable venture to undertake. Based on its profitability, cashewnut
contributes more to household’s income than other crop enterprises.
The assessment of returns to labour and labour requirements, showed that cashewnut
had higher return to labour (Tshs 2 485 per man-day), followed by coconut (Tshs 2
219 per man-day), maize (Tshs 1 463 per man-day) and cassava (Tshs 1 382 per man-
day) (Table 20). But, coconut had the lowest labour requirements of 37 man-days
compared to other farm crops (Table 21). The results imply that it would therefore be
paying for the farmers to produce more cashewnuts as they do obtain the best from
their labour than other farm enterprises.
4.5 Problems Encountered in Cashewnut Production and Marketing
The study portrayed many problems as far as cashewnut production and marketing is
concerned, as presented in Table 22. Low prices (54.2%), unreliable market (25.3%),
pests and diseases (40.1%), and high input costs (25.3%), featured as the most
important constraints. This is an indication that the majority of the farmers were not
satisfied with prices offered by cashewnuts dealers.
Table 22: Cashewnut production and marketing constraints
66

Constraint Frequency Weighted PercentCashewnut production:
Pests and diseases 65 40.1High input costs 41 25.3Poor extension services 22 13.6Lack of access to inputs 14 8.6Lack of capital 12 7.4Theft 8 5.0Total weighted 162 100.0Cashewnut marketing:Low prices 103 54.2Unreliable market 48 25.3Lack of market information 26 13.7Low demand of their produces 13 6.8Total weighted 190 100.0
Furthermore, the major constraint in cashewnut production is pests and diseases. The
problem is most severe at the cashew flowering stage, when a parasitic fungus
known as Odium anacardia causes the disease known as Powdery Mildew Disease
(PMD) attacks the said flowers, severely affecting both the quantity and quality of
the cashewnuts. The problem is worsened by the unavailability of such inputs as
sulphur and blowers essential for combating of the disease, as reported by 8.6% of
farmers. The study also reveals that cashewnut producers rely much on services
provided by private suppliers such as BYTRADE (T) Ltd Agent, MUKPAR, and
Input Trust Fund (ITF) at cost. Services offered include fertilizers, pesticides and
packing materials. However, these services are provided at high prices. About 25.3%
of farmers complained of high costs of production due to high price of inputs (Table
22). And 7.4% of farmers complained of lack of capital which occasions 62.5% of
farmers failing to hire labourers in their farms (Table 8).
67

4.6 Cashewnut Marketing
4.6.1 Cashewnut selling
Like any other agricultural product cashewnut marketing is not under control of the
government since after the trade liberalization, and has been confined to farmers’
organization and individual private traders. Informal interview with different
cashewnuts actors showed that marketing of nuts in Mkuranga District basically
involved simple linkages of farmers to exporters through middlemen. It was further
noted that private traders oscillate the buying prices as they wish in order to
magnetize farmers to sell to them. Most of farmers complained that no grading had
been considered that rather all nuts were purchased at the rate of under grades. Also
there were no weighing machine inspectors to ensure that farmers were not cheated.
This shows that there is weakness in CBT supervision, for their failure to regulate the
price of cashewnut. One solution to this problem, and which is officially supported
by government, is formation of producer marketing groups which can develop a key
link to the traders/exporters. Also, it can facilitate direct marketing, thereby
shortening the marketing chain and therefore increase farm incomes.
4.6.2 Transportation of cashewnuts
Cashewnuts traders are responsible for transportation of purchased nuts from buying
posts to exporting companies or processing mills. The study found that various
means of transport are used in transporting cashewnuts, among others includes, head
loads, bicycles, pickups, Lorries, and public transport (Table 23). Furthermore,
transport costs depend on the means and type of transport, road conditions and the
distance to be covered. The modes of transport also determine how much can be
68

profitably transported and sold. However, most small scale traders consider owning
vehicles expensive because the business deal is seasonal. As such small traders prefer
hiring vehicles to avoid increased overhead costs.
Table 23: Means of cashewnuts transportation
Means of transport Frequency PercentLorry 12 42.9Public transport 10 35.7Pickups 4 14.3Bicycle and head load 2 7.1Total 28 100.0
4.6.3 Cashewnut storage facilities
Primary Cooperative Societies’ (PCSs) godowns were the most storage facilities used
by farmers and traders in keeping their produces because these facilities are the
authorized ones. However, most of godowns were seen to be in very poor conditions
with leaking roofs, rendering spoilage of the stored nuts. It was also found that the
present storage godowns were insufficient. As a result some small and big
cashewnuts dealers used their own rooms or hired houses for storing their nuts during
the buying season.
4.6.4 Sources of finance
As far as sources of finance are concerned, it was noted that most of traders obtain
credits from informal sources. The sources of finance that were found to be important
in the study area are, own saving, relatives and friends, and family savings. Among
the three sources of finance own saving and family savings were the most important
ones. Among the traders interviewed 54.1% started the business from their own
69

savings. The remaining 29.2% earned same from family members. Only 16.7% of the
traders solicited to relatives and friends (Table 24). This means that majority of
business owners depend on informal sources of finance in order to start up or
improve their enterprises.
Table 24: Distribution of traders by sources of credit
Source Frequency PercentOwn saving 13 54.1Family 7 29.2Relative and Friends 4 16.7Total 24 100.0
Shortage of financial credit was noted to be a major problem in cashewnuts business.
The majority of traders (70.8%) reported lack of collateral as the major problem in
securing loans (Table 25).
Table 25: Reasons for not getting access to credits
Reason Frequency PercentLack of collateral 17 70.8Lack of interest 3 12.5Not aware 4 16.7Total 24 100.0
The main forms of collateral mentioned were permanent structures like houses and
other immovable assets like land. 16.7% of the traders were not aware of the
availability of credit. The remaining 12.5% had no interest in securing credit to
expand their business due to high associated risk in cashewnuts business, because of
unexpected high competition from other unregistered cashewnut dealers. It was
further noted that lack of finance inhibited the ability of cooperatives to compete
70

with private cashewnuts exporters in exporting nuts. This situation gave room to
larger traders to dominate the cashewnuts business by providing interest free credit to
small buyers and Primary Cooperative Societies (PCSs), so that they could buy and
supply them with large quantities of produces.
4.6.5 Cashewnut marketing channels
Exchange organization defines the structure of the market in terms of the nature of
marketing chains, bargaining relationships, volume and prices paid for products and
functions performed by various participants in the marketing system. While other
marketing channels might exist in the same district for the same product, it was
sufficient for the researcher to identify and analyse the most important ones. The
existing cashewnut marketing channels have been identified and their brief functions
are described here under.
Producers: Cashew cultivation is carried out by a large number of producers who
are geographically dispersed of various locations in Mkuranga District. Cashewnuts
producers, in general, belong to farming families. Their farms are allocated to them
by village authorities, inherited, or purchased. The producers harvest the nuts and
supply the product to the traders.
Village agents: They are small scale traders who normally do not involve themselves
in the supply of inputs or credits. These agents function as outlets for local farmers, a
retail market for local consumers and a bulking-up market for exporters/ traders who
tend to buy large quantities of nuts destined for district, urban or even export
markets.
71

Collectors: They are usually based in town or villages located on trunk roads. They
function as retail markets but they are also important as assembly points for lorry
loads (3 to 10 tons) of cashewnut to be transported to the main urban centre (Dar es
Salaam city). They do collect some quantities of cashewnuts and sell them directly to
exporters or wholesalers. They are not responsible for the transportation of the said
collection from the farm gates for the suppliers do cater for same. Instead, they do
transport purchased nuts from their site to exporting companies’ arena.
Primary Cooperative Societies: The primary cooperative societies (PCSs) form the
major link between farmers and traders. The marketing functions of purchasing
cashewnuts, cash payments, and supply of inputs to cashewnut farmers are conducted
by cashew dealers through PCSs. Each PCS is under the leadership of its
chairperson, vice chairperson, secretary and members. PCSs are charged with the
following functions: (i) act as centres for supply of sulphur and other inputs to
members through ITF and other input distributors in the district; (ii) collection of
cashewnut from farmers and selling them to the exporting companies; (iii) provision
of loans for farm inputs and weeding, to their members; (iv) effecting payments to
farmers after cashewnuts sales and deduct the amounts of loan provided; and (v)
identification and reporting to government authorities, production problems
encountered by farmers.
Exporting companies (traders): Exporters buy and sell large quantities of
cashewnuts from cashew growers and rural agents and sell the products to foreign
markets. The said quantities, of loads of various sizes and shapes, are then packed
72

into large uniform units. In so doing, the exporters provide information to suppliers
(e.g. cashew growers, rural assemblers). They also facilitate mass and specialized
storage operations, transportation and, in general, the subsequent distribution
operations involving cashewnuts exportation.
In addition, roadside retail markets (petty traders) perform an important function.
These markets are a common feature of the major roads and act as an additional
outlet for farmers.
Consumers: The last links in the marketing chain, families usually personify the
final consumer. However, processing companies are considered the user or consumer,
albeit at the intermediate stage. Fig. 5: below summarizes the cashewnut marketing
channels used in the study area.
73
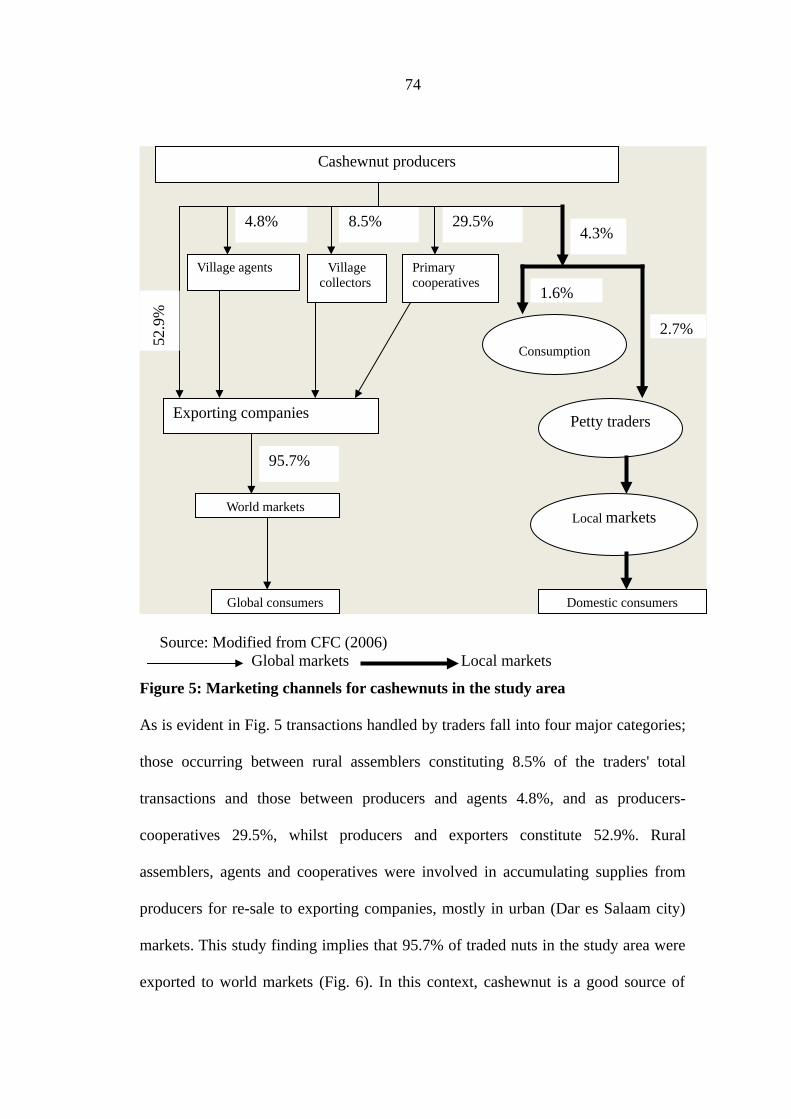
Source: Modified from CFC (2006) Global markets Local markets
Figure 5: Marketing channels for cashewnuts in the study area
As is evident in Fig. 5 transactions handled by traders fall into four major categories;
those occurring between rural assemblers constituting 8.5% of the traders' total
transactions and those between producers and agents 4.8%, and as producers-
cooperatives 29.5%, whilst producers and exporters constitute 52.9%. Rural
assemblers, agents and cooperatives were involved in accumulating supplies from
producers for re-sale to exporting companies, mostly in urban (Dar es Salaam city)
markets. This study finding implies that 95.7% of traded nuts in the study area were
exported to world markets (Fig. 6). In this context, cashewnut is a good source of
Cashewnut producers
Global consumers
Village agents Primary cooperatives
Village collectors
Exporting companies Petty traders
Consumption
Local marketsWorld markets
4.3%29.5%
95.7%
8.5%4.8%
2.7%
1.6%
52.9
%
Domestic consumers
74

foreign exchange earnings. The remaining 4.3% of the nuts were consumed at family
levels, given to relatives and friends, or sold to petty traders who re-sale the same to
local markets. The volume handled was given as a percentage total of cashewnuts
traded (Table 26). Prices were 250 to 610 Tshs per kg at producer level as reported
earlier in this text, but 750 Tshs per kg in urban markets. The difference in prices was
due to the difference in quality and market segmentation. Farmers can therefore
exploit other rewarding market avenues in urban areas if they sell large volumes of
cashewnut through economies of scale, same which may reduce marketing their nuts
at low prices.
Table 26: Buyer categories by volume of cashewnut traded
Category Volume (kg) % total
Village agents 4 225 4.8
Village collectors 7 482 8.5
Cooperatives 25 966.8 29.5
Exporters 46 564.2 52.9
Petty traders/consumption 3 785 4.3
75

Total 88 023 100.0
4.6.6 Correlation analysis
Correlation analysis was done to test the extent to which prices and market margin
are related to each other (Appendix 2). Results showed high correlation between
margin and selling price, this indicates that 66.5% and 26.7% of the market margin
were correlated to selling and producer prices in that order. It also implied that 33.5%
and 73.3% of the given variables were due to other factors, for instance transaction
costs (market levies, transport costs and others). The negative correlation between
margins and producer price shows that price change may be passed on subsequent
market intermediary in market channel. Taking these into account it would mean that
buyers are earning more profit (which does not reflect marketing costs). In this case
producers meet most of the marketing costs which were supposed to be paid by
buyers. Further analysis observed a strong association (r = 66.5%; P = 0.003)
between marketing margin and selling prices. A negative association between
marketing margin and producer price implies that as producer prices increases
market margin decreases and the vice versa. It can be noted, therefore, that selling
prices were relatively stable compared to producer prices.
4.6.7 Regression analysis
Table 27 presents the regression results that show the determinants that influence
traders’ net revenue. Analysis of results indicated that the coefficient of
determination (R2 = 0.748) showed that 74.8% of the variation in net profit was
accounted for by the independent variables using this model, only 25.2% of the
76

variation in the cashewnut net profit is explained by variable not included in the
model.
The coefficients for two out of the five variables were found to be significantly
different at (P < 0.05). These were buying price and experience in business. Further,
results indicated that the transport costs, education level and selling price were found
to be significant at (P < 0.05). However, transport costs and buying price were
inversely related to the net profit. This implies that traders received less net profit
when the buying price and transport costs of cashewnuts were higher. Also, selling
prices had positive effect on their profit. This is attributed to the fact that higher
selling price of cashewnuts forced traders to buy large quantity from farmers with
expectation of earning higher profit. Experience of the traders was positively related
to the net profit. This implying that traders with enough experience earn more profit
because had good knowledge of market dynamics and lobbying skills acquired in
cashewnut business. The significance (P < 0.05) of the extent of education, and its
positive relationship with net profit, shows that the higher the level of education, the
more the traders were willing to invest to make more profit. Similar conclusion for
education was reached by Mutayoba (2005) and Eze (2007) in Tanzania and Nigeria
respectively.
Table 27: Determinants of net profit margin in cashewnut marketing
Dependent Variable: Net profit marginVariable Coefficient SE T-value Sig Constant 61.589 1.384 45.500 0.000*Buying price -0.085 1.563 -0.054 2.281Selling price 0.867 0.043 0.555 0.000*
77

Transport cost -0.0223 0.165 -0.135 0.002*Experience (Years) 0.169 0.097 1.742 0.064Education level 0.3270 0.051 6.412 0.045*
*Significant (P < 0.05) R2 = 0.748
CHAPTER FIVE
5.0 CONCLUSION AND POLICY IMPLICATIONS
5.1 Conclusion
The gross margin analysis in this study showed that on average cashewnut farmers
earned 159 054 Tshs/ha as net return from cashewnut production. This is relatively a
larger profit margin compared to those earned from other crops and hence making
cashewnut a profitable enterprise although the productivity (kg/ha) was low. The
returns per man-day were the highest in cashewnut (2 485 Tshs) and the lowest in
cassava (1 382Tshs).
Marketing of cashewnut in the study area can be characterised as highly dependent
on cooperatives, individual traders and exporter companies. However, these actors
78

have not provided adequate incentives to cashewnut farmers in terms of pre-harvest
services and marketing performance. Many problems noted from the study indicated
gross inefficiency in the entire production-marketing system. These problems
increase production costs associated with low producer prices which eroded much of
the profit margins received by farmers.
Four main cashewnut marketing channels were identified in the study. The first
channel involved producers selling to village agents and these sell the nuts to
exporters who sell to consumers. The channel accounts for 4.8% of the total nuts
traded. The second channel involved producers who sell cashewnuts to collectors
who are agent of exporting companies who sell to consumers. This channel handles
8.5% of the total cashewnut traded. The third channel involved selling cashewnuts
from farmers to cooperatives to exporting companies and finally to consumers. The
channel constitutes 29.5% of total produce traded. The fourth channel involved
farmers selling cashewnuts directly to exporting companies and then to consumers.
The channel represents of 52.9% of cashewnut purchased.
The findings in this study show that low producer prices, unreliable markets, high
input costs, and pests and diseases constituted the major problems affecting
cashewnut production and marketing system in the study area.
The correlation analysis in this study showed positive correlation between net profits
and selling price (r = 66.5%; P = 0.003) and indication that selling price and net
profits were moving together across the season. There were three determinants of the
79

cashewnut profits, education level, selling price and transport costs which were
significant (p < 0.05). Other factors such as buying price and experience in cashew
business were insignificant (P < 0.05).
5.2 Policy Implications
Based on the findings in this study three fundamental recommendations are made for
improvement of the production and marketing systems in the study area:
5.2.1 Producer price
Farmers were selling raw cashewnuts at low prices. The government should promote
cheaper local processing techniques for cashewnuts by farmers by providing credits
or subsidizing the purchase of processing technologies. This will enable farmers to
add value to their produces and hence get higher producer prices and earn more
incomes from cashewnut production. The use of warehouse receipts system in
cashewnut marketing can stabilize the producer prices when backed up with legal
provisions through which the stored produces can serve as collateral, be packaged
under a future contracts system.
5.2.2 Cashewnut production
The study recommends that public services and polices related to the development
of cashewnut production should give more support to smallholder farmers. This
support can be in the form of facilitation of the acquisition of working capital and
access to lucrative markets through production of value added cashewnuts.
Moreover, support for the improvement of cultivation practices to increase
80

productivity and quality of cashewnuts should also be prioritized by the government.
This should involve development of a compatible and integrated strategy that will
ensure reliable access to inputs, credit and subsidies by cashewnut farmers. Increases
in yield require building capacity in research and development of highly yielding
cashewnut varieties as well as well improved extension and education services.
5.2.3 Cashewnut marketing
To improve cashewnut marketing, it is important to use designed official buying
posts. These have a number of advantages. First, they have appropriate marketing
facilities such as weighing scales, and storage facilities for fair and open transactions.
Such posts are also more likely to maximize the potential for collective bargaining
for cashewnut producers. These will also make it easier to enforce quality control and
traceability by using registered codes.
81
REFERENCES
Abbott, J. C. and Makeham, J. P. (1990). Agricultural Economics and Marketing in
the tropics. 2nd edition. Intermediate Tropical Agriculture Series. London,
UK: Longman group UK Limited. 232pp.
Akiyama, T., Baffes, J., Larson, D. and Varangis, P. (2001). Commodity Market
Reforms. Journal of Agricultural Economics 20(3): 241 - 252.
Ali, M. K. and Lashari, M. I. (2001). Marketing Margin Analysis of Flowers in
Sindh. [http://www.pakistaneconomist.com] site visited on 7/8/2008.
Bakker, D. T. (2001). Quality in cashew: A Study on Quality and Production
Improvement on Cashew in Nampula Province, Mozambique. Journal of
African Development Bank 7(4): 1 - 7.
82

Banda, T. (1995). An Evaluation of the Cashewnut Marketing in Tanzania: Natural
Resource Institute Chatham, UL. 37pp.
Behrens, R. (1996). Cashew as an Agro forestry Crop: Prospects and Potential.
Tropical Agriculture 9 Weikersheim, Margraf. 52pp.
Brown, A. (2007). Impact of micro finance institutions on poverty reduction among
smallholder farmers: Case of selected SACCOS in Dodoma and Kongwa
Districts. Dissertation for Award of MSc Degree at Sokoine Morogoro,
Tanzania. 88pp.
Cashewnut Board of Tanzania (2007). Cashewnut Marketing Board of Tanzania
Annual Reports. [http://www.Cashewnut-tz.org/] site visited on 10/7/2008.
Cashewnut Board of Tanzania (2008). Uzalishaji na Masafirisho ya Korosho nje ya
Nchi Kuanzia Msimu wa 1990/91 hadi 2007/08. Ukulima wa Kisasa Printing
Press, Dar es salaam, Tanzania. 10pp.
Chachage, S. L. C. and Nyoni, J. (2001). Economic Restructuring and the Cashewnut
Industry in Tanzania: A research Report. University of Dar es salaam. 67pp.
Colander, D. C. (2004). Economics 5th edn, a Business Unit of the Mcgraw-Hill
Companies, inc; 1221 Avenue of the Americas, New York, NY, 10020. 118pp.
83

Common Fund for Commodities (2003). Appraisal Report. Regional Cashew
Improvement Network for Eastern and Southern Africa: Naliendele Research
Institute, Tanzania. 51pp.
Common Fund for Commodities (2006). Appraisal Report. Regional Cashew
Improvement Network for Eastern and Southern Africa: Naliendele Research
Institute, Tanzania. 65pp.
CTAHR (1998). The Economics of Producing Coffee in Kona. College of Tropical
Agriculture and Human Resources University of Hawaii at Monoa July 1998.
25pp.
DAIPESA (2003). Cashew Sub-Sector Study, Final Report. Dar es Salaam, Tanzania.
24pp.
Duncan, A. and Jones, S. (1993). Agricultural marketing and pricing reform: A
review of experience. Journal of World Development 21(9): 1495 - 1513.
Ehirim, N. (2004). Economics of palm oil marketing in Owerri, Imo State, Nigeria.
Journal of Technology and Education in Nigeria 9(1): 71 - 81.
Eric, F. T. and Christopher, L. G. (2003). Does market liberalization jeopardize
export quality? Cameroonian cocoa, 1988-2000. Journal of African
Economies 12(3): 303 - 342.
84

Eze, C. C. (2007). Marketing margin of beef marketing in southeast Nigeria. Journal
of Tropical Science 47(2): 89 - 95.
Ferris, A. and Malcolm, B. (2000). Farm Management Economics Analysis:
University of Melbourne Parkville Victoria, Australia. 679pp.
Gabagambi, D. (1998). Production and marketing of paddy and cotton in Ulanga
District Tanzania. Dissertation for Award of MSc Degree at Sokoine,
University of Agriculture, Morogoro, Tanzania. 137pp.
Gabrekidan, A. (2006). The Impact of Micro Institutions on the Livelihood of the
Rural Poor. Adama University, Addis Ababa, Ethiopia. 79pp.
Gebreselassie, S. and Sharp, K. (2007). Commercialization of smallholder
agriculture in selected tef-growing areas of Ethiopia. Ethiopian Journal of
Economics 16 (1): 43 - 56.
Gibbon, H. and Hemele, K. (1992). Adjustment and agriculture in six African
Countries: Ghana, Kenya, Mozambique, Tanzania, Uganda and Zambia. Inc:
Proceeding of South African, Scandinavian Institute of African studies,
African Day Appraisal, 19th-21st May, 1992, Nairobi, Kenya. 8 – 18pp.
Golleti, F. and Babu, S. (1994). Market liberalization and integration of maize
Markets in Malawi. Journal of Agricultural Economics 11(2): 311 - 324.
85
Gregory, J. S. (1995). Analyzing Agricultural Markets in Developing Countries.
Gregory J. Scott, editor. Published in Cooperation with the International
Potato Centre (CIP); Apartado 1558, Lima, Peru. 287pp.
Gujarati, D. N. (1995). Basic Econometrics. Fifth Edition: McGraw-Hill. Inc.,
International Edition. 705pp.
IFAD (2001). Rural Poverty Report 2000/2001: Markets for the poor.
[http://www.ifad.org/media/pact/rpr/5.htm] site visited on 12/8/2008.
Jafee, S. (1995). Private trade response to market liberalization in Tanzania’s
cashewnut industry. Journal of Agricultural Economics 5(4): 331 - 365.
Johnsen, F. H. (2003). Using Gross Margin Analysis in the TARP II-SUA projects:
In: Impact: Lessons Learnt From Farmer Oriented Research Newsletter.
SUA. Morogoro. Tanzania. 4(1): 19 - 21.
Jones, E. and Muthuura, J. (1989). The supply responsiveness of small Kenya
farmers. Journal of Development Area 24: 535 - 544.
Kaoneka, S. R. (2006). Improving the price of cashewnuts in Mkuranga district,
Tanzania. Dissertation for Award of MSc Degree at Larenstein University of
Professional Education, Devender, The Netherlands. 64pp.
86

Kashuliza, A. K. (1994). Perception and role of informal rural finance in
development countries: The example of Tanzania. Journal of Rural Studies
9(2): 163 - 173.
Katinila, N. A., Shomari, S. H. and Mdadila, J. M. (2001). Status of Cashewnut
Industry in Tanzania. Paper Presented to Sub Regional Technical Workshop
on Development of the Cashew Sub Sector in Eastern and Southern Africa ,
29th-31st October, 2001, Maputo, Mozambique. 4 - 16pp.
Kikoka, L. P., Nsemwa, H. S. and Symon, W. (1997). Cashewnut Processing in
Tanzania: Challenges and Options; International Cashew and Coconut
Conference: Dar es Salaam, Tanzania, 17th-21st February. 20 - 56pp.
Ledgerwood, J. (2002). An Institutional and Financial Perspective. Banking with
the Poor. The World Bank, Washington D.C. 286pp.
LEISA (2007). Low External Input and Sustainable Agriculture.
[http://www.leisa.org] site visited on 21/8/2008.
Lumbana, N. (2000). Cashewnut Marketing in Tanzania. A Report by International
Cooperative Alliance (ICA), Regional Office for East, Central and Southern
Africa. 10pp.
Marketing Development Bureau (1992). Annual Review of Cashewnut. Ministry of
Agriculture and Livestock Development, Dar es Salaam. 41pp.
87

Martin, P. J. (1993). Report on Study Visit to Brazil. MALD and ODA Cashew
Project. ARI, Naliendele, Mtwara, Tanzania. 39pp.
Masambu, D., Mataba, L. and Bee, K. (2007). Access to agricultural finance in
Tanzania: Beep Research Report. Moshi University College of
Cooperative and Business Studies. 75pp.
Masawe, S. (2007). Assessment of food market structures and their implication to
household food security in Rufiji District. Dissertation for Award of MSc
Degree at Sokoine University of Agriculture, Morogoro, Tanzania. 70pp.
Ministry of Agriculture, Food and Cooperatives (2006). [http://www.tanzania online]
site visited on 12/8/2008.
Mitchell, D. (2004). Tanzania’s Cashew Sector: Challenges and Constraints in a
Global Environment. African Region Working Paper Series No. 70,
Washington, D.C. 72pp.
Mkude, C. D. (2003). Economic analysis of smallholder’s cashewnuts production
and marketing under market liberalization: A case of Coast Region.
Dissertation for Award of MSc Degree at Sokoine University of Agriculture,
Morogoro, Tanzania. 137pp.
Mkuranga District Council (2007). Mkuranga District Planning Report: Mkuranga
District Council, Coast Region, Tanzania. 57pp.
88

Mole, P. N. (2000). Smallholder cashew development opportunities and linkages to
food security in Nampula Province, Mozambique. Journal of International
Economics 8: 4 - 10.
.
Moshi, H. (2003). Agricultural Credit Financing System; Problems, Prospects and
the Way Forward. University of Dar es Salaam. 97pp.
Mukhebi, A. (2004). Reaching the poor in Rural Kenya with market information: A
case of a market information system. A Paper Presented at CTA Seminar on
the Role of Information Tools in Food Security, 8 th-16th November, 2004,
Mozambique. 19pp.
Msuya, E. (2003). An estimation of technical efficiency in Tanzania sugarcane
production: A case study of Mtibwa Sugar Estate out growers scheme.
Dissertation for Award of MSc Degree at Sokoine University of Agriculture,
Morogoro, Tanzania. 110pp.
Mukras, M. S. (1993). Elementary Econometrics Theory, Application and Policy:
East African Educational Publishers. Nairobi, Kenya. 647pp.
Mutayoba, V. (2005). Economic analysis of vanilla production and marketing: A case
study of Bukoba District, Kagera Region, Tanzania. Dissertation for Award of
MSc Degree Sokoine University of Agriculture, Morogoro, Tanzania. 86pp.
89

Mutakubwa, E. B. (2007). Production and marketing analysis of cassava in Coast
Region of Tanzania. Dissertation for Award of MSc Degree at Sokoine
University of Agriculture, Morogoro, Tanzania. 81pp.
Mwalili, M. S. C. (2008). Agriculture Marketing, Agro-processing and Trade.
[http://www.intrinsicmsc.blogspot.com] site visited on 23/2/2009.
Nayar, K. G. (1998). Cashew: A Versatile Nut for Health: Cashew Export Promotion
Council of India, P.B.No.1709, Chittoor Road, cochin-682016, India. 79pp.
Onumah, E. (2002). Improving Access to Rural Finance Through Regulated
Warehouse Receipt System in Africa in Agribusiness: Vendor Financing Input
Market. [http://www.basiswisc.edu/live/rfc/cs-ogd.pdf] site visited on
24/6/2008.
Orr, A. (1999). Markets and Livelihoods: Lessons from farming systems research
(FSR) in the Blantyre Shire Highlands. Paper Presented at the Workshop on
Integrated Crop Management Research in Malawi: Developing technologies
with farmers. Makokola, 20th – 23rd march 1999, Mangochi, Malawi. 12pp.
Philip, D. (2001). Economic analysis of medium scale agricultural enterprises in a
predominantly smallholder agriculture sector. Dissertation for Award of MSc
Degree at Sokoine University of Agriculture, Morogoro, Tanzania. 115pp.
90
Phiri, C. D. (1991). An Evaluation of Smallholders Farming Systems in Chilongwe
Settlement Scheme in Malawi. Issue in Africa Rural Social Networks. 104pp.
Poulton, C. (1998). The cashew sector in southern Tanzania: Overcoming problems
of input supply. Paper presented at the workshop on the future of research
and extension services in Tanzania, Dar es salaam 24th May 1998. pp36.
Porto, G. (2005). Informal export barriers and poverty. Journal of International
Economics 66: 447 - 570.
Ramatu, A., Doward, A. and Poulton, C. (2000). Improving Access to Maize
Marketing Opportunities in Remote Areas of Ghana: Damango.
[www.wye.ie.ac.uk/AgEcon/ADU/Research/Projects/Maizmkts] site visited
on 17/11/2008.
Rates (2003). Maize Market Assessment and Baseline Study for Tanzania.
[http://www.ratescenter.org/pd/reports/maizetanzaniamay03.pdf] site visited
on 6/7/2008.
Regional Commissioner’s Office (2008). Coast Regional Socio Economic Profile.
290 pp.
91
Rweyemamu, D. C. (2002). The contextual analysis of cashewnut industry in
southern Tanzania after market liberalization. African Journal of Finance and
Management 10 (2): 132 - 309.
Sacerdoti, E. (2005). Access to Bank Credit in SSA: Key Issues and Reform Status.
[http://www.ifm/externally/pubs/ft/wp/2005/wp05166] site visited on
8/7/2008.
Shepherd, A. S. and Ralolfi, S. (1999). Export Crop Liberalization in Africa, A
Review. FAO Agriculture Services Bulletin 135 Rome. 76 - 98pp.
Shepherd, A. S. (2004). Financing Agricultural Marketing the Asian Experience FAO
Working Paper. [http://www.fao.org/ag/agssubjects/en/ agmarket/
markfinance] site visited on 14/3/2009.
Shomari, S. H. (1990). Opportunities and constraints to the development of cashew
exports in Eastern and Southern Africa. A paper presented in the regional
Meeting on the development of cashewnuts exports from Africa. Hotel du
port-‘ La Marina, Cotonou, Benin 23rd-26th July 2002. 23pp.
Shoo, J. A. E. (1997). The Cashewnut industry in Tanzania status report, Cashew
Management Unit, Dar es Salaam, Tanzania. 37pp.
92

Sijaona, M. E. R. (2002). Assessment of the situation and development prospects for
the Cashewnut sector: A Report Carried Out on Behalf of the International
Trade Centre UNCTAD/WTO (ITC). 12pp.
Silomba, L. B. (2000). Structure and performance of bean marketing in Tanzania: a
case of Kigoma. Dissertation for Award of MSc Degree at Sokoine University
of agriculture, Morogoro, Tanzania. 112pp.
Topper, C. P., Martin, J. p., N.Katinila, L. P. and Shomari, S. H. (1998). The
Historical and Institutional Back grounding of the Tanzanian Cashew
Industry. [www.tanzania.go.tz] site visited on 21/02/2009.
Torero, M. and Gulati, A. (2004). Agricultural Markets and Rural poor. [http://dfid-
agriculture-consultation.nri.org/theme4/keypaper/poune] site visited on
22/9/2008.
United Republic of Tanzania (1997). The Agriculture and Livestock Policy of
Tanzania: Ministry of Agriculture and Food Security, Dar es Salaam,
Tanzania. 127pp.
United Republic of Tanzania (2001). Agricultural Sector Development Strategy: Dar
es Salaam, Tanzania. 82pp.
93

United Republic of Tanzania (2006). Cashewnut Processing in Tanzania.
Proceedings of the Stakeholders Meeting, Arusha, Tanzania, 14th March,
2006. 38pp.
United Republic of Tanzania (2007). [www.tanzania.go.tz] site visited on 8/7/ 2008.
Vicent, A. (2005). Options for Financing Agricultural Value Adding Business.
[http://www.AgMRC.comsite] site visited on 21/01/2009.
Wangwe, S. and Lwakatare, M. (2004). Innovation in Rural Financé in Tanzania:
Paper Prepared for the Third Annual Conference on Microfinance held from
15th -17th march 2004 at the AICC, Arusha, Tanzania. 18pp.
World Bank (2000). Agriculture in Tanzania Since 1986: Follower or Leader of
Growth? World Bank Country study, Washington D.C, World Bank. 45pp.
World Bank (2006). World Bank Policy Research Working Paper; 3881, April 2006
Narayan LTD. New York University Press New York. 99pp.
APPENDICES
Appendix 1: Questionnaire for Cashewnuts farmers and traders
Questionnaire no...............................Date of interview……………………………......…
PART ONE: FARMERS QUESTIONS.
Module A: Household identification variables
1. Farmer’s name…………………Gender 1=male 2=female2. Village………………………Ward …………………District………………………
94

3. Ecological zone/land form 1=coastline zone 2=upland zone 3=low land zone4. Farmer category 1=poor 2= medium 3= rich 5. Gender of Household head 1=Male 2=female, Age………………..(years)6. Marital status of household head: 1=married 2=single 3=divorce 4=separated
5=widow7. Level of education of household head 1=none 2=adult 3=primary 4=secondary
5=others……8. Occupation of household head: 1=farmer 2=employee 3=casual labour 4=own
business 5=others …………………………………………9. Household composition
Age group Males Females Total10-14 years15-18 years19 - 50 yearsAbove 50 years
10. Overview of Household Resources
Land resources Unit Quantity Estimated value -Total land HectareCultivated plots(all crops) Hectare Fallow land Hectare Plots for Cashewnuts Hectare Distance to Cashewnuts plot KmLivestock resourceCattle NumberGoats/Sheep NumberPoultry NumberHousing and assets: House conditionType of wall 1=Mud and wood 2=Burnt bricks
3=Non-burnt bricks 4 =cemented bricksType of floor 1=Mud floor 2=Cemented floorType of roof 1=Grass thatched 2=Iron sheetType of toilet 1=None 2= pit hole type 3=modernSource of water 1=piped 2=not piped
Type of assets present in the householdType of asset Number Value
Transportation Car
Motorbike
Bicycle News media Radio
Radio cassette
Clock/watch
TV/videoHouse assets Tables
ChairsSofa set
95

WardrobeElectric ironWooded bedModern mattress
Own land
RefrigeratorPoultryLivestockMobile phoneSewing machine
Kitchen facilities Charcoal stoveKerosene stove
Local stove-mafigaFarm implements Tractor
Hand hoeBush knife/pangaAxes
Sprayer
Blower
Spade
Other assets…….
11. How did you acquire land? 1=inherited 2=Bought 3=village government4=others……...
Module B: Enterprise output, consumption and marketing
12. Give the amount (in kg) produced, consumed at home, sold and prices of thefollowing different crop enterprises in 2007/08 season.
F/s
ize-
Ha
Cro
p
U
nit
Qty
Con
sum
ed
Qty
Sol
d Qty
In s
tore To
tal
Pro
duce
d
Avg
Pri
ce
Gro
ssIn
com
e
Var
cos
ts
Net
Tot
alin
com
e Net
Cas
hin
com
e
AQt
B%
CQt
D%
EQt
F%
G=A+C+E
H I=GxH
J K=I-J
L=KxD
CashewCassava
96
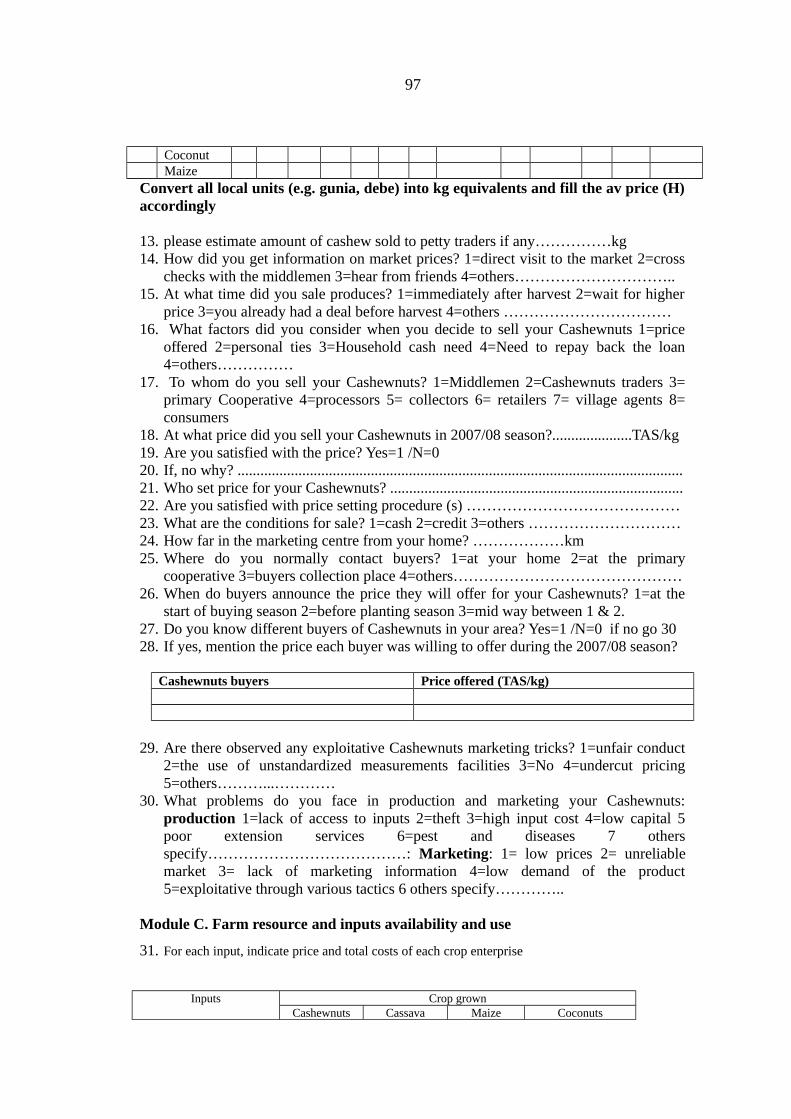
CoconutMaize
Convert all local units (e.g. gunia, debe) into kg equivalents and fill the av price (H)accordingly
13. please estimate amount of cashew sold to petty traders if any……………kg14. How did you get information on market prices? 1=direct visit to the market 2=cross
checks with the middlemen 3=hear from friends 4=others…………………………..15. At what time did you sale produces? 1=immediately after harvest 2=wait for higher
price 3=you already had a deal before harvest 4=others ……………………………16. What factors did you consider when you decide to sell your Cashewnuts 1=price
offered 2=personal ties 3=Household cash need 4=Need to repay back the loan4=others……………
17. To whom do you sell your Cashewnuts? 1=Middlemen 2=Cashewnuts traders 3=primary Cooperative 4=processors 5= collectors 6= retailers 7= village agents 8=consumers
18. At what price did you sell your Cashewnuts in 2007/08 season?.....................TAS/kg19. Are you satisfied with the price? Yes=1 /N=0 20. If, no why? .....................................................................................................................21. Who set price for your Cashewnuts? .............................................................................22. Are you satisfied with price setting procedure (s) ……………………………………23. What are the conditions for sale? 1=cash 2=credit 3=others …………………………24. How far in the marketing centre from your home? ………………km25. Where do you normally contact buyers? 1=at your home 2=at the primary
cooperative 3=buyers collection place 4=others………………………………………26. When do buyers announce the price they will offer for your Cashewnuts? 1=at the
start of buying season 2=before planting season 3=mid way between 1 & 2.27. Do you know different buyers of Cashewnuts in your area? Yes=1 /N=0 if no go 3028. If yes, mention the price each buyer was willing to offer during the 2007/08 season?
Cashewnuts buyers Price offered (TAS/kg)
29. Are there observed any exploitative Cashewnuts marketing tricks? 1=unfair conduct2=the use of unstandardized measurements facilities 3=No 4=undercut pricing5=others………...…………
30. What problems do you face in production and marketing your Cashewnuts:production 1=lack of access to inputs 2=theft 3=high input cost 4=low capital 5poor extension services 6=pest and diseases 7 othersspecify…………………………………: Marketing: 1= low prices 2= unreliablemarket 3= lack of marketing information 4=low demand of the product5=exploitative through various tactics 6 others specify…………..
Module C. Farm resource and inputs availability and use
31. For each input, indicate price and total costs of each crop enterprise
Inputs Crop grownCashewnuts Cassava Maize Coconuts
97
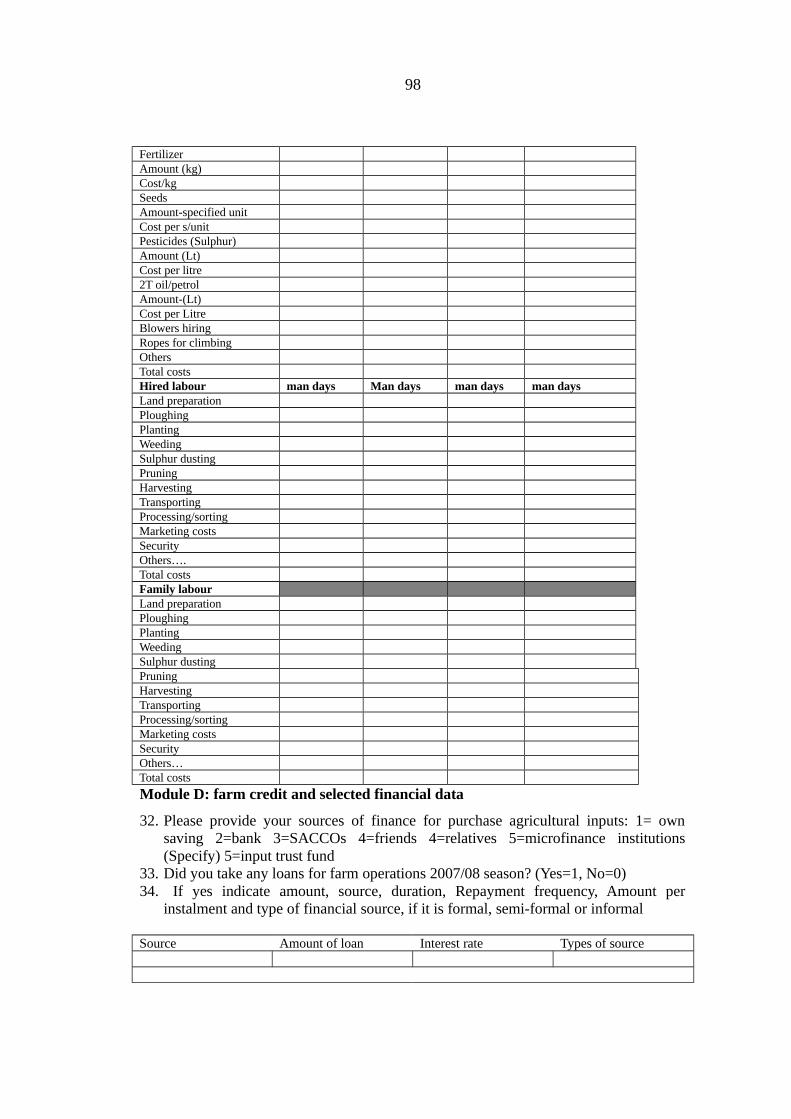
FertilizerAmount (kg)Cost/kgSeedsAmount-specified unitCost per s/unitPesticides (Sulphur)Amount (Lt)Cost per litre2T oil/petrolAmount-(Lt)Cost per LitreBlowers hiringRopes for climbingOthersTotal costsHired labour man days Man days man days man daysLand preparationPloughingPlantingWeedingSulphur dustingPruningHarvestingTransporting Processing/sortingMarketing costsSecurityOthers….Total costsFamily labourLand preparationPloughingPlantingWeedingSulphur dustingPruningHarvestingTransporting Processing/sortingMarketing costsSecurityOthers…Total costs
Module D: farm credit and selected financial data
32. Please provide your sources of finance for purchase agricultural inputs: 1= ownsaving 2=bank 3=SACCOs 4=friends 4=relatives 5=microfinance institutions(Specify) 5=input trust fund
33. Did you take any loans for farm operations 2007/08 season? (Yes=1, No=0)34. If yes indicate amount, source, duration, Repayment frequency, Amount per
instalment and type of financial source, if it is formal, semi-formal or informal
Source Amount of loan Interest rate Types of source
98

35. What is most important condition you were required to meet for obtaining the loan?1=farm record 2=collateral 3=witness 4=others……………………
36. If collateral in what form; 1=permanent structure e.g. House, movable assets e.g.Car, machinery, land, animals, any other valuable assets-mention
37. How do you access information on credit and availability? 1=media-specify,2=village authority, 3=Micro finance institutions, 4=private Cashewnuts companies,5=primary societies, 6=NGOs
38. Do you receive any advice on credit use in Cashewnuts production? (Yes=1, no=0)39. If yes from1=extension agent, 2=NGOs, 3=Micro finance institutions, 4=Neighbour,
5=others.
Module E: Farmers organization and support availability
40. Are you a member of one of the following organizations? Yes=1 no=0 ( if no go 43)1=SACCOs 2= farmer group 3=primary cooperative 4=others …………………………. 41. If yes, what benefits are delivered from these associations? 1=easy to acquire inputs
2= easy to market produces 3= easy to negotiate better price 4= others………………42. How can assess these organizations in facilitating marketing of your cashew?
1=helpful 2=not helpful43. If no, what is preventing you from joining or forming an organization 1=few
producers 2=no knowledge on dynamic of organization3=others…………………………….
44. Have you been visited by extension officers? Yes=1 /N=0 (if no go 47)45. What major kind of extension services did you receive? 1=growing of Cashewnuts
2=Cashewnuts marketing 3=pests and diseases control 4=others……………………46. Where do normally extension workers come from? 1=NGOs 2=government staff
3=others………………………………………………………………………………..
F. miscellaneous questions
47. In your opinion has Cashewnuts production increased or decreased in the past twoyears: 1= Increased 2= decreased 3=remained the same
48. If increased give reasons for your answer above; 1=Increased extension services 2=more readily available of inputs3= reliable market outlets 4=other reason………49. Besides income received from crop production, do you have any other sources of
income? Yes=1 /N=0 , 50. If yes, specify the sources and estimate amount earned.
Source Amount earned
PART TWO: TRADERS QUESTIONS
G. Traders’ basic information and trading practices
51. Name of organization/trader…………………………………………..
99
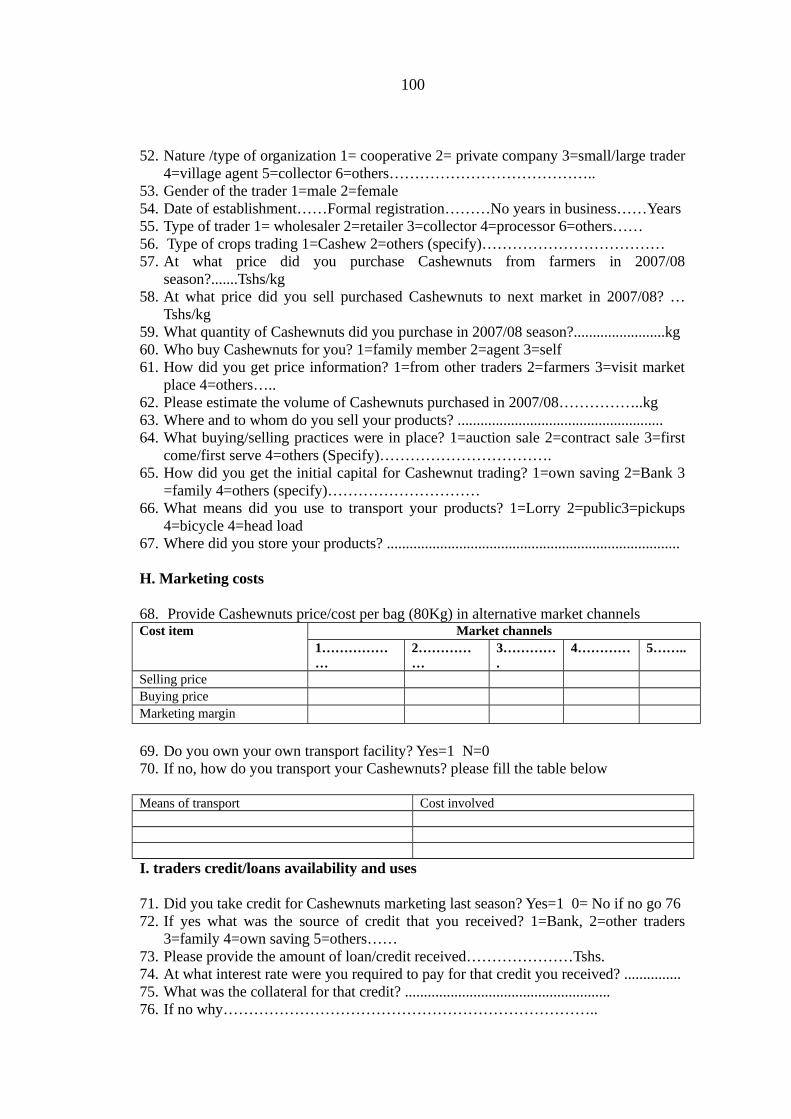
52. Nature /type of organization 1= cooperative 2= private company 3=small/large trader4=village agent 5=collector 6=others…………………………………..
53. Gender of the trader 1=male 2=female54. Date of establishment……Formal registration………No years in business……Years55. Type of trader 1= wholesaler 2=retailer 3=collector 4=processor 6=others……56. Type of crops trading 1=Cashew 2=others (specify)………………………………57. At what price did you purchase Cashewnuts from farmers in 2007/08
season?.......Tshs/kg58. At what price did you sell purchased Cashewnuts to next market in 2007/08? …
Tshs/kg59. What quantity of Cashewnuts did you purchase in 2007/08 season?........................kg60. Who buy Cashewnuts for you? 1=family member 2=agent 3=self61. How did you get price information? 1=from other traders 2=farmers 3=visit market
place 4=others…..62. Please estimate the volume of Cashewnuts purchased in 2007/08……………..kg63. Where and to whom do you sell your products? ......................................................64. What buying/selling practices were in place? 1=auction sale 2=contract sale 3=first
come/first serve 4=others (Specify)…………………………….65. How did you get the initial capital for Cashewnut trading? 1=own saving 2=Bank 3
=family 4=others (specify)………………………… 66. What means did you use to transport your products? 1=Lorry 2=public3=pickups
4=bicycle 4=head load67. Where did you store your products? .............................................................................
H. Marketing costs
68. Provide Cashewnuts price/cost per bag (80Kg) in alternative market channelsCost item Market channels
1………………
2……………
3………….
4………… 5……..
Selling priceBuying priceMarketing margin
69. Do you own your own transport facility? Yes=1 N=0 70. If no, how do you transport your Cashewnuts? please fill the table below
Means of transport Cost involved
I. traders credit/loans availability and uses
71. Did you take credit for Cashewnuts marketing last season? Yes=1 0= No if no go 7672. If yes what was the source of credit that you received? 1=Bank, 2=other traders
3=family 4=own saving 5=others……73. Please provide the amount of loan/credit received…………………Tshs.74. At what interest rate were you required to pay for that credit you received? ...............75. What was the collateral for that credit? ......................................................76. If no why………………………………………………………………..
100

J. Traders’ problems
77. What are the most serious problems you face in carrying out activities as a trader?
Problems Causes Possible solutions
THANK YOU, FOR YOUR COOPERATION
Appendix 2: Correlation between prices and marketing margin
Correlation Market margin Selling price Producer priceMarket margin 0.000 0.665** 0.267
(P=0.003) (P=0.467)Selling price 0.000 0.146
(P=0.565)Producer price 0.000** Means that selling price is positively correlated with market margin (P < 0.05).
101