CASH MARKET TRANSACTION SURVEY 2011/12 - HKEx
19
February 2013 Research & Policy CASH MARKET TRANSACTION SURVEY 2011/12
Transcript of CASH MARKET TRANSACTION SURVEY 2011/12 - HKEx

February 2013
Research & Policy
CASH MARKETTRANSACTION SURVEY 2011/12

CASH MARKET TRANSACTION SURVEY 2011/12
CONTENTS
Page
Executive summary .................................................................................................................. 1
1. Introduction ..................................................................................................................... 3
2. Distribution of market trading value by investor type .................................................... 4
2.1 The pattern in 2011/12 ............................................................................................ 4
2.2 Historical trend ....................................................................................................... 6
3. Distribution of overseas investor trading value by origin ............................................... 9
3.1 The pattern in 2011/12 ............................................................................................ 9
3.2 Historical trend ..................................................................................................... 11
4. Retail online trading ...................................................................................................... 13
Glossary ........................................................................................................................ 14
Appendix 1. Representativeness of the responded sample vis-à-vis the target population
of Exchange Participants ................................................................................ 15
Appendix 2. Survey methodology ....................................................................................... 16

CASH MARKET TRANSACTION SURVEY 2011/12 1
EXECUTIVE SUMMARY
The Cash Market Transaction Survey (CMTS) has been conducted annually since 1991 to study the
trading composition of Stock Exchange Participants (EPs). The main objective is to understand the
relative contribution of trading value in the HKEx securities market, including the Main Board and the
Growth Enterprise Market (GEM), by investor type. The market share of online trading is also
assessed.
The 2011/12 survey covered EPs’ transactions on both the Main Board and GEM for the 12-month
period from October 2011 to September 2012 (referred to as 2011/12). The overall response rate was
94% by number of EPs or 98% by turnover value in the target population.
The key survey findings are summarised below.
Trading value by investor type (See section 2)
(1) The total market turnover during 2011/12 decreased by 29% from 2010/11. All types of
trading recorded year-on-year decreases, the second time in the past decade after 2008/09. The
most significant drop was observed in local retail investor trading (down 45%) and the least was
in EP principal trading (down 6%).
(2) In 2011/12, overseas investors contributed 46% to total market turnover (similar to their
contribution in 2010/11) while local investors contributed a record low of 38% (down from 42%
in 2010/11). This was the third consecutive year overseas investors’ contribution surpassed
local investors’ contribution.
(3) Overseas investor trading came mainly from institutions (42% of total market turnover). Local
investor trading also came mainly from institutions (21% of total market turnover), surpassing
local retail investor trading (17%) in 2011/12.
(4) In 2011/12, institutional investors (local and overseas) contributed 63% to total market turnover
(62% in 2010/11) while retail investors (local and overseas) contributed 21%, down from 27% in
2010/11.
(5) The contribution of EP principal trading in 2011/12 increased for the fifth consecutive year to a
record high of 15%, up from 12% in 2010/11. Over the past decade, EP principal trading grew
at a compound annual growth rate (CAGR) of 46% — the highest among all types of trading.
Overseas investor trading (See section 3)
(6) In 2011/12, the main contributors to overseas investor trading were US investors (32%, up from
28% in 2010/11). They were followed by UK investors (25%, down from 27% in 2010/11) and
Continental European investors (12%, down from 14% in 2010/11).
(7) Asian investors in aggregate contributed 21% of total overseas investor trading in 2011/12,
compared to 22% in the previous year. Mainland investors were the largest contributor group
in Asia (8%, down from 10% in 2010/11), followed by Singaporean investors (7%, similar to
their contribution in 2010/11).
(8) Trading from US, UK, Continental Europe and Australia came predominantly from institutional
investors (over 93%). Trading from Mainland China, on the other hand, had a significant
proportion (at least 43%) coming from retail investors.

CASH MARKET TRANSACTION SURVEY 2011/12 2
(9) In 2011/12, investor trading value from all overseas origins saw double-digit percentage
decreases year-on-year. Trading from both Europe and Asia recorded significant decreases of
over 30%. In particular, the 39% drop in trading from Mainland China was the biggest among
all overseas origins.
(10) Over the past decade, overseas investor trading from the US grew at a CAGR of 32%, higher
than the CAGRs of investor trading from Europe (22%) and Asia (26%). Despite a sharp
year-on-year decrease in 2011/12, investor trading from Mainland China still recorded a CAGR
of 28% in the past decade, higher than that of the total overseas investor trading (26%).
Retail online trading (See section 4)
(11) In 2011/12, retail online trading accounted for 34% of total retail investor trading (up from 26%
in 2010/11) and 7% of total market turnover (similar to that in 2010/11).

CASH MARKET TRANSACTION SURVEY 2011/12 3
1. INTRODUCTION
The Cash Market Transaction Survey (CMTS) has been conducted annually since 1991 to study the
trading composition of Stock Exchange Participants (EPs). The main objective is to understand the
relative contribution of trading value in the HKEx securities market, including the Main Board and the
Growth Enterprise Market (GEM), by investor type (see classification chart below). The market
share of online trading1 is also assessed.
Classification of Stock Exchange Participants’ trading
The CMTS 2011/12 covered EPs’ transactions on both the Main Board and GEM for the 12-month
period from October 2011 to September 2012.2
In October 2012, survey questionnaires were mailed to 484 EPs in the target population. Out of the
484 questionnaires sent, 453 completed questionnaires were received, representing an overall response
rate of 94% by number or 98% by turnover value in the target population.3
1 Please refer to “Glossary” for definition.
2 Referred to as the year 2011/12 throughout the report; the same convention is used for the past surveys.
3 See Appendix 2 for details of the survey methodology.
U.S.
Participants’ trading on the Exchange
Agency Principal
Overseas Local
Institutional Retail
Local Overseas
Europe (ex U.K.) U.K. Taiwan Mainland China Japan Rest of Asia Australia Singapore Others

CASH MARKET TRANSACTION SURVEY 2011/12 4
2. DISTRIBUTION OF MARKET TRADING VALUE
BY INVESTOR TYPE
The total turnover value of the HKEx securities market in 2011/12 decreased by 29% from a year ago
to HK$14 trillion. All types of investor trading as well as EP principal trading recorded year-on-year
decreases as implied from survey findings. Local retail investor trading recorded the biggest drop in
value while EP principal trading recorded the smallest drop. As a result, the contribution of local
retail investors to total trading value decreased significantly in 2011/12, with a corresponding increase
in the contribution of EP principal trading.
2.1 The pattern in 2011/12
Overseas investors maintained their dominance over local investors in the contribution to total market
turnover for the third consecutive year — 46% in 2011/12, similar to their level in 2010/11. Most of
their trading came from overseas institutional investors, who contributed 42% (similar to their
contribution in 2010/11). Overseas retail investors contributed 4%, similar to 2010/11.
The contribution of local investors to total market turnover further decreased from 42% in 2010/11 to
a record low of 38%. Among them, local retail investors contributed 17% (22% in 2010/11),
overtaken by local institutional investors’ 21% (20% in 2010/11).
Local and overseas institutional investors in aggregate contributed 63% to total market turnover in
2011/12, compared to 62% in 2010/11. Local and overseas retail investors contributed in aggregate
21% of total market turnover in 2011/12, down from 27% in 2010/11.
Figure 1. Distribution of cash market trading value by investor type
(Oct 2011 – Sep 2012)
Note: Numbers may not add up to 100% due to rounding.
Local retail investors
(17.2%)
[2010/11: 22.3%]
Local institutional
investors
(21.3%)
[2010/11: 19.9%]
Overseas retail investors
(3.9%)
[2010/11: 4.4%]
Overseas institutional
investors
(42.2%)
[2010/11: 41.7%]
EP principal
trading
(15.5%)
[2010/11: 11.7%]
Distribution of cash market trading value by investor type (Oct 2011 - Sep 2012)
Note: Numbers may not add up to 100% due to rounding.

CASH MARKET TRANSACTION SURVEY 2011/12 5
The contribution of EP principal trading rose to a record high of 15% in 2011/12 from 12% in
2010/11. Investor trading contributed 85% to total market trading. Of this, institutional investor
trading had a larger share (75%) than retail investor trading and overseas investor trading had a larger
share (54%) than local investor trading.
Institutional investor trading came mostly from overseas (66%, down from 68% in 2010/11) while
retail investor trading came predominantly from local sources (82%, compared to 83% in 2010/11).
More than half of local investor trading came from institutional investors (55%, up from 47% in
2010/11), while overseas investor trading came predominantly from institutions (92%, compared to
90% in 2010/11).
(See Table 1.)
Table 1. Breakdown of contribution by type of trade in cash market
(2009/10 – 2011/12)
Type of trade 2009/10 2010/11 2011/12
All trading
Investor trading 90.08 88.27 84.51
EP principal trading 9.92 11.73 15.49
100.00 100.00 100.00
Investor trading
Retail 28.61 30.23 24.93
Institutional 71.39 69.77 75.07
100.00 100.00 100.00
Investor trading
Local 48.60 47.78 45.53
Overseas 51.40 52.22 54.47
100.00 100.00 100.00
Retail investor trading
Local 82.55 83.39 81.64
Overseas 17.45 16.61 18.36
100.00 100.00 100.00
Institutional investor trading
Local 35.00 32.36 33.54
Overseas 65.00 67.64 66.46
100.00 100.00 100.00
Local investor trading
Retail 48.59 52.75 44.70
Institutional 51.41 47.25 55.30
100.00 100.00 100.00
Overseas investor trading
Retail 9.72 9.62 8.40
Institutional 90.28 90.38 91.60
100.00 100.00 100.00

CASH MARKET TRANSACTION SURVEY 2011/12 6
2.2 Historical trend
Figure 2 shows the distribution of cash market trading value by investor type over the past decade.
Overseas institutional investors have become the dominant traders in the market since early 2000s.
Their contribution gradually increased to over 40% in the 2010s, double the respective contribution
from local retail investors and local institutional investors. Over the past decade, they contributed
39% to the cumulative market turnover. Together with overseas retail investors, overseas investors
contributed 43% to the cumulative market turnover.
Over the past decade, local investors still contributed more (48%) to the cumulative market turnover
than overseas investors. However, the contribution of local investors as a whole fell to a record low
of 38% in 2011/12. The 17% contribution of local retail investors in 2011/12 was also the lowest on
record.
Figure 2. Distribution of cash market trading value by investor type (2002/03 – 2011/12)
Note: Numbers may not add up to sub-totals or 100% due to rounding.
3034
30 27 28 26 2521 22
1724
2822
2726 25 27 24
23 2021
24
4 3 23 4 3
4
4 44
4
3533 34 39 39 38
3842 42
42
39
3 7 8 5 4 6 8 10 1215
9
0%
10%
20%
30%
40%
50%
60%
70%
80%
90%
100%
2002/03 2003/04 2004/05 2005/06 2006/07 2007/08 2008/09 2009/10 2010/11 2011/12
% o
f to
tal
mar
ket
turn
over
Distribution of cash market trading value by investor type (2002/03 - 2010/12)
Local retail investors Local institutional investors Overseas retail investors
Overseas institutional investors EP principal trading
2002/2012
(cumulative)
Note: Numbers may not add up to 100% due to rounding.
Distribution of cash market trading by type of trade (% )
2002/2012
cumulative
market
Type of trade 2002/03 2003/04 2004/05 2005/06 2006/07 2007/08 2008/09 2009/10 2010/11 2011/12 turnover (% )
EP principal trading 3.49 6.89 7.57 5.41 4.15 6.12 8.49 9.92 11.73 15.49 8.61
Overseas investor trading 38.84 36.34 36.14 41.47 43.10 41.49 41.84 46.30 46.09 46.03 43.23
Retail 4.10 3.36 2.34 2.96 3.81 3.24 4.32 4.50 4.43 3.87 3.85
Institutional 34.73 32.99 33.80 38.51 39.30 38.25 37.52 41.80 41.66 42.16 39.38
Local investor trading 57.67 56.77 56.30 53.12 52.75 52.39 49.66 43.78 42.18 38.48 48.16
Retail 29.69 34.29 29.78 27.34 27.50 25.88 25.20 21.27 22.25 17.20 24.40
Institutional 27.98 22.48 26.51 25.78 25.24 26.51 24.46 22.51 19.93 21.28 23.76
CASH MARKET TRANSACTION SURVEY 2011/12 7
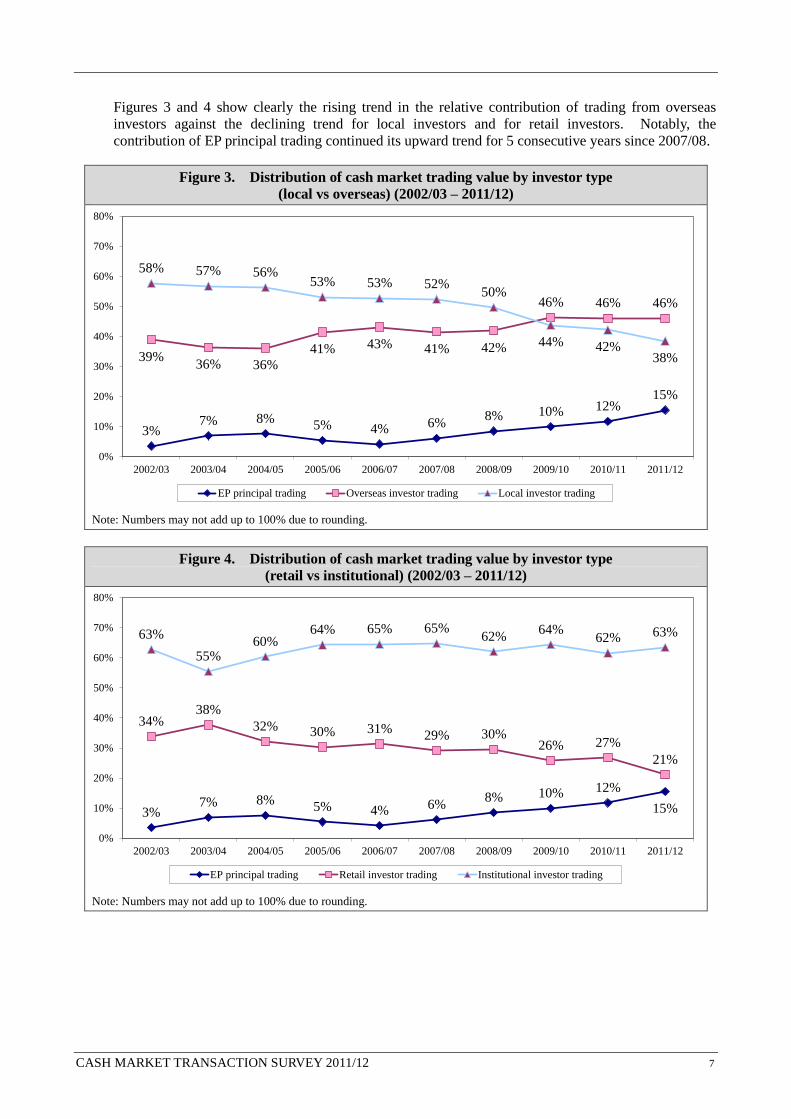
Figures 3 and 4 show clearly the rising trend in the relative contribution of trading from overseas
investors against the declining trend for local investors and for retail investors. Notably, the
contribution of EP principal trading continued its upward trend for 5 consecutive years since 2007/08.
Figure 3. Distribution of cash market trading value by investor type
(local vs overseas) (2002/03 – 2011/12)
Note: Numbers may not add up to 100% due to rounding.
Figure 4. Distribution of cash market trading value by investor type
(retail vs institutional) (2002/03 – 2011/12)
Note: Numbers may not add up to 100% due to rounding.
3%7% 8%
5% 4% 6%8% 10% 12%
15%
39%36% 36%
41% 43% 41% 42%
46% 46% 46%
58% 57% 56%53% 53% 52%
50%
44% 42%38%
0%
10%
20%
30%
40%
50%
60%
70%
80%
2002/03 2003/04 2004/05 2005/06 2006/07 2007/08 2008/09 2009/10 2010/11 2011/12
Distribution of cash market trading value by type of investor (local vs overseas)
(2002/03 - 2011/12)
EP principal trading Overseas investor trading Local investor trading
3%7% 8%
5% 4% 6%8% 10% 12%
15%
34%38%
32% 30% 31%29% 30%
26% 27%
21%
63%
55%60%
64% 65% 65%62%
64%62% 63%
0%
10%
20%
30%
40%
50%
60%
70%
80%
2002/03 2003/04 2004/05 2005/06 2006/07 2007/08 2008/09 2009/10 2010/11 2011/12
Distribution of cash market trading value by type of investor (retail vs institutional)
(2002/03 - 2011/12)
EP principal trading Retail investor trading Institutional investor trading

CASH MARKET TRANSACTION SURVEY 2011/12 8
In 2011/12, against the backdrop of a 29% decrease in total market turnover value, EP principal
trading and all types of investor trading experienced year-on-year decreases in value terms4, the
second time in the past decade after 2008/09. Significant drop was observed in retail investor trading
(down 35%), particularly in local retail investors (down 45%) while EP principal trading recorded the
smallest year-on-year decrease (down 6%). The trading of overseas retail investors also decreased
significantly by 38%. A drop of over 26% in institutional investor trading was recorded — down
28% for overseas institutional investors and 24% for local institutional investors.
Despite the decline, the total market turnover in 2011/12 was still substantially higher than the level a
decade ago and recorded a compound annual growth rate (CAGR) of 24%. Among different types of
trading, EP principal trading grew at the highest CAGR of 46%. Overseas institutional investor
trading had a CAGR of 27%, higher than that of the market total.
Figure 5. Implied value of cash market trading by investor type (2002/03 – 2011/12)
4 Implied trading value is calculated based on the survey responses and the total market turnover value.
0
2,500
5,000
7,500
10,000
12,500
15,000
17,500
20,000
22,500
25,000
2002/03 2003/04 2004/05 2005/06 2006/07 2007/08 2008/09 2009/10 2010/11 2011/12
HK$ bil
Implied value of cash market trading by type of trade (2002/03 - 2011/12)
EP principal trading
Overseas institutional investors
Overseas retail investors
Local institutional investors
Local retail investors
Year-on-year % change 2002/2012
Type of trade 2002/03 2003/04 2004/05 2005/06 2006/07 2007/08 2008/09 2009/10 2010/11 2011/12 CAGR
EP principal trading -39.93 280.48 29.88 8.23 80.90 110.00 -11.68 26.87 42.32 -5.78 46.21
Overseas investor trading 19.75 80.54 17.57 73.87 144.94 36.98 -35.79 20.19 19.79 -28.74 26.26
Retail 96.42 57.87 -17.53 91.51 202.90 21.08 -15.04 13.06 18.57 -37.74 23.09
Institutional 14.47 83.21 21.14 72.65 140.48 38.52 -37.54 21.01 19.92 -27.78 26.60
Local investor trading 17.16 89.91 17.25 42.96 134.03 41.35 -39.65 -4.25 15.92 -34.91 18.45
Retail 4.55 122.84 2.70 39.06 137.13 33.93 -38.02 -8.30 25.85 -44.85 16.61
Institutional 34.35 54.97 39.45 47.35 130.74 49.44 -41.24 -0.07 6.54 -23.81 20.19
Retail investor trading 10.85 114.95 0.89 42.88 143.56 32.36 -35.46 -5.17 24.58 -43.67 17.56
Institutional investor trading 22.56 70.61 28.56 61.53 136.57 42.79 -39.06 12.69 15.23 -26.50 24.06
Total 14.33 92.92 18.24 51.50 135.68 42.31 -36.33 8.62 20.33 -28.65 23.90

CASH MARKET TRANSACTION SURVEY 2011/12 9
3. DISTRIBUTION OF OVERSEAS INVESTOR
TRADING VALUE BY ORIGIN
3.1 The pattern in 2011/12
Overseas investor trading contributed 46% to total market trading in 2011/12. Among the different
overseas origins, US investors contributed the most — 32% of overseas investor trading in 2011/12
(up from 28% in 2010/11), or 15% of total market trading (compared to 13% in 2010/11). The
second largest contributors were UK investors who had a contribution of 25% (down from 27% in
2010/11), or 12% of total market trading (compared to 13% in 2010/11). In 2011/12, the contribution
from Continental European investors was 12% (down from 14% in 2010/11), or 6% of total market
trading (similar to 2010/11). The aggregate contribution from Europe decreased to 37% in 2011/12
(down from 41% in 2010/11), or 17% of total market trading (down from 19% in 2010/11).
In 2011/12, Asian investors contributed in aggregate 21% of total overseas investor trading (compared
to 22% in 2010/11) or 10% of total market trading (similar to 2010/11). Mainland investors
continued to be the largest contributors among Asian investors with a contribution of 8% (down from
10% in 2010/11), or 4% of total market trading (compared to 5% in 2010/11). They were followed
by Singaporean investors who contributed 7% in 2011/12 (similar to 2010/11) or 3% of total market
trading (also similar to 2010/11). The contribution from Australian investors in 2011/12 was 6%
(compared to 5% in 2010/11) or 3% of total market trading (similar to 2010/11).
Figure 6. Distribution of overseas investor trading value in cash market by origin
(Oct 2011 – Sep 2012)
# In 2011/12, reported origins in “Rest of Asia” were
Bangladesh, Brunei, Cambodia, India, Indonesia,
Kazakhstan, Macau, Malaysia, Mongolia, Myanmar,
Pakistan, Philippines, South Korea, Sri Lanka,
Thailand and Vietnam.
* In 2011/12, reported origins in “Others” included
Algeria, Anguilla, Bahamas, Bahrain, Belize,
Bermuda, Brazil, British Virgin Islands, Canada,
Cayman Islands, Channel Islands, Chile, Colombia,
Côte d'Ivoire, Cyprus, Dutch Antilles, Grenada,
Israel, Kenya, Kuwait, Liberia, Mauritius, Mexico,
New Zealand, Oman, Panama, Russia, Samoa, Saudi
Arabia, Seychelles, South Africa, Turkey, United
Arab Emirates, Uruguay and Venezuela.
Note: Numbers may not add up to 100% due to rounding.
US
(32.3%)
[2010/11: 27.7%]
UK
(25.4%)
[2010/11: 27.3%]
Europe (excluding UK)
(12.1%)
[2010/11: 13.9%]
Japan
(1.7%)
[2010/11: 1.9%]
Mainland China
(8.5%)
[2010/11: 9.9%]
Taiwan
(1.1%)
[2010/11: 1.1%]
Singapore
(7.0%)
[2010/11: 6.6%]
Rest of Asia#
(2.9%)
[2010/11: 2.7%]
Australia
(6.2%)
[2010/11: 5.5%]
Others*
(2.9%)
[2010/11: 3.3%]
Distribution of overseas investor trading in cash market by origin (Oct 2011 - Sep 2012)
# In 2011/12, reported origins in "Rest of Asia" were Bangladesh, Brunei, Cambodia, India, Indonesia, Kazakhstan, Macau, Malaysia, Mongolia, Myanmar, Pakistan,
Philippines, South Korea, Sri Lanka, Thailand and Vietnam.* In 2011/12, reported origins in "Others" included Algeria, Anguilla, Bahamas, Bahrain, Belize, Bermuda, Brazil, British Virgin Islands, Canada, Cayman Islands,
Channel Islands, Chile, Colombia, Côte d'Ivoire, Cyprus, Dutch Antilles, Grenada, Israel, Kenya, Kuwait, Liberia, Mauritius, Mexico, New Zealand, Oman, Panama, Russia,
Samoa, Saudi Arabia, Seychelles, South Africa, Turkey, United Arab Emirates, Uruguay and Venezuela.
Note: Numbers may not add up to 100% due to rounding.

CASH MARKET TRANSACTION SURVEY 2011/12 10
Figure 7. Distribution of cash market trading value by local and overseas origin
(Oct 2011 – Sep 2012)
* Others comprise investors from Japan, Taiwan, Rest of Asia and Rest of the World.
Note: Numbers may not add up to 100% due to rounding.
Although the survey did not ask for a breakdown by retail/institutional investor for each overseas
origin, a minimum proportion of retail/institutional investor trading from each origin could be deduced
from EPs’ responses. Overseas investor trading from the US, UK and Australia came
predominantly from institutional investors (over 96%), and so were those from Continental Europe
(over 93%), Singapore (over 84%) and Japan (over 70%). For trading from Mainland China, at
least 42% came from retail investors and at least 30% came from institutional investors. From the
implied value of trading, at least 43% of total overseas retail investor trading came from Mainland
China, and at least 34% and 26% of total overseas institutional investor trading came from the US and
UK respectively. (See Table 2.)
Table 2. Minimum proportion of retail/institutional investor trading from
each overseas origin (2011/12)
Origin
Minimum proportion of the trading coming from
Retail investors Institutional investors
US 0.4% 96.8%
UK 0.1% 96.0%
Europe (excl. UK) 0.1% 93.5%
Japan 3.6% 70.9%
Mainland China 42.7% 30.4%
Taiwan 10.8% 37.8%
Singapore 0.7% 84.3%
Australia 0.3% 96.1%
Note: The minimum proportions were deduced figures from the responses. The difference between 100% and the
summation of the two figures for an origin represents the proportion of trading from that origin which could come
from either retail or institutional investors.
EP principal trading
(15.5%)
[2010/11: 11.7%]
Local investors
(38.5%)
[2010/11: 42.2%]US
(14.9%)
[2010/11: 12.8%]
UK
(11.7%)
[2010/11: 12.6%]
Europe (excluding UK)
(5.5%)
[2010/11: 6.4%]
Mainland China
(3.9%)
[2010/11: 4.6%]
Singapore
(3.2%)
[2010/11: 3.1%]
Australia
(2.8%)
[2010/11: 2.5%] Others*
(4.0%)
[2010/11: 4.2%]
Distribution of cash market trading value by origin (Oct 2011 - Sep 2012)
* Others comprise investors from Japan, Taiwan, Rest of Asia and Rest of the World.
Note: Numbers may not add up to 100% due to rounding.

CASH MARKET TRANSACTION SURVEY 2011/12 11
3.2 Historical trend
Figure 8 shows the distribution of overseas investor trading by origin over the past decade. The main
contributors to total overseas investor trading during this period were investors from the US, UK and
Continental Europe. Since 2003/04, investors from the US and UK have maintained a dominant
aggregate contribution of over 50%. Investors from Continental Europe were the third largest
contributor most of the time in the decade but their contribution has shrunk to below 20% since
2006/07.
The contribution of Asian investors hovered at around 20% for most of the past decade and climbed to
more than a quarter in 2008/09 and 2009/10. The dominant contributors in Asia were investors from
Mainland China and Singapore. Since 2006/07, Mainland investors have surpassed Singaporean
investors and became the largest contributor from Asia.
Figure 8. Distribution of overseas investor trading in cash market by origin
(2002/03 – 2011/12)
Notes:
(1) Australia was included in "Others" in surveys prior to 2007/08.
(2) Numbers may not add up to sub-totals or 100% due to rounding.
22 2529 26
2935 36
2428
32
25
2825
24
27
2223
2927
25
24
24 2223
1616 10
16 1412
4
3 33
43
2 3 2 2
8
75
5 88
12 11 10 8
1
11 1 1 1 1
1 1 1
9
88
9 78 8 9
7 7
2
11 2 2
2 3 3
3 3
3 2 25 6
73
6 6 72 2 3 3 3
0%
10%
20%
30%
40%
50%
60%
70%
80%
90%
100%
2002/03 2003/04 2004/05 2005/06 2006/07 2007/08 2008/09 2009/10 2010/11 2011/12
% o
f o
ver
seas
in
ves
tor
trad
ing
Distribution of overseas investor trading in cash market by origin (2002/03 - 2011/12)
US UK Europe (excluding UK) Japan Mainland China Taiwan Singapore Rest of Asia Australia Others
Notes:
(1) Australia was included in "Others" in surveys prior to 2007/08.
(2) Numbers may not add up to 100% due to rounding.
Distribution of overseas investor trading by origin (% )
Overseas origin 2002/03 2003/04 2004/05 2005/06 2006/07 2007/08 2008/09 2009/10 2010/11 2011/12
US 21.81 24.61 28.75 26.08 29.19 35.13 36.31 24.37 27.75 32.27
Europe 49.13 52.57 47.31 47.03 42.12 38.51 33.84 44.81 41.23 37.41
UK 25.45 28.13 24.82 24.40 26.61 22.46 23.35 28.68 27.32 25.35
Europe (excluding UK) 23.68 24.44 22.50 22.64 15.51 16.05 10.49 16.13 13.91 12.05
Asia 22.11 19.77 17.53 20.73 21.52 21.52 25.58 26.56 22.27 21.23
Japan 3.66 3.13 2.56 3.33 3.69 3.39 1.92 2.58 1.90 1.74
Mainland China 7.50 6.65 5.41 5.44 8.22 7.75 11.86 10.55 9.92 8.49
Taiwan 0.83 0.66 0.92 0.96 1.36 0.89 1.11 1.03 1.09 1.08
Singapore 8.57 8.40 7.80 8.95 6.63 7.55 7.69 9.28 6.63 6.97
Rest of Asia 1.54 0.93 0.83 2.06 1.63 1.94 3.00 3.11 2.73 2.95
Australia 2.85 1.81 1.60 5.47 6.15
Others 6.95 3.05 6.40 6.15 7.17 1.99 2.46 2.66 3.28 2.95
Total 100.00 100.00 100.00 100.00 100.00 100.00 100.00 100.00 100.00 100.00

CASH MARKET TRANSACTION SURVEY 2011/12 12
In 2011/12, overseas investor trading decreased by 29% from 2010/11 in value terms, almost offsetting
the entire two-year rebound after the precipitous fall in 2008/09 amid the Global Financial Crisis.
This was the second time in the past decade, after 2008/09, in which investor trading from all overseas
origins recorded year-on-year decreases. The decreases in trading from Europe and Asia were
significant (both over 30%). In particular, the 39% drop in trading from Mainland China was the
biggest among all overseas origins.
Over the past decade, overseas investor trading from the US grew at a CAGR of 32%, higher than the
CAGRs of investor trading from Europe (22%) and Asia (26%). Despite a sharp year-on-year
decrease, investor trading from Mainland China still recorded a CAGR of 28% in the past decade,
higher than that of the total overseas investor trading (26%).
Figure 9. Implied value of overseas investor trading in cash market by origin
(2002/03 – 2011/12)
Notes:
(1) Australia was included in "Others" in surveys prior to 2007/08, for which year-on-year percentage change in implied value
of investor trading was not available. The CAGR of trading from Australian investors was calculated for the period
starting from 2007/08 when data for this origin was available. Since “Australia” was spun off from “Others” during the
ten-year period, CAGR for “Others” had to be interpreted with care.
(2) The substantial growth in trading from Australia in 2010/11 was due to a change in reporting by an EP, who reported a
substantial contribution to its trading from its sister company in Australia in 2010/11 while in past surveys, this kind of trading carried out for its corporate group was reported as its principal trading.
0
1,000
2,000
3,000
4,000
5,000
6,000
7,000
8,000
9,000
10,000
2002/03 2003/04 2004/05 2005/06 2006/07 2007/08 2008/09 2009/10 2010/11 2011/12
HK$ bil
Implied value of overseas investor trading in cash market by origin (2002/03 - 2011/12)
US UK Europe (excluding UK) Japan Mainland China Taiwan Singapore Rest of Asia Australia Others
Notes:
(1) The implied value of trading from a particular origin is determined by first calculating the implied overseas agency trading value during the study period
for that year of survey, and then multiplying it by the percentage contribution to overseas agency trading by that origin as obtained from the survey.
(2) Australia was included in "Others" in surveys prior to 2007/08.
Year-on-year % change 2002/2012
Overseas origin 2002/03 2003/04 2004/05 2005/06 2006/07 2007/08 2008/09 2009/10 2010/11 2011/12 CAGR
US 11.56 103.65 37.35 57.74 174.18 64.82 -33.62 -19.36 36.41 -17.13 31.88
Europe 15.35 93.18 5.81 72.84 119.34 25.24 -43.58 59.19 10.20 -35.34 22.50
UK 10.67 99.55 3.73 70.94 167.18 15.59 -33.25 47.65 14.08 -33.86 26.21
Europe (excluding UK) 20.83 86.34 8.21 74.94 67.79 41.80 -58.04 84.86 3.29 -38.25 17.14
Asia 31.93 61.44 4.25 105.56 154.28 36.96 -23.67 24.78 0.47 -32.09 25.69
Japan 52.19 54.08 -3.55 125.46 171.62 25.94 -63.67 61.76 -11.63 -35.04 16.22
Mainland China 117.55 60.14 -4.42 74.77 270.15 29.16 -1.67 6.89 12.57 -38.97 28.02
Taiwan -40.66 43.58 64.20 80.19 246.84 -9.74 -20.58 12.29 26.57 -29.57 29.95
Singapore 76.82 9.26 99.33 81.53 55.86 -34.52 44.96 -14.36 -25.13 23.39
Rest of Asia -83.77 9.39 4.63 330.99 93.48 63.27 -0.93 24.78 5.08 -22.94 35.69
Australia(1),(2)
-59.26 6.39 309.19 -19.83 9.20
Others(2)
50.98 -20.69 146.76 67.10 185.15 -61.96 -20.48 29.91 47.67 -36.05 14.79
Total 19.75 80.54 17.57 73.87 144.94 36.98 -35.79 20.19 19.79 -28.74 26.26

CASH MARKET TRANSACTION SURVEY 2011/12 13
4. RETAIL ONLINE TRADING
There were 245 EPs reporting themselves as online brokers in 2011/12. This was equivalent to 54%
of all responding EPs, up from 48% (or 209 EPs) in 2010/11. Retail online trading contributed 22%
to the total turnover value of online brokers in 2011/12, experiencing an upward trend since 2007/08.
Retail online trading accounted for 34% of total retail investor trading in 2011/12, compared to 26%
in 2010/11. It accounted for 7% of total market turnover, similar to the proportion in 2010/11. In
value terms, retail online trading decreased by 27% in 2010/11, compared to the 29% decrease of the
total market turnover.
Figure 10. Percentage share of retail online trading value in cash market
(2002/03 – 2011/12)
Note: One EP which had a significant proportion of its total turnover as retail agency trading and reported high percentage share
of retail online trading prior to 2010/11 did not provide the percentage share of its retail online trading since 2010/11.
This EP was excluded from the responded sample in calculating retail online trading in percentage and value terms since
then.
Table 3. Statistics on retail online trading in cash market (2007/08 – 2011/12)
2007/08 2008/09 2009/10 2010/11 2011/12
Responded sample size 404 410 409 431 453
Online brokers(1),(2)
2007/08 2008/09 2009/10 2010/11 2011/12
Number of online brokers 155 173 185 209 245
- As % of all responding EPs 38% 42% 45% 48% 54%
Online trading(2)
2007/08 2008/09 2009/10 2010/11 2011/12
Total implied trading value (HK$m) 1,156,321 921,416 1,095,691 1,252,109 919,187
- As % of total market turnover 5.06% 6.34% 6.94% 6.59% 6.78%
- As % of all agency (investor) trading 5.39% 6.92% 7.70% 7.50% 8.11%
- As % of total retail investor trading 17.38% 21.46% 26.91% 25.82% 33.75%
- As % of total turnover of online brokers 15.39% 16.48% 17.12% 18.35% 22.39%
Notes:
(1) “Online brokers” refers to EPs offering online trading service to retail clients since the 2004/05 survey but refers to EPs
recording retail online trading in the previous surveys.
(2) One EP which had a significant proportion of its total turnover as retail agency trading and reported high percentage share of
retail online trading prior to 2010/11 did not provide the percentage share of its retail online trading since 2010/11. This EP
was excluded from the responded sample in calculating retail online trading in percentage and value terms since then.
8.5%10.4%
11.5%13.0%
16.8% 17.4%
21.5%
26.9%
25.8%
33.7%
2.9%3.9% 3.7% 3.9%
5.3% 5.1%6.3% 6.9% 6.6% 6.8%
0%
5%
10%
15%
20%
25%
30%
35%
40%
2002/03 2003/04 2004/05 2005/06 2006/07 2007/08 2008/09 2009/10 2010/11 2011/12
Percentage share of retail online trading value in cash market (2002/03 - 2011/12)
As % of total retail investor trading
As % of total cash market turnover
Note: One EP which had a significant proportion of its total turnover as retail agency trading and reported high percentage share
of retail online trading prior to 2010/11 did not provide the percentage share of its retail online trading since 2010/11. This EP
was excluded from the responded sample in calculating retail online trading in percentage and value terms for 2010/11 - 2011/12.

CASH MARKET TRANSACTION SURVEY 2011/12 14
GLOSSARY
Agency trading Trading on behalf of the participant firm’s clients, including client
trading channelled from the firm’s parent or sister companies.
Implied value of trading The implied value of trading for a particular type of trade is
calculated by multiplying the percentage contribution to market
turnover by that type of trade as obtained from the survey by the
actual overall market turnover during the study period.
The implied value of trading from a particular overseas origin is
calculated by first calculating the implied overseas agency trading
value during the study period, and then multiplying it by the
percentage contribution to overseas agency trading by that origin as
obtained from the survey.
Individual/retail investors Investors who trade on their personal account.
Institutional investors Investors who are not individual/retail investors.
Local investors Individual/retail investors residing in Hong Kong or institutional
investors operating in Hong Kong, with Hong Kong as the source of
funds.
Online brokers Stock Exchange Participants who offer online trading service to
individual/retail investors.
Overseas investors Individual/retail investors residing outside Hong Kong or
institutional investors operating outside Hong Kong, with the source
of funds overseas.
Principal trading Trading on the participant firm’s own account.
Retail online trading Trading originating from orders entered directly by individual/retail
investors and channelled to the brokers via electronic media (e.g.
the Internet).

CASH MARKET TRANSACTION SURVEY 2011/12 15
APPENDIX 1. REPRESENTATIVENESS OF THE
RESPONDED SAMPLE VIS-À -VIS
THE TARGET POPULATION OF
EXCHANGE PARTICIPANTS
0%
20%
40%
60%
80%
100%
0% 10% 20% 30% 40% 50% 60% 70% 80% 90% 100%
Cum
ula
tive
contr
ibuti
on t
o t
ota
l tu
rnover
val
ue
% of Exchange Participants
Representativeness of responded sample to target population of all EPs
Target respondents
Responded sample

CASH MARKET TRANSACTION SURVEY 2011/12 16
APPENDIX 2. SURVEY METHODOLOGY
(1) Target population
The target population included all trading Stock Exchange Participants (EPs) of the cash market who
became trading participants prior to the end of March 2012 (i.e. who had been in business for over 6
full months during the study period) and remained so before the fieldwork of the survey began. It
excluded EPs whose trading was suspended from July 2012 to September 2012 or ceased on or before
September 2012 or who traded for less than 6 months during the study period. This is to avoid
distortion of the results by participants who were not in the normal course of business.
All EPs are corporations.
(2) Methodology
The study period is from October 2011 to September 2012.
EPs in the target population were ranked in descending order by turnover value. To achieve a fairer
ranking, the actual turnover of new EPs whose trading period was less than 12 months during the
study period was annualised for the ranking. The actual turnover of the EPs was used in analysing
the results. Ranking of EPs by turnover was for the purpose of monitoring the responses and
follow-up in the fieldwork as well as generating response rates by turnover size groups as weighting
factors in the subsequent analysis.
The survey sample consisted of all EPs in the target population. Survey questionnaires were mailed
to each EP firm in the sample, with close telephone follow-up to ensure a high response rate,
especially for the EPs which were top-ranked in the target population by turnover value. In the
survey questionnaire, EPs were requested to provide an estimated percentage breakdown of their
trading value during the study period in accordance with the prescribed classification. EPs were
asked to provide their consolidated trading composition including trading channelled through their
affiliate or sister companies as far as possible, if applicable. Those who were known to have such
situation but who refused to provide details were treated as cases with missing value for which a mean
substitution method5 was adopted, except for online trading. For online trading, EPs who reported to
be online brokers but were unable to provide the proportion of their retail investor trading as online
trading were excluded from the responded sample in calculating the retail online trading in percentage
and value terms.
Each responding EP’s answers in percentage terms were weighted by the respondent’s total turnover
value in the overall market accordingly to obtain respective values in the responded sample. The
implied percentage shares of different types of trade in the market were then calculated, adjusted by
the response rate in value terms relative to the target population.
5 The average values obtained from other EPs in the same size group were applied to the missing cases. For this
purpose, EPs in the target population were divided into three size groups with equal aggregate contributions to total
turnover value of the target population — large-sized brokers (contributing the top one-third of turnover in the
target population), medium-sized brokers (contributing the second one-third of turnover) and small-sized brokers
(contributing the bottom one-third of turnover).

CASH MARKET TRANSACTION SURVEY 2011/12 17
The implied value of trading for a particular type of trade is determined by multiplying the percentage
contribution to total turnover by that type of trade as obtained from the survey by the actual total
turnover in the overall market during the study period for that year of survey.
(3) Limitations
In providing the breakdown of total turnover value by the type of trade, many EPs could only provide
their best estimates instead of hard data.
EPs might not know the true origins of all their client orders. For instance, an EP might classify
transactions for a local institution as such when in fact the orders originated from overseas and were
placed through that local institution, or vice versa.
In practice, it is not unusual for EPs to convey client orders to other EPs for execution. When
providing the breakdown of their investor composition, most of the EPs would treat those EPs who
conveyed orders to them as their ultimate clients, i.e. as local institutions, regardless of the client
origin.
Some bank-related EPs might not be able to provide the trading composition of client orders
originating from their associated banks and would treat the banks as their local institutional clients.
This would also affect the result of retail online trading since part of the retail investor trading
channelled through banks would be online.
Different EPs would have different corporate group structures and operating models within their
corporate groups. Some EPs might be able to provide the investor composition of trading channelled
via their sister companies; others may regard their sister companies as their clients and incorporated no
further breakdown. In other words, the depth of detail in investor composition across EPs might not
be on the same ground.
The non-responded EPs and responded EPs with missing responses for certain questions may have
different trading composition from the other responded EPs. The exclusion of these EPs from the
applicable analysis might affect the survey results. Since the survey has a high response rate by
turnover value and a method of weighting by size group in treating missing responses was adopted to
cater for the different trading composition by size group, the impact of non-responded EPs to the
overall findings should be small. Nevertheless, there might be some impact on the types of investor
trading which had relatively low contribution to market turnover.
The random sampling method used in the previous surveys in 2001/02 and 2002/036 would also have
consequences similar to those stated in the above paragraph. Therefore, for the types of investor
trading with very small contributions, the relative changes in their contributions and in absolute value
terms over the years should be interpreted with caution.
— END —
6 In 2001/02 and 2002/03 surveys, the survey sample consisted of all brokers contributing the top two-thirds of
turnover value in the target population as well as a random sample covering 60% of brokers contributing the bottom
one-third of turnover value. In the prior years and since the 2003/04 survey, a census approach was adopted, i.e.
all brokers in the target population were included in the survey sample.