
Cash and Carbons - ConstructCO2 Update
31
t: @constructco2 www.constructco2.com e: [email protected] Cash and Carbon a perfect marriage for Residential Providers martin brown
-
Upload
martin-brown -
Category
Technology
-
view
469 -
download
0
description
Updated intro to Constructco2 - presented to Residential Providers and HA's in July 2012
Transcript of Cash and Carbons - ConstructCO2 Update

t: @constructco2www.constructco2.com e: [email protected]
C a s h a n d C a r b o n
a p e r f e c t m a r r i a g e f o r R e s i d e n t i a l P r o v i d e r s
m a r t i n b r o w n

design build in use
Carbon tool focusing on construction
Understand Construction Carbons
Address Standards + Assessments
Address Evidence
Develop KPI / Benchmark
Engage Supply Chain
Address Green Deal and Eco Refits
* *

PART OF
A CARBON
CONTROLLED DIET

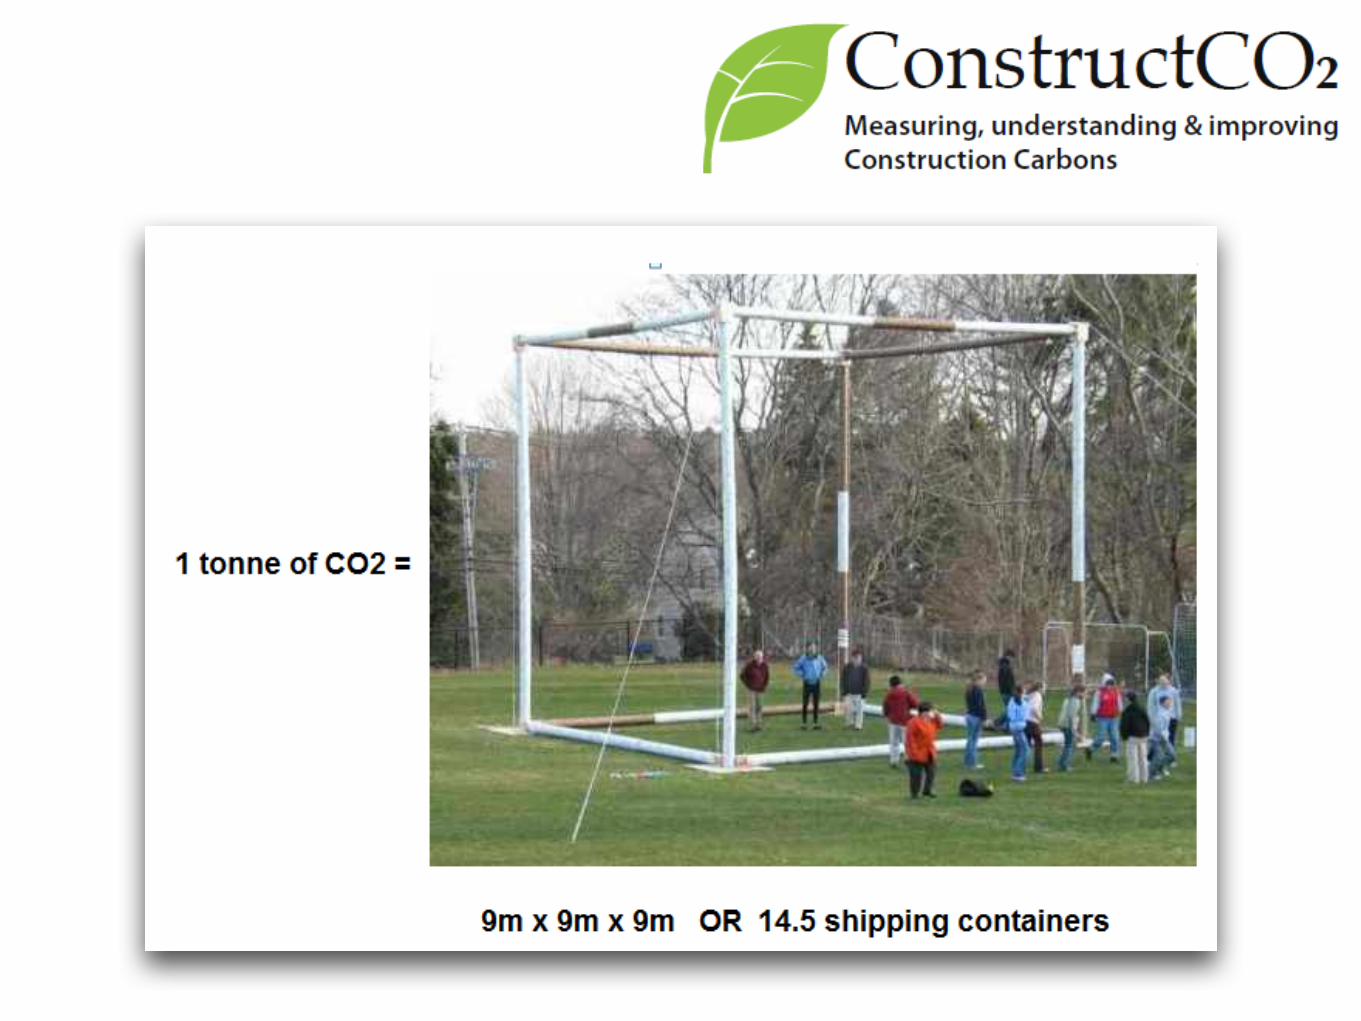
What does a tonne of CO2 looks like?
How much CO2 will U emit for £1m Social Housing Project?
What is the highest contributor of CO2 on a typical Construction Project?
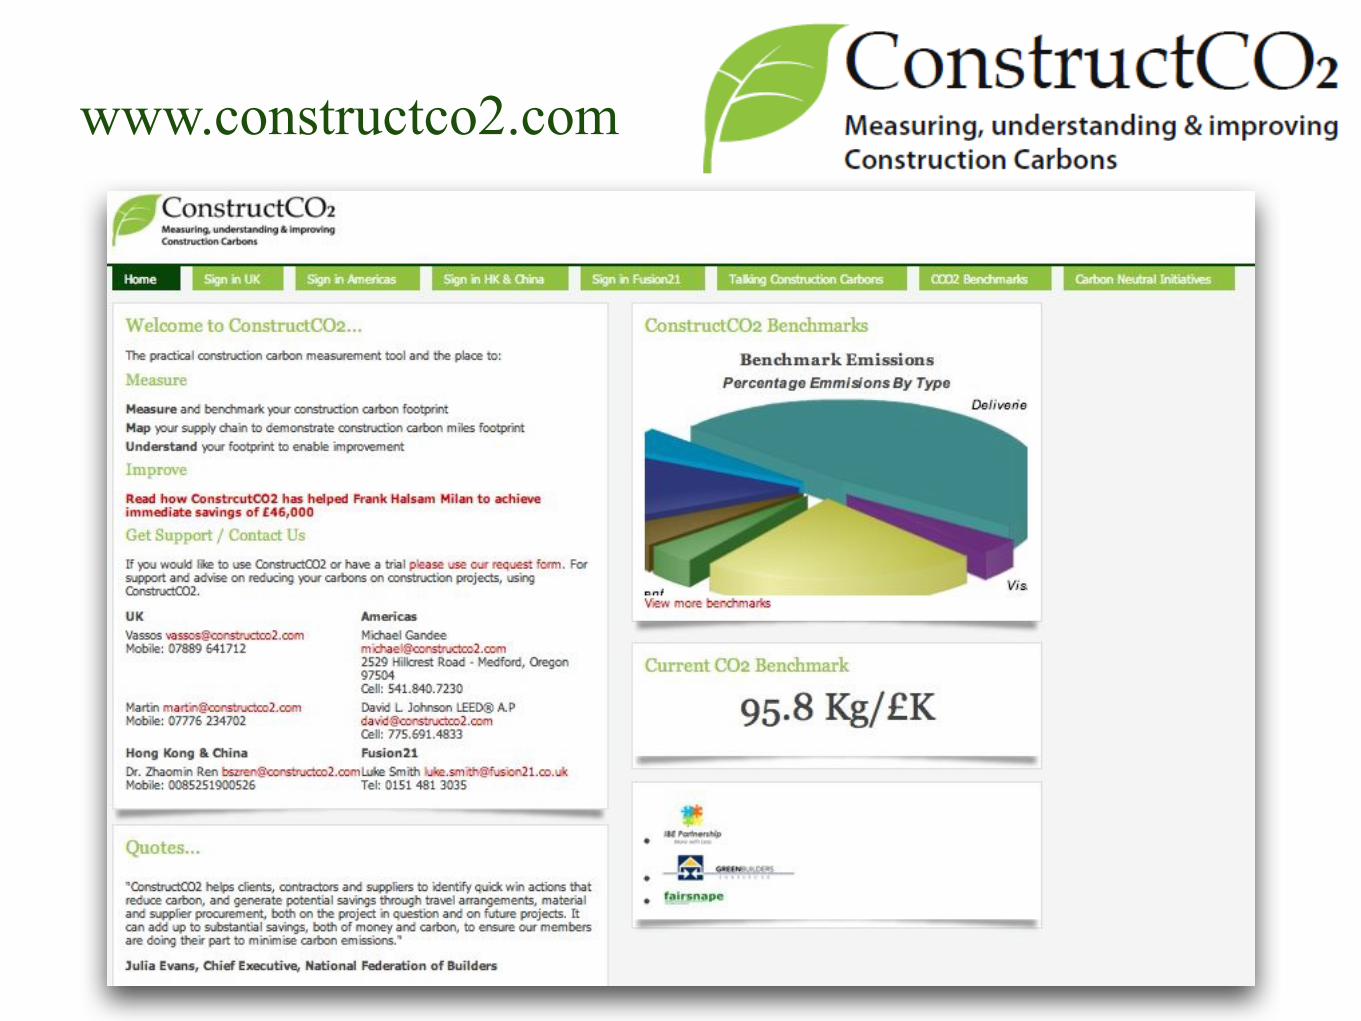
www.constructco2.com
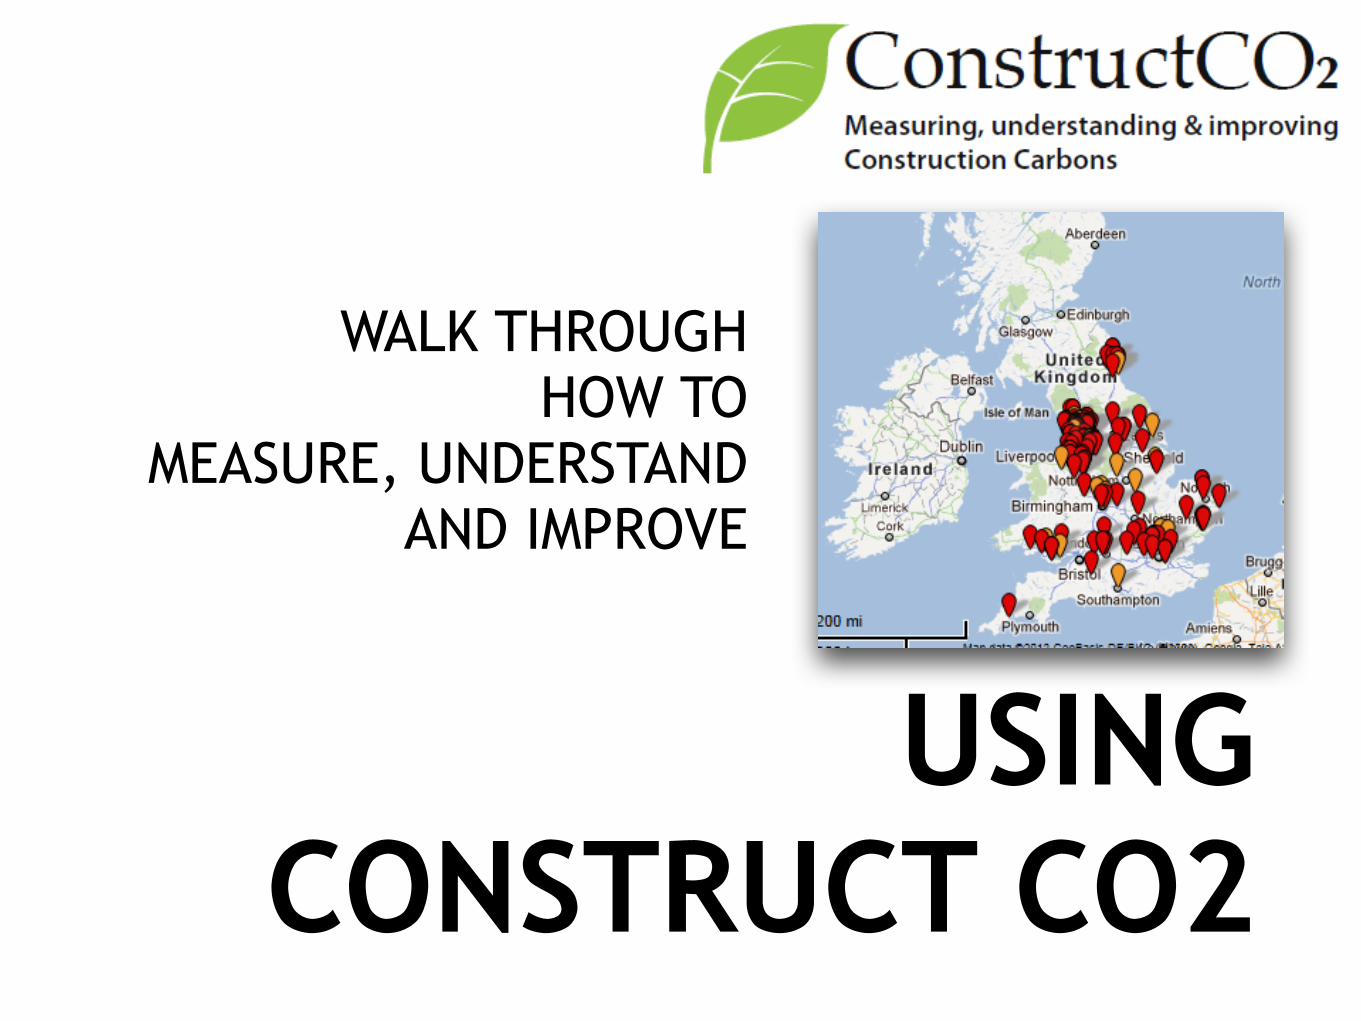
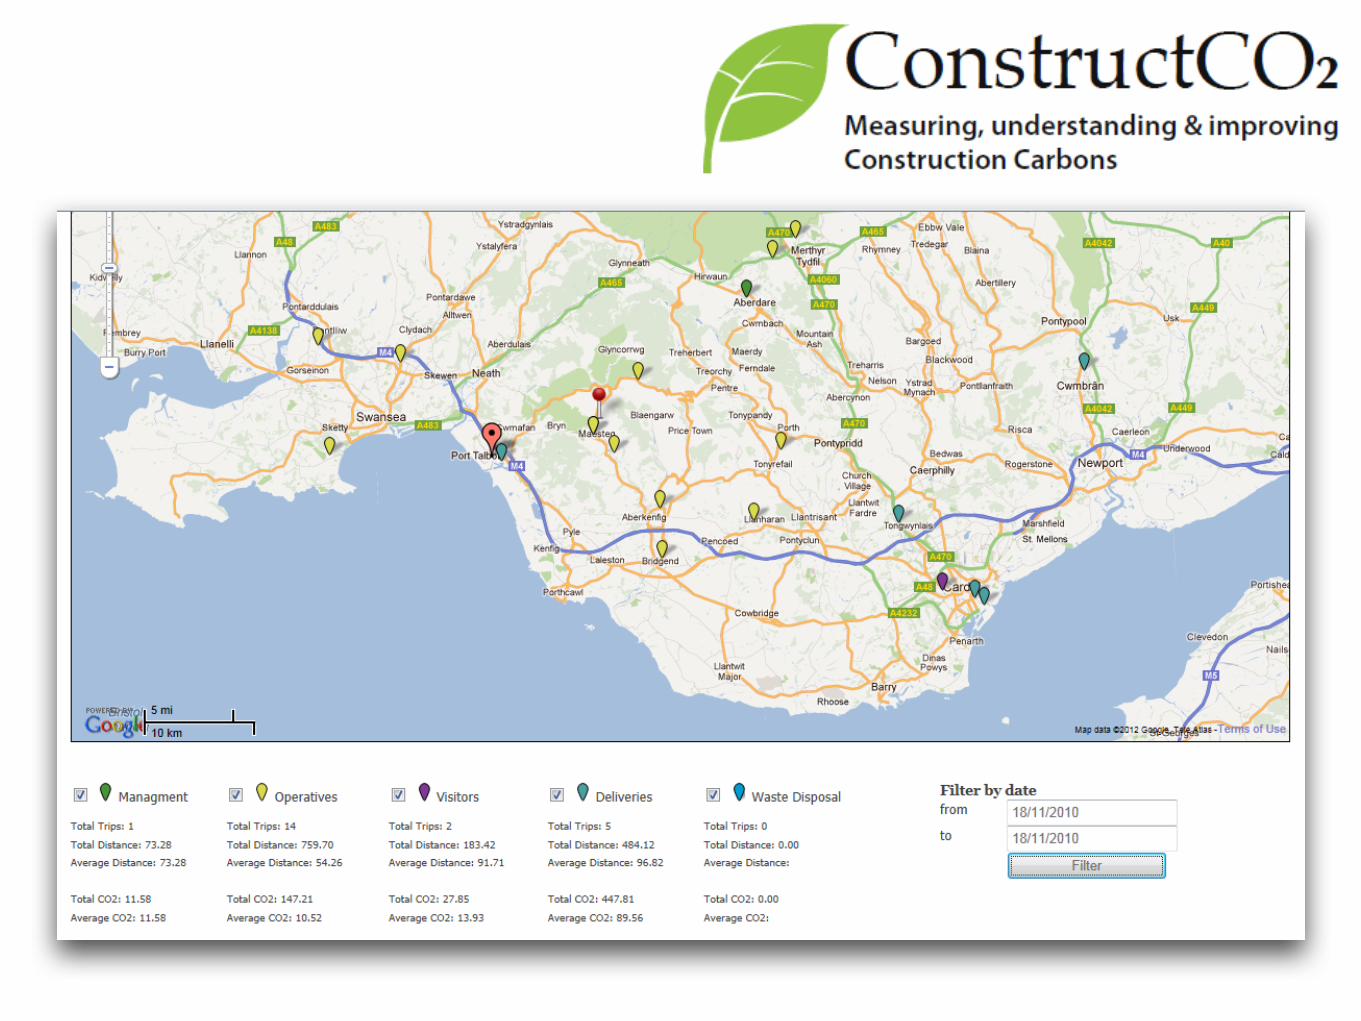
USING
CONSTRUCT CO2
WALK THROUGH HOW TO
MEASURE, UNDERSTAND AND IMPROVE
keep it simple make a difference
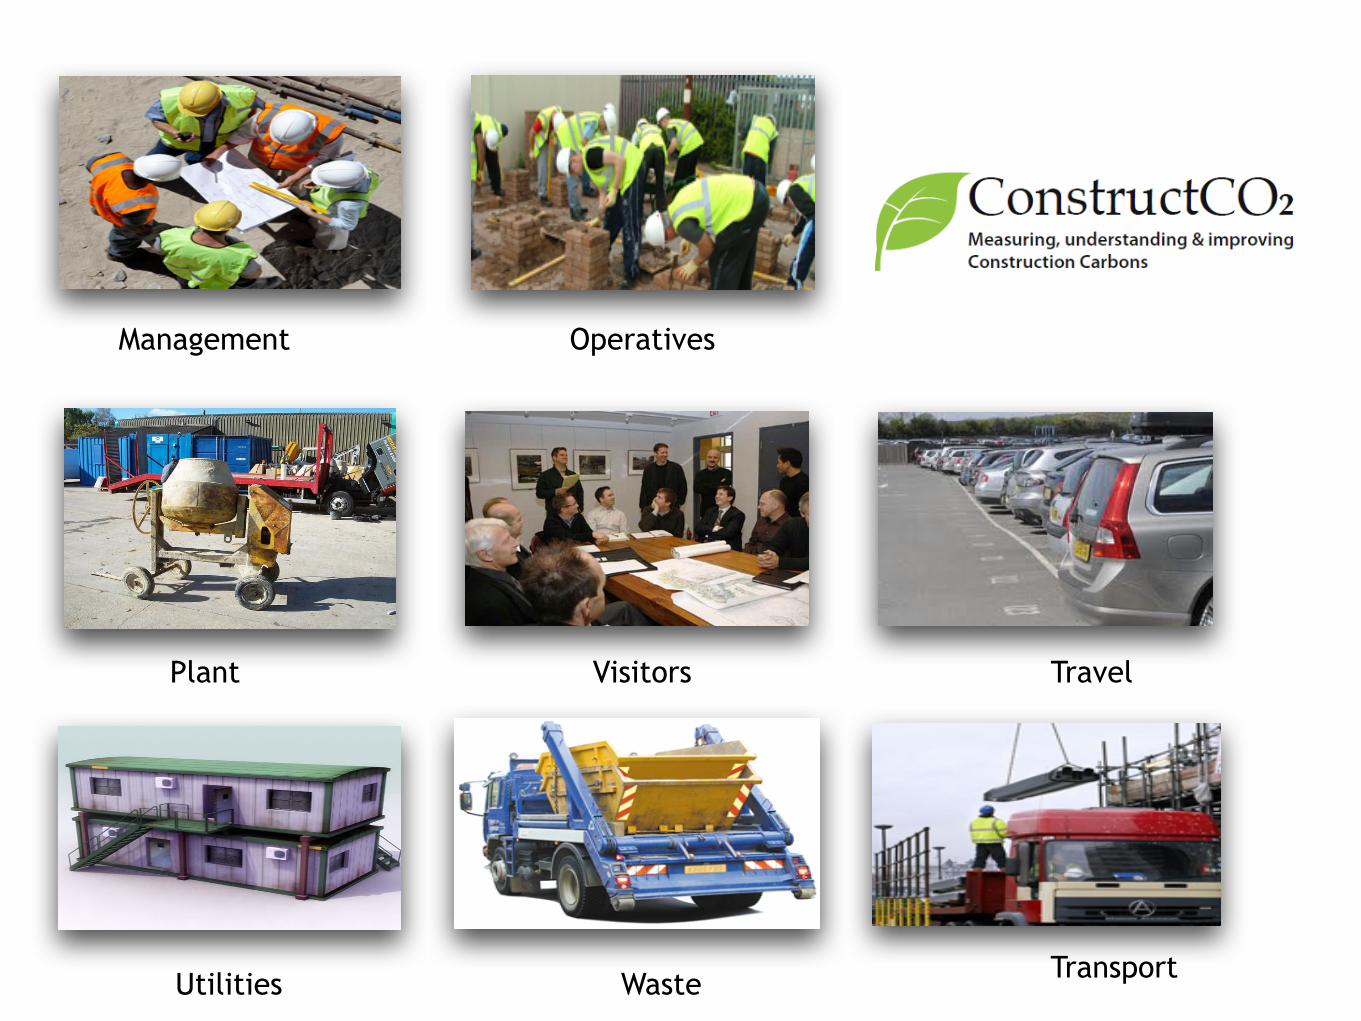
Management Operatives
TravelPlant
Utilities
Visitors
TransportWaste
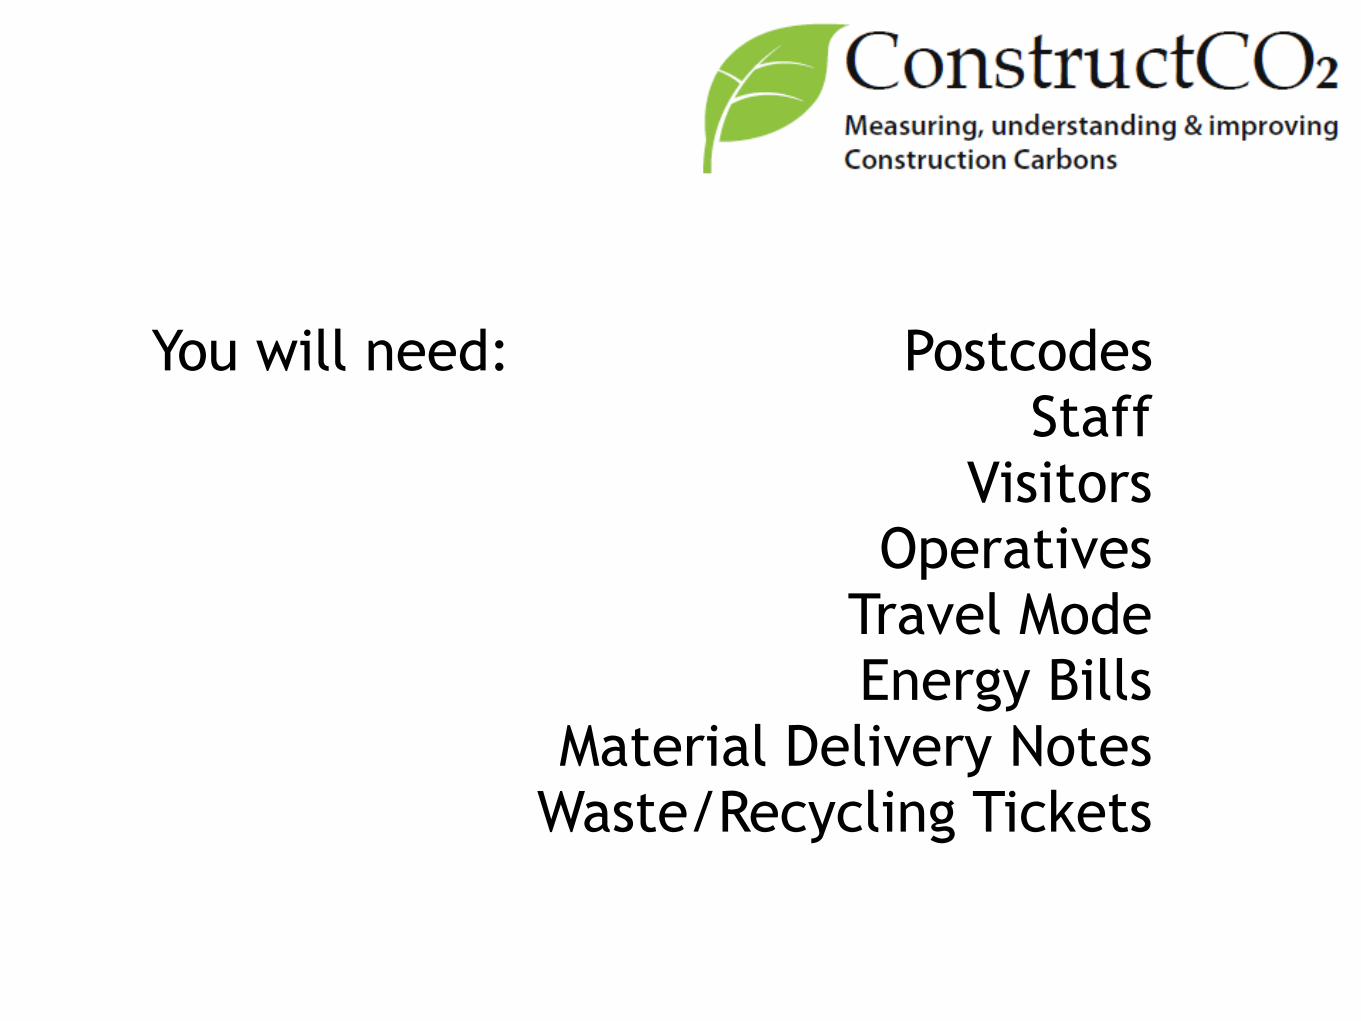
You will need: Postcodes Staff
Visitors Operatives
Travel Mode Energy Bills
Material Delivery Notes Waste/Recycling Tickets


Management - 4 671 Journeys 7.5 tonnes of CO2 Average Journey 11.2Kg of CO2 43466Km – once around the Earth Average Journey 64km Operatives - 129 3422 Journeys 59 tonnes of CO2 Average Journey 17.2Kg of CO2 223360Km – 5.5 times around the Earth Average Journey 65.3km Deliveries 742 Journeys 94 tonnes of CO2 Average Journey 126.7Kg of CO2 51394Km – 1.3 times around the Earth Average Journey 69.3km
An Average Housing Project?
223 tonnes of CO2 = 3234 shipping containers
£2.5m New Build
Project Footprint

Social Housing Carbon Benchmarks
CASH IS KING CARBON IS QUEEN
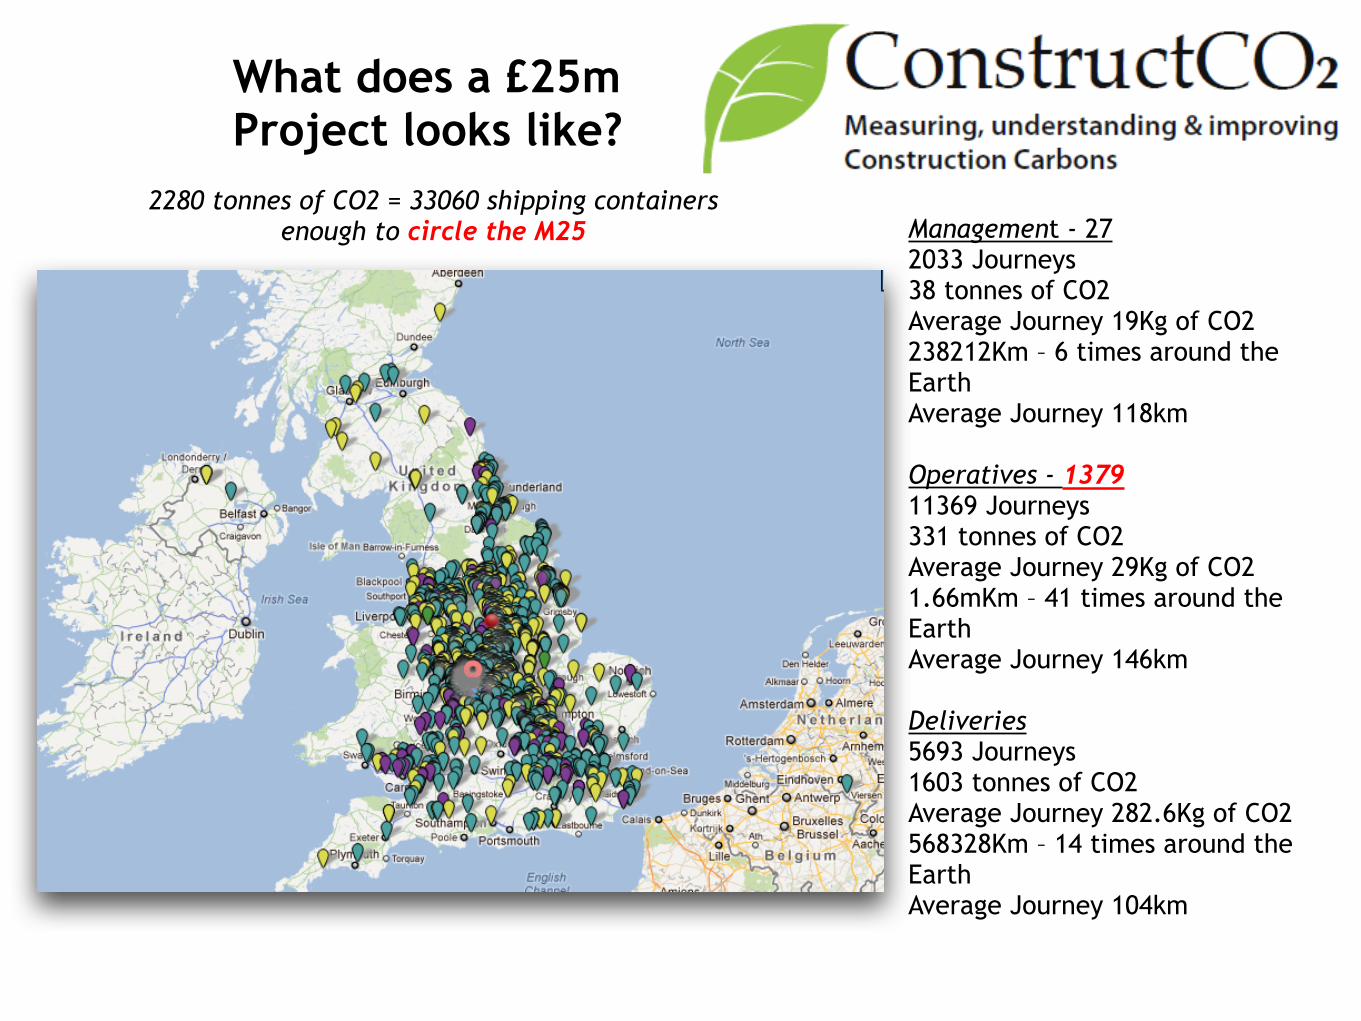
Management - 27 2033 Journeys 38 tonnes of CO2 Average Journey 19Kg of CO2 238212Km – 6 times around the Earth Average Journey 118km Operatives - 1379 11369 Journeys 331 tonnes of CO2 Average Journey 29Kg of CO2 1.66mKm – 41 times around the Earth Average Journey 146km Deliveries 5693 Journeys 1603 tonnes of CO2 Average Journey 282.6Kg of CO2 568328Km – 14 times around the Earth Average Journey 104km
What does a £25m Project looks like?
2280 tonnes of CO2 = 33060 shipping containers enough to circle the M25

Reducing Carbon Reducing Costs
Operatives
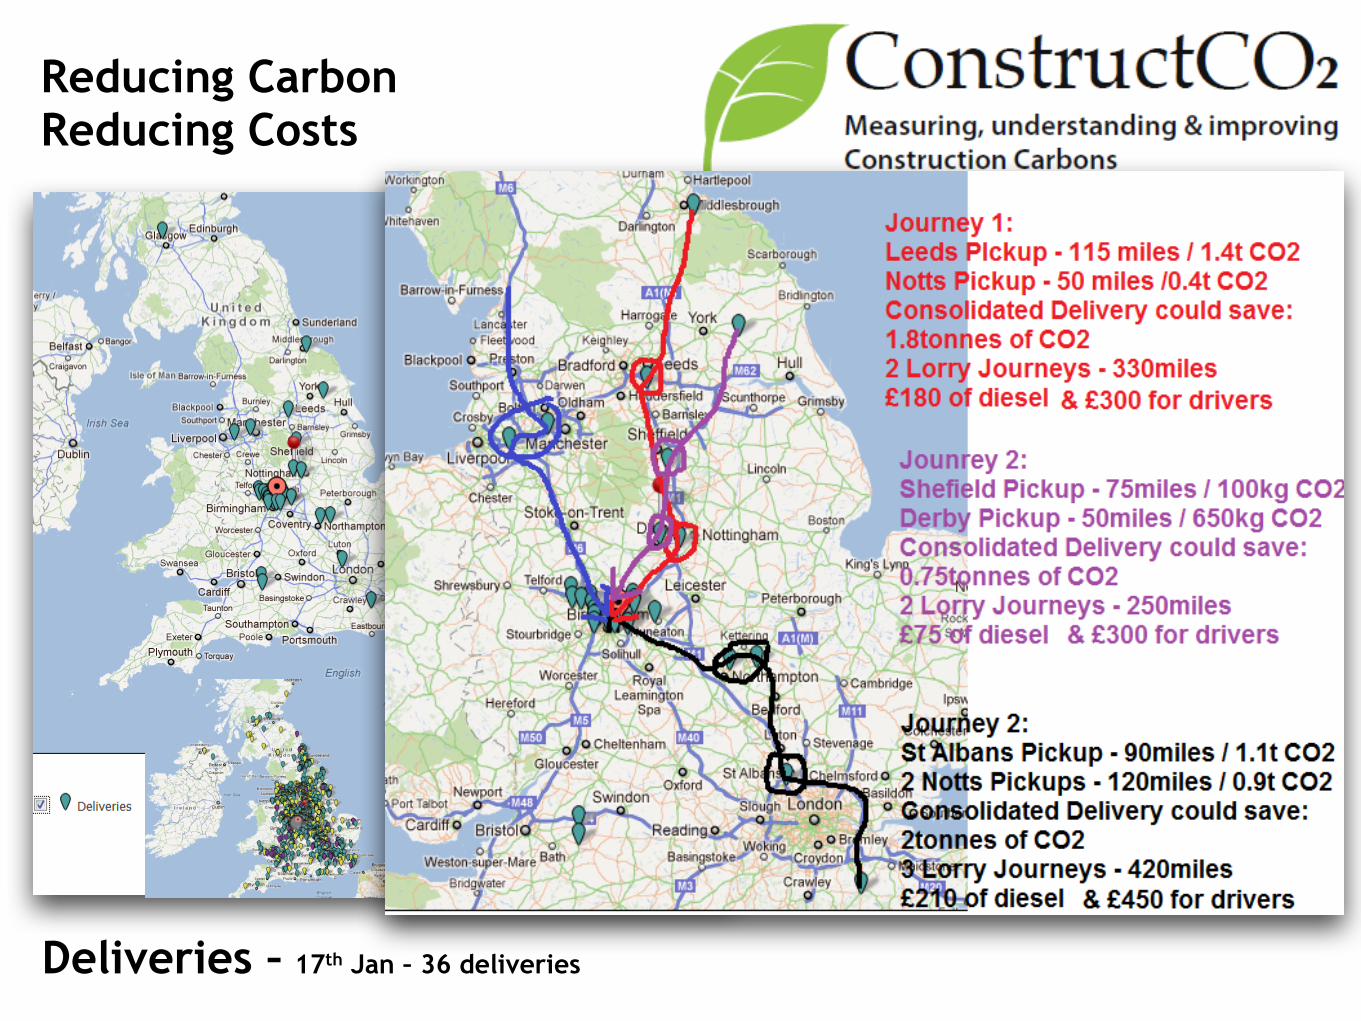
Deliveries – 17th Jan – 36 deliveries
Reducing Carbon Reducing Costs

IMPROVING
CONSTRUCTION
CARBONS
LOW CARBON CONSTRUCTION ACTION PLAN
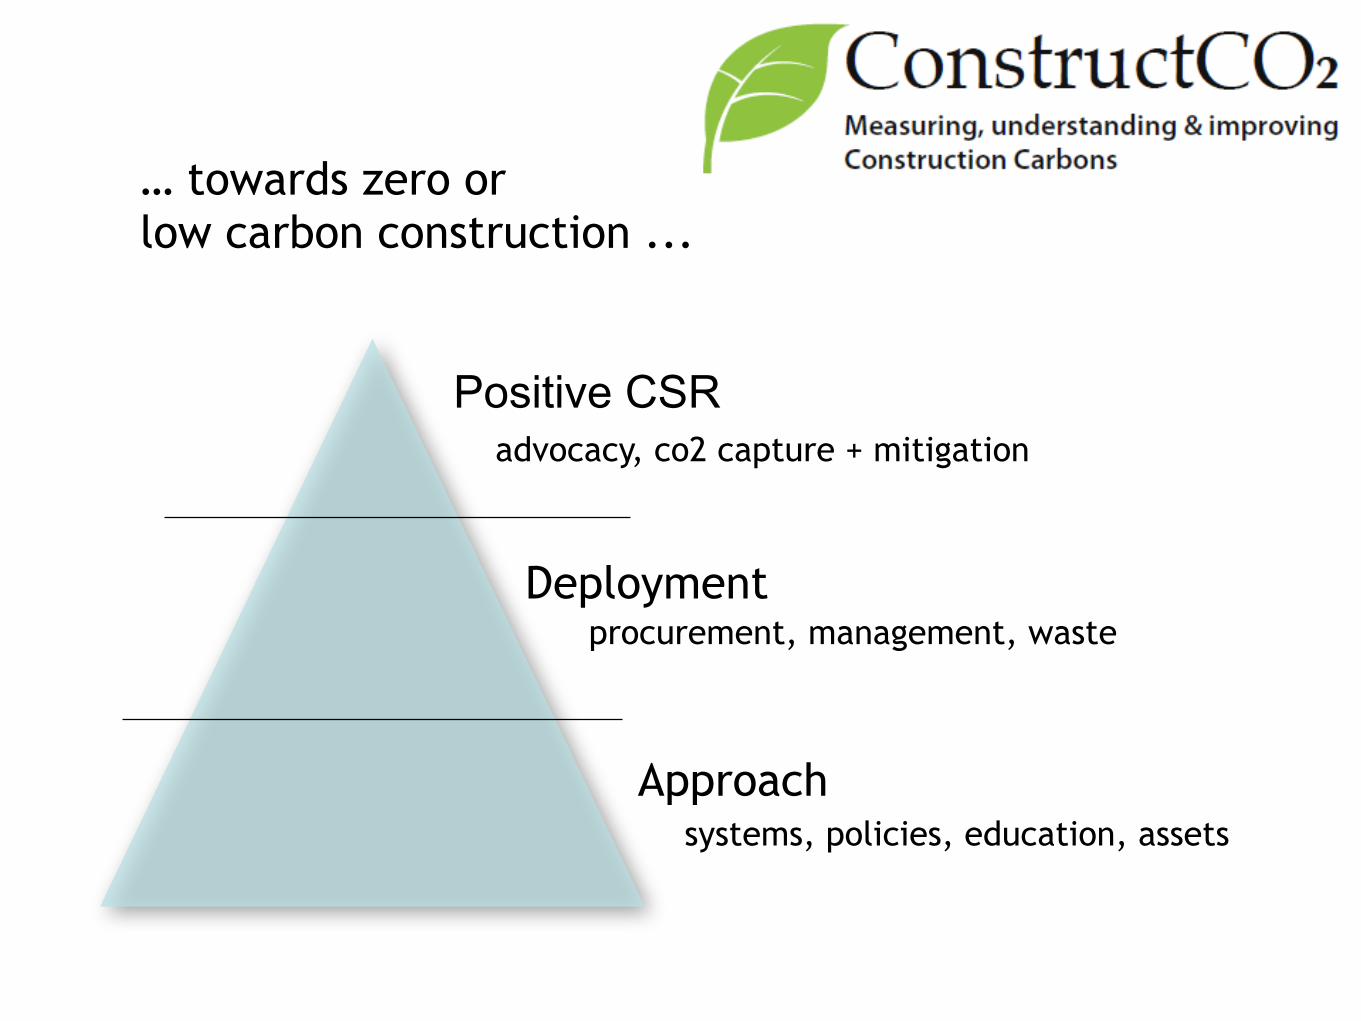
Approach
Deployment
Positive CSR advocacy, co2 capture + mitigation
procurement, management, waste
systems, policies, education, assets
… towards zero or low carbon construction ...
transport
travel

procurement
localism
appropriate
sourcing

corporate social
responsibility
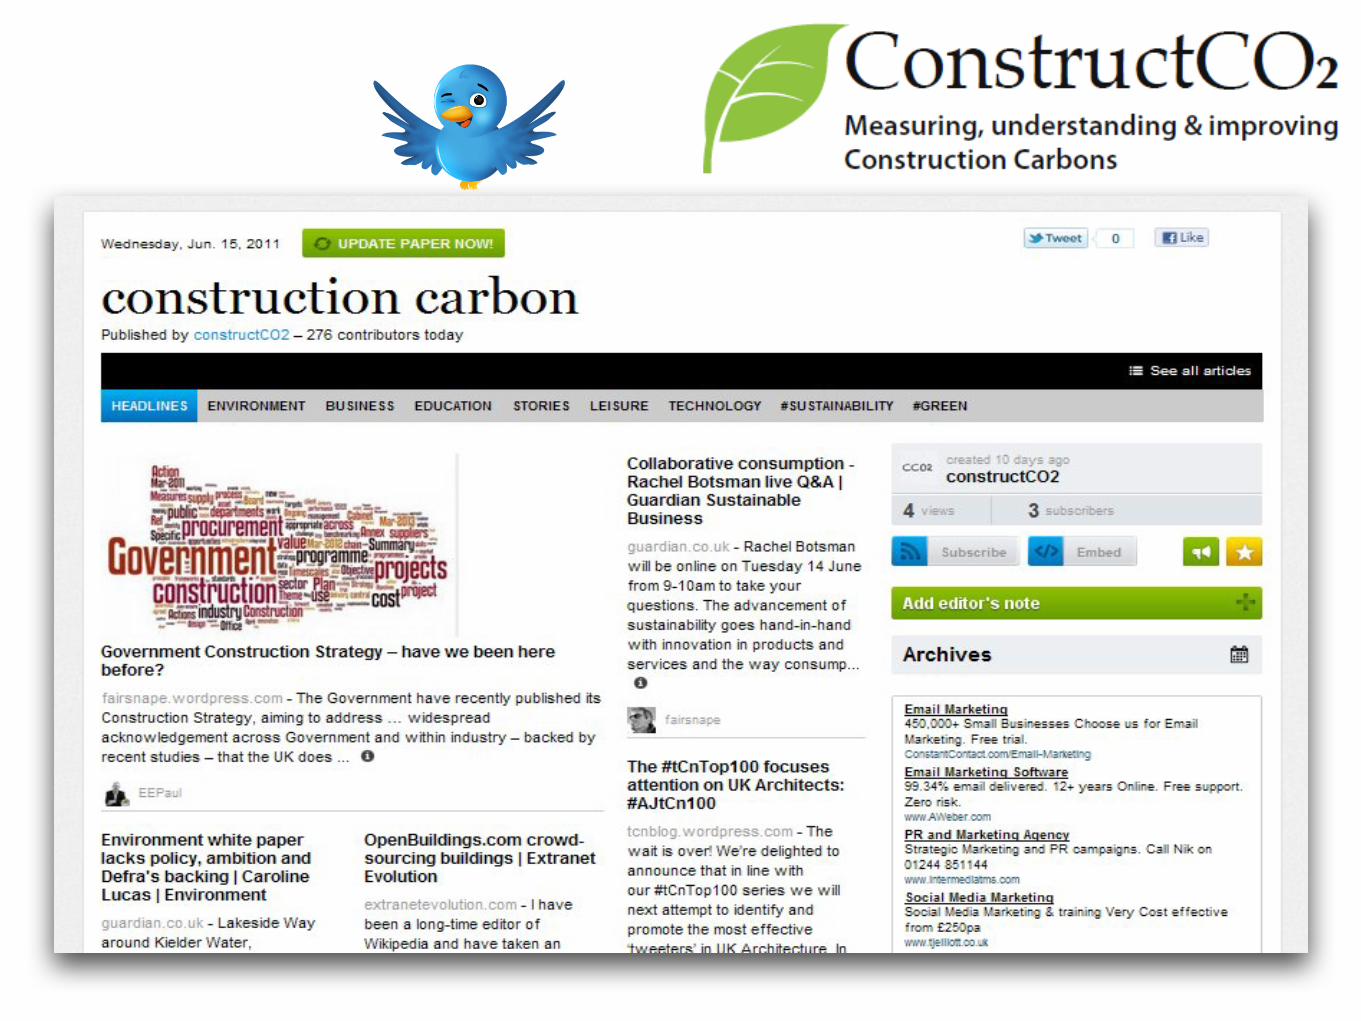
TALKING
CONSTRUCTION
CARBON

www.constructco2.com
twitter: @constructco2
Linkedin group: construction carbons
t: @constructco2www.constructco2.com e: [email protected]
T h a n k Yo u
Q u e s t i o n s ?
m a r t i n b r o w n


