CaseStudyofHurricaneKatrina - weatherdata.com · CaseStudyofHurricaneKatrina WHITEPAPER I FALL2005...
12
Case Study of Hurricane Katrina WHITE PAPER I FALL 2005 Protecting Your Business. Protecting You. ®
Transcript of CaseStudyofHurricaneKatrina - weatherdata.com · CaseStudyofHurricaneKatrina WHITEPAPER I FALL2005...
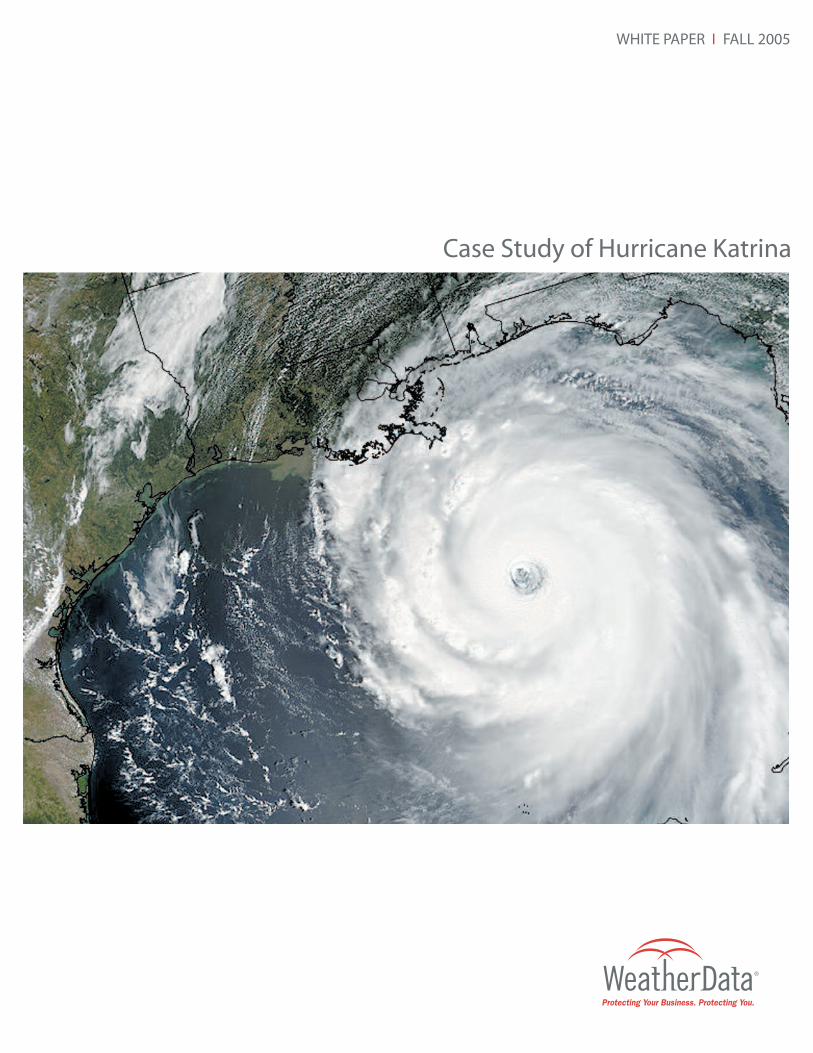
Case Study of Hurricane Katrina
WHITE PAPER I FALL 2005
Protecting Your Business. Protecting You.
®

About the Author
Mike Smith’s fascination with weather began at the age of five when he
witnessed a tornado with F5 damage tear through his home town of
Kansas City. The tornado was one of the most damaging in history and
Mike recalls thinking “If a tornado could do such damage, it must be
interesting.” He’s been hooked on weather ever since.
After achieving a Bachelor of Science Degree in meteorology, with
additional studies in engineering and mathematics, from the University
of Oklahoma, Mike began his professional career in broadcasting. He
worked for television stations in Oklahoma City, St. Louis and Wichita.
In 1981, Mike founded WeatherData, a company dedicated to the
highest standards of customer service and meteorological science. Mike
is a board certified consulting meteorologist and Fellow of the American
Meteorological Society. He served as Chairman of the Commercial
Weather Services Association, a Charter Member of the National
Weather Association and served on the American Meteorological
Society's Forecasting and Aviation Meteorology Committees.
In 1992, Mike won the American Meteorological Society's Award for
Outstanding Contribution to Applied Meteorology and shared in
WeatherData's 2000 Award for Outstanding Service to Meteorology by
a Corporation. He is a recipient of seven United States patents, with
other U.S. and foreign patents pending, and is a published author and
photographer in the field of meteorology.
In 1981, Mike founded WeatherData,
a company dedicated to the highest
standards of customer service and
meteorological science.

WHITE PAPER I FALL 2005
Hurricane Katrina, in economic terms, is the worst natural disaster inthe history of the United States. With direct and indirect economic lossexceeding $200 billion, more than 1,200 fatalities and evacuees in all50 states, the sheer magnitude of Katrina is often difficult to grasp.
The purpose of this White Paper is to review the information availableprior to landfall in the context of its value for decision-making.

Case Study of WeatherData® for Hurricane Katrina
In the predawn hours on Saturday morning, August 27, a team of WeatherDatameteorologists were tracking and forecasting Hurricane Katrina. Their 2 a.m.Katrina Risk Assessment forecast called for Katrina to pass just east of NewOrleans at Category 4 intensity. Our forecast of the path of the eye of thestorm was either over New Orleans or just to the east from this point intime until landfall – remarkable consistency.
WeatherData takes great pride in getting the meteorology (wind speed,storm’s path, etc.) right and in going the extra step to provide insight asto the storm’s effects. Keeping in mind that Katrina crossed the Louisianacoast around 7 a.m. on Monday, August 29, the following statements madein our forecast products were of amazing accuracy. They are edited toeliminate redundancy, none of the editing changes their meaning.
Sunday, August 28, 2005• 2 a.m.: “Katrina’s Cat 4 or 5 strength ensures a giant storm surge of 10 to 20 feet
above normal… Regarding the Gulf Coast, extensive to catastrophic structuraldamage, power outages and flooding are inevitable with the population centersof New Orleans and Biloxi hard hit.”
• 8:30 a.m.: “Look for winds to 160 mph…very dangerous situation setting upfor New Orleans and Mobile…storm surge heights of 15-20 ft. above normal arelikely. Surge heights of this magnitude could inundate a large section of easternNew Orleans…winds of 70 to 80 mph will occur inland to Jackson andMontgomery…”
• 11 a.m.: “Catastrophic damage now appears likely from New Orleans eastthrough the Mississippi coast…complete destruction of most beachside structureswith extensive damage inland, as well…surge heights of 18-25 ft….”
• 2:30 p.m.: “swelling water in Lake Pontchartrain will eclipse the levee systemand fill into the northern and eastern sections of New Orleans…”
• 5:30 p.m.: Special Forecast of the Economic and Sociological Effects of HurricaneKatrina. “Due to the large size of the hurricane, sustained 100 mph wind speedswill likely occur as far north as Interstate 20 from Jackson to where it crosses theAlabama border to near Pensacola…Serious damage will occur in these areasincluding widespread power failures and flooding…Loss of life in Katrina will bemuch higher than in Andrew and may be higher, perhaps significantly so, than inCamille. Major loss of life is possible if the eye goes over New Orleans, due to thebelow sea level elevation...On this path and at this intensity, total damage may wellexceed $50 billion…the Port of New Orleans will be affected by this storm,including the ports through which much of the United State’s imported oilflows…The Port of Mobile will also experience damage due to wind and surge.”
In addition, WeatherData’s meteorologists developed many special,customized products for our clients and participated in conference callswith a number of them.
Meteorologists are often reluctant to make these types of forecasts for fear oflooking foolish if the forecast does not pan out. However, we believe our clientspay us to make the “tough calls” and provide our best professional opinions.
“Regarding the Gulf Coast,
extensive to catastrophic
structural damage, power
outages and flooding are
inevitable with the
population centers of New
Orleans and Biloxi hard hit.”
“On this path and at this
intensity, total damage may
well exceed $50 billion”

To receive copies of any of our
forecasts and learn more about
how you can partner with
WeatherData to mitigate the
effects of adverse weather on
safety and profitability, please
contact us at:
316.265.9127
The Hurricane Katrina Economic and Sociological Effects Forecastwas sent to WeatherData clients on August 28, 2005, to help themascertain the impact of Hurricane Katrina. This tool proved valuablein helping clients such as insurance companies and railways plan fornot only the areas that were going to be directly affected, but also thechain reactions of this catastrophic event that affected nearly everybusiness and enterprise.

Case Study Regarding the National Weather Service’sPerformance During Hurricane Katrina
Our colleagues at the National Weather Service’s National Hurricane Center(NHC) did a fine job with the meteorology of Katrina. However, we havesome concerns about the ways in which they communicated that information.
The Commercial Weather Services’ Association (an industry group,WeatherData is a member) has assembled a timeline that raises a numberof important questions about NWS performance:
• Friday, August 26, 5 p.m.: National Weather Service local forecast for NewOrleans Monday called for “decreasing clouds. Isolated thunderstorms. Verywindy. Highs in the lower 90’s. Chance of thunderstorms 20 percent.” At thesame time, NHC’s forecast graphic shows the path of Katrina to be about 60 mileseast of New Orleans. Why the huge discrepancy between NHC and the local office?
• Friday evening, 10 p.m.: The local New Orleans forecast (as people were turningin the for the night) was unchanged even as NHC moved their forecast pathcloser to New Orleans.
• Saturday, August 27, 10 a.m.: The first hurricane watch (not warning) is issuedfor southeast Louisiana, but does not include Mississippi or Alabama. While therehas been criticism of local officials about the voluntary (as opposed to mandatory)evacuation at this time, the fact is there was no NWS hurricane warning in effect.
• Saturday, August 27, 4 p.m.: The National Weather Service’s “Probabilities forGuidance in Hurricane Protection Planning by Government and Disaster Officials”product (more commonly called “strike probabilities”) was only predicting a 21%chance of the eye coming within 65 miles of New Orleans. This was inconsistentwith the NHC track forecast and the 21% value was lower than the values for2004’s Hurricane Ivan, which missed New Orleans and struck eastern Alabamaand western Florida. There was an evacuation for New Orleans because of Ivan.While there has been justified criticism of local officials, it must be stressed that strikeprobabilities for Katrina that were lower than a recent hurricane that missed NewOrleans hardly reinforced the urgency of the situation.
• According to multiple press reports, “around dinner time” NHC director MaxMayfield “made a round of phone calls to top state and local officials” includingthe Mayor of New Orleans. He wanted to impress on them the severity of whatwas about the happen – and to “be able to go to sleep that night knowing thathe’d done everything in his power to save lives.” He is quoted as telling NewOrleans Mayor Nagin “this was the worst hurricane he had ever seen and thatpublic officials should do everything in their power to get people out of the way.”While the intent of Mr. Mayfield is commendable, why didn’t NHC’s products forthe public reflect this urgency? There were still no hurricane warnings. The “strikeprobability” for New Orleans was still 21% – hardly a number that reinforced thata catastrophe was about to occur. In fact, at the same point in the life of HurricaneIvan (which missed New Orleans) the strike probability was higher, 23%.
The National Weather Service has had, for most of its existence, an
unfortunate culture where certain entities are given preferential treatment.
Phone calls to selected people and entities seem to be part of that culture.
“Catastrophic damage will
occur in a 40 mile wide
band corresponding to
the eyewall.”
Economic and Sociological Effects
WeatherData, Inc., Aug. 28, 2005
© 2005 Jim Reed
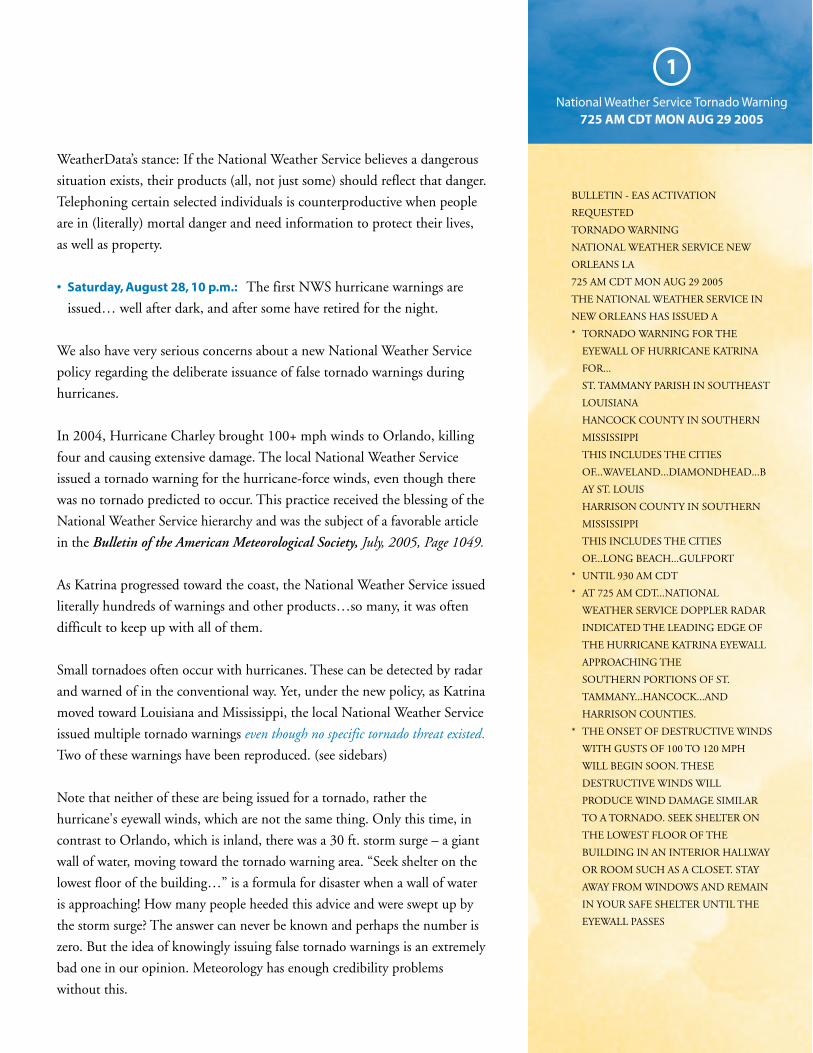
WeatherData’s stance: If the National Weather Service believes a dangerous
situation exists, their products (all, not just some) should reflect that danger.
Telephoning certain selected individuals is counterproductive when people
are in (literally) mortal danger and need information to protect their lives,
as well as property.
• Saturday, August 28, 10 p.m.: The first NWS hurricane warnings are
issued… well after dark, and after some have retired for the night.
We also have very serious concerns about a new National Weather Service
policy regarding the deliberate issuance of false tornado warnings during
hurricanes.
In 2004, Hurricane Charley brought 100+ mph winds to Orlando, killing
four and causing extensive damage. The local National Weather Service
issued a tornado warning for the hurricane-force winds, even though there
was no tornado predicted to occur. This practice received the blessing of the
National Weather Service hierarchy and was the subject of a favorable article
in the Bulletin of the American Meteorological Society, July, 2005, Page 1049.
As Katrina progressed toward the coast, the National Weather Service issued
literally hundreds of warnings and other products…so many, it was often
difficult to keep up with all of them.
Small tornadoes often occur with hurricanes. These can be detected by radar
and warned of in the conventional way. Yet, under the new policy, as Katrina
moved toward Louisiana and Mississippi, the local National Weather Service
issued multiple tornado warnings even though no specific tornado threat existed.
Two of these warnings have been reproduced. (see sidebars)
Note that neither of these are being issued for a tornado, rather the
hurricane's eyewall winds, which are not the same thing. Only this time, in
contrast to Orlando, which is inland, there was a 30 ft. storm surge – a giant
wall of water, moving toward the tornado warning area. “Seek shelter on the
lowest floor of the building…” is a formula for disaster when a wall of water
is approaching! How many people heeded this advice and were swept up by
the storm surge? The answer can never be known and perhaps the number is
zero. But the idea of knowingly issuing false tornado warnings is an extremely
bad one in our opinion. Meteorology has enough credibility problems
without this.
BULLETIN - EAS ACTIVATION
REQUESTED
TORNADO WARNING
NATIONAL WEATHER SERVICE NEW
ORLEANS LA
725 AM CDT MON AUG 29 2005
THE NATIONAL WEATHER SERVICE IN
NEW ORLEANS HAS ISSUED A
* TORNADO WARNING FOR THE
EYEWALL OF HURRICANE KATRINA
FOR...
ST. TAMMANY PARISH IN SOUTHEAST
LOUISIANA
HANCOCK COUNTY IN SOUTHERN
MISSISSIPPI
THIS INCLUDES THE CITIES
OF...WAVELAND...DIAMONDHEAD...B
AY ST. LOUIS
HARRISON COUNTY IN SOUTHERN
MISSISSIPPI
THIS INCLUDES THE CITIES
OF...LONG BEACH...GULFPORT
* UNTIL 930 AM CDT
* AT 725 AM CDT...NATIONAL
WEATHER SERVICE DOPPLER RADAR
INDICATED THE LEADING EDGE OF
THE HURRICANE KATRINA EYEWALL
APPROACHING THE
SOUTHERN PORTIONS OF ST.
TAMMANY...HANCOCK...AND
HARRISON COUNTIES.
* THE ONSET OF DESTRUCTIVE WINDS
WITH GUSTS OF 100 TO 120 MPH
WILL BEGIN SOON. THESE
DESTRUCTIVE WINDS WILL
PRODUCE WIND DAMAGE SIMILAR
TO A TORNADO. SEEK SHELTER ON
THE LOWEST FLOOR OF THE
BUILDING IN AN INTERIOR HALLWAY
OR ROOM SUCH AS A CLOSET. STAY
AWAY FROM WINDOWS AND REMAIN
IN YOUR SAFE SHELTER UNTIL THE
EYEWALL PASSES
1
National Weather Service Tornado Warning725 AM CDT MON AUG 29 2005

The National Weather Service justifies this policy to “cut through the
clutter” of the barrage of messages they issue during hurricanes. Of course,
the obvious solution is to 1) Cut out unnecessary messages, and 2) Create
an urgent "Inland Hurricane Wind Warning" or "Inland Hurricane Eyewall
Wind Warning." We urge the National Weather Service to make this change
in policy as quickly as possible.
We believe this highlights one of the most important services we offer to
our clients: Pertinent, concise information without generating “information
overload.” We never issue information we know to be false. WeatherData
works for its clients and produces information tailored to their business
requirements. This has proven far more effective than having to try to “play
meteorologist” and attempt to interpret NWS products (intended for the
public-at-large) into their business context.
Lessons Learned
Business Continuity – From The Wall Street Journal September 9:
Before the storm hit, Oreck had transferred its computer systems and call-center
operations to backup locations in Colorado. If New Orleans got hit, Mr. Oreck's
plan was to move the corporate offices to Long Beach, MS. If Long Beach got hit,
production, distribution and the call center operations would go to New
Orleans. He never thought both sites would get hammered.
Based on subsequent press reports, Oreck is doing relatively well compared
to most coastal businesses in the path of Katrina. When choosing a backup
site, it is important to choose locations that are strategically situated so they
are not knocked out in the same storm. Preferably, they should be in
climatologically different parts of the Nation (i.e., do not locate all sites in
the earthquake zone of southern California: locate them far enough apart so
the same blizzard does not shut them down, etc.). In other words, put your
eggs in different climatological baskets. At WeatherData, we can assist you
with the climatological component of site selection.
WeatherData helps establish customized solutions for weather risk needs
to ensure that weather hazards will have minimal effects on a company
and its’ facilities.
Global Warming
Although there have been innumerable reports tying Katrina and Rita to
“global warming”, the data compiled shows there is no correlation between
w
BULLETIN - EAS ACTIVATION REQUESTED
TORNADO WARNING
NATIONAL WEATHER SERVICE NEW
ORLEANS-BATON ROUGE LA
ISSUED BY NATIONAL WEATHER
SERVICE MOBILE AL
943 AM CDT MON AUG 29 2005
THE NATIONAL WEATHER SERVICE
HAS ISSUED A
* TORNADO WARNING FOR...
WASHINGTON PARISH IN SOUTHEAST
LOUISIANA ST. TAMMANY PARISH IN
SOUTHEAST LOUISIANA PEARL RIVER
COUNTY IN SOUTHERN MISSISSIPPI
HANCOCK COUNTY IN SOUTHERN
MISSISSIPPI
* UNTIL 1045 AM CDT
* AT 940 AM CDT...NATIONAL WEATHER
SERVICE DOPPLER RADAR INDICATED
THE LEADING EDGE OF INTENSE
EYEWALL WINDS ASSOCIATED WITH
VERY DANGEROUS HURRICANE
KATRINA MOVING THROUGH
SOUTHEAST LOUISIANA AND
SOUTHEAST MISSISSIPPI. THIS LINE IS
CAPABLE OF PRODUCING EXTENSIVE
DAMAGING WINDS FROM 15 MILES
EAST OF PICAYUNE TO 11 MILES
SOUTHWEST OF PEARL RIVER...
MOVING NORTH AT 18 MPH.
* TORNADO PRODUCING STORMS ARE
EXPECTED TO BE NEAR... ABITA
SPRINGS BY 1020 AM CDT
POPLARVILLE BY 1030 AM CDT THE
ONSET OF DESTRUCTIVE WINDS
WITH GUSTS OF 100 TO 120 MPH WILL
BE NOTED WITH THIS LINE. THESE
DESTRUCTIVE WINDS WILL PRODUCE
WIND DAMAGE SIMILAR TO A
TORNADO OVER LARGE AREAS. SEEK
SHELTER ON THE LOWEST FLOOR OF
THE BUILDING IN AN INTERIOR
HALLWAY OR ROOM SUCH AS A
CLOSET. STAY AWAY FROM WINDOWS
AND REMAIN IN YOUR SAFE SHELTER
UNTIL THE EYEWALL PASSES.
2
National Weather Service Tornado Warning943 AM CDT MON AUG 29 2005

“Due to the large size of the
hurricane, sustained 100mph
wind speeds will likely
occur as far north as
Interstate 20 from Jackson
to along I-20 where is crosses
the Alabama border south
to near Pensacola. Serious
damage will occur in these
areas, including widespread
power failures and flooding.”
Economic and Sociological Effects
WeatherData, Inc., Aug. 28, 2005
Number of hurricanes by Saffir-Simpson Category to strike the mainland U.S. each decade.
Saffir-Simpson Category* All Major
Decade 1 2 3 4 5 1,2,3,4,5 3,4,5
1851-1860 8 5 5 1 0 19 6
1861-1870 8 6 1 0 0 15 1
1871-1880 7 6 7 0 0 20 7
1881-1890 8 9 4 1 0 22 5
1891-1900 8 5 5 3 0 21 8
1901-1910 10 4 4 0 0 18 4
1911-1920 10 4 4 3 0 21 7
1921-1930 5 3 3 2 0 13 5
1931-1940 4 7 6 1 1 19 8
1941-1950 8 6 9 1 0 24 10
1951-1960 8 1 5 3 0 17 8
1961-1970 3 5 4 1 1 14 6
1971-1980 6 2 4 0 0 12 4
1981-1990 9 1 4 1 0 15 5
1991-2000 3 6 4 0 1 14 5
2001-2004 4 2 2 1 0 9 3
1851-2004 109 72 71 18 3 273 92
Average Per Decade 7.1 4.7 4.6 1.2 0.2 17.7 6.0
* Only the highest Saffir-Simpson Category to affect the U.S. has been used.
___________________________________________________________________________________
1 Chart taken from “The Deadliest, Costliest, and Most Intense United States Hurricanes from 1900 to 2000 (and Other Frequently Requested HurricaneFacts) by Jerry D. Jarrell (retired), Max Mayfield, and Edward N. Rappaport; NOAA/NWS/ Tropical Prediction Center Miami, FL and Christopher W. Landsea;NOAA/AOML/Hurricane Research Division, Miami, FL
U.S. HURRICANE STRIKES BY DECADE1
© 2005 Jim Reed
world temperatures and intense hurricanes striking the United States. The
extreme damage we are experiencing with recent hurricanes is directly tied
to the explosion of population in coastal counties along the Atlantic and
Gulf Coasts. If you put people, houses and businesses more in the path of
a destructive storm, more damage will result.
The accompanying table charts the frequency of both hurricanes and
intense hurricanes (Category 3 or higher):
Meteorologists have known for decades (long before the term “global warming”
was coined) there is a 25 to 40 year cycle of hurricanes in the Atlantic Basin
(Atlantic Ocean, Caribbean Sea and Gulf of Mexico). As the table indicates,
hurricanes have been less frequent as global temperatures have risen in the
80’s and 90’s. In the 1980’s, Dr. Bill Gray of Colorado State University, one
of the nations leading hurricane researchers, forecast higher numbers and
intensities of hurricanes in the 90’s and first decade of the 2000’s.
Whether a correlation between global weather and hurricanes exists or not is
the “wrong question” for business continuity. Our opinion is that far too much
time is being spent worrying about the effects/consequences of global warming
and far too little is spent planning for extreme weather, regardless of the cause.
B

Effective, pro-active planning is the only course of action that businesses
can follow to minimize the effects of extreme weather.
In Conclusion
When you are responsible for contingency planning, consider the following
analogies: You would not go to court without an expert attorney. You would
not attempt do-it-yourself cancer surgery after consulting WebMD.® When
serious natural hazards threaten your enterprise, you need expert advice and
consultation. Regardless of whether it is a hurricane, blizzard, ice storm or
tornado, WeatherData can assist with the planning and information needed
to make critical decisions for specific operations at specific sites. We take
the guesswork out of decision-making as it applies to the risks related to
extreme weather.
About WeatherData, Incorporated
Since 1981, WeatherData has partnered with Fortune 500 companies in
proactively managing the risks and opportunities associated with high-impact
weather and natural hazards. Through an innovative blend of research,
communication services and technology, WeatherData provides User-Centric™
services– information tailored to the specific requirements of an organization
combined with unique geographic precision.
© 2005 Jim Reed
“Loss of life in Katrina will be
much higher than Andrew
and may be higher, perhaps
significantly so depending on
the exact path and intensity,
than in Camille.”
Economic and Sociological Effects
WeatherData, Inc., Aug. 28, 2005
WeatherData® Protecting Your
Business. Protecting You

Last year during Hurricane Charley, nearly 1,400 miles were warned.Miles struck: 197.
In all, hundreds of thousands of people fled their homes, shutteredtheir businesses and prepared for the worst.
But the alerts were false alarms.
For years, forecasters at the [NOAA National Weather Service‘s]Hurricane Center have posted widespread warnings to cover theiruncertainties, triggering multimillion-dollar evacuations and themass closings of schools, companies and governments.
In nearly half of the 29 hurricanes that struck the United States sinceHurricane Andrew in 1992,The Herald found, three-quarters of thewarning areas per storm were ultimately left untouched byhurricane winds.
•••
...at private companies, meteorologists say they carefully weigh theprobability of a storm striking in the warning area against the costsof closing businesses.
As Hurricane Charley bore down on Florida in 2004, Blue Cross andBlue Shield's Risk Management Director John Phelps had to decidewhether to recommend closing the company's Jacksonville offices,which would have cost $180,000 in lost labor -- every hour. At thesame time, the safety of roughly 6,500 employees was at stake.
The private weather service WeatherData, in Wichita, Kan., toldPhelps that Hurricane Charley's strongest winds would not strikeJacksonville, even though the Hurricane Center had put NortheastFlorida under a warning.
''Had we not had the WeatherData forecast,'' Phelps said, ''we wouldhave closed.''
Excerpts from the Miami HaroldTuesday, October 11, 2005
E

WeatherData® Inc.245 North Waco Street, Suite 310Wichita, Kansas 67202Telephone (316) 265-9127www.weatherdata.comwww.stormhawk.com
© 2005 WeatherData, Inc. All rights reserved
Protecting Your Business. Protecting You.
®