CASE(STUDY:(( WILLY(STREET(GROCERY(COOPERATIVE( Studies/Willy Street Coop Case Study... ·...
35
“I’m pleased to announce that sales forecasts are exceeding expectations at both Willy East and Willy West. Sales for the combined operations are running at 10% over what was budgeted.” 1 There was an audible sigh of relief in the boardroom as Anya Firszt, Willy Street Coop’s general manager continued to share positive statistics about the Coop’s new location. It had been nine months since Willy Street Coop opened its second location and both sales and membership were exceeding expectations. And despite the growth at Willy West, sales continued to be strong at the flagship location on the east side. After years of hard work and several aborted efforts to expand, it was a relief to finally have Willy Street’s second store open, embraced by the community, and on track for financial success. As this success began sinking in, minds naturally turned to the Coop’s next step. History of the Willy Street Grocery Coop The Willy Street Grocery Cooperative, is a consumerowned coop located in Madison, Wisconsin, and has been one of the city’s major purveyors of natural and organic foods since it opened its first storefront in 1974. The Coop developed in response to an increasing demand for natural foods in the 1960s and 1970s as well as the departure of a local buying club from the Williamson Street area, which at the time was a somewhat rundown neighborhood with a diverse socioeconomic makeup. Since its humble beginnings, the Coop has experienced impressive growth and now has 24,000 memberowners, approximately 275 employees, and over $26 million in annual sales. 2 (See Appendix A.) The Coop’s first storefront was located in the heart of the neighborhood at 1101 Williamson Street. Willy Street Coop and Nature’s Bakery Cooperative shared this small space and offered a limited selection of products. A small staff of volunteers ran the store, while another group of volunteers sought out a larger location. In October of 1974, the Coop moved to 1014 Williamson Street, which had 900 square feet of retail space as well as some storage space. The Coop was able to increase its inventory and hire six fulltime workers. At first, the staff was not paid but was allowed to take up to $50 per week for sustenance until the Coop was financially stable. Many of the workers took less or none of the allotted $50 and within three months the Co op was able to begin paying the staff. 3 The Coop quickly outgrew this space and relocated once again in October 1977. The new space, at 1202 Williamson Street, had 1,600 square feet of retail space and 2,500 square feet of office and storage space. The inventory expanded greatly, sales doubled almost immediately, and membership grew from 1,300 to 4,000 in five years. 4 This success came with staff and governance challenges. Up until this point, the Coop had had no formal governance system, board of directors, or staff structure—the staff operated on a non hierarchical, consensus basis and most CASE STUDY: WILLY STREET GROCERY COOPERATIVE By Courtney Berner University of Wisconsin Center for Cooperatives September 2011
Transcript of CASE(STUDY:(( WILLY(STREET(GROCERY(COOPERATIVE( Studies/Willy Street Coop Case Study... ·...

“I’m pleased to announce that sales forecasts are exceeding expectations at both Willy East and Willy West. Sales for the combined operations are running at 10% over what was budgeted.”1 There was an audible sigh of relief in the boardroom as Anya Firszt, Willy Street Co-‐op’s general manager continued to share positive statistics about the Co-‐op’s new location.
It had been nine months since Willy Street Co-‐op opened its second location and both sales and membership were exceeding expectations. And despite the growth at Willy West, sales continued to be strong at the flagship location on the east side. After years of hard work and several aborted efforts to expand, it was a relief to finally have Willy Street’s second store open, embraced by the community, and on track for financial success. As this success began sinking in, minds naturally turned to the Co-‐op’s next step. History of the Willy Street Grocery Co-‐op The Willy Street Grocery Cooperative, is a consumer-‐owned co-‐op located in Madison, Wisconsin, and has been one of the city’s major purveyors of natural and organic foods since it opened its first storefront in 1974. The Co-‐op developed in response to an increasing demand for natural foods in the 1960s and 1970s as well as the departure of a local buying club from the Williamson Street area, which at the time was a somewhat run-‐down neighborhood with a diverse socio-‐economic make-‐up. Since its humble beginnings, the Co-‐op has experienced impressive growth and now has 24,000 member-‐owners,
approximately 275 employees, and over $26 million in annual sales.2 (See Appendix A.)
The Co-‐op’s first storefront was located in the heart of the neighborhood at 1101 Williamson Street. Willy Street Co-‐op and Nature’s Bakery Cooperative shared this small space and offered a limited selection of products. A small staff of volunteers ran the store, while another group of volunteers sought out a larger location.
In October of 1974, the Co-‐op moved to 1014 Williamson Street, which had 900 square feet of retail space as well as some storage space. The Co-‐op was able to increase its inventory and hire six full-‐time workers. At first, the staff was not paid but was allowed to take up to $50 per week for sustenance until the Co-‐op was financially stable. Many of the workers took less or none of the allotted $50 and within three months the Co-‐op was able to begin paying the staff. 3
The Co-‐op quickly outgrew this space and relocated once again in October 1977. The new space, at 1202 Williamson Street, had 1,600 square feet of retail space and 2,500 square feet of office and storage space. The inventory expanded greatly, sales doubled almost immediately, and membership grew from 1,300 to 4,000 in five years.4
This success came with staff and governance challenges. Up until this point, the Co-‐op had had no formal governance system, board of directors, or staff structure—the staff operated on a non-‐hierarchical, consensus basis and most
CASE STUDY: WILLY STREET GROCERY COOPERATIVE
By Courtney Berner University of Wisconsin Center for Cooperatives September 2011

Page 2
governance issues were addressed at monthly membership meetings. As the Co-‐op grew, this system no longer met the Co-‐op’s needs and the business began experiencing financial losses. In response, the membership elected its first board of directors in 1979 and hired its first general manager in 1982.5
Historical meeting at the Willy Street Co-‐op
By 1985, the Co-‐op was back on sound financial footing and decided to expand into available space in their building. Sales continued to grow in the 1980s and by 1990 the Co-‐op was able to purchase the building.6
In 1998, the board began yet another conversation about expansion—but there were nine board members and nine different visions of that what expansion meant. After 20 years at 1202, the Co-‐op had outgrown the space. It was inefficient and needed renovation and equipment was starting to break down. The board discussed renovating the current location but at some point it became clear that they should look for a new location.
The most recent Willy Street Co-‐op expansion on Williamson Street took place in 1998 with the purchase of the former Eagles Club building at 1221 Williamson. The building has 20,000 total square feet and 9,500 square feet of retail space. The building was remodeled and opened for business in October 1999.7 Since then, the Co-‐op has continued its impressive growth. Between
2000 and 2004, annual sales grew from $6.34 million to $11.4 million, nearly doubling sales per square foot.8 In fact, the Co-‐op experienced so much growth after the move to 1221 that they immediately began thinking about their next step. Exploring the Possibilities Opportunities Committee In response to rapid growth at the 1221 location, the Co-‐op formed an Opportunities Committee in 2004 to explore potential expansion ideas. The Opportunities Committee was a member-‐owner-‐driven committee comprised of four staff members, three board members, and seven member-‐owners at large. In order to staff the committee with a good representation of member-‐owners, general manager Anya Firszt placed a call for member-‐owner volunteers in the Co-‐op’s newsletter. She also asked three members of other local grocery co-‐ops—Regent Street and Mifflin Street—to join the committee. Firszt emphasized that member-‐owner involvement in the committee was prioritized “because owner loyalty is what makes our business a success” and it was critical to have member-‐owner “investment in the decision of where to locate.”
Once the committee was formed, members drew up a long list of possibilities including remodeling the 1221 location, buying a farm, starting a restaurant, launching a daycare service, opening an offsite kitchen facility, establishing a natural foods warehouse, and opening a second store, among others. Of these, three ideas rose to the top and were adopted by the board as potential strategies: 1) Open a second store 2) Open an offsite production facility, and 3) Change the footprint of 1221 to better accommodate the Co-‐op’s growth. Initially the ideas were prioritized in that order, but over the years their order of priority shifted a few times.
Why Expand? In 1999, a market study revealed that at $17-‐18 million in sales, Willy Street Co-‐op would be maxed out on their current space—and at $18.4

Page 3
million in sales they were. On average, a typical grocery store turns their inventory over 18-‐20 times per years and has sales of $700-‐$1,100 per square foot. In 2007, Willy Street was turning their inventory over 35 times per year and averaging sales of $1,900 per square foot. While these figures were good for business, they created major labor and space constraints that put too much pressure on the store and staff.
Willy Street Co-‐op’s current store on the east side.
In addition to pressure on the space and staff, member-‐owners began to comment on how crowded the store was and the need for additional parking. Many member-‐owners were driving from around the county to shop at the Co-‐op. Beyond alleviating crowding, these member-‐owners were also interested in having access to a more conveniently located Co-‐op. Many member-‐owners wanted a store of their own in their neighborhoods.
Convincing the board of the need for a second location was easy—they knew something needed to happen to alleviate pressure on 1221 and quickly came to the conclusion that the best idea was to open another store. The board took seriously the opportunity to create good jobs in a difficult economy, give current staff professional growth opportunities, and provide additional market opportunities for local farmers. The board of directors also had an interest in protecting the Co-‐op’s position in Madison’s natural foods market. With the arrival of Whole Foods and
Trader Joes in the mid-‐2000s, the Co-‐op needed to be proactive about diversifying and maintaining its place in the market. The real challenge was picking a location that met the committee’s criteria and would actually have a downsizing effect on 1221.
Monroe Commons Monroe Commons, in the heart of the Monroe Street neighborhood, was the first potential expansion opportunity to arise. The Monroe Commons development project was an ideal location. The community is highly educated, affluent, and located in close proximity to the University of Wisconsin-‐Madison campus.
An aging grocery store was originally on the Monroe Commons site. When the owner retired and was going to sell the property to Walgreens, over 400 neighbors met to explore other options to keep a grocery in the neighborhood. Monroe Street Grocery Cooperative came into being as a result, and it spent the next several years negotiating with the city and new owners of the site on various redevelopment plans, eventually including the Monroe Commons project. The Monroe Commons developer’s plan, which included demolition of the old site, TIF financing, and the building of a very large condo project, was only approved once a space for a retail grocery was included. The developers asked that they be allowed to negotiate directly with Willy Street, since Monroe Street Grocery Cooperative was not yet a proven successful grocery business. The Monroe Street Co-‐op agreed to step aside at which point Willy Street entered into negotiations with the developer.
On July 5, 2004, member-‐owners received a ballot and four-‐page summary of the benefits, costs and risks of two ventures: opening a second store on Monroe Street and the development of an off-‐site kitchen. At the time, the Co-‐op’s bylaws stated that member-‐owner approval was required for any unbudgeted capital expenditure on expansion over $50,000.9 The membership voted to open both the store and an off-‐site production kitchen.

Page 4
After 10 months of negotiations, however, the Monroe site developer and the Co-‐op could not agree on terms and eventually broke off negotiations. The developers behind the Monroe Commons were asking $28 per-‐square-‐foot, a price the Co-‐op could not afford to pay, so the Co-‐op walked away.
Through this disappointment, Willy Street learned that it can be difficult to do business as a cooperative in a corporate environment. Many cooperatives choose to share information freely with their member-‐owners, making it more difficult to keep business dealings secret. In the case of the Monroe Street expansion, the board asked the membership to vote on the expansion proposals before they had negotiated a deal with the site developers. The board hoped that securing member-‐owner approval would prove their interest in the Monroe Commons site and put the Co-‐op in a better position during negotiations.10 In real estate dealings, however, secrets are often critical to success. Based on this learning experience, the board of directors kept the remaining list of potential sites private until a deal was secured.
Metropolitan Place In late 2006, the Co-‐op began negotiating with the Buckingham Corporation to operate a retail grocery store in the Metropolitan Place Condominium project being developed on West Mifflin Street in downtown Madison. After sinking months of work and approximately $600,000 into the project, the Co-‐op learned in early 2008 that Buckingham could not meet its financial obligations to the bank. As a result, the development was put on hold indefinitely and the Co-‐op had to terminate the agreement. In addition to the time and money the Co-‐op had already invested in the project, the Co-‐op had hired staff for the new store six months prior to the proposed opening date. When the deal fell through, these combined factors put a major strain on the Co-‐op’s finances and frustrated member-‐owners and staff. It was a tense, difficult time and people wanted someone to blame. A
board member at the time confessed that the board “missed the ball on pulling the plug on MP2 [Metropolitan Place]. We were too trusting.” None of the board members who were on the board when the Metropolitan Place deal fell through were re-‐elected during the next general election. Most board members believe that the unusually high turnover rate was due to the failed expansion efforts.
The loss of the Monroe Commons and Metropolitan Place opportunities was a huge blow to the Co-‐op’s expansion efforts. While other potential sites were still available, including locations on the north and east sides of Madison as well as in Middleton, the Co-‐op’s consultant, Dakota Worldwide Corp., had highly recommended both sites due to their strong demographics and sales potential.
Offsite Production Kitchen In the middle of the Metropolitan Place expansion process, the Co-‐op opened an offsite kitchen, which enabled the Co-‐op to create additional floor space at 1221. While the Co-‐op had planned to open the second retail location before opening the offsite kitchen, by 2004, they had completely outgrown their refrigeration and storage space at 1221. The new facility alleviated some pressure on 1221 and helped the Co-‐op grow their deli sales. The facility was designed to supply product to at least two retail operations and it was obvious from the beginning that the kitchen could expand its operations. When it first opened, it was only running eight hours per day, but it is now operating sixteen hours per day due to increased demand for prepared foods.
Second Site Committee After the Co-‐op regrouped from the Metropolitan Place disappointment, Firszt formed a Second Site Committee that focused exclusively on evaluating a list of 24 potential sites that she, a realtor, and a few board members had compiled. The Second Site Committee, which did not include any board members, was comprised of two people from the Opportunities Committee and five member-‐

Page 5
owners who were new to the process. The seven member-‐owners represented different geographic areas in and around Madison. Firszt selected committee members based on individuals’ interest in the Co-‐op over the last ten years. She also chose professionals, including a commercial real estate broker and an architect, whose skill sets would be valuable in the decision making process.
The committee used market studies from Dakota Worldwide (see Appendices B and C), a tiered set of evaluation criteria, (see Appendix D), and site visits to narrow the list down to two prospective locations. To accomplish this task, the Co-‐op hired an outside facilitator who led a series of seven meetings over the course of three months.11 The facilitator worked hard to use facts and a structured process to bring the group to a consensus decision. The two biggest difficulties during the process were getting people to agree on the evaluation criteria and to look beyond their first choice.
As the committee worked through the list, they dropped a few sites that were no longer available. Midway through the process, the committee requested an updated market study from Dakota. (See Appendix E.) This second Dakota study eliminated additional sites that did not have promising demographic or sales data. For many years, the Co-‐op had been encouraged by the city and neighborhood associations to open a store in an underserved neighborhood. This second round of market data confirmed that it would be a significant financial risk for the Co-‐op to open a second store in one of these neighborhoods. Ultimately, the committee chose to prioritize membership and sales potential in order to safeguard the Co-‐op’s overall financial health.
One of the major disagreements in the group was whether the second location should be downtown or not. Some committee members wanted the store to be downtown even if it meant picking a site that met fewer of the evaluation criteria. The other big push was in
Middleton, a small city on the outskirts of Madison. There had been some effort to find a location further east or north, but it eventually became clear that Middleton was the best option.
The 2010 market study update by Dakota concluded that Willy Street’s market share of the Madison area grocery market would nearly double if they located their second store in Middleton. (See Table 1. See Appendix E for full market study update.) According to the 2007 Dakota study, however, opening the second store in Middleton would have the least downsizing effect on 1221 of all the sites on the table. (See Appendix B.) This was problematic given that one of the main reasons cited for needing a second storefront was overcrowding at the 1221 location. In addition to increasing the Co-‐op’s market share, the benefits of locating in Middleton included the following:
• Favorable demographics including high income and education levels (See Appendix F.)
• 100,000+ people within a five-‐mile radius • A strong sense of community • Few current member-‐owners in city so
excellent opportunity for attracting new member-‐owners
• Up and coming neighborhood that is growing. Middleton was ranked 4th in CNN/Money’s "Best Places to Live 2009."
TABLE 1: Market Share of Madison-‐area of Key Competitors Before and After Expansion Chain Market
Share in 2010
Projected Market Share w/ 2nd Willy St. store in Middleton
Sentry (4 stores) 6.19% 6.12% Whole Foods 2.58% 2.54% Trader Joes 1.70% 1.68% Willy St. Co-‐op 1.83% 2.67% Regent St. Co-‐op 0.12% 0.12%
Eventually, the committee narrowed the list to two sites in Middleton: 6825 University and 6310 Century. In May 2009, the Second Site Committee

Page 6
evaluated the pros and cons of the two Middleton sites they had selected. This part of the process was especially painful because people had strong opinions about one site or the other. Some committee members really wanted the Co-‐op to build its own new building, but to some it did not seem environmentally responsible to build a whole new building if they could use an existing structure. In the end, the committee voted to recommend the University Avenue site and the board took the committee’s recommendation.
Exterior of Willy West
The Challenges of Opening a Second Store While many aspects of opening Willy West were very successful, there were also quite a few challenges. Fortunately, the board and management learned a lot from their earlier expansion attempts and thus avoided some potential pitfalls. One person involved in the process talked about the improvements since their first expansion attempt downtown:
“We failed in phase one, but we learned from our mistakes. Despite falling on our face, we executed almost a textbook transition to the second site. That’s the real story. The staff really stepped up and learned from it. The process was much better the second time for four reasons: a better agreement, a project plan, a project manager, and appropriate staffing.”
Even a textbook transition has wrinkles. There were four key challenges during the opening of
the second store: financing, staffing and management, governance, and culture.
Financing Financing for Willy West included a landlord tenant improvement allowance, a member-‐owner bond drive, cash held by the Co-‐op, vendor credit, and a business loan.12 Total financing for the project was $3,450,562.
The Co-‐op decided to borrow money from member-‐owners to help finance the second store. To do so, they used a financial tool called owner bonds. A bond is a formal agreement to pay back borrowed money with interest by an agreed upon date. Cooperative businesses occasionally use owner bonds to finance major capital investments. The Co-‐op had a goal of raising $600,000 in member-‐owner bonds but was authorized to raise up to $1 million. They reached that stretch goal in an astonishing 39 days. Money earned from the bond drive provided a portion of the cash needed to finance the second store.
The Co-‐op sought bids for debt financing from a variety of sources including national commercial banks, community banks, and credit unions. In keeping with Cooperative Principle Six, cooperation among cooperatives, a few board members advocated for working with a credit union. After reviewing several options, the Co-‐op chose to work with Summit Credit Union. Summit had recently developed a strategic initiative to work more closely with cooperatives and the Willy Street expansion was the credit union’s first big commercial loan of this nature.
As a result of the expansion financing, the Co-‐op took on approximately $1.5 million in long-‐term liabilities between fiscal years 2010 and 2011. This raised the Co-‐op’s long-‐term liabilities to a total a $2.8 million, the highest level in the Co-‐op’s history.13
Staffing and Management Several informants identified internal staffing issues as a major challenge during expansion. The
Page 7
management team has worked together for a long time and is tightly connected. This helped streamline the process, but the change was still difficult. The leadership worked hard to put mechanisms in place that made people felt safe and supported through the transition and an enormous amount of planning went into making the opening a success. Nonetheless, some staff felt that the store opening was too rushed.
There were also concerns that the labor estimation was wrong and insufficient training was provided to new staff members. One staff member shared that the hiring process didn’t go quite as smoothly as they had hoped. She added, “We didn’t know how to do it then and I’m not sure we know how to do it now. Maybe a completely smooth process doesn’t exist. We still kept a positive attitude, but I was really feeling for a lot of the managers who were working here and training at the new store. It was really intense.” Once the second store was up and running an additional challenge emerged, stretching management across two stores that are a 25-‐minute drive apart. So far, the board and staff have focused on continuity of service and striking the right balance between bringing the eastside culture to the new store and allowing the new store to develop it’s own culture.
Governance There were a lot of questions at the board level regarding the best governance model for two stores:
• Should there be one board or two? • Where should the annual meeting be
held? • Should there be board voting by
geographic district to ensure equal representation from the east and west sides of town?
• What is the best way to get Middleton residents elected to the board?
• How do we retain the same sense of community?
Ultimately, the board decided to maintain a single board without seats based on geographic district but they have yet to tackle the complex questions about community, annual meetings, and the need for representation beyond the east side. Culture The original Willy Street Co-‐op has a strong culture that reflects the culture of the neighborhood surrounding the store. Bringing the values of Willy East to Willy West while still allowing the new store to develop its own culture was a major challenge. Anytime a business has more than one location, it can be difficult to transfer the values from one site to two. At the same time, it is important to allow for some individuality, especially since the populations being served at each location are different.
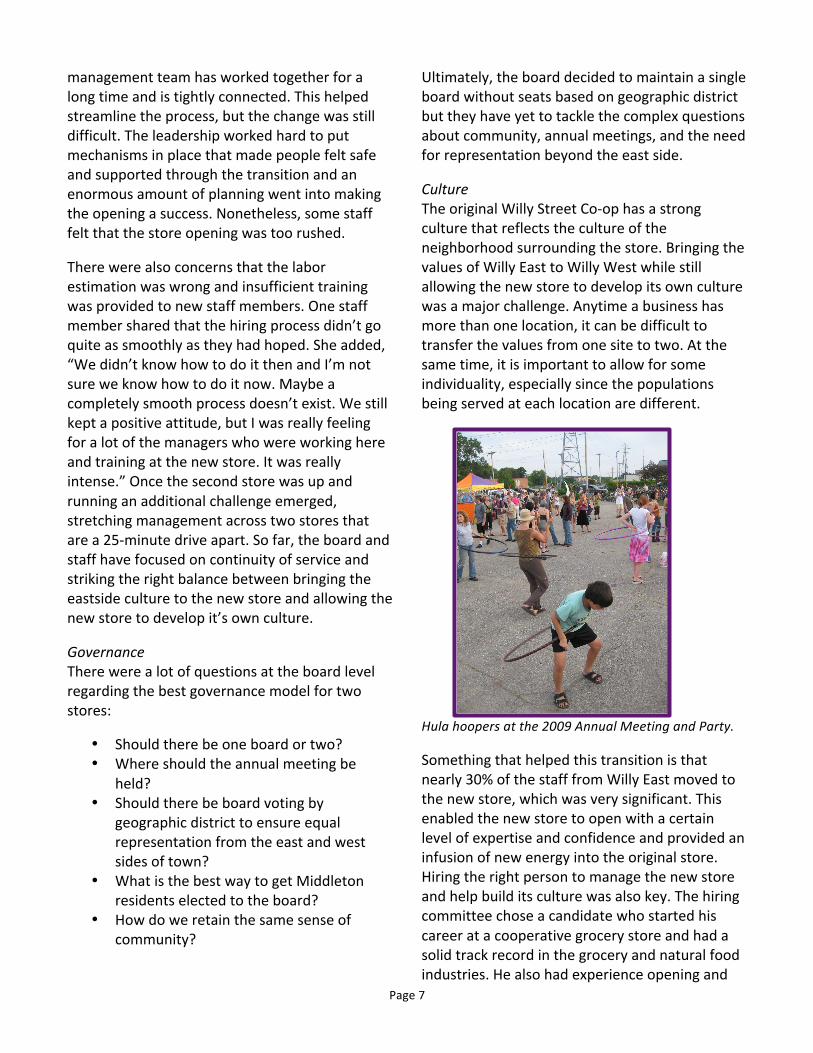
Hula hoopers at the 2009 Annual Meeting and Party.
Something that helped this transition is that nearly 30% of the staff from Willy East moved to the new store, which was very significant. This enabled the new store to open with a certain level of expertise and confidence and provided an infusion of new energy into the original store. Hiring the right person to manage the new store and help build its culture was also key. The hiring committee chose a candidate who started his career at a cooperative grocery store and had a solid track record in the grocery and natural food industries. He also had experience opening and

Page 8
remodeling stores and had worked for years in the local Copps grocery store, which made him a bit of a “hometown favorite.” Possible Next Steps for the Co-‐op There are a number of paths the Co-‐op could have chosen for expansion instead of opening a second location. As the Co-‐op explores future opportunities, many of these options are still on the table—and there are several cooperatives around the country that have tried these options and could share their experiences.
Buy a Farm Over the years, buying a farm has come up several times. Willy Street would not be the first Co-‐op to go down this path. In 2008, Chequamegon Food Co-‐op in Ashland, WI, purchased an 82-‐acre abandoned fruit farm in Bayfield, WI. Despite some member-‐owner opposition, they saw it as an opportunity to help the region’s agricultural community and be an example of sustainable and organic farming. The Chequamegon Co-‐op was able to purchase the farm for 75% of its appraised value, which decreased the perceived risk of the venture.14
In 2007, Willy Street explored the possibility of purchasing Turkey Ridge Organic Orchard in Gays Mills, WI, in order to create a farm-‐to-‐table relationship with a sustainable tenant farmer. They eventually decided to forgo the opportunity for two reasons. First, they were in the middle of negotiations with the Metropolitan Place, so management already had a lot on their plates. Second, the co-‐op was not confident in the business potential of the partnership. The farm idea continues to be popular with member-‐owners though some have voiced opposition. One member of the Opportunities Committee said that she saw the value in it, but just doesn’t think it is the right direction for the Co-‐op.
The cost of cropland is also a major barrier to the Co-‐op owning a farm. In 2010, the average sales price for a 10-‐35 acre bare land farm in Dane County was $5479/acre, compared to the state
average of $3194/acre. While land sale prices in Dane County have decreased 10% since 2005, they are still pose a major challenge to starting a new farm.15 In 2011, the Milwaukee Sentinel Journal reported that prime farmland sells for $5,000 to $10,000 an acre in the state depending on the location.16
Increase Offsite Kitchen Production Willy Street’s offsite production kitchen produces baked goods, deli items, and other prepared foods. The Co-‐op retails these items at both Willy Street locations and sells them wholesale to Regent Street Co-‐op and the EVP coffee shop at the University of Wisconsin VA Hospital. The offsite kitchen is currently operating at two-‐thirds capacity, so there is excellent growth potential. The Co-‐op could increase its sales, support of local growers, and overall impact by ramping up off-‐site kitchen production to full capacity. The additional prepared food items could help the Co-‐op capitalize on its market niche by targeting local cafes, grocery stores, and delis that serve local and organic fare.
Remodel 1221 Remodeling the 1221 store has been on the list of expansion possibilities since the first Opportunities Committee was established. Remodeling 1221 will definitely need to happen, the real question is when. While the store could benefit from a facelift and additional retail space, there are some negatives to remodeling. First, the cost of remodeling an existing structure can be very high. Second, it will be a challenge to remodel the site given the limitations that the current footprint imposes. The Co-‐op would like to add a second level to the current building but management is hesitant to make any big changes soon.
Open a Restaurant Given the Co-‐op’s successful deli and catering operations, starting a restaurant might be the logical next step for the Co-‐op. Other grocery co-‐ops have successfully made this leap.

Page 9
In November 2004, the People’s Food Co-‐op in LaCrosse, WI, opened Hackberry’s Bistro in conjunction with a major store renovation and expansion. Hackberry’s, a full-‐service upscale restaurant, was intended to compliment the Co-‐op’s popular deli. In early 2005, General Manager Michelle Schry wrote that, “The restaurant is a risky proposition. There haven’t been many co-‐ops to try it, and those who have tried haven’t necessarily been blessed with immediate financial success. But a restaurant was something that came up over and over in focus groups.” 17 By January 2005, both the expanded store and restaurant were on track to meet budget goals, but the economic downtown in 2009 had major impacts on Hackberry’s success. ”Revenues have shown only minimal growth, but due to our ability to ‘co-‐house’ these businesses, which keeps the restaurant overhead down, we've been able to make money on it...not a ton, but it has added very important margin to the store overall.” 18
Weaver Street Market in Carrboro, NC, operates Panzanella, an award-‐winning Mediterranean-‐style trattoria offering dishes prepared with seasonal ingredients. The restaurant opened in 2000 and quickly became a local favorite in Carrboro and Chapel Hill. Opening Panzanella was a strategic decision for Weaver Street. In 2001, Co-‐op founder Ruffin Slater wrote: “We realize that our strategy is different from the growth strategy of replicating successful stores in markets with similar demographic characteristics. In our case, with Whole Foods already thriving in two neighboring cities, we weren't comfortable with that strategy. Moreover, we feel that working from our established base of membership and community recognition we have a good chance of making co-‐ops a major force in our town's future.”19 While Panzanella was an immediate success with diners, financial and operational successes were more difficult to achieve. Ruffin emphasized that “The behind the scenes personnel and operational challenges will ease over time as we become more savvy in the restaurant industry”20 Ten years later, Panzanella
is still serving up delicious, seasonally based meals.
Partner with Non-‐Profits on Farm to School Programs There is strong momentum behind the Food to School movement, particularly in Wisconsin. Willy Street could become a strong business partner in this movement by leveraging existing relationships with growers or excess capacity in the offsite kitchen to help bring sustainable, local food to Madison area schools.
Open a Third Store Depending on Willy West’s evolution, opening a third store could be the best way to continue spreading the Co-‐op’s mission. There would be some powerful, tangible benefits to opening another store including job creation, increased management opportunities for current staff, reduced prices through larger purchases, and additional market opportunities for local farmers. With two successful stores under their belt, the Co-‐op might also be in a better position to move into a financially riskier, underserved neighborhood. Additionally, sales at Willy East have nearly returned to their original levels, so opening a third store may be the only way to achieve the downsizing effects on 1221 that the Co-‐op desires. Is Willy Street Getting Too Big? While most member-‐owners were incredibly supportive of the Co-‐op’s expansion efforts, some member-‐owners have accused Willy Street of getting too big and “selling out.” One long-‐time member-‐owner mentioned that she has “personal friends who were very opposed to a second location. To them the Co-‐op was becoming too big and losing its co-‐op feel. They’ve also been members since the 70s so they remember when you went in and did your three-‐hour shift. And now we don’t even permit that. So to them, they felt like the Co-‐op was selling out and becoming more like a big business. But I don’t really know how widespread that sentiment was.”

Page 10
The March 2006 issue of The Reader, the Co-‐op’s monthly newsletter, included the following letter from a member-‐owner:
“I am so tired of hearing about ‘expansion.’ If the coop is making so much money, why not consider the following instead:
1. lower mark-‐up margin (i.e. lower prices) 2. donate money to other local cooperative, struggling businesses (e.g. Mifflin) 3. increase the amount given to the Community Reinvestment Fund 4. raise staff salaries and benefits
I am deeply saddened that Willy Coop is becoming so mainstream and corporatized, with the sole goal of ‘expansion’ and with ‘management’ making all business decisions. Nowadays, it seems to be almost a misnomer to call the store a cooperative. With ‘expansion’ constantly on the mind, it feels to me like the ‘management’ of Willy Coop is trying to make the store the Wal-‐Mart of the cooperatives. Please, no!! As a member-‐owner, I ask you, the ‘management,’ to remember the store’s roots. No more talk about ‘expansion.’ Please.”21
Other member-‐owners disagree. One member-‐owner emphasized that “people who are having success doing good work have an obligation to do more of it.” Willy Street’s mission is to bring healthy, natural foods to consumers and support a more sustainable, equitable food system. If they are able to successfully do that by opening additional stores, then they should open additional stores.
Evaluating the best way for a Co-‐op to serve its member-‐owners is not an easy task. Are member-‐owners best served by Willy Street confronting broad food system deficiencies or by lowering prices and increasing convenience? Which is more important and can they do both? Even the general manager has questioned the Co-‐op’s role in the community and whether or not it should be in the business of starting other co-‐ops.
“In some ways, for me it’s tough to balance if it is our job to open other co-‐ops. Because I do think that co-‐ops are somewhat grassroots efforts and communities build them and that’s why they thrive. But I do know that it’s very hard to do as a start-‐up. So my long-‐term goal is that the Middleton store might be spun off and turned into a Middleton co-‐op. I know that’s a ways down the road and that not everyone would agree with me.”
Willy Street board members serve cake at the annual Owner Appreciation event.
What’s Next for Willy Street Co-‐op? As a well-‐respected, successful business, Willy Street Co-‐op is in a position to broaden its positive impact on the Madison community. But what is the best way for the Co-‐op to do that? Not surprisingly, the answer to this question differs depending on who you ask. The following quotes represent the diversity of ideas and opinions held by staff, board members, and member-‐owners.
“I’d like to see them replicate the success in whatever way they think is best. It might not be another store, it might be something else. The co-‐op is a very successful enterprise. If you look at the ends policies they talk about being an economic cornerstone. We should not rest on our laurels.”
“I’d like the co-‐op to do some other things besides just retail grocery. Manage co-‐op

Page 11
housing? Run a daycare center? Sometimes the management team will say ‘we know how to run a grocery store but we don’t know how to do these other things.’ But we have a very highly skilled management team and I bet they could.”
“I would like to see the Co-‐op add a third site in a couple of years.”
“We have been in expansion mode for so long that we haven’t been able to focus on our core business activities and processes. I think we should slow down and focus on doing what we are already doing well.”
Strategic Priorities In February 2011, the Board of Directors met to discuss Willy Street’s strategic priorities for the years ahead. The board whittled ten ideas down to three core initiatives:22
1) Develop the local food system 2) Pursue green initiatives 3) Make the co-‐op more financially
accessible
Willy Street and its member-‐owners have an exciting future ahead, ripe with possibility. Given the Co-‐op’s overall mission, strategic priorities, past experiences, and financial reality what should be the Co-‐op’s next step? Appendices Appendix A: Willy Street Co-‐op Financials, 3rd Quarter, 2011 Appendix B: 2007 Dakota Study Appendix C: 2006 Dakota Study Appendix D: Tiered Evaluation Criteria Appendix E: 2010 Dakota Study Update Appendix F: Demographic Data Appendix G: Financial & Operational Statements, 1998-‐2005 Appendix H: Map of Willy Street Co-‐op Locations
Page 12
In addition to the below citations, a selection of current and former board members, staff, and management were interviewed for the purpose of writing this case study. 1 Firszt , Anya. General Manager’s Report: Business Matters. The Willy Street Co-‐op Reader. July 2011. 2 Willy Street Co-‐op. Willy Street Co-‐op History. Willy Street Co-‐op Website. Retrieved on June 5, 2011 from http://www.willystreet.coop/history. 3 Willy Street Grocery Co-‐op. Willy Street Co-‐op History. January 10, 2007. Retrieved from http://www.willystreet.coop/history. 4 Willy Street Grocery Co-‐op. Willy Street Co-‐op History. January 10, 2007. Retrieved from http://www.willystreet.coop/history. 5 Willy Street Grocery Co-‐op. Willy Street Co-‐op History. January 10, 2007. Retrieved from http://www.willystreet.coop/history. 6 Willy Street Grocery Co-‐op. Willy Street Co-‐op History. January 10, 2007. Retrieved from http://www.willystreet.coop/history. 7 Willy Street Grocery Co-‐op. Willy Street Co-‐op History. January 10, 2007. Retrieved from http://www.willystreet.coop/history. 8 Firszt , Anya. GM Report. The Willy Street Co-‐op Reader. June 2004. Retrieved from http://www.willystreet.coop/Newsletter/Newsletter_Archive/0406/gm.html. 9 Olson, Lynn. Board Report: A Primer on the Proposed Bylaw Changes. The Willy Street Co-‐op Reader. February 2008. Retrieved from http://www.willystreet.coop/article/326. Current bylaws state that unbudgeted capital expenditures over one percent of the Co-‐op’s total equity shall be approved by the Board of Directors. Any decision to buy or sell the Co-‐op’s building(s) or to spend over ten percent of the Co-‐op’s total equity on an expansion project must be approved by the Owners, using the ballot process described in Section 4.7. Total equity for these purposes is defined as (Total Assets-‐Total Liabilities=Total Equity). 10 Lauber, Renée. Board Report. The Willy Street Co-‐op Reader. July 2004. Retrieved from http://www.willystreet.coop/Newsletter/Newsletter_Archive/0407/board.html. 11 WSGC Second Site Review Committee. PowerPoint. May 2009. 12 Willy Street Co-‐op. Owner Bond Program Information Packet. February 2010. 13 Willy Street Co-‐op. Owner Bond Program Information Packet. February 2010.; FY 2011 figure is an estimated projection; Willy Street Co-‐op. Financial Statements and
Operational Statements for Fiscal Years 1998 to 2005. See Appendix H. 14 White, Tim. Buying the Farm: Chequamegon Food Co-‐op purchases a fruit orchard. Cooperative Grocer. July-‐August 2009. 15 Brannstrom, A.J. Wisconsin Agricultural Land Prices 2005-‐2010. University of Wisconsin Center for Dairy Profitability. February 2011. 16 Barrett, Rick. Demand for farmland fuels higher prices, rents. Milwaukee Journal Sentinel. January 31, 2011. 17 Schry, Michelle. New La Crosse Store and Restaurant Opens: People’s Food Co-‐op jumps from 11,000 to 29,000 square feet. Cooperative Grocer. January-‐February 2005. 18 Schry, Michelle. New La Crosse Store and Restaurant Opens: People’s Food Co-‐op jumps from 11,000 to 29,000 square feet. Cooperative Grocer. January-‐February 2005; Schry, Michelle. Email communication. July 18, 2011. 19 Slater, Ruffin. Panzanella: Fresh Ideas at Weaver Street Market. Cooperative Grocery. #95. July -‐ August 2001. 20 Slater, Ruffin. Panzanella: Fresh Ideas at Weaver Street Market. Cooperative Grocery. #95. July -‐ August 2001. 21 Willy Street Co-‐op. A Customer Comment About Expansion. The Willy Street Co-‐op Reader. March 2006. Retrieved on June 6, 2011 from http://www.willystreet.coop/Newsletter/Newsletter_Archive/0603/gm.html. 22 Bessmer, Jeff. Board Report: 2011 Board Retreat. The Willy Street Co-‐op Reader. April 2011.
WSGC Financial Dashboard
WSGC Confidential 1 Printed on 11/17/11
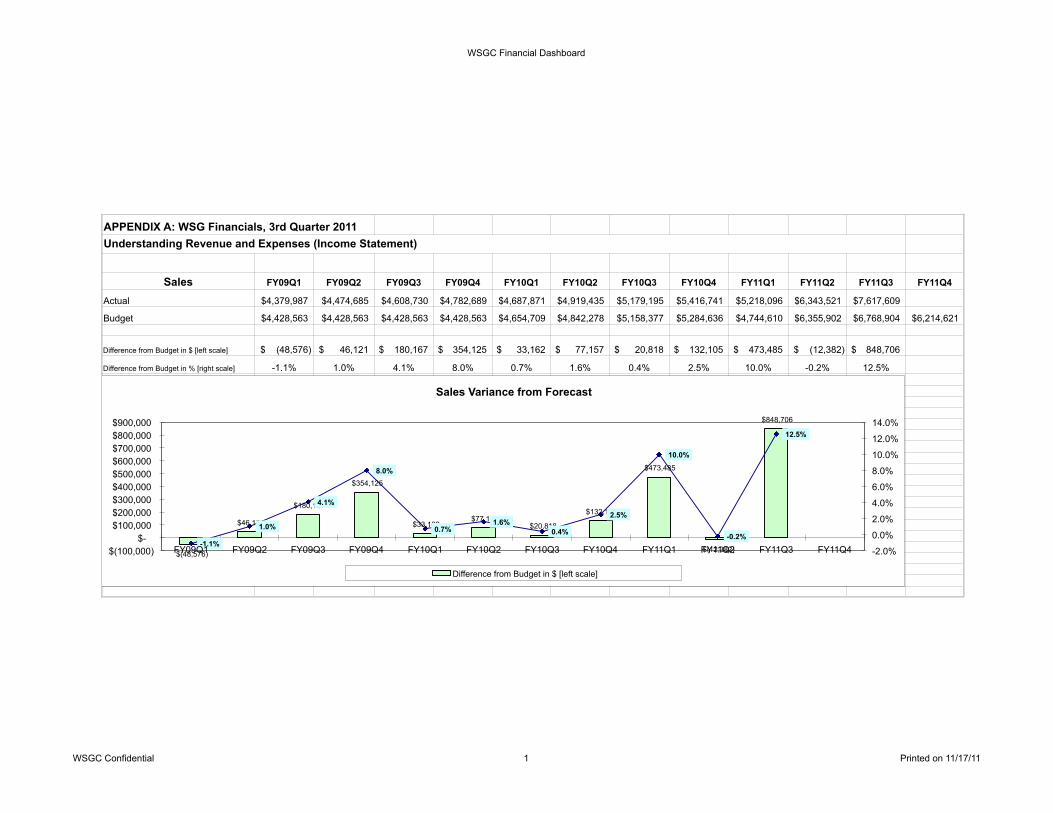
APPENDIX A: WSG Financials, 3rd Quarter 2011
Sales FY09Q1 FY09Q2 FY09Q3 FY09Q4 FY10Q1 FY10Q2 FY10Q3 FY10Q4 FY11Q1 FY11Q2 FY11Q3 FY11Q4
Actual $4,379,987 $4,474,685 $4,608,730 $4,782,689 $4,687,871 $4,919,435 $5,179,195 $5,416,741 $5,218,096 $6,343,521 $7,617,609
Budget $4,428,563 $4,428,563 $4,428,563 $4,428,563 $4,654,709 $4,842,278 $5,158,377 $5,284,636 $4,744,610 $6,355,902 $6,768,904 $6,214,621
Difference from Budget in $ [left scale] (48,576)$ 46,121$ 180,167$ 354,125$ 33,162$ 77,157$ 20,818$ 132,105$ 473,485$ (12,382)$ 848,706$
Difference from Budget in % [right scale] -1.1% 1.0% 4.1% 8.0% 0.7% 1.6% 0.4% 2.5% 10.0% -0.2% 12.5%
Understanding Revenue and Expenses (Income Statement)
$(48,576)
$46,121
$180,167
$354,125
$33,162 $77,157
$20,818
$132,105
$473,485
$(12,382)
$848,706
-1.1%
1.0%
4.1%
8.0%
0.7% 1.6%
0.4%
2.5%
10.0%
-0.2%
12.5%
-2.0%
0.0%
2.0%
4.0%
6.0%
8.0%
10.0%
12.0%
14.0%
$(100,000) $-
$100,000 $200,000 $300,000 $400,000 $500,000 $600,000 $700,000 $800,000 $900,000
FY09Q1 FY09Q2 FY09Q3 FY09Q4 FY10Q1 FY10Q2 FY10Q3 FY10Q4 FY11Q1 FY11Q2 FY11Q3 FY11Q4
Sales Variance from Forecast
Difference from Budget in $ [left scale]

WSGC Financial Dashboard
WSGC Confidential 2 Printed on 11/17/11
Adjusted Gross Margin FY09Q1 FY09Q2 FY09Q3 FY09Q4 FY10Q1 FY10Q2 FY10Q3 FY10Q4 FY11Q1 FY11Q2 FY11Q3 FY11Q4
Actual ( w/o Non-Member Markup) 35.9% 35.6% 35.4% 35.8% 35.9% 35.9% 35.8% 36.2% 36.8% 33.7% 34.8%Budget ( w/o Non-Member Markup) 35.7% 35.7% 35.7% 35.7% 35.8% 35.8% 35.8% 35.8% 35.7% 35.7% 35.7% 35.7%
Difference from Budget in $ [left scale] 11,388$ (4,475)$ (12,251)$ 6,037$ 3,749$ 2,464$ 2,131$ 19,495$ 56,888$ (130,994)$ (70,765)$
Difference from Budget in % [right scale] 0.3% -0.1% -0.3% 0.1% 0.1% 0.1% 0.0% 0.4% 1.1% -2.1% -0.9%
-2.5% -2.0% -1.5% -1.0% -0.5% 0.0% 0.5% 1.0% 1.5%
-$150,000
-$100,000
-$50,000
$0
$50,000
$100,000
$150,000
FY09Q1 FY09Q2 FY09Q3 FY09Q4 FY10Q1 FY10Q2 FY10Q3 FY10Q4 FY11Q1 FY11Q2 FY11Q3 FY11Q4 Perc
ent
Dol
lars
Positive Variance is Good
Margin Variance from Forecast
Difference from Budget in $ [left scale]

WSGC Financial Dashboard
WSGC Confidential 3 Printed on 11/17/11
Expenses BUDGET - YTD ACTUAL - YTD Difference from Budget YTD$ % of budgeted sales $ % of actual sales $ % of sales
Personnel 4,710,378$ 26.4% 5,075,392$ 26.5% 365,013$ 0.1%Depreciation & Amortization 342,530$ 1.9% 234,884$ 1.2% (107,646)$ (0.7%)Occupancy 604,104$ 3.4% 477,981$ 2.5% (126,123)$ (0.9%)Operating 441,053$ 2.5% 505,758$ 2.6% 64,706$ 0.2%Administrative 193,578$ 1.1% 193,157$ 1.0% (421)$ (0.1%)Governance 69,942$ 0.4% 60,175$ 0.3% (9,767)$ (0.1%)Promotion 267,237$ 1.5% 355,471$ 1.9% 88,234$ 0.4%Other Expense 294,680$ 1.6% 288,429$ 1.5% (6,251)$ (0.1%)Tax -$ 0.0% 3,750$ 0.0% 3,750$ 0.0%
Total 6,923,501$ 38.7% 7,194,996$ 37.5% 271,495$ (1.2%)
(1.0%) 0.0% 1.0% 2.0% 3.0% 4.0% 5.0%
-$100,000 -$80,000 -$60,000 -$40,000 -$20,000
$0 $20,000 $40,000 $60,000 $80,000
$100,000
Personnel Depreciation & Amortization
Occupancy Operating Administrative Governance Promotion Other Expense Tax Perc
ent
Dol
lars
Negative Variance is Good
Expense Variance from Forecast
Difference from Budget in $ [left scale]
Personnel 70%
Depreciation & Amortization 3%
Occupancy 7%
Operating 7%
Administrative 3%
Governance 1%
Promotion 5%
Other Expense 4%
Tax 0%
WSG Budgeted Expenses (not including COGS)
Personnel
Depreciation & Amortization Occupancy
Operating
Administrative
Governance

WSGC Financial Dashboard
WSGC Confidential 4 Printed on 11/17/11
Personnel Costs FY09Q1 FY09Q2 FY09Q3 FY09Q4 FY10Q1 FY10Q2 FY10Q3 FY10Q4 FY11Q1 FY11Q2 FY11Q3 FY11Q4Actual in $ 1,062,819$ 1,103,739$ 1,129,921$ 1,198,682$ 1,157,404$ 1,174,060$ 1,304,981$ 1,350,126$ 1,336,671$ 1,685,523$ 2,053,198$ Budget in $ 1,102,198$ 1,102,198$ 1,102,198$ 1,102,198$ 1,147,386$ 1,193,621$ 1,271,540$ 1,302,663$ 1,250,679$ 1,675,416$ 1,784,283$ 1,638,174$
Actual in Percent of Sales 24.3% 24.7% 24.5% 25.1% 24.7% 23.9% 25.2% 24.9% 25.6% 26.6% 27.0%Budget in Percent of Sales 24.9% 24.9% 24.9% 24.9% 24.7% 24.7% 24.7% 24.7% 26.4% 26.4% 26.4% 26.4%
Difference from Budget in $ (39,379)$ 1,541$ 27,722$ 96,483$ 10,018$ (19,561)$ 33,441$ 48,970$ 85,991$ 10,107$ 268,915$ Difference from Budget in % -0.6% -0.2% -0.4% 0.2% 0.0% -0.8% 0.5% 0.3% -0.7% 0.2% 0.6%
Comparing Net Income, Sales, Margin and Personnel Costs FY09Q1 FY09Q2 FY09Q3 FY09Q4 FY10Q1 FY10Q2 FY10Q3 FY10Q4 FY11Q1 FY11Q2 FY11Q3 FY11Q4
Net Income98,351$ 72,107$ 47,874$ 52,805$ 110,130$ 125,311$ 128,837$ 222,437$ 143,432$ (273,299)$ (108,866)$
% Change in Sales from Previous Quarter
-4.3% 2.2% 3.0% 3.8% -2.0% 4.9% 5.3% 4.6% -3.7% 21.6% 20.1%
% Change in Margin from Previous Quarter
-0.5% -1.0% -0.5% 1.1% 0.3% -0.1% 0.0% 0.9% 1.8% -8.6% 3.4%
% Change in Personnel Costs from Previous Quarter
1.0% 3.9% 2.4% 6.1% -3.4% 1.4% 11.2% 3.5% -1.0% 26.1% 21.8%
-1.0%
-0.5%
0.0%
0.5%
1.0%
-$100,000 -$50,000
$0 $50,000
$100,000 $150,000 $200,000 $250,000 $300,000
FY09Q1 FY09Q2 FY09Q3 FY09Q4 FY10Q1 FY10Q2 FY10Q3 FY10Q4 FY11Q1 FY11Q2 FY11Q3 FY11Q4
Perc
ent
Dol
lars
Negative Variance is Good
Personnel Costs Variance from Forecast
Difference from Budget in $ [left scale]

WSGC Financial Dashboard
WSGC Confidential 5 Printed on 11/17/11
WSG Peer Comparison -- Income Statement
(Unhide row 155 Company 1 Company 2 Company 3 Company 4 Company 5 Company 6 Company 7 Company 8 Company 9 WSGCAdjusted Gross Margin 39.5% 34.5% 37.0% 37.5% 38.2% 34.8% 43.4% 37.1% 39.7% 35.5%Personnel 26.0% 21.4% 21.1% 26.8% 27.3% 23.5% 25.7% 23.5% 25.3% 25.6%Net Income 2.0% 1.4% 4.7% -1.2% 3.1% 0.8% 3.1% 2.7% 1.3% 1.0%
Difference from WSGAdjusted Gross Margin 4.0% (1.1%) 1.5% 1.9% 2.7% (0.7%) 7.9% 1.6% 4.2% 35.5%Personnel 0.4% (4.2%) (4.5%) 1.1% 1.6% (2.1%) 0.1% (2.2%) (0.3%) 25.6%Net Income 1.0% 0.4% 3.7% (2.2%) 2.1% (0.2%) 2.1% 1.7% 0.3% 1.0%
\
This data is one quarter old. It represents rolling 4 quarter results from January 2010 - December 2010 (source:Extra Large Natural Food Coop Companies 4Q10 2011-03-29.xls)
(13.0%) (12.0%) (11.0%) (10.0%)
(9.0%) (8.0%) (7.0%) (6.0%) (5.0%) (4.0%) (3.0%) (2.0%) (1.0%)
0.0% 1.0% 2.0% 3.0% 4.0% 5.0% 6.0% 7.0% 8.0%
Company 1 Company 2 Company 3 Company 4 Company 5 Company 6 Company 7 Company 8 Company 9
Income Statement Peers Compared to WSG
Adjusted Gross Margin Personnel Net Income

WSGC Financial Dashboard
WSGC Confidential 6 Printed on 11/17/11
Same quarter Sales comparisons
Sales- by Calendar Qtr FY09Q1 FY09Q2 FY09Q3 FY09Q4 FY10Q1 FY10Q2 FY10Q3 FY10Q4 FY11Q1 FY11Q2 FY11Q3 FY11Q4
Actual-calendar quarter 4,379,987$ 4,474,685$ 4,608,730$ 4,782,689$ 4,687,871$ 4,919,435$ 5,179,195$ 5,416,741$ 5,218,096$ 6,343,521$ 7,617,609$ -$
Same quarter prior year 3,895,150$ 4,213,878$ 4,404,769$ 4,578,589$ 4,379,987$ 4,474,685$ 4,608,730$ 4,782,689$ 4,687,871$ 4,919,435$ 5,179,195$ 5,416,741$
Difference to Qtr Last Year in $ [left scale] 484,837$ 260,807$ 203,962$ 204,100$ 307,884$ 444,750$ 570,465$ 634,052$ 530,224$ 1,424,086$ 2,438,414$
Difference to Qtr Last Year in % [right scale] 12.4% 6.2% 4.6% 4.5% 7.0% 9.9% 12.4% 13.3% 11.3% 28.9% 47.1%
$484,837 $260,807 $203,962 $204,100 $307,884 $444,750 $570,465 $634,052 $530,224
$1,424,086
$2,438,414
12.4% 6.2%
4.6% 4.5% 7.0%
9.9% 12.4% 13.3%
11.3%
28.9%
47.1%
0.0% 5.0% 10.0% 15.0% 20.0% 25.0% 30.0% 35.0% 40.0% 45.0% 50.0%
$-
$500,000
$1,000,000
$1,500,000
$2,000,000
$2,500,000
$3,000,000
FY09Q1 FY09Q2 FY09Q3 FY09Q4 FY10Q1 FY10Q2 FY10Q3 FY10Q4 FY11Q1 FY11Q2 FY11Q3 FY11Q4
Sales Increase to Prior Year same Quarter
Difference to Qtr Last Year in $ [left scale]
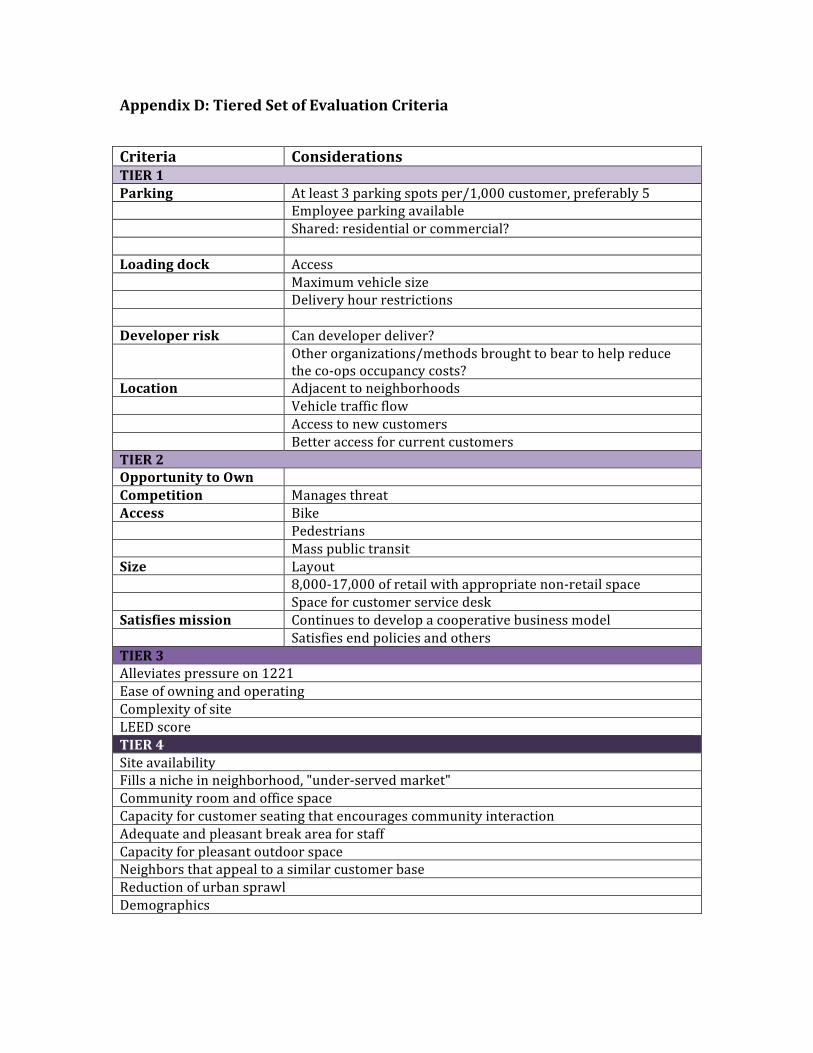
Appendix D: Tiered Set of Evaluation Criteria
Criteria Considerations TIER 1 Parking At least 3 parking spots per/1,000 customer, preferably 5 Employee parking available Shared: residential or commercial? Loading dock Access Maximum vehicle size Delivery hour restrictions Developer risk Can developer deliver? Other organizations/methods brought to bear to help reduce
the co-‐ops occupancy costs? Location Adjacent to neighborhoods Vehicle traffic flow Access to new customers Better access for current customers TIER 2 Opportunity to Own Competition Manages threat Access Bike Pedestrians Mass public transit Size Layout 8,000-‐17,000 of retail with appropriate non-‐retail space Space for customer service desk Satisfies mission Continues to develop a cooperative business model Satisfies end policies and others TIER 3 Alleviates pressure on 1221 Ease of owning and operating Complexity of site LEED score TIER 4 Site availability Fills a niche in neighborhood, "under-‐served market" Community room and office space Capacity for customer seating that encourages community interaction Adequate and pleasant break area for staff Capacity for pleasant outdoor space Neighbors that appeal to a similar customer base Reduction of urban sprawl Demographics

PROJECTED MARKETPLACE TRADE AREA TOTALS Trade Area Oct 2008 Apr 2011 % Change Population 356,412 359,009 .73 Potential 13,434,403 15,296,447 13.86 Facility Volume 11,187,750 12,737,371 13.85 Float Amount 2,246,653 2,559,076 13.91 Float Percent 16.72 16.73 P.C.E. 37.69 42.61 13.04
courtneyberner
Typewritten Text
Appendix E: 2010 Dakota Study Update
courtneyberner
Typewritten Text

MARKET CHANGES A NEW 61,000 TOTAL SQUARE FOOT COPPS OPENS AT THE INTERSECTION OF MAIN AND COUNTY ROAD N IN SUN PRAIRIE (MAP KEY 100) REPLACING THE PICK 'N SAVE AT MAP KEY 2 A NEW 104,000 TOTAL SQUARE FOOT HY-‐VEE OPENS AT THE INTERSECTION OF EAST WASHINGTON AND MENDOTA (MAP KEY 200) A NEW 17,000 TOTAL SQUARE FOOT SENTRY OPENS AT THE INTERSECTION OF JOHNSON AND UNIVERSITY (MAP KEY 300) A NEW 84,000 TOTAL SQUARE FOOT HY-‐VEE OPENS AT THE INTERSECTION OF SEGOE AND ONDANA (MAP KEY 400) THE IMAGE OF WILLIAMSON STREET COOPERATIVE WAS RAISED TO INCREASE SALES TO $350,000 PER WEEK STORES IN OPERATION Forecast Current Fcst Facility -‐-‐-‐Apr 2011 -‐-‐-‐ -‐-‐-‐-‐Oct 2008 -‐-‐-‐-‐ T.A. % Sales Map Key Name Volume /SqFt Volume /SqFt Diff. Chg Area Draw Image 1 Piggly Wiggly 347,066 13.10 315,000 11.89 19,240 10 26,500 60 111 2 Pick 'n Save 258,248 8.33 325,000 10.48 -‐53,401 -‐21 31,000 80 74 3 Sentry 249,589 8.76 335,000 11.75 -‐68,329 -‐25 28,500 80 80 4 Copps 479,510 11.42 575,000 13.69 -‐76,392 -‐17 42,000 80 117 5 Copps 447,998 14.04 425,000 13.32 11,499 5 31,900 50 119 6 Pierce's 111,107 5.70 120,000 6.15 -‐7,559 -‐7 19,500 85 49 7 Copps 689,424 15.67 740,000 16.82 -‐42,990 -‐7 44,000 85 120 8 Cub 446,305 10.53 495,000 11.67 -‐36,521 -‐10 42,400 75 81 9 Woodmans 2,086,886 20.26 2,200,000 21.36 -‐90,491 -‐5 103,000 80 73 10 Sentry 124,823 8.92 130,000 9.29 -‐4,142 -‐4 14,000 80 64 11 Jenifer St Mkt 120,093 18.76 125,000 19.53 -‐4,416 -‐4 6,400 90 143 12 Williamson St Co -‐-‐closed-‐-‐ -‐-‐-‐-‐-‐ 330,000 34.74 -‐280,500 85 158 12.1 Williamson St Co 329,957 34.73 0 0.00 280,463 0 9,500 85 163 13 Capital Ctr Food 149,687 19.44 150,000 19.48 -‐281 0 7,700 90 145 14 Copps 161,182 6.58 160,000 6.53 1,064 1 24,500 90 57 15 Trader Joe's 324,835 40.10 325,000 40.12 -‐132 0 8,100 80 168 16 Regent St CoOp 19,922 12.45 20,000 12.50 -‐74 0 1,600 95 113 17 Whole Foods 526,565 31.72 525,000 31.63 1,174 0 16,600 75 153 18 Copps 571,006 16.79 570,000 16.76 855 0 34,000 85 128 19 Sentry 625,805 18.96 625,000 18.94 684 0 33,000 85 146 20 Copps 545,542 18.49 525,000 17.80 10,271 4 29,500 50 131 21 Cub 487,077 11.51 475,000 11.23 7,246 3 42,300 60 79 22 Woodmans 2,362,312 19.69 2,300,000 19.17 37,387 3 120,000 60 71 23 Copps 599,453 13.38 600,000 13.39 -‐465 0 44,800 85 114 24 Cub 278,129 5.12 280,000 5.16 -‐1,404 -‐1 54,300 75 42 25 Pick 'n Save 333,381 8.55 320,000 8.21 7,359 4 39,000 55 60 26 Super Target 452,437 11.75 440,000 11.43 6,840 3 38,500 55 79 27 Miller & Son's 510,706 20.85 460,000 18.78 25,353 11 24,500 50 138 28 Copps 444,849 10.98 440,000 10.86 2,910 1 40,500 60 79 29 Walmart SC 385,735 8.42 375,000 8.19 8,052 3 45,800 75 58 30 Copps 450,794 10.94 435,000 10.56 11,845 4 41,200 75 73 31 Pick 'n Save 251,124 9.44 225,000 8.46 18,287 12 26,600 70 66 32 Piggly Wiggly 219,400 14.10 210,000 13.50 6,580 4 15,560 70 111 100 Copps 442,813 10.37 0 0.00 354,251 0 42,700 80 110 200 Hy-‐Vee 848,315 11.65 0 0.00 678,652 0 72,800 80 100 300 Sentry 128,751 10.82 0 0.00 115,876 0 11,900 90 80 400 Hy-‐Vee 718,626 12.22 0 0.00 610,832 0 58,800 85 100 Totals 17,529,450 15,575,000 1,549,622 Averages 486,929 13.77 486,719 14.33 35,360 101 The low draw for forecast volumes is 29.99

CHAIN SUMMARY Chain # of -‐-‐-‐-‐-‐-‐-‐-‐-‐-‐-‐-‐-‐-‐-‐-‐-‐-‐-‐-‐-‐Chain Total-‐-‐-‐-‐-‐-‐-‐-‐-‐-‐-‐-‐-‐-‐-‐-‐-‐-‐-‐-‐ Vol/ Avg Market Name Facs Volume Average Size Average SqFt Image Share Copps 10 4,832,571 483,257 375,100 37,510 12.88 105 23.31 Woodmans 2 4,449,198 2,224,599 223,000 111,500 19.95 72 20.18 Hy-‐Vee 2 1,566,941 783,471 131,600 65,800 11.91 100 8.43 Sentry 4 1,128,967 282,242 87,400 21,850 12.92 92 6.19 Cub 3 1,211,510 403,837 139,000 46,333 8.72 67 5.46 Independent 4 891,593 222,898 58,100 14,525 15.35 119 3.87 Pick 'n Save 3 842,754 280,918 96,600 32,200 8.72 67 3.70 Whole Foods 1 526,565 526,565 16,600 16,600 31.72 153 2.58 Piggly Wiggly 2 566,466 283,233 42,060 21,030 13.47 111 2.37 Walmart SC 1 385,735 385,735 45,800 45,800 8.42 58 1.89 Williamson St Co 1 329,957 329,957 9,500 9,500 34.73 163 1.83 Trader Joe's 1 324,835 324,835 8,100 8,100 40.10 168 1.70 Super Target 1 452,437 452,437 38,500 38,500 11.75 79 1.63 Regent St CoOp 1 19,922 19,922 1,600 1,600 12.45 113 .12 Totals 36 17,529,452 1,272,960 83.27 Averages 486,929 35,360 13.77 * Chain includes facilities with draw less than 29.99

SCENARIO 6 A NEW 16,671 TOTAL SQAUARE FOOT WILLIAMSON STREET NATURAL FOODS COOPERATIVE OPENS AT THE INTERSECTION OF UNIVERSITY AND PARK (MAP KEY 6000) THE MARKET CHANGES ARE IN EFFECT STORES IN OPERATION Forecast Current Fcst Facility -‐-‐-‐Apr 2011 -‐-‐-‐ -‐-‐-‐-‐Oct 2008 -‐-‐-‐-‐ T.A. % Sales Map Key Name Volume /SqFt Volume /SqFt Diff. Chg Area Draw Image 1 Piggly Wiggly 339,253 12.80 315,000 11.89 14,552 8 26,500 60 111 2 Pick 'n Save 258,225 8.33 325,000 10.48 -‐53,420 -‐21 31,000 80 74 3 Sentry 249,578 8.76 335,000 11.75 -‐68,338 -‐25 28,500 80 80 4 Copps 479,418 11.41 575,000 13.69 -‐76,466 -‐17 42,000 80 117 5 Copps 418,385 13.12 425,000 13.32 -‐3,308 -‐2 31,900 50 119 6 Pierce's 110,802 5.68 120,000 6.15 -‐7,819 -‐8 19,500 85 49 7 Copps 688,176 15.64 740,000 16.82 -‐44,050 -‐7 44,000 85 120 8 Cub 446,004 10.52 495,000 11.67 -‐36,747 -‐10 42,400 75 81 9 Woodmans 2,083,390 20.23 2,200,000 21.36 -‐93,288 -‐5 103,000 80 73 10 Sentry 124,774 8.91 130,000 9.29 -‐4,181 -‐4 14,000 80 64 11 Jenifer St Mkt 119,903 18.73 125,000 19.53 -‐4,588 -‐4 6,400 90 143 12 Williamson St Co -‐-‐closed-‐-‐ -‐-‐-‐-‐-‐ 330,000 34.74 -‐280,500 85 158 12.1 Williamson St Co 329,209 34.65 0 0.00 279,828 0 9,500 85 163 13 Capital Ctr Food 149,160 19.37 150,000 19.48 -‐756 -‐1 7,700 90 145 14 Copps 160,615 6.56 160,000 6.53 553 0 24,500 90 57 15 Trader Joe's 321,964 39.75 325,000 40.12 -‐2,429 -‐1 8,100 80 168 16 Regent St CoOp 19,764 12.35 20,000 12.50 -‐224 -‐1 1,600 95 113 17 Whole Foods 517,721 31.19 525,000 31.63 -‐5,459 -‐1 16,600 75 153 18 Copps 559,801 16.46 570,000 16.76 -‐8,669 -‐2 34,000 85 128 19 Sentry 613,010 18.58 625,000 18.94 -‐10,191 -‐2 33,000 85 146 20 Copps 528,612 17.92 525,000 17.80 1,806 1 29,500 50 131 21 Cub 472,397 11.17 475,000 11.23 -‐1,562 -‐1 42,300 60 79 22 Woodmans 2,312,885 19.27 2,300,000 19.17 7,731 1 120,000 60 71 23 Copps 588,802 13.14 600,000 13.39 -‐9,519 -‐2 44,800 85 114 24 Cub 275,864 5.08 280,000 5.16 -‐3,102 -‐1 54,300 75 42 25 Pick 'n Save 331,232 8.49 320,000 8.21 6,177 4 39,000 55 60 26 Super Target 449,617 11.68 440,000 11.43 5,290 2 38,500 55 79 27 Miller & Son's 509,288 20.79 460,000 18.78 24,644 11 24,500 50 138 28 Copps 443,080 10.94 440,000 10.86 1,848 1 40,500 60 79 29 Walmart SC 385,093 8.41 375,000 8.19 7,570 3 45,800 75 58 30 Copps 450,479 10.93 435,000 10.56 11,609 4 41,200 75 73 31 Pick 'n Save 251,104 9.44 225,000 8.46 18,273 12 26,600 70 66 32 Piggly Wiggly 219,395 14.10 210,000 13.50 6,577 4 15,560 70 111 100 Copps 442,799 10.37 0 0.00 354,240 0 42,700 80 110 200 Hy-‐Vee 847,602 11.64 0 0.00 678,081 0 72,800 80 100 300 Sentry 128,268 10.78 0 0.00 115,441 0 11,900 90 80 400 Hy-‐Vee 707,250 12.03 0 0.00 601,163 0 58,800 85 100 6000 Williamson St Co 171,804 14.72 0 0.00 128,853 0 11,671 75 140 Totals 17,504,720 15,575,000 1,549,621 Averages 473,101 13.63 486,719 14.33 34,720 102 The low draw for forecast volumes is 29.99

THREE-‐YEAR GROWTH PATTERN -‐ SITE 1000 Facility Map Key = 6000 Apr 2011 Forecast = Nat Foods Sales Forecast Estimated Sales/Sq. Ft. Sales/Sq. Ft. Share of % Weekly Sales Selling Area Total Area Market Beyond 1st Year (2011) 171,804 14.72 10.31 0.84% 25% 2nd Year (2012) 182,112 15.60 10.92 0.85% 25% 3rd Year (2013) 192,421 16.49 11.54 0.85% 25% Inflation is 5% CHAIN SUMMARY Chain # of -‐-‐-‐-‐-‐-‐-‐-‐-‐-‐-‐-‐-‐-‐-‐-‐-‐-‐-‐-‐-‐Chain Total-‐-‐-‐-‐-‐-‐-‐-‐-‐-‐-‐-‐-‐-‐-‐-‐-‐-‐-‐-‐ Vol/ Avg Market Name Facs Volume Average Size Average SqFt Image Share Copps 10 4,760,167 476,017 375,100 37,510 12.69 105 23.02 Woodmans 2 4,396,275 2,198,137 223,000 111,500 19.71 72 19.97 Hy-‐Vee 2 1,554,852 777,426 131,600 65,800 11.81 100 8.36 Sentry 4 1,115,630 278,907 87,400 21,850 12.76 92 6.12 Cub 3 1,194,265 398,088 139,000 46,333 8.59 67 5.39 Independent 4 889,152 222,288 58,100 14,525 15.30 119 3.86 Pick 'n Save 3 840,560 280,187 96,600 32,200 8.70 67 3.69 Williamson St Co 2 501,013 250,507 21,171 10,586 23.67 152 2.67 Whole Foods 1 517,721 517,721 16,600 16,600 31.19 153 2.54 Piggly Wiggly 2 558,648 279,324 42,060 21,030 13.28 111 2.33 Walmart SC 1 385,093 385,093 45,800 45,800 8.41 58 1.89 Trader Joe's 1 321,964 321,964 8,100 8,100 39.75 168 1.68 Super Target 1 449,617 449,617 38,500 38,500 11.68 79 1.62 Regent St CoOp 1 19,764 19,764 1,600 1,600 12.35 113 .12 Totals 37 17,504,722 1,284,631 83.27 Averages 473,101 34,720 13.63 * Chain includes facilities with draw less than 29.99

STORE VOLUME REPORT BY SECTOR -‐ MAP KEY 6000 Facility Map Key = 6000 Apr 2011 Draw = 75 Market Share Cutoff = 1 Sector Sector Expected Map Key Share Volume Population Potential Float Miles 1 4.84 759 382 15,700 20.35 4.96 2 2.94 4,276 3,588 145,481 20.14 5.12 3 1.11 1,127 2,761 101,622 20.30 7.60 4 2.32 2,764 3,044 119,055 20.29 5.73 6 1.10 1,448 3,376 131,773 20.20 7.16 57 2.31 1,141 1,123 49,290 17.03 2.09 58 4.57 2,320 1,084 50,727 17.09 1.37 59 8.15 7,344 2,102 90,099 17.20 .73 60 5.26 5,003 2,444 95,119 20.10 2.70 61 5.77 11,929 5,000 206,858 20.22 1.86 62 9.61 4,321 1,012 44,944 17.38 .74 63 10.53 6,927 1,482 65,784 17.34 .35 64 6.53 6,327 2,096 96,947 17.15 .79 65 8.95 10,838 2,594 121,066 17.30 .40 66 5.92 11,126 3,834 187,907 17.39 1.84 67 5.48 7,095 2,754 129,561 17.28 1.14 68 2.63 4,540 3,710 172,313 17.29 2.04 69 2.66 1,999 1,722 75,095 17.23 1.89 70 1.89 1,942 2,222 102,750 17.13 2.22 71 2.83 1,528 1,096 53,964 17.10 1.74 72 3.71 5,650 3,102 152,137 17.08 1.48 73 1.73 1,884 2,346 108,908 17.05 2.33 74 1.12 562 1,086 49,961 17.00 2.89 75 1.52 591 925 38,906 17.00 2.54 76 1.22 917 1,712 74,910 16.93 2.83 144 1.20 731 1,272 61,005 17.19 2.81 145 1.26 1,263 2,228 100,485 17.35 3.19 146 1.01 517 1,053 51,228 17.43 4.56 Sub Total 3.97 106,866 61,150 2,693,596 18.12 Other Sectors .17 21,987 297,859 12,602,851 16.43 TA Total .84 128,853 359,009 15,296,447 16.73 Outside TA 42,951 Sales Forecast 171,804

SCENARIO 7 A NEW 17,181 TOTAL SQUARE FOOT WILLIAMSON STREET NATURAL FOODS COOPERATIVE OPENS AT THE INTESECTION OF CENTURY AND ALLEN (MAP KEY 7000) THE MARKET CHANGES ARE IN EFFECT STORES IN OPERATION Forecast Current Fcst Facility -‐-‐-‐Apr 2011 -‐-‐-‐ -‐-‐-‐-‐Oct 2008 -‐-‐-‐-‐ T.A. % Sales Map Key Name Volume /SqFt Volume /SqFt Diff. Chg Area Draw Image 1 Piggly Wiggly 335,945 12.68 315,000 11.89 12,567 7 26,500 60 111 2 Pick 'n Save 258,213 8.33 325,000 10.48 -‐53,429 -‐21 31,000 80 74 3 Sentry 249,573 8.76 335,000 11.75 -‐68,342 -‐26 28,500 80 80 4 Copps 479,375 11.41 575,000 13.69 -‐76,500 -‐17 42,000 80 117 5 Copps 419,062 13.14 425,000 13.32 -‐2,969 -‐1 31,900 50 119 6 Pierce's 110,682 5.68 120,000 6.15 -‐7,920 -‐8 19,500 85 49 7 Copps 687,836 15.63 740,000 16.82 -‐44,340 -‐7 44,000 85 120 8 Cub 445,927 10.52 495,000 11.67 -‐36,805 -‐10 42,400 75 81 9 Woodmans 2,082,743 20.22 2,200,000 21.36 -‐93,806 -‐5 103,000 80 73 10 Sentry 124,767 8.91 130,000 9.29 -‐4,187 -‐4 14,000 80 64 11 Jenifer St Mkt 119,887 18.73 125,000 19.53 -‐4,602 -‐4 6,400 90 143 12 Williamson St Co -‐-‐closed-‐-‐ -‐-‐-‐-‐-‐ 330,000 34.74 -‐280,500 85 158 12.1 Williamson St Co 329,181 34.65 0 0.00 279,804 0 9,500 85 163 13 Capital Ctr Food 149,199 19.38 150,000 19.48 -‐721 -‐1 7,700 90 145 14 Copps 160,670 6.56 160,000 6.53 603 0 24,500 90 57 15 Trader Joe's 322,209 39.78 325,000 40.12 -‐2,233 -‐1 8,100 80 168 16 Regent St CoOp 19,781 12.36 20,000 12.50 -‐208 -‐1 1,600 95 113 17 Whole Foods 518,517 31.24 525,000 31.63 -‐4,862 -‐1 16,600 75 153 18 Copps 560,926 16.50 570,000 16.76 -‐7,713 -‐2 34,000 85 128 19 Sentry 614,341 18.62 625,000 18.94 -‐9,060 -‐2 33,000 85 146 20 Copps 533,042 18.07 525,000 17.80 4,021 2 29,500 50 131 21 Cub 475,863 11.25 475,000 11.23 518 0 42,300 60 79 22 Woodmans 2,322,192 19.35 2,300,000 19.17 13,315 1 120,000 60 71 23 Copps 590,835 13.19 600,000 13.39 -‐7,790 -‐2 44,800 85 114 24 Cub 276,340 5.09 280,000 5.16 -‐2,745 -‐1 54,300 75 42 25 Pick 'n Save 331,926 8.51 320,000 8.21 6,559 4 39,000 55 60 26 Super Target 450,447 11.70 440,000 11.43 5,746 2 38,500 55 79 27 Miller & Son's 509,874 20.81 460,000 18.78 24,937 11 24,500 50 138 28 Copps 443,401 10.95 440,000 10.86 2,041 1 40,500 60 79 29 Walmart SC 385,120 8.41 375,000 8.19 7,590 3 45,800 75 58 30 Copps 450,477 10.93 435,000 10.56 11,608 4 41,200 75 73 31 Pick 'n Save 251,103 9.44 225,000 8.46 18,272 12 26,600 70 66 32 Piggly Wiggly 219,395 14.10 210,000 13.50 6,576 4 15,560 70 111 100 Copps 442,793 10.37 0 0.00 354,234 0 42,700 80 110 200 Hy-‐Vee 847,375 11.64 0 0.00 677,900 0 72,800 80 100 300 Sentry 128,305 10.78 0 0.00 115,474 0 11,900 90 80 400 Hy-‐Vee 709,378 12.06 0 0.00 602,972 0 58,800 85 100 7000 Williamson St Co 151,489 13.72 0 0.00 113,617 0 11,043 75 140 Totals 17,508,180 15,575,000 1,549,619 Averages 473,194 13.64 486,719 14.33 34,703 102 The low draw for forecast volumes is 29.99

THREE-‐YEAR GROWTH PATTERN -‐ SITE 7000 Facility Map Key = 7000 Apr 2011 Forecast = Nat Foods Sales Forecast Estimated Sales/Sq. Ft. Sales/Sq. Ft. Share of % Weekly Sales Selling Area Total Area Market Beyond 1st Year (2011) 151,489 13.72 8.82 0.74% 25% 2nd Year (2012) 160,578 14.54 9.35 0.75% 25% 3rd Year (2013) 169,668 15.36 9.88 0.75% 25% Inflation is 5% CHAIN SUMMARY Chain # of -‐-‐-‐-‐-‐-‐-‐-‐-‐-‐-‐-‐-‐-‐-‐-‐-‐-‐-‐-‐-‐Chain Total-‐-‐-‐-‐-‐-‐-‐-‐-‐-‐-‐-‐-‐-‐-‐-‐-‐-‐-‐-‐ Vol/ Avg Market Name Facs Volume Average Size Average SqFt Image Share Copps 10 4,768,415 476,842 375,100 37,510 12.71 105 23.05 Woodmans 2 4,404,935 2,202,467 223,000 111,500 19.75 72 20.00 Hy-‐Vee 2 1,556,753 778,377 131,600 65,800 11.83 100 8.37 Sentry 4 1,116,985 279,246 87,400 21,850 12.78 92 6.13 Cub 3 1,198,130 399,377 139,000 46,333 8.62 67 5.41 Independent 4 889,641 222,410 58,100 14,525 15.31 119 3.86 Pick 'n Save 3 841,242 280,414 96,600 32,200 8.71 67 3.69 Williamson St Co 2 480,670 240,335 20,543 10,272 23.40 152 2.57 Whole Foods 1 518,517 518,517 16,600 16,600 31.24 153 2.54 Piggly Wiggly 2 555,339 277,670 42,060 21,030 13.20 111 2.32 Walmart SC 1 385,120 385,120 45,800 45,800 8.41 58 1.89 Trader Joe's 1 322,209 322,209 8,100 8,100 39.78 168 1.69 Super Target 1 450,447 450,447 38,500 38,500 11.70 79 1.62 Regent St CoOp 1 19,781 19,781 1,600 1,600 12.36 113 .12 Totals 37 17,508,184 1,284,003 83.27 Averages 473,194 34,703 13.64 * Chain includes facilities with draw less than 29.99

STORE VOLUME REPORT BY SECTOR -‐ MAP KEY 7000 Facility Map Key = 7000 Apr 2011 Draw = 75 Market Share Cutoff = 1 Sector Sector Expected Map Key Share Volume Population Potential Float Miles 1 5.94 933 382 15,700 20.35 4.47 2 4.32 6,279 3,588 145,481 20.14 4.31 3 1.58 1,602 2,761 101,622 20.30 6.90 4 3.24 3,857 3,044 119,055 20.29 5.03 5 1.44 375 593 25,954 20.26 6.59 6 1.66 2,193 3,376 131,773 20.20 6.35 7 1.32 542 992 41,130 19.94 6.86 57 2.02 994 1,123 49,290 17.03 2.22 58 4.22 2,140 1,084 50,727 17.09 1.43 59 8.32 7,493 2,102 90,099 17.20 .56 60 7.00 6,661 2,444 95,119 20.10 1.91 61 7.39 15,284 5,000 206,858 20.22 1.04 62 10.28 4,619 1,012 44,944 17.38 .46 63 8.90 5,853 1,482 65,784 17.34 .65 64 5.20 5,041 2,096 96,947 17.15 1.16 65 5.90 7,139 2,594 121,066 17.30 1.22 66 3.80 7,132 3,834 187,907 17.39 2.47 67 3.30 4,279 2,754 129,561 17.28 1.95 68 1.48 2,548 3,710 172,313 17.29 2.82 69 1.57 1,177 1,722 75,095 17.23 2.62 70 1.19 1,224 2,222 102,750 17.13 2.82 71 1.87 1,010 1,096 53,964 17.10 2.32 72 2.95 4,483 3,102 152,137 17.08 1.79 73 1.27 1,381 2,346 108,908 17.05 2.71 75 1.26 492 925 38,906 17.00 2.73 76 1.08 807 1,712 74,910 16.93 2.93 Sub Total 3.82 95,536 57,096 2,498,002 18.26 Other Sectors .14 18,081 301,913 12,798,445 16.43 TA Total .74 113,617 359,009 15,296,447 16.73 Outside TA 37,872 Sales Forecast 151,489

APPENDIX F: DEMOGRAPHIC DATA FOR MADISON AND MIDDLETON Madison Middleton Wisconsin Median household income (1999) $41,941 $93,008 $49,994 Per capita income (1999) $23,498 $46,214 $21,271 Median value of owner occupied housing units (2000) $139,300* $246,700 Persons below poverty (1999) 15% 0.7% 8.7% Bachelor’s degree or higher (2000) 48.2% 55.8% 22.4% U.S. Census Bureau. *This represents the mean value, not the median value.

Financial Statements & Operational Statements for Fiscal Years 1998 to 2005 (all numbers using CoCoFiSt format)
Primary Store location for the Year: 1221 Willy 1221 Willy 1221 Willy 1221 Willy 1221 Willy 1221 Willy 1202 Willy 1202 Willy& Kitchen
Common Sized Balance Sheet Page 1
Willy Street Coop FY2005 FY2004 FY2003 FY2002 FY2001 FY2000 FY1999 FY1998
Balance SheetAssetsCurrent Assets (ex Inventory & Cash) 28,548 44,887 15,112 19,551 23,381 7,526 9,521 14,846Cash 539,896 1,080,613 827,728 587,074 621,194 442,034 208,797 358,293Inventory 344,223 267,261 245,388 249,512 254,373 252,878 121,241 124,177Fixed Assets 2,857,618 2,548,470 2,726,582 2,738,903 2,846,763 2,952,254 2,476,526 1,175,010Other Assets 52,440 11,501 12,555 135,266 132,185 102,985 78,105 70,472Total Assets 3,822,725 3,952,731 3,827,365 3,730,305 3,877,895 3,757,677 2,894,189 1,742,798
Liabilities & EquityCurrent Liabilities (ex Account Payables) 511,268 419,006 436,398 362,733 317,990 263,192 1,249,086 527,958Accounts Payables 219,711 288,481 185,896 113,756 148,284 90,742 76,382 48,900Long Term Liabilities 995,290 1,232,233 1,403,660 1,738,431 2,122,039 2,287,650 640,135 315,583Total Liabilities 1,726,269 1,939,719 2,025,954 2,214,921 2,588,313 2,641,584 1,965,603 892,441Equity (ex RE & Net Income) 692,213 661,118 602,842 515,222 451,767 406,874 334,991 314,157Retained Earnings 1,351,894 1,198,570 1,000,162 837,815 709,219 597,265 536,198 465,832Net Income 52,350 153,324 198,408 162,347 128,596 111,953 57,398 70,369Total Equity 2,096,456 2,013,012 1,801,411 1,515,384 1,289,582 1,116,092 928,586 850,358Total Liabilities & Equity 3,822,725 3,952,731 3,827,365 3,730,305 3,877,895 3,757,677 2,894,189 1,742,799
Appendix G: Financial and operational statements 1998-2005
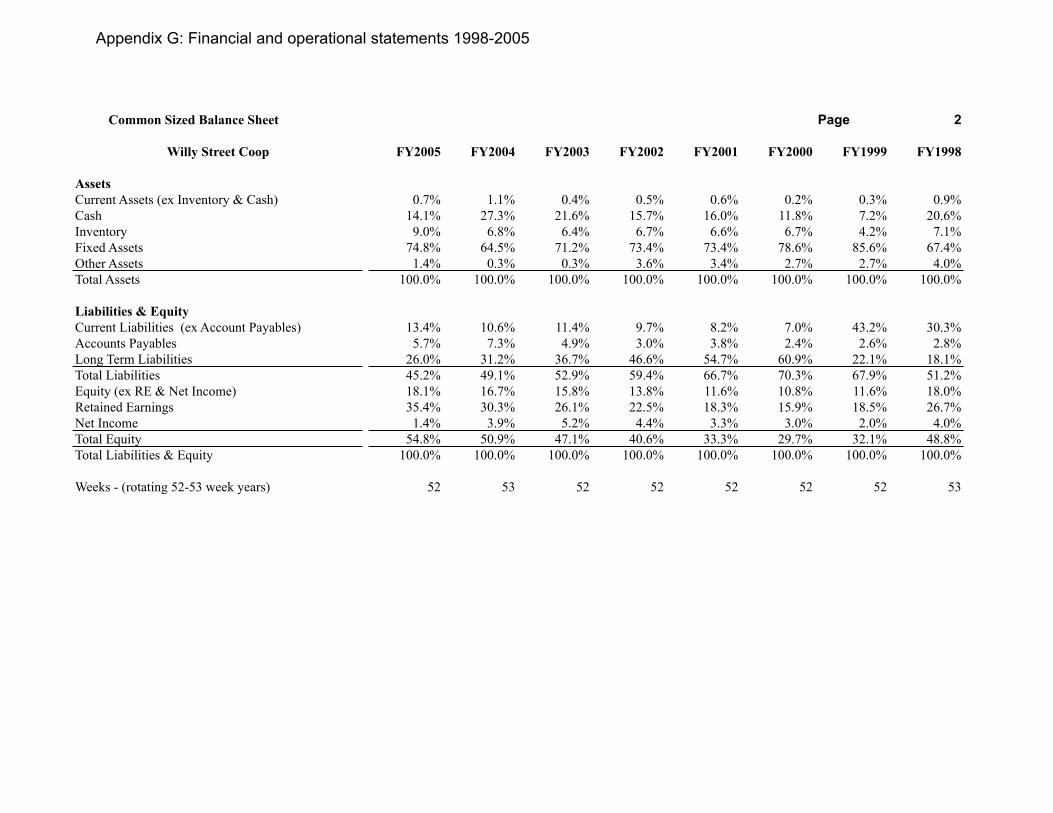
Common Sized Balance Sheet Page 2
Willy Street Coop FY2005 FY2004 FY2003 FY2002 FY2001 FY2000 FY1999 FY1998
AssetsCurrent Assets (ex Inventory & Cash) 0.7% 1.1% 0.4% 0.5% 0.6% 0.2% 0.3% 0.9%Cash 14.1% 27.3% 21.6% 15.7% 16.0% 11.8% 7.2% 20.6%Inventory 9.0% 6.8% 6.4% 6.7% 6.6% 6.7% 4.2% 7.1%Fixed Assets 74.8% 64.5% 71.2% 73.4% 73.4% 78.6% 85.6% 67.4%Other Assets 1.4% 0.3% 0.3% 3.6% 3.4% 2.7% 2.7% 4.0%Total Assets 100.0% 100.0% 100.0% 100.0% 100.0% 100.0% 100.0% 100.0%
Liabilities & EquityCurrent Liabilities (ex Account Payables) 13.4% 10.6% 11.4% 9.7% 8.2% 7.0% 43.2% 30.3%Accounts Payables 5.7% 7.3% 4.9% 3.0% 3.8% 2.4% 2.6% 2.8%Long Term Liabilities 26.0% 31.2% 36.7% 46.6% 54.7% 60.9% 22.1% 18.1%Total Liabilities 45.2% 49.1% 52.9% 59.4% 66.7% 70.3% 67.9% 51.2%Equity (ex RE & Net Income) 18.1% 16.7% 15.8% 13.8% 11.6% 10.8% 11.6% 18.0%Retained Earnings 35.4% 30.3% 26.1% 22.5% 18.3% 15.9% 18.5% 26.7%Net Income 1.4% 3.9% 5.2% 4.4% 3.3% 3.0% 2.0% 4.0%Total Equity 54.8% 50.9% 47.1% 40.6% 33.3% 29.7% 32.1% 48.8%Total Liabilities & Equity 100.0% 100.0% 100.0% 100.0% 100.0% 100.0% 100.0% 100.0%
Weeks - (rotating 52-53 week years) 52 53 52 52 52 52 52 53
Appendix G: Financial and operational statements 1998-2005

Financial RatiosPage 3
Willy Street Coop FY2005 FY2004 FY2003 FY2002 FY2001 FY2000 FY1999 FY1998
GrowthSales Growth %age - yr/yr 12.0% 21.4% 4.8% 15.5% 20.7% 56.8% 14.1% 6.4%Net Income Growth %age - yr/yr 20.9% N/A N/A N/A N/A N/A N/A N/A
Liquidity RatiosCurrent Ratio 1.25 1.97 1.75 1.80 1.93 1.98 0.26 0.86Quick Ratio 0.78 1.59 1.35 1.27 1.38 1.27 0.16 0.65Working Capital $ 181,688 685,274 465,935 379,647 432,674 348,504 -985,909 -79,542
Activity RatiosAverage Inventory Turnover (COGS) (Annualized) 28.23 29.70 25.39 24.00 19.88 18.10 22.27 20.63Total Sales/Working Capital (annualized) 72.21 17.09 20.70 24.24 18.42 18.95 -4.27 -46.38Total Sales/Fixed Assets (annualized) 4.68 4.49 3.57 3.33 2.77 2.13 2.56 4.86Total Sales/Total Assets (annualized) 3.37 3.10 2.56 2.40 2.07 1.77 1.85 2.83Accounts Payable/Inventory 0.64 1.08 0.76 0.46 0.58 0.36 0.63 0.39
LeverageTotal Debt/Total Assets 0.45 0.49 0.53 0.59 0.67 0.70 0.68 0.51Total Debt/Total Equity 0.82 0.96 1.12 1.46 2.01 2.37 2.12 1.05
Appendix G: Financial and operational statements 1998-2005

Annual Income Statement Page 4
Willy Street Coop FY2005 FY2004 FY2003 FY2002 FY2001 FY2000 FY1999 FY1998
Sales 13,217,304 11,843,458 10,077,343 8,912,454 7,777,347 6,341,282 4,010,596 3,691,501Cogs 9,242,413 8,201,668 6,766,629 5,861,216 5,134,651 4,196,532 2,699,589 2,483,877Gross Profit 3,974,891 3,641,790 3,310,714 3,051,238 2,642,696 2,144,751 1,311,007 1,207,624Volume Discounts 544,315 329,971 123,813 0 0 0 0 0Surcharge Income 41,185 42,110 44,800 43,465 49,825 56,005 36,574 32,584Adjusted Gross Profit 4,560,391 4,013,871 3,479,327 3,094,703 2,692,521 2,200,756 1,347,580 1,240,208ExpensesPersonnel 3,258,576 2,780,841 2,307,098 2,022,319 1,719,066 1,352,678 920,830 800,107Occupancy Expense (ex Depre & Amort) 462,233 330,000 376,294 353,169 385,137 371,325 88,833 66,178Depreciation & Amortization 233,295 217,551 184,517 171,920 168,899 172,454 54,979 52,376Operating Expense 263,439 195,257 165,430 127,715 117,141 92,401 48,534 58,309Administrative Expense 79,908 62,163 56,420 61,597 62,590 54,632 45,228 82,763Governance 78,487 72,297 55,966 58,732 54,185 51,402 27,744 37,988Member Sales Discounts 0 0 0 0 0 0 1,930 4,345Promotions 239,681 243,189 196,775 136,333 117,131 103,200 96,873 67,592Total Expenses 4,615,619 3,901,299 3,342,500 2,931,786 2,624,149 2,198,092 1,284,951 1,169,658Income from Operations (55,228) 112,572 136,828 162,917 68,372 2,664 62,629 70,550
Other Income and ExpensesOther Income 144,981 131,460 203,624 75,610 121,642 170,335 52,863 59,348Other Expenses (ex Interest & Taxes) (27,456) (11,872) (15,377) (7,333) 0 0 (14,868) (36,042)Interest 0 0 0 0 0 0 (29,372) (2,521)Taxes (9,948) (78,836) (126,667) (68,847) (61,418) (61,046) (13,720) (20,967)Total Other Income and Expenses 107,577 40,752 61,580 (570) 60,224 109,289 (5,096) (182)Net Income 52,350 153,324 198,408 162,347 128,596 111,953 57,532 70,368
Appendix G: Financial and operational statements 1998-2005

Annual Income Statement Page 5Willy Street Coop FY2005 FY2004 FY2003 FY2002 FY2001 FY2000 FY1999 FY1998
Sales 100.00% 100.00% 100.00% 100.00% 100.00% 100.00% 100.00% 100.00%Cogs 69.93% 69.25% 67.15% 65.76% 66.02% 66.18% 67.31% 67.29%Gross Profit 30.07% 30.75% 32.85% 34.24% 33.98% 33.82% 32.69% 32.71%Volume Discounts 4.12% 2.79% 1.23% 0.00% 0.00% 0.00% 0.00% 0.00%Surcharge Income 0.31% 0.36% 0.44% 0.49% 0.64% 0.88% 0.91% 0.88%Adjusted Gross Profit 34.50% 33.89% 34.53% 34.72% 34.62% 34.71% 33.60% 33.60%ExpensesPersonnel 24.65% 23.48% 22.89% 22.69% 22.10% 21.33% 22.96% 21.67%Occupancy Expense (ex Depre & Amort) 3.50% 2.79% 3.73% 3.96% 4.95% 5.86% 2.21% 1.79%Depreciation & Amortization 1.77% 1.84% 1.83% 1.93% 2.17% 2.72% 1.37% 1.42%Operating Expense 1.99% 1.65% 1.64% 1.43% 1.51% 1.46% 1.21% 1.58%Administrative Expense 0.60% 0.52% 0.56% 0.69% 0.80% 0.86% 1.13% 2.24%Governance 0.59% 0.61% 0.56% 0.66% 0.70% 0.81% 0.69% 1.03%Member Sales Discounts 0.00% 0.00% 0.00% 0.00% 0.00% 0.00% 0.05% 0.12%Promotions 1.81% 2.05% 1.95% 1.53% 1.51% 1.63% 2.42% 1.83%Total Expenses 34.92% 32.94% 33.17% 32.90% 33.74% 34.66% 32.04% 31.69%Income from Operations -0.42% 0.95% 1.36% 1.83% 0.88% 0.04% 1.56% 1.91%
Other Income and ExpensesOther Income 1.10% 1.11% 2.02% 0.85% 1.56% 2.69% 1.32% 1.61%Other Expenses (ex Interest & Taxes) -0.21% -0.10% -0.15% -0.08% 0.00% 0.00% -0.37% -0.98%Interest 0.00% 0.00% 0.00% 0.00% 0.00% 0.00% -0.73% -0.07%Taxes -0.08% -0.67% -1.26% -0.77% -0.79% -0.96% -0.34% -0.57%Total Other Income and Expenses 0.81% 0.34% 0.61% -0.01% 0.77% 1.72% -0.13% 0.00%Net Income 0.40% 1.29% 1.97% 1.82% 1.65% 1.77% 1.43% 1.91%
Appendix G: Financial and operational statements 1998-2005
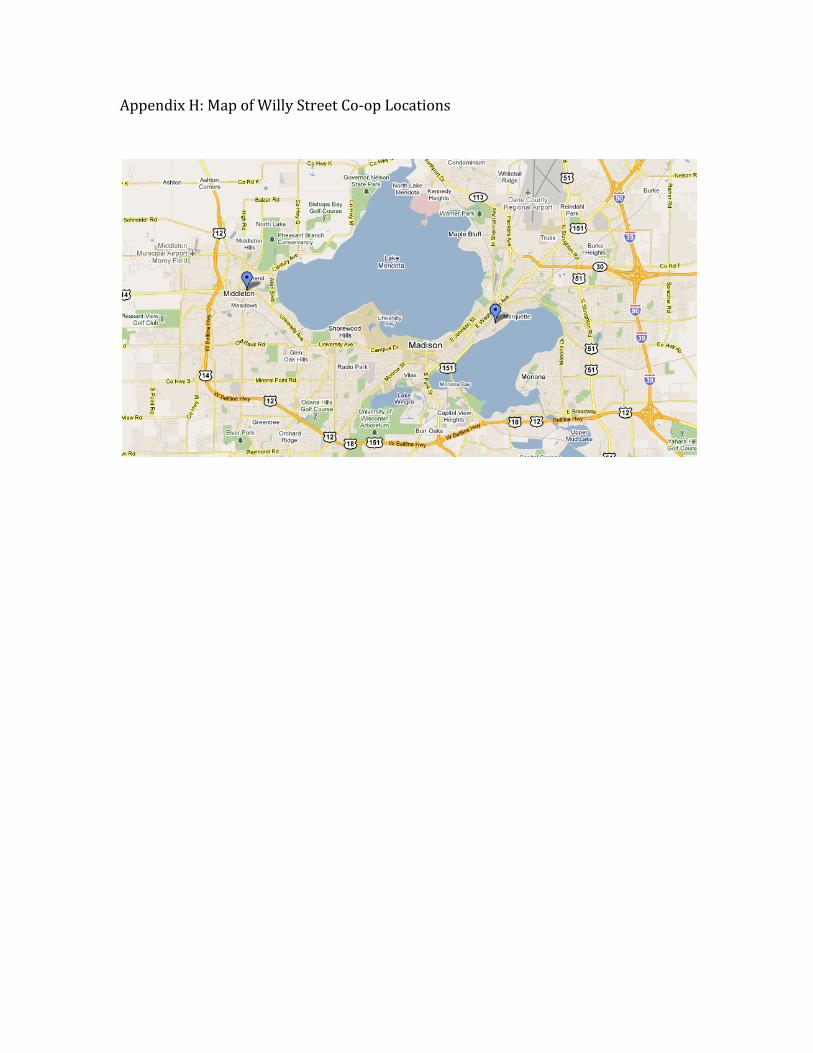
Appendix H: Map of Willy Street Co-‐op Locations