
CASES REGISTERED UNDER IPC CRIMES DURING 2015 (All...
35
Crime in India-2015 18 CASES REGISTERED UNDER IPC CRIMES DURING 2015 (All India 29,49,400) Number of Registered Cases upto 2,000 5,001 to 50,000 Above 2,00,000 Map Powered by DevInfo, UNICEF 2,001 to 5,000 50,001 to 1,00,000 1,00,001 to 2,00,000
Transcript of CASES REGISTERED UNDER IPC CRIMES DURING 2015 (All...

Crime in India-2015 18
CASES REGISTERED UNDER IPC CRIMES DURING 2015 (All India 29,49,400)
Number of Registered Cases
upto 2,000
5,001 to 50,000
Above 2,00,000 Map Powered by DevInfo, UNICEF
2,001 to 5,000
50,001 to 1,00,000
1,00,001 to 2,00,000

Crime in India-2015 20
RATE OF IPC CRIMES DURING 2015
(All India 234.2)
Rate of IPC Crime
upto 100.0
150.1 to 200.0
Above 300.0 Map Powered by DevInfo, UNICEF
100.1 to 150.0
200.1 to 250.0
250.1 to 300.0
Note: Rate of IPC Crime means number of IPC crimes per 1,00,000 population.

Crime in India-2015 25
CASES REGISTERED UNDER CRIME AGAINST BODY DURING 2015 (All India 8,57,995)
Number of Cases Registered
upto 500
2,001 to 20,000
Above 60,000
501 to 2,000
20,001 to 40,000
40,001 to 60,000
Map Powered by DevInfo, UNICEF
Crime in India-2015 26
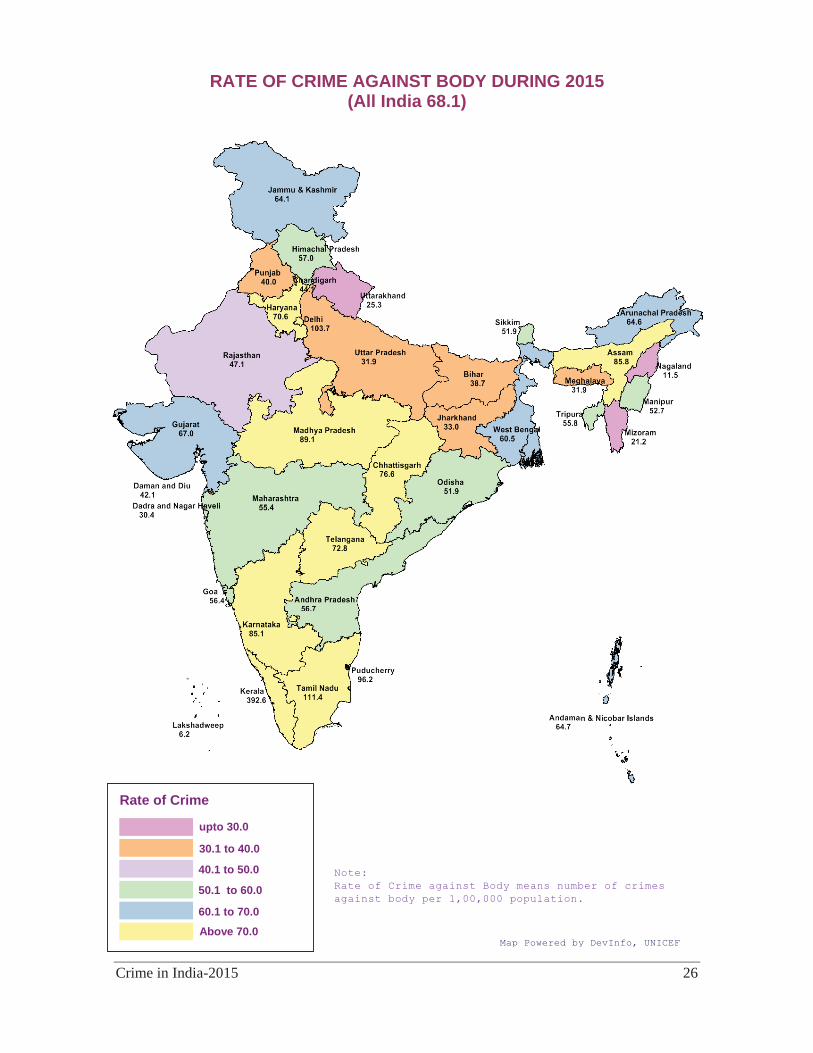
RATE OF CRIME AGAINST BODY DURING 2015 (All India 68.1)
Rate of Crime
upto 30.0
40.1 to 50.0
Above 70.0 Map Powered by DevInfo, UNICEF
30.1 to 40.0
50.1 to 60.0
60.1 to 70.0
Note: Rate of Crime against Body means number of crimes against body per 1,00,000 population.

Crime in India-2015 28
CASES REGISTERED UNDER CRIME AGAINST PROPERTY DURING 2015
(All India 6,25,279)
Cases Registered (No. of Cases)
upto 1,000
5,001 to 15,000
Above 50,000 Map Powered by DevInfo, UNICEF
1,001 to 5,000
15,001 to 25,000
25,001 to 50,000

Crime in India-2015 30
CASES REGISTERED UNDER CRIME AGAINST PUBLIC ORDER DURING 2015
(All India 86,265)
Number of Registered Cases
upto 50
201 to 1,000
Above 5,000 Map Powered by DevInfo, UNICEF
51 to 200
1,001 to 2,000
2,001 to 5,000

Crime in India-2015 31
RATE OF CRIME AGAINST PUBLIC ORDER DURING 2015 (All India 6.9)
Rate of Crime
upto 2.5
3.6 to 5.0
Above 13.0 Map Powered by DevInfo, UNICEF
2.6 to 3.5
5.1 to 8.0
8.1 to 13.0
Note: Rate of Crime against Public Order means number of crimes against Public Order per 1,00,000 population.
Crime in India-2015 33
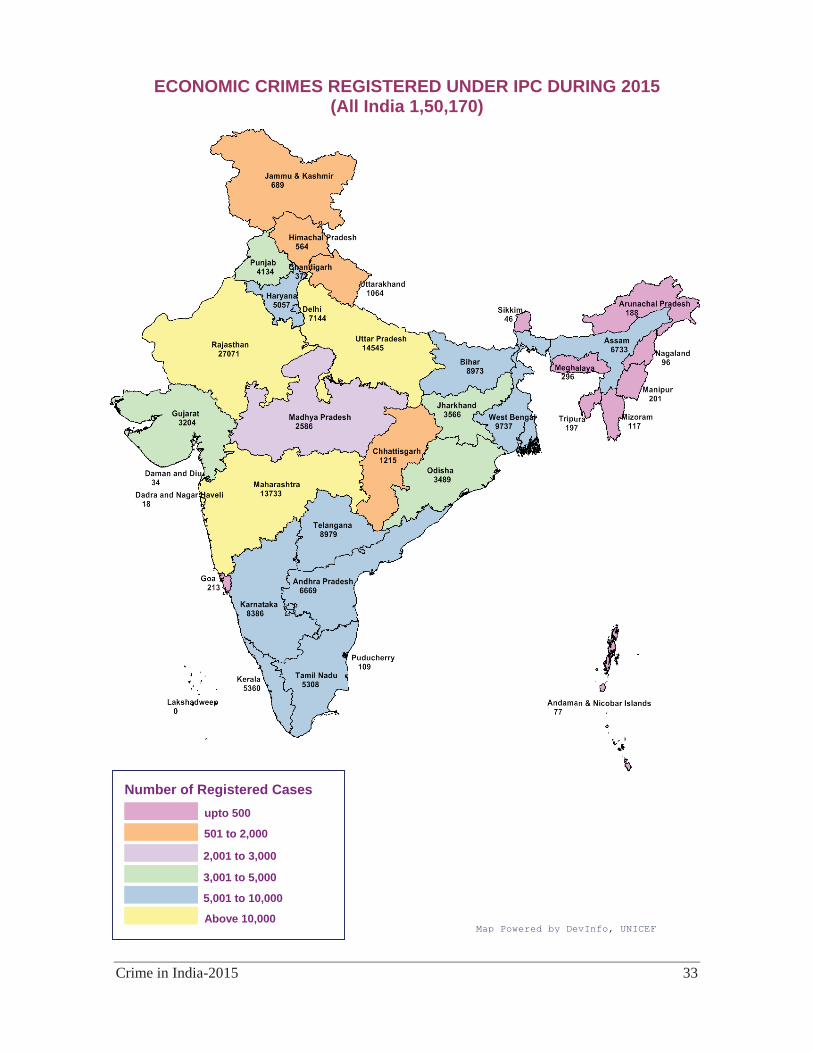
ECONOMIC CRIMES REGISTERED UNDER IPC DURING 2015
(All India 1,50,170)
Number of Registered Cases upto 500
2,001 to 3,000
Above 10,000
501 to 2,000
3,001 to 5,000
5,001 to 10,000
Map Powered by DevInfo, UNICEF

Crime in India-2015 34
RATE OF ECONOMIC CRIMES UNDER IPC DURING 2015 (All India 11.9)
Map Powered by DevInfo, UNICEF
Rate of Crime
upto 5.0
7.1 to 10.0
Above 20.0
5.1 to 7.0
10.1 to 15.0
15.1 to 20.0
Note: Rate of IPC Crime Economic Crimes means number of cases related to economic crimes per 1,00,000 population.
Crime in India-2015 36
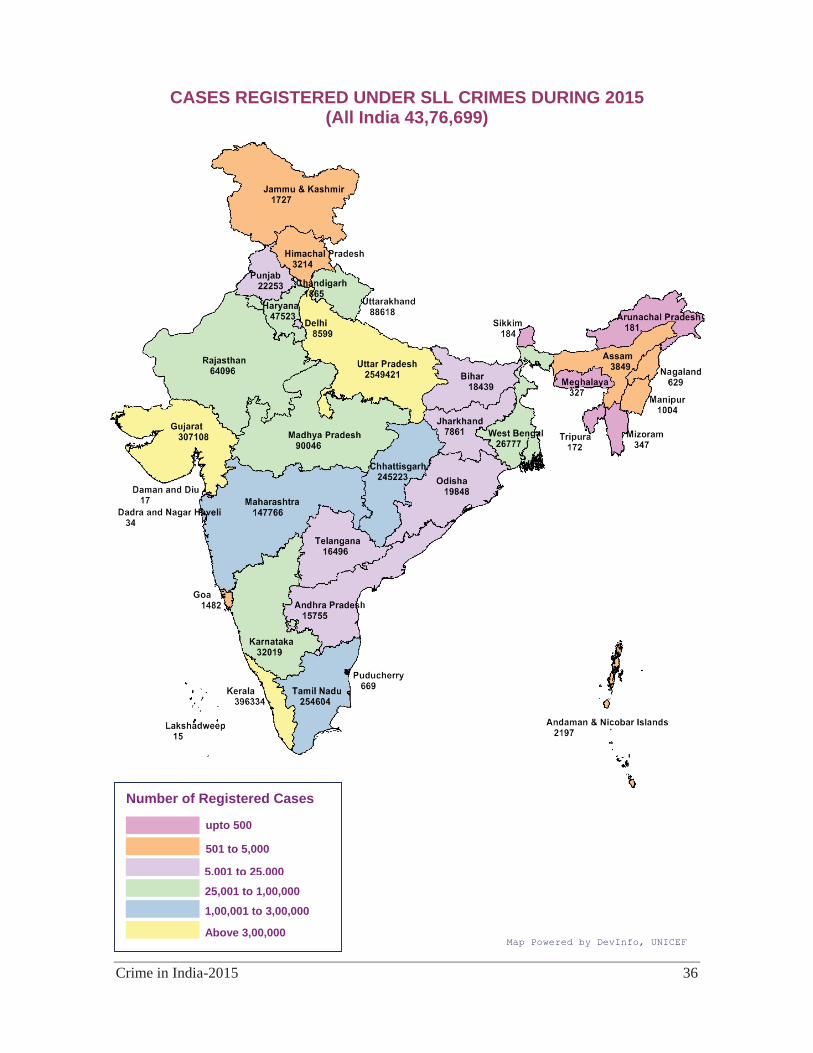
CASES REGISTERED UNDER SLL CRIMES DURING 2015 (All India 43,76,699)
Number of Registered Cases
upto 500
5,001 to 25,000
Above 3,00,000 Map Powered by DevInfo, UNICEF
501 to 5,000
25,001 to 1,00,000
1,00,001 to 3,00,000

Crime in India-2015 38
CRIME RATE OF CASES UNDER SLL CRIMES DURING 2015 (All India 347.6)
Rate of SLL Crime
upto 15.0
35.1 to 50.0
Above 500.0 Map Powered by DevInfo, UNICEF
15.1 to 35.0
50.1 to 125.0
125.1 to 500.0
Note: Rate of SLL Crime means number of cases under SLL crimes per 1,00,0000 population.

Crime in India-2015 56
CASES REGISTERED UNDER VIOLENT CRIMES DURING 2015 (All India 3,35,901)
Number of Registered Cases
upto 500
1,001 to 5,000
Above 20,000Map Powered by DevInfo, UNICEF
501 to 1,000
5,001 to 10,000
10,001 to 20,000
Crime in India-2015 58
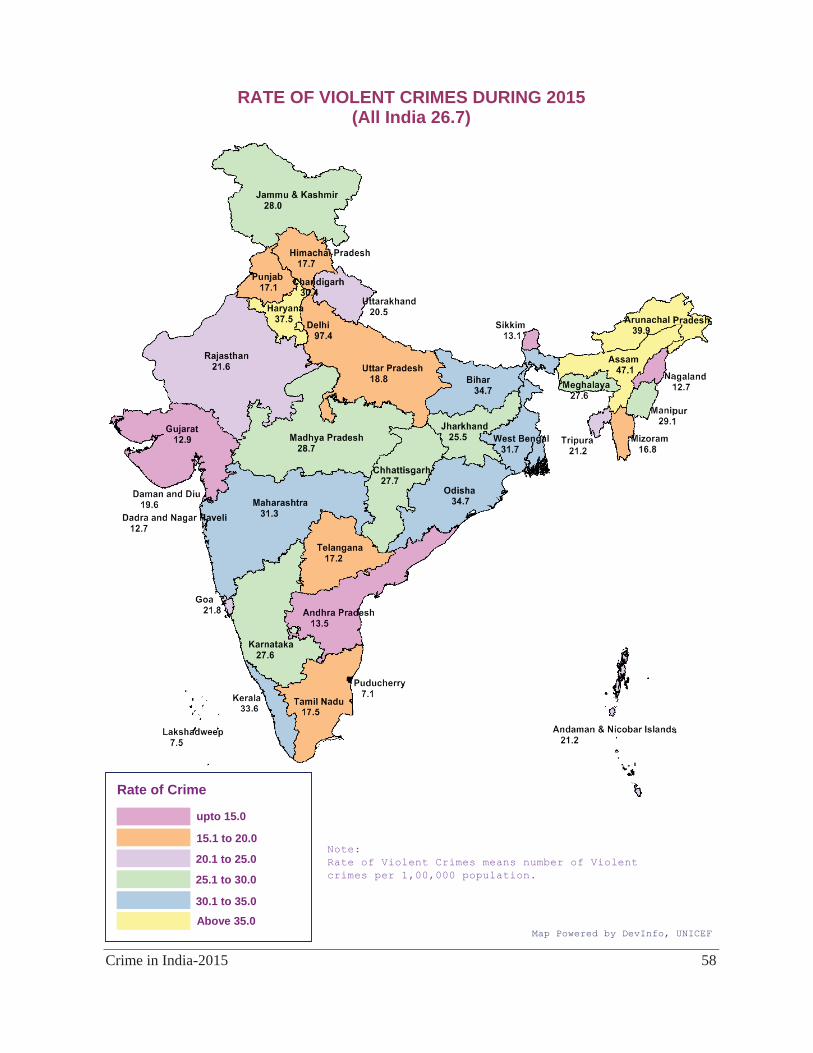
RATE OF VIOLENT CRIMES DURING 2015 (All India 26.7)
Rate of Crime
upto 15.0
20.1 to 25.0
Above 35.0 Map Powered by DevInfo, UNICEF
15.1 to 20.0
25.1 to 30.0
30.1 to 35.0
Note: Rate of Violent Crimes means number of Violent crimes per 1,00,000 population.

Crime in India-2015 68
DISPOSAL PERCENTAGE OF IPC CRIME CASES BY POLICE DURING 2015
(All India 71.6)
Disposal Percentage
upto 50.0
60.1 to 70.0
Above 90.0 Map Powered by DevInfo, UNICEF
50.1 to 60.0
70.1 to 80.0
80.1 to 90.0
Note: Disposal Percentage of IPC cases by police means percentage of cases investigated and cases in which investigation was not done by police out of the total cases for investigation (including pending cases of previous year) under IPC.

Crime in India-2015 69
CHARGESHEETING RATE OF IPC CRIMES DURING 2015 (All India 77.7)
Chargesheeting Rate
upto 60.0
70.1 to 80.0
Above 90.0 Map Powered by DevInfo, UNICEF
60.1 to 70.0
80.1 to 85.0
85.1 to 90.0
Note: Chargesheeting Rate means percentage of cases chargesheeted out of total true cases (cases in which chargesheet not laid but final report submitted as true + cases chargesheeted) under IPC.
Crime in India-2015 73
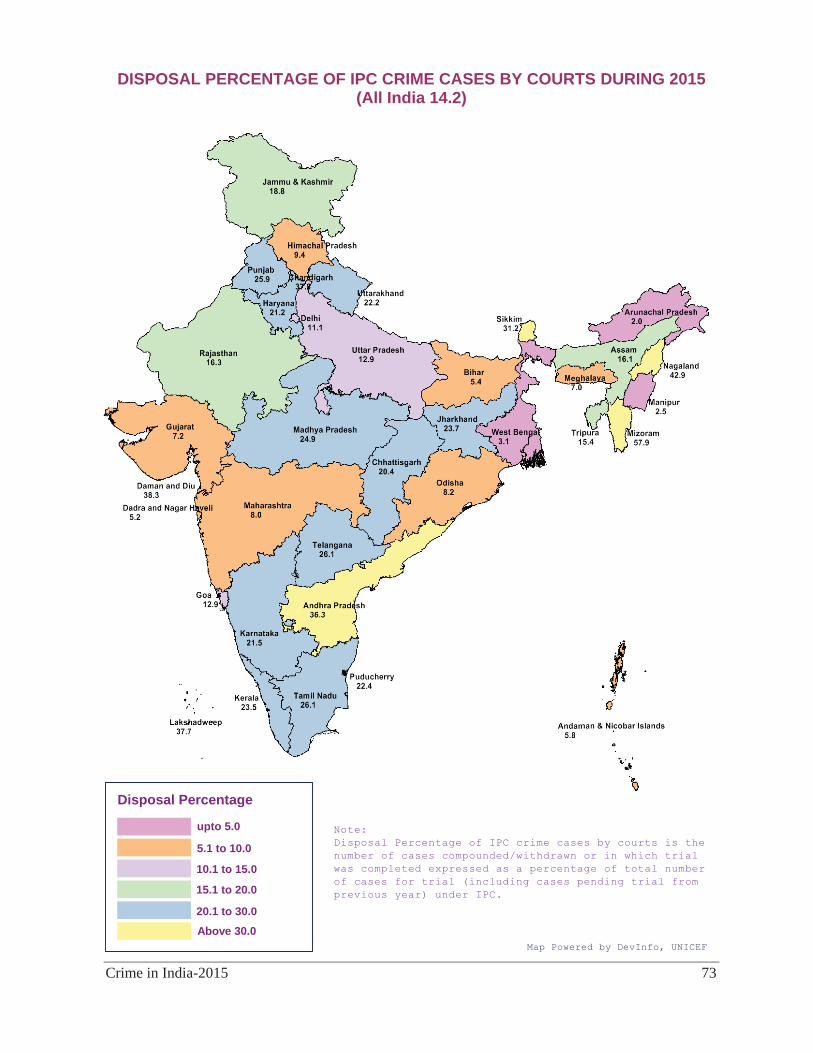
DISPOSAL PERCENTAGE OF IPC CRIME CASES BY COURTS DURING 2015 (All India 14.2)
Disposal Percentage
upto 5.0
10.1 to 15.0
Above 30.0 Map Powered by DevInfo, UNICEF
5.1 to 10.0
15.1 to 20.0
20.1 to 30.0
Note: Disposal Percentage of IPC crime cases by courts is the number of cases compounded/withdrawn or in which trial was completed expressed as a percentage of total number of cases for trial (including cases pending trial from previous year) under IPC.
Crime in India-2015 77
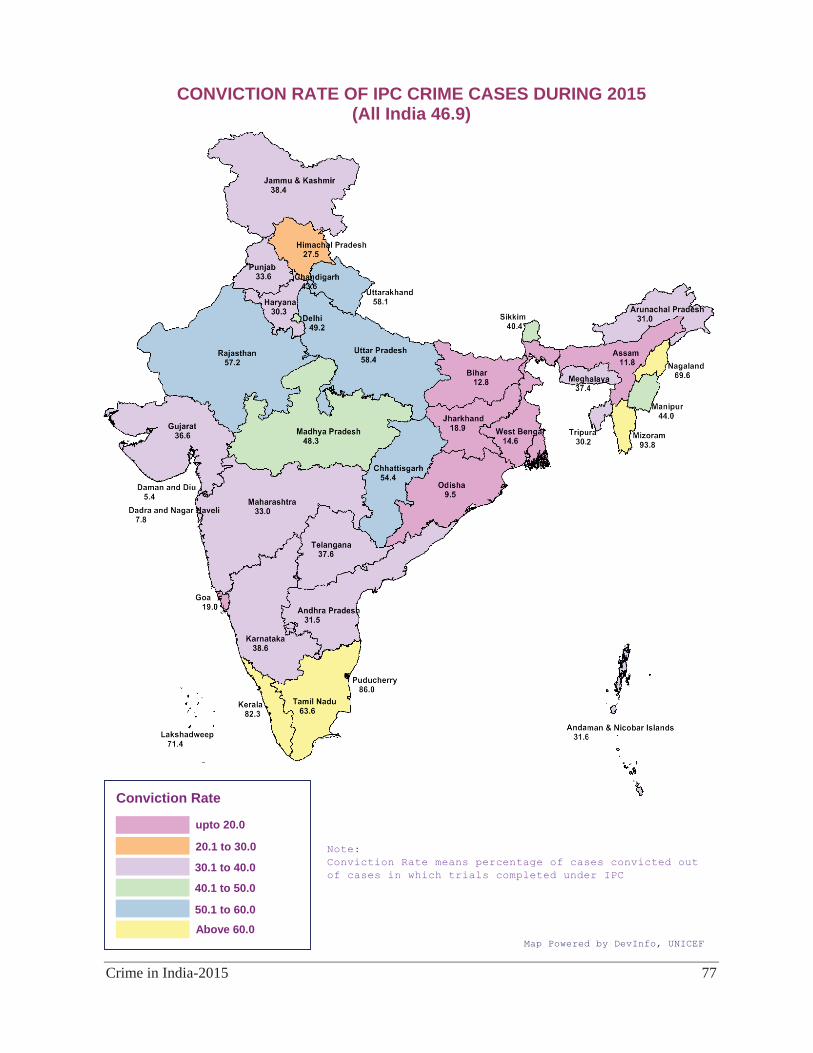
CONVICTION RATE OF IPC CRIME CASES DURING 2015 (All India 46.9)
Conviction Rate
upto 20.0
30.1 to 40.0
Above 60.0 Map Powered by DevInfo, UNICEF
20.1 to 30.0
40.1 to 50.0
50.1 to 60.0
Note: Conviction Rate means percentage of cases convicted out of cases in which trials completed under IPC

Crime in India-2015 82
CASES REGISTERED UNDER CRIME AGAINST WOMEN DURING 2015 (All India 3,27,394)
Number of Registered Cases
upto 1,000
5,001 to 10,000
Above 30,000 Map Powered by DevInfo, UNICEF
1,001 to 5,000
10,001 to 20,000
20,001 to 30,000

Crime in India-2015 84
RATE OF CRIME AGAINST WOMEN DURING 2015 (All India 53.9)
Rate of Crime
upto 20.0
40.1 to 50.0
Above 90.0 Map Powered by DevInfo, UNICEF
20.1 to 40.0
50.1 to 70.0
70.1 to 90.0
Note: Rate of Crime against Women means number of cases registered under crimes against women per 1,00,000 female population.

Crime in India-2015 94
CASES REGISTERED UNDER CRIME AGAINST CHILDREN DURING 2015 (All India 94,172)
Number of Registered Cases
upto 100
1,001 to 2,000
Above 6,000 Map Powered by DevInfo, UNICEF
101 to 1,000
2,001 to 4,000
4,001 to 6,000
Crime in India-2015 95
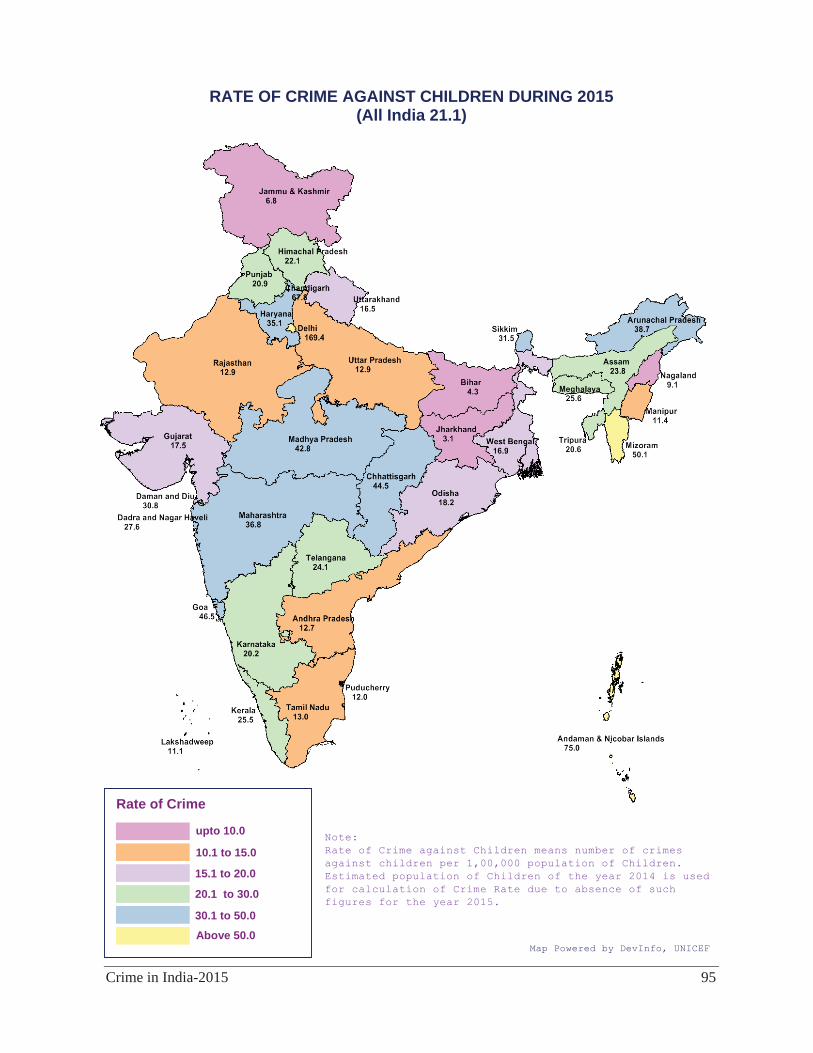
RATE OF CRIME AGAINST CHILDREN DURING 2015 (All India 21.1)
Rate of Crime
upto 10.0
15.1 to 20.0
Above 50.0 Map Powered by DevInfo, UNICEF
10.1 to 15.0
20.1 to 30.0
30.1 to 50.0
Note:Rate of Crime against Children means number of crimes against children per 1,00,000 population of Children. Estimated population of Children of the year 2014 is used for calculation of Crime Rate due to absence of such figures for the year 2015.

Crime in India-2015 108
CHILD TRAFFICKING CASES REGISTERED DURING 2015 (All India 3,490)
Number of Registered Cases
NIL
51 – 100
Map Powered by DevInfo, UNICEF
1 – 50
Above 100
5
A
Crime in India-2015 112
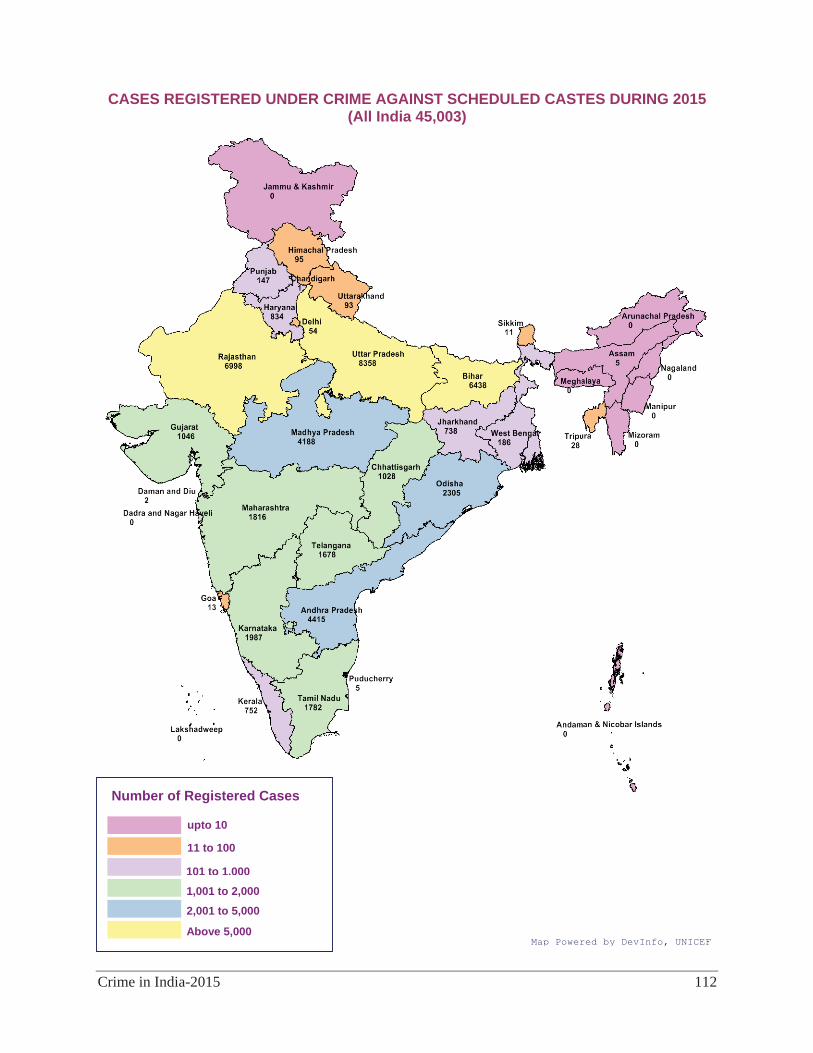
CASES REGISTERED UNDER CRIME AGAINST SCHEDULED CASTES DURING 2015
(All India 45,003)
Number of Registered Cases
upto 10
101 to 1,000
Above 5,000 Map Powered by DevInfo, UNICEF
11 to 100
1,001 to 2,000
2,001 to 5,000
Crime in India-2015 113
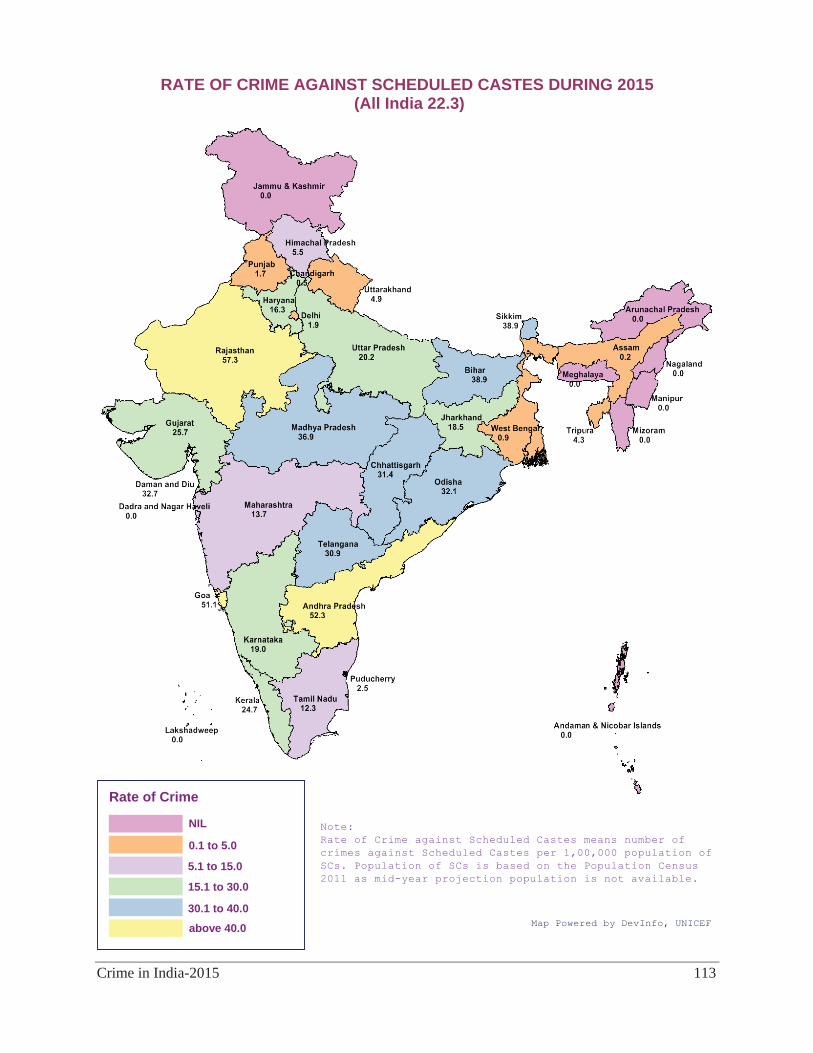
RATE OF CRIME AGAINST SCHEDULED CASTES DURING 2015 (All India 22.3)
Rate of Crime
NIL
5.1 to 15.0
above 40.0 Map Powered by DevInfo, UNICEF
0.1 to 5.0
15.1 to 30.0
30.1 to 40.0
Note: Rate of Crime against Scheduled Castes means number of crimes against Scheduled Castes per 1,00,000 population of SCs. Population of SCs is based on the Population Census 2011 as mid-year projection population is not available.

Crime in India-2015 115
CASES REGISTERED UNDER CRIME AGAINST SCHEDULED TRIBES DURING 2015 (All India 10,914)
Number of Registered Cases
NIL
11 to 100
Above 1,000 Map Powered by DevInfo, UNICEF
1 to 10
101 to 500
501 to 1,000

Crime in India-2015 116
RATE OF CRIME AGAINST SCHEDULED TRIBES DURING 2015 (All India 10.5)
Rate of Crime
NIL
2.1 to 5.0
Above 20.0 Map Powered by DevInfo, UNICEF
0.1 to 2.0
5.1 to 12.0
12.1 to 20.0
Note: Rate of Crime against Scheduled Tribes means number of crimes against Scheduled Tribes per 1,00,00 population of STs. Population of Census 2011 is used for ST population as mid-year population projection for STs is not available.

Crime in India-2015 140
PERSONS ARRESTED UNDER IPC CRIMES DURING 2015 (All India 36,36,596)
Persons Arrested (Number)
upto 5,000
50,001 to 1,00,000
Above 3,00,000 Map Powered by DevInfo, UNICEF
5,001 to 50,000
1,00,001 to 2,00,000
2,00,001 to 3,00,000
Crime in India-2015 142
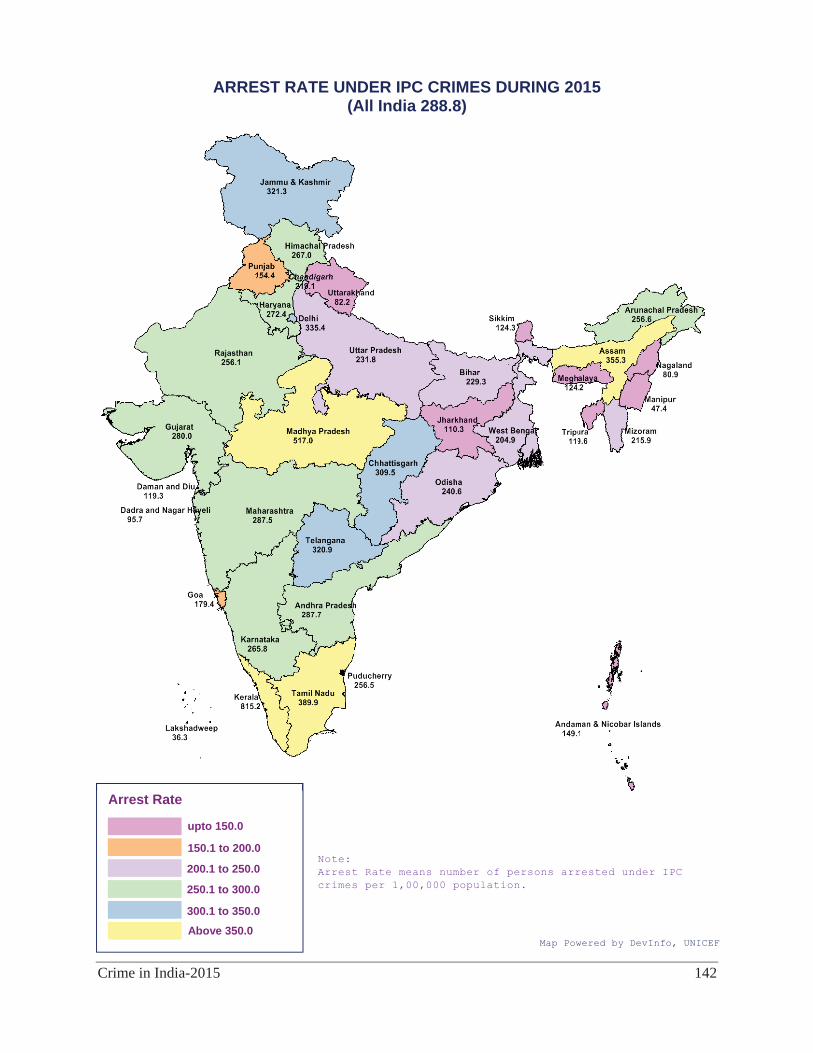
ARREST RATE UNDER IPC CRIMES DURING 2015 (All India 288.8)
Arrest Rate
upto 150.0
200.1 to 250.0
Above 350.0 Map Powered by DevInfo, UNICEF
150.1 to 200.0
250.1 to 300.0
300.1 to 350.0
Note: Arrest Rate means number of persons arrested under IPC crimes per 1,00,000 population.

Crime in India-2015 165
CASES REGISTERED UNDER CYBER CRIME CASES DURING 2015 (All India 11,592)
Number of Cases Registered
upto 20
61 to 150
Above 500 Map Powered by DevInfo, UNICEF
21 to 60
151 to 250
251 to 500

Crime in India-2015 170
PERSONS ARRESTED UNDER CYBER CRIME DURING 2015 (All India 8,121)
Persons Arrested (Number)
upto 10
51 to 150
above 500 Map Powered by DevInfo, UNICEF
11 to 50
151 to 250
251 to 500

Crime in India-2015 178
CASES REGISTERED UNDER CRIME AGAINST SENIOR CITIZENS DURING 2015 (All India 20,532)
Number of Registered Cases
NIL
11 to 200
Above 1500 Map powered by DevInfo, UNICEF
upto 10
201 to 500
501 to 1500

Crime in India-2015 183
CASES REGISTERED UNDER OFFENCES AGAINST STATE (IPC) DURING 2015
(All India 571)
Number of Registered Cases
NIL
6 to 15
Above 35 Map Powered by DevInfo, UNICEF
upto 5
16 to 20
21 to 35
Crime in India-2015 191
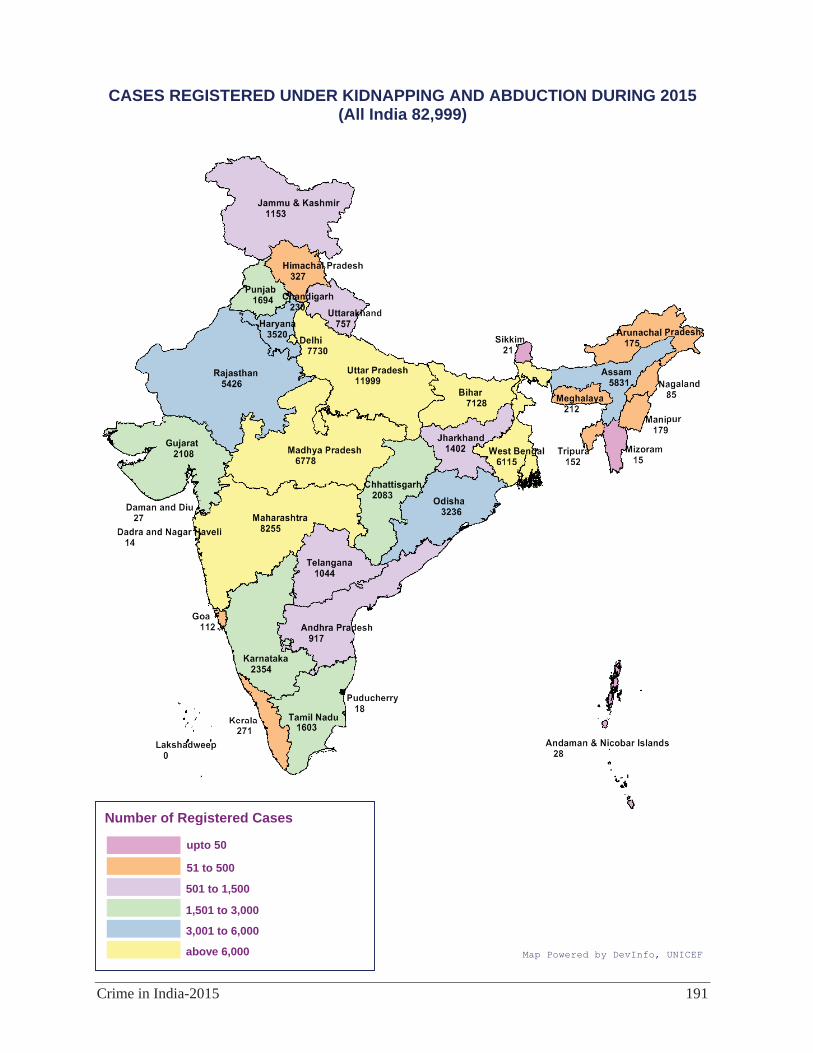
CASES REGISTERED UNDER KIDNAPPING AND ABDUCTION DURING 2015(All India 82,999)
Number of Registered Cases
upto 50
501 to 1,500
above 6,000 Map Powered by DevInfo, UNICEF
51 to 500
1,501 to 3,000
3,001 to 6,000
Crime in India-2015 192
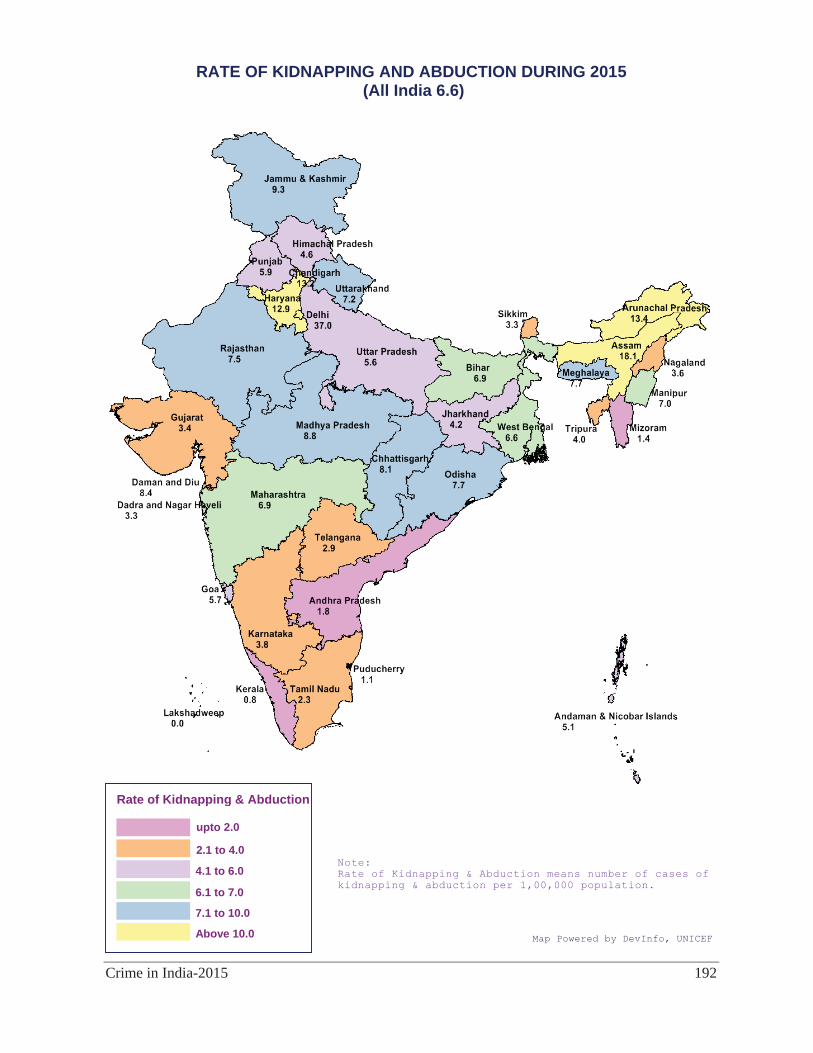
RATE OF KIDNAPPING AND ABDUCTION DURING 2015 (All India 6.6)
Rate of Kidnapping & Abduction
upto 2.0
4.1 to 6.0
Above 10.0 Map Powered by DevInfo, UNICEF
2.1 to 4.0
6.1 to 7.0
7.1 to 10.0
Note: Rate of Kidnapping & Abduction means number of cases of kidnapping & abduction per 1,00,000 population.
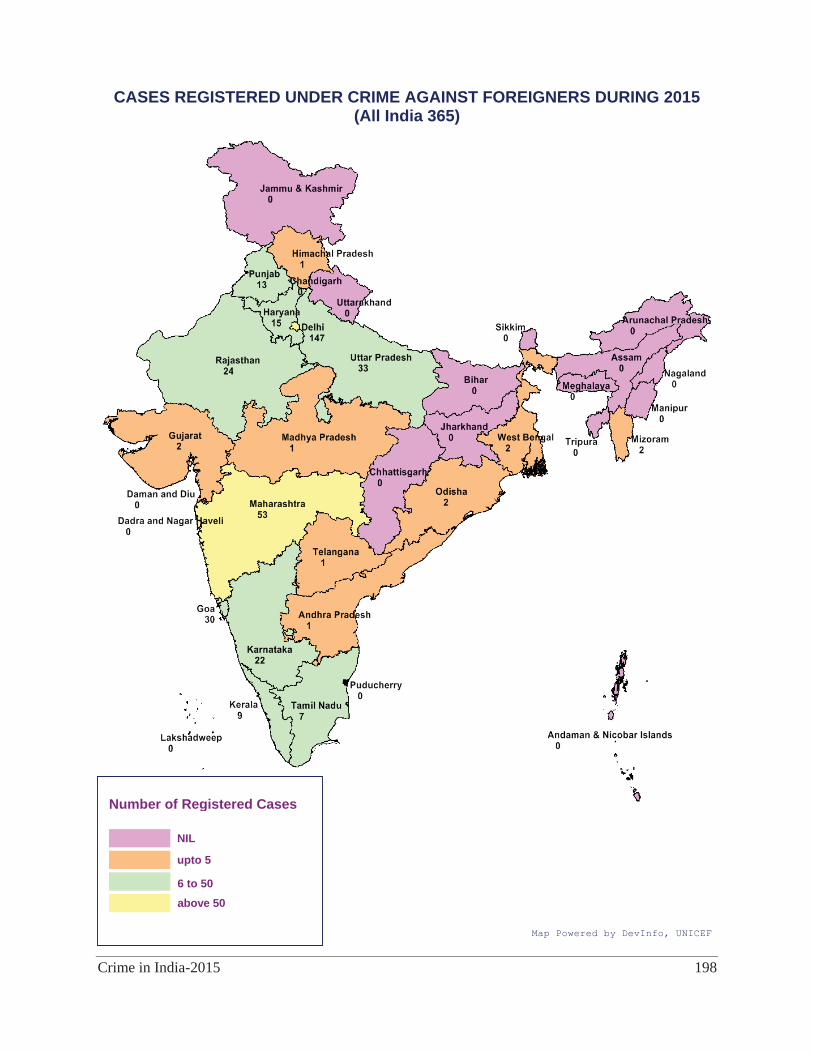
Crime in India-2015 198
CASES REGISTERED UNDER CRIME AGAINST FOREIGNERS DURING 2015 (All India 365)
Number of Registered Cases
NIL
6 to 50
Map Powered by DevInfo, UNICEF
upto 5
above 50


