Casein SNP in Norwegian goats: additive and … effects on milk composition and ... have significant...
12
RESEARCH Open Access Casein SNP in Norwegian goats: additive and dominance effects on milk composition and quality Binyam S Dagnachew 1* , Georg Thaller 2 , Sigbjørn Lien 1,3 and Tormod Ådnøy 1 Abstract Background: The four casein proteins in goat milk are encoded by four closely linked casein loci (CSN1S1, CSN2, CSN1S2 and CSN3) within 250 kb on caprine chromosome 6. A deletion in exon 12 of CSN1S1, so far reported only in Norwegian goats, has been found at high frequency (0.73). Such a high frequency is difficult to explain because the national breeding goal selects against the variant’s effect. Methods: In this study, 575 goats were genotyped for 38 Single Nucleotide Polymorphisms (SNP) located within the four casein genes. Milk production records of these goats were obtained from the Norwegian Dairy Goat Control. Test-day mixed models with additive and dominance fixed effects of single SNP were fitted in a model including polygenic effects. Results: Significant additive effects of single SNP within CSN1S1 and CSN3 were found for fat % and protein %, milk yield and milk taste. The allele with the deletion showed additive and dominance effects on protein % and fat %, and overdominance effects on milk quantity (kg) and lactose %. At its current frequency, the observed dominance (overdominance) effects of the deletion allele reduced its substitution effect (and additive genetic variance available for selection) in the population substantially. Conclusions: The selection pressure of conventional breeding on the allele with the deletion is limited due to the observed dominance (overdominance) effects. Inclusion of molecular information in the national breeding scheme will reduce the frequency of this deletion in the population. Background Under normal conditions, the milk of mammals con- tains 30-35 g of protein per liter [1]. In the milk of ruminants, more than 95% of these proteins are synthe- sized from six structural genes [2]. The two main whey proteins, a-lactalbumin and b-lactoglobulin, are encoded by the LALBA and LGB genes, respectively [3]. The four acid-precipitated proteins (caseins) - a S1 -CN, b-CN, a S2 -CN and -CN - are encoded by four tightly linked casein genes [2]. These four casein loci are found in the following order: CSN1S1, CSN2, CSN1S2 and CSN3 within 250 bp on caprine chromosome 6 [2,4-7]. In goats and other ruminants, casein represents about 80% of the total proteins [2]. Casein genetic variants have been identified and char- acterized in different species (for a review see Ng-Kwai- Hang and Grosclaude [3]). Caroli et al. [8] have reported a comparison among casein genetic variants in cattle, goat and sheep. Analysis of caseins in goats is complex due to extensive polymorphism in the four casein loci [4]. The CSN1S1 gene has a 16.5 kb long transcriptional unit composed of 19 exons, which vary in length from 24 bp to 358 bp [9], and 18 introns [5]. So far, more than 16 alleles have been detected and grouped into four classes based on different expression levels of a S1 - CN in the milk. “Strong” variants (A, B1, B2, B3, B4, C, H, L and M) produce around 3.6 g of a S1 -CN per liter of milk [10], “medium” variants (E and I) produce 1.6 g of a S1 -CN, “weak” alleles ( F and G) produce 0.6 g of a S1 -CN [2,11] and “null” alleles (01, 02, and N) result in absence of the a S1 -CN fraction in milk [2,4,11,12]. * Correspondence: [email protected] 1 Department of Animal and Aquacultural Sciences, Norwegian University of Life Sciences, P.O. Box 5003, N-1432 Ås, Norway Full list of author information is available at the end of the article Dagnachew et al. Genetics Selection Evolution 2011, 43:31 http://www.gsejournal.org/content/43/1/31 G enetics Selection Evolution © 2011 Dagnachew et al; licensee BioMed Central Ltd. This is an Open Access article distributed under the terms of the Creative Commons Attribution License (http://creativecommons.org/licenses/by/2.0), which permits unrestricted use, distribution, and reproduction in any medium, provided the original work is properly cited.
Transcript of Casein SNP in Norwegian goats: additive and … effects on milk composition and ... have significant...

RESEARCH Open Access
Casein SNP in Norwegian goats: additive anddominance effects on milk composition andqualityBinyam S Dagnachew1*, Georg Thaller2, Sigbjørn Lien1,3 and Tormod Ådnøy1
Abstract
Background: The four casein proteins in goat milk are encoded by four closely linked casein loci (CSN1S1, CSN2,CSN1S2 and CSN3) within 250 kb on caprine chromosome 6. A deletion in exon 12 of CSN1S1, so far reported onlyin Norwegian goats, has been found at high frequency (0.73). Such a high frequency is difficult to explain becausethe national breeding goal selects against the variant’s effect.
Methods: In this study, 575 goats were genotyped for 38 Single Nucleotide Polymorphisms (SNP) located withinthe four casein genes. Milk production records of these goats were obtained from the Norwegian Dairy GoatControl. Test-day mixed models with additive and dominance fixed effects of single SNP were fitted in a modelincluding polygenic effects.
Results: Significant additive effects of single SNP within CSN1S1 and CSN3 were found for fat % and protein %,milk yield and milk taste. The allele with the deletion showed additive and dominance effects on protein % and fat%, and overdominance effects on milk quantity (kg) and lactose %. At its current frequency, the observeddominance (overdominance) effects of the deletion allele reduced its substitution effect (and additive geneticvariance available for selection) in the population substantially.
Conclusions: The selection pressure of conventional breeding on the allele with the deletion is limited due to theobserved dominance (overdominance) effects. Inclusion of molecular information in the national breeding schemewill reduce the frequency of this deletion in the population.
BackgroundUnder normal conditions, the milk of mammals con-tains 30-35 g of protein per liter [1]. In the milk ofruminants, more than 95% of these proteins are synthe-sized from six structural genes [2]. The two main wheyproteins, a-lactalbumin and b-lactoglobulin, are encodedby the LALBA and LGB genes, respectively [3]. The fouracid-precipitated proteins (caseins) - aS1-CN, b-CN,aS2-CN and �-CN - are encoded by four tightly linkedcasein genes [2]. These four casein loci are found in thefollowing order: CSN1S1, CSN2, CSN1S2 and CSN3within 250 bp on caprine chromosome 6 [2,4-7]. Ingoats and other ruminants, casein represents about 80%of the total proteins [2].
Casein genetic variants have been identified and char-acterized in different species (for a review see Ng-Kwai-Hang and Grosclaude [3]). Caroli et al. [8] have reporteda comparison among casein genetic variants in cattle,goat and sheep. Analysis of caseins in goats is complexdue to extensive polymorphism in the four casein loci[4]. The CSN1S1 gene has a 16.5 kb long transcriptionalunit composed of 19 exons, which vary in length from24 bp to 358 bp [9], and 18 introns [5]. So far, morethan 16 alleles have been detected and grouped intofour classes based on different expression levels of aS1-CN in the milk. “Strong” variants (A, B1, B2, B3, B4, C,H, L and M) produce around 3.6 g of aS1-CN per literof milk [10], “medium” variants (E and I) produce 1.6 gof aS1-CN, “weak” alleles (F and G) produce 0.6 g ofaS1-CN [2,11] and “null” alleles (01, 02, and N) result inabsence of the aS1-CN fraction in milk [2,4,11,12].
* Correspondence: [email protected] of Animal and Aquacultural Sciences, Norwegian University ofLife Sciences, P.O. Box 5003, N-1432 Ås, NorwayFull list of author information is available at the end of the article
Dagnachew et al. Genetics Selection Evolution 2011, 43:31http://www.gsejournal.org/content/43/1/31
Ge n e t i c sSe lec t ionEvolut ion
© 2011 Dagnachew et al; licensee BioMed Central Ltd. This is an Open Access article distributed under the terms of the CreativeCommons Attribution License (http://creativecommons.org/licenses/by/2.0), which permits unrestricted use, distribution, andreproduction in any medium, provided the original work is properly cited.

The b-casein, which is encoded by the CSN2 locus, isthe major casein fraction in goat milk [13]. The CSN2gene consists of nine exons varying in length from 24bp to 492 bp [2]. Three CSN2 genetic variants (A, B andC) are associated with a normal b-CN content [4,14]and two null alleles (0 and 0’) result in absence or areduced level of b-CN [13,15].Caroli et al. [4] have reviewed the genetic variants of
CSN1S2; seven variants have been identified amongwhich five are associated with a normal aS2-CN level,one with a low level and one resulting in no aS2-CN[16]. At the CSN3 locus, 15 polymorphic sites have beenidentified leading to 16 CSN3 alleles and 13 �-caseinvariants [4,17,18].Several studies have analyzed the effects of the poly-
morphism of casein genes on dairy performance andmilk quality in different goat breeds [12,19-22]. Theyhave revealed that polymorphisms in the CSN1S1 locushave significant effects on casein content, total proteincontent, fat content and technological properties ofmilk. It has also been reported that �-casein (CSN3) var-iants have a significant influence on milk productiontraits [22,23].Norwegian dairy goat is a landrace, reared throughout
Norway and mainly kept for milk production. In thispopulation, 38-40 Single Nucleotide Polymorphisms(SNP) have been identified within the four casein lociand used in several studies [20]. Most of these poly-morphisms are located in the promoter regions of thegenes: with 15 SNP in CSN1S1, six in CSN2, five inCSN1S2 and 13 in CSN3. A deletion in exon 12 ofCSN1S1, so far only reported in Norwegian dairy goats,has been found at a high frequency (0.73, [20]). Thisdeletion and a deletion in exon 9, at lower frequency(0.08, [20]) also described in other breeds, are believedto contribute to the unusually high frequency (0.70,[24]) of “null” aS1-CN in Norwegian goats milk. Threepolymorphisms have been identified at this position ofexon 12 and coded as allele 1, 3 and 6 [20], i.e., allele 1:CTGAAAAATAC (deletion), allele 3: CTGAAGAAA-TAC and allele 6: CTGAAAAAATAC.Allele 1 is associated with a reduced level of dry mat-
ter (DM) content in milk and influences the physico-chemical properties of milk [19,20,24]. The primary goalin the national goat breeding programme is to increaseDM production per goat and year, but also to increasethe DM content in milk to improve milk quality. Inlight of this breeding goal, the high frequency of allele 1,which decreases DM yield, is difficult to explain. So far,in this population, only the average production per gen-otype of the daughters of bucks with known genotypeshas been studied [20]. Thus, it has not been possible toidentify dominance effects. In this study, milk producinggoats were genotyped, and both additive and dominance
effects of genes were determined. We investigated theeffect of SNP within casein genes on Norwegian goats’dairy performance and milk taste.
MethodsMaterialsGenotyping data: Blood samples were collected fromgoats of six farms located in southern Norway andgenomic DNA was isolated according to standard pro-cedures. Genotyping of 38 SNP was performed withthe Sequenom MassARRAY genotyping platform [25]using the assay and genotyping protocols described byHayes et al. [20]. Identities of the SNP and genotypingconditions are included in additional file 1 (see addi-tional file 1).Thirty-eight markers - 36 SNP, one deletion, and
another position with a deletion or two alternative bases(A or G) - located over the four casein loci were investi-gated. The deletion and the A or G are named ‘SNP14’,but have three alleles as explained above. Table 1 pre-sents a summary of the 38 markers (or SNP) used inthe study i.e. fourteen SNP in CSN1S1 (seven in thepromoter, six in the exons, and one in an intron), sixSNP in CSN2 (five in the promoter and one in an exon),four SNP in CSN1S2 (all in exons) and 14 SNP in CSN3(13 in the promoter and one in an exon). The SNPnumbering follows Hayes et al. [20].The extent of the linkage disequilibrium (LD) among
these casein SNP was calculated and visualized usingthe HaploView program [26]. The LD was measured byr2 and displayed as shades of grey (the intensity of thegrey color relates to the amount of LD between theSNP). Additional information such as the total length ofeach casein locus and the distances between adjacentcasein loci were obtained from literature [5,9] and fromthe bovine genome [27].Production data: The Norwegian Dairy Goat Control
recording system collects data from all flocks participat-ing in milk recording (74.1% of all goat flocks in 2005[28]), involving both flocks within and outside the buck-circle system [29]. Records from the six farms with gen-otyped goats were used for this analysis. In each farm,only genotyped goats with kidding date between August2004 and August 2005 were considered and the pheno-typic records correspond to the 2005 production year.Daily milk yield (DMY): refers to the test-day amount
of milk in kg as the sum of morning and evening milkproduction for a single goat. DMY is recorded at leastfive times per farm per year. For this study, a total of3194 DMY were available from 575 genotyped goats.Milk composition: includes milk fat content, protein
content, and lactose content measured as percent oftotal milk; somatic cell count (logSCC) and free fattyacids (logFFA) concentration in milk. These
Dagnachew et al. Genetics Selection Evolution 2011, 43:31http://www.gsejournal.org/content/43/1/31
Page 2 of 12
measurements are Fourier Transform Infrared (FTIR)spectra based predictions. Among the test-day milksamples, at least three are analyzed for milk content (foreither morning or evening milk or both for a test-day).For this study, 2236 milk content measures were avail-able for the 575 genotyped goats.
Milk taste: is an organoleptic evaluation of milk tasteby dairy personnel on a scale 1 to 4, depending on howmuch stale/rancid taste the milk has ("besk/harsk” arethe Norwegian terms used for the evaluation of milktaste). The scale is defined as 1 - there is no stale/rancidtaste, 2 - trace of strong stale/rancid taste, 3 - a stale/rancid taste detected and 4 - stale/rancid taste is strong.For this study, 1352 milk taste scores belonging to 499genotyped goats were available from five of the sixfarms.Pedigree record: 7325 pedigree records including the
575 genotyped goats were available. The genotypedgoats are progenies of 157 bucks. The pedigree file con-tains full identification of individuals and their parents.A maximum of seven generations back in the pedigreewere considered when constructing additive geneticrelationship matrix (A).Variance components: the variance components
used in the analysis are presented in Table 2. Thesevariance components were obtained from the Norwe-gian Association of Sheep and Goat Breeders (NorskSau og Geit, NSG), which is responsible for runningthe goat breeding scheme and calculating breedingvalues. In this study, variance components estimated inJanuary 2009 based on a large dataset were used(unpublished).
Data analysisTo separate the effect of single SNP from additive poly-genic effects, a mixed model was fitted to our dataset.Two slightly different models were used to analyze dif-ferent traits.Model 1: a single trait test-day mixed model was used
to analyze the individual SNP effect on daily milk pro-duction in kg, milk composition traits, somatic cellcount (logSCC) and free fatty acid (logFFA). Each SNPeffect was fitted as a fixed effect and analysed for oneSNP at a time (i.e. the model was run 38 times pertrait).
traitijklm = μ + DIM15i + YSj + FTDk
+ al + dl + um + pm + eijklm
Where:traitijklm: test-day measure of a traitμ: fixed effect of the meanDIM15i: fixed effect of stage of lactation, defined in
15-days intervals (DIM15i, where i = 1,...,24).YSj: fixed effect of the kidding season j (j = 1, 2, 3).
Three kidding seasons considered: 1- December to Feb-ruary, 2- March to May and 3- June to NovemberFTDk: fixed effect of the farm-test-day k (k = 1, 2, ...,
34 for daily milk yield and k = 1, 2,...,25 for milk com-position traits)
Table 1 Casein genes SNP’ position and frequencies inNorwegian dairy goats
SNPA Gene Location AllelesB Frequency of rare alleleC
1 CSN1S1 Promoter A(G) 0.050
2 CSN1S1 Promoter C(T) 0.049
4 CSN1S1 Promoter G(A) 0.130
5 CSN1S1 Promoter G(A) 0.145
6 CSN1S1 Promoter G(A) 0.147
7 CSN1S1 Promoter C(T) 0.146
8 CSN1S1 Promoter G(A) 0.068
9 CSN1S1 Exon 4 T(C) 0.150
10 CSN1S1 Exon 5 C(G) 0.160
11 CSN1S1 Exon 9 C(D) 0.037
12 CSN1S1 Intron 8 A(G) 0.148
13 CSN1S1 Exon 10 C(G) 0.148
14 CSN1S1 Exon 12 Allele 1 (D) 0.737
Allele 3 (G) 0.112
Allele 6 (A) 0.151
15 CSN1S1 Exon 17 C(T) 0.116
16 CSN2 Exon 7 T(C) 0.062
17 CSN2 Promoter A(G) 0.061
18 CSN2 Promoter G(A) 0.024
19 CSN2 Promoter A(G) 0.060
20 CSN2 Promoter (A)T 0.060
21 CSN2 Promoter C(T) 0.064
22 CSN1S2 Exon 3 G(A) 0.078
24 CSN1S2 Exon 16 C(G) 0.050
25 CSN1S2 Exon 16 C(T) 0.318
26 CSN1S2 Exon 16 A(T) 0.315
27 CSN3 Promoter G(A) 0.421
28 CSN3 Promoter G(A) 0.493
29 CSN3 Promoter (A)G 0.002
30 CSN3 Promoter T(A) 0.494
31 CSN3 Promoter T(A) 0.466
32 CSN3 Promoter G(C) 0.494
33 CSN3 Promoter T(G) 0.465
34 CSN3 Promoter T(G) 0.480
35 CSN3 Promoter A(G) 0.092
36 CSN3 Promoter T(C) 0.317
37 CSN3 Promoter G(T) 0.328
38 CSN3 Promoter A(G) 0.180
39 CSN3 Promoter G(A) 0.092
40 CSN3 Exon 4 C(T) 0.098A Numbering of SNP is according to Hayes et al., 2006 [20]B The allele in parentheses refers to the minor allele for the SNP. ‘D’ in SNP11and SNP14 refer to a deletion.C For SNP14 frequencies are reported for all the three possible alleles
Dagnachew et al. Genetics Selection Evolution 2011, 43:31http://www.gsejournal.org/content/43/1/31
Page 3 of 12
al: fixed additive effect of the major allele of SNP l (l= 1, 2,...,38)dl: fixed dominance effect of the major allele of SNP lum: random polygenic effects (breeding values) of the
animal m (m = 1, 2,...,575)pm: random permanent environment effect of the ani-
mal m (m = 1, 2,...,575)eijklm: random residual effect of observation ijklmMatrix representation of the model:
y = Xβ + Qq + Zu + Zp + e
Where: y is the vector of phenotypic observations, Xis a design matrix of fixed effects, other than SNPeffects, Q is a design matrix of a SNP (additive anddominance) effects, b is a vector of fixed non-geneticeffects, q is a vector of fixed SNP effects (additive anddominant), Z is an incidence matrix relating individuals’phenotypes to breeding values u and permanent envir-onment effect p and e is the vector of residual errorassociated with each observation. The vector of breedingvalues, u, contains only animals with records. Here we
assumed u ∼ N(0, Auσ2u ) , p ∼ N(0, Iσ 2
p ) and
e ∼ N(0, Iσ 2e )where Au is subset of the additive genetic
relationship matrix (A), which contains only genotypedanimals (part of matrix A is used to minimize computa-tion time since the model is run 38 times per trait), I is
an identity matrix, σ 2u , σ 2
p and σ 2e are additive genetic,
permanent environmental and residual variances,respectively. Q = [Qa Qd] was set for additive and dom-inance effects as follows:
Qa
⎧⎨⎩
1 if the SNP is homozygous for the major allele0 if the SNP is heterozygous- 1 if the SNP is homozygous for the other allele
for additive effect
Qd
{1 if the SNP is heterozygous0 if the SNP is homozygous
for dominance effect
Model 2: A slightly different model was used to esti-mate individual SNP effects on milk taste. Due to fewerobservations available for this trait compared to othermilk production traits, a longer interval (30 days) wasused to account for the effect of stage of lactation(DIM). No polygenic effect was included (because milk
taste is not included as a breeding criterion and reliablevariance component estimates from a large dataset arenot available). To account for genetic relatedness, milktaste scores were corrected for bucks’ effects prior tomodelling. The correction was done through fittingbucks as a fixed effect in a linear model and collectingthe residuals. The residuals of the taste scores were thenfitted as in model 2.
(residual of taste scores)ijkl = μ + DIM30i + YSj
+ FTDk + al + dl + eijkl
The model components were as defined in model 1.Dominance effects of SNP2, SNP11, SNP18, SNP19,
SNP20, SNP24 and SNP29 were not estimated becausethe number of homozygous goats for the rare alleles ofthese SNP was either very low or zero. For these SNP,Qa was set as 2, 1, and 0 if the SNP is homozygous forthe major allele, heterozygous and homozygous for theother allele, respectively.
Gene substitution effect (a)Gene substitution effect, a, for a SNP is the averagechange of genotypic value that results when one allele isreplaced by the other allele of same locus [30]. Estimatedadditive (al) and dominance (dl) effects of SNP were col-lected from model 1 and model 2, and gene substitutioneffects (al) were calculated (a1 = a1+(1-2 pi)di [31]); wherepl is the frequency of the major allele at lth SNP position.
SNP14 genotype’s effectIn the analysis of single SNP fixed effects, the threealleles at exon 12 of CSN1S1 (SNP14) were first treatedas a deletion (allele 1) or a non-deletion (alleles 3 and 6)in both models. In order to quantify the effect of thispolymorphism more precisely, the fixed effects of the sixpossible genotypes (’1/1’, ‘3/3’, ‘6/6’, ‘1/3’, ‘1/6’, and ‘3/6’)were also analyzed separately. The effects of these geno-types were also estimated using models 1 and 2, repla-cing the SNP effect term.
Statistical inferenceTo determine the significance of the effect of singleSNP, the null hypotheses that there is no additive effect
Table 2 Variance components used for the analysis
TraitsB
Variance componentsA Milk yield kg Fat percentage Protein percentage Lactose percentage log(FFA) log(SCC)
Additive genetic 0.0532 0.1398 0.0149 0.0133 0.1782 0.0811
Permanent environment 0.0710 0.0629 0.0073 0.0061 0.0979 0.1949
Residual 0.1531 0.3117 0.0196 0.0159 0.2438 0.5157AThe variance components were estimated in January 2009 by NSG.BMilk composition traits are expressed in percentage of total milk.
Dagnachew et al. Genetics Selection Evolution 2011, 43:31http://www.gsejournal.org/content/43/1/31
Page 4 of 12

of a SNP (al = 0) and the null hypotheses that there isno dominance effect (dl = 0) were tested. The student t-distribution was used to test the significance of eachSNP effect on each trait. Due to multiple testing, a Bon-ferroni threshold correction was applied to obtain a 5%overall error rate when testing for the 38 SNP per trait.The effective number of independent tests was deter-mined using a method that takes the linkage disequili-brium (LD) structure into account as described inCheverud (2001) [32]. If the dominance effect (dl) of aSNP was significant, the degree of dominance (kl = dl/al)was determined for the SNP. If kl was greater than 1,the significance of the overdominance effect waschecked by testing H1: dl-al > 0. Also, the null hypoth-eses that there is no difference between the CSN1S1genotype ‘1/1’ (homozygous for deletion) and each ofthe other five exon 12 CSN1S1 genotypes were tested.
Statistical toolsScripts were written for each model and run in ’R’ sta-tistical software (R Development Core Team) [33].
ResultsLinkage disequilibrium (LD) structureFigure 1 is a graphical representation of the extent anddistribution of LD within the four casein loci in Norwe-gian dairy goats. Pairwise LD values used to create thefigure are given in additional file 2 (see additional file 2).Figure 1 includes CSN1S1 SNP 1-14, CSN2 SNP 15-20,CSN1S2 SNP 21-24 and CSN3 SNP 25-38. A substantialamount of LD was observed among the casein SNP. Theobserved LD varied from completely linked (r2 = 1,black) to no LD (r2 = 0, white). Figure 1 shows that CSN2SNP are in stronger LD with CSN1S1 SNP than they arewith SNP of the CSN1S2 and CSN3 genes. It also showsthe CSN1S2 SNP are in strong LD with CSN3 SNP.
Test of SNP effectsThe test statistics of estimates for the major alleles ateach SNP position are plotted in Figures 2, 3 and 4. Fig-ures 2 and 3 present t-statistics values for additive (al)and dominance (dl) effects of single SNPl on milk pro-duction traits. Individual SNP show a similar pattern ofadditive effects for protein and fat content in milk (Fig-ure 2). At most positions, the observed t-statistics forprotein percentage are higher than for fat percentage.Among the SNP within CSN1S1, only SNP14 deletion(allele 1) significantly reduces both fat and protein per-centages at the chosen error rate. Two SNP withinCSN1S2 (SNP25 and SNP26) had significant negativeeffects for protein percentage with an opposite trend formilk production in kg. The major allele of CSN1S2SNP24 was associated with a significantly lower milkyield at the chosen error rate (Figure 2).
A cluster of SNP at CSN3 (SNP27-SNP29 and SNP31-SNP34) had a tendency to increase protein % and fat %and to reduce milk production in kg. However, few ofthese SNP had significant additive effects: SNP28,SNP34, SNP36 and SNP37 for milk production in kg,SNP27, SNP31, SNP33, SNP34, SNP36 and SNP 37 forprotein % and SNP34 for fat % (Figure 2). Almost allthe SNP within CSN1S1 and CSN3 loci had oppositeadditive effects on milk yield and milk content traits.The deletion in exon 9 of CSN1S1 (SNP11), whichresults in the absence of detectable aS1-casein [12], didnot show any significant additive effect, but also did notfollow the pattern of the neighbouring SNP.The dominance effects of casein SNP for milk produc-
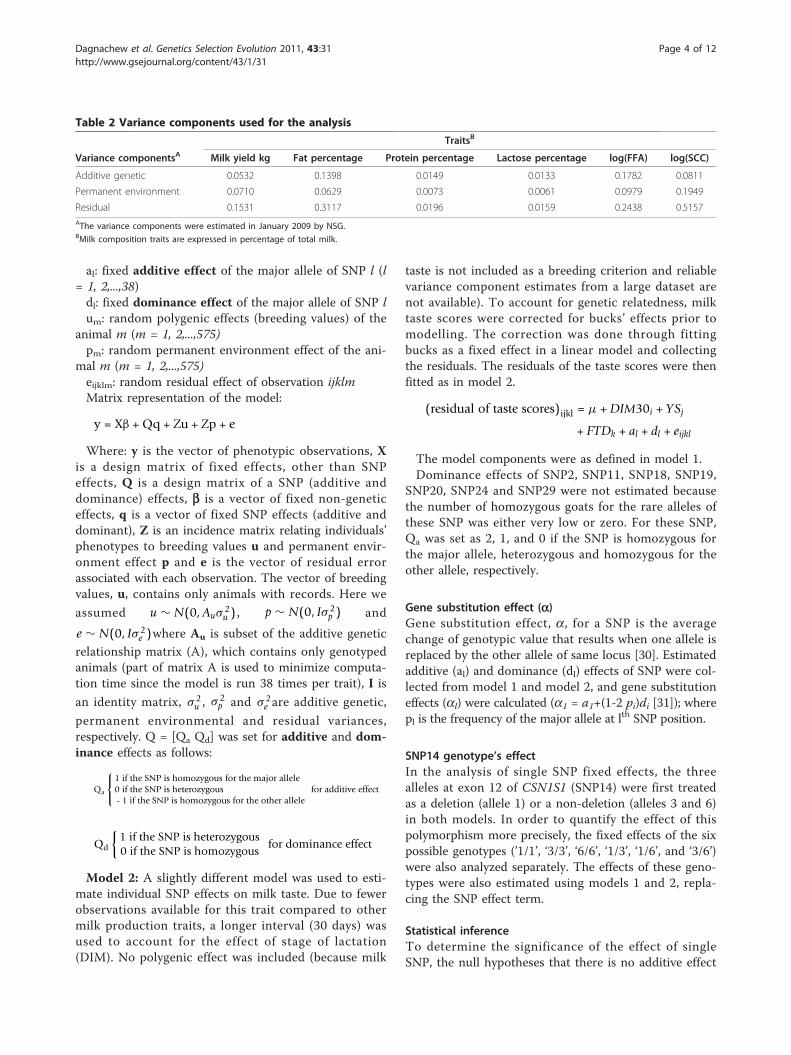
tion in kg, protein %, fat %, and lactose % are presentedin Figure 3. As for additive effects of these SNP, similarpatterns of dominance effects was observed for protein% and fat %. Only the deletion in exon 12 of CSN1S1(SNP14) had significant dominance effects for milk pro-duction in kg and milk composition (the heterozygote atthis position had significantly higher milk production inkg, and lower protein %, fat %, and lactose % than theaverage values of the homozygotes). As for the additiveeffects, all SNP in the CSN1S1 locus had opposite domi-nance effects on milk yield and milk composition traits(Figure 3).For the traits with significant dominance, the degrees
of dominance are presented in Table 3. The ratios arebetween 0.5 and 1, indicating partial dominance, forprotein % and fat % and higher than 1, implying overdo-minance, for milk production in kg and lactose %. Theoverdominance effects of SNP14 are significant (p <0.01) for milk production in kg and weakly significant (p< 0.1) for lactose % (Table 3).Single SNP fixed additive effects on milk taste and free
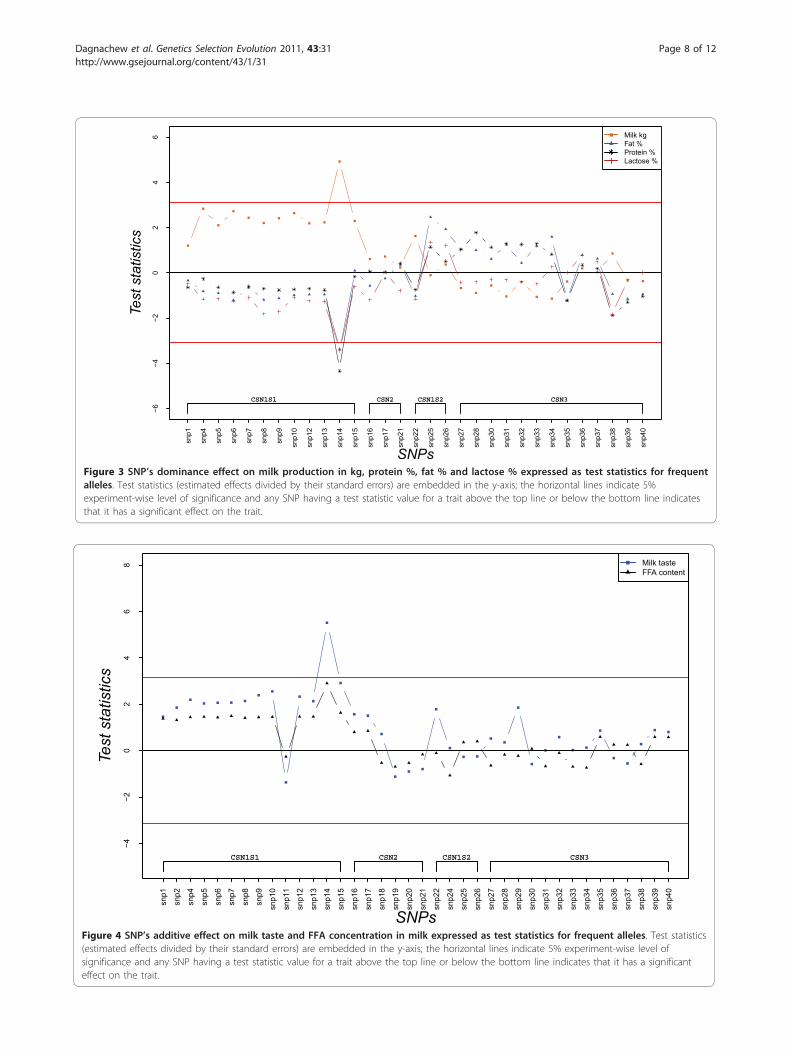
fatty acid (logFFA) concentration in milk are presentedin Figure 4. Additive effects of casein SNP on milk tastefollow a pattern similar to that of FFA concentration inmilk (Figure 4). The deletion in exon 12 of CSN1S1(SNP14) showed a significant additive effect on milktaste - i.e. was associated with a stronger rancid/staletaste - at the chosen level of significance. However,none of the SNP had significant additive effects on FFAconcentration in milk (Figure 4). No significant domi-nance effects on either of these traits were found(results not presented).
Gene substitution effect and varianceFigure 5A presents the gene substitution effect (a) ofSNP14 for the estimated additive (a) and dominance (d)values depending on the different allele 1 (deletion) fre-quencies. Results of the other SNP are not presentedhere. Figure 5A shows that the gene substitution effectof the SNP decreases when the frequency of allele 1
Dagnachew et al. Genetics Selection Evolution 2011, 43:31http://www.gsejournal.org/content/43/1/31
Page 5 of 12

increases for milk yield, and becomes negative for allelefrequencies above 0.74. For lactose %, the substitutioneffect would be zero if the frequency of allele 1 were0.87 and positive for higher frequencies (Figure 5A).The magnitude of the gene substitution effect is alsoreduced for protein % and fat %, becoming less negativewith an increasing frequency of allele 1, but remainingnegative (Figure 5A).The contribution of the gene substitution effect of
SNP14 to the additive genetic variance is presented inFigure 5B. This Figure shows that the variance increasesfor fat % and protein %, reaches maximum and thendecreases as the frequency of allele 1(deletion) increases.For milk production in kg and lactose % a similar trendof variance is observed, but after reaching zero at 0.74for milk and 0.87 for lactose there is a small additivevariance contribution for higher allele 1 frequencies.The variances reach their maximum values at frequen-cies for the allele 1 below 0.5 differing somewhat for thefour traits (Figure 5B). The maximum variance contribu-tion of SNP14 might attain approximately half the addi-tive genetic variance given in Table 2 for protein and fat
percentages, and less for lactose percentage and milkyield in kg.
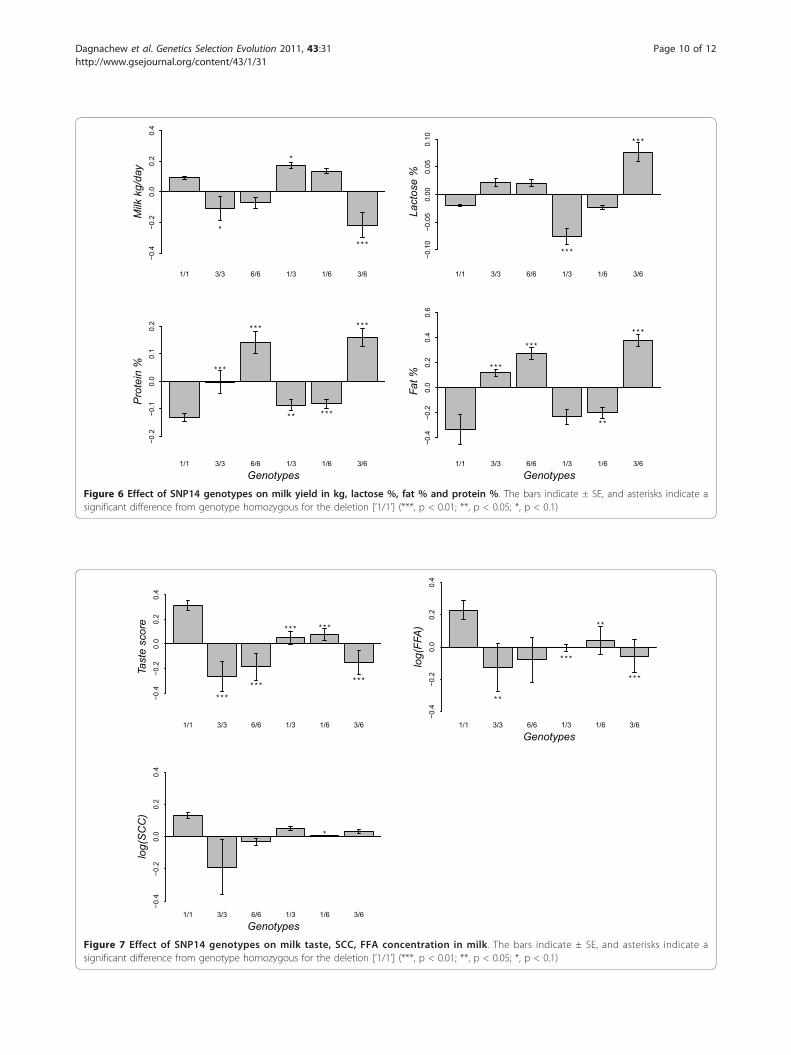
Effect of the genotypes at SNP14The estimated effects of the six genotypes at exon12 ofCSN1S1 (SNP14) and the significance tests to comparethe differences between the five genotypes and thehomozygous genotype for allele 1 (’1/1’) are presentedin Figures 6 and 7. Figure 6 shows that ‘3/6’ goats pro-duced less milk production in kg (p < 0.01) and morelactose (p < 0.01) than ‘1/1’ goats. ‘1/3’ goats had alower lactose % (p < 0.01) compared to ‘1/1’ goats. Allfive genotypes were associated with a significantly higherprotein % in milk than that in ‘1/1’ goats. Goats homo-zygous for allele 1 also had a lower milk fat % comparedto ‘3/3’, ‘6/6’, ‘1/6’ and ‘3/6’ (Figure 6).All the five genotypes - ‘3/3’, ‘6/6’, ‘1/3’, ‘1/6’, and ‘3/6’
- were significantly associated with less strong milk tastecompared to genotype homozygous for the deletion(Figure 7). This Figure also shows that the ‘1/1’ geno-type led to a significantly higher FFA concentration inthe milk in contrast with ‘3/3’,’1/3’,’1/6’ and ‘3/6’
Figure 1 Graphical representation of Linkage Disequilibrium (LD) across SNP within four casein loci in Norwegian dairy goats. Eachdiamond indicates the extent of pairwise LD measured by r2 between the SNP specified; the darker the color, the higher the r2 value (white, r2
= 0; shades of grey, 0 < r2 < 1 and black, r2 = 1); the r2 values used to generate this graphical representation are given in additional file 2 (seeadditional file 2)
Dagnachew et al. Genetics Selection Evolution 2011, 43:31http://www.gsejournal.org/content/43/1/31
Page 6 of 12

genotypes. In addition, although the ‘1/1’ goats had thehighest somatic cell count (logSCC), the difference wasonly weakly significant for the ‘1/6’ genotype (p < 0.1,Figure 7)
DiscussionThe effects of casein polymorphisms on dairy perfor-mance of different goat breeds have been reviewedacross countries [12,18-20]. A previous study on Norwe-gian goats [20] reported on an association analysisbetween the casein genotypes of bucks and the daugh-ters’ yield deviation (DYD). In this study, both genotypeand phenotype information of milk producing goats wasused to investigate casein SNP dominance effects inaddition to their additive effects. Unlike in the afore-mentioned study [20], we identified single SNP ofCSN1S1 and CSN3 genes significantly associated withmilk production in kg and milk contents (Figure 2) anda SNP in the CSN1S1 gene that was significantly asso-ciated with milk taste (Figure 4).One explanation for the higher significance revealed in
our study, could be that family analysis in a segregatingpopulation cannot disentangle the fixed additive anddominance effects and thus only gene substitution
effects could be studied [31]. The substitution effectanalysis of SNP14 (Figure 5A) showed that allele 1 hadlow allele substitution effects on milk and milk composi-tion traits at its current frequency in the population.This contributes to the small effect found in the pre-vious dataset [20].Effects of CSN1S1 polymorphism on milk fat content
have been reported in several goat populations [3,12].To explain this unexpected effect, rather than a directgenetic cause, it is hypothesised that the absence of aS1-casein disrupts the intercellular transport of caseins,which in turn disturbs the secretion of milk lipids[34,35]. Our observation on the allele with a deletion inexon 12 of CSN1S1, which probably leads to “null” aS1-casein, is associated with a reduced fat content of milk(Figure 2 and 6), is in line with this hypothesis.Hayes et al. [20] have proposed that the observed
higher SNP effects at CSN3 locus might not be due todirect genetic effects, but rather to the fact that the SNPare physically associated with the causative mutationresponsible for the observed variation. However, datareported in other breeds strongly confirmed the effect of�-casein polymorphisms on milk production traits[22,23,36]. The observed additive effects of CSN3 SNP
−50
5
SNPs
Test
sta
tistic
s
snp1
snp2
snp4
snp5
snp6
snp7
snp8
snp9
snp1
0
snp1
1
snp1
2
snp1
3
snp1
4
snp1
5
snp1
6
snp1
7
snp1
8
snp1
9
snp2
0
snp2
1
snp2
2
snp2
4
snp2
5
snp2
6
snp2
7
snp2
8
snp2
9
snp3
0
snp3
1
snp3
2
snp3
3
snp3
4
snp3
5
snp3
6
snp3
7
snp3
8
snp3
9
snp4
0
Milk kgFat %Protein %Lactose %
CSN1S1 CSN2 CSN1S2 CSN3
Figure 2 SNP’s additive effect on milk production in kg, protein %, fat % and lactose % expressed as test statistics for frequentalleles. Test statistics (estimated effects divided by their standard errors) are embedded in the y-axis; the horizontal lines indicate 5%experiment-wise level of significance and any SNP having a test statistic value for a trait above the top line or below the bottom line indicatesthat it has a significant effect on the trait.
Dagnachew et al. Genetics Selection Evolution 2011, 43:31http://www.gsejournal.org/content/43/1/31
Page 7 of 12
−6−4
−20
24
6
SNPs
Test
sta
tistic
s
snp1
snp4
snp5
snp6
snp7
snp8
snp9
snp1
0
snp1
2
snp1
3
snp1
4
snp1
5
snp1
6
snp1
7
snp2
1
snp2
2
snp2
5
snp2
6
snp2
7
snp2
8
snp3
0
snp3
1
snp3
2
snp3
3
snp3
4
snp3
5
snp3
6
snp3
7
snp3
8
snp3
9
snp4
0
Milk kgFat %Protein %Lactose %
CSN1S1 CSN2 CSN1S2 CSN3
Figure 3 SNP’s dominance effect on milk production in kg, protein %, fat % and lactose % expressed as test statistics for frequentalleles. Test statistics (estimated effects divided by their standard errors) are embedded in the y-axis; the horizontal lines indicate 5%experiment-wise level of significance and any SNP having a test statistic value for a trait above the top line or below the bottom line indicatesthat it has a significant effect on the trait.
−4−2
02
46
8
SNPs
Test
sta
tistic
s
snp1
snp2
snp4
snp5
snp6
snp7
snp8
snp9
snp1
0
snp1
1
snp1
2
snp1
3
snp1
4
snp1
5
snp1
6
snp1
7
snp1
8
snp1
9
snp2
0
snp2
1
snp2
2
snp2
4
snp2
5
snp2
6
snp2
7
snp2
8
snp2
9
snp3
0
snp3
1
snp3
2
snp3
3
snp3
4
snp3
5
snp3
6
snp3
7
snp3
8
snp3
9
snp4
0
Milk tasteFFA content
CSN1S1 CSN2 CSN1S2 CSN3
Figure 4 SNP’s additive effect on milk taste and FFA concentration in milk expressed as test statistics for frequent alleles. Test statistics(estimated effects divided by their standard errors) are embedded in the y-axis; the horizontal lines indicate 5% experiment-wise level ofsignificance and any SNP having a test statistic value for a trait above the top line or below the bottom line indicates that it has a significanteffect on the trait.
Dagnachew et al. Genetics Selection Evolution 2011, 43:31http://www.gsejournal.org/content/43/1/31
Page 8 of 12

on protein percentage and milk yield (Figure 2) in thisstudy are in agreement with those findings.The single SNP analyses did not detect any significant
associations between casein SNP and FFA concentrationin milk (Figure 4). However, when analyzing separatelythe six genotypes at SNP14 position, a significant varia-tion in FFA concentration was observed (Figure 7).Ådnøy et al. [19] have also reported significant associa-tion between CSN1S1 genotypes and FFA concentrationin milk in goats from two flocks of the same Norwegianbreed. FFA are released into the milk through the actionof lipase on fat molecules leading to lipolysis [37] andthis lipolytic activity may affect negatively the sensory
quality of the milk and its products [38] because of theunpleasant flavor produced during this process. Eventhough several other factors contribute to the taste ofgoat milk [18], genetic variants at SNP14 position couldexplain part of the significant variations in milk taste(Figure 4 and 7). This might be related with the FFAconcentration in the milk. The results show that geno-types associated with a high concentration of FFA inmilk are also associated with a strong milk taste (Figure7). It has been suggested [21] that milk from goats with“weak” CSN1S1 alleles have higher post-milking lipolyticactivity than milk from goats with the “strong” CSN1S1alleles. In our study, the “weak” alleles (genotype homo-zygous for allele 1) tend to be associated with a higherFFA concentration in milk (Figure 7) and support thesuggestion.For SNP14, dominance effect (d) was significantly
greater than additivity (a) for milk yield in kg and lac-tose % (Table 3), implying an overdominance effect forthese traits. Based on the estimated a and d, the geneticvariances of SNP14 are small at the existing gene fre-quency (0.73) for milk production in kg, fat, protein andlactose % (Figure 5B). Lynch and Walsh [30] havedescribed that in case of overdominance, there is alwaysan intermediate allele frequency at which genetic var-iance is equal to zero. Figure 5B shows that the geneticvariance of SNP14 is zero at allele frequencies of 0.74and 0.87 for milk production in kg and lactose %,respectively. The variances became zero (Figure 5B)when the respective gene substitution effects cross thex-axis (Figure 5A).A primary breeding goal of Norwegian dairy goat
population is towards high DM production of milk pergoat and year at least since 1996. Nevertheless, the fre-quency of the deletion in exon12 of CSN1S1 gene hasremained high (0.73, Table 1) despite the negativeeffects of the allele on DM content of the milk and milkquality [19,20,24]. Our results also confirmed that allele1 of SNP14 is associated with significantly reduced pro-tein and fat percentages (Figure 2 and 6).In practice, breeding sire evaluations are based on
their daughters’ performance and therefore use only thegene substitution effect variance [31]. If a gene has anadditive effect only, the gene substitution effect is equal
Table 3 SNP14 additive, dominance effects and dominance to additive ratio for milk production traits.
Traits Effects Degree of dominance [k = d/a] P-valuesA
Additive [a] Dominance [d]
Milk yield (kg) 0.0932 0.2016 2.16 0.0011
Lactose (%) -0.0327 -0.0538 1.65 0.064
Fat (%) -0.2890 -0.1698 0.59 -
Protein (%) -0.1136 -0.0736 0.65 -A P-values are for testing if the difference between d and a is significantly greater than zero.
� � � �
� � � �
� � � �
� � � �
� � � �
�
� � �
� � �
� � �
� � �
� � � � � � � � �
� � � � � � � � � � � �
� � � � � � � ! � " # # $
% �
�
& ' & (
�
�
�
� � � � � � � � �
Figure 5 Gene substitution effect and variance of the SNP14.Gene substitution effects of SNP14 on milk yield in kg, protein %,fat % and lactose %. The effects are plotted against the frequencyof allele 1; the substitution effects are given in kg or % according tothe traits. A) Variances due to SNP14 for milk yield in kg, protein %,fat % and lactose %; the variances are plotted against the frequencyof allele 1 of SNP14
Dagnachew et al. Genetics Selection Evolution 2011, 43:31http://www.gsejournal.org/content/43/1/31
Page 9 of 12
1/1 3/3 6/6 1/3 1/6 3/6
Milk
kg/
day
−0.4
−0.2
0.0
0.2
0.4
***
*
*
1/1 3/3 6/6 1/3 1/6 3/6
Genotypes
Fat %
−0.4
−0.2
0.0
0.2
0.4
0.6
***
***
**
***
1/1 3/3 6/6 1/3 1/6 3/6
Genotypes
Pro
tein
%−0
.2−0
.10.
00.
10.
2
***
***
** ***
***
1/1 3/3 6/6 1/3 1/6 3/6
Lact
ose
%−0
.10
−0.0
50.
000.
050.
10
***
***
Figure 6 Effect of SNP14 genotypes on milk yield in kg, lactose %, fat % and protein %. The bars indicate ± SE, and asterisks indicate asignificant difference from genotype homozygous for the deletion [’1/1’] (***, p < 0.01; **, p < 0.05; *, p < 0.1)
1/1 3/3 6/6 1/3 1/6 3/6
Tast
e sc
ore
−0.4
−0.2
0.0
0.2
0.4
***
***
******
***
1/1 3/3 6/6 1/3 1/6 3/6
Genotypes
log(
FFA
)−0
.4−0
.20.
00.
20.
4
**
***
**
***
1/1 3/3 6/6 1/3 1/6 3/6
Genotypes
log(
SC
C)
−0.4
−0.2
0.0
0.2
0.4
*
Figure 7 Effect of SNP14 genotypes on milk taste, SCC, FFA concentration in milk. The bars indicate ± SE, and asterisks indicate asignificant difference from genotype homozygous for the deletion [’1/1’] (***, p < 0.01; **, p < 0.05; *, p < 0.1)
Dagnachew et al. Genetics Selection Evolution 2011, 43:31http://www.gsejournal.org/content/43/1/31
Page 10 of 12

to the additive effect of the gene. With dominance, thegene substitution effect is no longer equal to the addi-tive effect, but includes a function of the dominanceeffect and the frequency of the gene in the population[30]. Allele 1 of SNP14 has shown a marked dominanceeffect on protein % and fat % (Figure 3) and exhibitsoverdominance for lactose % and milk yield (Table 3).Figure 5A shows that the gene substitution effect (a) ofthe allele is reduced for milk production in kg when theallele frequency increases until 0.74. It also shows thatthe magnitude of the gene substitution effect decreasesfor milk contents when the allele frequency increases.With the current frequency of the allele in the popula-tion, 0.73, the gene substitution effect is almost zero formilk production in kg and close to zero for lactose %and the magnitude of the effect is reduced for protein %and fat %. Similarly, Figure 5B shows that the variancesof the gene substitution effects are reduced at the higherfrequencies of allele 1.Traditional selection based on gene substitution effect
has a low or no pressure on a major gene segregating ina population where the major gene exhibits non-additivevariation and the favorable allele is found at a low fre-quency - as explained by Dodds et al. [39]. In the caseof allele 1 of SNP14, the observed dominance effectsreduce the gene substitution effects and their variances(additive genetic variances available for selection) for thetraits included in the breeding goal. This suggests thatthe selection pressure of conventional breeding on theallele is limited at the current frequency of allele 1. Thiscould be one explanation why the allele frequency hasremained high in spite of the fact that selection is direc-ted against the additive effect of the allele for milkcontent.In this study, single SNP effects are found in separate
models, modelling one SNP at a time. This would be ade-quate if the SNP were independent (in linkage equili-brium). The fact that the four casein genes are foundclustered within 250 kb implies that they have high ten-dency of being in high LD (inherited together as haplo-types). Figure 1 shows a considerable amount of LDamong casein SNP especially at either end of the chromo-some segment containing the casein genes. The result sug-gests that using haplotypes (or multivariate analysistechniques) to account for the observed LD could be ben-eficial in association studies as well as in breeding. More-over, the advantage of using casein haplotypes is that ittakes into account not only casein variants but also otherimportant polymorphisms within the casein cluster region(for a review look at Caroli et al. [8]).
ConclusionsWe have shown that the deletion in exon12 of CSN1S1found in Norwegian dairy goats is significantly associated
with milk quantity and quality, including milk taste. Theallele showed overdominance effects for milk yield in kgand lactose percentage and dominance effects for proteinand fat percentages. The observed non-additive effect ofthe allele with the deletion and its high frequency in thepopulation, 0.73, will reduce the additive genetic var-iances of the locus available for selection. This limits theselection pressure of conventional breeding on the allele.Use of molecular information in the national breedingscheme would help reduce the frequency of the allelewith the deletion in the population (currently, informa-tion about the deletions in exon 9 and exon 12 of CSN1S1 is used for the genetic evaluation).
Additional material
Additional file 1: SNP and genotyping condition. The file containsidentity of 38 SNP used in the study and assay for the genotyping.
Additional file 2: Pairwise linkage disequilibrium (LD) among SNPwithin the four casein loci in Norwegian dairy goats. The filecontains pairwise LD measurements in D’ and r2. The r2 values are usedto generate the graphical representation of LD (Figure 1).
AcknowledgementsThis study is financially supported by the Research Council of Norway (NRF),TINE and Norwegian University of Life Sciences (UMB). The authors gratefullyacknowledge TINE for providing production records and NSG for providingvariance components.
Author details1Department of Animal and Aquacultural Sciences, Norwegian University ofLife Sciences, P.O. Box 5003, N-1432 Ås, Norway. 2Institute of AnimalBreeding and Husbandry, Christian-Albrechts University, 24098 Kiel, Germany.3Center for Integrative Genetics, Norwegian University of Life Sciences, P.O.Box 5003, N-1432 Ås, Norway.
Authors’ contributionsBD carried out the analysis, and drafted the manuscript. GT participated insupervising the study and editing the manuscript. SL was responsible forgenotyping and quality filtering of SNP data and editing the manuscript. TÅorganized and facilitated the research, supervised the study, and finalizedthe manuscript. All authors read and approved the final manuscript.
Competing interestsThe authors declare that they have no competing interests.
Received: 29 November 2010 Accepted: 24 August 2011Published: 24 August 2011
References1. Holt C: The milk salt: Their secretion, concentration and physical
chemistry. In Development in Dairy Chemistry. Volume 2. Edited by: Fox PF.London: Applied Science; 1985:143-181.
2. Martin P, Szymanowska M, Zwierzchowski L, Leroux C: The impact ofgenetic polymorphisms on the protein composition of ruminant milks.Reprod Nutr Dev 2002, 42:433-459.
3. Ng-Kwai-Hang KF, Grosclaude F: Genetic polymorphism of the milkproteins. In Advanced Dairy Chemistry. Volume 1.. 3 edition. Edited by: FoxPF. McSweeney PLH. New York: kluwer Academic/Plenum Publishers;2003:737-814, part B.
4. Caroli AM, Chiatti F, Chessa S, Rignanese D, Bolla P, Pagnacco G: Focusingon the goat casein complex. J Dairy Sci 2006, 89:3178-3187.
Dagnachew et al. Genetics Selection Evolution 2011, 43:31http://www.gsejournal.org/content/43/1/31
Page 11 of 12
5. Martin P, Grosclaude F: Improvement of milk protein quality by genetechnology. Livest Prod Sci 1993, 35:95-115.
6. Moioli B, Pilla F, Tripaldi F: Detection of milk protein geneticpolymorphisms in order to improve dairy traits in sheep and goats: areview. Small Ruminant Res 1998, 27:185-195.
7. Ferretti L, Leone P, Sgaramella V: Long range restriction analysis of thebovine casein genes. Nucleic Acids Res 1990, 18:6829-6833.
8. Caroli AM, Chessa S, Erhardt GJ: Milk protein polymorphisms in cattle:Effect on animal breeding and human nutrition. J Dairy Sci 2009,92:5335-5352.
9. Ramunno L, Cosenza G, Rando A, Illario R, Gallo D, Di Berardino D,Masina P: The goat alpha s1- casein gene: gene structure and promoteranalysis. Gene 2004, 334:105-111.
10. Martin P, Ollivier-Bousquet M, Grosclaude F: Genetic polymorphism ofcaseins: a tool to investigate casein micelle organization. Int Dairy J 1999,9:163-171.
11. Ramunno L, Cosenza G, Rando A, Pauciullo A, Illario R, Gallo D, DiBerardino D, Masina P: Comparative analysis of gene sequence of goatCSN1S1 F and N alleles and characterization of CSN1S1 transcriptvariants in mammary gland. Gene 2005, 345:289-299.
12. Grosclaude F, Martin P: Casein polymorphisms in the goat. Proceedings ofthe International Dairy Federation: February 1997 Palmerston North, NewZealand; 1997, 241-253.
13. Marletta D, Criscione A, Bordonaro S, Guastella AM, D’Urso G: Caseinpolymorphism in goat’s milk. Le Lait 2007, 87:491-504.
14. Chessa S, Budelli E, Chiatti F, Cito AM, Bolla P, Caroli A: ShortCommunication: Predominance of β-Casein (CSN2) C allele in goatbreeds reared in Italy. J Dairy Sci 2005, 88:1878-1881.
15. Neveu C, Mollé D, Moreno J, Martin P, Léonil J: Heterogeneity of caprinebeta-casein elucidated by RP-HPLC/MS: Genetic variants andphosphorylations. J Protein Chem 2003, 21:557-567.
16. Ramunno L, Cosenza G, Pappalardo M, Longobardi E, Gallo D, Pastore N, DiGregorio P, Rando A: Characterization of two new alleles at the goatCSN1S2 locus. Anim Genet 2001, 32:264-268.
17. Caroli AM, Jann O, Budelli E, Bolla P, Jäger S, Erhardt G: Geneticpolymorphism of goat k-casein (CSN3) in different breeds andcharacterization at DNA level. Anim Genet 2001, 32:226-230.
18. Moioli B, D’Andrea M, Pilla F: Candidate genes affecting sheep and goatmilk quality. Small Ruminant Res 2007, 68:179-192.
19. Ådnøy T, Vegarud G, Devold TG, Nordbø R, Colbjørnsen I, Brovold M,Markovic B, Roseth A, Lien S: Effects of the 0- and F- alleles of alpha S1casein in two farms of Northern Norway. Proceedings of the InternationalWorkshop on Major Genes and QTL in Sheep and Goat: December 8-11 2003;Toulouse France: INRA; 2003, CD-ROM communication no. 2-20.
20. Hayes B, Hagesæther N, Ådnøy T, Pellerud G, Berg PR, Lien S: Effects onproduction traits of haplotypes among casein genes in Norwegian goatsand evidence for a site of preferential recombination. Genetics 2006,174:455-464.
21. Chilliard Y, Rouel J, Leroux C: Goat’s alpha-s1 casein genotype influencesits milk fatty acid composition and delta-9 desaturation ratios. AnimalFeed Sci Technol 2006, 131:474-487.
22. Chiatti F, Chessa S, Bolla P, Cigalino G, Caroli AM, Pagnacco G: Effect of κ-casein polymorphism on milk composition in Orobica goat. J Dairy Sci2007, 90:1962-1966.
23. Angulo C, Diaz Carrillo E, Munoz A, Alonso A, Jimenez I, Serradilla JM: Effectof electrophoretic goat’s k-casein polymorphism on milk yield and maincomponents. Proceedings of the 5th World Congress on Genetis Applied toLivestock Production: 7-12 August 1994 Guelph: University of Guelph; 1994,333-336.
24. Vegarud GE, Devold TG, Opheim R, Lødeng E, Svenning C, Abrahamsen RK,Lien S, Langsrud T: Genetic variants of Norwegian goats milkcomposition, micellar size and renneting properties. Int Dairy J 1999,9:367-368.
25. SEQUENOM: SNP Genotyping with MassARRAY. [http://www.sequenom.com/].
26. Barrett JC, Fry B, Maller J, Daly MJ: Haploview: analysis and visualization ofLD and haplotype maps. Bioinformatics 2005, 21:263-265.
27. NCBI Map Viewer: Bos taurus (cattle) genome view. [http://www.ncbi.nlm.nih.gov/projects/mapview/maps.cgi?taxid=9913&chr=6].
28. Tilslutning til Geitkontrollen og middel buskapsstørrelse. [http://medlem.tine.no/trm/tp/page?id=58&key=7667].
29. Nævdal I, Svendsen M: Buck circles for dairy goat breeding in Norway(Cercles des boucs pour l’amélioration génétique des chèvres laitièresen Norvège). In proceedings of the 7th International Conference on Goats:15-21 May 2000; Institut de l’Elevage, Nouzilly, Tours, France. Edited by: Gruner L,Chabert Y. INRA, Paris; 2000:1047.
30. Lynch M, Walsh B: Genetics and Analysis of Quantitative Traits Sunderlands,Massachusetts, USA: Sinauer Associates, Inc.; 1998.
31. Falconer DS: Introduction to Quantitative Genetics. Third edition. Harlow,England: Longman Scientifics & Technical; 1989.
32. Cheverud J: A simple correction for multiple comparisons in intervalmapping genome scans. Heredity 2001, 87:52-58.
33. R:A language and environment for statistical computing. Vienna, Austria:R Foundation for statistical computing;, version 2.2.8 2005.
34. Neveu C, Riaublanc A, Miranda G, CHICHe J-F, Martin P: Is the apocrinemilk secretion process observed in the goat species rooted in theperturbation of the intracellular transport mechanism induced bydefective alleles at the as1-Cn locus? Reprod Nutr Dev 2002, 42:163-172.
35. Chanat E, Leroux C, Martin P, Ollivier-Bousquet M: αS1-caseinpolymorphism in goat: perturbation of the intracellular transport of milkproteins. In Proceedings of the Symposium on milk synthesis, secretion andremoval in ruminants: 26-27 April 1996; University of Berne, Switzerland Editedby: Blum JW, Bruckmaier RM 1996, 31.
36. Caravaca F, Carrizosa J, Urrutia B, Baena F, Jordana J, Amills M, Badaoui B,Sánchez A, Angiolillo A, Serradilla JM: Effect of αS1-casein (CSN1S1) and κ-casein (CSN3) genotypes on milk composition in Murciano-Granadinagoats. J Dairy Sci 2009, 92:2960-2964.
37. Haenlein GFW: Goat milk in human nutrition. Small Ruminant Res 2004,51:155-163.
38. Zan M, Stibilj V, Rogelj I: Milk fatty acid composition of goats grazing onalpine pasture. Small Ruminant Res 2006, 64:45-52.
39. Dodds KG, McEwan JC, Davis GH: Integration of molecular andquantitative information in sheep and goat industry breedingprogrammes. Small Ruminant Res 2007, 70:32-41.
doi:10.1186/1297-9686-43-31Cite this article as: Dagnachew et al.: Casein SNP in Norwegian goats:additive and dominance effects on milk composition and quality.Genetics Selection Evolution 2011 43:31.
Submit your next manuscript to BioMed Centraland take full advantage of:
• Convenient online submission
• Thorough peer review
• No space constraints or color figure charges
• Immediate publication on acceptance
• Inclusion in PubMed, CAS, Scopus and Google Scholar
• Research which is freely available for redistribution
Submit your manuscript at www.biomedcentral.com/submit
Dagnachew et al. Genetics Selection Evolution 2011, 43:31http://www.gsejournal.org/content/43/1/31
Page 12 of 12


![Sheep Milk, Sheep Cheese · Use milk higher in casein and fat Increase casein retention Increase fat retention How to improve cheese yield? [RF (%fat in milk) + RC (% casein in milk)]](https://static.fdocuments.us/doc/165x107/5ec5e9bced3a6867603dc67a/sheep-milk-sheep-cheese-use-milk-higher-in-casein-and-fat-increase-casein-retention.jpg)