Case Study: Using the AoH Report for a Preliminary Look at Glacier National Park Trista Glazier...
16
Case Study: Case Study: Using the AoH Report for Using the AoH Report for a Preliminary Look at a Preliminary Look at Glacier National Park Glacier National Park Trista Glazier Trista Glazier March 2005 March 2005 WRAP WRAP Implementation Implementation Workgroup Workgroup Meeting Meeting San Francisco, San Francisco,
-
Upload
cuthbert-smith -
Category
Documents
-
view
217 -
download
1
Transcript of Case Study: Using the AoH Report for a Preliminary Look at Glacier National Park Trista Glazier...
Case Study: Case Study: Using the AoH Report for a Using the AoH Report for a
Preliminary Look at Preliminary Look at Glacier National ParkGlacier National Park
Trista Glazier Trista Glazier
March 2005March 2005
WRAP WRAP Implementation Implementation
Workgroup MeetingWorkgroup Meeting
San Francisco, CASan Francisco, CA
OverviewOverview
• Expectations for AoHExpectations for AoH
• Glacier National ParkGlacier National Park
• Phase II RecommendationsPhase II Recommendations
• ConclusionConclusion

AOH Report:
AlmostOver MyHead
•What’s Causing the Haze
•Who’s Causing the Haze from a Geographic Perspective (because it certainly couldn’t be Montana’s fault)
•Who’s Causing the Haze from a Source Perspective

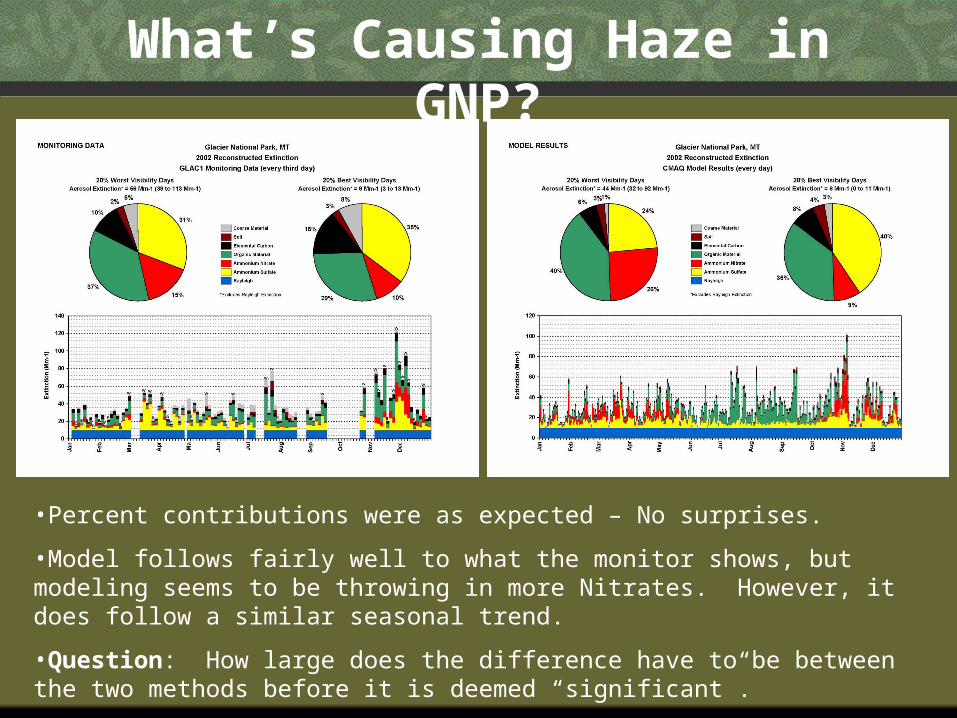
•Percent contributions were as expected – No surprises.
•Model follows fairly well to what the monitor shows, but modeling seems to be throwing in more Nitrates. However, it does follow a similar seasonal trend.
•Question: How large does the difference have to be between the two methods before it is deemed “significant”.
What’s Causing Haze in GNP?
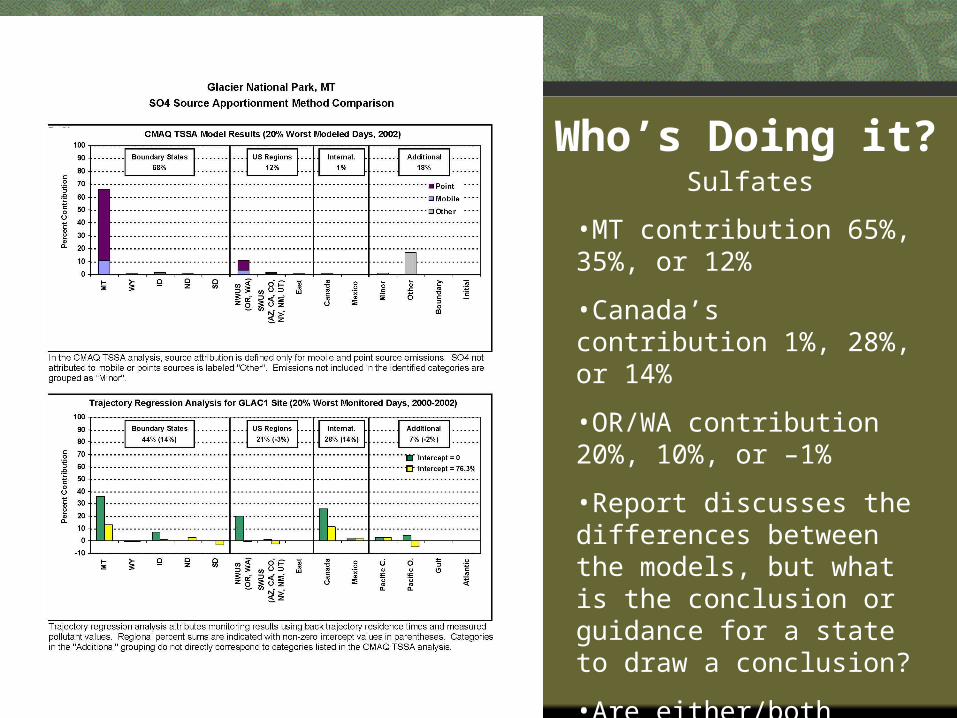
Who’s Doing it?
•MT contribution 65%, 35%, or 12%
•Canada’s contribution 1%, 28%, or 14%
•OR/WA contribution 20%, 10%, or –1%
•Report discusses the differences between the models, but what is the conclusion or guidance for a state to draw a conclusion?
•Are either/both models defensible to stakeholders?
Sulfates

•Nitrates are mostly from Mobile Sources and are coming from outside the state.
•Question: Best way to explain “other”?
Nitrates


Regional SO2 Emissions

Regional NOx Emissions
Conclusions for Glacier National Park
•Organic material is responsible for most of the haze, however, a significant amount is caused by both sulfates and nitrates and control of both point and mobile sources may be required to meet visibility goals.
•Canadian sources may become an obstacle to meeting goals.
•Looking for sources to control is premature at this time. Mandatory controls should be assessed first.

•Is there a way to eliminate known fire events from the 20% Worst Days to better assess where the man-made sources of haze are coming from?
•More in depth look at Organic Materials contribution – is there more to it than just fire?
•Map of major sources plotted on Emission Inventory Maps
Ideas for Phase II

Conclusion
• Montana believes defensibility of products to be a high priority before taking steps toward deciding on control strategies.
•AoH report is highly useful tool to be used in conjunction with additional modeling and inventory work – conclusions cannot be drawn on results of AoH report alone
•Results from modeling the effects of Federal Programs, Smoke Management Programs, and application of BART will better define what the next steps are
•Attribution to specific sources or source categories may be required in the future (especially for Eastern Montana sites).