Case Study "Using Real Time Clinical Data To Support Patient Risk Stratification in The Clinical...
27
Using Real Time Clinical Data To Support Patient Risk Stratification in The Clinical Care Setting May 20, 2015 IHT2 Health IT Summit in Boston
-
Upload
health-it-conference-iht2 -
Category
Education
-
view
23 -
download
0
Transcript of Case Study "Using Real Time Clinical Data To Support Patient Risk Stratification in The Clinical...

Using Real Time Clinical Data To
Support Patient Risk Stratification
in The Clinical Care Setting
May 20, 2015
IHT2 Health IT Summit in Boston

Speaker
Devore Culver
Executive Director & CEO,
HealthInfoNet

Presentation Outline
Background
Analytic and Reporting Service
Case Study: Population Management – ED
Utilization
Adoption and Feedback
Q&A

Background
• HealthInfoNet operates the Maine health information
exchange HIE, and is an independent, nonprofit organization.
• Since 2009, HealthInfoNet’s system combines information
from separate health care sites to create a single electronic
patient health record.
• Patient health information is automatically uploaded from a
provider’s electronic medical record system.
• The information is standardized and aggregated across
care sites.
• HealthInfoNet automates reporting of certain illnesses and
conditions like Lyme disease or food poisoning, to public
health experts at the Maine CDC.

What’s in the HIE system?
• Patient Identifier and Demographics
• Encounter History
• Laboratory and Microbiology Results
• Vital signs
• Radiology Reports
• Adverse Reactions/Allergies
• Medication History
• Diagnosis/Conditions/Problems (primary and secondary)
• Immunizations
• Dictated/Transcribed Documents
• Continuity of Care Documents (CCD)
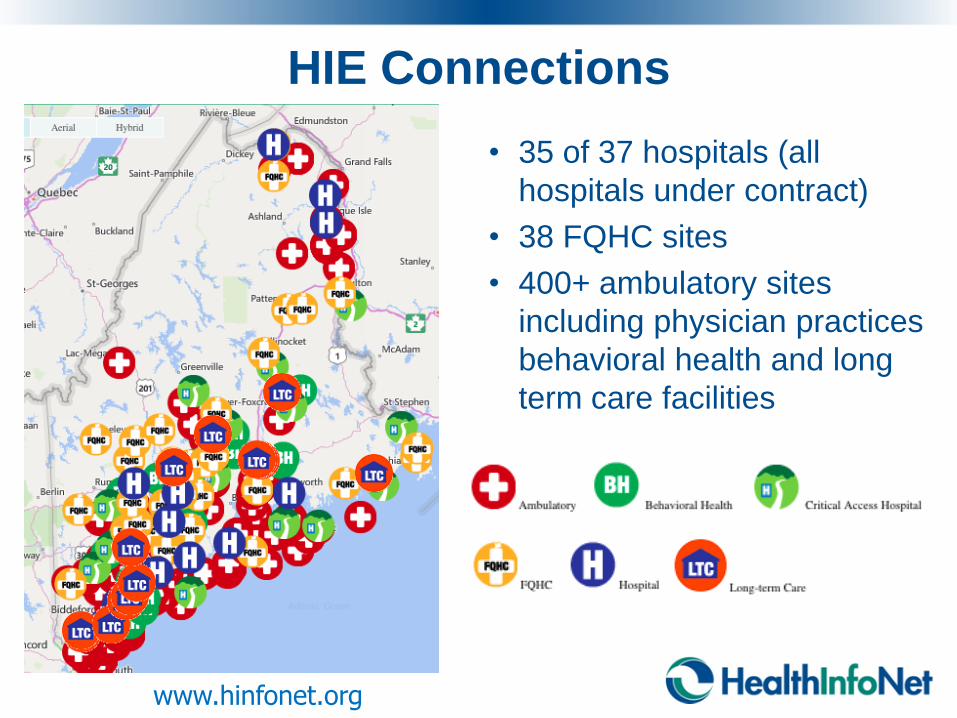
• 35 of 37 hospitals (all
hospitals under contract)
• 38 FQHC sites
• 400+ ambulatory sites
including physician practices
behavioral health and long
term care facilities
HIE Connections
www.hinfonet.org

Most recent HIE Usage Stats http://www.hinfonet.org/products-services/product-use-statistics
7

Reporting & Analytics Next generation of HIE
• Available to HIE bi-directional (sharing data) clients.
• Helps providers drive quality and cost improvements, manage risk and
population health, and inform operational decision making.
• Uses real-time HIE clinical data to predict utilization, disease and mortality.
• Offered in partnership with HBI Solutions (www.hbisolutions.com)

Benefits: Improved Quality
• Better target care for patients with chronic disease to
prevent complications and hospitalizations.
• Identify your patients most at risk for future utilization
and help them avoid unnecessary ER and hospital visits,
tests and procedures.
• Use real time data to identify quality measure gaps to put
performance improvement plans in place quicker.

Benefits: Lower Costs
• Determine if market share targets for key service lines
are met.
• Better identify services lines that are not hitting key
performance measures.
• Prevent unnecessary visits for high cost and repeat
services.
• Lower out of pocket costs for patients
• Avoid penalties for readmissions and repeat tests and
procedures.
• Identify and reduce higher than expected hospital
lengths of stay.

Reporting and Analytics Modules
• Population Risk: Identify populations and individuals most at risk
for future high costs, inpatient admissions, and emergency room
visits.
• 30-Day Readmission / Return Risk: Identify inpatient encounters
most at risk for 30-day readmissions or 30 day ED revisits.
• Variation Management: Understand resource variation by disease
and cost category (length of stay, laboratory, radiology, etc...) to
reduce unnecessary practice variation.
• Hospital Performance: Compare actual to target performance for
key performance indicators (KPI) using case mix and severity
adjusted targets, including statewide norms.
• Volume and Market Share: Track and trend volumes and market
share by service area, disease, payer and patient demographics.

Analytic Platform: Solution Road Map
Available Today
• Population health application
o Utilization monitoring and trending
o Disease prevalence
o Risk of emergency visit, risk of inpatient admission, cost risk
o Risk of diabetes, stroke, AMI, and mortality
o Risk of 30 day readmission, risk of 30 day ED return
• Variation management application
• Performance benchmarking application
• Market share and patient origin application
• Natural language processing integration
Available in the Future
• Claims data integration – Medicaid population
• New risk models – Hypertension, CHF, Coronary Artery Disease, COPD

Market Share
13
This chart shows the hospital market share performance for Orthopedic Surgery patients residing in Penobscot County
Hospital 1
Hospital 2
Each bubble represents a
hospital. The larger the bubble
the greater the market share.

Market Share Trending
14
Hospital 1
Hospital 2
This trends show market share performance over time for the top 2 hospitals for Orthopedic Surgery patients residing in
Penobscot County

Hospital KPI Performance
15
This dashboard shows performance for key measures compared to an all-hospital target. Performance against target is
assessed over time. This organization has performed better than target over the last 6 months for readmission
management
Hospital 1

Case Study:
Population
Management: ED
Utilization
Copyright 2015, HBI Solutions, Inc.

Case Study:
Population Management: ED Utilization
Copyright 2015, HBI Solutions, Inc.
On the Population Utilization Risk landing page, the user views and understands the latest
risk profile for their patients, including the number of patients at each risk level. This helps
the user understand the best allocation of care management resources to at risk patients.

Copyright 2015, HBI Solutions, Inc.
User views and gains insight on the distribution
of future ED visit risk; decides to focus on the
highest risk patients – those patients with a risk
score (probability) greater than 40 - 40% or
more likely to visit and ED in the future 12
months.
Case Study:
Population Management: ED Utilization

Copyright 2015, HBI Solutions, Inc.
To view individual patients at high risk for a
future ED visit, user selects appropriate criteria
in patient list filters.
Case Study:
Population Management: ED Utilization

Copyright 2015, HBI Solutions, Inc.
Selecting a patient from the patient list, user can see the risk and visit history of the
patient. In this instance, the patient’s ED risk (red line) has risen significantly over
the last 3 months.
Case Study:
Population Management: ED Utilization

Copyright 2015, HBI Solutions, Inc.
Selecting a patient from the patient list, user we can see the list of chronic diseases,
and medications.
Case Study:
Population Management: ED Utilization

Copyright 2015, HBI Solutions, Inc.
Selecting a patient from the patient list, users can view interventions for specific
patient risks including polypharmacy, chronic diseases, and emergency and
inpatient utilization.
Case Study:
Population Management: ED Utilization
Copyright 2015, HBI Solutions, Inc.
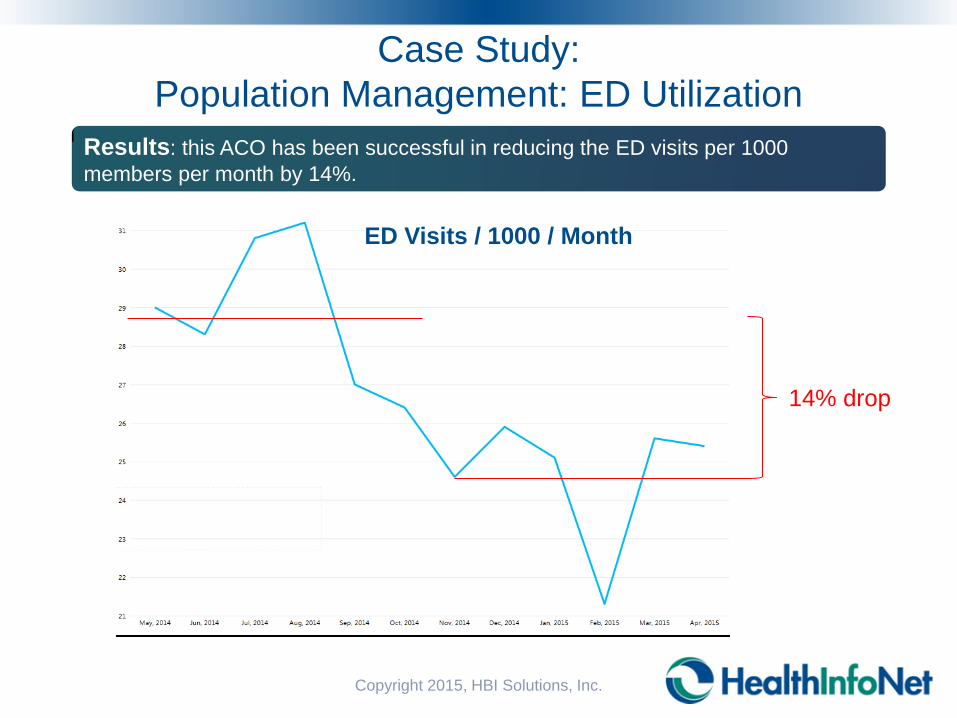
Results: this ACO has been successful in reducing the ED visits per 1000
members per month by 14%.
Case Study:
Population Management: ED Utilization
ED Visits / 1000 / Month
14% drop

“In today’s health care market, everyone is working hard to
reduce costs. Historically making cost predictions based on risk
meant turning to outdated claims data. HealthInfoNet’s
analytics tool couples 837 claims data with real-time clinical
data. This allows us to negotiate with payers, using data more
current that what they’re using.”
Feedback from Users
“The greatest barrier to managing patients at high risk for
readmission is identifying them quickly. It’s easy to capture the
patients that we know need a lot of help. My goal was to reach
those patients that are doing OK but might be getting into
trouble. Nurse care managers are a limited resource and we
have to use our time wisely. Using HealthInfoNet’s analytics
tool, I can focus my time on the patients most at risk.”
Jessica Taylor, RN, St. Joseph Healthcare
William Wood, MD, St. Joseph Healthcare

Analytic Platform: Current Adoption
• General Acute Care Hospitals
– Budgeting and volume forecasting
– Throughput management - high risk ED patients / over utilizers
– 30-day readmission management
• ACO – Pioneer CMS, State Employees, Commercial
– Population management – risk stratification and proactive care management
• Medical Group with Insurance Product
– Population management – risk stratification and proactive care management

Early Assessment of Impact
• Subjective Findings
– Analytic findings are believable
– Outperforms existing manual risk assessment tools
– Risk trending over set time frames very powerful
– Near real time data access fills huge patient management needs
– Clinical and encounter data can generate reliable predictive analytics
• Empirical Findings (now in process)
– Impact on resource consumption (ED Visits, Inpatient Admissions,
Readmissions
– Clinical Performance (decline in population risk)

Discussion/Questions Devore Culver
Executive Director & CEO, HealthInfoNet
www.hinfonet.org