CASE STUDY: TOYS “R” US1 - accid.org · CASE STUDY: TOYS “R” US1 1. ... the Babies“R”Us...
20
1 CASE STUDY: TOYS “R” US 1 1. INTRODUCTION Toys“R”Us is an American company dedicated to the toys retail since 1948. It is a well-known firm which has obtained reputation through the years. It focuses on meeting the needs of its customers and on offering a Customer Experience which gives the firm a competitive advantage. It also has a wide geographical diversification and product diversification. Currently, it’s going through a complex situation, since it filed for bankruptcy in September 2017. 2. HISTORY OF TOYS “R” US Charles P. Lazarus was the founder of Toys “R” Us (the actual second bigger toys retailer in terms of sales). His father had a bicycle shop and Charles dreamed to own a store by himself one day. After coming back from World War II, Lazarus, influenced by his uncle who had a baby furniture business, opened a baby furniture store: Children’s Bargain Town, in Washington D.C. in 1948. Two years later, he added some toys he sold along with the baby furniture. By that time, he had realized the difference between toys and furniture: toys broke and became old-fashioned with children. Because of this, parents had to visit more often the store, so the toys business was more lucrative. Customer demand for toys grew and Lazarus opted for including a wider range of toys in his stores. In the late 1950s, a big change in the structure of Lazarus business would take place. He decided to restructure his business following a supermarket store (given the success self-service grocery supermarkets had experienced). He started offering a larger assortment of toys and allowed customers to serve themselves and use carts to shop. In 1957, Lazarus opened his first store which was only focused on toys: Toys “R” Us. 1 Case written by Neus Bock, Núria Mallorquí, Laura Navarrete, Rosó Soler. With the supervision of Professor Oriol Amat. Universitat Pompeu Fabra, 2018.
Transcript of CASE STUDY: TOYS “R” US1 - accid.org · CASE STUDY: TOYS “R” US1 1. ... the Babies“R”Us...

1
CASE STUDY: TOYS “R” US1
1. INTRODUCTION
Toys“R”Us is an American company dedicated to the toys retail since 1948. It is a well-known firm
which has obtained reputation through the years. It focuses on meeting the needs of its customers
and on offering a Customer Experience which gives the firm a competitive advantage. It also has a
wide geographical diversification and product diversification. Currently, it’s going through a
complex situation, since it filed for bankruptcy in September 2017.
2. HISTORY OF TOYS “R” US
Charles P. Lazarus was the founder of Toys “R” Us (the actual second bigger toys retailer in terms
of sales). His father had a bicycle shop and Charles dreamed to own a store by himself one day.
After coming back from World War II, Lazarus, influenced by his uncle who had a baby furniture
business, opened a baby furniture store: Children’s Bargain Town, in Washington D.C. in 1948.
Two years later, he added some toys he sold along with the baby furniture. By that time, he had
realized the difference between toys and furniture: toys broke and became old-fashioned with
children. Because of this, parents had to visit more often the store, so the toys business was more
lucrative. Customer demand for toys grew and Lazarus opted for including a wider range of toys in
his stores.
In the late 1950s, a big change in the structure of Lazarus business would take place. He decided to
restructure his business following a supermarket store (given the success self-service grocery
supermarkets had experienced). He started offering a larger assortment of toys and allowed
customers to serve themselves and use carts to shop. In 1957, Lazarus opened his first store which
was only focused on toys: Toys “R” Us.
1 Case written by Neus Bock, Núria Mallorquí, Laura Navarrete, Rosó Soler. With the supervision of Professor Oriol
Amat. Universitat Pompeu Fabra, 2018.

2
1948 Inauguration of the first store: Children’s Bargain Town, a baby furniture store
1952 Lazarus opens the first Baby Furniture and Toy supermarket
1957 Foundation of Toys”R”Us ®
1966 Company sold to Interstate Stores Inc
1974 Interstate Stores Inc goes bankrupt
1978 Name’s company is changed to Toys”R”Us Inc
Lazarus becomes the president and CEO
It starts being listed in the New York Stock Exchange
1984 First international stores: in Canada and Singapore
1992 After rising some money in 1985, “Toys “R” Us Children’s Fund” is created to
improve conditions of children in precarious conditions.
1994 Lazarus leaves the position of Chairman and CEO, but his ideals will still be followed
by the company
1996 Babies”R”Us is launched and Toys”R”Us first website is created
1997 Toys”R”Us buys Imaginarium and signs a partnership deal with Amazon to manage its
online sales.
2000 John Eyler becomes the President and Chief Executive Officer
2001 Center of the Toy Universe is opened in New York City’s Times Square
2003 Kids”R”Us closes (opened in 1983), even though the company keeps selling products
using the brand
2005 Toys”R”Us leaves the stock market exchange and becomes a private company: Bain
Capital Partners llc, Kohlberg Kravis Roberts&Co and Vornado Reality Trust acquire
Toys”R”Us for $6.6 billion
2006 Gerald Storch is appointed the Chairman and Chief Executive Officer
3
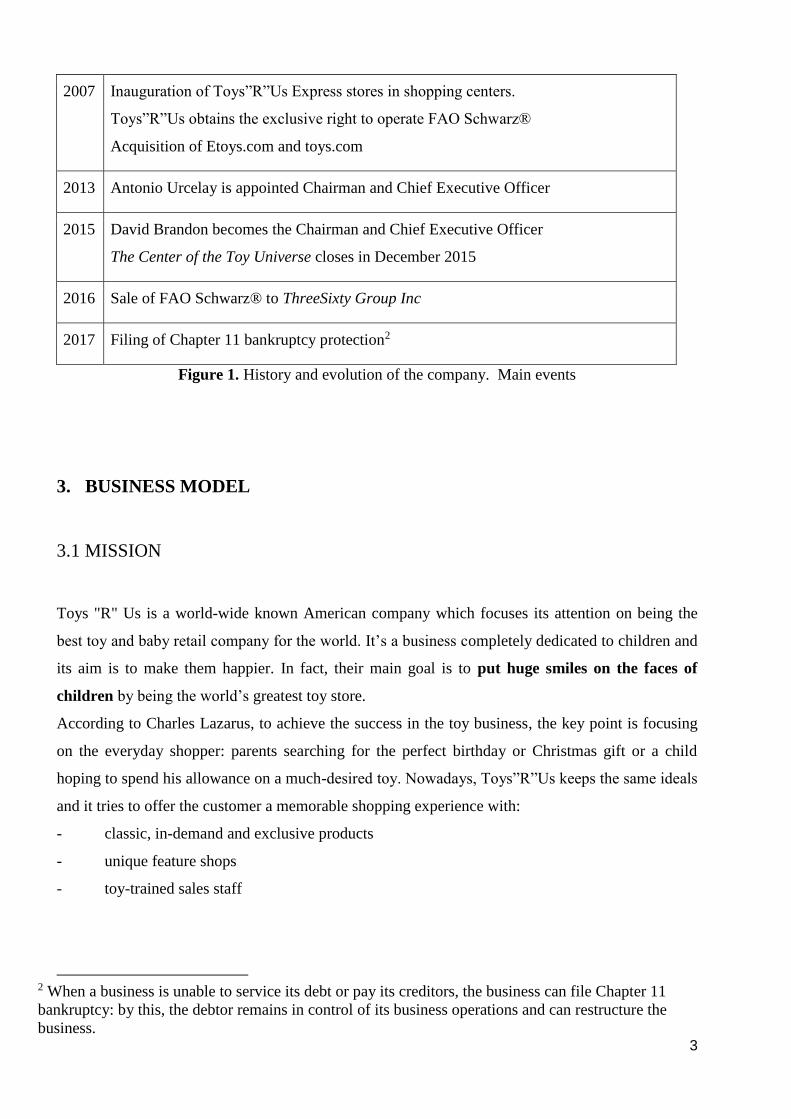
2007 Inauguration of Toys”R”Us Express stores in shopping centers.
Toys”R”Us obtains the exclusive right to operate FAO Schwarz®
Acquisition of Etoys.com and toys.com
2013 Antonio Urcelay is appointed Chairman and Chief Executive Officer
2015 David Brandon becomes the Chairman and Chief Executive Officer
The Center of the Toy Universe closes in December 2015
2016 Sale of FAO Schwarz® to ThreeSixty Group Inc
2017 Filing of Chapter 11 bankruptcy protection2
Figure 1. History and evolution of the company. Main events
3. BUSINESS MODEL
3.1 MISSION
Toys "R" Us is a world-wide known American company which focuses its attention on being the
best toy and baby retail company for the world. It’s a business completely dedicated to children and
its aim is to make them happier. In fact, their main goal is to put huge smiles on the faces of
children by being the world’s greatest toy store.
According to Charles Lazarus, to achieve the success in the toy business, the key point is focusing
on the everyday shopper: parents searching for the perfect birthday or Christmas gift or a child
hoping to spend his allowance on a much-desired toy. Nowadays, Toys”R”Us keeps the same ideals
and it tries to offer the customer a memorable shopping experience with:
- classic, in-demand and exclusive products
- unique feature shops
- toy-trained sales staff
2 When a business is unable to service its debt or pay its creditors, the business can file Chapter 11
bankruptcy: by this, the debtor remains in control of its business operations and can restructure the
business.

4
3.2 DISTINCTIVE FACTORS
Its target market includes children from all ages, but also the parents of these children, since they
are the ones that eventually buy the toys.
It’s important to highlight their educational commitment by providing a learning experience to
children through playing. For this reason, they offer a wide-range of educational toys to promote
learning and creativity.
They also focus on the shopping experience. They offer to the customer a good and different
experience since the first moment he or she gets into the store.
There is an increasing importance in product safety which is essential for the company. For this
reason, high product safety standards have been set, which even exceed USA requirements.
As far as Corporate Social Responsibility is concerned, Toys “R” US has a social and
environmental commitment:
- Social commitment: Toys”R”Us feels it has a global responsibility. Because of this, it
follows different initiatives in order to generate a positive impact to society. During its daily
activity, it asks for integrity to their team members, executives and suppliers. Among their
initiatives, a few examples are described as follows:
• Disaster Aid and Response: In 2005, after the hurricane Katrina, Toys"R"Us donated six
trucks full of toys and baby supplies including diapers, wipes, and formula.
• Charitable giving: Over the past three decades, Toys”R”Us has given more than $100
million in product donations to children’s charities. Furthermore, the Toys “R” Us Children’s
Fund Inc. (public charity affiliated with the Company), has donated more than $130 million to
children’s charities such as: Marine Toys, Make-A-Wish America, Special Olympics, St. Jude
Children’s Research Hospital and Save the Children.
- Environmental commitment: the company is implementing clean energy and efficient
energy projects. The Rooftop solar project: On 2010, a rooftop solar power system was installed at
the Babies“R”Us in North Brunswick. It was their first store to use solar energy. It provided around
the 67% of the electricity needed for the store. On 2011, Toys"R"Us announced their plans to cover
70% of the roof of its distribution center (in Flanders, New Jersey) with a solar installation - the
largest rooftop solar installation in North America.

5
3.3 CORPORATE GOVERNANCE
Toys "R" Us, Inc. is a private corporation since 2005, the year in which it went out of the stock
market after being bought by Bain Capital Partners llc, Kohlberg Kravis Roberts&Co and Vornado
Reality Trust.
The shares of common stock are privately held by the Sponsors3, their officers, certain current and
former employees and a private investor. On 2017, there were around 300 holders of the Common
Stock.
Investment funds or groups affiliated with the Sponsors currently control Toys”R”Us through their
ownership of 98% of their voting common stock. For this reason, the Sponsors have control over
their decisions on corporate transaction and have the ability to prevent any transaction that requires
the approval of stockholders. That’s why, the Sponsors have the capacity to strongly influence the
company’s decisions.
Board of Directors: David A. Brandon is the current Chairman and Chief Executive Officer. He
has deep experience in growing businesses and developing talent which enable organizations to
create and capture value. Before coming to Toys”R”Us, he worked for well-known companies. He
was, for instance, the Chairman and Chief Executive Officer of Domino’s Pizza: he led the
company to profit growth and managed to successfully complete the largest initial public offering in
restaurant history.
3.4 STRATEGY
With the arrival of Mr. Brandon in Toys”R”Us, together with new employees and the previously
existing management team, four strategic growth initiatives have been set:
● Make talent and culture a competitive advantage: create a culture of high performance,
responsiveness and agility in Toys“R”Us.
● Grow and build the Toys“R”Us and Babies“R”Us Brands throughout the world: invest in
the existing stores and e-commerce platforms and continue to grow their brands globally.
3 We refer as “Sponsors” to the investment group advised by or affiliated with Bain Capital Private Equity, L.P.,
Kohlberg Kravis Roberts & Co. L.P., and Vornado Realty Trust that acquired Toys”R”Us on 2005.

6
● Create a world class experience for their customers: keep on innovating and leading in their
market, attending to their customers with the highest quality service.
● Have a solid financial basis
3.5 COMPOSITION
Toys“R”Us retailer store is composed by Toys"R"Us and Babies"R"Us. Altogether these stores sell
merchandise at around 1,600 stores at the time of writing, including more than 800 international
stores and 200 international licensed stores.
● Toys”R”Us: focused on the selling of toys for children.
● Babies”R”Us: the baby product retailer. It offers a broad selection of baby products, toys
and other gifts for all the needs of parents, parents-to-be and their family.
Toys”R”Us employs 64.000 full-time and part-time individuals worldwide. As for the suppliers, the
firm gets its merchandise from a wide range of domestic and international vendors (over 3.600).
However, their top 20 vendors worldwide represent 43% of the total products they purchase.
Nowadays, there are many different types of Toys”R”Us stores. Some of them keep the traditional
supermarket model format: it allows customers to pick up the products they want to buy and pay
them at the register area. On the other hand, in 2006, Integrated stores model, in which we find the
Toys”R”Us and the Babies”R”Us stores all combined in one store.
3.6 SEGMENTATION OF PRODUCTS
Toys “R” us offers a wide range of products apart from the conventional toys.
- Baby: focused on serving newborns and children up to four years of age. Products from
baby gear, to furniture and room décor among others.
- Core Toy: toys for children such as action figures, dolls accessories, role play toys and
vehicles
- Entertainment: video game software, tablet computers, electronics and other related
products
- Learning: educational electronics and developmental toys, such as “Imaginarium” products
in the United States and “World of Imagination” products at International locations. Includes
construction toys, games, creative activities, pre-school merchandise.
- Seasonal: toys and other products geared toward holidays and summer activities, as well as
bikes, sporting goods, play sets and other outdoor products.
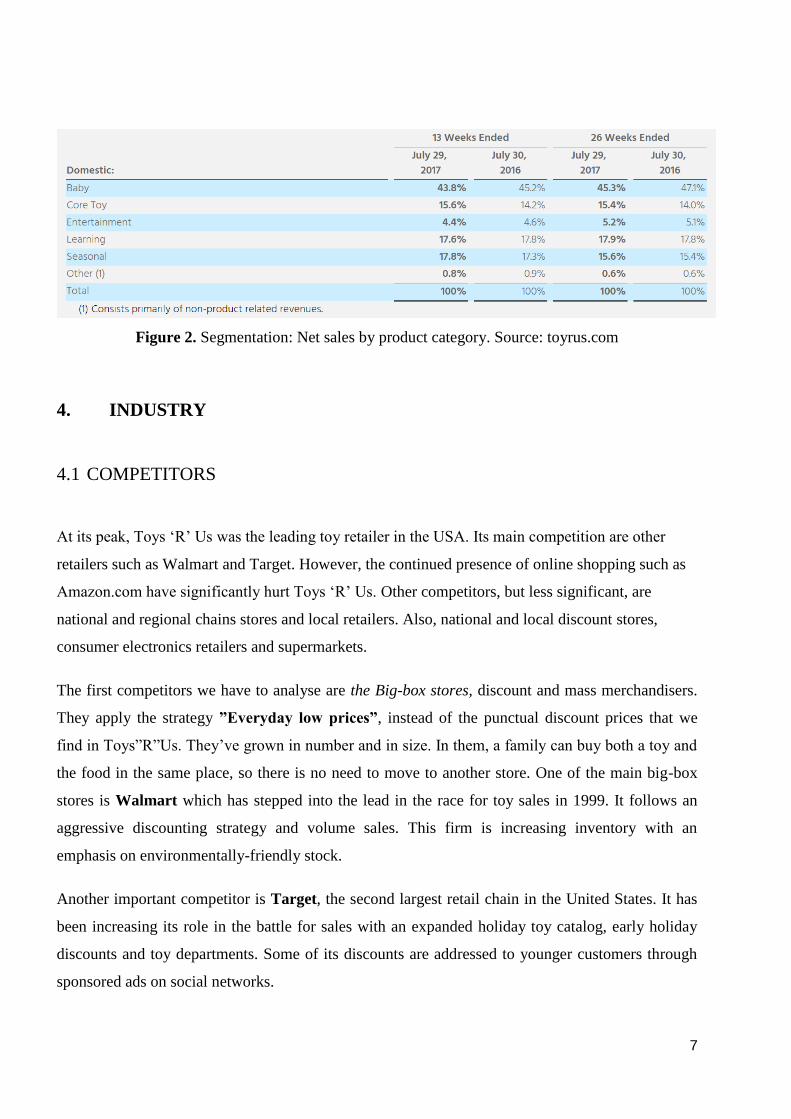
7
Figure 2. Segmentation: Net sales by product category. Source: toyrus.com
4. INDUSTRY
4.1 COMPETITORS
At its peak, Toys ‘R’ Us was the leading toy retailer in the USA. Its main competition are other
retailers such as Walmart and Target. However, the continued presence of online shopping such as
Amazon.com have significantly hurt Toys ‘R’ Us. Other competitors, but less significant, are
national and regional chains stores and local retailers. Also, national and local discount stores,
consumer electronics retailers and supermarkets.
The first competitors we have to analyse are the Big-box stores, discount and mass merchandisers.
They apply the strategy ”Everyday low prices”, instead of the punctual discount prices that we
find in Toys”R”Us. They’ve grown in number and in size. In them, a family can buy both a toy and
the food in the same place, so there is no need to move to another store. One of the main big-box
stores is Walmart which has stepped into the lead in the race for toy sales in 1999. It follows an
aggressive discounting strategy and volume sales. This firm is increasing inventory with an
emphasis on environmentally-friendly stock.
Another important competitor is Target, the second largest retail chain in the United States. It has
been increasing its role in the battle for sales with an expanded holiday toy catalog, early holiday
discounts and toy departments. Some of its discounts are addressed to younger customers through
sponsored ads on social networks.

8
Another sector of competitors is coming from the E-commerce. We have to bear in mind that toys
are an item suitable for online shopping because there’s no need in observing it directly (as opposed
to fruit, for instance). Therefore, it’s understandable that the growing size of online companies is
affecting negatively the sales of Toys”R”Us. Amazon, for example, is the largest seller of toy and
baby products online in the US. Toys“R”Us is the third behind Walmart and Target when
considering all US sales (both online and not). And Toys”R”Us is also the third, behind Amazon
and Walmart when considering only online sales, as we can see in Figure 3.
Figure 3. Online Sales of Toys and Baby Products in the US
Source: http://www.businessinsider.com/walmart-amazon-beat-toys-r-us-online-sales-2017-9
4.2 SWOT ANALYSIS OF THE RETAIL INDUSTRY
Strengths
Financially strong: the retail industry has easy access to capital and bank loans.
Working capital: this industry can benefit from the fact that it receives the money from its clients
usually before the firm has to pay to its suppliers.
Weaknesses
Seasonality: The industry highly depends on Christmas’ sales which makes the industry vulnerable
in case there is a reduction on consumption during this period due to external factors such as strikes,
attacks, political changes, etc.
9
Dependence to consumer spending patterns: the industry is adversely affected by factors
reducing the consumer spending such as the consumer confidence, employment level, availability of
credit, recessions, etc.
Fluctuations in consumer preferences: products must attract consumers whose preferences
change according to fashion trends and seasons. That fact sometimes affects the stock since some
purchases are made in advance of the holiday season when the preferences are not still evidenced.
Differentiation in the toys market is difficult. Because of this, competitors can only compete in
terms of prices, availability and range of products.
Opportunities
Digital strategy: going digital will enable the firms to sell online but also to improve their
interaction with consumers and their customers’ experience (search and browse products and
conduct transactions through the internet).
Better economic conditions: getting out of the crisis means higher consumer spending.
Threats
Rate of birth: a decrease in the birth rates that affects negatively the toy industry where the main
goods are destined to kids and babies.
Highly competitive: the retail industry has been affected by the growth of the e-commerce and
other competitors since there are not barriers of entries. As a consequence, there has been an
increase in a battle for prices and promotional discounts, weaker margins, etc.
Change in toy demand: children are, every time, plus attracted to technological devices, instead of
traditional toys.
5. SPECIAL ISSUES
5.1. FROM A LISTED COMPANY IN THE STOCK EXCHANGE TO A PRIVATE
COMPANY. CONSEQUENCES OF THE ACQUISITION OF TOYS “R” US
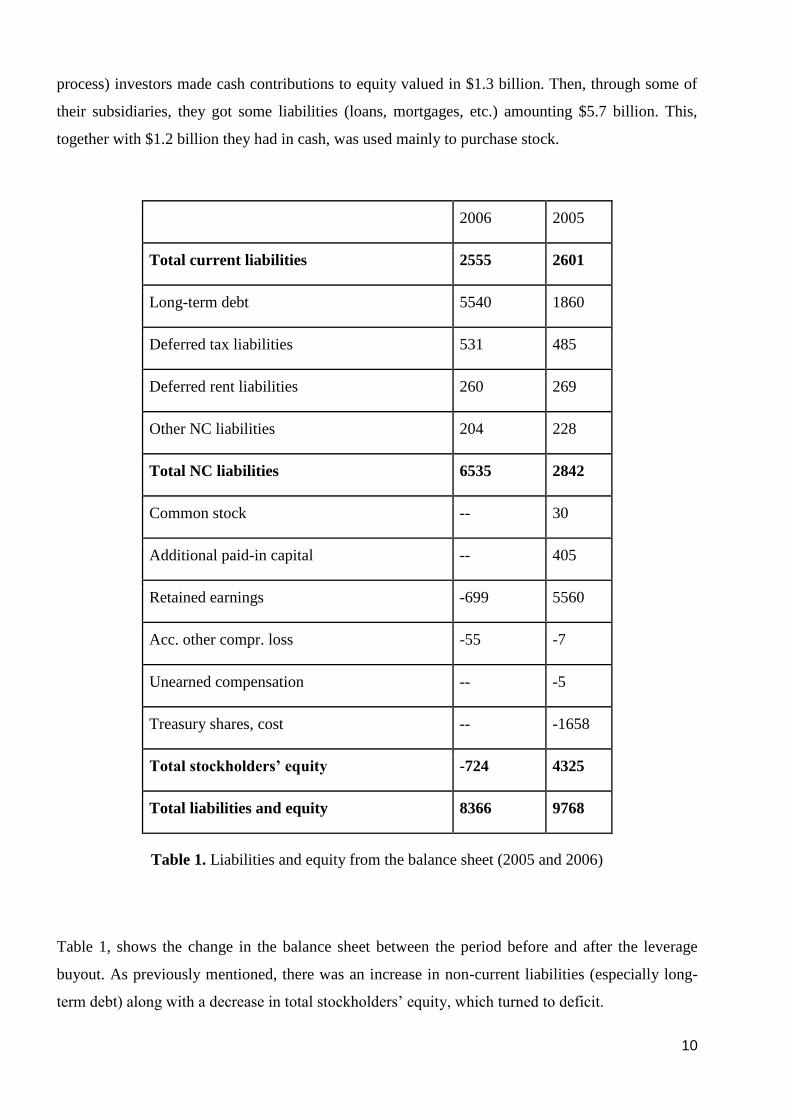
In 2005, the company left the stock exchange and it was bought by KKR & Co. LP, Bain Capital
and Vornado Realty Trust investors. It was a $6.6 billion leveraged buyout4, and it caused a
substantial increase in debt. During “The Merger” (term used by the company to refer to this
4 Leverage buyout: is the acquisition of another company using a significant amount of borrowed money. It is used to
make acquisitions without having to commit a lot of capital.
10
process) investors made cash contributions to equity valued in $1.3 billion. Then, through some of
their subsidiaries, they got some liabilities (loans, mortgages, etc.) amounting $5.7 billion. This,
together with $1.2 billion they had in cash, was used mainly to purchase stock.
2006 2005
Total current liabilities 2555 2601
Long-term debt 5540 1860
Deferred tax liabilities 531 485
Deferred rent liabilities 260 269
Other NC liabilities 204 228
Total NC liabilities 6535 2842
Common stock -- 30
Additional paid-in capital -- 405
Retained earnings -699 5560
Acc. other compr. loss -55 -7
Unearned compensation -- -5
Treasury shares, cost -- -1658
Total stockholders’ equity -724 4325
Total liabilities and equity 8366 9768
Table 1. Liabilities and equity from the balance sheet (2005 and 2006)
Table 1, shows the change in the balance sheet between the period before and after the leverage
buyout. As previously mentioned, there was an increase in non-current liabilities (especially long-
term debt) along with a decrease in total stockholders’ equity, which turned to deficit.

11
The increase in long-term liabilities provoked high indebtedness: it affects the situation of the
company adding difficulties to increase debt, limiting the flexibility of the company -there are
underlying covenants-, exposing it to higher interest rates and causing possible non-strategic
divestitures.
Ratio 2005 2006
Current assets/ Current liabilities 1.694 1.139
Equity/assets 0.443 -0.092
Net profit/ assets 0.026 -0.049
Net profit/ equity=ROE 0.058 -0.530
Table 2. Some solvency ratios for 2005 and 2006
Observed in Table 2 is the capacity to pay debts which decreased substantially between the period
of 2005 and 2006.
The problem which arose with that situation was that if this high volume of long-terms debts were
not liquidated through the following years or, at least, resources to pay in the long term were not
being created, the firm could have liquidity problems in the long-term. When in the future, long
term debt had to turn into current term debt, the weight of debt over assets could be huge. This fact
is crucial to understand the current situation of bankruptcy of the company, as well as its future
performance.
5.2 BANKRUPTCY
On September 18, 2017, Toys”R”Us, Inc. filed for Chapter 11 bankruptcy protection. Brandon, the
CEO of the company, stated the shops would carry on operating as usual and that this
reorganization would be just the beginning of a new brilliant era.
At the time of writing, Toys “R” Us has filed a contract with the law firm “Kirkland & Ellis” in
order to restructure its $400 million debt. Optimists claim that Christmas holidays will boost sales
so that the situation might become more favourable. Thus, the 1.600 Toys”'R”Us and Babies”R”Us

12
stores, which are spread out all over the world, continue to operate. Indeed, the company's
operations outside of the U.S. and Canada are not a part of the protection proceedings.
Nowadays, Toys “R” Us carries approximately $5 billion in debt, much of which finds its roots in
the leveraged buyout of 2005. The firm faced no imminent debt maturities until now. The delay of
dealing with the indebtedness has been exhausted, as more than $400 million in debt is due to
mature in 2018.
Once the firm realized that it could not secure financing to get through the holiday Christmas
season, it decided to file for Bankruptcy. Toys “R” Us owners are now finding ways to restructure
its $5 billion debt by reaching terms with its debt holders and other creditors. In addition, filing for
bankruptcy has allowed the company to secure financing to continue to operate its stores.
13
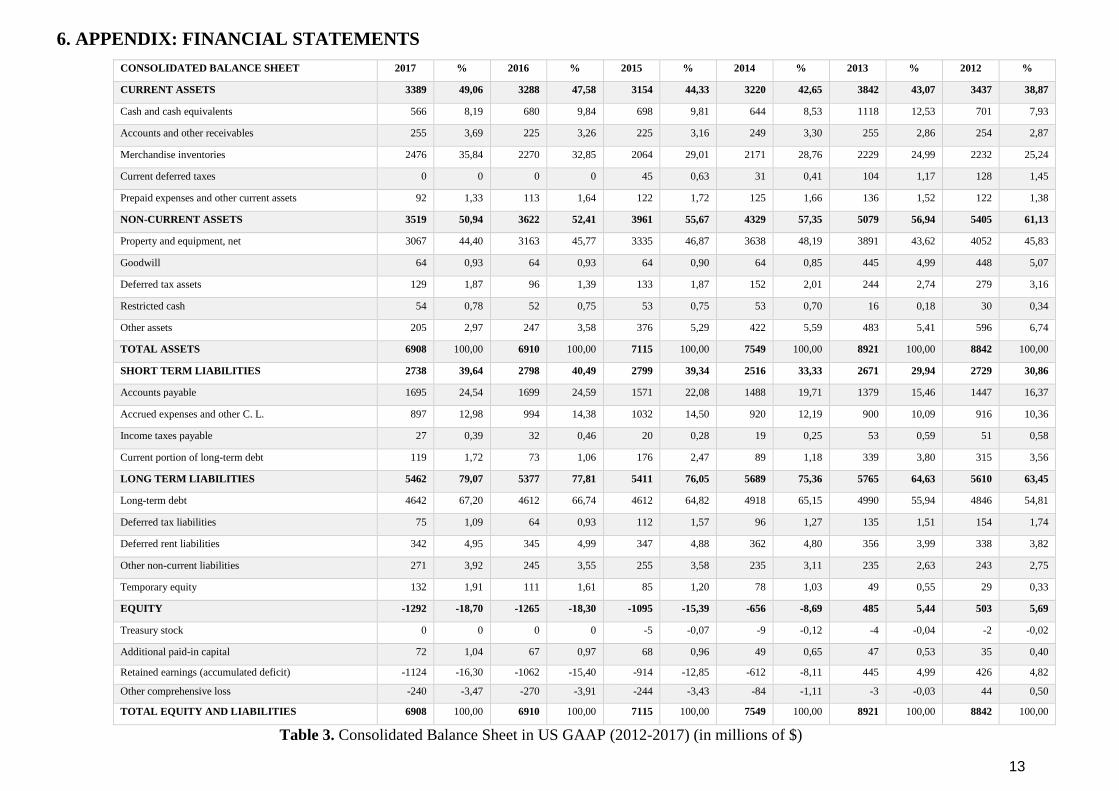
6. APPENDIX: FINANCIAL STATEMENTS
CONSOLIDATED BALANCE SHEET 2017 % 2016 % 2015 % 2014 % 2013 % 2012 %
CURRENT ASSETS 3389 49,06 3288 47,58 3154 44,33 3220 42,65 3842 43,07 3437 38,87
Cash and cash equivalents 566 8,19 680 9,84 698 9,81 644 8,53 1118 12,53 701 7,93
Accounts and other receivables 255 3,69 225 3,26 225 3,16 249 3,30 255 2,86 254 2,87
Merchandise inventories 2476 35,84 2270 32,85 2064 29,01 2171 28,76 2229 24,99 2232 25,24
Current deferred taxes 0 0 0 0 45 0,63 31 0,41 104 1,17 128 1,45
Prepaid expenses and other current assets 92 1,33 113 1,64 122 1,72 125 1,66 136 1,52 122 1,38
NON-CURRENT ASSETS 3519 50,94 3622 52,41 3961 55,67 4329 57,35 5079 56,94 5405 61,13
Property and equipment, net 3067 44,40 3163 45,77 3335 46,87 3638 48,19 3891 43,62 4052 45,83
Goodwill 64 0,93 64 0,93 64 0,90 64 0,85 445 4,99 448 5,07
Deferred tax assets 129 1,87 96 1,39 133 1,87 152 2,01 244 2,74 279 3,16
Restricted cash 54 0,78 52 0,75 53 0,75 53 0,70 16 0,18 30 0,34
Other assets 205 2,97 247 3,58 376 5,29 422 5,59 483 5,41 596 6,74
TOTAL ASSETS 6908 100,00 6910 100,00 7115 100,00 7549 100,00 8921 100,00 8842 100,00
SHORT TERM LIABILITIES 2738 39,64 2798 40,49 2799 39,34 2516 33,33 2671 29,94 2729 30,86
Accounts payable 1695 24,54 1699 24,59 1571 22,08 1488 19,71 1379 15,46 1447 16,37
Accrued expenses and other C. L. 897 12,98 994 14,38 1032 14,50 920 12,19 900 10,09 916 10,36
Income taxes payable 27 0,39 32 0,46 20 0,28 19 0,25 53 0,59 51 0,58
Current portion of long-term debt 119 1,72 73 1,06 176 2,47 89 1,18 339 3,80 315 3,56
LONG TERM LIABILITIES 5462 79,07 5377 77,81 5411 76,05 5689 75,36 5765 64,63 5610 63,45
Long-term debt 4642 67,20 4612 66,74 4612 64,82 4918 65,15 4990 55,94 4846 54,81
Deferred tax liabilities 75 1,09 64 0,93 112 1,57 96 1,27 135 1,51 154 1,74
Deferred rent liabilities 342 4,95 345 4,99 347 4,88 362 4,80 356 3,99 338 3,82
Other non-current liabilities 271 3,92 245 3,55 255 3,58 235 3,11 235 2,63 243 2,75
Temporary equity 132 1,91 111 1,61 85 1,20 78 1,03 49 0,55 29 0,33
EQUITY -1292 -18,70 -1265 -18,30 -1095 -15,39 -656 -8,69 485 5,44 503 5,69
Treasury stock 0 0 0 0 -5 -0,07 -9 -0,12 -4 -0,04 -2 -0,02
Additional paid-in capital 72 1,04 67 0,97 68 0,96 49 0,65 47 0,53 35 0,40
Retained earnings (accumulated deficit) -1124 -16,30 -1062 -15,40 -914 -12,85 -612 -8,11 445 4,99 426 4,82
Other comprehensive loss -240 -3,47 -270 -3,91 -244 -3,43 -84 -1,11 -3 -0,03 44 0,50
TOTAL EQUITY AND LIABILITIES 6908 100,00 6910 100,00 7115 100,00 7549 100,00 8921 100,00 8842 100,00
Table 3. Consolidated Balance Sheet in US GAAP (2012-2017) (in millions of $)
14
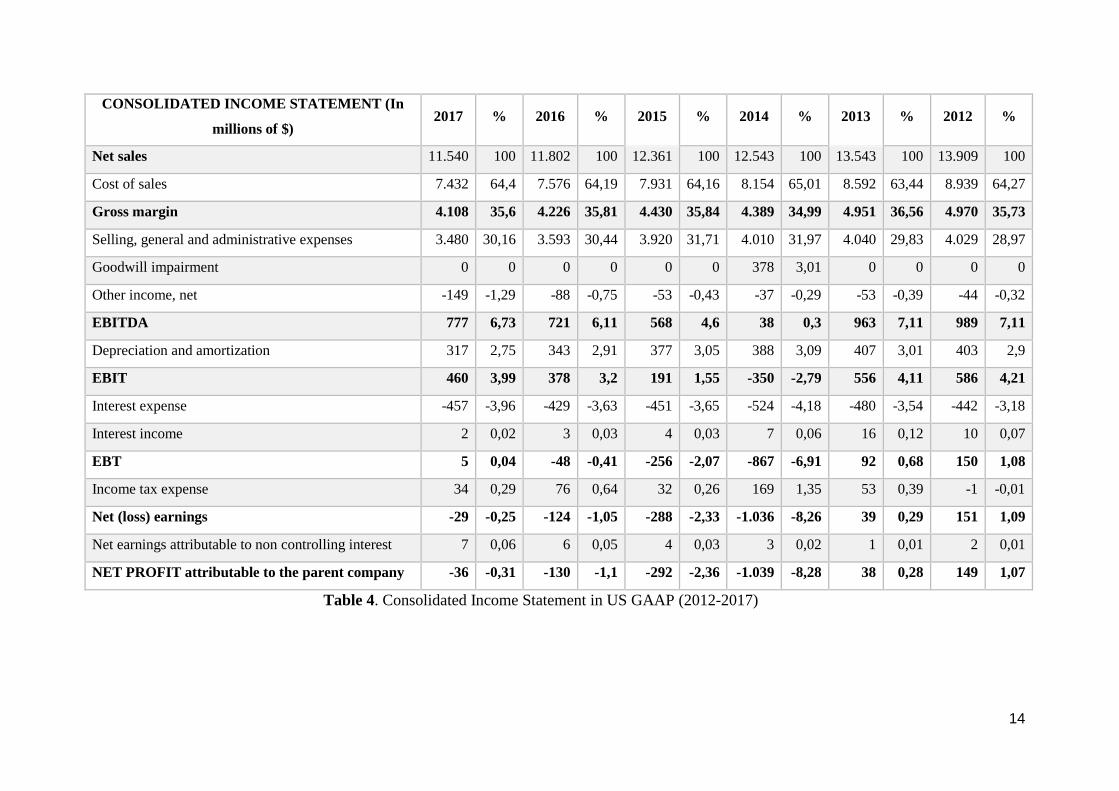
CONSOLIDATED INCOME STATEMENT (In
millions of $) 2017 % 2016 % 2015 % 2014 % 2013 % 2012 %
Net sales 11.540 100 11.802 100 12.361 100 12.543 100 13.543 100 13.909 100
Cost of sales 7.432 64,4 7.576 64,19 7.931 64,16 8.154 65,01 8.592 63,44 8.939 64,27
Gross margin 4.108 35,6 4.226 35,81 4.430 35,84 4.389 34,99 4.951 36,56 4.970 35,73
Selling, general and administrative expenses 3.480 30,16 3.593 30,44 3.920 31,71 4.010 31,97 4.040 29,83 4.029 28,97
Goodwill impairment 0 0 0 0 0 0 378 3,01 0 0 0 0
Other income, net -149 -1,29 -88 -0,75 -53 -0,43 -37 -0,29 -53 -0,39 -44 -0,32
EBITDA 777 6,73 721 6,11 568 4,6 38 0,3 963 7,11 989 7,11
Depreciation and amortization 317 2,75 343 2,91 377 3,05 388 3,09 407 3,01 403 2,9
EBIT 460 3,99 378 3,2 191 1,55 -350 -2,79 556 4,11 586 4,21
Interest expense -457 -3,96 -429 -3,63 -451 -3,65 -524 -4,18 -480 -3,54 -442 -3,18
Interest income 2 0,02 3 0,03 4 0,03 7 0,06 16 0,12 10 0,07
EBT 5 0,04 -48 -0,41 -256 -2,07 -867 -6,91 92 0,68 150 1,08
Income tax expense 34 0,29 76 0,64 32 0,26 169 1,35 53 0,39 -1 -0,01
Net (loss) earnings -29 -0,25 -124 -1,05 -288 -2,33 -1.036 -8,26 39 0,29 151 1,09
Net earnings attributable to non controlling interest 7 0,06 6 0,05 4 0,03 3 0,02 1 0,01 2 0,01
NET PROFIT attributable to the parent company -36 -0,31 -130 -1,1 -292 -2,36 -1.039 -8,28 38 0,28 149 1,07
Table 4. Consolidated Income Statement in US GAAP (2012-2017)
15
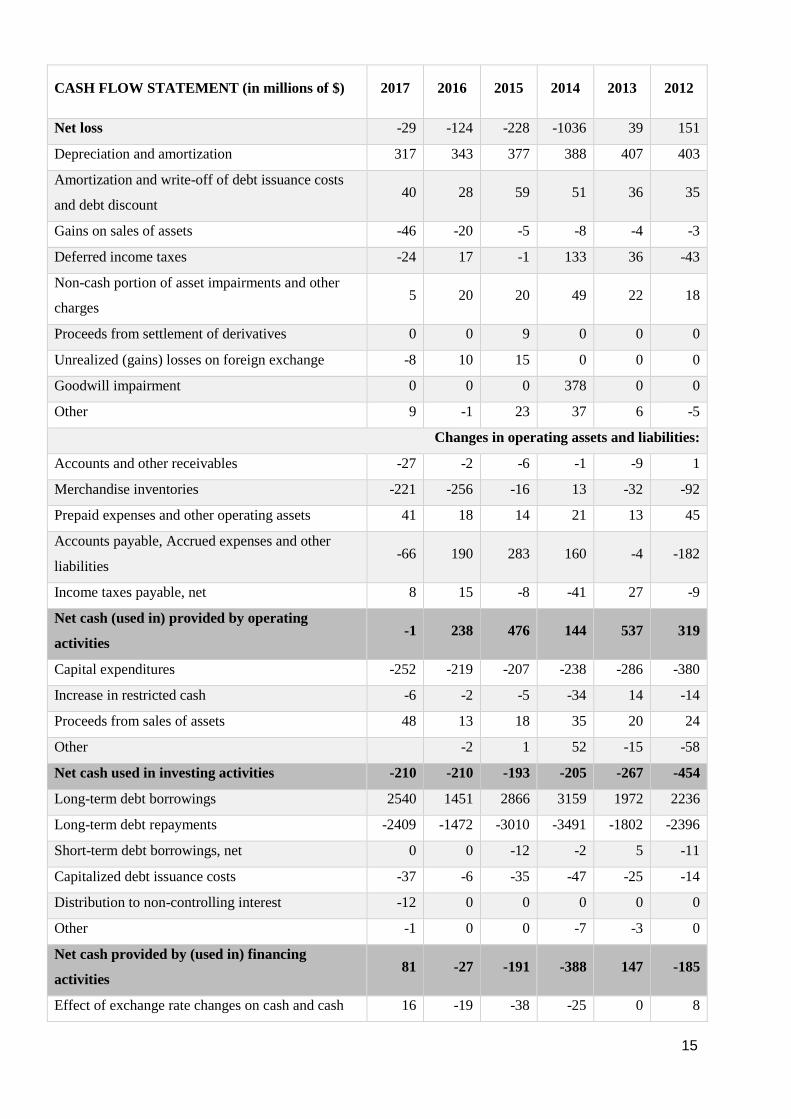
CASH FLOW STATEMENT (in millions of $) 2017 2016 2015 2014 2013 2012
Net loss -29 -124 -228 -1036 39 151
Depreciation and amortization 317 343 377 388 407 403
Amortization and write-off of debt issuance costs
and debt discount 40 28 59 51 36 35
Gains on sales of assets -46 -20 -5 -8 -4 -3
Deferred income taxes -24 17 -1 133 36 -43
Non-cash portion of asset impairments and other
charges 5 20 20 49 22 18
Proceeds from settlement of derivatives 0 0 9 0 0 0
Unrealized (gains) losses on foreign exchange -8 10 15 0 0 0
Goodwill impairment 0 0 0 378 0 0
Other 9 -1 23 37 6 -5
Changes in operating assets and liabilities:
Accounts and other receivables -27 -2 -6 -1 -9 1
Merchandise inventories -221 -256 -16 13 -32 -92
Prepaid expenses and other operating assets 41 18 14 21 13 45
Accounts payable, Accrued expenses and other
liabilities -66 190 283 160 -4 -182
Income taxes payable, net 8 15 -8 -41 27 -9
Net cash (used in) provided by operating
activities -1 238 476 144 537 319
Capital expenditures -252 -219 -207 -238 -286 -380
Increase in restricted cash -6 -2 -5 -34 14 -14
Proceeds from sales of assets 48 13 18 35 20 24
Other -2 1 52 -15 -58
Net cash used in investing activities -210 -210 -193 -205 -267 -454
Long-term debt borrowings 2540 1451 2866 3159 1972 2236
Long-term debt repayments -2409 -1472 -3010 -3491 -1802 -2396
Short-term debt borrowings, net 0 0 -12 -2 5 -11
Capitalized debt issuance costs -37 -6 -35 -47 -25 -14
Distribution to non-controlling interest -12 0 0 0 0 0
Other -1 0 0 -7 -3 0
Net cash provided by (used in) financing
activities 81 -27 -191 -388 147 -185
Effect of exchange rate changes on cash and cash 16 -19 -38 -25 0 8

16
equivalents
Net increase during period -114 -18 54 -474 417 -312
Cash and cash equivalents at beginning of period 680 698 644 1118 701 1013
Cash and cash equivalents at end of period 566 680 698 644 1118 701
Table 5. Consolidated Cash Flow Statement in US GAAP (2012-2017)

17
RATIOS 2017 2016 2015 2014 2013 2012
LIQUIDITY RATIOS
Current ratio Current assets / Current liabilities 1,24 1,18 1,13 1,28 1,44 1,26
Liquidity ratio (Current assets – Inventories) / Current liabilities 0,3 0,32 0,33 0,36 0,51 0,35
Acid test Cash / Current liabilities 0,21 0,24 0,25 0,26 0,42 0,26
DEBT RATIOS
Indebtedness Liabilities / Assets 1,19 1,18 1,15 1,09 0,95 0,94
Quality of debt Current liabilities / Liabilities 0,334 0,342 0,341 0,307 0,317 0,327
Repayment
capacity
Cash flow / Loans 0,122 0,147 0,151 0,131 0,224 0,145
Cost of debt Financial expenses / Loans 0,098 0,093 0,098 0,107 0,096 0,091
Financial expenses Financial expenses / Sales 0,040 0,036 0,036 0,042 0,035 0,032
ASSETS MANAGEMENT
NCA turnover Sales / Non current assets 3,279 3,258 3,121 2,897 2,666 2,573
CA turnover Sales / Current assets 3,405 3,589 3,919 3,895 3,525 4,047
Inventory turnover COGS (cost of good sold) / Inventories 3,002 3,337 3,843 3,756 3,855 4,005
Inventory terms Inventory / Daily cost of sales 121,60 109,36 94,99 97,18 94,69 91,14
TERMS
Days receivable Customers / Daily cost of sales 8,07 6,96 6,64 7,25 6,87 6,67
Days payable Suppliers / Daily cost of sales 83,25 81,86 72,30 66,61 58,58 59,08
RETURN ON EQUITY
Margin EBIT / Sales 0,039 0,032 0,015 -0,028 0,041 0,042
Turnover Sales / Assets 1,671 1,708 1,737 1,662 1,518 1,573
Financial leverage Assets / Equity * EBT / EBIT -0,058 0,694 8,709 -28,51 3,044 4,500
Fiscal effect Net profit /EBT -7,2 -2,71 -1,140 -1,198 0,413 0,993
ROE Net profit / Equity -0,028 -0,103 -0,266 -1,583 0,078 0,296
RETURN ON INVESTMENTS
ROI EBIT / Assets 0,067 0,055 0,027 -0,046 0,062 0,066
Table 6. Ratios (2012-2017)

18
RATIOS
COMPETITORS 2017 2016 2015 2014
COMPANIES
To
ysr
us
Wal
mar
t
Tar
get
Am
azo
n
To
ysr
us
Wal
mar
t
Tar
get
Am
azo
n
To
ysr
us
Wal
mar
t
Tar
get
Am
azo
n
To
ysr
us
Wal
mar
t
Tar
get
Am
azo
n
LIQ
UID
ITY
Current ratio 1,24 0,86 0,94 1,04 1,18 0,93 1,12 1,05 1,13 0,97 1,16 1,12 1,28 0,88 0,91 1,07
Liquidity ratio 0,30 0,19 0,20 0,63 0,32 0,22 0,32 0,64 0,33 0,24 0,19 0,72 0,36 0,20 0,05 0,58
Acid test 0,21 0,10 0,20 0,44 0,24 0,13 0,32 0,47 0,25 0,14 0,19 0,52 0,26 0,11 0,05 0,38
DE
BT
Indebtedness 1,17 0,61 0,71 0,77 1,17 0,60 0,68 0,79 1,14 0,60 0,66 0,80 1,08 0,63 0,64 0,76
Quality of debt 0,34 0,55 0,48 0,68 0,35 0,54 0,46 0,66 0,34 0,53 0,43 0,64 0,31 0,54 0,45 0,76
Repayment capacity 0,12 0,52 0,39 1,36 0,15 0,48 0,44 0,83 0,15 0,51 0,04 0,55 0,13 0,44 0,32 1,11
Cost of debt 0,10 0,05 0,08 0,06 0,09 0,05 0,05 0,06 0,10 0,05 0,07 0,03 0,11 0,04 0,08 0,04
Financial expenses 0,04 0,00 0,01 0,00 0,04 0,01 0,01 0,00 0,04 0,01 0,01 0,00 0,04 0,00 0,01 0,00
A.
MA
NA
G
E.
NCA turnover 3,28 3,44 2,73 3,61 3,26 3,46 2,82 3,68 3,12 3,46 2,64 3,84 2,90 3,32 2,16 4,79
CA turnover 3,41 8,42 5,80 2,97 3,59 8,00 5,22 3,00 3,92 7,67 5,33 2,84 3,90 7,78 6,16 3,02
Inventory turnover 3,00 8,39 5,88 7,70 3,34 8,12 6,05 7,00 3,84 8,09 6,19 7,56 3,76 7,98 6,04 7,31
Inventory terms 121,6 43,49 62,06 47,39 109,4 44,96 60,38 52,18 94,99 45,13 58,95 48,27 97,18 45,73 60,38 49,93
TE
RM
Days receivable 8,07 4,38 0,00 22,38 6,96 4,26 0,00 19,29 6,64 5,09 0,00 23,02 7,25 5,12 0,00 23,37
Days payable 83,25 63,66 82,07 161,5 81,86 59,27 81,81 156,7 72,30 58,57 82,16 152,8 66,61 58,28 79,84 147,0
RO
E
Margin 0,04 0,05 0,07 0,03 0,03 0,05 0,07 0,02 0,02 0,06 0,06 0,00 -0,03 0,06 0,07 0,01
Turnover 1,67 2,44 1,86 1,63 1,71 2,42 1,83 1,65 1,74 2,39 1,76 1,63 1,66 2,33 1,60 1,85
Financial leverage -0,06 2,29 2,73 3,85 0,69 2,22 2,77 3,74 8,71 2,27 2,37 -5,69 -28,5 2,46 2,19 3,22
Fiscal effect -7,54 0,67 0,69 0,61 -1,67 0,68 0,68 0,38 -0,37 0,66 -0,45 2,17 0,20 0,65 0,48 0,54
R O I EBIT/A 0,067 0,11 0,13 0,05 0,055 0,12 0,14 0,03 0,027 0,13 0,11 0,002 -0,05 0,13 0,11 0,02
Table 7. Comparison of the ratios with competitors (2014-2017)
19
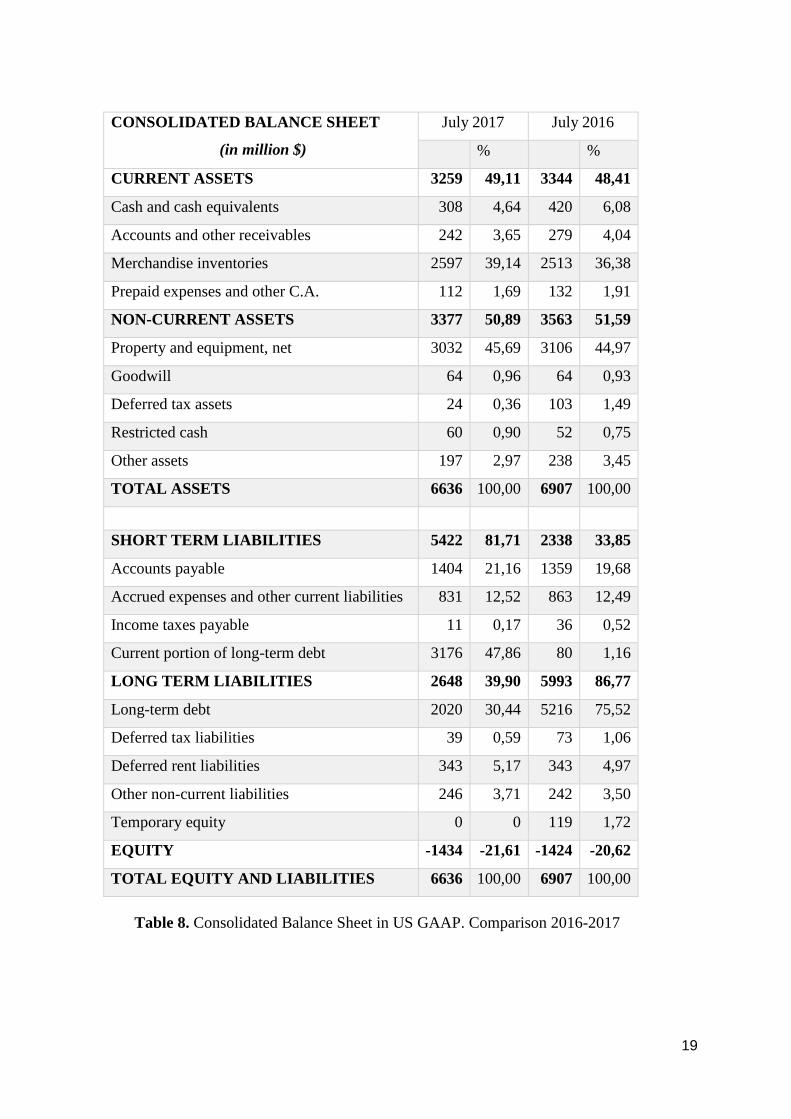
CONSOLIDATED BALANCE SHEET
(in million $)
July 2017 July 2016
% %
CURRENT ASSETS 3259 49,11 3344 48,41
Cash and cash equivalents 308 4,64 420 6,08
Accounts and other receivables 242 3,65 279 4,04
Merchandise inventories 2597 39,14 2513 36,38
Prepaid expenses and other C.A. 112 1,69 132 1,91
NON-CURRENT ASSETS 3377 50,89 3563 51,59
Property and equipment, net 3032 45,69 3106 44,97
Goodwill 64 0,96 64 0,93
Deferred tax assets 24 0,36 103 1,49
Restricted cash 60 0,90 52 0,75
Other assets 197 2,97 238 3,45
TOTAL ASSETS 6636 100,00 6907 100,00
SHORT TERM LIABILITIES 5422 81,71 2338 33,85
Accounts payable 1404 21,16 1359 19,68
Accrued expenses and other current liabilities 831 12,52 863 12,49
Income taxes payable 11 0,17 36 0,52
Current portion of long-term debt 3176 47,86 80 1,16
LONG TERM LIABILITIES 2648 39,90 5993 86,77
Long-term debt 2020 30,44 5216 75,52
Deferred tax liabilities 39 0,59 73 1,06
Deferred rent liabilities 343 5,17 343 4,97
Other non-current liabilities 246 3,71 242 3,50
Temporary equity 0 0 119 1,72
EQUITY -1434 -21,61 -1424 -20,62
TOTAL EQUITY AND LIABILITIES 6636 100,00 6907 100,00
Table 8. Consolidated Balance Sheet in US GAAP. Comparison 2016-2017
20
7. QUESTIONS:
You are asked to prepare the following:
1. Prepare a qualitative analysis of Toys“R”Us including the main strengths and weaknesses.
2. Analyse the balance sheet, income statement and cash flow statement from 2017 to 2012 in
order to identify the main financial strengths and weaknesses of Toys“R”Us.
3. Calculate the working capital of Toys”R”Us and the working capital needed in order to
analyse their financing necessities.
4. Does Toys“R”Us have capacity to grow?
5. Calculate the Z score from 2003 to 2017. Could they have foreseen the insolvency of the
company? In 2005, would you have recommended the investor to buy Toys”R”US with debt?
6. Analyse the ratios of Toys“R”Us and compare them to the ratios of the main competitors.
7. Prepare the Cause & Effect Diagram
8. Given the Balance Sheet of July 2017, analyse the causes that drove Toys”R”US towards
bankruptcy. And give an opinion on the forecast of the company.
9. What measures would you recommend the company to apply so as to improve their
performance? Demonstrate their effectiveness.