CASE STUDY STATUS REPORT DANUBE RIVER BASIN, · Case Study Status Report Danube River Basin...
50
Case Study Status Report Danube River Basin (Deliverable D25) 1 CASE STUDY STATUS REPORT DANUBE RIVER BASIN, (Deliverable D25) The Neajlov Catchment, Romanian Department of Systems Ecology and Sustainability - University of Bucharest Vienna, Austrian Institute of Advanced Studies (Klagenfurt) and Department of Economics (Klagenfurt University), Klagenfurt. May, 2007.
Transcript of CASE STUDY STATUS REPORT DANUBE RIVER BASIN, · Case Study Status Report Danube River Basin...
Case Study Status Report Danube River Basin (Deliverable D25)
1
CASE STUDY STATUS REPORT
DANUBE RIVER BASIN,
(Deliverable D25)
The Neajlov Catchment, Romanian Department of Systems Ecology and Sustainability - University
of Bucharest
Vienna, Austrian Institute of Advanced Studies (Klagenfurt) and Department of
Economics (Klagenfurt University), Klagenfurt.
May, 2007.

Case Study Status Report Danube River Basin (Deliverable D25)
2
Case Study Status Report Danube River Basin (Deliverable D25)
3
CASE STUDY STATUS REPORT
DANUBE RIVER BASIN,
(Deliverable D25)
1. The Neajlov Catchment, Romanian
Department of Systems Ecology and Sustainability - University
of Bucharest
Angheluta Vadineanu, Carmen Postolache, Georgia Cosor, Teodora Palarie, Costel Negrei, Magdalena Bucur.
Case Study Status Report Danube River Basin (Deliverable D25)
4
Department of Systems Ecology and Sustainability - University of Bucharest
CASE STUDY REPORT
The Neajlov Catchment (Romania)
Angheluta Vadineanu, Carmen Postolache, Georgia Cosor, Teodora Palarie, Costel Negrei, Magdalena Bucur. 1. General characteristics 1.1. Location in the Danube River Catchment
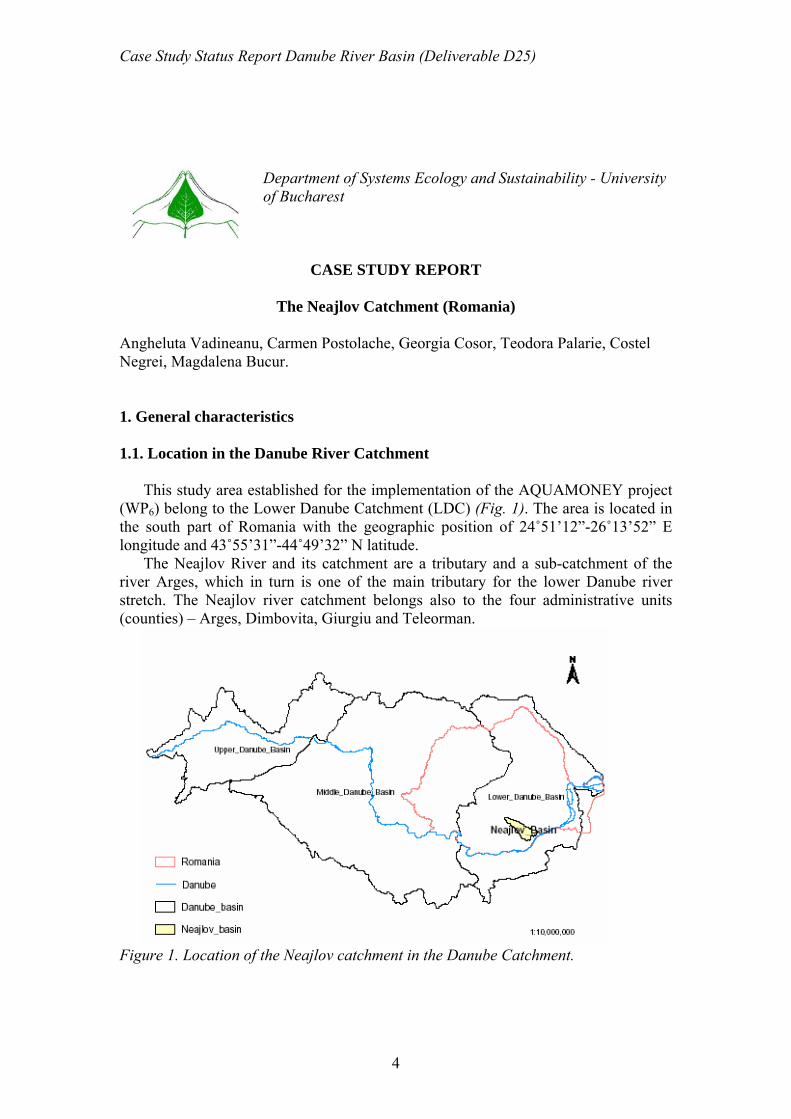
This study area established for the implementation of the AQUAMONEY project (WP6) belong to the Lower Danube Catchment (LDC) (Fig. 1). The area is located in the south part of Romania with the geographic position of 24˚51’12”-26˚13’52” E longitude and 43˚55’31”-44˚49’32” N latitude.
The Neajlov River and its catchment are a tributary and a sub-catchment of the river Arges, which in turn is one of the main tributary for the lower Danube river stretch. The Neajlov river catchment belongs also to the four administrative units (counties) – Arges, Dimbovita, Giurgiu and Teleorman.
Figure 1. Location of the Neajlov catchment in the Danube Catchment.
Case Study Status Report Danube River Basin (Deliverable D25)
5
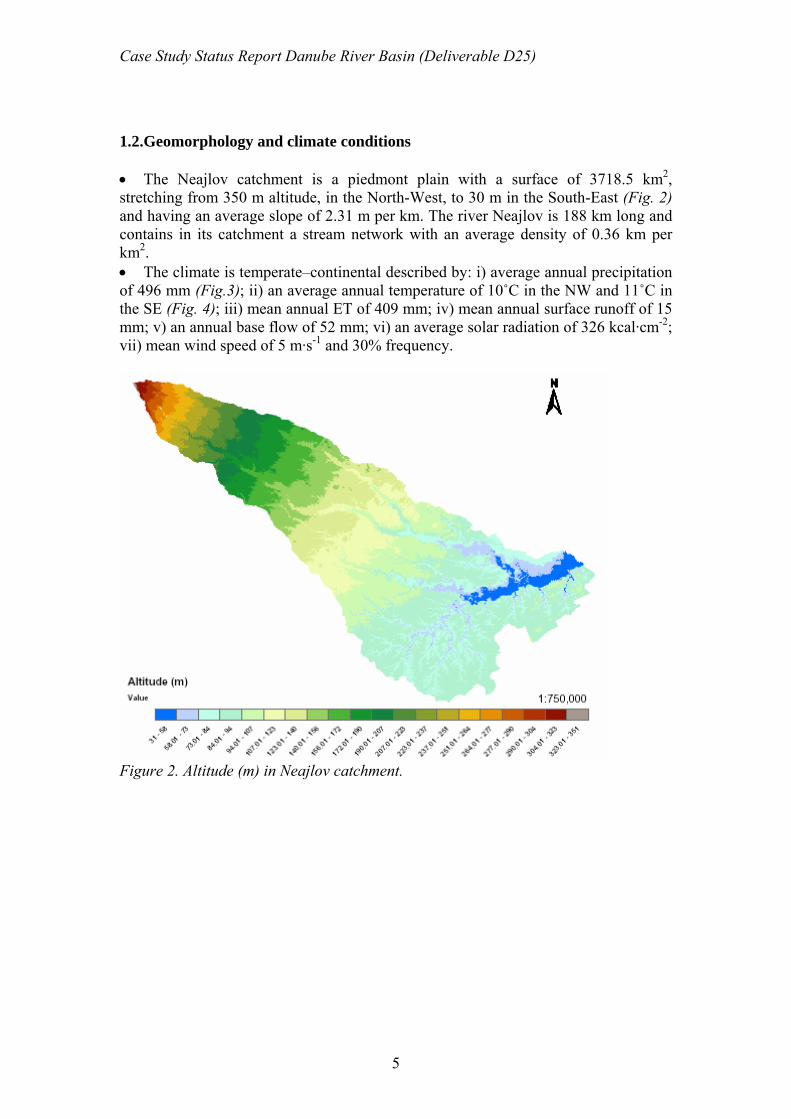
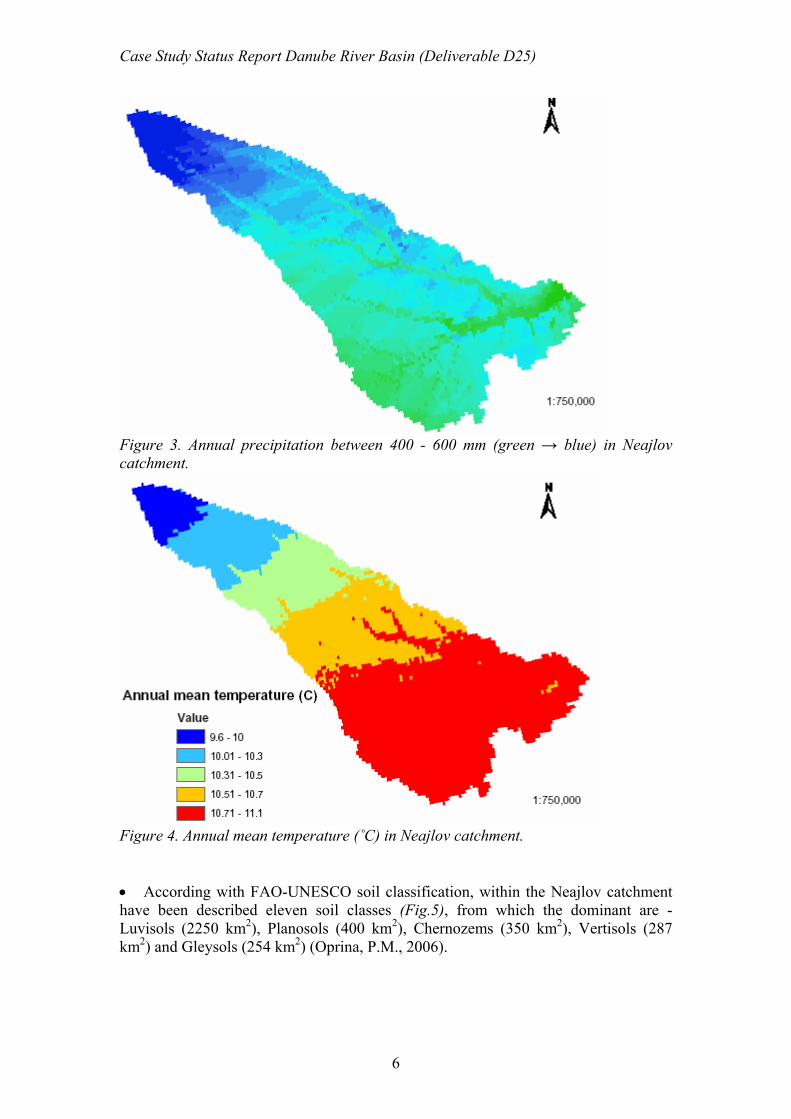
1.2.Geomorphology and climate conditions • The Neajlov catchment is a piedmont plain with a surface of 3718.5 km2, stretching from 350 m altitude, in the North-West, to 30 m in the South-East (Fig. 2) and having an average slope of 2.31 m per km. The river Neajlov is 188 km long and contains in its catchment a stream network with an average density of 0.36 km per km2. • The climate is temperate–continental described by: i) average annual precipitation of 496 mm (Fig.3); ii) an average annual temperature of 10˚C in the NW and 11˚C in the SE (Fig. 4); iii) mean annual ET of 409 mm; iv) mean annual surface runoff of 15 mm; v) an annual base flow of 52 mm; vi) an average solar radiation of 326 kcal·cm-2; vii) mean wind speed of 5 m·s-1 and 30% frequency.
Figure 2. Altitude (m) in Neajlov catchment.
Case Study Status Report Danube River Basin (Deliverable D25)
6
Figure 3. Annual precipitation between 400 - 600 mm (green → blue) in Neajlov catchment.
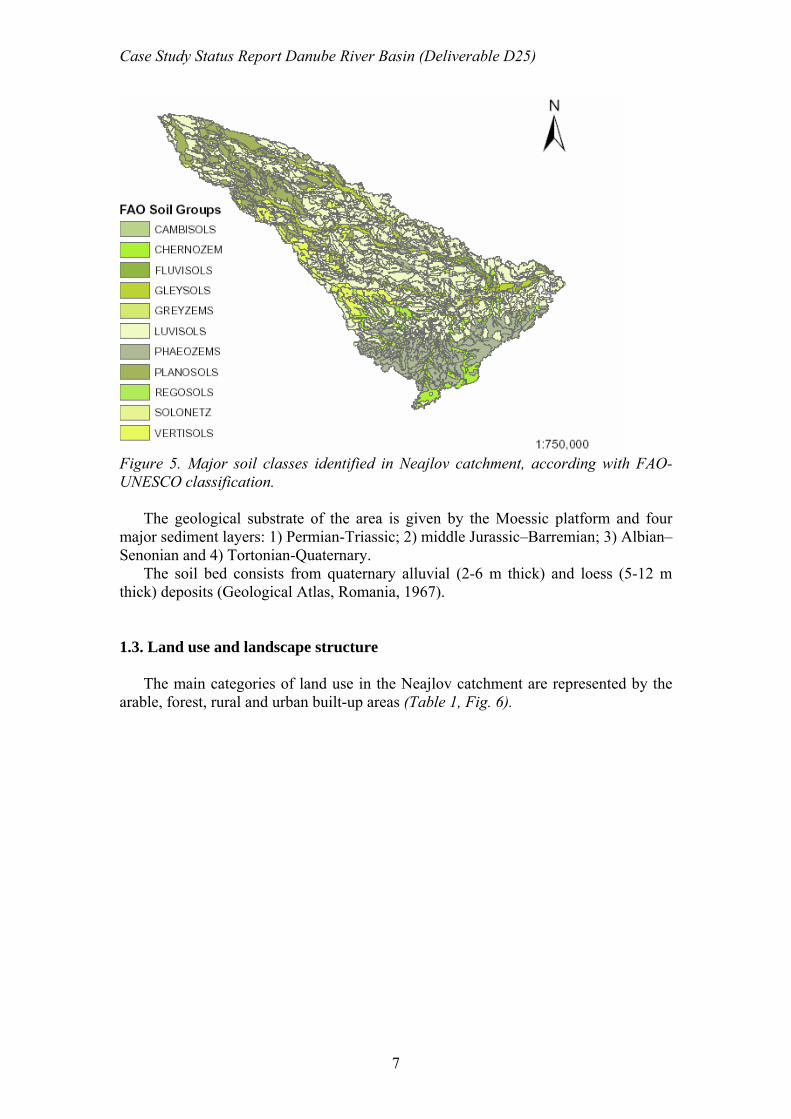
Figure 4. Annual mean temperature (˚C) in Neajlov catchment. • According with FAO-UNESCO soil classification, within the Neajlov catchment have been described eleven soil classes (Fig.5), from which the dominant are - Luvisols (2250 km2), Planosols (400 km2), Chernozems (350 km2), Vertisols (287 km2) and Gleysols (254 km2) (Oprina, P.M., 2006).
Case Study Status Report Danube River Basin (Deliverable D25)
7
Figure 5. Major soil classes identified in Neajlov catchment, according with FAO-UNESCO classification.
The geological substrate of the area is given by the Moessic platform and four major sediment layers: 1) Permian-Triassic; 2) middle Jurassic–Barremian; 3) Albian–Senonian and 4) Tortonian-Quaternary.
The soil bed consists from quaternary alluvial (2-6 m thick) and loess (5-12 m thick) deposits (Geological Atlas, Romania, 1967). 1.3. Land use and landscape structure
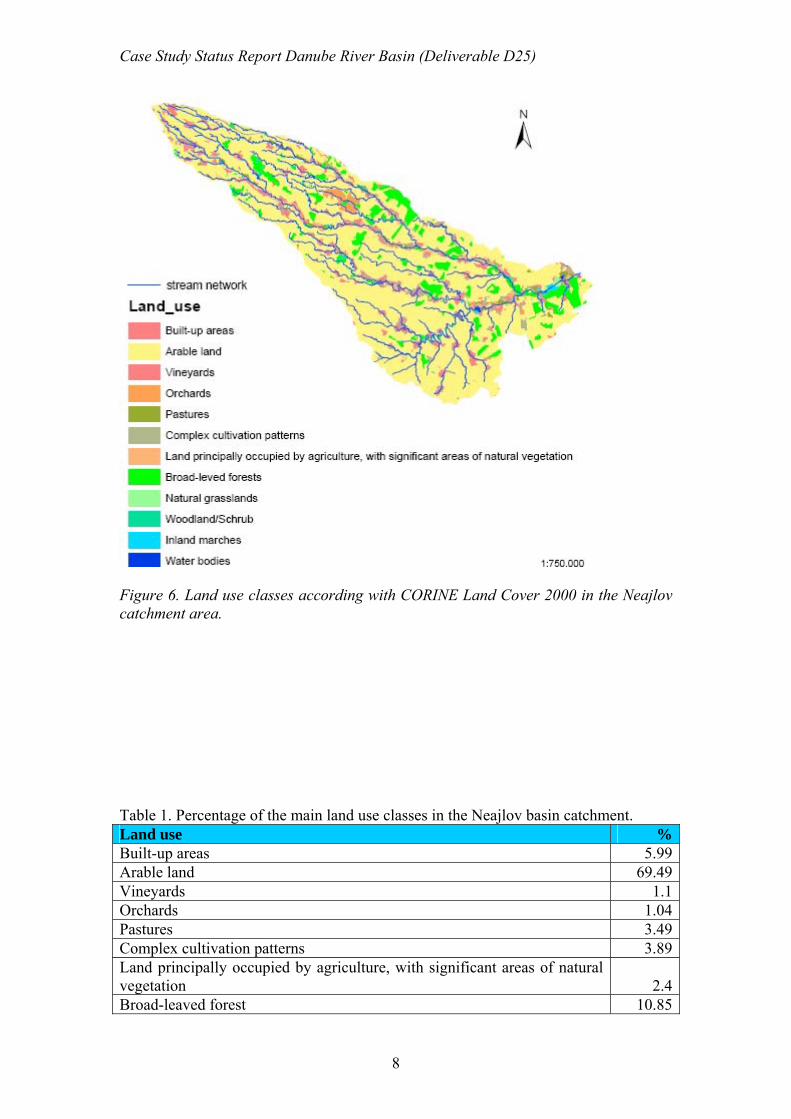
The main categories of land use in the Neajlov catchment are represented by the arable, forest, rural and urban built-up areas (Table 1, Fig. 6).
Case Study Status Report Danube River Basin (Deliverable D25)
8
Figure 6. Land use classes according with CORINE Land Cover 2000 in the Neajlov catchment area. Table 1. Percentage of the main land use classes in the Neajlov basin catchment. Land use %Built-up areas 5.99Arable land 69.49Vineyards 1.1Orchards 1.04Pastures 3.49Complex cultivation patterns 3.89Land principally occupied by agriculture, with significant areas of natural vegetation 2.4Broad-leaved forest 10.85
Case Study Status Report Danube River Basin (Deliverable D25)
9
Natural grasslands 0.17Woodland and shrub 0.17Inland marshes 0.68Water courses 0.73
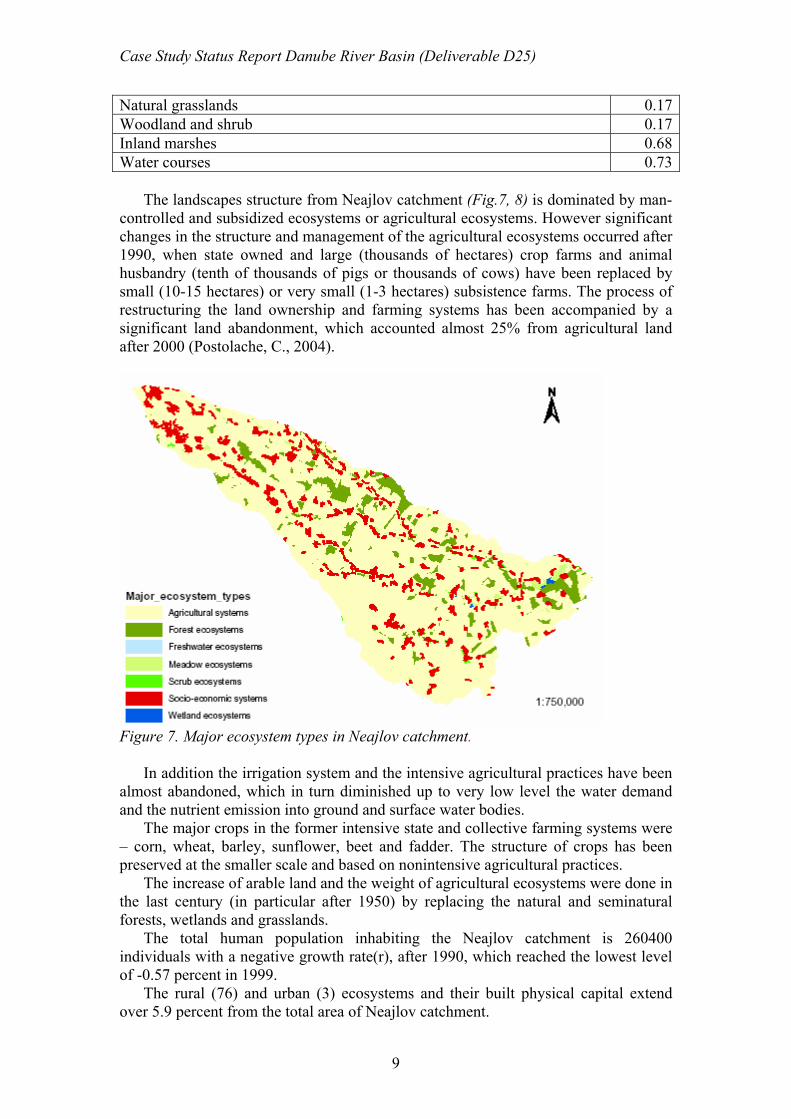
The landscapes structure from Neajlov catchment (Fig.7, 8) is dominated by man-controlled and subsidized ecosystems or agricultural ecosystems. However significant changes in the structure and management of the agricultural ecosystems occurred after 1990, when state owned and large (thousands of hectares) crop farms and animal husbandry (tenth of thousands of pigs or thousands of cows) have been replaced by small (10-15 hectares) or very small (1-3 hectares) subsistence farms. The process of restructuring the land ownership and farming systems has been accompanied by a significant land abandonment, which accounted almost 25% from agricultural land after 2000 (Postolache, C., 2004).
Figure 7. Major ecosystem types in Neajlov catchment.
In addition the irrigation system and the intensive agricultural practices have been almost abandoned, which in turn diminished up to very low level the water demand and the nutrient emission into ground and surface water bodies.
The major crops in the former intensive state and collective farming systems were – corn, wheat, barley, sunflower, beet and fadder. The structure of crops has been preserved at the smaller scale and based on nonintensive agricultural practices.
The increase of arable land and the weight of agricultural ecosystems were done in the last century (in particular after 1950) by replacing the natural and seminatural forests, wetlands and grasslands.
The total human population inhabiting the Neajlov catchment is 260400 individuals with a negative growth rate(r), after 1990, which reached the lowest level of -0.57 percent in 1999.
The rural (76) and urban (3) ecosystems and their built physical capital extend over 5.9 percent from the total area of Neajlov catchment.
Case Study Status Report Danube River Basin (Deliverable D25)
10
From the total human population, 90 percent is living in the rural settlements and 10 percent in the urban settlements. Almost 75 percent of the rural population are currently dependent, from economic point of view, on small / subsistence farms with very low level of intensification. From 10 percent of employed population, 44 percent works in the industrial sector and from that 73 percentage in the oil extraction industry and 21 percent in the processing industry.
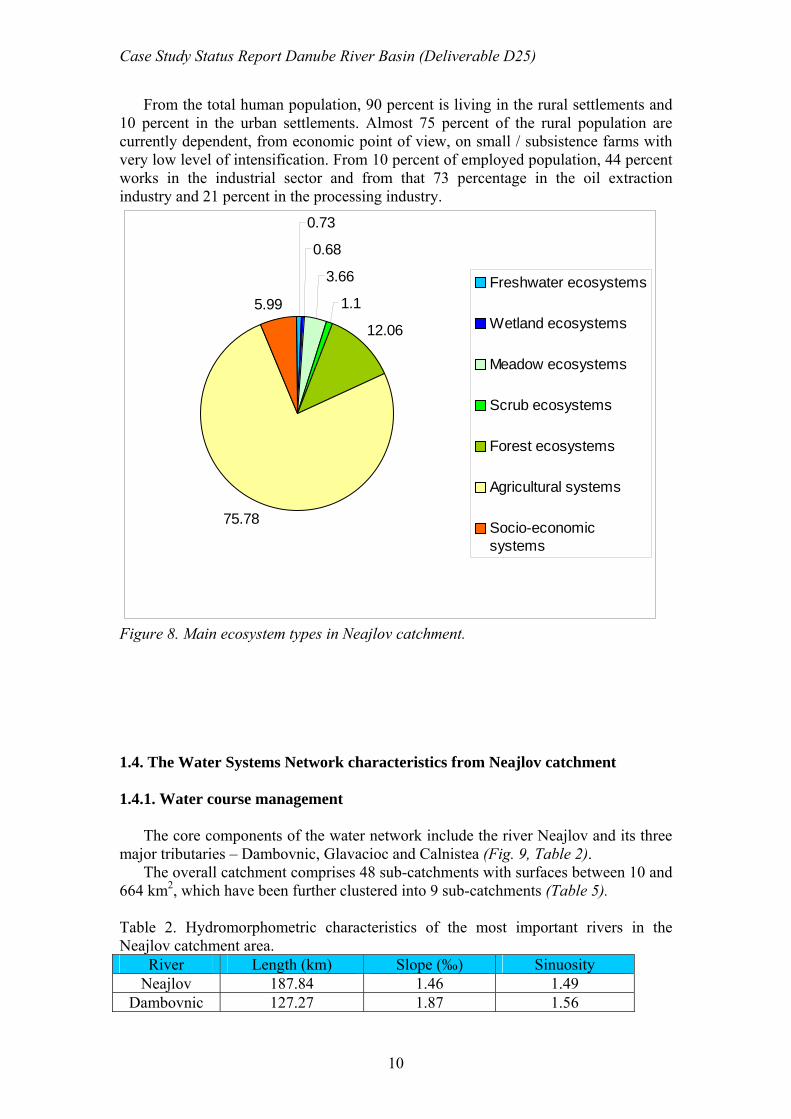
0.73
0.68
3.66
1.1
12.06
75.78
5.99Freshwater ecosystems
Wetland ecosystems
Meadow ecosystems
Scrub ecosystems
Forest ecosystems
Agricultural systems
Socio-economicsystems
Figure 8. Main ecosystem types in Neajlov catchment. 1.4. The Water Systems Network characteristics from Neajlov catchment 1.4.1. Water course management
The core components of the water network include the river Neajlov and its three major tributaries – Dambovnic, Glavacioc and Calnistea (Fig. 9, Table 2).
The overall catchment comprises 48 sub-catchments with surfaces between 10 and 664 km2, which have been further clustered into 9 sub-catchments (Table 5).
Table 2. Hydromorphometric characteristics of the most important rivers in the Neajlov catchment area.
River Length (km) Slope (‰) Sinuosity Neajlov 187.84 1.46 1.49
Dambovnic 127.27 1.87 1.56
Case Study Status Report Danube River Basin (Deliverable D25)
11
Calnistea 108.03 0.64 2.05 Glavacioc 112.64 1.88 1.57
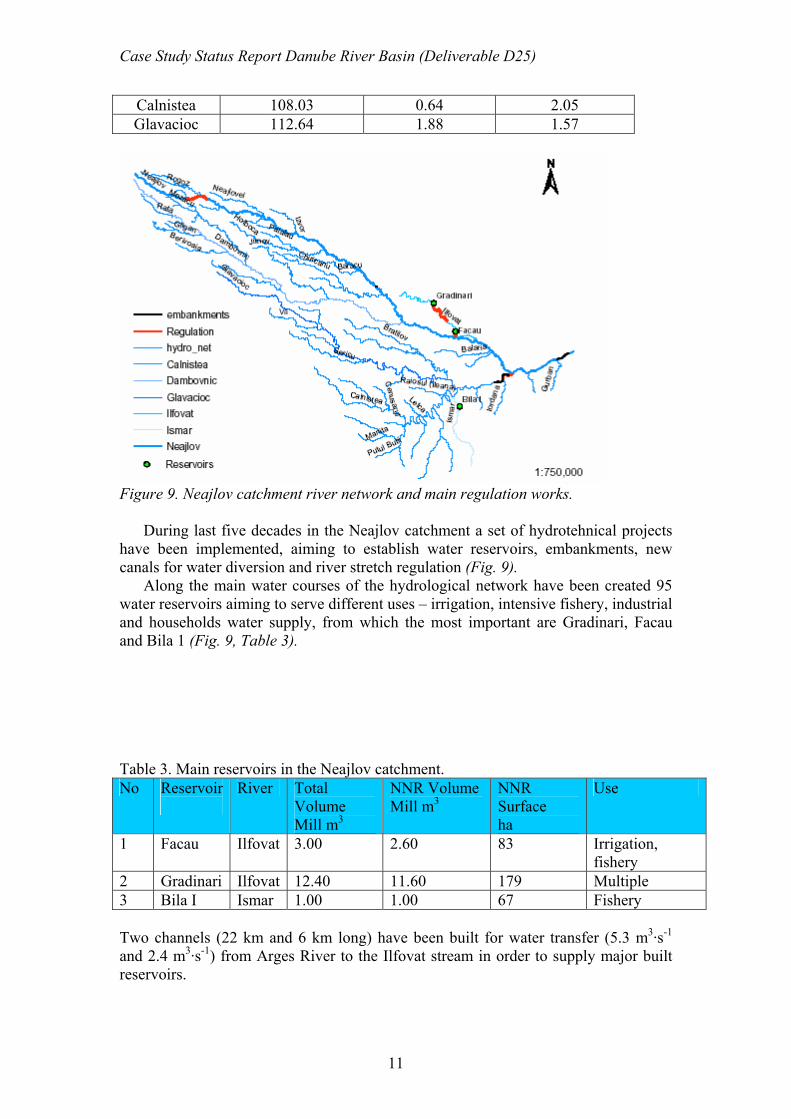
Figure 9. Neajlov catchment river network and main regulation works.
During last five decades in the Neajlov catchment a set of hydrotehnical projects
have been implemented, aiming to establish water reservoirs, embankments, new canals for water diversion and river stretch regulation (Fig. 9).
Along the main water courses of the hydrological network have been created 95 water reservoirs aiming to serve different uses – irrigation, intensive fishery, industrial and households water supply, from which the most important are Gradinari, Facau and Bila 1 (Fig. 9, Table 3).
Table 3. Main reservoirs in the Neajlov catchment. No Reservoir
River Total
Volume Mill m3
NNR Volume Mill m3
NNR Surface ha
Use
1 Facau Ilfovat 3.00 2.60 83 Irrigation, fishery
2 Gradinari Ilfovat 12.40 11.60 179 Multiple 3 Bila I Ismar 1.00 1.00 67 Fishery Two channels (22 km and 6 km long) have been built for water transfer (5.3 m3·s-1 and 2.4 m3·s-1) from Arges River to the Ilfovat stream in order to supply major built reservoirs.
Case Study Status Report Danube River Basin (Deliverable D25)
12
1.4.2. Ground and Surface water course resources management*1
Total groundwater resources in the Arges River catchment are about 696 Mil. M3/year, from which about 600 Mil. M3/year can be accessed and use by the socio-economic system. About 60% of these resources are shallow aquifer (below 5 m depth), while 40% are mean and deep aquifer (between 20-100 m depth). Surface water resources are estimated at about 1960 Mil. M3/year, and the infrastructure ensure the access of about 1671.6 Mil. M3/year. Water abstraction and use in 2002 accounted for 113.4 Mil. M3/year from groundwater resources and about 628.1 Mil. M3/year from surface waters. Water uses by socio-economic sectors are:
• Population: 71.2 Mil. M3/year from GW and 346.3 Mil. M3/year from SW; • Industry: 39.8 Mil. M3/year from GW and 244.9 Mil. M3/year from SW; • Agriculture: 2.3 Mil. M3/year from GW and 36.9 Mil. M3/year from SW;
o Irrigation: 12.14 Mil. M3/year (SW) and 0.12 Mil. M3/year (GW); o Breeding farms: 2.21 Mil. M3/year (GW); o Aquaculture: 24.76 Mil. M3/year (SW).
Water balance and aquifers characteristics
The detailed water balance for the period 1995-2001, was evaluated with SWAT model (Danielescu, S., and Postolache, C., unpublished data) and MONERIS (MOdelling Nutrient Emissions in RIver Systems) model (Postolache, C., unpublished data). Water balance characteristics are synthetically presented in Table 4.
Due to the complexity of spatial distribution of hydrologic balance components a cluster analysis has been performed in order to group the sub-catchments in functional classes. Table 4. Water balance components of the Neajlov catchment, calculated for the period 1995-2001 (without storage changes and transmission losses from river)
Component [mm/a] [%] Remarcs Average annual precipitation 496 River discharge 66 13.3 [%] related to precipitation Evapotranspiration 409 82.45 [%] related to precipitation Surface runoff 15 20.70 [%] related to river discharge Baseflow 52 71.76 [%] related to river discharge Lateral flow 1 1.38 [%] related to river discharge Point source contribution 3.6 4.97 [%] related to river discharge Tile drainage runoff 0.43 0.59 [%] related to river discharge
It was observed that regions located in the northern and western part of the
catchment are characterized by high values of surface runoff (18-20 mm/a annual * Values indicate the volumes of water resources at the Arges River catchment, to which Neajlov catchment belongs
Case Study Status Report Danube River Basin (Deliverable D25)
13
average) and as a consequence by high values of total water yield (75-91 mm/a annual average). The infiltration (366 - 377 mm/a) and evapotranspiration (379 / 397 mm/a annual average) are lower than the catchment average (394 / 409 mm). These factors together with the soil properties suggest a very rapid circulation of water from upslope to the river, mainly through surface runoff. The soil water content has the lowest values for the entire catchment (between 41 mm/a and 50 mm/a).
Regions located in the central and southern-western, southern-eastern parts of the catchment are characterized by lower values of surface runoff (11-13 mm/a). The infiltration level is greater for these areas, but is balanced by a higher level of evapotranspiration (420-432). Groundwater discharge varies from 7 mm/a to 89 mm/a, and soil water content lies between 72 mm/a and 122 mm/a.
Aquifers characteristics, detailed on 9 sub-catchments of the Neajlov catchment, are presented in Table 5. Data have been obtained by mathematical modeling (MONERIS model). It can be observed that groundwater specific discharge is higher in the upper part of the catchment, while the longer residence time was obtained for the lower part of the catchment (Calugareni). Table 5. Aquifers characteristics for 9 sub-catchments of the Neajlov catchment evaluated through MONERIS model.
Q-GW (discharge)
Areas contribting to GW recharge
Groundwater discharge
(long term corrected)
GW residence time Sub-
catchment [m³/s] [km²] [mm/a] [years]
Suseni 0.34 93.76 96.45 31 Slobozia 0.54 162.08 88.43 34 Roata Mica 1.25 378.84 87.71 34 Oarja 0.22 64.01 92.10 33 Furduiesti 0.24 73.90 87.67 34 Morteni 0.20 64.81 83.03 36 Moara din Groapa 0.37 116.56 84.54 35 Vadu Lat 1.18 355.37 88.05 34 Calugareni 4.23 2253.28 49.99 60
Main hydraulic infrastructure
The water supply and waste water management systems have not reached the actual modern requirements in this sector. Only a very small percentage of population, of ~6% is provided with water supply and is connected to waste water treatment plants. In fact, only 2.9% of population living in the catchment is provided with these utilities. The rest live in Gaesti, a town located outside the borders of Neajlov catchment, which discharges the waste water from municipality near Moara din Groapa. There are three waste water treatment plants in the region discharging the waste water in the surface waters: Gaesti, Videle and Drganesti Vlasca (Fig. 10). The treatment plants ensure only the removal of organic carbon (biological level of treatment). Average data concerning more information about WWTP discharges are presented in Table 6.
Case Study Status Report Danube River Basin (Deliverable D25)
14
Table 6. Information about the level of waste water treatment and discharges for Neajlov basin.
WWTP Population connected
Level of treatment
Q (mil. m3/a)
discharged
TN (t/a)
TP (t/a)
Data period
Gaesti 7124 C 1.12 10.8 2.24 1998-2001Videle 6418 C 0.48 4.9 0.14 1998-2001Drganesti Vlasca
C 0.18 2.5 0.11 1998-2001
Pitesti - C 11.08 63.2 3.63 1998-2001Oarja - C 0.11 41.6 0.83 1998-2001C = carbon removal
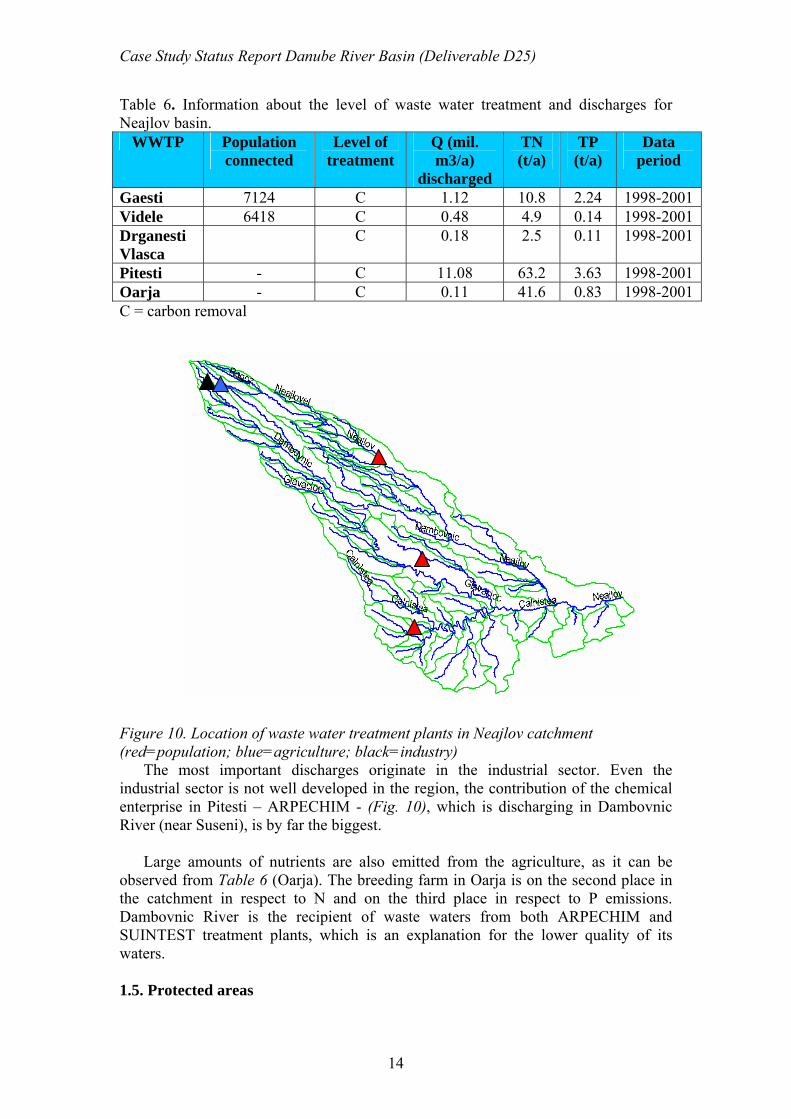
Figure 10. Location of waste water treatment plants in Neajlov catchment (red=population; blue=agriculture; black=industry)
The most important discharges originate in the industrial sector. Even the industrial sector is not well developed in the region, the contribution of the chemical enterprise in Pitesti – ARPECHIM - (Fig. 10), which is discharging in Dambovnic River (near Suseni), is by far the biggest.
Large amounts of nutrients are also emitted from the agriculture, as it can be observed from Table 6 (Oarja). The breeding farm in Oarja is on the second place in the catchment in respect to N and on the third place in respect to P emissions. Dambovnic River is the recipient of waste waters from both ARPECHIM and SUINTEST treatment plants, which is an explanation for the lower quality of its waters. 1.5. Protected areas
Case Study Status Report Danube River Basin (Deliverable D25)
15
According with article 6 and article 6.3. of the Water Framework Directive (WFD) the concept of protected areas has been extended to cover:
• areas designated for the protection of habitats and species; • areas designated for water abstraction intended for human consumption; • nutrient sensitive areas, including areas designated as vulnerable. In that regard at the Neajlov catchment scale up to now have been established for
following protected areas: • Comana wetland (1260 ha), designated as a Natura 2000 site for bird species
protection under the EU-Bird and Habitat directives; • Teleorman – Glavacioc (185 ha) and Glavacioc – Neajlov (231 ha) as
vulnerable areas due to high nitrate load; • Poieni (51 l·s-1), Videle (50 l·s-1) and Gradinari (10 l·s-1) as protected areas
designated for ground water abstraction for human consumption. 1.6. Economic analysis of water use
The water management is based on the solidarity principle and common interest through the cooperation of public administration, water users and representatives of local communities. The qualitative and quantitative water resource management is made by the Romanian Waters National Authority, the instution in charge with all the strategies regarding the management and exploitation of the water resources. The National Authority administrates the national network of hydrological, hydro-geological and quality measurements of the public waters through its Water Directorates organized at basin and group of basin level.
The payment, penalties and rewards system constitutes the economic mechanism
established for the qualitative and quantitative management of water use in a monopolistic regime. According with the implementation of the Government Ordinance 1001/1990, the water pricing system consists of unique charges for raw water supplied from different sources to groups of users and unique tariffs provided by the water supplyers for specific water services.
The water charges and taxes that are being set by the Romanian Waters Authority
on a national level acording with the Water Law (107/1996) under the supervision of the Competition Council based on the economic analysis of the financial status of the water services providers consider the following cost categories:
• raw materials costs: energy, fuels, and significant other costs (concession fees, raw water, typical chemical substances);
• labor force costs; • depreciation costs; • monitoring and hydrological research costs; • other costs of services provided by third parties; • maintenance and repairs costs (provided by own activity or other parties). The resource cost or the private cost of water use is reflected by the payment
system according with the beneficiary pays principle, comprising the amount of money paid by the water users (households, public institutions and any other economic agent) to the specialized management units for the following services:
Case Study Status Report Danube River Basin (Deliverable D25)
16
• abstraction, treatment and pumping; • water distribution for industrial platforms, irrigation, public and other
networks; • water transport through pipes and channels; • conservation of tourism and recreational opportunities for rivers, natural lakes
and reservoirs; • flood protection activities; • water pumping for therapeutical waters protection and embankment areas; • insuring fish resource utility; • water flow supplement; • other services related to water use and treatment.
The environmental costs or the external cost of water is reflected by the
environmental related taxes (Table 7) and the penalties system.
The water users are allowed to discharge effluents, which are loaded with specific pollutants, according with the type of water use, up to certain thresholds, established by water law. However for the permission any economic agent / user has to pay a tax for each chemical compound released with the effluent.
According with the polluter pays principle, the discharge of waste water
containing pollutants above the allowed thresholds established by law are punished by penalties set taking into account the difference between the allowed chemical concentration and the discharge concentration level and the volume of the discharges.
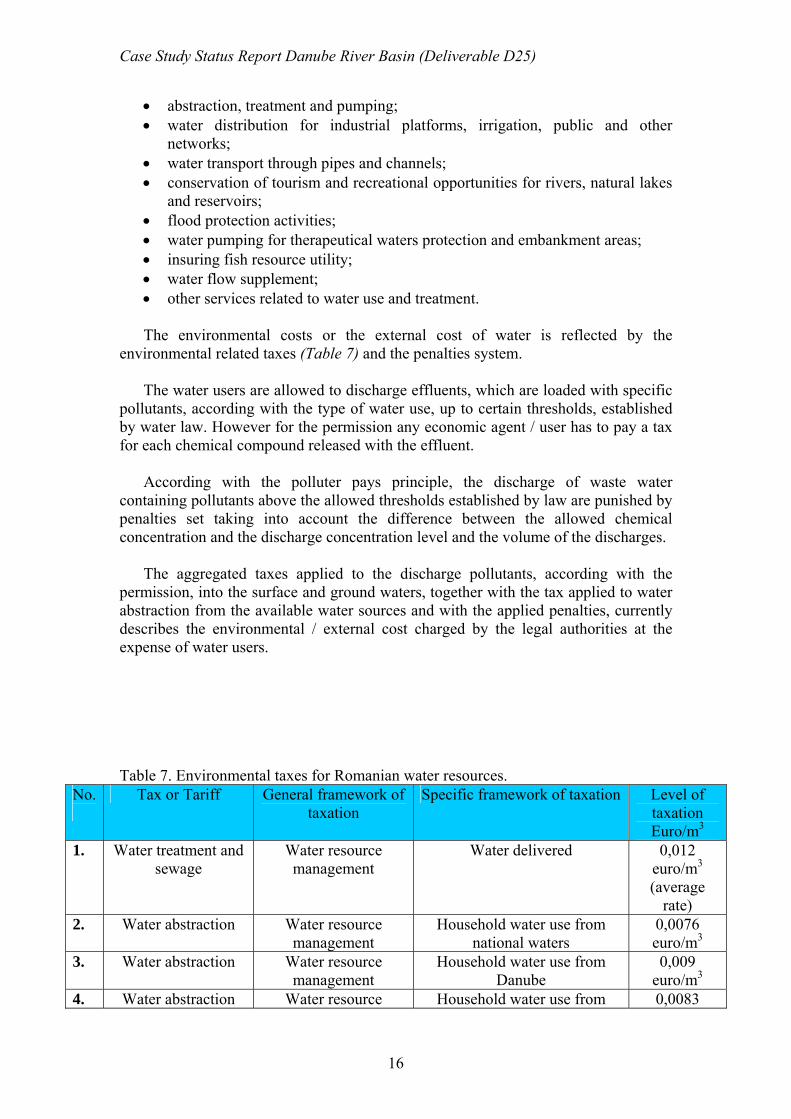
The aggregated taxes applied to the discharge pollutants, according with the permission, into the surface and ground waters, together with the tax applied to water abstraction from the available water sources and with the applied penalties, currently describes the environmental / external cost charged by the legal authorities at the expense of water users. Table 7. Environmental taxes for Romanian water resources.
No.
Tax or Tariff General framework of taxation
Specific framework of taxation Level of taxation Euro/m3
1. Water treatment and sewage
Water resource management
Water delivered 0,012 euro/m3 (average
rate) 2. Water abstraction Water resource
management Household water use from
national waters 0,0076 euro/m3
3. Water abstraction Water resource management
Household water use from Danube
0,009 euro/m3
4. Water abstraction Water resource Household water use from 0,0083
Case Study Status Report Danube River Basin (Deliverable D25)
17
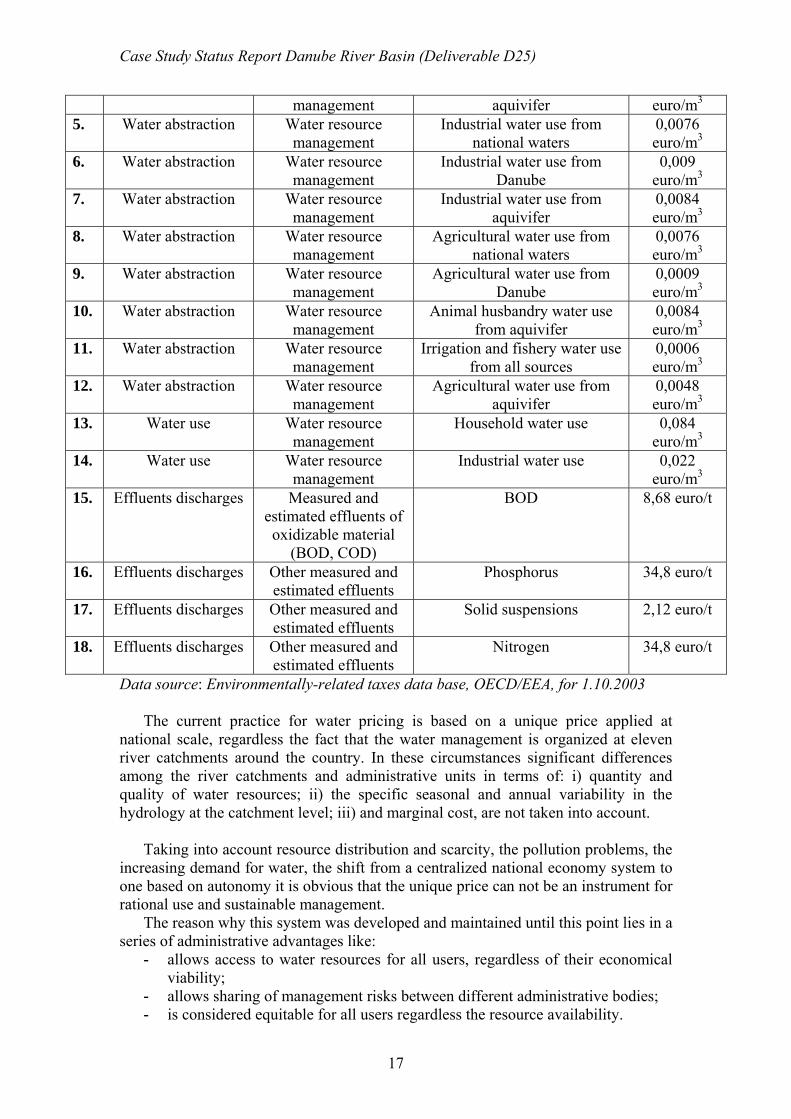
management aquivifer euro/m3 5. Water abstraction Water resource
management Industrial water use from
national waters 0,0076 euro/m3
6. Water abstraction Water resource management
Industrial water use from Danube
0,009 euro/m3
7. Water abstraction Water resource management
Industrial water use from aquivifer
0,0084 euro/m3
8. Water abstraction Water resource management
Agricultural water use from national waters
0,0076 euro/m3
9. Water abstraction Water resource management
Agricultural water use from Danube
0,0009 euro/m3
10. Water abstraction Water resource management
Animal husbandry water use from aquivifer
0,0084 euro/m3
11. Water abstraction Water resource management
Irrigation and fishery water use from all sources
0,0006 euro/m3
12. Water abstraction Water resource management
Agricultural water use from aquivifer
0,0048 euro/m3
13. Water use Water resource management
Household water use 0,084 euro/m3
14. Water use Water resource management
Industrial water use
0,022 euro/m3
15. Effluents discharges Measured and estimated effluents of oxidizable material
(BOD, COD)
BOD 8,68 euro/t
16. Effluents discharges Other measured and estimated effluents
Phosphorus 34,8 euro/t
17. Effluents discharges Other measured and estimated effluents
Solid suspensions 2,12 euro/t
18. Effluents discharges Other measured and estimated effluents
Nitrogen 34,8 euro/t
Data source: Environmentally-related taxes data base, OECD/EEA, for 1.10.2003
The current practice for water pricing is based on a unique price applied at national scale, regardless the fact that the water management is organized at eleven river catchments around the country. In these circumstances significant differences among the river catchments and administrative units in terms of: i) quantity and quality of water resources; ii) the specific seasonal and annual variability in the hydrology at the catchment level; iii) and marginal cost, are not taken into account.
Taking into account resource distribution and scarcity, the pollution problems, the increasing demand for water, the shift from a centralized national economy system to one based on autonomy it is obvious that the unique price can not be an instrument for rational use and sustainable management.
The reason why this system was developed and maintained until this point lies in a series of administrative advantages like:
- allows access to water resources for all users, regardless of their economical viability;
- allows sharing of management risks between different administrative bodies; - is considered equitable for all users regardless the resource availability.
Case Study Status Report Danube River Basin (Deliverable D25)
18
Nevertheless in spite of these advantages the unique price does not stimulate competition and liability, as the authorities’ responsibilities and incomes or deficits are transferred from the local to the national level.
The expected improved practice for economic analysis according with the provision of WFD should be developed by taking into consideration the shortages of the current practice and to extend the analysis to the major functions and broader range of resources and services provided by the inland water ecosystems, under the pressure of different drivers acting across time and space scales. This is in fact the unique goal of the AQUAMONEY project.
1.7. Major water quality and environmental problems Groundwater quality
Groundwater monitoring system in the Neajlov catchment recorded high concentrations of pollutants in 22 deep wells. The main pollutants are organic compounds, ammonium, and nitrates. High concentrations of organic compounds have been recorded in the northern part of the catchment, in the proximity of the industrial platform ARPECHIM - Pitesti. Ammonium, and accidentally nitrates, is present in larger amounts in those regions characterized by shallow aquifers and more intense agricultural practices (central and southern part of the catchment). Measurements of groundwater nutrient content performed by Arges-Vedea Water Directorate (WDAV – Pitesti) reported mean catchment concentrations of 2.96 mg N/l and 0.07 mg P/l. Surface water
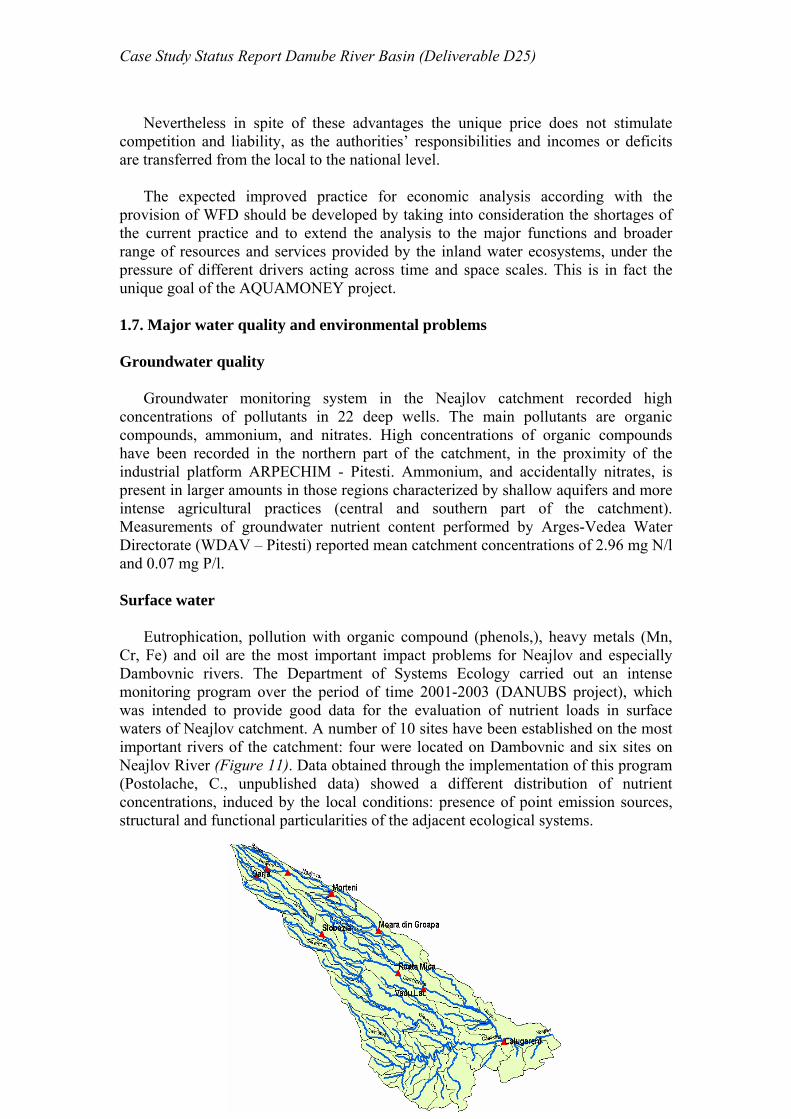
Eutrophication, pollution with organic compound (phenols,), heavy metals (Mn, Cr, Fe) and oil are the most important impact problems for Neajlov and especially Dambovnic rivers. The Department of Systems Ecology carried out an intense monitoring program over the period of time 2001-2003 (DANUBS project), which was intended to provide good data for the evaluation of nutrient loads in surface waters of Neajlov catchment. A number of 10 sites have been established on the most important rivers of the catchment: four were located on Dambovnic and six sites on Neajlov River (Figure 11). Data obtained through the implementation of this program (Postolache, C., unpublished data) showed a different distribution of nutrient concentrations, induced by the local conditions: presence of point emission sources, structural and functional particularities of the adjacent ecological systems.

Case Study Status Report Danube River Basin (Deliverable D25)
19
Figure 11. Selected measuring points for the additional sampling program in the Neajlov catchment (2001-2003).
The variation of total nitrogen concentrations is similar for both rivers, being no higher than 15 mg TN/l, with the exception of one site - Suseni. In this point concentrations up to 30 mg TN/l have been determined. The values decrease while moving downstream as a consequence of bigger dilution. The dynamics of total reactive phosphorous is similar with that of total nitrogen. The range of variation is greater for Dambovnic River (up to 4.5 mg TP/l) but no more than 0.7 mg TP/l has been recorded for Neajlov River.
Very irregular variation of both nutrients have been recorded in several points:
Suseni and Furduiesti. Both the amplitudes and heterogeneities in nutrient dynamics can be explained by the great influence of point discharges from the local industries: ARPECHIM, SUINTEST (discharging in Dambovnic-Suseni) and, to some extend, Cateasca (even if the amplitude is not too high).
In conclusion, the distribution and variation of nutrients in the surface waters of
the Neajlov catchment are highly dependent on the emissions but also on the transport and transformation processes they undergo with different rates in time and space. There are several “hot spots” in the region, characterized by the highest nutrient concentrations: Suseni and Moara din Groapa. They are tightly related to the intensity of point emissions. 2. Pressure, impact, and risk analysis whit regards to the WFD environmental objectives 2.1 Significant pressures impacting on water status
The most important point and diffuse pollution sources present in the Neajlov catchment are: • the emission points of the chemical industry ARPECHIM - Pitesti - Suseni
(organic compounds, heavy metals oil spills); • the breeding farm SUINTEST – Oarja (nutrients, organic matter); • the waste waters from the beverage industry Cateasca are discharged near
Furduiesti (organic compounds, nutrients); • Roata is an oil extraction region (oil pollution);
Case Study Status Report Danube River Basin (Deliverable D25)
20
• Moara din Groapa is the receiving point of the effluents from the Waste Water Treatment Plant (WWTP) Gaesti (nutrients, organic matter);
• Downstream both Neajlov and Dambovnic rivers the emissions originate mostly from agricultural areas and rural settlements (nutrients). Nutrient emissions in the surface and ground waters is one of the most severe
problem in the cathment and, therefore the mathematical model MONERIS was applied (DANUBS project) in order to quantify the emission nutrient fluxes of different origin - point or diffuse sources (Postolace, C., unpublished data).
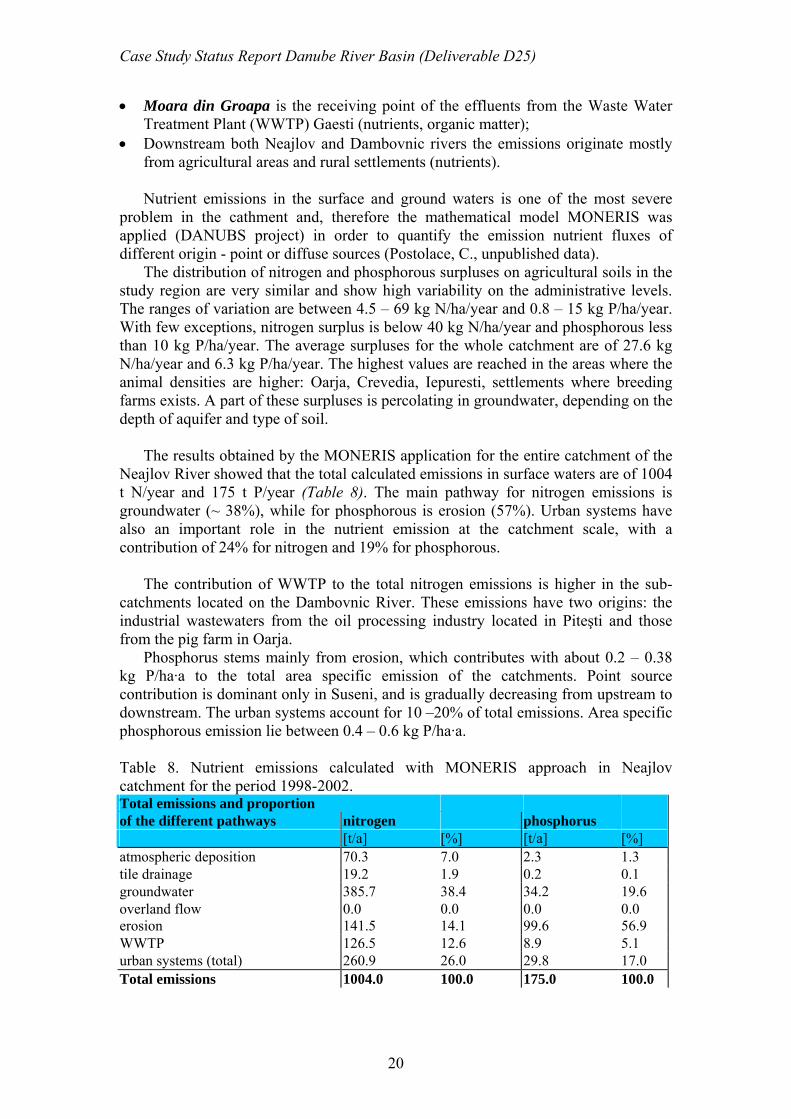
The distribution of nitrogen and phosphorous surpluses on agricultural soils in the study region are very similar and show high variability on the administrative levels. The ranges of variation are between 4.5 – 69 kg N/ha/year and 0.8 – 15 kg P/ha/year. With few exceptions, nitrogen surplus is below 40 kg N/ha/year and phosphorous less than 10 kg P/ha/year. The average surpluses for the whole catchment are of 27.6 kg N/ha/year and 6.3 kg P/ha/year. The highest values are reached in the areas where the animal densities are higher: Oarja, Crevedia, Iepuresti, settlements where breeding farms exists. A part of these surpluses is percolating in groundwater, depending on the depth of aquifer and type of soil. The results obtained by the MONERIS application for the entire catchment of the Neajlov River showed that the total calculated emissions in surface waters are of 1004 t N/year and 175 t P/year (Table 8). The main pathway for nitrogen emissions is groundwater (~ 38%), while for phosphorous is erosion (57%). Urban systems have also an important role in the nutrient emission at the catchment scale, with a contribution of 24% for nitrogen and 19% for phosphorous.
The contribution of WWTP to the total nitrogen emissions is higher in the sub-catchments located on the Dambovnic River. These emissions have two origins: the industrial wastewaters from the oil processing industry located in Piteşti and those from the pig farm in Oarja.
Phosphorus stems mainly from erosion, which contributes with about 0.2 – 0.38 kg P/ha·a to the total area specific emission of the catchments. Point source contribution is dominant only in Suseni, and is gradually decreasing from upstream to downstream. The urban systems account for 10 –20% of total emissions. Area specific phosphorous emission lie between 0.4 – 0.6 kg P/ha·a. Table 8. Nutrient emissions calculated with MONERIS approach in Neajlov catchment for the period 1998-2002. Total emissions and proportion of the different pathways nitrogen phosphorus [t/a] [%] [t/a] [%] atmospheric deposition 70.3 7.0 2.3 1.3 tile drainage 19.2 1.9 0.2 0.1 groundwater 385.7 38.4 34.2 19.6 overland flow 0.0 0.0 0.0 0.0 erosion 141.5 14.1 99.6 56.9 WWTP 126.5 12.6 8.9 5.1 urban systems (total) 260.9 26.0 29.8 17.0 Total emissions 1004.0 100.0 175.0 100.0
Case Study Status Report Danube River Basin (Deliverable D25)
21
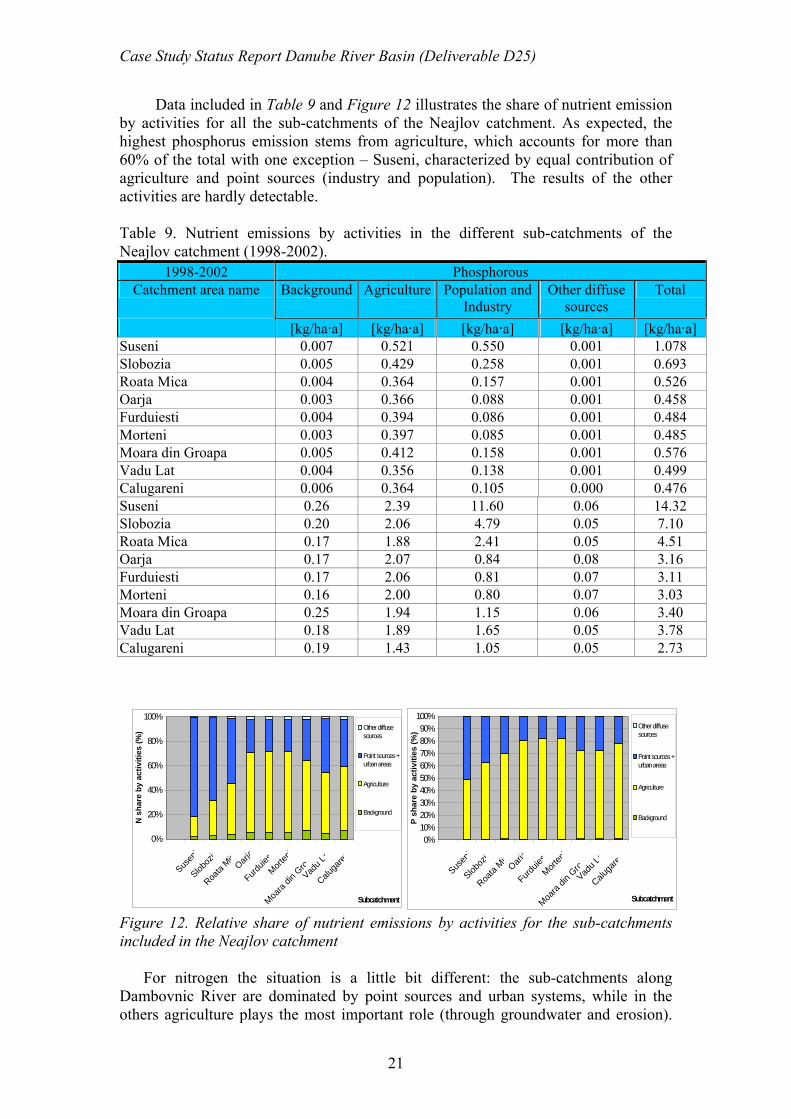
Data included in Table 9 and Figure 12 illustrates the share of nutrient emission by activities for all the sub-catchments of the Neajlov catchment. As expected, the highest phosphorus emission stems from agriculture, which accounts for more than 60% of the total with one exception – Suseni, characterized by equal contribution of agriculture and point sources (industry and population). The results of the other activities are hardly detectable. Table 9. Nutrient emissions by activities in the different sub-catchments of the Neajlov catchment (1998-2002).
1998-2002 Phosphorous Catchment area name Background Agriculture Population and
Industry Other diffuse
sources Total
[kg/ha·a] [kg/ha·a] [kg/ha·a] [kg/ha·a] [kg/ha·a] Suseni 0.007 0.521 0.550 0.001 1.078 Slobozia 0.005 0.429 0.258 0.001 0.693 Roata Mica 0.004 0.364 0.157 0.001 0.526 Oarja 0.003 0.366 0.088 0.001 0.458 Furduiesti 0.004 0.394 0.086 0.001 0.484 Morteni 0.003 0.397 0.085 0.001 0.485 Moara din Groapa 0.005 0.412 0.158 0.001 0.576 Vadu Lat 0.004 0.356 0.138 0.001 0.499 Calugareni 0.006 0.364 0.105 0.000 0.476 Suseni 0.26 2.39 11.60 0.06 14.32 Slobozia 0.20 2.06 4.79 0.05 7.10 Roata Mica 0.17 1.88 2.41 0.05 4.51 Oarja 0.17 2.07 0.84 0.08 3.16 Furduiesti 0.17 2.06 0.81 0.07 3.11 Morteni 0.16 2.00 0.80 0.07 3.03 Moara din Groapa 0.25 1.94 1.15 0.06 3.40 Vadu Lat 0.18 1.89 1.65 0.05 3.78 Calugareni 0.19 1.43 1.05 0.05 2.73
Figure 12. Relative share of nutrient emissions by activities for the sub-catchments included in the Neajlov catchment
For nitrogen the situation is a little bit different: the sub-catchments along Dambovnic River are dominated by point sources and urban systems, while in the others agriculture plays the most important role (through groundwater and erosion).
0%10%20%30%40%50%60%70%80%90%
100%
Susen
i
Sloboz
ia
Roata
MicOarj
a
Furduie
st
Morten
i
Moara
din G
roaVad
u La
Caluga
ren
Subcatchment
P sh
are
by a
ctiv
ities
(%)
Other diffusesources
Point sources +urban areas
Agriculture
Background
0%
20%
40%
60%
80%
100%
Susen
i
Sloboz
ia
Roata
MicOarj
a
Furduie
st
Morten
i
Moara
din G
roaVad
u Lat
Caluga
ren
Subcatchment
N s
hare
by
activ
ities
(%) Other diffuse
sources
Point sources +urban areas
Agriculture
Background
Case Study Status Report Danube River Basin (Deliverable D25)
22
These results have been expected for a region dominated by agricultural practices, even if the pressure from industrial activities in the northern part of the catchment cannot be neglected and was the main driving force for the water quality deterioration in the last decades (Dambovnic River was degraded in the upstream part between 1980 – 1990).
2.2. Impacts on surface and groundwater bodies
The diversity of point and diffuse sources located in the Neajlov catchment or in its proximity, as well as the increase of transfer rates of the chemical compounds towards the components of the natural capital have been the main consequences of the anthropic activities in the region during the last decades. These led to deterioration of surface and groundwater quality consisting in:
• accumulation of some macro elements (nutrients) and changes of their biogeochemical cycles. Eutrophication is one of the most important problems reported for the region, and previous studies showed that important nutrient fluxes originate from agriculture, especially as diffuse sources;
• increase of surface water loads and sediment concentrations in chemical compounds as: phenols, aromatic hydrocarbons (PAH) in the upper part of the catchment, near Pitesti;
• accumulation of heavy metals: Cr, Fe, Mn in sediments and surface waters, along the Dambovnic River;
• decrease of groundwater quality due to accumulation of organic compounds (chemical oxygen demand – COD) in the aquifers near Pitesti, COD, ammonium and nitrates in aquifers located in the southern part of the catchment;
• decrease of water surface area for Comana Lake from about 1300 ha in 1960 to 600-650 ha in the present period, due to decrease of groundwater level.
2.3. Water bodies at risk of not achieving a good status
The risk of not achieving a good status is enhanced for those water bodies which are receptors of residual water fluxes from chemical industry, food industry and oil extraction platforms. Continuous discharges of waste waters and accidental pollution have been recorded every year in the catchment and the “hot spots” mentioned most frequently are:
• Suseni, located on Dambovnic River, due to pollution with phenols, PAH, heavy metals from ARPECHIM - Pitesti;
• Suseni (Dambovnic River) receptor of waste waters from breeding farm SUINTEST - Oarja;
• Roata, Poeni (Dambovnic River) due to accidental pollution with oil (extraction platform);
• Cateasca (Neajlov River) receiving the waste waters from beverage industry (accidental pollution) with organic matter;
• Rogoz chanel - Neajlovel – pollution with oil from Oarja platform.
Case Study Status Report Danube River Basin (Deliverable D25)
23
At the catchment level, Dambovnic River is under a continuous and more heavily impact of residual fluxes from the socio-economic system, while Neajlov River is only accidentally not achieving a good status, over limited periods of time and with less severe consequences. 2.4. Diagnosis of water quality and ecological issues (aquatic and related terrestrial ecosystems)
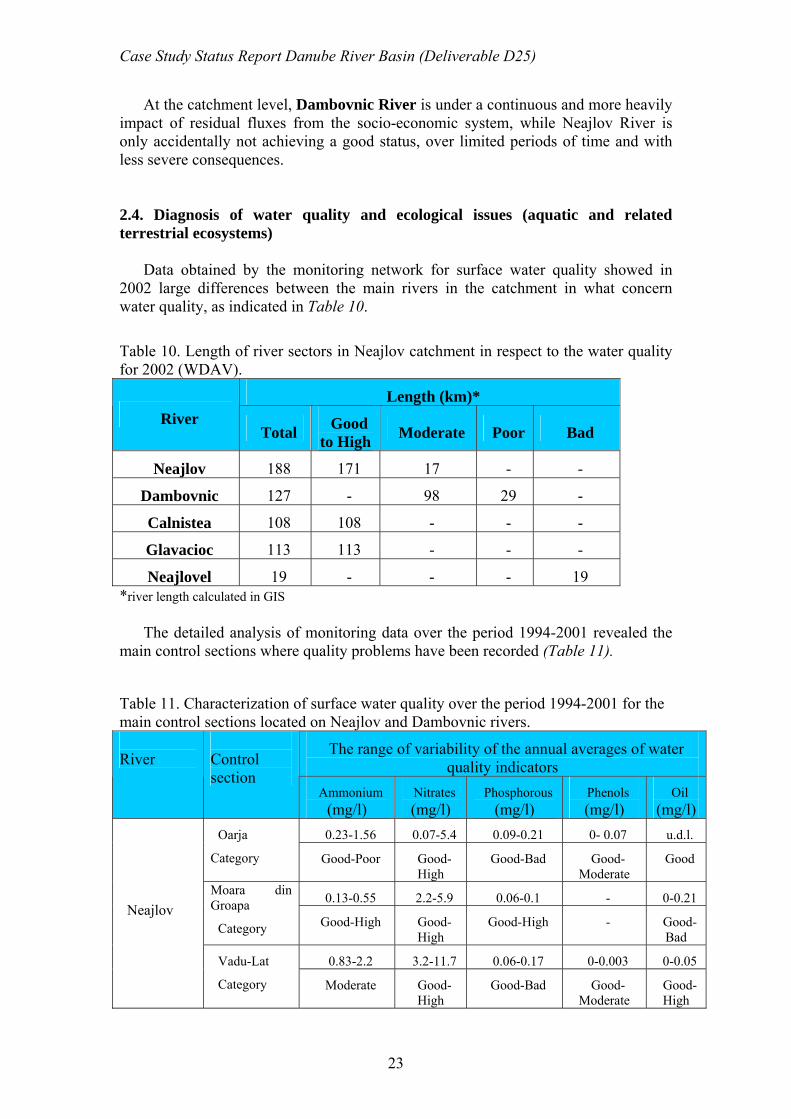
Data obtained by the monitoring network for surface water quality showed in 2002 large differences between the main rivers in the catchment in what concern water quality, as indicated in Table 10.
Table 10. Length of river sectors in Neajlov catchment in respect to the water quality for 2002 (WDAV).
Length (km)* River
Total Good to High Moderate Poor Bad
Neajlov 188 171 17 - -
Dambovnic 127 - 98 29 -
Calnistea 108 108 - - -
Glavacioc 113 113 - - -
Neajlovel 19 - - - 19 *river length calculated in GIS
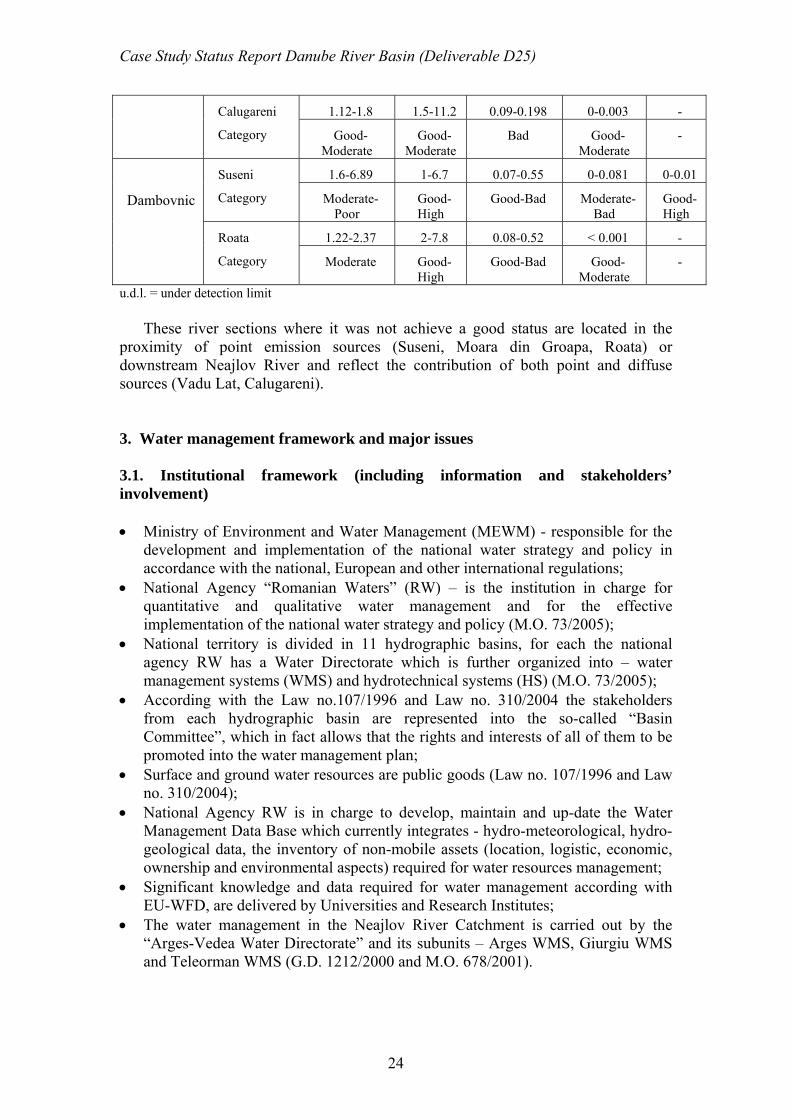
The detailed analysis of monitoring data over the period 1994-2001 revealed the main control sections where quality problems have been recorded (Table 11).
Table 11. Characterization of surface water quality over the period 1994-2001 for the main control sections located on Neajlov and Dambovnic rivers.
The range of variability of the annual averages of water quality indicators
River
Control section
Ammonium (mg/l)
Nitrates (mg/l)
Phosphorous (mg/l)
Phenols (mg/l)
Oil (mg/l)
0.23-1.56 0.07-5.4 0.09-0.21 0- 0.07 u.d.l. Oarja
Category Good-Poor Good-High
Good-Bad Good-Moderate
Good
0.13-0.55 2.2-5.9 0.06-0.1 - 0-0.21 Moara din Groapa
Category Good-High Good-High
Good-High - Good-Bad
0.83-2.2 3.2-11.7 0.06-0.17 0-0.003 0-0.05
Neajlov
Vadu-Lat
Category Moderate Good-High
Good-Bad Good-Moderate
Good-High
Case Study Status Report Danube River Basin (Deliverable D25)
24
1.12-1.8 1.5-11.2 0.09-0.198 0-0.003 - Calugareni
Category Good-Moderate
Good-Moderate
Bad Good-Moderate
-
1.6-6.89 1-6.7 0.07-0.55 0-0.081 0-0.01 Suseni
Category Moderate-Poor
Good-High
Good-Bad Moderate-Bad
Good-High
1.22-2.37 2-7.8 0.08-0.52 < 0.001 -
Dambovnic
Roata
Category Moderate Good-High
Good-Bad Good-Moderate
-
u.d.l. = under detection limit
These river sections where it was not achieve a good status are located in the proximity of point emission sources (Suseni, Moara din Groapa, Roata) or downstream Neajlov River and reflect the contribution of both point and diffuse sources (Vadu Lat, Calugareni). 3. Water management framework and major issues 3.1. Institutional framework (including information and stakeholders’ involvement) • Ministry of Environment and Water Management (MEWM) - responsible for the
development and implementation of the national water strategy and policy in accordance with the national, European and other international regulations;
• National Agency “Romanian Waters” (RW) – is the institution in charge for quantitative and qualitative water management and for the effective implementation of the national water strategy and policy (M.O. 73/2005);
• National territory is divided in 11 hydrographic basins, for each the national agency RW has a Water Directorate which is further organized into – water management systems (WMS) and hydrotechnical systems (HS) (M.O. 73/2005);
• According with the Law no.107/1996 and Law no. 310/2004 the stakeholders from each hydrographic basin are represented into the so-called “Basin Committee”, which in fact allows that the rights and interests of all of them to be promoted into the water management plan;
• Surface and ground water resources are public goods (Law no. 107/1996 and Law no. 310/2004);
• National Agency RW is in charge to develop, maintain and up-date the Water Management Data Base which currently integrates - hydro-meteorological, hydro-geological data, the inventory of non-mobile assets (location, logistic, economic, ownership and environmental aspects) required for water resources management;
• Significant knowledge and data required for water management according with EU-WFD, are delivered by Universities and Research Institutes;
• The water management in the Neajlov River Catchment is carried out by the “Arges-Vedea Water Directorate” and its subunits – Arges WMS, Giurgiu WMS and Teleorman WMS (G.D. 1212/2000 and M.O. 678/2001).
Case Study Status Report Danube River Basin (Deliverable D25)
25
3.2. Major issues • Increased frequency of droughts alternating with heavy rains and floods; • For the time being few aggressive point sources pollution, which are responsible
for low water quality of Dambovnic and Neajlovel streams (see 2.3. and 2.4.); • Abandonment and deterioration of the irrigation system; • Siltation of the man made water accumulation; • Very poor development of water supply system. 3.3. Major water policy issues • The need to adapt the water strategy and management to the trend of increasing
frequency and intensity of droughts and floods; • Agricultural landscape planning for multifunctional farming system which may
allow for effective diffuse pollution control, habitat connectivity and biodiversity conservation / adaptation;
• Rehabilitation of water quality and the ecosystem health of degraded water bodies (including siltation of water reservoirs);
• Rehabilitation and development of the irrigation system as an effective tool for adaptation;
• Water supply infrastructure development (60 percent of the population living in the Neajlov catcment to benefit by 2013);
• Efficient and effective waste water treatment infrastructure development.

Case Study Status Report Danube River Basin (Deliverable D25)
26
4. ERC Analysis and methodological issues 4.1. Table 12. Ecosystem functions, goods and services and type of values associated (Neajlov Catchment).
Ecosystem functions Goods and services Type of value Cost/Benefit
Hydrological: Water discharge Water recharge Flood detention
Potable water for households use Water for livestock consumption Aquaculture Crop irrigation Food processing Manufacturing processes Flood protection / control Ground water recharge
Direct use Direct use Direct use Direct use Direct use Direct use
Indirect use Indirect use
Full cost
Biochemical: Nutrient retention Nutrient export Trace elements retention Trace elements export
Water purification Chemical speciation and toxicant removal Micro-climate regulation
Indirect use Indirect use Indirect use
Improve water quality and local climate Human health
Ecological: Food web support Habitat support Biodiversity
Biological diversity provision Recreation Fishing and hunting Research, education
Non-use Direct use Direct use
Indirect use
Biodiversity conservation Eco-Tourism Knowledge Awareness attitudes participation Water resources conservation
Ben
efits
Case Study Status Report Danube River Basin (Deliverable D25)
27
4.2. Proposed methods and tools for ERC & Benefit valuation
Having in mind the overall goal of the project, the major structural and functional characteristics of the ground and surface water ecosystems and landscapes from the Neajlov Catchment, the ecosystem functioning and associated flows of resources / goods and services, the type of values, costs and benefits (Table 12) as well as the major water policy and management issues, identified for the catchment, and the availability of the needed data and information or the request for additional data, we believe that there are good premises for Total Economic Valuation of the “Water Services” from this particular case study.
Taking also, into consideration the existing wide range of methods and tools which may allow for total economic valuation of the costs and benefits involved in the water management, their sectoral application and the advantages or disadvantages associated with their use, we have tried to pack a set of them, which if applied together can help for achieving the goal of full economic valuation of water services. These are: i) Market Based transactions; ii) Derived demand functions; iii) Damage costs avoided; iv) Contingent Valuation; v) Hedonic price; vi) Travel cost; vii) Benefit transfer.
That will be accompanied by field survey, data quality assessment, statistical analysis and modeling. • The analysis is based on holistic and hierarchical approach, applied at ecosystem,
landscape and subregional socio-ecological scale (e.g.1-10 km2; 10-500 km2; 3000-5000 km2 / “single water body; stream / small scale catchment”)
• The data used extends over more than 10 years, and they allow for structural and functional analysis, identification of major socio-economic drivers and pressures responsible for structural and functional changes; estimation of renewable water and biological resources, water balance, renewable rates or “resource stocks and flows”; identification and estimation of significant flows for major services; data about composition, structure and dynamics of social and built capital; data regarding the structure and metabolism of the subregional socio-economic system. This time interval fits with the time constants specific to the dynamics of structural component of the case study area.
• Additional information required for economic valuation through methods based on the revealed or stated preferences, is instead to be produced with a high degree of confidence. In that regard, the study should rely on appropriate sample structure (to be representative for social capital structure) and size.
4.3. Available sources of data / information • The Neajlov Catchment has been identified as a subregional socio-ecological
complex, part of the national network of sites for Long Term Socio – Ecological Research (LTSER), and of the global ILTER – network. Since more than one decade complementary research and monitoring activities were carried out in this area, and many others are implemented or designed. The integrated research and monitoring activities have been or are carried out in close cooperation with the National Agency “Romanian Waters” and Arges –
Case Study Status Report Danube River Basin (Deliverable D25)
28
Vedea Water Directorate and the Basin Committee, as institutions responsible for WFD implementation.
• The available sourced of data information are mostly represented by the data and knowledge base concerning Neajlov Catchment LTSER site, administred by DSES-UNIBUC and Arges – Vedeas Water Management Data Base.
Case Study Status Report Danube River Basin (Deliverable D25)
29
References:
1. Romanian Waters Agency, Water Management Data Base 2. Arges - Vedea Water Directorate, Water Management Data Base 3. DSES-UNIBUC LTSER InfoBase / Neajlov Catchment 4. DSES-UNIBUC, Final report - Nutrient Balances for Danube Countries and
Options for Surface and Groundwater Protection, EC - DG XI, contract no. EU/AR/102A/91, years of implementation: 1995 – 1997.
5. DSES-UNIBUC, Final report - Nitrogen Control by Landscape Structures in Agricultural Environments (NICOLAS), EC - DG XII, contract no. ENV4-CT97-0395, years of implementation: 1998-2000.
6. DSES-UNIBUC, Final report, European Valuation and Assessment tools supporting Wetland Ecosystem legislation (EVALUWET), EC - DG XII, contract no. EVK1-CT-2000-00070, years of implementation: 2001-2003.
7. DSES-UNIBUC, Final report, Nutrient management in the Danube basin and its impact on the Black Sea (DANUBS), EC - DG XII, contract no. EVK1-CT-2000-00051, years of implementation: 2001-2003.
8. DSES-UNIBUC, Final report - Integrating Ecosystem Function into River Quality Assessment and Management (RIVFUNCTION), EC - DG XII, contract no. EVK1-CT-2001-00088, years of implementation 2001–2004.
9. DSES-UNIBUC, Interim report - Populations / Species and guildes as services provider unites in freshwater and terrestrial ecosystems (PROMOTOR), Ministry of Research – contract no. 626 / 2005, years of implementation 2005-2008.
10. DSES-UNIBUC, Interim report - Assessment of functions, services and resources in aquatic ecosystems as basis for the management of hydrographic systems (INAQUA), Ministry of Research – contract no. 759 / 2006, years of implementation 2006-2008.

Case Study Status Report Danube River Basin (Deliverable D25)
30
CASE STUDY STATUS REPORT
DANUBE RIVER BASIN,
(Deliverable D25)
1. Vienna, Austrian
Institute of Advanced Studies (Klagenfurt) and Department of Economics (Klagenfurt University), Klagenfurt.
Autors: Markus Bliem, Michael Getzner
May, 2007

Authors Michael Getzner, Markus Bliem
Date 2 May 2007
Status report of the case study considering ERCB in the
WFD: Austria
Contact information AquaMoney Partners
Copyright © 2006
All rights reserved. No part of this publication may be reproduced, stored in a retrieval system or transmitted in any form or by any
means, electronic, mechanical, photocopying, recording or otherwise without the prior written permission of the copyright holder.
Colophone
This report is part of the EU funded project AquaMoney, Development and Testing of Practical Guidelines for the As-
sessment of Environmental and Resource Costs and Benefits in the WFD, Contract no SSPI-022723.
General
Deliverable Case study status report
Deadline
Complete reference Bliem, M. Getzner, M. (2007), Status report of the case study considering ERCB in the WFD: Austria. Institute of
Advanced Studies (Klagenfurt) and Department of Economics (Klagenfurt University), Klagenfurt.
Status Author(s) Date Comments Date
Approved / Released Markus Bliem, Michael
Getzner
2 May 2007
Reviewed by Manuel Pulido Velázquez 29 April 2007
Pending for Review
Second draft 15 April 2007
First draft for Comments 21 March 2007
Under Preparation
Confidentiality
Public
Restricted to other programme participants (including the Commission Service)
Restricted to a group specified by the consortium (including the Advisory Board)
Confidential, only for members of the consortium
Accessibility
Workspace
Internet
Paper

Status report of the case study considering ERCB in the WFD: Austria
1
1. Introduction, problem setting and background
1.1 Background
As a part of the Aquamoney research project, the current paper reports on the preparation of a case study demonstrating
the potentials and limits of including Environmental and Resource Costs and Benefits (ERCB) into the pricing of water
services in Austria. The Austrian case study is part of the ‘Danube group’ within the Aquamoney project dealing with
different aspects of water use and water services along the Danube River and the river’s catchment area.
The case study builds on three Articles of the Water Framework Directive (WFD) with the aim to set into practice the
regulations detailed in these articles. A number of Articles of the WFD refers to economic aspects (e.g. full-cost recov-
ery) while accounting for the Environmental and Resource Costs and Benefits.
The Austrian Water Act (WRG, Wasserrechtsgesetz)1 prescribes the use of the state of the art in (abatement) technology
in order to protect the waters (groundwater, surface water) as defined in §12a(1) of the WRG. Environmental impacts to
these waters have to be limited according to the technological state of the art (§13 of the WRG). This also applies to
changes of the use of waters (§21a(1) WRG). The WRG also accounts for the costs and benefits of a certain technologi-
cal measure (§12a(1) WRG), however, no details are provided regarding the calculation of costs and benefits of such
measures. Interestingly, the WRG applies to all kinds of water uses (not only water services), and therefore, the official
position of the Austrian authorities regarding the account for ERCB for water services only is somehow a step back
behind the already existing Austrian regulations (nevertheless, calculating ERCB according to the WRG when approv-
ing or rejecting water uses has not been done yet).
As documented by Bliem and Getzner (2007), the ‘Austrian position’ is narrow regarding the valuation of ERCB in the
WFD. Austrian policy makers restrict themselves to water services only – i.e. ERCB have to be calculated when it
comes to pricing water services such as drinking water, communal waste water collection and treatment, or paid indus-
trial services. They therefore reject the notion that water uses therefore do not fall under the ERCB regime.
The range of potential Aquamoney case studies in the current context is therefore limited in order to potentially influ-
ence Austrian policy-making. An advantage of a limited approach is that beyond the variety of Aquamoney case stud-
ies, none concentrates on waste water and sewage collection and treatment of a capital city (Vienna) located at a major
European River (Danube river).
Because the economic analysis of the water use as well as economic instruments play a central role in the implementa-
tion process of the WFD the Federal Ministry commissioned four economic studies for the sectors agriculture, produc-
tion and services, energy as well as water supply and wastewater service. The results of the economic analysis were
published in the volume ‘economic analysis of water use’ and set up the basis for the report on the economic analysis
according to Art. 5 of the WFD. 2
In order to fulfil the provision of Article 5 of the WFD also a comprehensive status
quo report was published and submitted to the EC in 2006.3
The current case study therefore is based on already existing reports and builds on the Aquamoney guidelines and defi-
nitions while incorporating also the existing knowledge of Austrian decision makers.
1.2 Choice of the relevant case study
Due to the ‘Austrian position’, the range of potential case studies is limited to water services. Before this position was
clarified, the Austrian project team considered a number of interesting potential case studies where ERCB may play an
important role in economic analyses:
1 Wasserrechtsgesetz (WRG) 1959, BGBl.Nr. 215/1959 in the version of BGBl. I Nr. 123/2006.
2 http://recht.lebensministerium.at/article/articleview/19764/1/5642
3 http://wasser.lebensministerium.at/article/articleview/36921/1/6345/
AquaMoney
2
- The “Marchfeld-Kanal” is an irrigation and groundwater enrichment project that was discussed during the
1970s and 1980s, and actually constructed and opened in the 1990s.
The channel used surface water of the Danube River and transports waters from the Danube very near to the
North city limits of Vienna to the Marchfeld (the bread basket of Austria). Due to agricultural use and commu-
nal waste water, the groundwater quality and quantity decreased significantly, and the falling groundwater lev-
els also lead to drainage of surface water (small creeks) where water quality turned so bad that waters were
ecologically dead (e.g. extinct fish species).
A case study around the Marchfeld Kanal could be interesting from many viewpoints: Irrigation, ERCB of wa-
ter enrichment, agricultural use and communal waste water management. However, the main use of the waters
is not done within water services but farmers may use the waters traditionally (e.g. by pumping water on their
plots).
- The “Flussbauliches Gesamtkonzept” is a project along the Danube east of Vienna targeted at preventing the
further erosion of the river bed (1 to 2 centimeters per year). The aim of the project is basically twofold: On the
one hand, the conditions for ship transport should be secured (e.g. 2.5 to 2.8 meters of river depth on 95% of
all days); on the other hand, the Donauauen National Park – situated alongside of about 40 kilometers of the
river – depends on groundwater and flooding dynamics for its fast changing wetland ecosystems.
The hydrological concept has been discussed since the 1980s and 1990s when the national park was estab-
lished. Up to now, no “hard” and comprehensive technical measures have been undertaken. The concept
touches upon a number of water uses and ecological issues of wetlands, and would therefore be interesting in
terms of valuing ERCB. However, there are some studies available in the context of the Donauauen National
Park (e.g. Schönbäck et al., 19974) that detail important economic aspects and the valuation of ERCB.
- “LIFE projects” increasing the quality and quantity of water availability target specific issues of species con-
servation. A number of projects have been undertaken5, many of them dealing with water issues. However, no
LIFE project accounted specifically for water services but concentrated for instance on single species or
smaller water management issues. Economic analyses have not yet been implemented.
Taking these three potential case studies, the project team decided to restrict the Austrian case study to a topic dealing
with water services in the narrow sense. As the WFD requires full-cost recovery of water services, a decision was made
to consider the economic aspects of waste water collection and sewage treatment of the Austria capital city of Vienna.
Historically, even the Roman city of Vindobona had its waste water collection system, and nowadays, waste water ad
sewage is treated centrally in a waste water treatment plant at the South-Eastern city limit with a direct connection to
the Danube River. The capacity of the plant is to clean waste water of about 3 million inhabitant equivalents (thus also
cleaning commercial and industrial waste water given that Vienna has about 1.6 million residents). Earlier studies6
exhibited a technologically up-to-date cleaning plant while the economic aspects referring to full-cost recovery are
doubtful. Given the utility fees, full-cost recovery was not achieved in the past as the substantial federal subsidies for
investment and maintenance suggest. The Austrian UFG (Umweltförderungsgesetz), i.e. the legal framework in which
the government may pay subsidies to the industrial and communal polluting facilities, and the Austrian Act on Tax
Sharing (Finanzausgleichsgesetz, FAG 1993) provide for the calculation of water and waste water utility fees. For full-
cost recovery based on the Austrian framework, costs that accrue to the utility manager (the community) have to be
recovered based on those costs that the community has directly to bear. This means that the full investment costs, minus
the subsidy, is the basis for cost recovery by revenues out of fees. Therefore, even if the community charges the full
costs, the resulting revenue cannot guarantee adequate provision for financing wear-and-tear (depreciation) since the
part of the investment that was financed by subsidies is not recovered by the fees paid to the community. Therefore,
communities also need subsidies for future (re-) investments, and are thus dependent on governments grants.
The current status report therefore deals with the waste water treatment in the City of Vienna in order to indicate how
the draft guidelines and the key issues listed in the draft guidelines for the assessment of environmental and resource
costs and benefits in the WFD are tested in practice, and how the information gained by valuing ERCB may influence
4 Schönbäck, W., Kosz, M., Madreiter, T. (1997). Nationalpark Donau-Auen: Kosten-Nutzen-Analyse. Springer Verlag, Wien/New York (ISBN 3-211-82968-7). See also
Kosz, M. (1996). Valuing Riverside Wetlands: the Case of the „Donau-Auen“ National Park. Ecological Economics 16 (2), 109-127. 5 For an overview of potentially interesting LIFE projects see http://www.lifenatur.at/ and http://ec.europa.eu/environment/life/project/index.htm.
6 Kosz, M. (1997). Einnahmen, Ausgaben und Kosten der Wasserver und Abwasserentsorgung in Wien. Wiener Mitteilungen (Wasser - Abwasser - Gewässer), Band 142
(hrsg. v. Institut für Wassergüte und Abfallwirtschaft, TU-Wien), Wien (ISBN 3-85234-034-9).

Status report of the case study considering ERCB in the WFD: Austria
3
full-cost recovery and the calculation of utility fees paid by Viennese households and companies. Taking the waste
water treatment system of Vienna as the Austrian case study considers two important aspects:
- The receiving water body is a major European river, the Danube River. Therefore, we may draw conclusion
that will not be restricted to a small area or that might be untypical for European cities and water bodies.
- As Vienna and its surrounding account for 20 to 30% of the Austrian population (depending on the definition
of the region), we may also draw conclusions for Austria as a whole since the Vienna waste water treatment
system may function as a benchmark of a centralized and efficient system.
- The data and information availability is highly given since the system is centralized, and data may be drawn
from a single source.
AquaMoney
4
1905
2314
2167
1979
1767
2123
1868
1685
1396
1831
2355
17201833
2271
2437 2468
1682
1878
16081641
1758
1384
1772
15841557
18921936
1963
0
500
1000
1500
2000
2500
3000
1978
1979
1980
1981
1982
1983
1984
1985
1986
1987
1988
1989
1990
1991
1992
1993
1994
1995
1996
1997
1998
1999
2000
2001
2002
2003
2004
2005
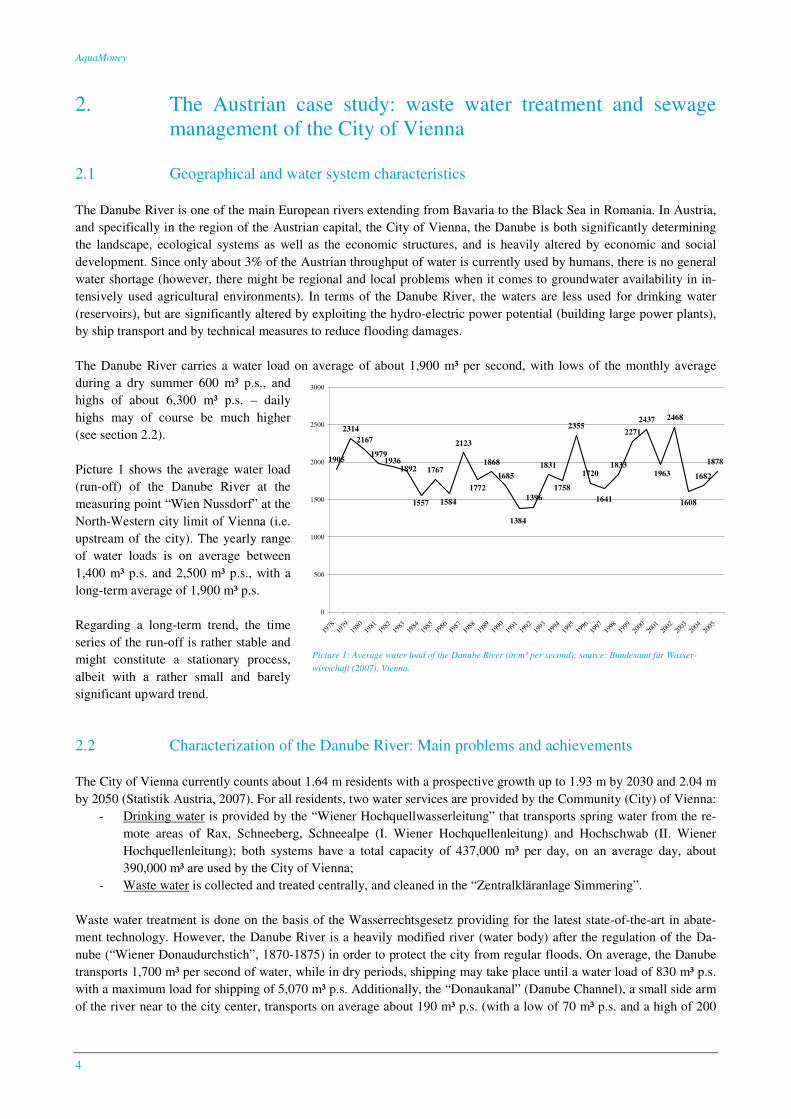
Picture 1: Average water load of the Danube River (in m³ per second); source: Bundesamt für Wasser-
wirtschaft (2007), Vienna.
2. The Austrian case study: waste water treatment and sewage
management of the City of Vienna
2.1 Geographical and water system characteristics
The Danube River is one of the main European rivers extending from Bavaria to the Black Sea in Romania. In Austria,
and specifically in the region of the Austrian capital, the City of Vienna, the Danube is both significantly determining
the landscape, ecological systems as well as the economic structures, and is heavily altered by economic and social
development. Since only about 3% of the Austrian throughput of water is currently used by humans, there is no general
water shortage (however, there might be regional and local problems when it comes to groundwater availability in in-
tensively used agricultural environments). In terms of the Danube River, the waters are less used for drinking water
(reservoirs), but are significantly altered by exploiting the hydro-electric power potential (building large power plants),
by ship transport and by technical measures to reduce flooding damages.
The Danube River carries a water load on average of about 1,900 m³ per second, with lows of the monthly average
during a dry summer 600 m³ p.s., and
highs of about 6,300 m³ p.s. – daily
highs may of course be much higher
(see section 2.2).
Picture 1 shows the average water load
(run-off) of the Danube River at the
measuring point “Wien Nussdorf” at the
North-Western city limit of Vienna (i.e.
upstream of the city). The yearly range
of water loads is on average between
1,400 m³ p.s. and 2,500 m³ p.s., with a
long-term average of 1,900 m³ p.s.
Regarding a long-term trend, the time
series of the run-off is rather stable and
might constitute a stationary process,
albeit with a rather small and barely
significant upward trend.
2.2 Characterization of the Danube River: Main problems and achievements
The City of Vienna currently counts about 1.64 m residents with a prospective growth up to 1.93 m by 2030 and 2.04 m
by 2050 (Statistik Austria, 2007). For all residents, two water services are provided by the Community (City) of Vienna:
- Drinking water is provided by the “Wiener Hochquellwasserleitung” that transports spring water from the re-
mote areas of Rax, Schneeberg, Schneealpe (I. Wiener Hochquellenleitung) and Hochschwab (II. Wiener
Hochquellenleitung); both systems have a total capacity of 437,000 m³ per day, on an average day, about
390,000 m³ are used by the City of Vienna;
- Waste water is collected and treated centrally, and cleaned in the “Zentralkläranlage Simmering”.
Waste water treatment is done on the basis of the Wasserrechtsgesetz providing for the latest state-of-the-art in abate-
ment technology. However, the Danube River is a heavily modified river (water body) after the regulation of the Da-
nube (“Wiener Donaudurchstich”, 1870-1875) in order to protect the city from regular floods. On average, the Danube
transports 1,700 m³ per second of water, while in dry periods, shipping may take place until a water load of 830 m³ p.s.
with a maximum load for shipping of 5,070 m³ p.s. Additionally, the “Donaukanal” (Danube Channel), a small side arm
of the river near to the city center, transports on average about 190 m³ p.s. (with a low of 70 m³ p.s. and a high of 200
Status report of the case study considering ERCB in the WFD: Austria
5
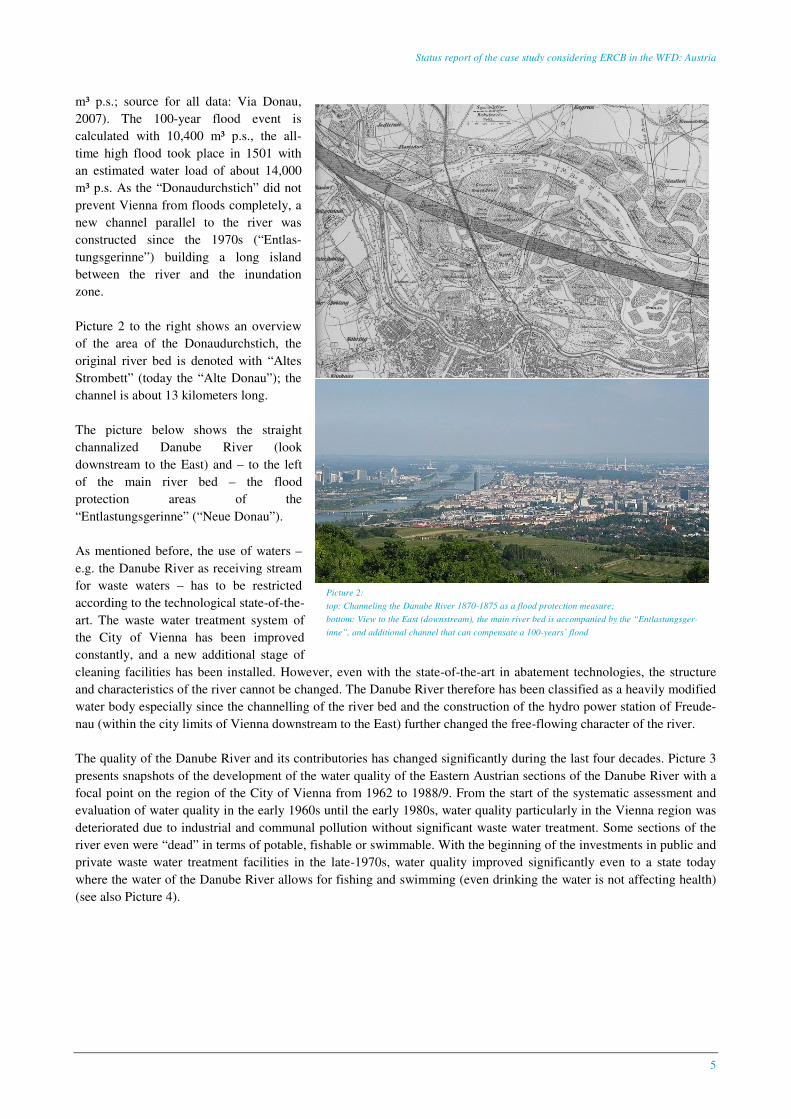
Picture 2:
top: Channeling the Danube River 1870-1875 as a flood protection measure;
bottom: View to the East (downstream), the main river bed is accompanied by the “Entlastungsger-
inne”, and additional channel that can compensate a 100-years’ flood
m³ p.s.; source for all data: Via Donau,
2007). The 100-year flood event is
calculated with 10,400 m³ p.s., the all-
time high flood took place in 1501 with
an estimated water load of about 14,000
m³ p.s. As the “Donaudurchstich” did not
prevent Vienna from floods completely, a
new channel parallel to the river was
constructed since the 1970s (“Entlas-
tungsgerinne”) building a long island
between the river and the inundation
zone.
Picture 2 to the right shows an overview
of the area of the Donaudurchstich, the
original river bed is denoted with “Altes
Strombett” (today the “Alte Donau”); the
channel is about 13 kilometers long.
The picture below shows the straight
channalized Danube River (look
downstream to the East) and – to the left
of the main river bed – the flood
protection areas of the
“Entlastungsgerinne” (“Neue Donau”).
As mentioned before, the use of waters –
e.g. the Danube River as receiving stream
for waste waters – has to be restricted
according to the technological state-of-the-
art. The waste water treatment system of
the City of Vienna has been improved
constantly, and a new additional stage of
cleaning facilities has been installed. However, even with the state-of-the-art in abatement technologies, the structure
and characteristics of the river cannot be changed. The Danube River therefore has been classified as a heavily modified
water body especially since the channelling of the river bed and the construction of the hydro power station of Freude-
nau (within the city limits of Vienna downstream to the East) further changed the free-flowing character of the river.
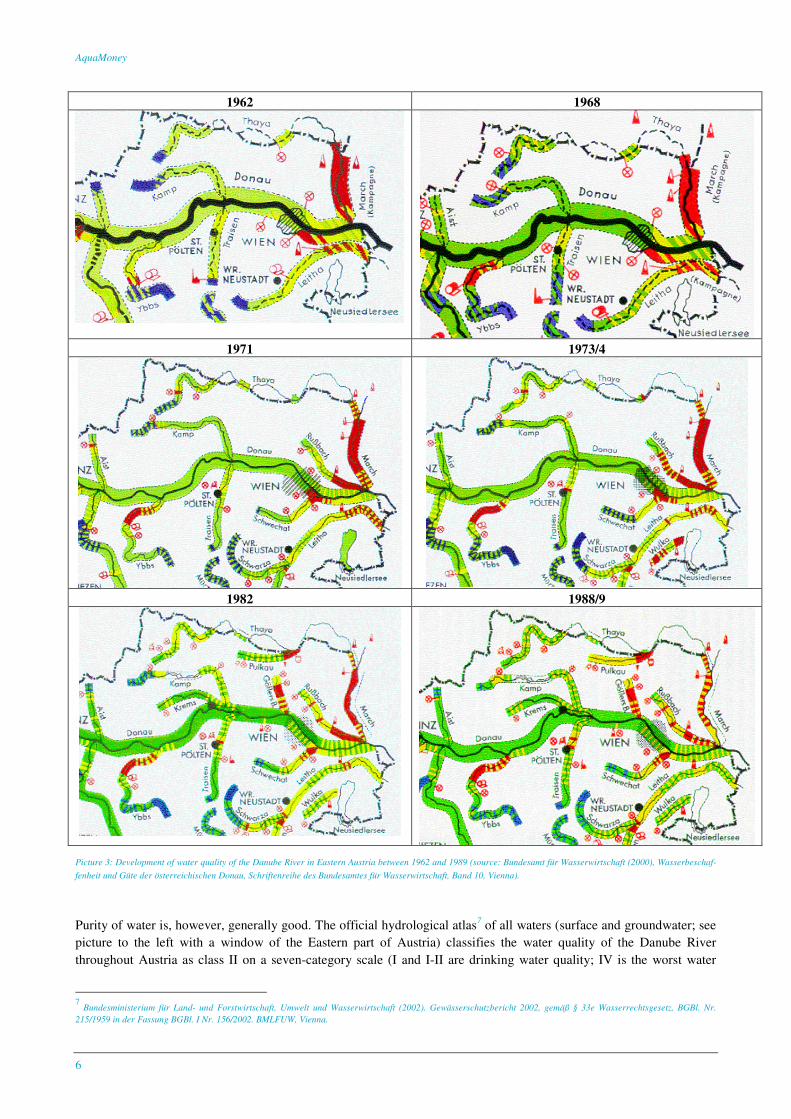
The quality of the Danube River and its contributories has changed significantly during the last four decades. Picture 3
presents snapshots of the development of the water quality of the Eastern Austrian sections of the Danube River with a
focal point on the region of the City of Vienna from 1962 to 1988/9. From the start of the systematic assessment and
evaluation of water quality in the early 1960s until the early 1980s, water quality particularly in the Vienna region was
deteriorated due to industrial and communal pollution without significant waste water treatment. Some sections of the
river even were “dead” in terms of potable, fishable or swimmable. With the beginning of the investments in public and
private waste water treatment facilities in the late-1970s, water quality improved significantly even to a state today
where the water of the Danube River allows for fishing and swimming (even drinking the water is not affecting health)
(see also Picture 4).
AquaMoney
6
Picture 3: Development of water quality of the Danube River in Eastern Austria between 1962 and 1989 (source: Bundesamt für Wasserwirtschaft (2000), Wasserbeschaf-
fenheit und Güte der österreichischen Donau, Schriftenreihe des Bundesamtes für Wasserwirtschaft, Band 10, Vienna).
Purity of water is, however, generally good. The official hydrological atlas7 of all waters (surface and groundwater; see
picture to the left with a window of the Eastern part of Austria) classifies the water quality of the Danube River
throughout Austria as class II on a seven-category scale (I and I-II are drinking water quality; IV is the worst water
7 Bundesministerium für Land- und Forstwirtschaft, Umwelt und Wasserwirtschaft (2002). Gewässerschutzbericht 2002, gemäß § 33e Wasserrechtsgesetz, BGBl. Nr.
215/1959 in der Fassung BGBl. I Nr. 156/2002. BMLFUW, Vienna.
1962 1968
1971 1973/4
1982 1988/9

Status report of the case study considering ERCB in the WFD: Austria
7
Picture 4: Water quality of Eastern Austrian surface waters; Source: Federal Ministry of Agri-
culture and Forestry, Environment and Water Management (2002)
Picture 5: Water quality of Eastern Austrian surface waters at 9 measuring spots ; Source: Federal Ministry of Agriculture and Forestry, Environment and Water
Management (2002)
quality category). The atlas also exhibits quality problems in the contributories of the Danube (Wienfluss and Liesing-
bach) that also influence the Donaukanal (Picture 5 and Picture 4). Picture 5 gives an overview of the development of
water quality measured on the 7-step water quality ladder; while even back in the 1960s and 1970s, at some spots up-
stream of Vienna, water quality of the Danube River was very good (dark green shade at the measurement spots in
Wien-Nußdorf, Wien-Leopoldstadt and Wien-Albern), the most significant problems occurred downstream of Vienna.
The spot Wien-Albern-Fischamend measures water quality at the estuary of the Donaukanal which carries the waste
water load of the City of Vienna to the Danube River. Due to enormous investments, the central cleaning facility of
Vienna has improved water quality significantly leading to a “green” water quality also downstream of Vienna (see also
Picture 9 and Table 1 on page 1).
Given the improved water quality, the Danube River has still problems with reaching a Good Ecological Status since
the river is heavily modified. However, even with the character of a heavily modified water body, there are important
protected areas along the Danube. The most
prominent, the Donauauen National Park
(about 9,700 hectares of wetlands), is also
located within the city limits of Vienna (about
2,500 hectares in an area called Lobau).
The basis for ERCB in the context of the
waste water treatment system of the City of
Vienna is therefore the GEP (Good Ecologi-
cal Potential) opposite to the GES (Good
Ecological Status). However, a recent map of
the Federal Ministry of Agriculture and For-
estry, Environment and Water Management
(2004)8 exhibits that the achievement of the
WFD aims along the Danube, in particular in
Vienna, is rather uncertain (Picture 6). The
map to the right denotes the main rivers (Da-
nube, Danaukanal, Wienfluss and Liesing-
8 Federal Ministry of Agriculture and Forestry, Environment and Water Management (2007). Risikoanalyse der Oberflächenwasserkörper in Hinblick auf eine mögliche
Zielverfehlung – Österreichischer Bericht der Ist-Bestandsaufnahme gemäß EU WRRL (§55k WRG 1959). BMLFUW, Vienna.
AquaMoney
8
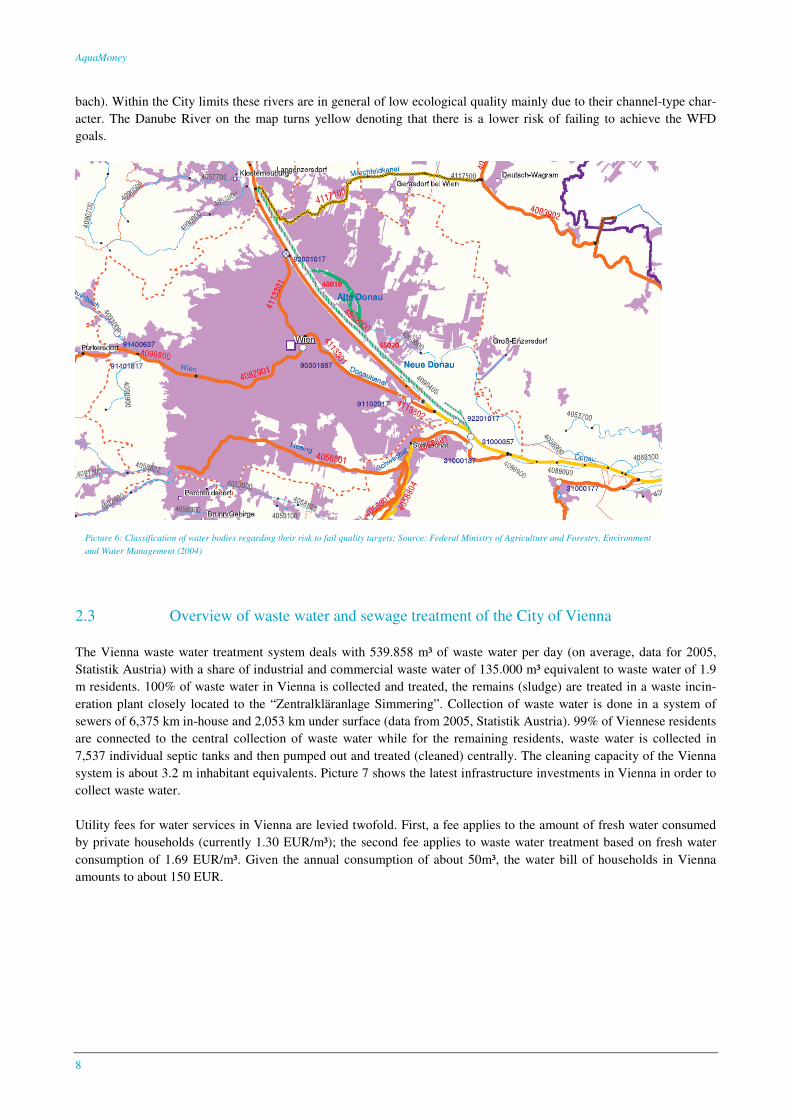
Picture 6: Classification of water bodies regarding their risk to fail quality targets; Source: Federal Ministry of Agriculture and Forestry, Environment
and Water Management (2004)
bach). Within the City limits these rivers are in general of low ecological quality mainly due to their channel-type char-
acter. The Danube River on the map turns yellow denoting that there is a lower risk of failing to achieve the WFD
goals.
2.3 Overview of waste water and sewage treatment of the City of Vienna
The Vienna waste water treatment system deals with 539.858 m³ of waste water per day (on average, data for 2005,
Statistik Austria) with a share of industrial and commercial waste water of 135.000 m³ equivalent to waste water of 1.9
m residents. 100% of waste water in Vienna is collected and treated, the remains (sludge) are treated in a waste incin-
eration plant closely located to the “Zentralkläranlage Simmering”. Collection of waste water is done in a system of
sewers of 6,375 km in-house and 2,053 km under surface (data from 2005, Statistik Austria). 99% of Viennese residents
are connected to the central collection of waste water while for the remaining residents, waste water is collected in
7,537 individual septic tanks and then pumped out and treated (cleaned) centrally. The cleaning capacity of the Vienna
system is about 3.2 m inhabitant equivalents. Picture 7 shows the latest infrastructure investments in Vienna in order to
collect waste water.
Utility fees for water services in Vienna are levied twofold. First, a fee applies to the amount of fresh water consumed
by private households (currently 1.30 EUR/m³); the second fee applies to waste water treatment based on fresh water
consumption of 1.69 EUR/m³. Given the annual consumption of about 50m³, the water bill of households in Vienna
amounts to about 150 EUR.
Status report of the case study considering ERCB in the WFD: Austria
9
8578 77 75
87
104
131
107 109103
107
134
116111
104 106
119
110 113107
93
182
102
116
0
20
40
60
80
100
120
140
160
180
200
1982 1983 1984 1985 1986 1987 1988 1989 1990 1991 1992 1993 1994 1995 1996 1997 1998 1999 2000 2001 2002 2003 2004 2005
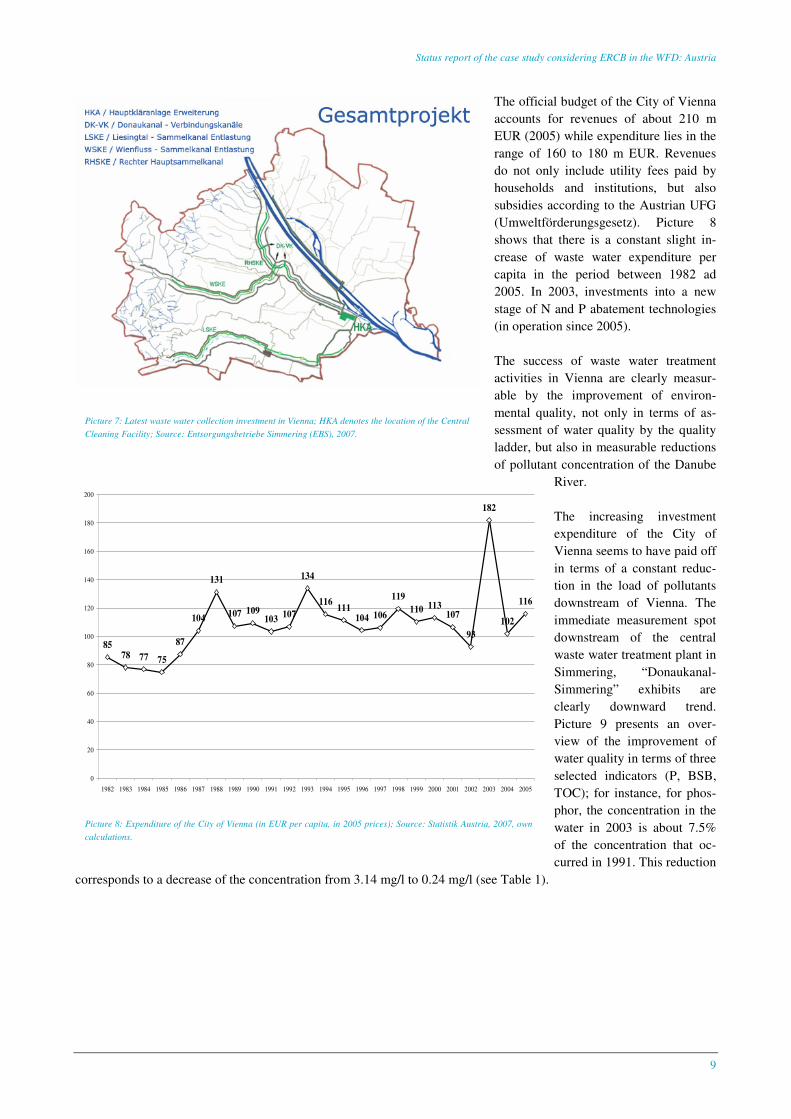
Picture 8: Expenditure of the City of Vienna (in EUR per capita, in 2005 prices); Source: Statistik Austria, 2007, own
calculations.
Picture 7: Latest waste water collection investment in Vienna; HKA denotes the location of the Central
Cleaning Facility; Source: Entsorgungsbetriebe Simmering (EBS), 2007.
The official budget of the City of Vienna
accounts for revenues of about 210 m
EUR (2005) while expenditure lies in the
range of 160 to 180 m EUR. Revenues
do not only include utility fees paid by
households and institutions, but also
subsidies according to the Austrian UFG
(Umweltförderungsgesetz). Picture 8
shows that there is a constant slight in-
crease of waste water expenditure per
capita in the period between 1982 ad
2005. In 2003, investments into a new
stage of N and P abatement technologies
(in operation since 2005).
The success of waste water treatment
activities in Vienna are clearly measur-
able by the improvement of environ-
mental quality, not only in terms of as-
sessment of water quality by the quality
ladder, but also in measurable reductions
of pollutant concentration of the Danube
River.
The increasing investment
expenditure of the City of
Vienna seems to have paid off
in terms of a constant reduc-
tion in the load of pollutants
downstream of Vienna. The
immediate measurement spot
downstream of the central
waste water treatment plant in
Simmering, “Donaukanal-
Simmering” exhibits are
clearly downward trend.
Picture 9 presents an over-
view of the improvement of
water quality in terms of three
selected indicators (P, BSB,
TOC); for instance, for phos-
phor, the concentration in the
water in 2003 is about 7.5%
of the concentration that oc-
curred in 1991. This reduction
corresponds to a decrease of the concentration from 3.14 mg/l to 0.24 mg/l (see Table 1).
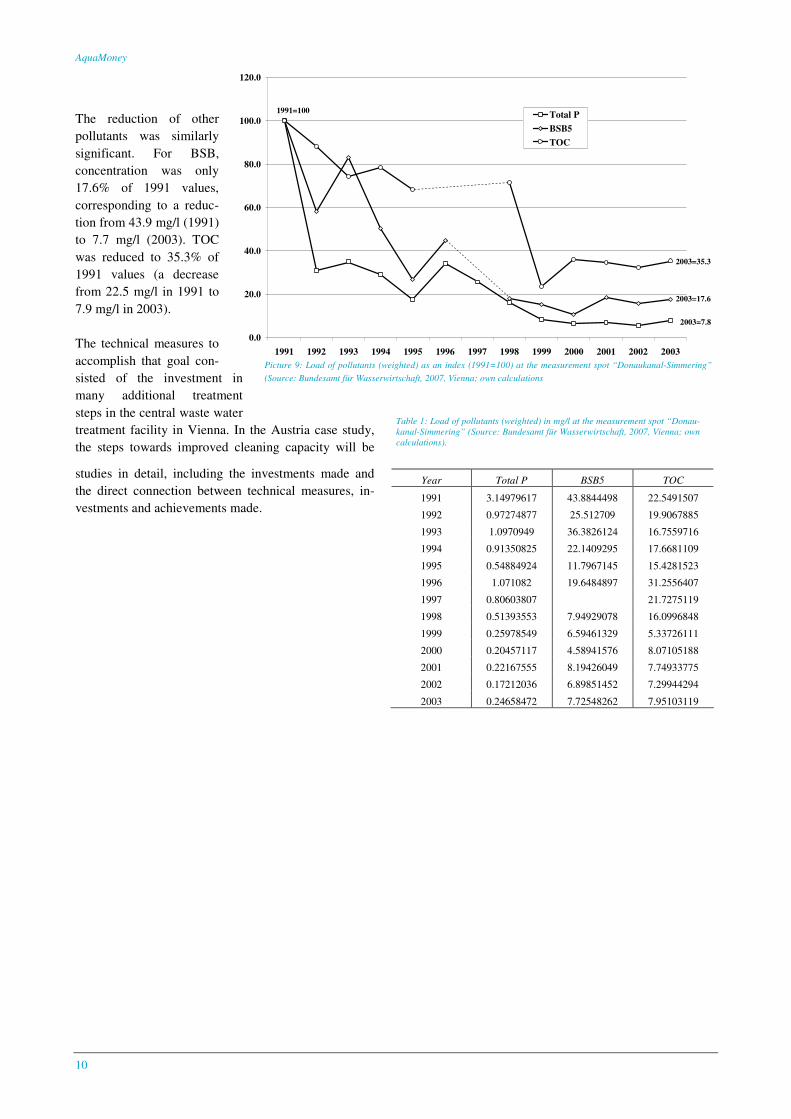
AquaMoney
10
Table 1: Load of pollutants (weighted) in mg/l at the measurement spot “Donau-kanal-Simmering” (Source: Bundesamt für Wasserwirtschaft, 2007, Vienna; own calculations).
Picture 9: Load of pollutants (weighted) as an index (1991=100) at the measurement spot “Donaukanal-Simmering”
(Source: Bundesamt für Wasserwirtschaft, 2007, Vienna; own calculations
Year Total P BSB5 TOC
1991 3.14979617 43.8844498 22.5491507
1992 0.97274877 25.512709 19.9067885
1993 1.0970949 36.3826124 16.7559716
1994 0.91350825 22.1409295 17.6681109
1995 0.54884924 11.7967145 15.4281523
1996 1.071082 19.6484897 31.2556407
1997 0.80603807 21.7275119
1998 0.51393553 7.94929078 16.0996848
1999 0.25978549 6.59461329 5.33726111
2000 0.20457117 4.58941576 8.07105188
2001 0.22167555 8.19426049 7.74933775
2002 0.17212036 6.89851452 7.29944294
2003 0.24658472 7.72548262 7.95103119
The reduction of other
pollutants was similarly
significant. For BSB,
concentration was only
17.6% of 1991 values,
corresponding to a reduc-
tion from 43.9 mg/l (1991)
to 7.7 mg/l (2003). TOC
was reduced to 35.3% of
1991 values (a decrease
from 22.5 mg/l in 1991 to
7.9 mg/l in 2003).
The technical measures to
accomplish that goal con-
sisted of the investment in
many additional treatment
steps in the central waste water
treatment facility in Vienna. In the Austria case study,
the steps towards improved cleaning capacity will be
studies in detail, including the investments made and
the direct connection between technical measures, in-
vestments and achievements made.
0.0
20.0
40.0
60.0
80.0
100.0
120.0
1991 1992 1993 1994 1995 1996 1997 1998 1999 2000 2001 2002 2003
Total P
BSB5
TOC
1991=100
2003=7.8
2003=17.6
2003=35.3
Status report of the case study considering ERCB in the WFD: Austria
11
2.4 Valuation of ERCB in the Austrian case study
The valuation objective in the Austrian case study is to value environmental and resource costs and benefits (ERCB)
given the ecological status of the Danube River, and to explore the range of economic values that are currently secured
by the centralized waste water treatment system of Vienna. Given the heavily modified character of the Danube River
and some of its contributaries (Wienfluss, Donaukanal, Liesingbach), and the legal obligation to account for the latest
state-of-the-art in abatement technology, the case study will explore
- whether additional technical measures could be undertaken to further reduce the pollution load of the City of
Vienna,
- the possibilities to value the full range of ERCB along the Danube River and the potential influence of the
waste water system of Vienna, and
- the range of ERCB based on replacement and abatement (defensive) cost accounting as one central valuation
tool in the current context.
Based on the valuation of ERCB, the study will further show whether there will be room for designing an incentive-
compatible system of utility fees. Special emphasis will be laid on the issue of full-cost recovery, and the importance of
ERCB in calculating utility fees according to the polluter-pays principle (internalization of external costs).
The main valuation method will be based on the full costs of abatement technologies (avertive behavior – defensive
expenditure – avoidance costs). For the different stages of cleaning technologies, costs of investment and maintenance
will be studies. Special emphasis will be laid on the issue of full costs on which utility fees are based. According to the
Austrian regulations on fiscal federalism, communities may base their calculation of utility fees on their expenditure
that in cases may be substantially reduced by federal subsidies. Levying utility fees on subsidized expenditure therefore
does not include the full costs of a facility, and therefore, communities may depend on subsidies when they add more
technologically advanced equipment to their sewage plants.
The chosen methodology (defensive expenditure) is theoretically correct regarding the “valuation” of ERCB in particu-
lar in the context of the WFD since technologies and costs are known or may be derived by the actual expenditure un-
dertaken by the City of Vienna.
Regarding the calculation of investment and maintenance cost, there are time series data of all relevant expenditure
including technological information in cleaning plants, sewage load, sludge treatment and load of pollutants remaining
after cleaning the waste water.
This case study status report has shown that the improvements in water quality are clearly measurable. A minor meth-
odological problem will be the selection of the quality measure (e.g. water quality ladder, aggregation and/or weighting
of different pollutants and their reduction).
At the moment, it is not clear whether there will be a study eliciting primary values of the Viennese population regard-
ing residents’ willingness to pay for waste water treatment services, and their perception of water quality of the Danube
River and its side-arms. If a contingent valuation or choice experiment study will be carried out, it will include two
jointly drafted parts.
- a CE (choice experiment) study on the Viennese households’ WTP (willingness to pay) for different water
qualities of the Danube River (comparable to study areas of other Aquamoney case studies);
- a CV (contingent valuation) study on the Viennese households’ WTP for river restoration projects.
Currently, the possibilities for a representative survey are being explored.
Environmental values to be considered in the Austrian case study will refer mainly to use values related with the re-
duction of pollutants in the downstream water bodies (Danube River and accompanying wetlands.
Potential use values include
- consumptive use values (drinking water);
AquaMoney
12
- recreational values (fishing, boating).
These use values will be assessed by establishing a connection between water quality of the Danube River, the potential
impacts of the Vienna waste water treatment system (abatement of pollutants), and the potentials for using the Danube
River for various purposes that depend on the water quality. Transports on ships will not be considered as the water
quality is not affected – does not affect shipping.
Indirect use values include the potential for removal of pollutants that is enhanced by a increased water quality of the
Danube River.
Finally, it will be discussed whether water quality will affect non-use values, in particular regarding the water quality in
the Donauauen National Park (e.g. existence values). It is questionable whether such non-use values are touched by the
Viennese system since the main issue of the Donauauen wetlands is the dynamics of a free-flowing river. Therefore, the
quantity of waters and flood dynamics is a crucial ingredient for the functioning of wetlands, water quality only plays a
minor role.
The target groups of the Austrian case study will consist of academics, decision makers in communal and federal au-
thorities, as well as the general public.
- There are a number of studies dealing with costs of waste water treatment systems in Austria. However, the
ERCB haven’t been calculated up to now. Therefore the case study will be of interest to academics working in
particular in the water management field (e.g. Vienna University of Agriculture and Life Sciences; Vienna
University of Technology).
- Decision makers in the City of Vienna will be interested to learn about the calculation of ERCB of the largest
waste water treatment system in Austria, and the consequences for calculating utility fees (this is also a sensi-
tive political issue for the Viennese City Council).
- Decision makers in federal authorities have already exhibited their interest on Aquamoney, and will therefore
receive the final report including the finalized Aquamoney guidelines.
- Finally, the general public will be interested in understanding the potentially important role of the WFD in
general and ERCB in particular.
A number of valuation scenarios will be designed in relation to ERCB & WFD, in particular regarding the technologi-
cal feasibility of further improving the cleaning capacity of the sewage treatment system of Vienna. As the valuation of
ERCB depends crucially on the definition of the GES/GEP, special emphasis will be laid on the relevant benchmark for
calculating ERCB. The remaining loads of pollutants after sewage cleaning will also be studied in order to derive reli-
able estimates of the environmental impacts.
Regarding the spatial implementation, the main focus will be the City of Vienna and the Danube River downstream
from the city. As discussed before, the waste water load of the city of Vienna is probably not the main problem for
water quality of the Danube River because some contributaries exhibit a rather low water quality. Therefore, the case
study will also include a short discussion of the spatial distribution of environmental impacts. Furthermore, downstream
Austrian communities as well, of course, countries such as Hungary and Romania, will be affected by Austrian abate-
ment activities. In order to highlight the potential impacts, it will be discussed whether the use of groundwater for drink-
ing water purposes alongside the Danube River will be affected, and how much technologies would hypothetically cost
to secure a sound use of groundwaters for drinking purposes.
A number of methodological tests will be used, in particular by using benchmarks for abatement costs of waste water
treatment plants. Furthermore, it will be discussed and tested whether the approach of measuring ERCB by the abate-
ment expenditure approach will be useful, and how much information might this approach in general carry.
One of the crucial issues in the current context is the question whether values can be transferred from other sites (e.g.
European cities with a comparable size and problem setting).
Status report of the case study considering ERCB in the WFD: Austria
13
The aggregation and use of GIS (feasibility of a GIS based value map) will not be central working step in the Austrian
case study.
Planning of activities and their timing
The next steps of the Austrian case study include
- establishment of a working base with the City Department 31 (Waste Water Collection and Treatment);
- collection of all relevant hydrological and environmental data;
- collection of technical data on the central cleaning facility;
- calculation of the full costs of collection, treatment and cleaning of Vienna’s sewage;
- discussion of the impacts of cleaning costs (valuation of ERCB) on the utility fees in Vienna;
- exploration of possibilities to conduct a representative household survey to explore the WTP for water quality
of the Danube River and of river restoration projects in Austria.
The case study will be worked on during spring 2007, and will lead to results already in early summer 2007.
Problems encountered so far
Delays of the current report were due to
- slow response to the policy makers’ demand survey, that clarified the Austrian position and influenced the
choice of the case study significantly; and
- the hesitation of the City of Vienna to provide crucial data for the current case study.
Available studies/information on cost/benefits
There is only one comprehensive study of the costs of waste water treatment of the City of Vienna (Kosz, 1997). Some
of the data in this study will be used; however, the study relies on data from 1945 to mid-1990s, but many new techno-
logical developments have lead to further treatment and cleaning activities. Therefore, economic data may have to be
collected newly at least for the last decade.
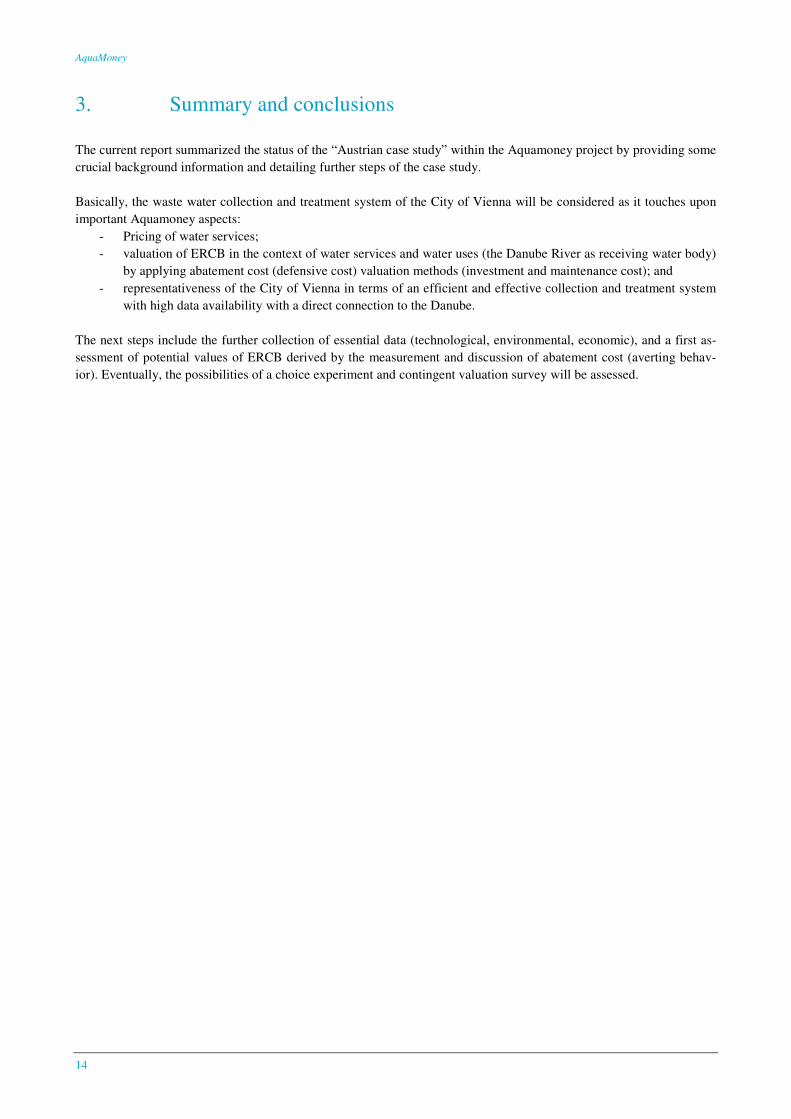
AquaMoney
14
3. Summary and conclusions
The current report summarized the status of the “Austrian case study” within the Aquamoney project by providing some
crucial background information and detailing further steps of the case study.
Basically, the waste water collection and treatment system of the City of Vienna will be considered as it touches upon
important Aquamoney aspects:
- Pricing of water services;
- valuation of ERCB in the context of water services and water uses (the Danube River as receiving water body)
by applying abatement cost (defensive cost) valuation methods (investment and maintenance cost); and
- representativeness of the City of Vienna in terms of an efficient and effective collection and treatment system
with high data availability with a direct connection to the Danube.
The next steps include the further collection of essential data (technological, environmental, economic), and a first as-
sessment of potential values of ERCB derived by the measurement and discussion of abatement cost (averting behav-
ior). Eventually, the possibilities of a choice experiment and contingent valuation survey will be assessed.