Minimum Spanning Trees Prim’s Algorithm Kruskal’s Algorithm Wed, July 9th.

sixteen Kruskal’s Algorithm
CS16.1 Application Overview and Model Development CS16.2 Worksheets CS16.3 User Interface CS16.4 Procedures CS16.5 Re-solve Options CS16.6 Summary CS16.7 Extensions
case study OVERVIEW
CASE STUDY
CASE STUDY 16 Kruskal’s Algorithm
2
CS16.1 Application Overview and Model Development
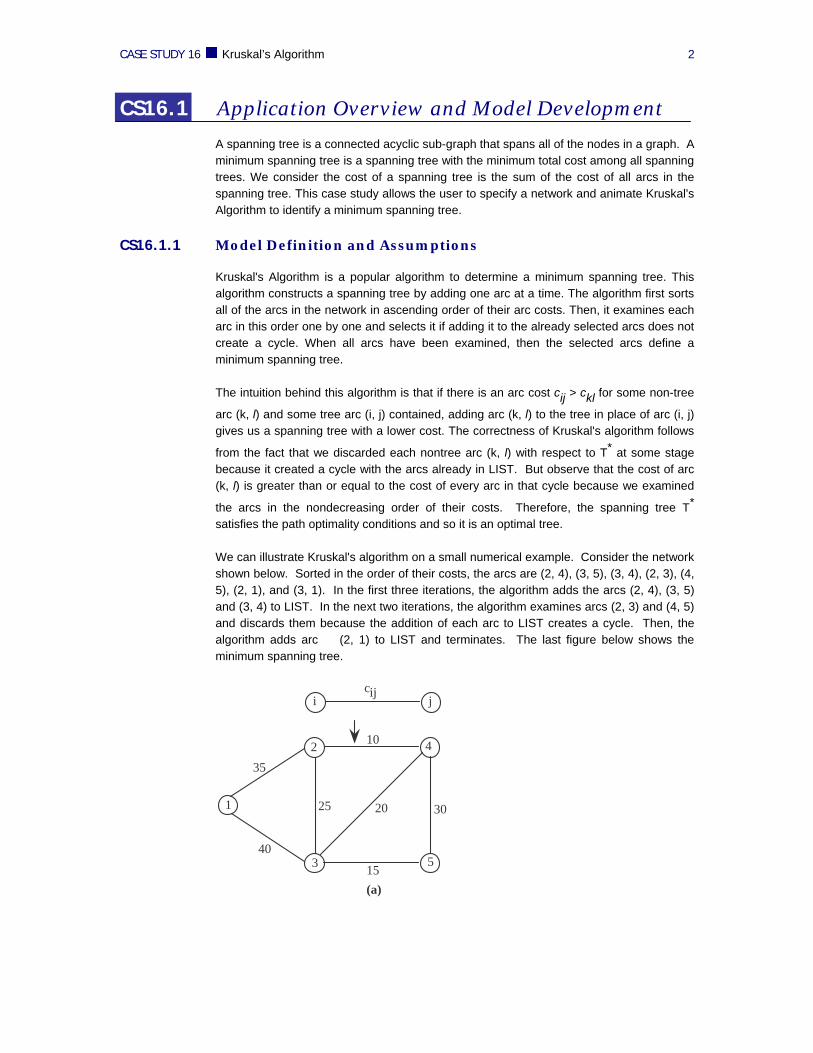
A spanning tree is a connected acyclic sub-graph that spans all of the nodes in a graph. A minimum spanning tree is a spanning tree with the minimum total cost among all spanning trees. We consider the cost of a spanning tree is the sum of the cost of all arcs in the spanning tree. This case study allows the user to specify a network and animate Kruskal's Algorithm to identify a minimum spanning tree.
CS16.1.1 Model Definition and Assumptions
Kruskal's Algorithm is a popular algorithm to determine a minimum spanning tree. This algorithm constructs a spanning tree by adding one arc at a time. The algorithm first sorts all of the arcs in the network in ascending order of their arc costs. Then, it examines each arc in this order one by one and selects it if adding it to the already selected arcs does not create a cycle. When all arcs have been examined, then the selected arcs define a minimum spanning tree. The intuition behind this algorithm is that if there is an arc cost cij > ckl for some non-tree
arc (k, l) and some tree arc (i, j) contained, adding arc (k, l) to the tree in place of arc (i, j) gives us a spanning tree with a lower cost. The correctness of Kruskal's algorithm follows
from the fact that we discarded each nontree arc (k, l) with respect to T* at some stage because it created a cycle with the arcs already in LIST. But observe that the cost of arc (k, l) is greater than or equal to the cost of every arc in that cycle because we examined
the arcs in the nondecreasing order of their costs. Therefore, the spanning tree T* satisfies the path optimality conditions and so it is an optimal tree. We can illustrate Kruskal's algorithm on a small numerical example. Consider the network shown below. Sorted in the order of their costs, the arcs are (2, 4), (3, 5), (3, 4), (2, 3), (4, 5), (2, 1), and (3, 1). In the first three iterations, the algorithm adds the arcs (2, 4), (3, 5) and (3, 4) to LIST. In the next two iterations, the algorithm examines arcs (2, 3) and (4, 5) and discards them because the addition of each arc to LIST creates a cycle. Then, the algorithm adds arc (2, 1) to LIST and terminates. The last figure below shows the minimum spanning tree.
1
2
3
4
5
35
10
30
15
25
40
20
cij
(a)
i j

CASE STUDY 16 Kruskal’s Algorithm
3
(b)
1
2
3
4
5
35
10
30
15
25
40
201
2
3
4
5
35
10
30
15
25
40
20
(c)
1
2
3
4
5
35
10
30
15
25
40
20
(d)
1
2
3
4
5
35
10
30
15
25
40
20
(e)
1
2
3
4
5
35
10
30
15
25
40
20
(f)
1
2
3
4
5
35
10
30
15
25
40
20
(g)
We assume that the user creates their network and tells us the number of nodes and arcs they have created. We also ask the user to complete a table listing all of the arcs in the network, the nodes they connect, and their arc cost. We use this table to sort the arcs in ascending order of their arc costs. We can then use the node pairs for each listed arc to determine whether or not a cycle would be created if an arc was added to the tree.
For more information about Kruskal's algorithm, please refer to the book Network Flows: Theory, Algorithm, and Applications by Ahuja, Magnanti, and Orlin.
CS16.1.2 Input
The input for this application is primarily the network that the user creates. Number of nodes and arcs in the network Node pairs for each arc Arc costs

CASE STUDY 16 Kruskal’s Algorithm
4
CS16.1.3 Output
The output for this application is the minimum spanning tree. Which arcs are in and out of the minimum spanning tree. The total spanning tree cost.
CS16.2 Worksheets
We use three worksheets in this application: the welcome sheet, an example sheet, and the network sheet. The welcome sheet has the title and description of the application as well as an image (see Figure CS16.1). There are two buttons on this sheet: “Run Demo” and “Start Program”. Both buttons will bring the user to the network sheet.
Figure CS16.1 The welcome sheet.
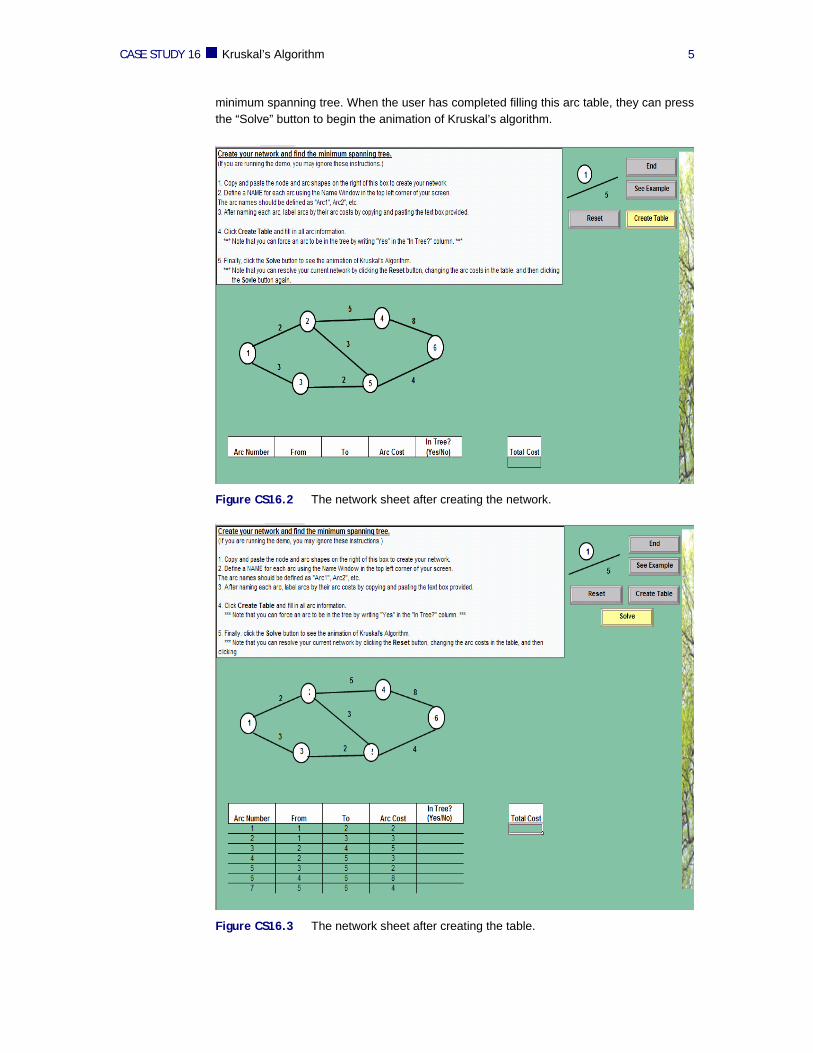
The network sheet is the main sheet of the application (see Figure CS16.2). Detailed directions are given to the user at the top of this sheet on how to create their network and how to fill in the table with arc information. The user begins by creating their network. They can copy and paste the node and arc images to create the network in the area above the table. They can also copy and paste the text box to label their arcs with the arc costs. The user must also name each arc using Excel’s name window. This visual information is for the animation of Kruskal’s algorithm. When the user is done creating the network, they will press the “Create Table” button. This button will then prompt them with a user form to ask for the number of nodes and arcs in the network they have just created. A table will then be drawn on the sheet for the user to provide the arc information (see Figure CS16.3). This information includes the arc number, node pair that the arc connects, and arc cost. The last column in the table will be used by the application to display to the user which arcs are in and out of the final
CASE STUDY 16 Kruskal’s Algorithm
5
minimum spanning tree. When the user has completed filling this arc table, they can press the “Solve” button to begin the animation of Kruskal’s algorithm.
Figure CS16.2 The network sheet after creating the network.
Figure CS16.3 The network sheet after creating the table.
CASE STUDY 16 Kruskal’s Algorithm
6
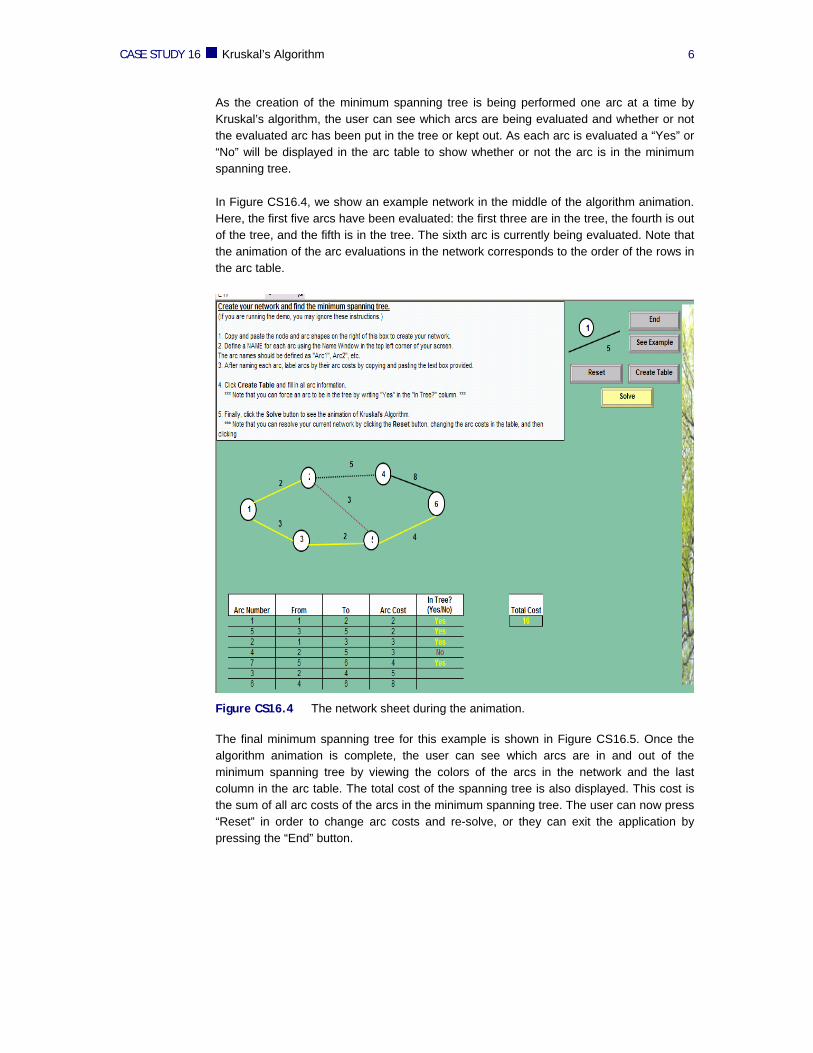
As the creation of the minimum spanning tree is being performed one arc at a time by Kruskal’s algorithm, the user can see which arcs are being evaluated and whether or not the evaluated arc has been put in the tree or kept out. As each arc is evaluated a “Yes” or “No” will be displayed in the arc table to show whether or not the arc is in the minimum spanning tree.
In Figure CS16.4, we show an example network in the middle of the algorithm animation. Here, the first five arcs have been evaluated: the first three are in the tree, the fourth is out of the tree, and the fifth is in the tree. The sixth arc is currently being evaluated. Note that the animation of the arc evaluations in the network corresponds to the order of the rows in the arc table.
Figure CS16.4 The network sheet during the animation.
The final minimum spanning tree for this example is shown in Figure CS16.5. Once the algorithm animation is complete, the user can see which arcs are in and out of the minimum spanning tree by viewing the colors of the arcs in the network and the last column in the arc table. The total cost of the spanning tree is also displayed. This cost is the sum of all arc costs of the arcs in the minimum spanning tree. The user can now press “Reset” in order to change arc costs and re-solve, or they can exit the application by pressing the “End” button.

CASE STUDY 16 Kruskal’s Algorithm
7
Figure CS16.5 The network sheet with the final solution.
The example sheet is available to the user if they press the “See Example” button on the network sheet. The example sheet has an example network and completed arc table (see Figure CS16.6). This sheet is used to guide the user in creating their own network and filling in their own arc table. The user can press the “Return to Network Sheet” button to return to the network sheet. The data on this sheet is also used for running the demo of the application.
Figure CS16.6 The example sheet.
Welcome sheet Application description and “Start” button.
Network sheet The main sheet in which the user creates their network, completes a table of arc information, and runs the algorithm animation.
Example sheet An example network and completed arc table are available to user for guidance; this information is also used to run the demo.
Summary

CASE STUDY 16 Kruskal’s Algorithm
8
CS16.3 User Interface
For this application, we use navigational and functional buttons as well as one user form for the user interface. On the welcome sheet, there are two buttons: “Run Demo” and “Start Program”. Both buttons take the user to the network sheet, but if the “Run Demo” button was pushed then the network will already be created. When the user presses the “Create Table” button, the user form appears to prompt them for the number of nodes and arcs in the network they have created (see Figure CS16.7). If the demo is run and the network was already created for the user, then this form is not shown.
Figure CS16.7 The input form.
The remainder of the interface includes the functional buttons “Solve” and “Reset” as well as the navigational buttons “See Example”, “Return to Network Sheet”, and “End”. Some formatting is done to highlight the button which should be pressed at the necessary time. This is another clarification tool incorporated in the user interface.
CS16.4 Procedures
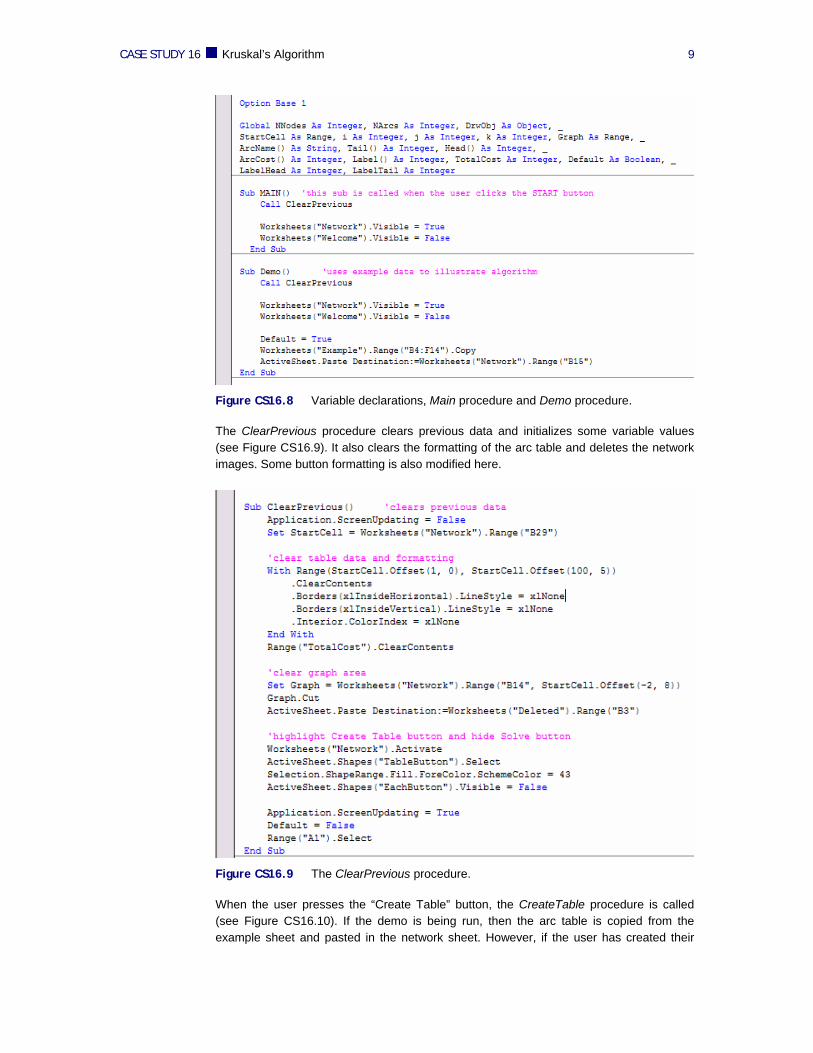
We will now outline the procedures for this application. We begin with the initial sub procedures and variable definitions (see Figure CS16.8). The Main procedure, assigned to the “Start Program” button, calls the ClearPrevious procedure and takes the user to the network sheet. The Demo procedure, assigned to the “Run Demo” button, calls the ClearPrevious procedure, takes the user to the network sheet, and copies the network from the example sheet to the network sheet.
Navigational Buttons “Run Demo” and “Start Program” buttons on welcome sheet; “See Example” and “End” buttons on the network sheet; “Return to Network Sheet” on the example sheet.
Functional Buttons “Create Table”, “Solve”, and “Reset” buttons on the network sheet.
Input user form User specifies number of nodes and arcs in the network they have created.
Summary
CASE STUDY 16 Kruskal’s Algorithm
9
Figure CS16.8 Variable declarations, Main procedure and Demo procedure.
The ClearPrevious procedure clears previous data and initializes some variable values (see Figure CS16.9). It also clears the formatting of the arc table and deletes the network images. Some button formatting is also modified here.
Figure CS16.9 The ClearPrevious procedure.
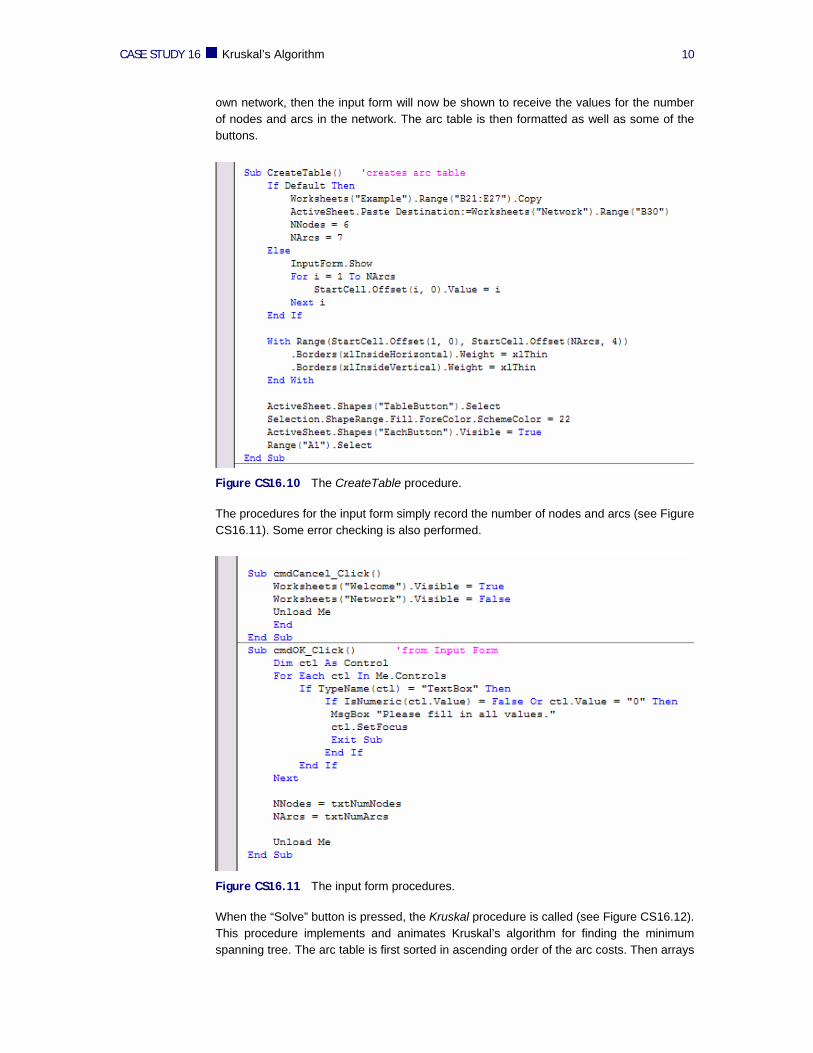
When the user presses the “Create Table” button, the CreateTable procedure is called (see Figure CS16.10). If the demo is being run, then the arc table is copied from the example sheet and pasted in the network sheet. However, if the user has created their
CASE STUDY 16 Kruskal’s Algorithm
10
own network, then the input form will now be shown to receive the values for the number of nodes and arcs in the network. The arc table is then formatted as well as some of the buttons.
Figure CS16.10 The CreateTable procedure.
The procedures for the input form simply record the number of nodes and arcs (see Figure CS16.11). Some error checking is also performed.
Figure CS16.11 The input form procedures.
When the “Solve” button is pressed, the Kruskal procedure is called (see Figure CS16.12). This procedure implements and animates Kruskal’s algorithm for finding the minimum spanning tree. The arc table is first sorted in ascending order of the arc costs. Then arrays

CASE STUDY 16 Kruskal’s Algorithm
11
are populated with the arc names, tail nodes and head nodes (or node pairs), and arc costs from the arc table. A labeling array is initialized; it will be used to check for cycles as the spanning tree is created.
Figure CS16.12 The Kruskal procedure.
The algorithm then simply checks the label array for each arc in its sorted order to determine whether or not a cycle would be created if it were added to the spanning tree. If no cycle would be created then it is added to the tree by calling the InTree function. If a cycle would be created, then it cannot be put in the tree and the OutTree function is called. We will discuss later why we check for arcs which are forced in the spanning tree (see Section CS23.5).
The InTree function updates the label array used in the algorithm and then animates the network (see Figure CS16.13). The animation changes the current arc format to dashed, pauses using the Wait method, and then changes the color of the arc to show that it is in the tree. The OutTree function also animates the network (see Figure CS16.14). The animation changes the current arc format to dashed, pauses using the Wait method, and then changes the color of the arc to show that it is not in the tree.

CASE STUDY 16 Kruskal’s Algorithm
12
Figure CS16.13 The InTree function.
Figure CS16.14 The OutTree function.
The navigational procedures are used for the “End”, “Show Example” and “Return to Network Sheet” buttons (see Figure CS16.15).
Figure CS16.15 The Navigational procedures.
CASE STUDY 16 Kruskal’s Algorithm
13
CS16.5 Re-solve Options
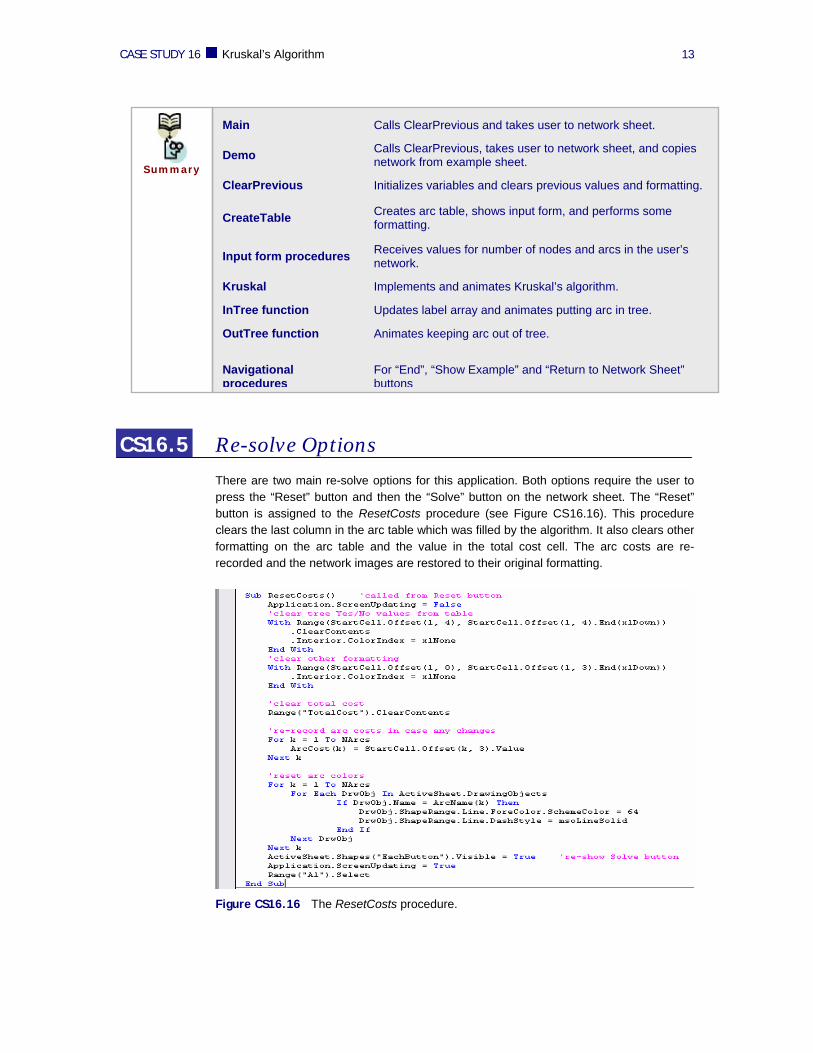
There are two main re-solve options for this application. Both options require the user to press the “Reset” button and then the “Solve” button on the network sheet. The “Reset” button is assigned to the ResetCosts procedure (see Figure CS16.16). This procedure clears the last column in the arc table which was filled by the algorithm. It also clears other formatting on the arc table and the value in the total cost cell. The arc costs are re-recorded and the network images are restored to their original formatting.
Figure CS16.16 The ResetCosts procedure.
Main Calls ClearPrevious and takes user to network sheet.
Demo Calls ClearPrevious, takes user to network sheet, and copies network from example sheet.
ClearPrevious Initializes variables and clears previous values and formatting.
CreateTable Creates arc table, shows input form, and performs some formatting.
Input form procedures Receives values for number of nodes and arcs in the user’s network.
Kruskal Implements and animates Kruskal’s algorithm.
InTree function Updates label array and animates putting arc in tree.
OutTree function Animates keeping arc out of tree.
Navigational procedures
For “End”, “Show Example” and “Return to Network Sheet” buttons
Summary
CASE STUDY 16 Kruskal’s Algorithm
14
After pressing the “Reset” button and before pressing the “Solve” button to re-run Kruskal’s algorithm, the user can use either or both of the two re-solve options. The first option is for the user to modify the arc costs and see how it affects the minimum spanning tree. That is, if some arc costs are changed, when the algorithm is implemented and the arcs are sorted and cycles are checked, the resulting minimum spanning tree may differ from the original result.
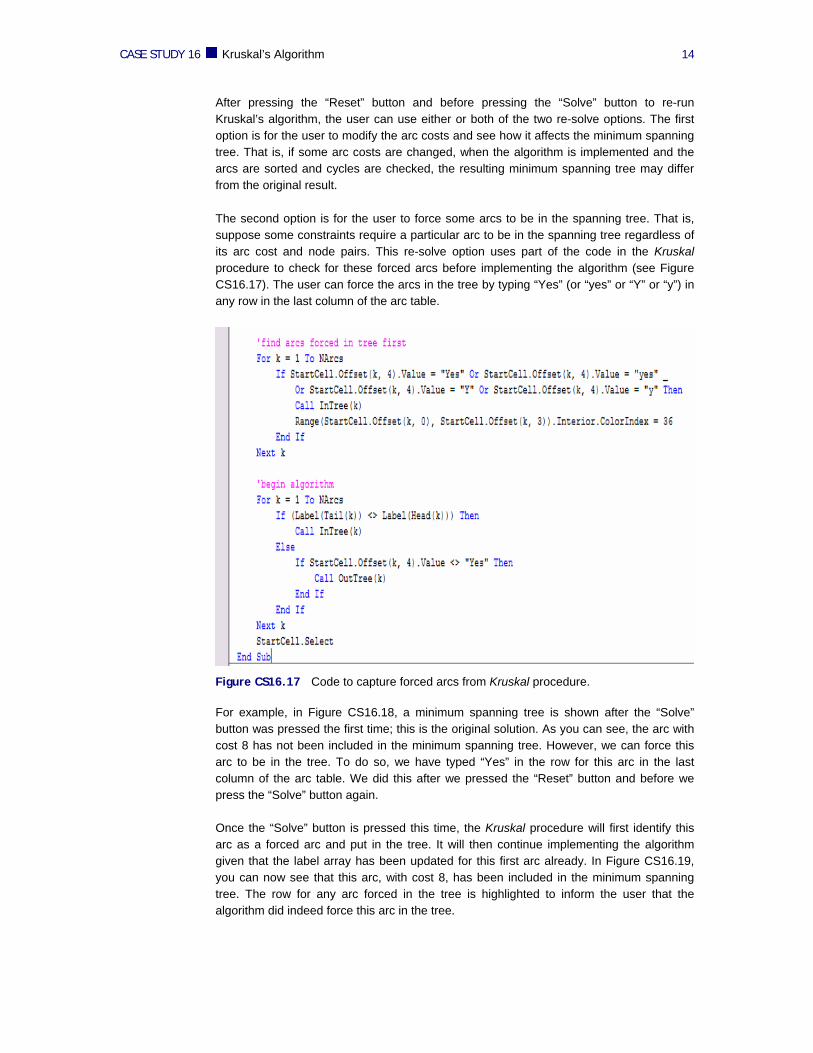
The second option is for the user to force some arcs to be in the spanning tree. That is, suppose some constraints require a particular arc to be in the spanning tree regardless of its arc cost and node pairs. This re-solve option uses part of the code in the Kruskal procedure to check for these forced arcs before implementing the algorithm (see Figure CS16.17). The user can force the arcs in the tree by typing “Yes” (or “yes” or “Y” or “y”) in any row in the last column of the arc table.
Figure CS16.17 Code to capture forced arcs from Kruskal procedure.
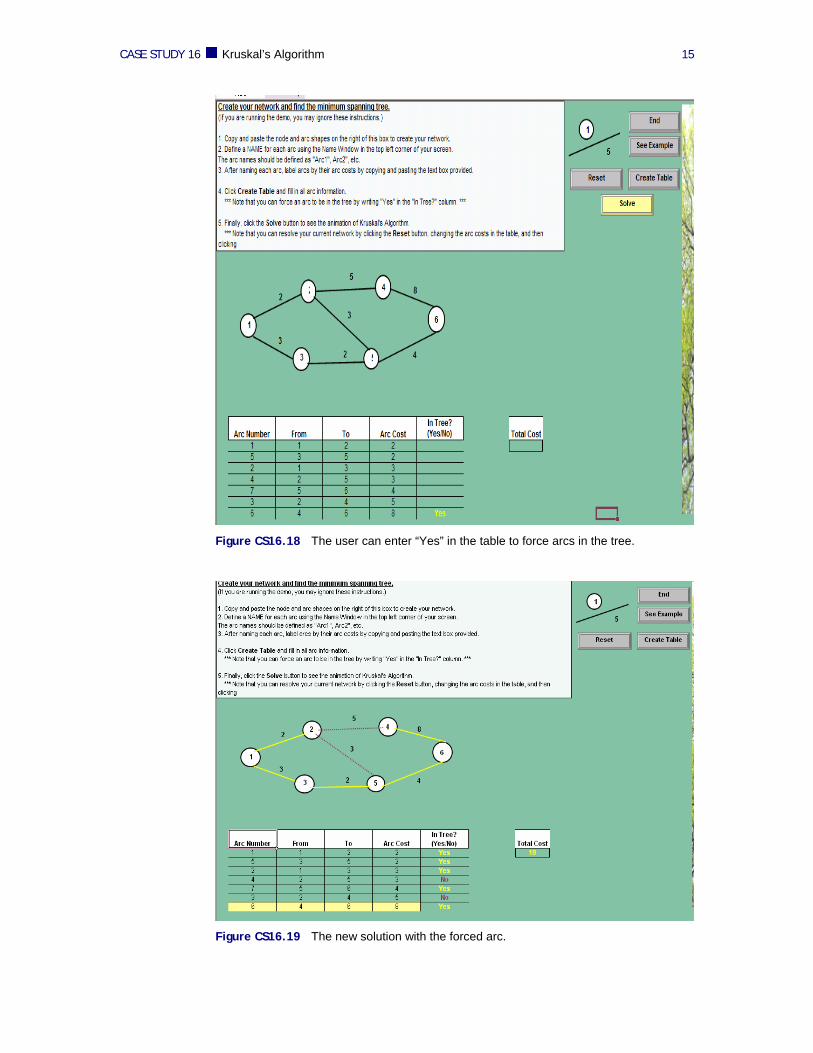
For example, in Figure CS16.18, a minimum spanning tree is shown after the “Solve” button was pressed the first time; this is the original solution. As you can see, the arc with cost 8 has not been included in the minimum spanning tree. However, we can force this arc to be in the tree. To do so, we have typed “Yes” in the row for this arc in the last column of the arc table. We did this after we pressed the “Reset” button and before we press the “Solve” button again. Once the “Solve” button is pressed this time, the Kruskal procedure will first identify this arc as a forced arc and put in the tree. It will then continue implementing the algorithm given that the label array has been updated for this first arc already. In Figure CS16.19, you can now see that this arc, with cost 8, has been included in the minimum spanning tree. The row for any arc forced in the tree is highlighted to inform the user that the algorithm did indeed force this arc in the tree.
CASE STUDY 16 Kruskal’s Algorithm
15
Figure CS16.18 The user can enter “Yes” in the table to force arcs in the tree.
Figure CS16.19 The new solution with the forced arc.

CASE STUDY 16 Kruskal’s Algorithm
16
CS16.6 Summary
This case study allows the user to specify a network and animate Kruskal's Algorithm to identify a minimum spanning tree.
We use three worksheets in this application: the welcome sheet, an example sheet, and the network sheet.
For this application, we use navigational and functional buttons as well as one user form for the user interface.
There are several procedures for this application which implement and animate Kruskal’s algorithm.
The user can re-solve the application by using the “Reset” and “Solve” buttons on the network sheet. They can change arc costs or force arcs to be in the spanning tree.
CS16.7 Extensions
Allow user to also be able to change other network information before resolving. For example, you should be able to record not only new arc costs, but also new arcs and new nodes.
Design an alternative user interface for all of the options available to the user on the network sheet.
Add a procedure which automatically draws the network after the user enters the number of nodes and arcs.
Modify this application to implement and animate Prim’s algorithm for finding a minimum spanning tree. (Refer to Network Flows: Theory, Algorithm, and Applications by Ahuja, Magnanti, and Orlin.)
Modify this application to implement and animate Sollin’s algorithm for finding a minimum spanning tree. (Refer to Network Flows: Theory, Algorithm, and Applications by Ahuja, Magnanti, and Orlin.)
“Reset” and “Solve” buttons
These buttons allow the user to user either or both of the re-solve options.
Changing arc costs The user can change arc costs and re-solve.
Forcing arcs in tree The user can force some arcs to be in the spanning tree and then re-solve.
Summary