Case study on the rice value chain in the Republic of India
58
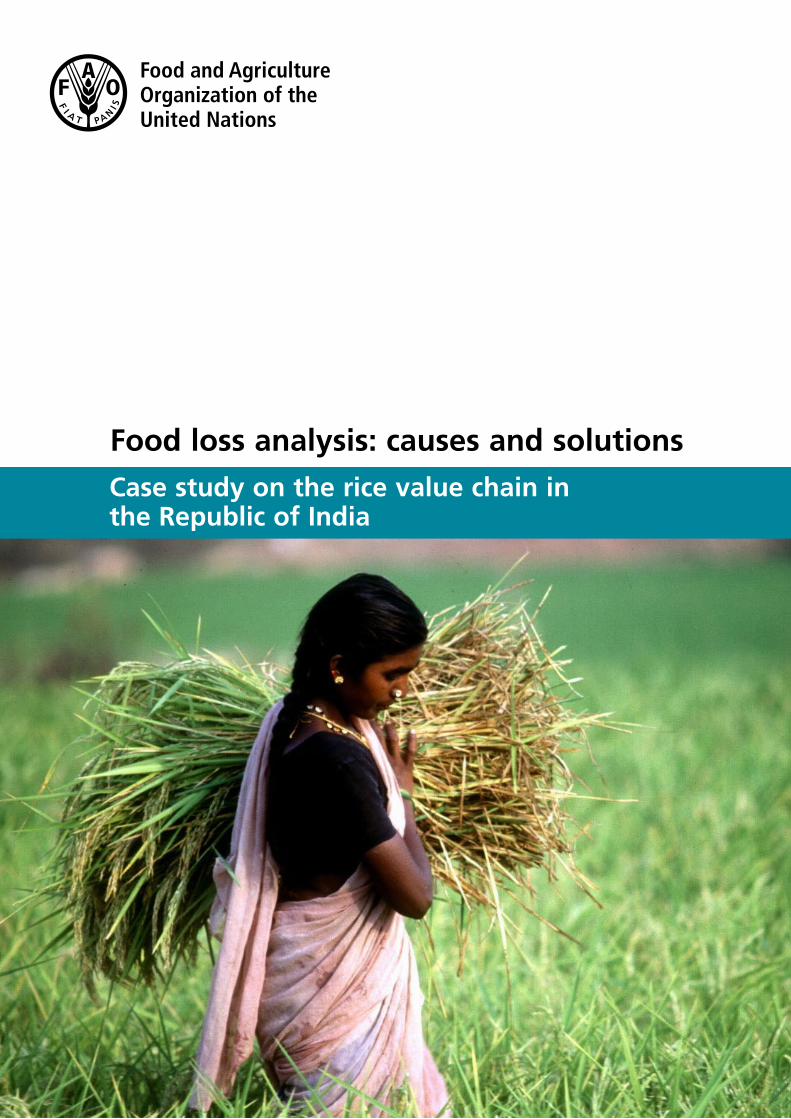
Food loss analysis: causes and solutions Case study on the rice value chain in the Republic of India
Transcript of Case study on the rice value chain in the Republic of India
Food loss analysis: causes and solutions
Case study on the rice value chain in the Republic of India

FOOD AND AGRICULTURE ORGANIZATION OF THE UNITED NATIONSROME, 2018
Food loss analysis: causes and solutionsCase study on the rice value chain in
the Republic of India
Field studies in Andhra Pradesh the districts of East Godavari and Nellore districtsMay to July 2016

Required citation: FAO. 2018. Food loss analysis: causes and solutions - Case study on the rice value chain in the Republic of India. Rome. 54 pp. Licence: CC BY-NC-SA 3.0 IGO.
The designations employed and the presentation of material in this information product do not imply the expression of any opinion whatsoever on the part of the Food and Agriculture Organization of the United Nations (FAO) concerning the legal or development status of any country, territory, city or area or of its authorities, or concerning the delimitation of its frontiers or boundaries. The mention of specific companies or products of manufacturers, whether or not these have been patented, does not imply that these have been endorsed or recommended by FAO in preference to others of a similar nature that are not mentioned. The views expressed in this information product are those of the author(s) and do not necessarily reflect the views or policies of FAO. ISBN978-92-5-130646-8 © FAO, 2018
Some rights reserved. This work is made available under the Creative Commons Attribution-NonCommercial-ShareAlike 3.0 IGO licence (CC BY-NC-SA 3.0 IGO; https://creativecommons.org/licenses/by-nc-sa/3.0/igo/legalcode). Under the terms of this licence, this work may be copied, redistributed and adapted for non-commercial purposes, provided that the work is appropriately cited. In any use of this work, there should be no suggestion that FAO endorses any specific organization, products or services. The use of the FAO logo is not permitted. If the work is adapted, then it must be licensed under the same or equivalent Creative Commons license. If a translation of this work is created, it must include the following disclaimer along with the required citation: “This translation was not created by the Food and Agriculture Organization of the United Nations (FAO). FAO is not responsible for the content or accuracy of this translation. The original [Language] edition shall be the authoritative edition. Disputes arising under the licence that cannot be settled amicably will be resolved by mediation and arbitration as described in Article 8 of the licence except as otherwise provided herein. The applicable mediation rules will be the mediation rules of the World Intellectual Property Organization http://www.wipo.int/amc/en/mediation/rules and any arbitration will be in accordance with the Arbitration Rules of the United Nations Commission on International Trade Law (UNCITRAL). Third-party materials. Users wishing to reuse material from this work that is attributed to a third party, such as tables, figures or images, are responsible for determining whether permission is needed for that reuse and for obtaining permission from the copyright holder. The risk of claims resulting from infringement of any third-party-owned component in the work rests solely with the user. Sales, rights and licensing. FAO information products are available on the FAO website (www.fao.org/publications) and can be purchased through [email protected]. Requests for commercial use should be submitted via: www.fao.org/contact-us/licence-request. Queries regarding rights and licensing should be submitted to: [email protected]. Cover photograph ©FAO/G.Bizzarri

iii
Contents
Foreword v
Abbreviations and acronyms vi
Executive Summary viii
Chapter 1 The rice subsector – Introduction and background 1
Status and importance of the rice subsector; developments over the last 15 years 1Inventory of activities and lessons learned from past and ongoing interventions 10Policy framework and national strategy 10Relevant institutions and their roles 11Overview of the rice supply chains 11
Chapter 2 The food supply chain – Situation analysis 15
The rice subsector 15Marketing systems in the rice supply chain 19Involvement of actors in the supply chain benefits, job creation and income 19
Chapter 3 The food loss – Study findings and results 25
Description of risk factors in the food supply chain 25Critical loss points 25Potential loss reduction measures 28Low loss points, and good practices leading to low food losses 31
Chapter 4 Food loss reduction strategy – Conclusions and recommendations 33
Impact of food losses in the rice food supply chain 33Food loss reduction measures 33Budget calculations for food loss reduction 34Good practices observed in the rice value chain 38
Bibliography 43

iv
TABLES1 State production information on the rice subsector 62 Gender distribution by task in the rice food supply chain 63 Distribution channels for the rice supply chain 74 FSSAI standards for rice 75 Damaged food grains and their destination 86 Actors and their roles in the rice supply chain 97 List of the main AP institutions in the paddy/rice food supply chain 128A List of the main Main food supply chains in the rice subsector 128B Rice by-products 138C Importance of food supply chains in Andhra Pradesh 139 Details of economic importance of food supply chains for smallholders 1410 Preliminary screening for food losses in the selected food supply chains 1411 Intermediary products and conversion factors in the food supply chain 1512 Detailed description of the rice supply chain – Basics 1613 Detailed description of the food supply chain – social structures 2014 Scenario 1: PDS system; Farmer sells to millers at MSP 2115 Scenario 2: Private market system; farmer sells to millers at market price 2116 Equipment and chemicals used in the rice food supply chain 2317 Factors in the environmental assessment 2418 Food loss risk factors 2619 Critical loss points and level of losses 2620 Quality scoring of food products 2721 Summary result matrix of food losses 2922 Projected construction of silos in Andhra Pradesh (Phase III) 3423 Calculations for capacity-building 3524 Intervention: Hermetic cocoon (No subsidy provided by the government) 3625 Intervention: Hermetic cocoon (50 percent subsidy provided by Government) 3726 Development costs for bulk storage using metal silos 3827 Comparison of silos and flat warehouses 3828 The social implications of suggestions related to specific food loss solutions 3929 Summary of food losses, causes and solutions 42
FIGURES1 Map of Andhra Pradesh, the case study districts – East Godavari and Nellore 12 Rice production and yield in Andhra Pradesh 23 Transporting rice using a tractor 34 A view of a CWC warehouse from outside and storage (bottom) 45 A consumer’s credentials being authenticated 46 Andhra Pradesh production information for the rice subsector 57 Quality testing laboratory (left), cooking test (middle) and rice colour sorting 88 Flow diagram of the rice value chain in the selected FSC 179 Combine harvester 1810 Food loss points in the rice food supply chain 2511 Cause finding diagram 3012 Five tonne cocoon 36
v
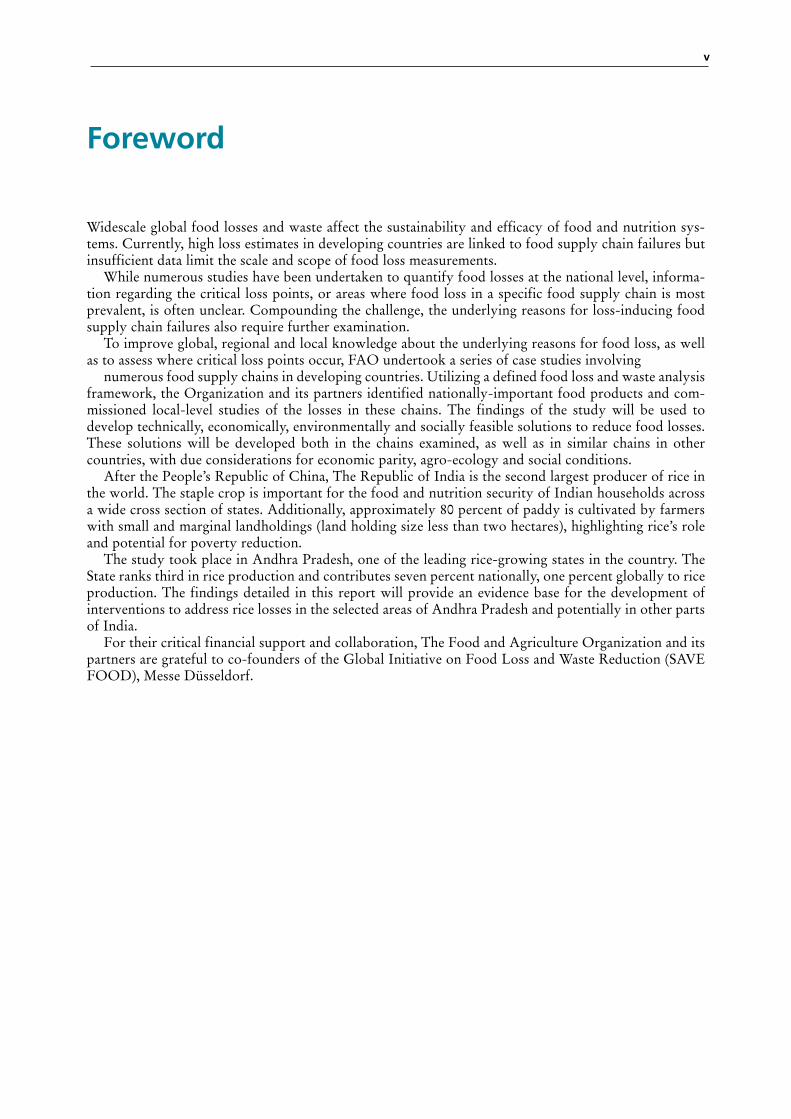
Foreword
Widescale global food losses and waste affect the sustainability and efficacy of food and nutrition sys-tems. Currently, high loss estimates in developing countries are linked to food supply chain failures but insufficient data limit the scale and scope of food loss measurements.
While numerous studies have been undertaken to quantify food losses at the national level, informa-tion regarding the critical loss points, or areas where food loss in a specific food supply chain is most prevalent, is often unclear. Compounding the challenge, the underlying reasons for loss-inducing food supply chain failures also require further examination.
To improve global, regional and local knowledge about the underlying reasons for food loss, as well as to assess where critical loss points occur, FAO undertook a series of case studies involving
numerous food supply chains in developing countries. Utilizing a defined food loss and waste analysis framework, the Organization and its partners identified nationally-important food products and com-missioned local-level studies of the losses in these chains. The findings of the study will be used to develop technically, economically, environmentally and socially feasible solutions to reduce food losses. These solutions will be developed both in the chains examined, as well as in similar chains in other countries, with due considerations for economic parity, agro-ecology and social conditions.
After the People’s Republic of China, The Republic of India is the second largest producer of rice in the world. The staple crop is important for the food and nutrition security of Indian households across a wide cross section of states. Additionally, approximately 80 percent of paddy is cultivated by farmers with small and marginal landholdings (land holding size less than two hectares), highlighting rice’s role and potential for poverty reduction.
The study took place in Andhra Pradesh, one of the leading rice-growing states in the country. The State ranks third in rice production and contributes seven percent nationally, one percent globally to rice production. The findings detailed in this report will provide an evidence base for the development of interventions to address rice losses in the selected areas of Andhra Pradesh and potentially in other parts of India.
For their critical financial support and collaboration, The Food and Agriculture Organization and its partners are grateful to co-founders of the Global Initiative on Food Loss and Waste Reduction (SAVE FOOD), Messe Düsseldorf.
vi
Abbreviations and acronyms
AGMARK Agricultural marketing
ANGRAU Acharya N. G. Ranga Agricultural University
AP Andhra Pradesh
APCSC AP State Civil Supplies Corporation
APEDA Agricultural and Processed Food Products Export Development Authority
APSWC AP State Warehousing Corporation
ARS Agricultural Research Stations
ASCI Agriculture Sector Skill Council of India
B2B Business to Business
BPL Below Poverty Line
CAGR Compound Annual Growth Rate
CER Constant Exchange Rate
CMR Custom Milled Rice
CWC Central Warehousing Corporation
DMI Directorate of Marketing and Inspection
DRR Directorate of Rice Research
ECA Essential Commodities Act
EG East Godavari
EIC Export Inspection Council
ePDS Electronic Public Distribution System
ePOS Electronic Point of Service
FCI Food Corporation of India
FMCG Fast Moving Consumer Goods
FPS Fair Price Shops
FSC Food Supply Chain
FSSAI Food Safety and Standards Authority of India
FY Financial year
GAP Good Agricultural Practices
GoI Government of India
HOD Head of Department
IIRR Indian Institute of Rice Research
IRRI International Rice Research Institute
JLG Join liability groups
KVK Krishi Vigyan Kendra
MANAGE National Institute of Agricultural Extension Management

vii
MAO Mandal Agriculture Officer
MLS Mandal (Block) Level Storage
MSP Minimum Support Price
NFSM National Food Security Mission
NSDC National Skill Development Corporation
PDS Public Distribution System
PPP Public-Private Partnerships
QCC Quality Control Cell
RKVY Rashtriya Krishi Vikas Yojana
SBD Solar Bubble Dryer
SCDA Supervisory Control and Data Acquisition
SRI System of Rice Intensification
SRPP Special Rice Development Program
VLA Village Level Aggregators
GLOSSARY OF TERMSBroken rice Damaged white rice, broken during processing
Husked rice Only the husk has been removed
Milled rice The pericarp has been completely removed by passing through special tapering cylinders
Paddy Rice that has retained its husk after threshing
Parboiled rice Rice that has been partially boiled in the husk

viii
Executive Summary
Food loss and waste is observed across commodities globally. Food losses do not merely reduce food available for human consumption but also negatively affect society because of the cost of waste manage-ment, greenhouse gas production and the loss of scarce resources used in their production. This present study is an initiative to drive innovations and promote dialogue between the stakeholders across the food supply chain (FSC) to generate solutions that can lead to curbing this problem.
The objective of this study is to identify the main causes of food loss in the rice supply chain and suggest potential solutions to mitigate these losses. A field case study methodology has been used to conduct this study. It is a one-moment recording, not a state or national subsector study. It is a uniform methodology formulated by the Food and Agriculture Organization of the United Nations (FAO) based on four (‘S’) elements, Screening (secondary research of documents, reports, and expert consultations), Survey, Sampling, Synthesis (root cause analysis and finding a solution). The study also evaluates the technical and economic feasibility of the suggested solutions, social acceptability and environmental impact to create a concrete proposal for a food loss reduction programme. The proposal was further discussed and validated at a one-day workshop with stakeholders from the public and private sector, the outcomes are presented in this report.
Andhra Pradesh (AP) is an agrarian state that has a premier position in the Republic of India with a major contribution in agriculture, horticulture, dairy, poultry and fisheries. Around 60 percent of the state’s population is employed in agriculture and related activities. Andhra Pradesh is also popularly known as the ‘Rice Bowl of India’ as it ranks third in terms of rice production and second in terms of productivity; contributing 7 percent of national rice production.
To assess the food losses, field case studies were performed in the selected FSCs in east Godavari and Nellore districts because they contribute to approximately 60 percent of paddy production in the state, and the existence of the entire value chain helps to provide a holistic picture. The rice supply chain is highly organized and complex. It flows either through the public distribution system or through private markets. The paddy supply chain is made up of multiple actors and factors that could lead to potential food losses. The following actors play a major role in the supply chain: farmers as the producers of paddy, village level aggregators (VLAs), rice processing industries, warehouse managers, distribution agents and retailers.
The principal factors affecting food losses in the rice value chain can be categorized at the farmer level (mechanized harvesting), transporter (transportation of paddy or milled rice), millers (milling and processing), warehouses (storage) and retailing. At the farmer level crop varieties, good agricultural practices, rainfall during cultivation and harvest, the timing of harvest or post-harvest operations, and the method of harvesting were observed as food loss risk factors that, if managed efficiently, will lead to reduced losses. Mechanized harvesting and threshing is one of the critical loss points (CLP), where farm-ers surveyed reported a loss of 7 to 10 percent. Similarly, during storage at mills and Central Warehousing Corporation (CWC) warehouses, the qualitative losses for rice ranged from 2 to 4 percent, which was exacerbated by the intake of paddy with higher moisture content for mechanical drying and processing. The study covers the economic and social impact of these losses. Also across the food supply chain, vari-ous factors such as machinery used, use of chemicals, fuel, land, water, etc. that affect the environment are also considered in detail in the report.
Given the significant role that food loss reductions could have in sustainably improving food security, it is important to have economically viable, environmentally friendly and socially acceptable solutions. The study suggests a few potential interventions to mitigate food losses across the critical loss points. It includes a food loss reduction strategy, taking into consideration the suitability and economic viability of solutions and expert insights.
First and foremost, the intervention suggested is the formation of farmer producer organizations that would be engaged in the end-to-end linkage in the supply chain. Another initiative is the capacity-building of farmers and labourers. Since most loss was observed at the mechanized harvesting stage,
ix
it was suggested that training be given to combine harvester operators. Another important solution proposed is to use better combine harvesters that would facilitate deep cutting. To mitigate the losses at the storage level, the use of hermetic storage or silos is suggested. A stakeholder meeting was conducted to appraise the findings of the report and the main action points were identified to address food losses in the rice subsector.

1
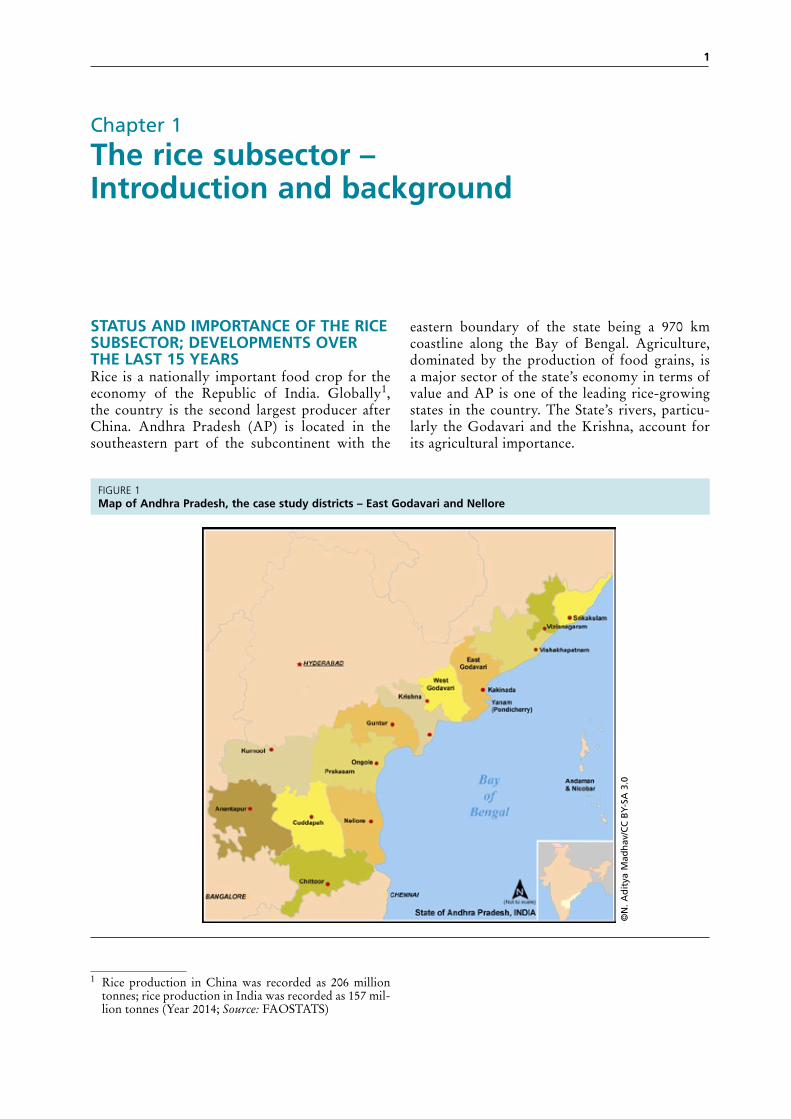
STATUS AND IMPORTANCE OF THE RICE SUBSECTOR; DEVELOPMENTS OVER THE LAST 15 YEARS Rice is a nationally important food crop for the economy of the Republic of India. Globally1, the country is the second largest producer after China. Andhra Pradesh (AP) is located in the southeastern part of the subcontinent with the
1 Rice production in China was recorded as 206 million tonnes; rice production in India was recorded as 157 mil-lion tonnes (Year 2014; Source: FAOSTATS)
eastern boundary of the state being a 970 km coastline along the Bay of Bengal. Agriculture, dominated by the production of food grains, is a major sector of the state’s economy in terms of value and AP is one of the leading rice-growing states in the country. The State’s rivers, particu-larly the Godavari and the Krishna, account for its agricultural importance.
Chapter 1
The rice subsector – Introduction and background
FIGURE 1Map of Andhra Pradesh, the case study districts – East Godavari and Nellore
©N
. Ad
itya
Mad
hav
/CC
BY
-SA
3.0

The Republic of India - Rice2
Rice is cultivated on 2.4 million ha in AP with an average productivity of 3.4 tonnes/ha (2014–2015), behind only Punjab (3.7 tonnes/ha). Andhra Pradesh (AP) ranks third in India for rice production contributing 7 percent of national rice production and a share of 1 percent to the global market2. AP3 is also a rice surplus production state, with production in excess of the state’s consumption.
The districts in the deltaic regions of Krishna-Godavari and the coastal areas (Nellore) are the major producers of rice. The study was conducted in the districts of East Godavari and Nellore as they account for 25 percent of the cultivated area and 31 percent of the rice production in the state. The rice supply chain is highly organized and rice is marketed through a public distribution system (PDS) and private channels. Informal trade or storing for self-consumption is minimal, and most produce is marketed after milling. In East Godavari district the main cultivation season for paddy is kharif, with sowing in June and harvesting in October; the other growing season is rabi with sowing in December and
2 Global rice production: 740 million tonnes; Indian rice production: 120 million tonnes; AP rice production: 8.4 million tonnes (Year 2014; Source: FAOSTATS)
3 Rice production in AP: 8.4 million tonnes rice consump-tion in AP: 7.5 million tonnes (Year 2013-2014, NSSO, Sathguru calculations)
harvesting in April or May; whereas, in Nellore, the seasons are early kharif (April-August) and rabi (October-March).
Over the past 10 years (Figure 1.2) the cultivated area for rice decreased by 1 percent, whereas the production and productivity shows a compound annual growth rate (CAGR) of 2 percent. The State’s rice production witnessed major dips in the financial years 2009–2010, 2012–2013 because of drought; and in 2011–2012 because of the ‘crop holiday’, a form of farmers’ protest against the negative incomes of the previous years. During this period, farmers collectively decided to leave the land unsown to ensure their demands were heard.
Several other factors including a shift in cropping patterns from paddy to high-value non-cereal crops, low productivity and increasing paddy cultivation costs, labour shortages, unattractive market prices and erratic climatic conditions also affect crop production.
According to the data from the Agricultural and Processed Food Products Export Development Authority (APEDA), approximately 2.5 million tonnes of non-basmati rice was exported from different ports in AP and an estimated 2 million tonnes from the combined states of AP and Telangana.
FIGURE 2Rice production and yield in Andhra Pradesh
10 000
8 000
6 000
4 000
2 000
0
4,00
3,50
3,00
2,50
2,00
1,50
1,00
0,50
0,00
Yie
ld
Pro
du
ctio
n a
nd
are
a
Area (Thousand Hectare) Production (Thousand Tonnes) Yield (Tonnes/Hectare)
2005-06 2006-07 2007-08 2008-09 2009-10 2010-11 2011-12 2012-13 2013-14 2014-15
Source: Field data
Chapter 1 – The rice subsector – Introduction and background 3
Production information for the rice subsector – actors and product flowIn AP, almost the entire paddy (98 %) is mar-keted and the organized market (farmers, aggre-gators, millers, wholesalers, retailers) dominates the value chain with the paddy being distributed through the government and private channels. The role of different actors in the rice supply chain is as follows:
Producers – In AP, approximately 80 percent of paddy is cultivated by farmers with small and marginal landholdings (land holding size < 2 ha). Tenant farming is predominant, a practice where farmers with medium and large landhold-ings (landholding size > 5 ha) lease out their land to multiple farmers (tenants) who cultivate paddy and share a percentage of the profit with the land owner. The farmers store 2 percent of their produce in anticipation of fetching a better price. Depending on the market situation, however, farmers may or may not obtain a better price. Usually, in the latter case, the farmers consume the produce. No paddy is stored by farmers for seeds in AP.
Government Procurement Centres operate at the village level and act as aggregation points for the procurement of paddy and pulses depending on season. Usually, one centre caters to three to four villages. Farmers, however, do not like this mode of paddy sale, as the farmers must transport paddy from the farm to the centre, and the price of their produce is determined based on moisture content and grain size. Apart from procuring paddy directly from the farmers and getting it custom milled, a substantial quantity of rice is procured through processors. In this case the millers procure paddy directly from farmers, convert it into rice and deliver it to the Food Corporation of India (FCI) and state government agencies (SGAs).
Village Level Aggregators (VLAs) are private agents or traders working on behalf of the private mills. The VLAs are involved in the collection of paddy directly from the paddy farms, and they transport the produce to the mills, usually within a 10 km radius of the village. Their commission, approximately 5 percent, does not affect the farmer’s profit margin, because the commission is paid out of the millers’ revenue. This is a preferred system over the government procurement centres because of the above-mentioned advantages and the price being determined by the prevailing mar-
ket rates rather than a sampling method based on moisture and grain size.
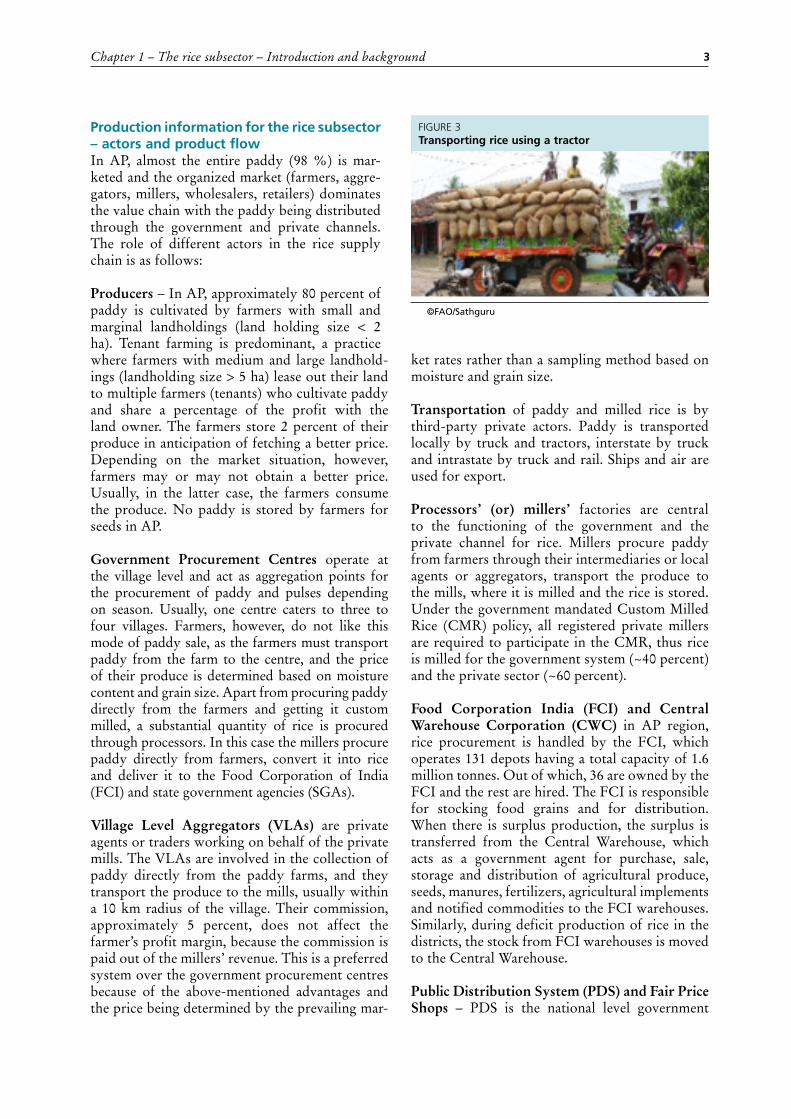
Transportation of paddy and milled rice is by third-party private actors. Paddy is transported locally by truck and tractors, interstate by truck and intrastate by truck and rail. Ships and air are used for export.
Processors’ (or) millers’ factories are central to the functioning of the government and the private channel for rice. Millers procure paddy from farmers through their intermediaries or local agents or aggregators, transport the produce to the mills, where it is milled and the rice is stored. Under the government mandated Custom Milled Rice (CMR) policy, all registered private millers are required to participate in the CMR, thus rice is milled for the government system (~40 percent) and the private sector (~60 percent).
Food Corporation India (FCI) and Central Warehouse Corporation (CWC) in AP region, rice procurement is handled by the FCI, which operates 131 depots having a total capacity of 1.6 million tonnes. Out of which, 36 are owned by the FCI and the rest are hired. The FCI is responsible for stocking food grains and for distribution. When there is surplus production, the surplus is transferred from the Central Warehouse, which acts as a government agent for purchase, sale, storage and distribution of agricultural produce, seeds, manures, fertilizers, agricultural implements and notified commodities to the FCI warehouses. Similarly, during deficit production of rice in the districts, the stock from FCI warehouses is moved to the Central Warehouse.
Public Distribution System (PDS) and Fair Price Shops – PDS is the national level government
FIGURE 3Transporting rice using a tractor
©FAO/Sathguru

The Republic of India - Rice4
controlled system for distributing rice through fair price shops to beneficiaries, who are below the poverty line. Also referred to as rations shops, these are government-owned retail outlets that are concentrated in rural areas. Fair price shops sell rice, along with other essential commodities to beneficiaries such as wheat, sugar and kerosene oil at highly subsidized rates. Rice is sold at fair price shops for USD 0.02 per kg (INR 1/kg) to USD 0.15 per kg (INR 9/kg).
The retail price varies with the subsidy scheme and the targeted audience. Generally, the subsidy schemes have the lowest rates for below the pov-erty line (BPL) beneficiaries. These rates are much below the prevailing market prices that range between USD 0.4 to 0.5/kg (INR 25 to 30/kg).
Case Study 1: ePDS system at NelloreElectronic Public Distribution System (ePDS) and Electronic Point of Service (ePOS) were intro-duced into India in 2015, and are implemented across fair price shops in Nellore along with a customer milled rice (CMR) system called ‘supply management system’. The manager interviewed has a fair price shop in Harinathapuram, Nel-lore and uses ePDS, which is an online software application for ration card management, alloca-tion and seeding of Aadhaar, which is data for the Unique Identification Number (UIN). The ePDS processes involved in the distribution of
essential commodities (ECs) to the BPL families are automated so as to facilitate PDS efficiency, accountability and transparency.
The manager further explained that when the ePOS system was put into effect, all cardholders had been previously allocated a UIN. Replace-ment of the old ration card system with the new digital fingerprints for customer identification has increased operational efficiency and stopped leakages. The field staff were able to add new shops in thee ePDS and tag the ration cards to the shops concerned. Allocation to each shop is calculated by the system based on the distribu-tion of the shop and the closing balances of the previous month. The details of the shop allocation are linked to eSeva (digital services for citizens using information and communication technolo-gies tools).
Paddy is the basic farm output that is pro-cessed to give husked rice or rice as the primary produce. Table 1 provides the data for products, by-products from milling of paddy and their economic value in AP.
Intermediary products and by-products The different intermediary products and by-prod-ucts and a note about their value chain in the state follows.
Parboiled rice is rice that has been processed by boiling or heating paddy. The supply chain is similar to that of raw rice, where the farmer sells to the miller through the agents or aggregators and after processing the millers can sell directly to the open market or sell to the government under the CMR scheme, which mandates 68 percent recov-ery from paddy. As a result of the harder grain and pest resistance, FCI prefers to store parboiled rice. The FCI currently transports the rice to Kerala by rail and road and is considering the sea route for transportation.
FIGURE 4A view of a CWC warehouse from outside and storage (bottom)
©FAO/Sathguru
FIGURE 5A consumer’s credentials being authenticated
©FAO/Sathguru
Chapter 1 – The rice subsector – Introduction and background 5
During parboiling, the rice becomes harder and results in a higher milling yield with fewer breakages and more oil content in the bran, which contains more vitamins and minerals than in polished rice. Hence, parboiled rice fetches a higher market price than raw rice. Parboiled rice, however, requires more energy to achieve the same degree of milling. Some mills in AP produce parboiled rice in addition to raw rice and export to other states including Kerala and Tamil Nadu or overseas to other countries.
Broken rice is obtained as part of rice mill-ing and is further processed into various other products and consumed. The higher percentage of broken kernels or rice reflects the qualitative loss of rice grains. The percentage of broken rice varies depending on the mill, 10 to 12 kg of broken
rice is obtained from 1 quintal of paddy; while for modern mills with rubber roll shellers, 6 to 8 kg of broken rice is obtained from 1 quintal of paddy. If the paddy is not dried to 18 percent moisture content, the probability of broken kernels during milling increases.
Broken rice is sold at a lower price than raw rice, which is the primary product of processing. The broken rice is sold at the mill-gate or on the open market. The broken rice is further processed into rice flour, vermicelli, semolina and poultry feed. In addition, it may also be blended by various millers as per customer demand, which involves mixing a predetermined amount of broken rice with raw rice, which is then sold at a lower price. The broken rice market is unorganized. The local cottage and small-scale industries further process
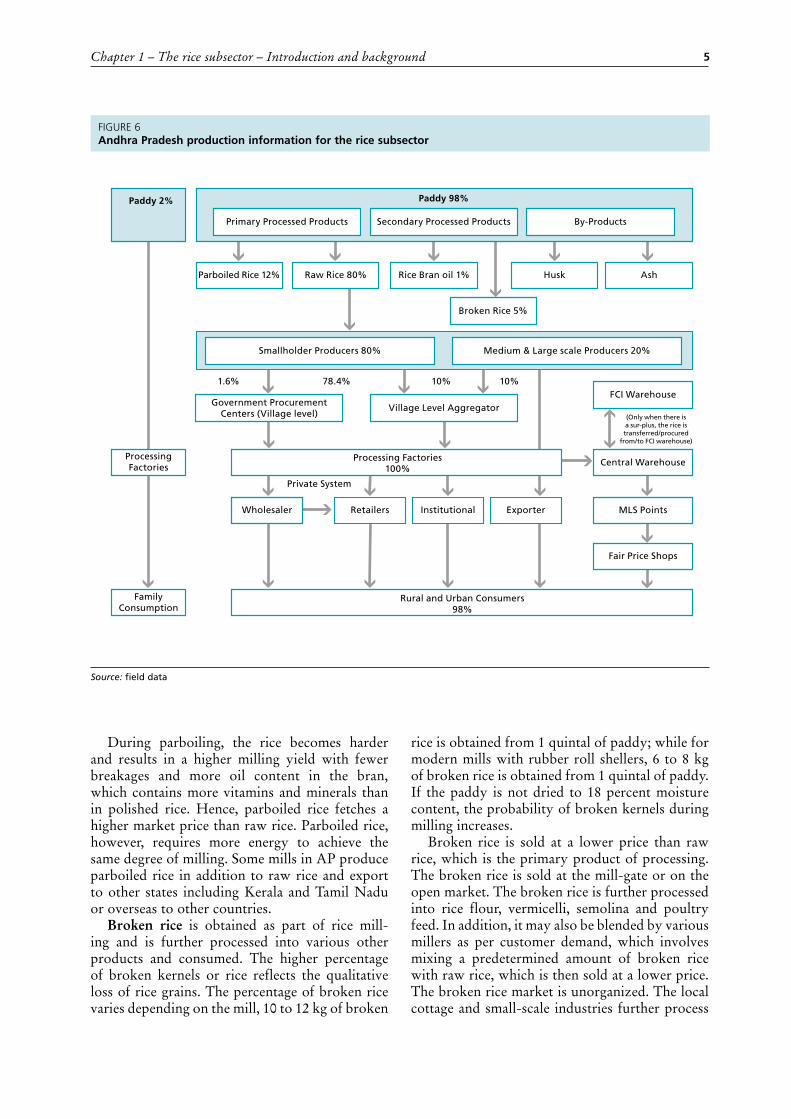
FIGURE 6Andhra Pradesh production information for the rice subsector
Paddy 98%Paddy 2%
Processing Factories100%
Private System
ProcessingFactories
FamilyConsumption
Parboiled Rice 12% Raw Rice 80%
1.6% 78.4% 10% 10%
Rice Bran oil 1% Husk Ash
Broken Rice 5%
Primary Processed Products
Government ProcurementCenters (Village level)
Village Level AggregatorFCI Warehouse
Central Warehouse
MLS Points
Fair Price Shops
Rural and Urban Consumers98%
Secondary Processed Products
Smallholder Producers 80% Medium & Large scale Producers 20%
By-Products
(Only when there isa sur-plus, the rice istransferred/procured
from/to FCI warehouse)
Wholesaler Retailers Institutional Exporter
Source: field data
The Republic of India - Rice6
it into other value-added products, package and distribute it to the local markets. These units, therefore, incur losses during cleaning, packaging, distribution and storage. In the organized market, a few players have tapped this market, especially the large-scale millers, which are also exporting to Africa, Thailand and various Southeast Asian countries as branded products.
The broken rice can be in several fractions and of different sizes as follows:
� large broken kernel: 50 to 75 percent of the whole kernel size;
� medium broken kernel: 25 to 50 percent of the whole kernel size;
� small broken kernel: less than 25 percent of the kernel size, cannot pass through a sieve with 1.4 mm diameter holes; and
� chips: fragments of a kernel that pass through a sieve with 1.4 mm diameter holes.
Rice-bran or oil is a high value by-product of rice. The bran contains approximately 16 to 18 percent rice-bran oil and is further processed using solvent extraction for refining. In the extraction facility, the bran oil is extracted as the main product and the de-oiled cake is used for cattle feed, in soap manufacturing, for waxes and gums or for coating candy or fruits as it prevents moisture loss and shrinkage. The rice-bran oil has a higher economic value because of its health benefits, which include lowering cholesterol and aiding in weight loss, boosting the immune system, increasing cognitive powers, preventing cancer and mitigating allergic reactions.
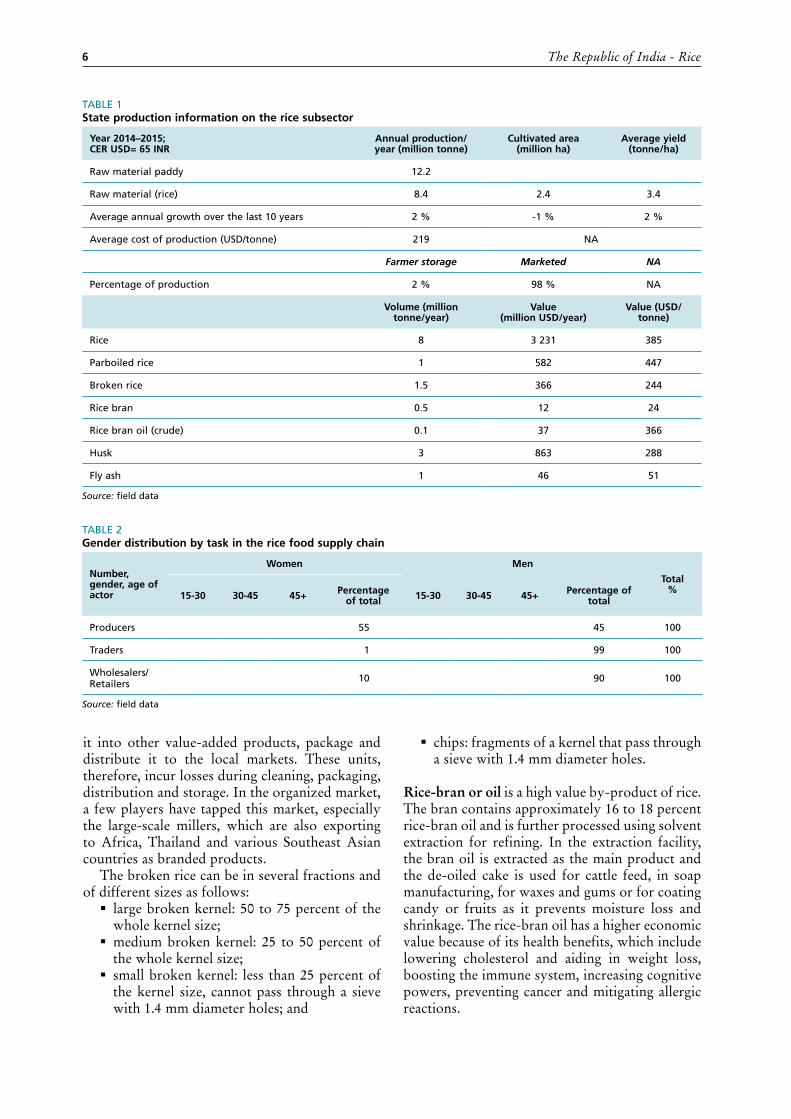
TABLE 2Gender distribution by task in the rice food supply chain
Number, gender, age of actor
Women Men
Total%
15-30 30-45 45+ Percentage of total 15-30 30-45 45+ Percentage of
total
Producers 55 45 100
Traders 1 99 100
Wholesalers/ Retailers 10 90 100
Source: field data
TABLE 1State production information on the rice subsector
Year 2014–2015;CER USD= 65 INR
Annual production/year (million tonne)
Cultivated area(million ha)
Average yield (tonne/ha)
Raw material paddy 12.2
Raw material (rice) 8.4 2.4 3.4
Average annual growth over the last 10 years 2 % -1 % 2 %
Average cost of production (USD/tonne) 219 NA
Farmer storage Marketed NA
Percentage of production 2 % 98 % NA
Volume (million tonne/year)
Value (million USD/year)
Value (USD/tonne)
Rice 8 3 231 385
Parboiled rice 1 582 447
Broken rice 1.5 366 244
Rice bran 0.5 12 24
Rice bran oil (crude) 0.1 37 366
Husk 3 863 288
Fly ash 1 46 51
Source: field data
Chapter 1 – The rice subsector – Introduction and background 7
Husk is the bulky by-product obtained during rice milling (about 20 to 22 percent of total paddy milled), it is a rich source of silica and fibre, and is used in glass manufacturing. Husk has a considerable fuel value for different processing industries where it is used to produce steam or electricity. Later the ashes are used as manure as it contains a considerable amount of silica.
Demographics of the subsectorDuring the study, the absolute population of producers, traders or wholesalers engaged in the rice supply chain at the state level across the age groups could not be determined. At the pro-ducer level (excluding owners of land titles), most labourers are contract workers at the village level and hence no record is kept of their employment. At the trader level, namely primary processing at mills, women and men are employed equally. The role of women, however, is restricted to cleaning and winnowing. Few women participate in pro-cessing and marketing.
The age disaggregated absolute data was dif-ficult to compute, as no published reference data points were available. The percentages that follow are provided based on field level observa-
tions during the study, and are not representative of the State.
Out of approximately 6 500 rice mills in Andhra Pradesh, most mills have been modernized. The large units are highly advanced with a milling capacity as high as 2 000 tonnes per day. The wholesale and retail distribution channels operate through the government and the private systems through the fair price shops and the hypermarkets, supermarkets or kirana stores respectively, the density of which depends on the rural or urban areas as provided in Table 3.
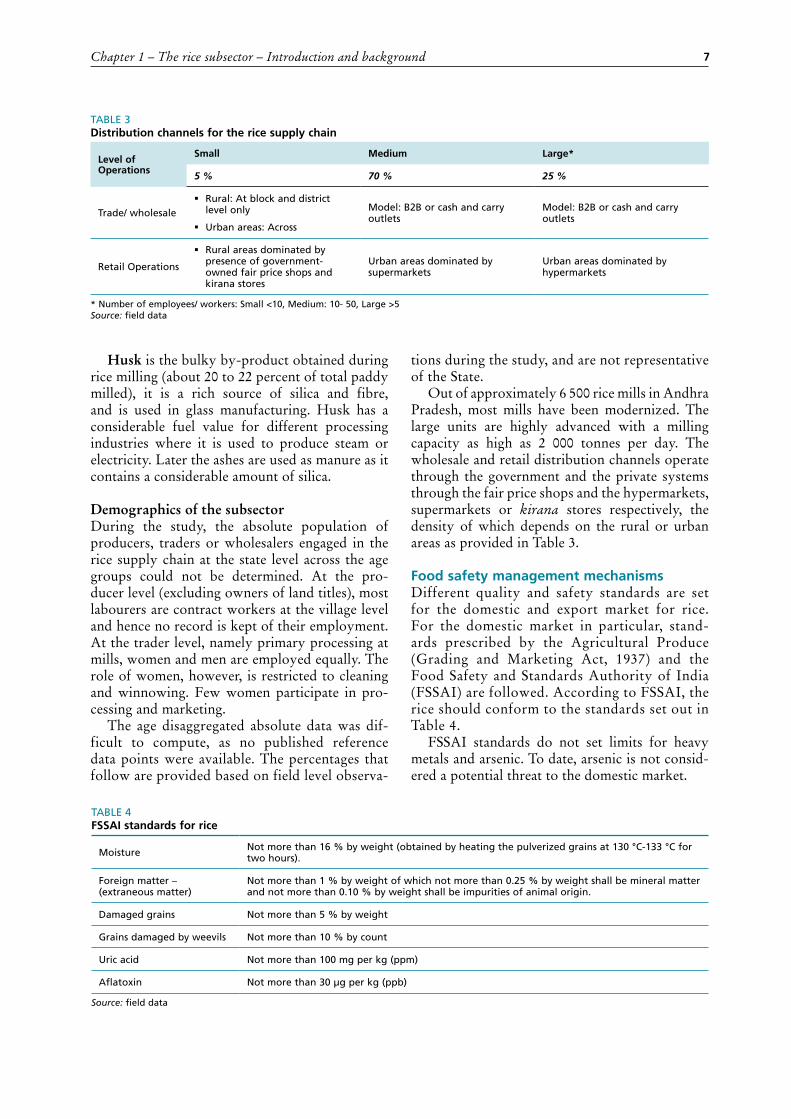
Food safety management mechanismsDifferent quality and safety standards are set for the domestic and export market for rice. For the domestic market in particular, stand-ards prescribed by the Agricultural Produce (Grading and Marketing Act, 1937) and the Food Safety and Standards Authority of India (FSSAI) are followed. According to FSSAI, the rice should conform to the standards set out in Table 4.
FSSAI standards do not set limits for heavy metals and arsenic. To date, arsenic is not consid-ered a potential threat to the domestic market.
TABLE 3Distribution channels for the rice supply chain
Level of Operations
Small Medium Large*
5 % 70 % 25 %
Trade/ wholesale � Rural: At block and district
level only
� Urban areas: Across
Model: B2B or cash and carry outlets
Model: B2B or cash and carry outlets
Retail Operations
� Rural areas dominated by presence of government-owned fair price shops and kirana stores
Urban areas dominated by supermarkets
Urban areas dominated by hypermarkets
* Number of employees/ workers: Small <10, Medium: 10- 50, Large >5Source: field data
TABLE 4FSSAI standards for rice
Moisture Not more than 16 % by weight (obtained by heating the pulverized grains at 130 °C-133 °C for two hours).
Foreign matter – (extraneous matter)
Not more than 1 % by weight of which not more than 0.25 % by weight shall be mineral matter and not more than 0.10 % by weight shall be impurities of animal origin.
Damaged grains Not more than 5 % by weight
Grains damaged by weevils Not more than 10 % by count
Uric acid Not more than 100 mg per kg (ppm)
Aflatoxin Not more than 30 µg per kg (ppb)
Source: field data
The Republic of India - Rice8
Paddy is procured at the farmgate, based on the moisture level and the purity percentage. The domestic market has no mechanism or procedure to check for pesticide residue or metal contami-nants in paddy hence these contaminants do not have grading parameters. Limits for pesticide residue levels are, however, strictly followed for the export market. The institutions involved in monitoring and implementation of standards are the following:
� Food Corporation of India: The Quality Control (QC) wing inspects the stock regu-larly during storage to monitor quality by carrying out physical and chemical analysis to ensure the quality standards prescribed by the government and FSSAI. The senior QC officers inspect FCI warehouses frequently. Periodical disinfestation measures are also undertaken to ensure the health of the grains. Rice samples are drawn using a joint sam-pling system and lots that strictly conform to GoI Uniform Specifications standards are issued to PDS.
� Non-issuable (damaged) food grains and their disposal: The grains that do not con-
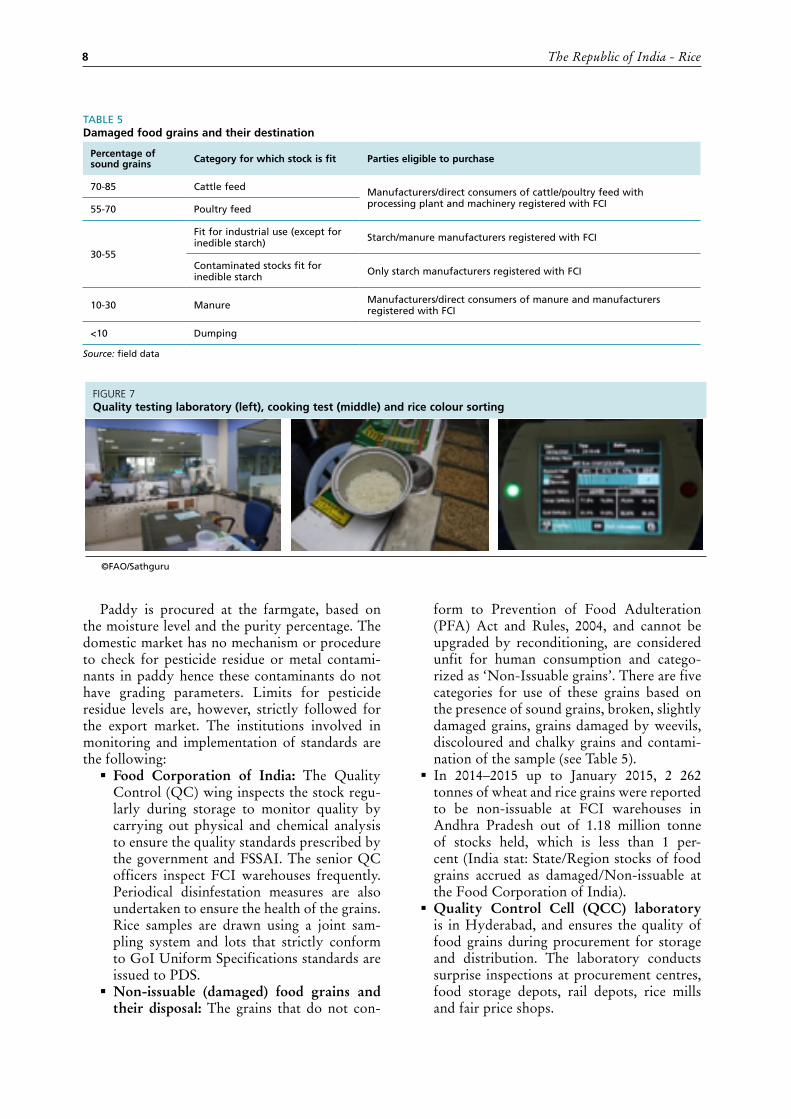
form to Prevention of Food Adulteration (PFA) Act and Rules, 2004, and cannot be upgraded by reconditioning, are considered unfit for human consumption and catego-rized as ‘Non-Issuable grains’. There are five categories for use of these grains based on the presence of sound grains, broken, slightly damaged grains, grains damaged by weevils, discoloured and chalky grains and contami-nation of the sample (see Table 5).
� In 2014–2015 up to January 2015, 2 262 tonnes of wheat and rice grains were reported to be non-issuable at FCI warehouses in Andhra Pradesh out of 1.18 million tonne of stocks held, which is less than 1 per-cent (India stat: State/Region stocks of food grains accrued as damaged/Non-issuable at the Food Corporation of India).
� Quality Control Cell (QCC) laboratory is in Hyderabad, and ensures the quality of food grains during procurement for storage and distribution. The laboratory conducts surprise inspections at procurement centres, food storage depots, rail depots, rice mills and fair price shops.
TABLE 5Damaged food grains and their destination
Percentage of sound grains Category for which stock is fit Parties eligible to purchase
70-85 Cattle feed Manufacturers/direct consumers of cattle/poultry feed with processing plant and machinery registered with FCI55-70 Poultry feed
30-55
Fit for industrial use (except for inedible starch) Starch/manure manufacturers registered with FCI
Contaminated stocks fit for inedible starch Only starch manufacturers registered with FCI
10-30 Manure Manufacturers/direct consumers of manure and manufacturers registered with FCI
<10 Dumping
Source: field data
FIGURE 7Quality testing laboratory (left), cooking test (middle) and rice colour sorting
©FAO/Sathguru
Chapter 1 – The rice subsector – Introduction and background 9
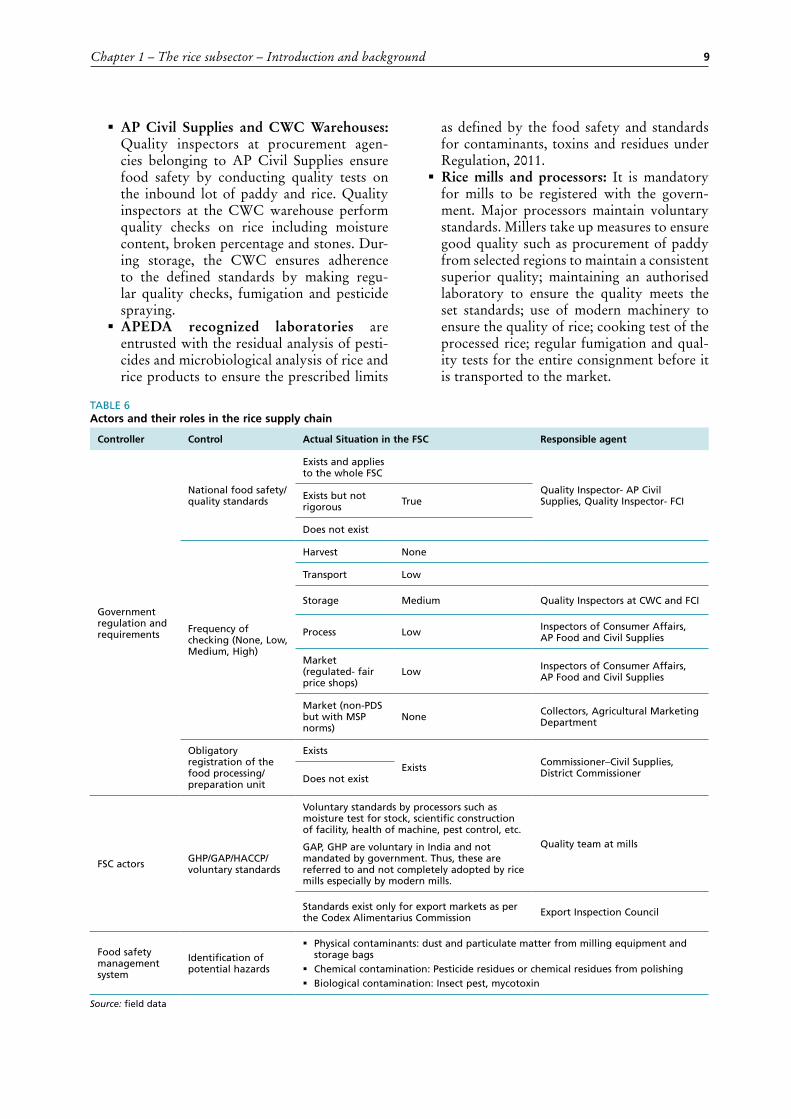
� AP Civil Supplies and CWC Warehouses: Quality inspectors at procurement agen-cies belonging to AP Civil Supplies ensure food safety by conducting quality tests on the inbound lot of paddy and rice. Quality inspectors at the CWC warehouse perform quality checks on rice including moisture content, broken percentage and stones. Dur-ing storage, the CWC ensures adherence to the defined standards by making regu-lar quality checks, fumigation and pesticide spraying.
� APEDA recognized laboratories are entrusted with the residual analysis of pesti-cides and microbiological analysis of rice and rice products to ensure the prescribed limits
as defined by the food safety and standards for contaminants, toxins and residues under Regulation, 2011.
� Rice mills and processors: It is mandatory for mills to be registered with the govern-ment. Major processors maintain voluntary standards. Millers take up measures to ensure good quality such as procurement of paddy from selected regions to maintain a consistent superior quality; maintaining an authorised laboratory to ensure the quality meets the set standards; use of modern machinery to ensure the quality of rice; cooking test of the processed rice; regular fumigation and qual-ity tests for the entire consignment before it is transported to the market.
TABLE 6Actors and their roles in the rice supply chain
Controller Control Actual Situation in the FSC Responsible agent
Government regulation and requirements
National food safety/ quality standards
Exists and applies to the whole FSC
Quality Inspector- AP Civil Supplies, Quality Inspector- FCIExists but not
rigorous True
Does not exist
Frequency of checking (None, Low, Medium, High)
Harvest None
Transport Low
Storage Medium Quality Inspectors at CWC and FCI
Process Low Inspectors of Consumer Affairs, AP Food and Civil Supplies
Market (regulated- fair price shops)
Low Inspectors of Consumer Affairs, AP Food and Civil Supplies
Market (non-PDS but with MSP norms)
None Collectors, Agricultural Marketing Department
Obligatory registration of the food processing/ preparation unit
Exists
Exists Commissioner–Civil Supplies, District CommissionerDoes not exist
FSC actors GHP/GAP/HACCP/ voluntary standards
Voluntary standards by processors such as moisture test for stock, scientific construction of facility, health of machine, pest control, etc.
GAP, GHP are voluntary in India and not mandated by government. Thus, these are referred to and not completely adopted by rice mills especially by modern mills.
Quality team at mills
Standards exist only for export markets as per the Codex Alimentarius Commission Export Inspection Council
Food safety management system
Identification of potential hazards
� Physical contaminants: dust and particulate matter from milling equipment and storage bags
� Chemical contamination: Pesticide residues or chemical residues from polishing � Biological contamination: Insect pest, mycotoxin
Source: field data

The Republic of India - Rice10
The Export Inspection Council (EIC), renders the following services either directly or through the Export Inspection Agencies:
� Quality certification of export of commodi-ties is through installation of quality assur-ance systems (In-process Quality Control and Self-Certification) in the exporting units as well as inspection of consignments.
� Quality certification of food items for export is through installation of Food Safety Man-agement Systems in the food processing units as per international standards.
� Different certificates are issued to exporters such as health and authenticity under various export product schemes.
� Issues Certificates of Origin to exporters. � Offers laboratory testing services.
See Table 6 for a summary of actors and their roles in the rice FSC.
India’s food safety standards are stricter for the export market than for the domestic market. Food safety inspections at the farmgate are insufficient.
INVENTORY OF ACTIVITIES AND LESSONS LEARNED FROM PAST AND ONGOING INTERVENTIONS To optimize the supply chain along the pro-duction, procurement and distribution to retail points, the state government has adopted several initiatives and streamlined the post-harvest value chain process. The main interventions are:
Minimizing loss at harvesting – Adoption of non-lodging, non-shattering varieties such as MTU 1064, MTU 7029 and harvesting at the optimum stage helps to achieve higher yields at harvest. These varieties were released by the Rice Agriculture Research Stations in the region and popularized by the Krishi Vigyan Kendra (KVKs), which is the primary link to farmers in their learning about the latest agricultural technology development, and serve as Farm Science Centres for diffusion of location specific technologies with a minimum time gap between development and transfer to the end users through extension services.
Subsidy schemes for mechanized harvesting – Schemes under Rashtriya Krishi Vikas Yojana (RKVY) provide a subsidy of USD 15 384 per unit of machinery. These subsidy schemes have promoted large-scale mechanization to address labour shortages.
Public-Private Partnerships (PPP) mode of paddy procurement – Private millers are engaged by the government to procure, transport, process and store paddy or rice on behalf of the govern-ment. The process has well-defined protocols to ensure market discipline, substantially improving the efficiency of the supply chain.
Minimum Support Price (MSP) for paddy – Each year the government upwardly revises the MSP for paddy, and ensures strict mechanisms to procure rice from farmers at or above the MSP. For the rabi season (2015–2016), the MSP for Common Grade rice was fixed at USD 216.92 and USD 223.07/tonne for Grade A rice. The initiative has recently motivated farmers to sell their entire produce.
Rodent control programme – In the coastal districts of Krishna, Guntur, East Godavari and West Godavari, the paddy crop is cultivated year-round, followed by summer pulses and thus the environment is hospitable for the breeding of rodents. The main objective of the implementation of a rodent control programme in paddy fields is to reduce yield losses caused by rodents and also to produce quality food grain. The activity is undertaken and monitored by the Block (Mandal) level officers in the farmer fields.
POLICY FRAMEWORK AND NATIONAL STRATEGY Rice, as one of the country’s food security crops, has always been the focus crop for the Central and State Government. Policies have been designed to address various bottlenecks across the supply chain. The main policies that are relevant to the paddy post-harvest supply chain are:
� Farm mechanization and post-harvest handling – In the AP State Action Plan 2015-2016, the component of mechanization at harvesting has been integrated into the Agriculture Plan. The policy aims to provide implements to farmer groups (Rythu Mitra Groups, Joint Liability Groups or JLG, etc.) under the RKVY scheme and to individual farmers under the Normal State Plan (NSP).
� Weather-based crop insurance – With the growing importance of climate smart agri-culture, various weather-based insurance schemes cover paddy for both growing sea-sons: kharif and rabi and are revised from time-to-time. The schemes cover production and post-harvest losses, which are assessed

Chapter 1 – The rice subsector – Introduction and background 11
at the farm level. Coverage is available for 2 to 3 weeks post-harvest, when the crop is harvested and left to dry in the fields and is affected by natural disasters. Unseasonal heavy rains in November–December, post-harvest, as seen in the last few years, has washed away farmers’ produce, especially in Andhra. The policy thus helps minimize farmers’ economic losses, even post-harvest. In AP, the districts that are rich in paddy cultivation such as East Godavari, West Godavari, Guntur and Krishna have created Village Insurance Units for other crops. The government subsidizes the programme by capping the premium percentage at 2.5 per-cent for paddy.
� Decentralized rice procurement policy – The policy was launched in 2012, and mandates the state to take responsibility for procuring food grains, store them scientifically and distribute them through the PDS, thereby bypassing the FCI, which was previously involved in direct procurement. Earlier, paddy procured by the state government was sent to the rice mills and the rice was stored at the Food Corporation of India warehouses and later supplied to the public distribution system shops. The policy has helped achieve self-reliance and econo-mize on warehouse space. On the ground, the scheme has improved distribution efficiency in the supply chain and reduced losses at the farm level as well as storage, as most processes are now taken care of by the organized channel.
� Procurement under the Custom Milled Rice (CMR) policy outlines the quality guidelines and the scientific design to be adopted for unloading, storage and processing of rice by the private mills. Under the CMR policy, millers are required to mill rice for the public distribution system. The millers are required to obtain dehusked or milled rice at 67 kg of rice or 68 kg of parboiled rice for every 100 kg of paddy provided to them. The initiative involves the participation of the private sec-tor and has well-defined protocols to ensure market discipline.
� National Food Safety and Quality Policy – Agmark drives the food safety, quality and grading criteria. On the ground implementa-tion is effective only for grading criteria for the domestic market. The Directorate of Marketing and Inspection (DMI) has defined Agmark standards.
RELEVANT INSTITUTIONS AND THEIR ROLES The Government’s agriculture and allied depart-ments are involved in supporting and controlling the paddy supply chain, as paddy is a commod-ity that falls under the Essential Commodity Act (ECA), which is an Act of Parliament that ensures the delivery and timely supply of selected com-modities to the consumer (Table 7).
OVERVIEW OF THE RICE SUPPLY CHAINSRice productivity in Nellore and East Godavari are above the national average and these districts have the main milling facilities in AP, thus the entire value chain for rice exists in the selected area. The selected districts fall under two different agroclimatic zones, East Godavari in the Godavari agroclimatic zone, receives from 800 to 1 000 mm of rainfall and makes up 14.8 percent of the state’s rice area. Nellore, on the other hand, falls under the state’s southern agroclimatic zone with from 700 to 1 000 mm of rainfall and making up 9.8 percent of the rice area.
The major varieties in East Godavari dis-trict are Cottondora Sannalu (MTU-1010) (IET 15644), Vijetha (IET-13967), MTU 1064, Triguna (IET-12875), Swarna (MTU 7029) and Sravani (NLR-33359). The main varieties in Nellore are (IET-14876), Somasila (NLR-33358), (IET-13932), Swathi (NLR-33057), (IET-11582), Vedagiri (NLR-33641), (IET-14328) are the main varieties for Nellore.
Table 8a lists the main FSCs in the subsector by geographical location, final product and market for the final product. Tables 8b and 8c were completed based on the information in Table 8a. In Table 8c a score was assigned of 1 (low), 2 (medium) or 3 (high) to the factors in the columns for each FSC.
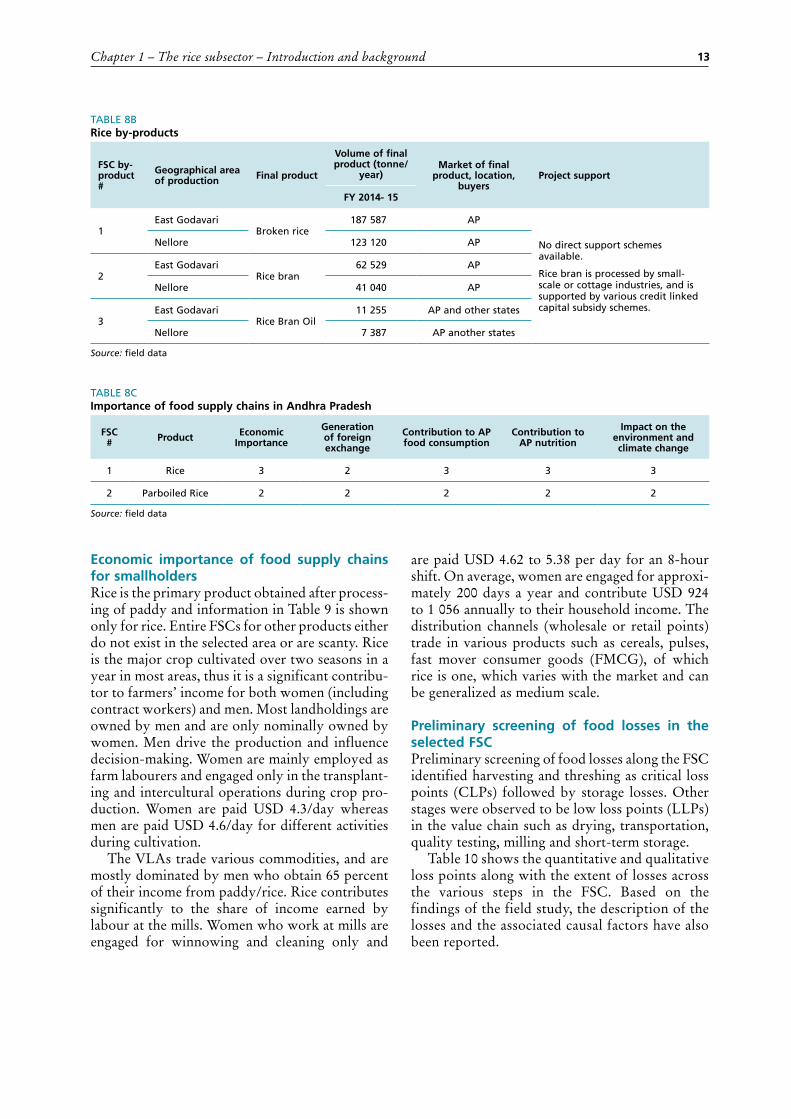
Rice by-products – The main intermediary prod-ucts obtained during rice processing are broken rice, rice husk and bran, which are traded in niche markets outside the state, and are not very impor-tant at the state level, see Table 8b.
Importance of Food Supply Chains in Andhra PradeshRice is a food staple and contributes significantly to national food consumption as well as nutrition. The total value generated for milled rice produced in the state is USD 3 230.78 million contributing approximately 62.91 percent to the rice economy (share of rice in the value of all products) in AP.

The Republic of India - Rice12
Parboiled rice is produced for export to overseas markets and other states and generates USD 581.24 million for the state contributing 11.32 percent to the rice economy.
The rice food supply chain was selected for the study because of the economic contribution of
rice, and its value as a staple food across the State was observed to be the highest. The entire value chain (farmers to retail) is present in the State (Table 8c).
TABLE 8AList of the main Main food supply chains in the rice subsector
FSC #
Geographical area of production
Final product
Volume of final product (tonne/
year)
Number, age and gender of smallholder producers
Market of final product, location, buyers
Project support
FY 2014-2015
1East Godavari
Rice1.56 million
80 %+ of paddy producers are small and marginal producers- with ~55 % workforce being female field labourers in the 20- 40 age group
AP (wholesale and retail shops)
� Minimum support price
� Decentralized procurement scheme
[Parboiled rice when processed for food security, follows decentralized procurement scheme]
Nellore 1.03 million
2
East Godavari
Parboiled Rice
234 000 AP, Kerala & Tamil Nadu
Nellore 154 000 Kerala & Tamil Nadu
Source: field data
TABLE 7List of the main AP institutions in the paddy/rice food supply chain
Institution or Department Type Role/Mandate activities
Department of Agriculture and Cooperation
Central Government
Responsible for formulating and implementing national policies and programmes to achieve rapid agricultural growth.
Department of Agriculture, Government of AP
State Government
Provides agriculture extension and training to farmers, introduction of high-yield varieties, supply of quality inputs, regulating the supply.
Consumer Affairs, Food and Civil Supplies
Central Government
Promotes consumer affairs and protects consumer rights in the State. In view of protecting the rights of consumers, increases awareness to enable consumers to protect themselves and safeguard the interest of consumers.
AP State Civil Supplies Corporation
State Government
Promotes, improves, develops counsel and finances production, purchases, stores, processes transportation, distribution and sale of food grains, foodstuffs and any other essential commodities and establishes laboratories for the purpose of ensuring quality control.
Food Corporation of India Central Government
Distributes food grains through the PDS, maintains buffer and operational stocks to ensure national food security, regulates market price and price support operations for consumers.
Central Warehousing Corporation
Central Government
Provides storage and handling, offers services in the area of clearing and forwarding, handling and transportation, procurement and distribution, disinfestation services, fumigation services and other ancillary activities.
AP State Warehousing Corporation
State Government
Provides storage facilities for food grains and other agriculture commodities, seeds, manure and fertilizers to minimize losses and deterioration in storage. The scheme also aims to enable farmers to have easy and cheap credit facilities from banks against pledges of the warehouse receipt.
Indian Institute of Rice Research (IIRR), Hyderabad (erstwhile AP)
Central Government
Rice Research Institute coordinates testing, technology transfer and consultancy services.
ANGRAU
Autonomous Agriculture Research Institution
Agriculture research, education and training.
Source: field data
Chapter 1 – The rice subsector – Introduction and background 13
Economic importance of food supply chains for smallholders Rice is the primary product obtained after process-ing of paddy and information in Table 9 is shown only for rice. Entire FSCs for other products either do not exist in the selected area or are scanty. Rice is the major crop cultivated over two seasons in a year in most areas, thus it is a significant contribu-tor to farmers’ income for both women (including contract workers) and men. Most landholdings are owned by men and are only nominally owned by women. Men drive the production and influence decision-making. Women are mainly employed as farm labourers and engaged only in the transplant-ing and intercultural operations during crop pro-duction. Women are paid USD 4.3/day whereas men are paid USD 4.6/day for different activities during cultivation.
The VLAs trade various commodities, and are mostly dominated by men who obtain 65 percent of their income from paddy/rice. Rice contributes significantly to the share of income earned by labour at the mills. Women who work at mills are engaged for winnowing and cleaning only and
TABLE 8CImportance of food supply chains in Andhra Pradesh
FSC # Product Economic
Importance
Generation of foreign exchange
Contribution to AP food consumption
Contribution to AP nutrition
Impact on the environment and climate change
1 Rice 3 2 3 3 3
2 Parboiled Rice 2 2 2 2 2
Source: field data
TABLE 8BRice by-products
FSC by- product #
Geographical area of production Final product
Volume of final product (tonne/
year)Market of final
product, location, buyers
Project support
FY 2014- 15
1East Godavari
Broken rice187 587 AP
No direct support schemes available.
Rice bran is processed by small-scale or cottage industries, and is supported by various credit linked capital subsidy schemes.
Nellore 123 120 AP
2East Godavari
Rice bran62 529 AP
Nellore 41 040 AP
3East Godavari
Rice Bran Oil11 255 AP and other states
Nellore 7 387 AP another states
Source: field data
are paid USD 4.62 to 5.38 per day for an 8-hour shift. On average, women are engaged for approxi-mately 200 days a year and contribute USD 924 to 1 056 annually to their household income. The distribution channels (wholesale or retail points) trade in various products such as cereals, pulses, fast mover consumer goods (FMCG), of which rice is one, which varies with the market and can be generalized as medium scale.
Preliminary screening of food losses in the selected FSCPreliminary screening of food losses along the FSC identified harvesting and threshing as critical loss points (CLPs) followed by storage losses. Other stages were observed to be low loss points (LLPs) in the value chain such as drying, transportation, quality testing, milling and short-term storage.
Table 10 shows the quantitative and qualitative loss points along with the extent of losses across the various steps in the FSC. Based on the findings of the field study, the description of the losses and the associated causal factors have also been reported.

The Republic of India - Rice14
TABLE 9Details of economic importance of food supply chains for smallholders
FSC # GenderPercentage of produce by Contribution to income-generation
(percentage share of annual income)
Smallholders Other Farmers VLAs Processors Wholesalers Retailers*
1Women 20 20 60-100 - - 90 70
Men 80 80 80-100 65 60 90 70
* The data is for PDS system only as private retailers have a wide-range of commodities and the percentage share of rice could not be determinedSource: field data
TABLE 10Preliminary screening for food losses in the selected food supply chains
FSC # Rice
Step in the FSC
Expected Loss Points (CLP/LLP)
Comments/ Remarks
Quantity Quality
Harvesting and threshing CLP 6 % LLP <1 %
Gaps in technical know-how on use of machines and lack of timely availability of machines
At the farm level, 30 to 35 bags of paddy (each bag of paddy weighs 75 kg) are harvested per ha with approximately 2 to 3 bags of loss.
Drying LLP 0.2 % Open and manual drying exposes the grains to feeding birds, and admixture of dust or stones that contribute to grain breakage during milling.
Transportation LLP 0.5 % _ Paddy is transported from the farm to the mill and losses occur as a result of pilferage during loading or unloading.
Quality testing (Miller level) _ _ Sample lots are drawn for quality testing. If quality is found below the
standards, the entire lot is rejected.
Milling LLP, <0.1 % Mills are modernized and operate using rubber hullers, minimising losses from milling.
Storage (at mills) LLP 0.2-0.5 % CLP 3 %
� Quantitative and qualitative loss observed depends on the duration of storage. The percentage was calculated based on a storage time of 6 months or more and the level of hygienic conditions for storage.
� For a medium-sized mill with a storage capacity of >5 000 tonne of rice; in one season the mill stores 20 000 to 25 000 bags for government channel (each bag weighs 50 kg); and 120 000 bags for the private channel (each bag weighs 25 kg).
Loss of approximately 240 to 600 (0.3 %) bags for government channel and 60 to 75 (0.3 %) bags for the private channel observed.
Transportation _ _ No loss during transportation of rice (packed in plastic bags)
Storage at CWC warehouses CLP 2-3 %
� Depending on the duration of storage, quality loss occurs as a result of suboptimal storage conditions leading to discoloration, breakage, moisture loss
� In CWC warehouse with a storage capacity of ~30 000 tonne of rice, storing 400 000 rice bags (50 kg bag), 7 000 to 10 000 bags of rice are lost as a result of improper storage conditions.
Storage at mandal level storage (MLS) points
_ _ Stock turnover ratio is within 20 days, thus no storage loss at this point observed
Storage at FCI Warehouse LLP, 0.2 % _ Percentage obtained directly from representative officials, and not based on
observation. (Entry into FCI warehouses for observation restricted)
Distribution (Fair Price Shops)
LLP, 0.01-0.05 % _ Pilferage at the time of distribution has been observed. The loss at fair price
shop is minimal because of the e- PDS) in place.
Distribution (Wholesale/Retail) - - Losses from pilferage occur only when sold in unpackaged form
Source: field data

15
THE RICE SUBSECTORThe study was conducted in East Godavari and Nellore districts, AP, from May to July 2016. The preliminary survey was in May followed by a detailed survey in June in East Godavari; whereas, in Nellore, the study was in July. The scheduling of the field visits followed the late harvesting threshing of rabi rice and the peak months for milling activities in May, June, July respectively. The cultivation season for paddy in East Goda-vari district is kharif (June to October) and rabi (December to April) whereas in Nellore, the seasons are early kharif (April-August) and rabi (October to March).
In the surveyed areas, the rice supply chain is highly organized and there are both public distribution systems (PDS) and private channels for marketing. Large farmers directly supply their paddy to the mills, reducing the costs of the inter-mediary, whereas smallholder farmers sell their produce to mills through village level aggregators. After processing, the mills supply the government warehouses or wholesalers.
The region is made up of small (<0.5 tonne/day), medium (0.5 to 2 500 tonne/day) and large (>2 500 tonne/day) mills. The small mills are engaged at the village level where they offer milling services to clients who use the milled rice for household
consumption whereas the medium and large mills cater to the milling needs of government and the commercial market.
The percentages of recovery for rice and other intermediate and by-products from paddy across the FSC are shown in Table 11.
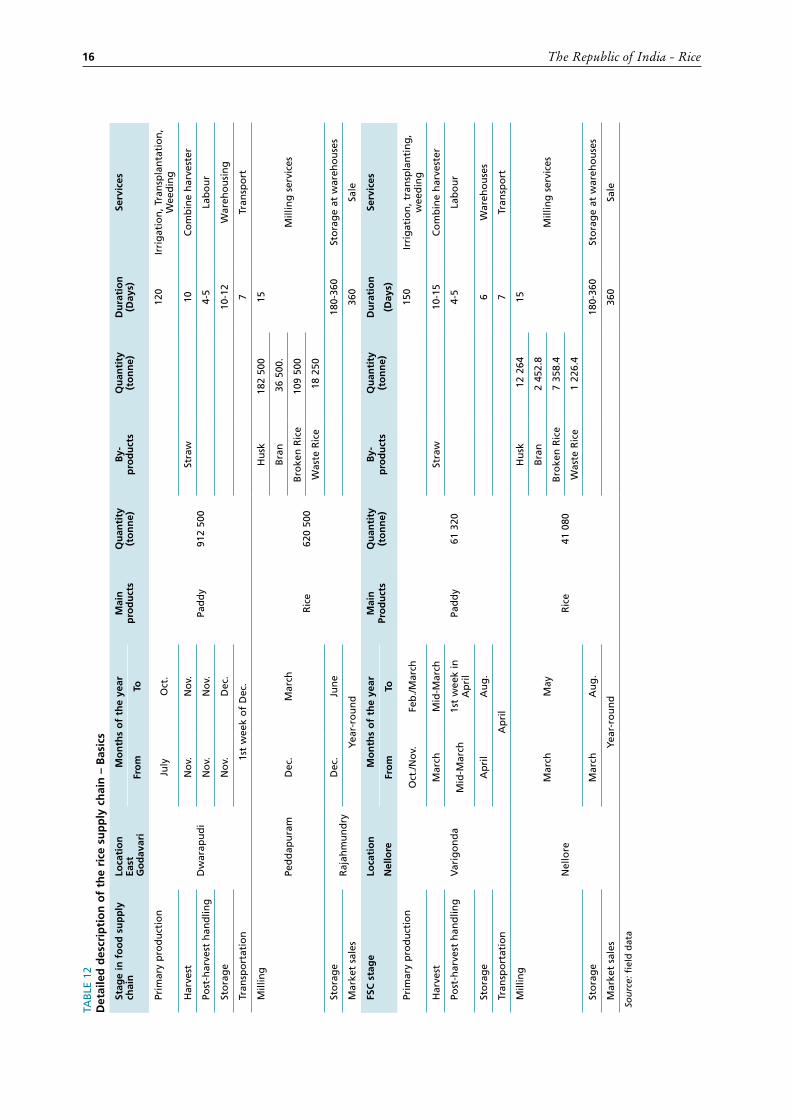
The description of the flow of the products in the various steps of the FSC, the services provided and the duration of each activity is shown in Table 13. The FSC starts at the village level and ends at retail points. The entire production process lasts 120 days, followed by processing (within a month) and storage for future consumption, which extends to a year or more.
It was observed that the following actors play a significant role in the rice value chain: Farmers as the basic supplier of paddy, VLAs, rice process-ing industries, warehouse managers, distribution agents, and retailers.
� Farmers are involved in the primary stage of the rice supply chain as they supply paddy to the rice processing companies, both directly and through intermediaries. Typi-cally, a farmer handles cultivation, harvesting, threshing, drying and packing of paddy.
� Operators of combine harvesters: Harvest-ing operations are manual as well as mechani-cal. Manual harvesting is more prevalent dur-
Chapter 2
The food supply chain – Situation analysis
TABLE 11Intermediary products and conversion factors in the food supply chain
Activity in the process Duration Product out Weight from 100 in kg Error (± %)
Percentage of conversion
factor
Milling-polishing
These steps are continuous processes
Rice 60 5 60-65
Milling-de husking Rice husk 20 5 20-25
Milling-de hulling Rice bran 6 2 4-6
Milling-grading Broken rice 12 4 12-16
Milling-grading Waste rice 2 3 2-8
Source: field data
The Republic of India - Rice16
TAB
LE 1
2D
etai
led
des
crip
tio
n o
f th
e ri
ce s
up
ply
ch
ain
– B
asic
s
Stag
e in
fo
od
su
pp
ly
chai
nLo
cati
on
East
G
od
avar
i
Mo
nth
s o
f th
e ye
arM
ain
p
rod
uct
sQ
uan
tity
(t
on
ne)
By-
p
rod
uct
sQ
uan
tity
(t
on
ne)
Du
rati
on
(D
ays)
Serv
ices
Fro
mTo
Prim
ary
pro
du
ctio
n
Dw
arap
ud
i
July
Oct
.
Pad
dy
912
500
120
Irri
gat
ion
, Tra
nsp
lan
tati
on
, W
eed
ing
Har
vest
No
v.N
ov.
Stra
w10
Co
mb
ine
har
vest
er
Post
-har
vest
han
dlin
gN
ov.
No
v.4-
5 La
bo
ur
Sto
rag
eN
ov.
Dec
.10
-12
War
eho
usi
ng
Tran
spo
rtat
ion
1st
wee
k o
f D
ec.
7Tr
ansp
ort
Mill
ing
Ped
dap
ura
mD
ec.
Mar
ch
Ric
e62
0 50
0
Hu
sk18
2 50
015
Mill
ing
ser
vice
sB
ran
36 5
00.
Bro
ken
Ric
e10
9 50
0
Was
te R
ice
18 2
50
Sto
rag
eR
ajah
mu
nd
ryD
ec.
Jun
e18
0-36
0 St
ora
ge
at w
areh
ou
ses
Mar
ket
sale
sY
ear-
rou
nd
360
Sale
FSC
sta
ge
Loca
tio
n
Nel
lore
Mo
nth
s o
f th
e ye
arM
ain
Pr
od
uct
sQ
uan
tity
(t
on
ne)
By-
p
rod
uct
sQ
uan
tity
(t
on
ne)
Du
rati
on
(Day
s)
Serv
ices
Fro
mTo
Prim
ary
pro
du
ctio
n
Var
igo
nd
a
Oct
./No
v.Fe
b./M
arch
Pad
dy
61 3
20
150
Irri
gat
ion
, tra
nsp
lan
tin
g,
wee
din
g
Har
vest
Mar
chM
id-M
arch
Stra
w10
-15
Co
mb
ine
har
vest
er
Post
-har
vest
han
dlin
gM
id-M
arch
1st
wee
k in
A
pri
l 4-
5 La
bo
ur
Sto
rag
eA
pri
lA
ug
.6
War
eho
use
s
Tran
spo
rtat
ion
Ap
ril
7Tr
ansp
ort
Mill
ing
Nel
lore
Mar
chM
ay
Ric
e41
080
Hu
sk12
264
15
Mill
ing
ser
vice
sB
ran
2 45
2.8
Bro
ken
Ric
e7
358.
4
Was
te R
ice
1 22
6.4
Sto
rag
eM
arch
Au
g.
180-
360
Sto
rag
e at
war
eho
use
s
Mar
ket
sale
sY
ear-
rou
nd
360
Sale
Sou
rce:
fie
ld d
ata
Chapter 2 – The food supply chain – Situation analysis 17
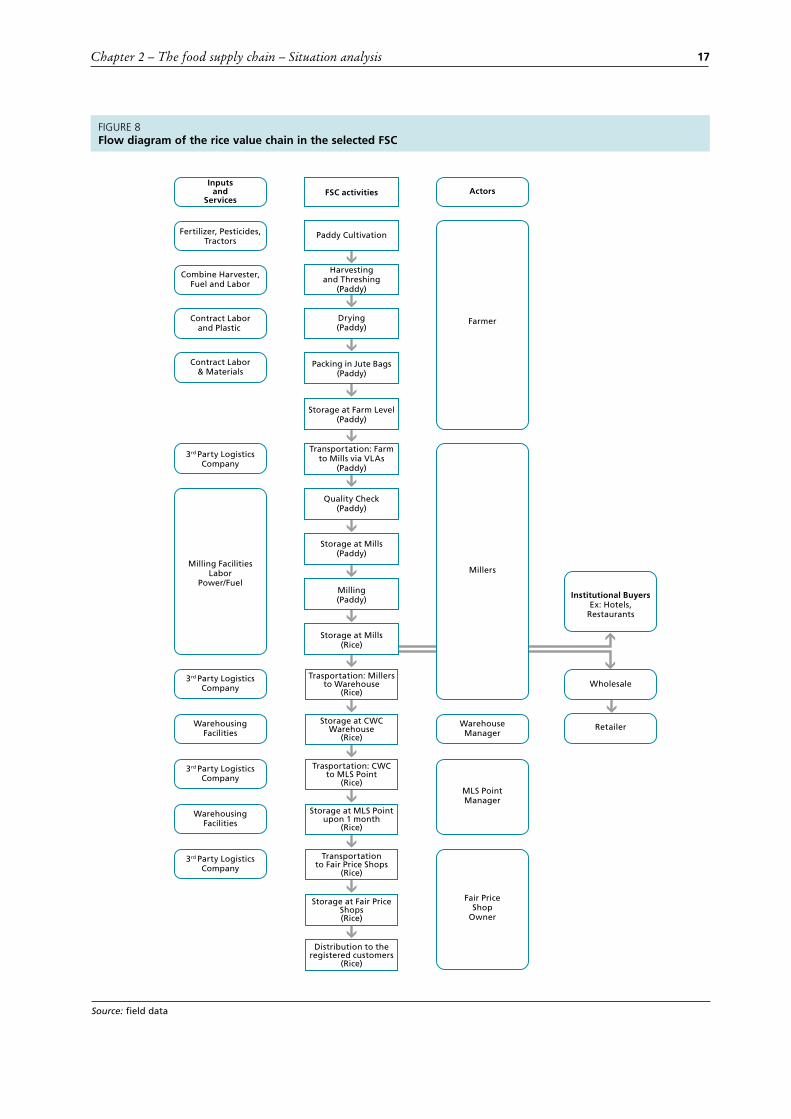
FIGURE 8Flow diagram of the rice value chain in the selected FSC
Distribution to theregistered customers
(Rice)
FSC activities
Paddy Cultivation
Harvestingand Threshing
(Paddy)
Drying(Paddy)
Packing in Jute Bags(Paddy)
Storage at Farm Level(Paddy)
Transportation: Farmto Mills via VLAs
(Paddy)
Quality Check(Paddy)
Storage at Mills(Paddy)
Milling(Paddy)
Storage at Mills(Rice)
Trasportation: Millersto Warehouse
(Rice)
Storage at CWCWarehouse
(Rice)
Trasportation: CWCto MLS Point
(Rice)
Transportationto Fair Price Shops
(Rice)
Storage at Fair PriceShops(Rice)
Inputsand
ServicesActors
Fertilizer, Pesticides,Tractors
Combine Harvester,Fuel and Labor
Contract Laborand Plastic
Contract Labor& Materials
3rd Party LogisticsCompany
3rd Party LogisticsCompany
WarehousingFacilities
WarehouseManager
Wholesale
Retailer
3rd Party LogisticsCompany
MLS PointManager
Institutional BuyersEx: Hotels,
Restaurants
Fair PriceShop
Owner
WarehousingFacilities
3rd Party LogisticsCompany
Milling FacilitiesLabor
Power/Fuel
Farmer
Millers
Storage at MLS Pointupon 1 month
(Rice)
Source: field data

The Republic of India - Rice18
ing the kharif season when rice is cultivated under rainfed conditions whereas during rabi rice is irrigated, mechanical harvesters are deployed for harvesting the paddy crop.
� Manual harvesting is by both men and women. Mechanical harvesters are preferred as they help address the crisis of labour availability during the peak agriculture sea-son. Although mechanization has a positive impact on the farmer, the people engaged as agricultural labour are challenged as their livelihood is being replaced by machinery.
� Labourers are engaged in production, dry-ing and packaging during paddy cultivation; loading and unloading for transportation and various operations during milling and processing of the paddy. Rice transplantation is completely handled by women; men are seldom involved. Women can also be seen weeding and drying. Harvesting is mostly mechanized and the machine operators are men. Most post-harvest practices are male dominated and women are only involved in cleaning and sometimes in packaging.
� Village Level Aggregators play an important role in the rice value chain as they are respon-sible for the procurement of paddy for the Government as well as the millers. They buy paddy from various farmers in the village and sell it to the millers at a predetermined price. A single village has one or two aggregators who collect the produce from the entire vil-lage. They are also responsible for transpor-tation of the harvested paddy from field or farmer storage to the processor. Though the
transportation charges are included in their commission, the VLA is accountable for the physical transfer of the product. During the study visits it was observed that the activities of the village level aggregator are only carried out by men.
� Transporters take the paddy from the village to the mills, mills to market and warehouses, and from warehouses to fair price shops. Rice is transported from one state to another by truck or by rail.
� Processor/Miller: The processor is the pivot in the supply chain where value addition in primary product occurs. The miller handles the following activities: - Procurement: The processor procures
paddy from farmers through village aggre-gators from multiple villages. In the case of procurement under the CMR policy, the Government allocates specific regions, and the amount to be processed by each miller, based on processing capacity. The allocated amount of paddy is then procured by the processor through the VLA and processed.
- Quality testing at mills of the transported paddy is conducted by the laboratory at the mill or processing factories. Tests evaluate the paddy for moisture level and uniform-ity of grains, based on which the grains are divided into Common Grade and Grade A. Samples are collected for random test-ing using a rod which is inserted into the gunny bags, a sample is extracted and the test conducted as per recommendation of quality standards by FSSAI.
- Processing/Milling: Paddy is cleaned to remove unwanted matter including mud, stones and chaff. This cleaned lot is then fed to the dehusker where it is separated with the help of rubber roller. The brown rice is then taken to a huller where it is pol-ished using mild friction in the polishing chamber. The resulting polished rice and bran are separated and collected.
- Packaging: Rice is packed in 50 kg and 25 kg bags for the PDS and private sales respectively.
- Storage: The millers store rice that for private markets under the mill brand name.
- Transportation: Millers transport the rice to CWC warehouses through third-party transporters whereas wholesalers send vehicles to mills to procure rice for sale.
FIGURE 9Combine harvester
©FAO/Sathguru

Chapter 2 – The food supply chain – Situation analysis 19
� Warehouse Manager (FCI and CWC) is in charge of organizing the safe and efficient receipt, stockpiling, maintenance and dis-patch of the products.
� Fair Price Shop owners take delivery of stocks from authorized nominees of the state government to ensure essential commodities are available within the first week of the month and sold to beneficiaries.
MARKETING SYSTEMS IN THE RICE SUPPLY CHAIN Small-scale producersThe marketing systems for rice follow two chains: the government system (Public Distribution System-PDS) and the private chain (wholesaler and retailer).
The Government allots a fixed quantum of paddy to be milled at every registered processor in the state. The millers procure paddy at the MSP during the season and process it. After processing, the miller transports the rice to the mandal level storage (MLS) points or the CWC warehouses or FCI warehouses. The government also allocates a specific quantity of rice to different FPS to be sold to consumers at highly subsidized rates. The fair price shop owners procure the allotted quantity from the MLS point and distribute it to the consumers.
Private: The entire produce is not sold at the same time. After harvesting some farmers store the paddy, as they anticipate an increase in price. Millers procure the paddy at differential prices for the private channel, taking advantage of market dynamics and accordingly vary the rates of rice at wholesale points. The usual model followed for rice in this system is that the rice processors procure the paddy from farmers and sell it to wholesalers who in turn sell it to the retailers. Some of the large processors have their own franchise through which the business is operated. In contrast, some large retailers have developed backward integration through which they have established direct procurement from villages and sell to urban customers. The prevailing retail market rates are USD 0.54-0.62 / kg (INR 35-40) for the common grade rice up to USD 0.92 /kg (INR 60).
INVOLVEMENT OF ACTORS IN THE SUPPLY CHAIN BENEFITS, JOB CREATION AND INCOME Economic data Involvement of men and women along the FSC is dependent on the type of activity being con-
ducted at the different stages. All involved in the different activities across the value chain are of working age and typically range between 21 to 50 years old. At the primary production stage, men are involved in land preparation, fertigation and spraying for pesticides. The equipment the men use for these activities are tractors for land preparation, diesel operated pump sets for irriga-tion and hand sprayers for pesticides. Activities such as raising plants in a nursery, transplanta-tion of paddy are done by women. Harvesting is a male dominated activity and is conducted by third-party operators (combine harvesters). The crop is harvested in the presence of the farmers. The involvement of women in post-production activities are limited to cleaning at the mills and wholesale levels, whereas they are engaged in sales at retail stores and large market chains and, to some extent, at rural kirana (traders of consumer goods) stores.
When paddy rice is stored at the household level, women’s involvement is extended to carrying the bags from the field to the storage point at home and maintenance of the stored paddy. The storage conditions at the household level are moderately good to poor in various households. The storage at different levels in the FSC, i.e. millers, state and central government warehouses are handled by men who load, unload paddy or rice, stack bags, spray for pest management, whereas women are engaged in cleaning and winnowing. The storage conditions at the mills and government warehouses are good, where the rice is stored in jute or tarpaulin bags.
At the marketing stage, women are involved in the main activities of sale in both the public and private channels. Fair Price Shops are the major retail outlets and have moderate storage space and conditions. Rural shops, as well as organized, retail chains are also involved in retail sales.
In general, women’s wages are 20 to 22 percent lower than the men for comparable activities in the value chain. A high percentage of women engage in the aforementioned activities as contract labours. The access of women in the FSC to technology and decision-making in terms of selection of varieties for cultivation, different cultivation activities and marketing were observed to be minimal during the study. Also, it was observed that in rural areas, men are the head of the household and control the income earned by women in the family whereas, in urban areas, women have comparatively greater control over their income (Table 13).

The Republic of India - Rice20
TAB
LE 1
3D
etai
led
des
crip
tio
n o
f th
e fo
od
su
pp
ly c
hai
n –
so
cial
str
uct
ure
s
FSC
STE
PS
Invo
lvem
ent
of
wo
men
Invo
lvem
ent
of
men
Wh
o is
mai
nly
in
volv
ed: M
en,
wo
men
, ch
ildre
n
Org
aniz
atio
n
leve
l of
FSC
ac
tors
Gen
der
/So
cial
pat
tern
s:
Ob
serv
atio
ns
and
rem
arks
th
at e
xpla
in t
he
cho
sen
qu
alif
iers
an
d/o
r g
ive
add
itio
nal
info
rmat
ion
Gir
lsA
du
lt
wo
men
Bo
ysA
du
lt m
en
Qu
alif
ier1
Qu
alif
ier
Qu
alif
ier
Qu
alif
ier
Prim
ary
pro
du
ctio
n3
3
Men
an
d w
om
enH
ou
seh
old
Lab
ou
r in
ten
sive
act
ivit
ies
are
han
dle
d b
y m
en
Har
vest
3
Men
Priv
ate
Har
vest
ing
in t
he
sele
cted
dis
tric
ts is
hig
hly
mec
han
ized
(60
%),
men
o
per
ate
the
mac
hin
ery
Post
-har
vest
, h
and
ling
2
2
Men
an
d w
om
enH
ou
seh
old
Load
ing
of
bag
s h
and
led
by
men
. Wo
men
are
invo
lved
on
ly in
sti
tch
ing
o
f th
e b
ags
Sto
rag
e
2
2M
en a
nd
wo
men
Ho
use
ho
ldSt
ora
ge
at f
arm
er le
vel i
s ve
ry lo
w (
2 %
) an
d is
han
dle
d b
y m
en a
nd
w
om
en b
oth
Tran
spo
rtat
ion
3
Men
Priv
ate
Tran
spo
rtat
ion
is m
ale
do
min
ated
an
d d
on
e b
y vi
llag
e ag
gre
gat
ors
usi
ng
tr
acto
rs, t
ruck
s o
r lo
rrie
s
Ag
ro-
pro
cess
ing
3
3
Men
an
d w
om
enPr
ivat
ePr
oce
ssin
g is
han
dle
d b
y p
riva
te m
iller
s an
d is
wel
l mec
han
ised
. Th
e m
ach
ines
are
op
erat
ed b
y m
en w
her
eas
wo
men
are
invo
lved
in c
lean
ing
Sto
rag
e
3
3M
en a
nd
wo
men
Priv
ate
and
G
ove
rnm
ent
Phys
ical
lab
ou
r su
ch a
s lo
adin
g, u
nlo
adin
g o
f p
add
y/ri
ce is
by
men
, wh
ile
wo
men
are
invo
lved
in c
lean
ing
an
d w
inn
ow
ing
Tran
spo
rtat
ion
3
Pr
ivat
eTr
ansp
ort
atio
n f
rom
mill
s an
d g
ove
rnm
ent
war
eho
use
s is
mal
e d
om
inat
ed a
nd
is d
on
e b
y vi
llag
e ag
gre
gat
ors
usi
ng
tra
cto
rs, t
ruck
s o
r lo
rrie
s, w
hic
h a
re h
ired
on
co
ntr
act
bas
is
Wh
ole
sale
3
3
Men
an
d w
om
enPr
ivat
eB
oth
men
an
d w
om
en h
and
le s
ale
of
the
pac
ked
pro
du
ct a
s w
ell a
s lo
ose
ri
ce t
o c
on
sum
ers.
Wo
men
are
als
o in
volv
ed in
cle
anin
g
Ret
ail
3
3
Men
an
d w
om
enPr
ivat
eSa
le o
f th
e p
rod
uct
is h
and
led
by
bo
th m
en a
nd
wo
men
, cle
anin
g b
y w
om
en a
nd
load
ing
/un
load
ing
of
the
sto
ck b
y m
en
Qu
alif
iers
fo
r eq
uip
men
t, c
on
dit
ion
s, a
cces
s to
ser
vice
s an
d t
rain
ing
; 4: e
xcel
len
t; 3
: go
od
; 2: m
od
erat
ely
go
od
; 1: b
adSo
urc
e: f
ield
dat
a

Chapter 2 – The food supply chain – Situation analysis 21
cessing and the rice is sold through fair price shops at a highly subsidized rate. Thus the value added margin at every step is not a true representation of the economics of the FSC. The MSP for 2014-2015 rabi season was fixed at USD 216.92 per tonne of paddy.
The farmer sells to millers for the private trade system:
� For the private market, the miller varies the sale price for paddy with respect to the demand–supply market conditions. At mar-ket prices above the MSP, the farmer benefits. The miller bears the cost of processing and transport and sells at the prevailing market price. The miller may also store the rice in anticipation of rising prices.
Description of the food supply chain – economicsAddition of maximum value to the price of rice occurs at the miller’s level for both marketing systems. With the rising cost of production, the farmer has been realizing lower margins. Rice being a staple food crop, the Government intervenes through various input subsidies for fertilizers, seeds and credit to subsidize crop production costs.
Two scenarios have been presented below to assist understanding of the economics of the FSC:
The farmer sells to millers through the PDS system:
� Farmer receives the price for paddy at the minimum support price, and the miller also receives the government fixed rate for pro-
TABLE 14Scenario 1: PDS system; Farmer sells to millers at MSP
Stage in FSC Main Products
Cost of production (USD/tonne) Value of products (USD/tonne) Value added/margins
(USD/tonne)
Primary production
Paddy
171
Production at farmer levelHarvest 34
Drying 3
Sale to miller point (MSP rate) 217 9
Transportation
4 At Miller level, Price paid to Miller which is fixed by Government
Storage
Agroprocessing
Transportation
RiceStorage at CWC 1
Market sales 15-154 Prices are subsidised by Government
Source: field data
TABLE 15Scenario 2: Private market system; farmer sells to millers at market price
Stage in food supply chain Main products
Cost of production (USD/tonne)
Value of products (USD/tonne)
Value added/margins (USD/tonne)
Primary production
Paddy
171
Harvest 34
Drying 3
Sale to miller point (market price; Market price> MSP)
231 23
Transportation 2
Agroprocessing 18
Market sales Rice 385 174
Source: field data

The Republic of India - Rice22
In the current market scenario, the farmer realizes a higher price in the latter option as the prices paid to the farmers are higher (USD 231/tonne).
Detailed description of the food supply chain – environmentAcross the FSC, various factors described below such as operation of equipment, use of chemicals, fuels, land, water etc. affect the environment.
� Tools, equipment, facilities: A wide variety of equipment and products are required in operations on a particular farm. The rice industry has witnessed a drastic cut in labour needs as a result of mechanization (tractors, combine harvesters); further labour reduc-tions are expected as automation and digi-talization lead to more efficient production. Mechanization at the drying and storage level is still at an early stage. There is great scope for improvement in terms of infrastructure development at the level of farm storage.
� Chemicals: Different pesticides used during cultivation and storage are listed in Table 16. Farmers usually spray more than the optimum required for management of disease pests, which then either remains as residues in the product or dissolves in the runoff water and affects soil and streams nearby.
� Energy: The rice milling industry is one of the most energy consuming industries. A typical processing unit involves dehusking, dehulling, polishing and sorting. The major energy consuming equipment at the rice milling units includes boilers and steam dis-tribution, sorter, polisher, blowers, pumps, conveyers, elevators, motors, transmission and weighing systems.
� Water consumption is as high as 3 000 liters for the production of 1 kg of rice. Most of the water consumption in the rice chain was observed at the production and processing stages. At the production level, rain and irri-gation water are necessary for rice growth in two ways: to maintain soil moisture and – in
wet irrigation – to maintain the standing layer of water over the paddy field. In the selected regions, the crop is grown using irrigated water. A resultant advantage is that part of the water used in wetland farming percolates back into the ground, thus re-establishing the balance in the water table. Flooded irriga-tion, however, is a major source of GHG emissions and adds to the salinity of soil over the years. Water is used during processing to clean the paddy, produce steam and to boil rice. Usually, the used water is discharged into open fields without treatment, further leading to groundwater pollution.
Factors in the environmental assessmentThe factors considered for the environmental assessment were grouped into farming practices such as land preparation, soil quality, water use efficiency and GHG emission and processing activities: water use and reuse, use of by-products and energy efficiency. The water use for cultiva-tion was observed to be a major challenge, as cultivation in East Godavari is in continuously waterlogged fields, leading to increased emissions of GHG gases especially methane (CH4). Another source of GHG emissions and other pollutants such as dust and smoke occurs during the process-ing operations at both small and large mills. As far as the reuse of by-products from processing is concerned, the larger mills were observed to operate more efficiently, for example rice husks are used in the boiler to generate energy and fly ash is transported to brick kilns.
The GHG emissions are dominated by meth-ane from the paddy field and Nitrous Oxide also contributes significantly. The second largest emis-sions occur during parboiling because rice husks are used to create the heat. As there is incomplete combustion, a fraction of the carbon is released as methane, which is 25 times more potent as a GHG than carbon. Methane emissions occur over an area and the higher the yield, the lower the emis-sions per tonne of final product.

Chapter 2 – The food supply chain – Situation analysis 23
TABLE 16Equipment and chemicals used in the rice food supply chain
Production Quantity Unit
Tools, equipment,
Facilities
Tractor (for small to medium farms)
Diesel operated1 Per ha
Combine harvester thresher (small to medium farms), Diesel operated 1 Per ha
Materials Seeds (varieties for medium to long duration) 15 kg/acre
Chemicals
Fertilizers
Nitrogen (basal and top dressing) 120 kg/acre
P2O5 (basal dose) 60 kg/acre
K2O (top dressing for long duration varieties) 40 kg/acre
Fungicides: Carbendazim, Edifenphos 50 EC,
Tricylozole, Hexaconazole
Insecticides: Profenofos, Monocrotophos, Acephate
Buprofezin, Carbofuran, Cartap hydrochloride
10-12 Sprays per season
Herbicides: Pre and Postemergent (0- 10DAT)
Pretachlor/Oxadiazil/Butachlor/Phyzosulfuron/ Ethoxysuluron/Visphyricivax,
1-2Applications per
season
EnergyDiesel (tractor + Irrigation pump set)
Consumption varies with area of operation, number of irrigations required)
7-10 litres Per ha
Water Paddy crop consumes the maximum amount of water (Irrigation + milling) 3 000- 4 000 Litre/kg of rice
Land Gross cropped area (GCA) for paddy in AP 86 14 768 ha
Storage (Millers, warehouses) Quantity Unit
Tools, Equipment, Facilities
Captive storage with use of pallets for elevation, ventilators, plinth, stack size and rodent traps
Varying capacity ranging from 50 – 250 tonne (small) to above 2 000 tonne
(large)
Materials Gunny bags (for government procurement and private), plastic bags (for private channel only)
1
1
75 kg (jute bags)
50 kg (plastic bags)
Chemicals
� Fumigants Dichorvos (DDVP) to be sprayed once in 20-30 days
� To control stored grain insect pests (weevil, beetle, borer etc.)
Deltamethrin 2.5 % WP sprayed once in 3 months
Malathion sprayed once in two weeks
3 litres for 100 m2 area on floor and open spaces not on bags
Deltamethrin @1 200 g/ ha
1 litre/270 m3
EnergyElectricity consumption is minimal and is limited to general administration of the warehouses, activities such as spraying are done in daylight
NA
Transportation from Farmer to Mill and Mill to Warehouse Quantity Unit
Tools, Equipment, Facilities
Lorries/trucks (diesel operated); Rail tracks for intra-district and intrastate transport 17 tonne Load (FCI), varied
for private purpose
Energy Diesel for transportation; consumption varies with distance4 km/litre
Trucks

The Republic of India - Rice24
Processing Quantity Unit
Tools, Equipment, Facilities
Dryer, hullers, rollers, DE stoner, boilers, conveyor belts, sorter, polisher and packaging machine Varying capacity
Materials Raw material paddy
Chemicals Chalk for rice polishing
Energy � Rice husk for boiler and/ turbine system
� Additional Thermal energy to meet balance requirement437.5 kWh/ tonne of
paddy
Water - - -
Wholesale/ Retail Quantity Unit
Tools, Equipment, Facilities Store premises Varies with area of store
Energy Electricity consumption for running of store NA
Source: field data
TABLE 16(Continued)
TABLE 17Factors in the environmental assessment
Factors Description Details
Production system Rainfed and irrigated Both productions systems are used
Land preparation practices
Intercultural operations (such as puddling) Disturbs the soil structure affecting the soil micro fauna
Soil quality and land degradation
Nutrient depletion
Soil erosion
Application of pesticides
Usually, waterlogged farming is practiced in these areas. During draining nutrients are also drained with the water out of the soil, leading to nutrient deficiency in the soil.
Waterlogging leads to soil salinization.
Runoff from the farm contaminates the soil, thereby degrading the soil health disturbing the soil microfauna.
Fertilizer manufacture and utilization
Fertilizers containing Nitrogen, Phosphorus and Potassium are commonly used for paddy cultivation.
Fertilizer runoff into streams, canals or ponds results in algal bloom leading to eutrophication.
Application of fertilizer causes groundwater pollution as part of the fertilizer accumulates in the soil or is lost as runoff, increasing the nitrate level of soil and water.
Application of fertilizers also significantly contributes to greenhouse gases as they emit N2O.
Moreover, the manufacture of fertilizer is also very energy intensive
Water regimeWater intensive crop
Water pollution
Double cropping system depletes the water table.
Untreated water is discharged from the field and processing units, which further seeps into the water table contaminating it.
Sources of GHG emission and particulates
Paddy cultivation and milling Units and combine harvesters
GHG (CH4, N2O) emission: 9-12 %
Particulates: Smoke and dust from mills and loading- Unloading
Use of residues in the supply chain
Biomass rice husk is used to fuel the boilers
Bioenergy that reduces the dependency on fossil fuel, reducing CO2 emission.
Fly ash generated is sent to brick kilns or road construction
Water used in production of electricity
Though observed at few mills, this use of water reduces the release of refuse into the groundwater thus reducing the environmental impact
Re-use of food Losses
High percentage of recovery of rice from paddy and less broken rice
Broken rice is further processed to rice flour or rava at smaller mills
Source: field data
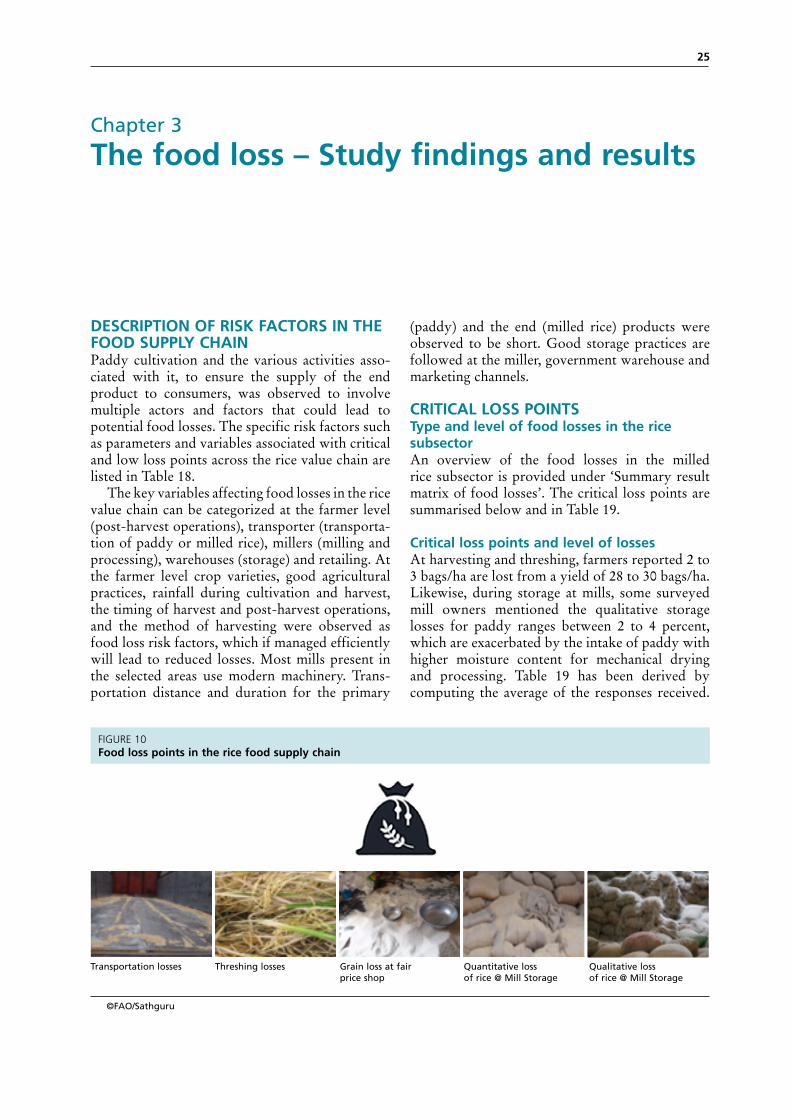
25
DESCRIPTION OF RISK FACTORS IN THE FOOD SUPPLY CHAINPaddy cultivation and the various activities asso-ciated with it, to ensure the supply of the end product to consumers, was observed to involve multiple actors and factors that could lead to potential food losses. The specific risk factors such as parameters and variables associated with critical and low loss points across the rice value chain are listed in Table 18.
The key variables affecting food losses in the rice value chain can be categorized at the farmer level (post-harvest operations), transporter (transporta-tion of paddy or milled rice), millers (milling and processing), warehouses (storage) and retailing. At the farmer level crop varieties, good agricultural practices, rainfall during cultivation and harvest, the timing of harvest and post-harvest operations, and the method of harvesting were observed as food loss risk factors, which if managed efficiently will lead to reduced losses. Most mills present in the selected areas use modern machinery. Trans-portation distance and duration for the primary
(paddy) and the end (milled rice) products were observed to be short. Good storage practices are followed at the miller, government warehouse and marketing channels.
CRITICAL LOSS POINTS Type and level of food losses in the rice subsector An overview of the food losses in the milled rice subsector is provided under ‘Summary result matrix of food losses’. The critical loss points are summarised below and in Table 19.
Critical loss points and level of lossesAt harvesting and threshing, farmers reported 2 to 3 bags/ha are lost from a yield of 28 to 30 bags/ha. Likewise, during storage at mills, some surveyed mill owners mentioned the qualitative storage losses for paddy ranges between 2 to 4 percent, which are exacerbated by the intake of paddy with higher moisture content for mechanical drying and processing. Table 19 has been derived by computing the average of the responses received.
Chapter 3
The food loss – Study findings and results
FIGURE 10Food loss points in the rice food supply chain
©FAO/Sathguru
Transportation losses Threshing losses Grain loss at fair price shop
Quantitative loss of rice @ Mill Storage
Qualitative loss of rice @ Mill Storage

The Republic of India - Rice26
TABLE 19Critical loss points and level of losses
Critical loss points Product Type of loss Percentage of loss
Harvesting and threshing Paddy Quantitative 7 to 10
Storage* at mills Paddy Qualitative 3
Storage at CWC warehouse Paddy Qualitative 2 to 3
* The storage losses reported are based on the data provided by representatives and are for long-term storage of 6 months or moreSource: field data
TABLE 18Food loss risk factors
Variable UnitParameter - relation to food losses-Contributing to Low loss
Value of variable (observed in the case study)
Variety Name Non-shattering varieties Both shattering and non-shattering varieties
Good agricultural practices Yes/No Yes
Selection of high-yielding varieties from established sources, irrigation, proper doses of fertilizers, pest management and harvesting techniques
Rainfall during cultivation mm 175-300 318.7-768.1 (East Godavari) 331.3-661.4 (Nellore)
Optimum Temperature during cultivation °C 20-40 °C 26-38 °C
Harvest technology L/M/H High level of mechanization Medium
Operation of combine harvesters L/M/H High skill level of operator Low
Processing Technology L/M/H High output processing High output processing
Good maintenance practices at mills L/M/H High-regular maintenance
practices Medium and high quality
Packaging materials L/M/H High quality Medium and high quality
Packaging practices L/M/H High quality High quality
Transport practices L/M/H High quality Medium quality
Transport duration Short/Long Short Short (1 to 3 hours)
Good Storage Practices L/M/H High level of implementation Medium and high level
Storage duration Short/Long Short Short (paddy) Long (milled rice)
Price Incentive for better Quality (optimum moisture content, no immature grains, no discoloured grains)
Yes/No Yes Yes
Knowledge of FSC actors L/M/H High Low to medium knowledge level
Consumer access to the product L/M/H High High
FL = parameter a × variable x; FL transport (percentage loss) = a (percentage loss/hour) × x (hours of transport);FL Storage (percentage loss) = a (percentage loss/month) × x (months of storage)Legend: Y/N = yes / no; L/M/H = low / medium / high
Source: field data

Chapter 3 – The food loss – Study findings and results 27
Thus, the loss percentages are indicative and not uniform across all mills. CWC losses were derived based on our discussion and observations in the surveyed geographies.
Case Study 2: Harvesting and threshing lossesA farmer from Nalluru owns 5 acres of land, all of which is under paddy cultivation. The average yield per acre is around 3.75 tonnes in the kharif season and 2.25 tonnes in rabi. Until recently the farmer harvested paddy manually, but now he uses combine harvesters for harvesting and threshing. Scarcity of farm labour and high labour costs drove this change. The farmer says he paid USD 6/acre and it took 2 days to harvest one acre and now he has cut his cost to USD 49/acre and harvesting is completed in 1.5 hours.
A third-party service supplies the combine harvester, which is rented by the hour. Although the farmer is happy that mechanization has improved farming he is concerned about the operational efficiency of the machine. It has been observed that while harvesting or thresh-ing the machine does not achieve complete separation of grains from the straw. The farmer has observed that around 225 kg of paddy per acre is lost during machine harvesting. Also, compared to manual harvesting, the combine harvester is harsh on the crop, which results in a higher percentage of broken grains. Despite the fact that there are certain drawbacks to mecha-nization the farmer still prefers it as he perceives it to be the more economically viable solution.
TABLE 20Quality scoring of food products
Product quality score Paddy/rice description of the quality Percentage reduction of market value
0 High pesticide residues -
1 Immature and green coloured grains -
2 Presence of foreign matter or grains damaged by weevils beyond prescribed limits 2
3 Damaged grains 1
4 Moisture exceeding 16 % 2
5 Discoloured grains 0.5
6 Presence of admixture beyond permissible limits 0.5
7 Polished rice – Common Grade -
8 Polished Rice – Grade A -
9 Superfine grains with no impurities/residues -
* No quality check for pesticide residues at the miller level. Quality checks for pesticide residues are for export only. Here it is assumed that products with higher quality scores have lower pesticide residues.Source: field data
©FAO/Sathguru
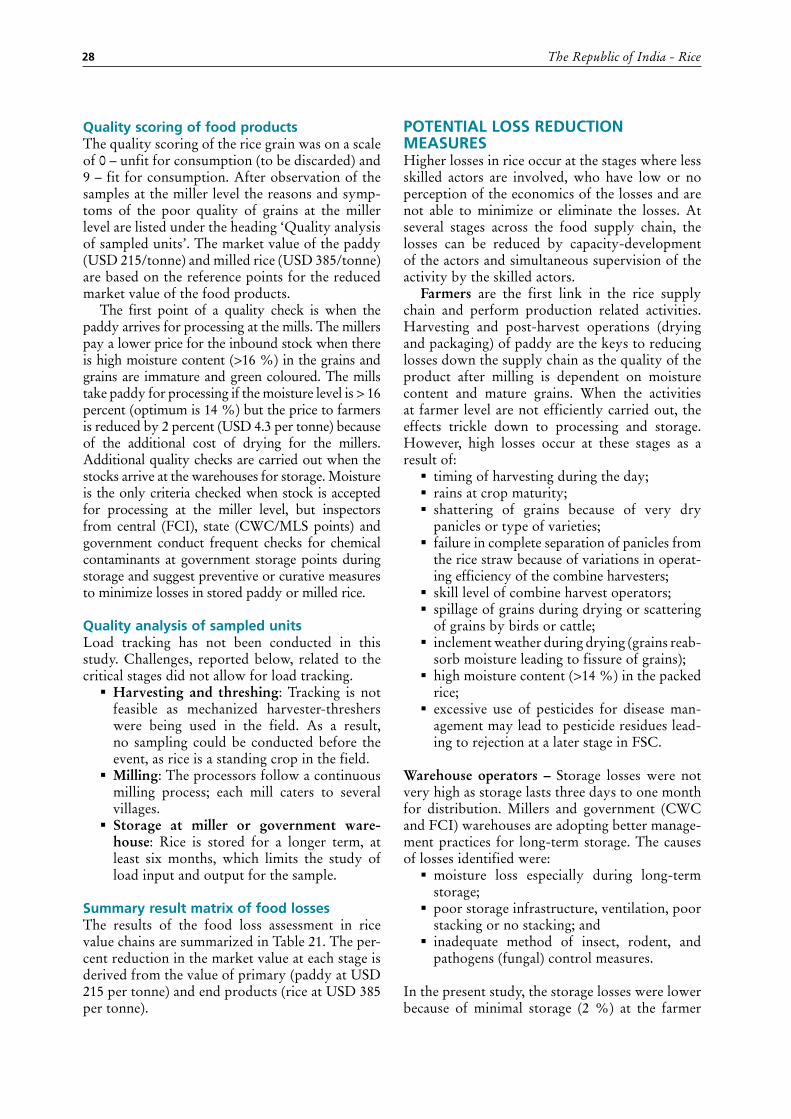
The Republic of India - Rice28
Quality scoring of food productsThe quality scoring of the rice grain was on a scale of 0 – unfit for consumption (to be discarded) and 9 – fit for consumption. After observation of the samples at the miller level the reasons and symp-toms of the poor quality of grains at the miller level are listed under the heading ‘Quality analysis of sampled units’. The market value of the paddy (USD 215/tonne) and milled rice (USD 385/tonne) are based on the reference points for the reduced market value of the food products.
The first point of a quality check is when the paddy arrives for processing at the mills. The millers pay a lower price for the inbound stock when there is high moisture content (>16 %) in the grains and grains are immature and green coloured. The mills take paddy for processing if the moisture level is > 16 percent (optimum is 14 %) but the price to farmers is reduced by 2 percent (USD 4.3 per tonne) because of the additional cost of drying for the millers. Additional quality checks are carried out when the stocks arrive at the warehouses for storage. Moisture is the only criteria checked when stock is accepted for processing at the miller level, but inspectors from central (FCI), state (CWC/MLS points) and government conduct frequent checks for chemical contaminants at government storage points during storage and suggest preventive or curative measures to minimize losses in stored paddy or milled rice.
Quality analysis of sampled unitsLoad tracking has not been conducted in this study. Challenges, reported below, related to the critical stages did not allow for load tracking.
� Harvesting and threshing: Tracking is not feasible as mechanized harvester-threshers were being used in the field. As a result, no sampling could be conducted before the event, as rice is a standing crop in the field.
� Milling: The processors follow a continuous milling process; each mill caters to several villages.
� Storage at miller or government ware-house: Rice is stored for a longer term, at least six months, which limits the study of load input and output for the sample.
Summary result matrix of food lossesThe results of the food loss assessment in rice value chains are summarized in Table 21. The per-cent reduction in the market value at each stage is derived from the value of primary (paddy at USD 215 per tonne) and end products (rice at USD 385 per tonne).
POTENTIAL LOSS REDUCTION MEASURESHigher losses in rice occur at the stages where less skilled actors are involved, who have low or no perception of the economics of the losses and are not able to minimize or eliminate the losses. At several stages across the food supply chain, the losses can be reduced by capacity-development of the actors and simultaneous supervision of the activity by the skilled actors.
Farmers are the first link in the rice supply chain and perform production related activities. Harvesting and post-harvest operations (drying and packaging) of paddy are the keys to reducing losses down the supply chain as the quality of the product after milling is dependent on moisture content and mature grains. When the activities at farmer level are not efficiently carried out, the effects trickle down to processing and storage. However, high losses occur at these stages as a result of:
� timing of harvesting during the day; � rains at crop maturity; � shattering of grains because of very dry panicles or type of varieties;
� failure in complete separation of panicles from the rice straw because of variations in operat-ing efficiency of the combine harvesters;
� skill level of combine harvest operators; � spillage of grains during drying or scattering of grains by birds or cattle;
� inclement weather during drying (grains reab-sorb moisture leading to fissure of grains);
� high moisture content (>14 %) in the packed rice;
� excessive use of pesticides for disease man-agement may lead to pesticide residues lead-ing to rejection at a later stage in FSC.
Warehouse operators – Storage losses were not very high as storage lasts three days to one month for distribution. Millers and government (CWC and FCI) warehouses are adopting better manage-ment practices for long-term storage. The causes of losses identified were:
� moisture loss especially during long-term storage;
� poor storage infrastructure, ventilation, poor stacking or no stacking; and
� inadequate method of insect, rodent, and pathogens (fungal) control measures.
In the present study, the storage losses were lower because of minimal storage (2 %) at the farmer
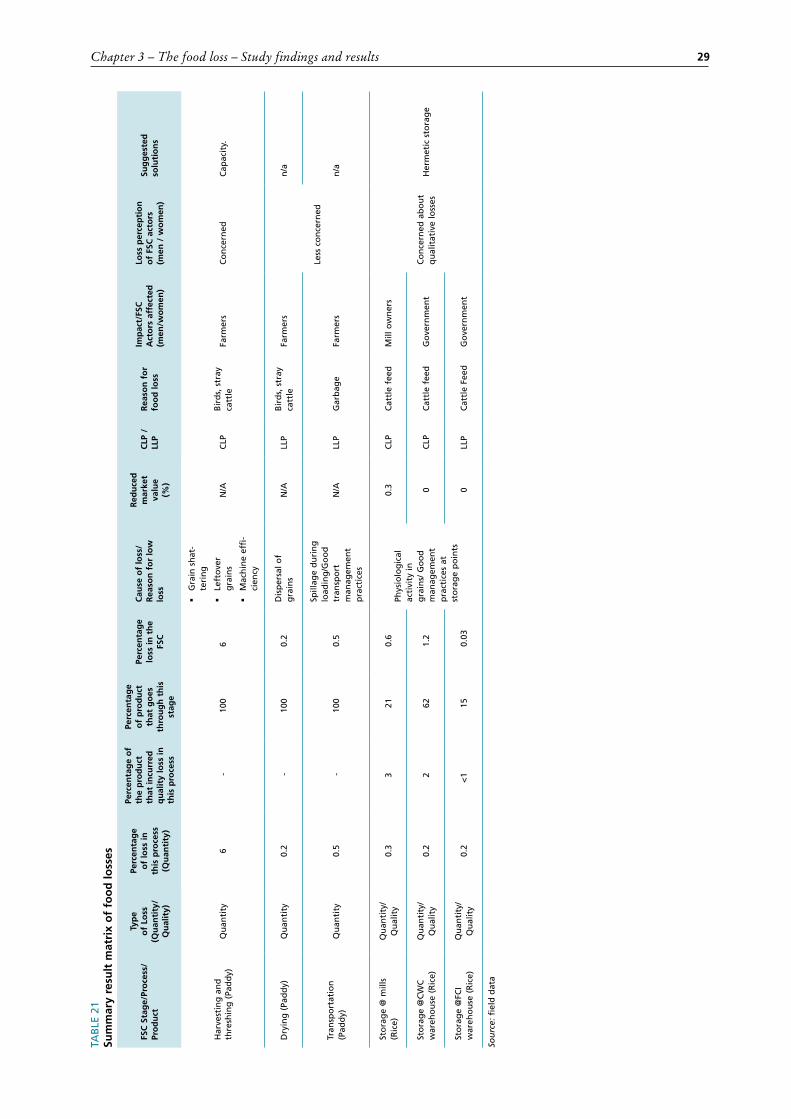
Chapter 3 – The food loss – Study findings and results 29
TAB
LE 2
1Su
mm
ary
resu
lt m
atri
x o
f fo
od
loss
es
FSC
Sta
ge/
Pro
cess
/Pr
od
uct
Typ
e o
f Lo
ss
(Qu
anti
ty/
Qu
alit
y)
Perc
enta
ge
of
loss
in
this
pro
cess
(Q
uan
tity
)
Perc
enta
ge
of
the
pro
du
ct
that
incu
rred
q
ual
ity
loss
in
this
pro
cess
Perc
enta
ge
of
pro
du
ct
that
go
es
thro
ug
h t
his
st
age
Perc
enta
ge
loss
in t
he
FSC
Cau
se o
f lo
ss/
Rea
son
fo
r lo
w
loss
Red
uce
d
mar
ket
valu
e(%
)
CLP
/LL
PR
easo
n f
or
foo
d lo
ss
Imp
act/
FSC
A
cto
rs a
ffec
ted
(m
en/w
om
en)
Loss
per
cep
tio
n
of
FSC
act
ors
(men
/ w
om
en)
Sug
ges
ted
so
luti
on
s
Har
vest
ing
an
d
thre
shin
g (
Pad
dy)
Qu
anti
ty6
-10
06
�G
rain
sh
at-
teri
ng
�Le
fto
ver
gra
ins
�M
ach
ine
effi
-ci
ency
N/A
C
LPB
ird
s, s
tray
ca
ttle
Farm
ers
Co
nce
rned
Cap
acit
y.
Dry
ing
(Pa
dd
y)Q
uan
tity
0.2
-10
00.
2D
isp
ersa
l of
gra
ins
N/A
LL
PB
ird
s, s
tray
ca
ttle
Farm
ers
Less
co
nce
rned
n/a
Tran
spo
rtat
ion
(P
add
y)Q
uan
tity
0.5
-10
00.
5
Spill
age
du
rin
g
load
ing
/Go
od
tr
ansp
ort
m
anag
emen
t p
ract
ices
N/A
LL
PG
arb
age
Farm
ers
n/a
Sto
rag
e @
mill
s (R
ice)
Qu
anti
ty/
Qu
alit
y0.
33
210.
6Ph
ysio
log
ical
ac
tivi
ty in
g
rain
s/ G
oo
d
man
agem
ent
pra
ctic
es a
t st
ora
ge
po
ints
0.3
CLP
Cat
tle
feed
Mill
ow
ner
s
Co
nce
rned
ab
ou
t q
ual
itat
ive
loss
esH
erm
etic
sto
rag
eSt
ora
ge
@C
WC
w
areh
ou
se (
Ric
e)Q
uan
tity
/ Q
ual
ity
0.2
262
1.2
0C
LPC
attl
e fe
edG
ove
rnm
ent
Sto
rag
e @
FCI
war
eho
use
(R
ice)
Qu
anti
ty/
Qu
alit
y0.
2<
115
0.03
0LL
PC
attl
e Fe
edG
ove
rnm
ent
Sou
rce:
fie
ld d
ata

The Republic of India - Rice30
FIGURE 11Cause finding diagram
1. Food loss assessment methods have revealed a batch of food products containing losses or product of low quality.
2. Identify and describe the symptoms that lead to this quantitative/quality loss.
3. Verify the possible causes by consultation of experts and literature, and by the on-site investigation.
4. Identify the real cause of the low quality and subsequent food loss.
5. Find the underlying reason for the cause, why the problem hasn’t been solved yet.
- Paddy losses from mechanical harvesting and threshing- Qualitative losses of paddy and rice during storage
Screening Observation Survey
- Low awareness of non-shattering varieties- Low skills of machine operator- High moisture content- Diseased crop- Poor storage management coupled with long-term storage- Long-�term storage
Physical Chemical
Physiological Non-Compliance
Biological
- Poor maintenance of the machinery during harvesting and threshing- Long-term storage under poor conditions- Attack by pests (fungi, insects, rodents) during storage
Experts/FSC Actors Literature
Technology
Organization
Infrastrucrture
Observation
Skills
- Timing of the harvest- High/low moisture content- Shattering varieties- Improper operation of the machinery during harvesting and threshing
Climate Change
Technology Skills/PracticesOrganization
Investigation
- Increase in tenant farming- Availability and cost of labour for field operations- Low technology for storage- Low awareness about economics of loss- Actors perceive individual losses to be negligible
Low Investment Legislation Policy Under-Development
Skills/PracticesLow Loss
Perception
Source: field data
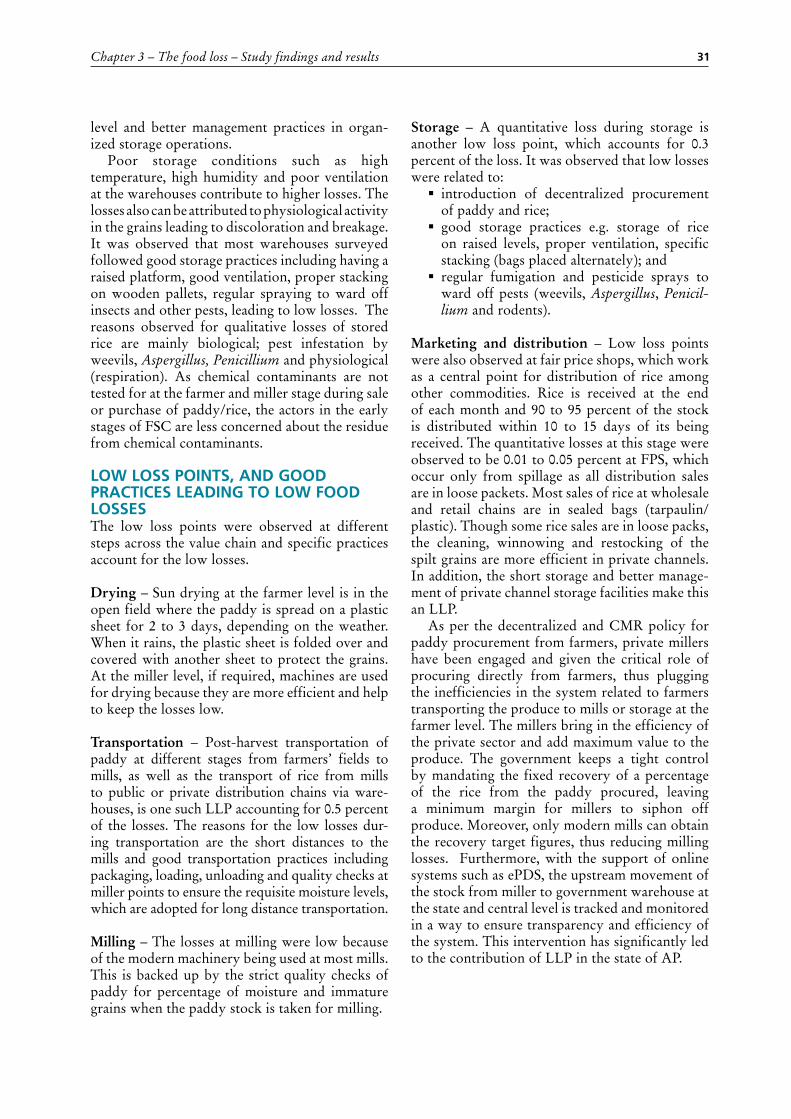
Chapter 3 – The food loss – Study findings and results 31
level and better management practices in organ-ized storage operations.
Poor storage conditions such as high temperature, high humidity and poor ventilation at the warehouses contribute to higher losses. The losses also can be attributed to physiological activity in the grains leading to discoloration and breakage. It was observed that most warehouses surveyed followed good storage practices including having a raised platform, good ventilation, proper stacking on wooden pallets, regular spraying to ward off insects and other pests, leading to low losses. The reasons observed for qualitative losses of stored rice are mainly biological; pest infestation by weevils, Aspergillus, Penicillium and physiological (respiration). As chemical contaminants are not tested for at the farmer and miller stage during sale or purchase of paddy/rice, the actors in the early stages of FSC are less concerned about the residue from chemical contaminants.
LOW LOSS POINTS, AND GOOD PRACTICES LEADING TO LOW FOOD LOSSESThe low loss points were observed at different steps across the value chain and specific practices account for the low losses.
Drying – Sun drying at the farmer level is in the open field where the paddy is spread on a plastic sheet for 2 to 3 days, depending on the weather. When it rains, the plastic sheet is folded over and covered with another sheet to protect the grains. At the miller level, if required, machines are used for drying because they are more efficient and help to keep the losses low.
Transportation – Post-harvest transportation of paddy at different stages from farmers’ fields to mills, as well as the transport of rice from mills to public or private distribution chains via ware-houses, is one such LLP accounting for 0.5 percent of the losses. The reasons for the low losses dur-ing transportation are the short distances to the mills and good transportation practices including packaging, loading, unloading and quality checks at miller points to ensure the requisite moisture levels, which are adopted for long distance transportation.
Milling – The losses at milling were low because of the modern machinery being used at most mills. This is backed up by the strict quality checks of paddy for percentage of moisture and immature grains when the paddy stock is taken for milling.
Storage – A quantitative loss during storage is another low loss point, which accounts for 0.3 percent of the loss. It was observed that low losses were related to:
� introduction of decentralized procurement of paddy and rice;
� good storage practices e.g. storage of rice on raised levels, proper ventilation, specific stacking (bags placed alternately); and
� regular fumigation and pesticide sprays to ward off pests (weevils, Aspergillus, Penicil-lium and rodents).
Marketing and distribution – Low loss points were also observed at fair price shops, which work as a central point for distribution of rice among other commodities. Rice is received at the end of each month and 90 to 95 percent of the stock is distributed within 10 to 15 days of its being received. The quantitative losses at this stage were observed to be 0.01 to 0.05 percent at FPS, which occur only from spillage as all distribution sales are in loose packets. Most sales of rice at wholesale and retail chains are in sealed bags (tarpaulin/plastic). Though some rice sales are in loose packs, the cleaning, winnowing and restocking of the spilt grains are more efficient in private channels. In addition, the short storage and better manage-ment of private channel storage facilities make this an LLP.
As per the decentralized and CMR policy for paddy procurement from farmers, private millers have been engaged and given the critical role of procuring directly from farmers, thus plugging the inefficiencies in the system related to farmers transporting the produce to mills or storage at the farmer level. The millers bring in the efficiency of the private sector and add maximum value to the produce. The government keeps a tight control by mandating the fixed recovery of a percentage of the rice from the paddy procured, leaving a minimum margin for millers to siphon off produce. Moreover, only modern mills can obtain the recovery target figures, thus reducing milling losses. Furthermore, with the support of online systems such as ePDS, the upstream movement of the stock from miller to government warehouse at the state and central level is tracked and monitored in a way to ensure transparency and efficiency of the system. This intervention has significantly led to the contribution of LLP in the state of AP.


33
IMPACT OF FOOD LOSSES IN THE RICE FOOD SUPPLY CHAINThe major impact of the food losses is the econom-ic impact on different actors in the value chain. Overall, losses are 7 percent for the various actors in the rice value chain. The impact on smallholder farmers is higher as the main losses observed are at the harvesting and threshing level. This impacts overall household income. The women in the household are also affected as they have to buy food with less money.
There are also economic losses at the transportation and storage stages, however, the actors in this value chain such as transporters, village aggregators and warehouse owners are not affected directly by product prices at these stages because they do not vary based on the quantity lost. For example, the price of transportation is fixed for a quantity of rice and is variable only for the distance to be covered to reach the destination. Likewise, for warehouses, which are mostly government controlled, the prices vary based on length of storage time that are fixed at the beginning of storage and not on the quantity that comes out of the storage for transportation to different destinations.
FOOD LOSS REDUCTION MEASURES The interventions described below are to be imple-mented for over 10 years and can be used to reduce losses at critical loss points and to mitigate any negative impacts on the environment.
Harvesting and threshing � Combine harvester – Currently, the com-bines used in Andhra Pradesh have an inbuilt engine and take around 40 to 180 minutes to harvest one acre of paddy field at a cost of INR 2 400/hr. In most cases, the harvesters used perform shallow cutting, which results in residual grains being wasted. The intro-duction of advanced combine harvesters into
the system would enable deep cutting and help minimize losses during harvesting and threshing.
� Capacity-building of farmers and operators of combine harvesters is suggested. As a result of untimely harvesting at high moisture content, the grains need excessive drying before processing, leading to higher storage losses. A capacity-development programme should focus on master trainers from each rice producing village to sensitize machine opera-tors about harvesting at the right maturity period for paddy, specific moisture content required for harvesting and strict monitoring of mechanical harvesting. Combine harvest operators can be trained to improve the efficiency of machines. In addition, capacity-building efforts will also train farmers in good agriculture practices (GAP) for paddy cultivation.
Processing � Single polished or brown rice in PDS – Rice is the main food eaten by south Indian adults, providing at least half of the total calories consumed. Currently, the rice consumed is double polished rice, which contributes to a high glycaemic load (GL), which is associated with an increased risk of type 2 diabetes. In the traditional south Indian diet, carbohy-drates were typically derived from ‘under milled’ grains such as hand pounded, which has been replaced by polished ‘white rice’ (refined grain, 8 percent polish). Although this has led to an increase in rice yield as a result of modern milling technology and reduced storage losses, the nutritional value of the rice has been reduced. This is of great concern as most of the current population are victims of either malnutrition or diabetes and coronary artery diseases. In order to help save this situation, a potential solution suggested
Chapter 4
Food loss reduction strategy – Conclusions and recommendations

The Republic of India - Rice34
at the consultative workshop is the delivery of brown rice through a public distribu-tion system. While most consumers prefer polished white rice, education about the health benefits of brown rice may help the population switch to brown or undermilled rice. One significant constraint hindering the distribution of brown rice is that it is more susceptible to pest attack. The introduction of better pest control mechanisms that are tailored to brown rice will help lengthen its shelf-life. Implementation of this interven-tion would mitigate the burden of the health risks in the state.
Storage � Hermetic storage at farmer level (Superb-ags-50 kg) or commercial cocoons (5 to 1 000 tonne) for milled rice at warehouses and mills is a viable solution, where either can be used to provide air tight conditions for stored grains.
� Metallic (galvanized steel) or concrete silos – Improved infrastructure such as metal-lic (galvanized steel) or concrete silos for rice storage could provide a solution for warehouse operators. In many countries, smallholder farmers are using metal silos as an effective solution to grain storage and an efficient method of reducing post-harvest grain losses. Since the storage losses observed during the study at the farmer level are very low (2 %), no solution has been proposed for this stage.
� FCI has developed a plan to pilot the use of steel silos for rice storage in Bihar and based on the success will expand to other states including AP.
Farmer Producer Organizations It is suggested that economically viable, demo-cratic and self-governing Farmer Producer Organizations (FPOs) be created and pro-moted. The FPOs would provide end-to-end links between farmers and their markets and will allow them to improve their productiv-ity through efficient, cost-effective and sustain-able use of resources. Farmers will also be able obtain higher returns for their produce through improved access to markets. This can be achieved through fruitful collaboration with academia, research agencies, government, civil society and the private sector. These FPO can function on a five-point agenda:
� Capacity-building – to strengthen farmers’ abilities through communication of agricul-tural best practices to enhance productivity.
� Quality inputs – to ensure access to and use of quality inputs, credit and other services at affordable prices for enhanced production.
� Storage – to invest in and operate commu-nity storage and drying facilities.
� Value addition – to facilitate links to proces-sors for value-addition of the produce.
� Market linkage – to facilitate access to fair and remunerative markets including link-ing of farmers to marketing opportunities through market aggregators.
BUDGET CALCULATIONS FOR FOOD LOSS REDUCTION Different solutions and strategies were considered to control food losses at the critical loss points that is harvesting-threshing (quantitative) and storage (quantitative and qualitative). The main challenge faced during the study, during assessment of the solutions, was the actors did not perceive food losses. No realization or concern was shown for the loss points. This was aggravated at the farmer level by their lack of knowledge about methods to use to reduce losses. Likewise, the mill owners are happy as long as they are making a profit. The two interventions proposed hereunder are based on the economic considerations, inclusiveness and positive environmental impact. The cost-benefit analysis of the proposed solutions was conducted for the two districts studied.
In considering a sustainable environmentally friendly intervention, the use of solar powered portable training kits was proposed as a greener way to help address power failures in the villages and to provide smooth and uninterrupted training. In addition, another solution proposed concerned
TABLE 22Projected construction of silos in Andhra Pradesh (Phase III)
Centre Capacity in tonnes
Srikakulam 100 000
East Godavari 100 000
West Godavari 100 000
Krishna 50 000
Total 350 000
Source: field data

Chapter 4 – Food loss reduction strategy – Conclusions and recommendations 35
hermetic storage, which is an eco-friendly technology involving no risks to storage operators, consumers and non-target organisms. This technology also limits the use of insecticides or fumigants.
Loss reduction at the harvesting and threshing stageIn the study, the quantitative losses were observed to be mostly (6 percent) at harvesting and thresh-ing using combine harvesters. The authors pro-pose the capacity-building of farmers and machine operators to reduce losses by 30 percent at this stage. For each village, one master trainer could be selected, and the training provided by the Agricultural Research Stations (ARS) and Krishi Vigyan Kendra. The master trainer could focus on the training of the farmers in these villages to teach them the type and name of varieties to use to minimize or eliminate shattering of grains. Training could also cover timing of the harvest in terms of specific time periods in a day, grain maturity and moisture assessment of the grains before harvesting.
In addition, training for combine harvester operators could focus on machine maintenance to ensure greater operational efficiency and reduce harvesting and threshing losses. The calculations for the capacity-building efforts are shown in Table 23.
Budget calculation for food loss reduction using hermetic storageIn the present study the quantitative losses (0.2 to 0.3 percent) during storage were found to be low loss points, however, the factors affecting quanti-tative losses are also leading to qualitative losses, which is a critical loss point of 3 percent. The authors of the case study suggest hermetic stor-age of rice using cocoons, which can last 15 years when used for commercial storage, where storage last from 6 months to 1.5 years. The calculations are for one cocoon for 5 tonnes of rice.
In addition to reducing quantitative losses, hermetic storage eliminates the use of pesticides, thereby eliminating the harmful effects of the chemicals used.
TABLE 23Calculations for capacity-building
Item Value Unit calculation
a Product quantity 4 979 286 Tonne/year Total paddy produced in East Godavari and Nellore
b Product value 215 USD/tonne
c Loss rate 6 Percentage
d Anticipated loss reduction 30 Percentage
e Cost of intervention (training of trainers) 149 840 USD
(No. of Villages * No of Training per Village *Cost of
training)
f Depreciation 10 Years
g Yearly costs of investment 14 984 USD/year e / f (for 4 months)
h Yearly costs of operation per season (training of farmers) 280 950 USD/year
(Cost of training* No. of Villages * No. of training
per season)
i Total yearly costs of solution 295 934 USD/year g + h
j Client costs per ton product 0.059 USD/tonne i / a
k Food loss 298 757 Tonne/year c * a
l Economic loss 64 232 789 USD/year k * b
m Loss reduction 89 627 Tonne/year k * d
n Loss reduction savings 19 269 836 USD/year m * b
o Total Client costs 295 934 USD/year a* j = i
p Profitability of solution 18 973 902 USD/year n - o
Source: field data
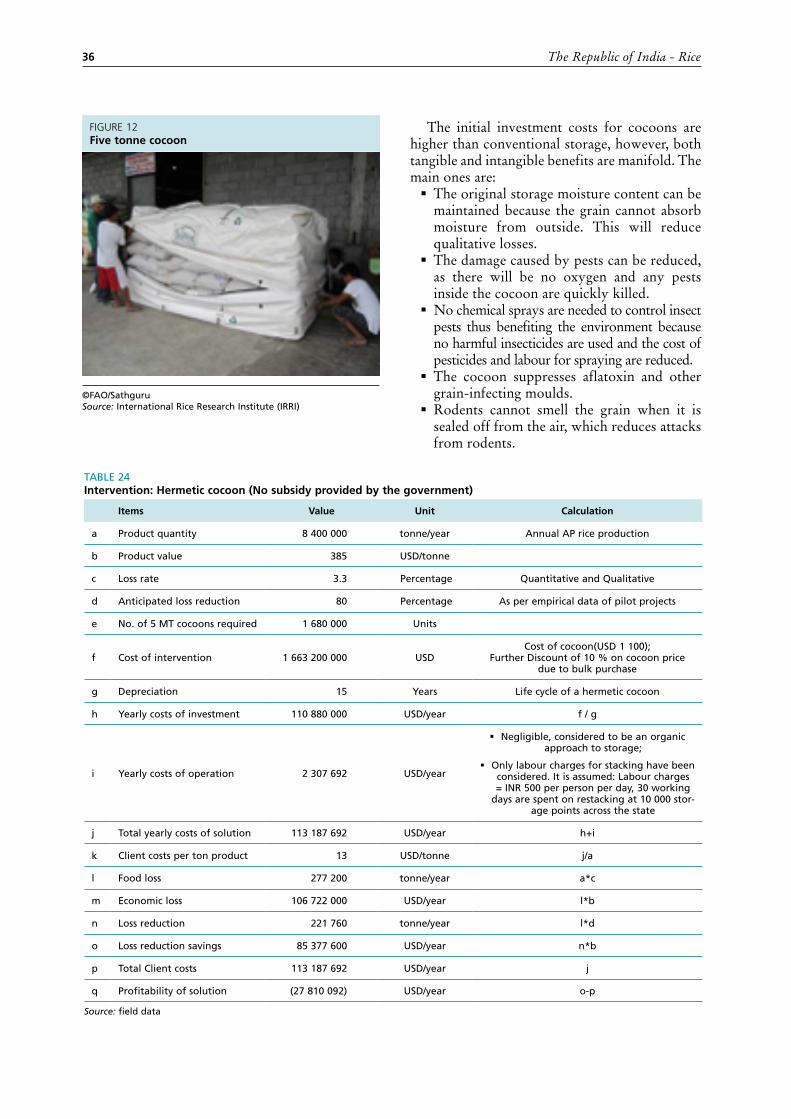
The Republic of India - Rice36
The initial investment costs for cocoons are higher than conventional storage, however, both tangible and intangible benefits are manifold. The main ones are:
� The original storage moisture content can be maintained because the grain cannot absorb moisture from outside. This will reduce qualitative losses.
� The damage caused by pests can be reduced, as there will be no oxygen and any pests inside the cocoon are quickly killed.
� No chemical sprays are needed to control insect pests thus benefiting the environment because no harmful insecticides are used and the cost of pesticides and labour for spraying are reduced.
� The cocoon suppresses aflatoxin and other grain-infecting moulds.
� Rodents cannot smell the grain when it is sealed off from the air, which reduces attacks from rodents.
TABLE 24Intervention: Hermetic cocoon (No subsidy provided by the government)
Items Value Unit Calculation
a Product quantity 8 400 000 tonne/year Annual AP rice production
b Product value 385 USD/tonne
c Loss rate 3.3 Percentage Quantitative and Qualitative
d Anticipated loss reduction 80 Percentage As per empirical data of pilot projects
e No. of 5 MT cocoons required 1 680 000 Units
f Cost of intervention 1 663 200 000 USDCost of cocoon(USD 1 100);
Further Discount of 10 % on cocoon price due to bulk purchase
g Depreciation 15 Years Life cycle of a hermetic cocoon
h Yearly costs of investment 110 880 000 USD/year f / g
i Yearly costs of operation 2 307 692 USD/year
� Negligible, considered to be an organic approach to storage;
� Only labour charges for stacking have been considered. It is assumed: Labour charges = INR 500 per person per day, 30 working
days are spent on restacking at 10 000 stor-age points across the state
j Total yearly costs of solution 113 187 692 USD/year h+i
k Client costs per ton product 13 USD/tonne j/a
l Food loss 277 200 tonne/year a*c
m Economic loss 106 722 000 USD/year l*b
n Loss reduction 221 760 tonne/year l*d
o Loss reduction savings 85 377 600 USD/year n*b
p Total Client costs 113 187 692 USD/year j
q Profitability of solution (27 810 092) USD/year o-p
Source: field data
FIGURE 12Five tonne cocoon
©FAO/SathguruSource: International Rice Research Institute (IRRI)
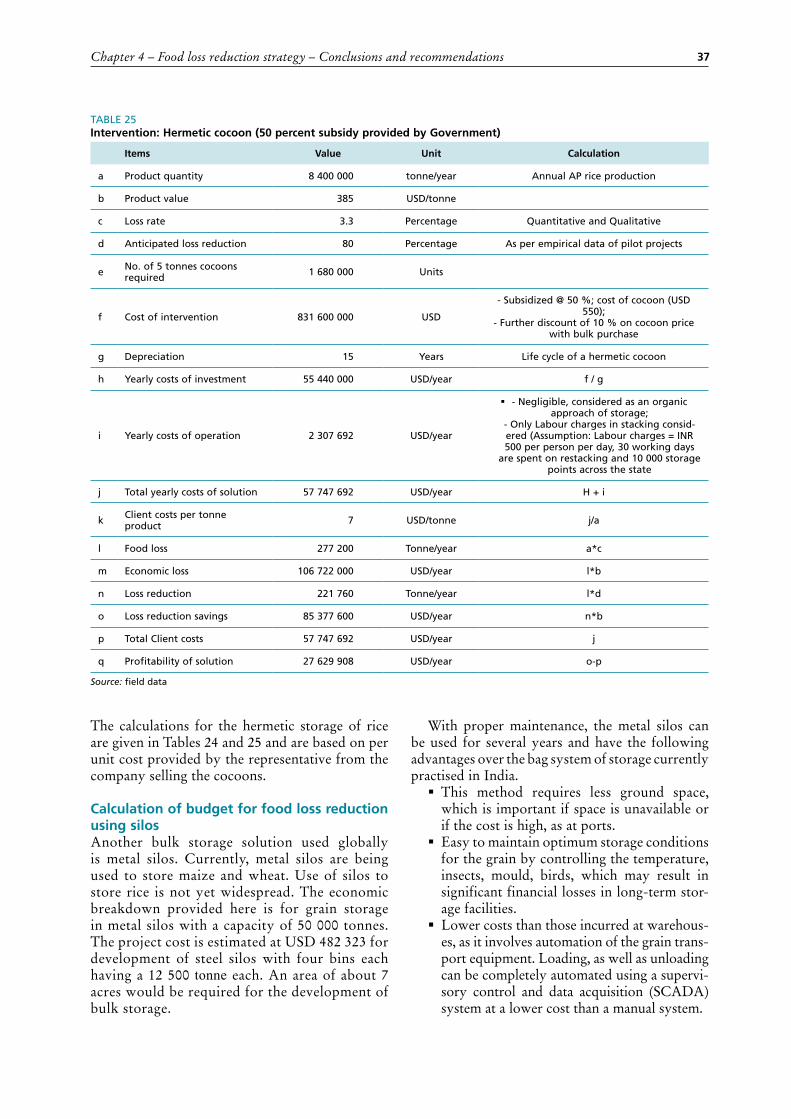
Chapter 4 – Food loss reduction strategy – Conclusions and recommendations 37
The calculations for the hermetic storage of rice are given in Tables 24 and 25 and are based on per unit cost provided by the representative from the company selling the cocoons.
Calculation of budget for food loss reduction using silos Another bulk storage solution used globally is metal silos. Currently, metal silos are being used to store maize and wheat. Use of silos to store rice is not yet widespread. The economic breakdown provided here is for grain storage in metal silos with a capacity of 50 000 tonnes. The project cost is estimated at USD 482 323 for development of steel silos with four bins each having a 12 500 tonne each. An area of about 7 acres would be required for the development of bulk storage.
With proper maintenance, the metal silos can be used for several years and have the following advantages over the bag system of storage currently practised in India.
� This method requires less ground space, which is important if space is unavailable or if the cost is high, as at ports.
� Easy to maintain optimum storage conditions for the grain by controlling the temperature, insects, mould, birds, which may result in significant financial losses in long-term stor-age facilities.
� Lower costs than those incurred at warehous-es, as it involves automation of the grain trans-port equipment. Loading, as well as unloading can be completely automated using a supervi-sory control and data acquisition (SCADA) system at a lower cost than a manual system.
TABLE 25Intervention: Hermetic cocoon (50 percent subsidy provided by Government)
Items Value Unit Calculation
a Product quantity 8 400 000 tonne/year Annual AP rice production
b Product value 385 USD/tonne
c Loss rate 3.3 Percentage Quantitative and Qualitative
d Anticipated loss reduction 80 Percentage As per empirical data of pilot projects
e No. of 5 tonnes cocoons required 1 680 000 Units
f Cost of intervention 831 600 000 USD
- Subsidized @ 50 %; cost of cocoon (USD 550);
- Further discount of 10 % on cocoon price with bulk purchase
g Depreciation 15 Years Life cycle of a hermetic cocoon
h Yearly costs of investment 55 440 000 USD/year f / g
i Yearly costs of operation 2 307 692 USD/year
� - Negligible, considered as an organic approach of storage;
- Only Labour charges in stacking consid-ered (Assumption: Labour charges = INR 500 per person per day, 30 working days
are spent on restacking and 10 000 storage points across the state
j Total yearly costs of solution 57 747 692 USD/year H + i
k Client costs per tonne product 7 USD/tonne j/a
l Food loss 277 200 Tonne/year a*c
m Economic loss 106 722 000 USD/year l*b
n Loss reduction 221 760 Tonne/year l*d
o Loss reduction savings 85 377 600 USD/year n*b
p Total Client costs 57 747 692 USD/year j
q Profitability of solution 27 629 908 USD/year o-p
Source: field data
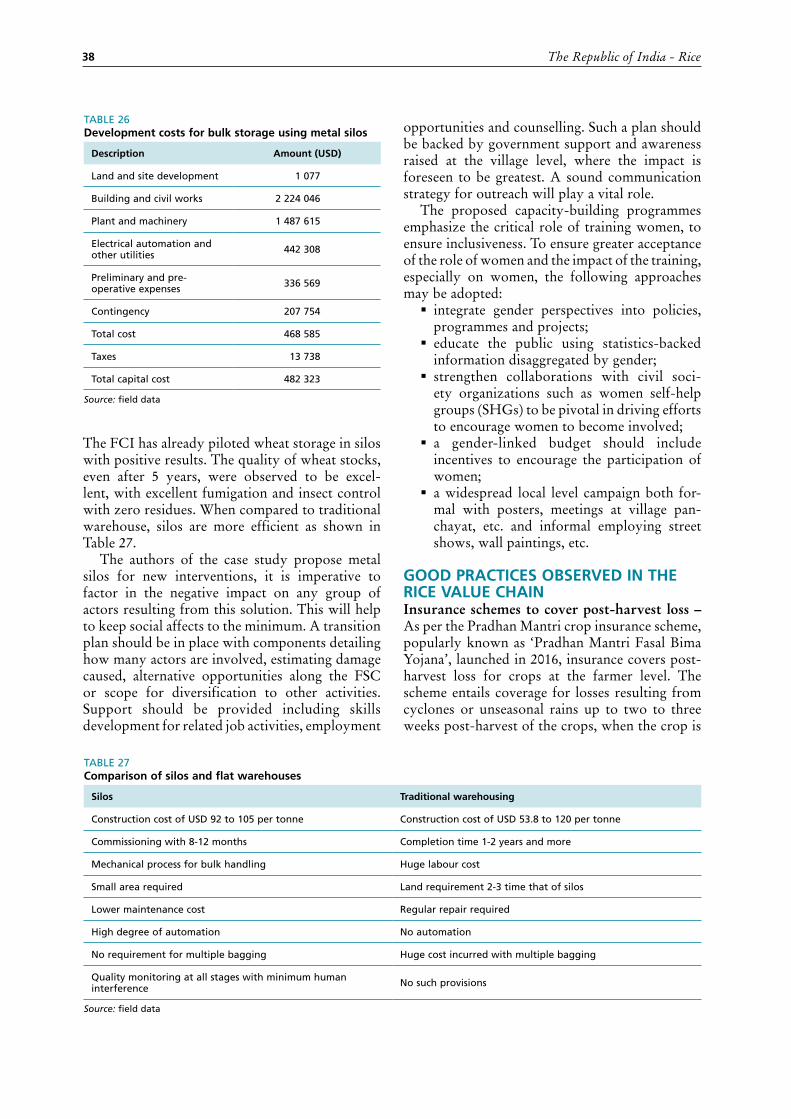
The Republic of India - Rice38
TABLE 26Development costs for bulk storage using metal silos
Description Amount (USD)
Land and site development 1 077
Building and civil works 2 224 046
Plant and machinery 1 487 615
Electrical automation and other utilities 442 308
Preliminary and pre-operative expenses 336 569
Contingency 207 754
Total cost 468 585
Taxes 13 738
Total capital cost 482 323
Source: field data
TABLE 27Comparison of silos and flat warehouses
Silos Traditional warehousing
Construction cost of USD 92 to 105 per tonne Construction cost of USD 53.8 to 120 per tonne
Commissioning with 8-12 months Completion time 1-2 years and more
Mechanical process for bulk handling Huge labour cost
Small area required Land requirement 2-3 time that of silos
Lower maintenance cost Regular repair required
High degree of automation No automation
No requirement for multiple bagging Huge cost incurred with multiple bagging
Quality monitoring at all stages with minimum human interference No such provisions
Source: field data
The FCI has already piloted wheat storage in silos with positive results. The quality of wheat stocks, even after 5 years, were observed to be excel-lent, with excellent fumigation and insect control with zero residues. When compared to traditional warehouse, silos are more efficient as shown in Table 27.
The authors of the case study propose metal silos for new interventions, it is imperative to factor in the negative impact on any group of actors resulting from this solution. This will help to keep social affects to the minimum. A transition plan should be in place with components detailing how many actors are involved, estimating damage caused, alternative opportunities along the FSC or scope for diversification to other activities. Support should be provided including skills development for related job activities, employment
opportunities and counselling. Such a plan should be backed by government support and awareness raised at the village level, where the impact is foreseen to be greatest. A sound communication strategy for outreach will play a vital role.
The proposed capacity-building programmes emphasize the critical role of training women, to ensure inclusiveness. To ensure greater acceptance of the role of women and the impact of the training, especially on women, the following approaches may be adopted:
� integrate gender perspectives into policies, programmes and projects;
� educate the public using statistics-backed information disaggregated by gender;
� strengthen collaborations with civil soci-ety organizations such as women self-help groups (SHGs) to be pivotal in driving efforts to encourage women to become involved;
� a gender-linked budget should include incentives to encourage the participation of women;
� a widespread local level campaign both for-mal with posters, meetings at village pan-chayat, etc. and informal employing street shows, wall paintings, etc.
GOOD PRACTICES OBSERVED IN THE RICE VALUE CHAINInsurance schemes to cover post-harvest loss – As per the Pradhan Mantri crop insurance scheme, popularly known as ‘Pradhan Mantri Fasal Bima Yojana’, launched in 2016, insurance covers post-harvest loss for crops at the farmer level. The scheme entails coverage for losses resulting from cyclones or unseasonal rains up to two to three weeks post-harvest of the crops, when the crop is

Chapter 4 – Food loss reduction strategy – Conclusions and recommendations 39
TABLE 28The social implications of suggestions related to specific food loss solutions
(How) does the suggested solution …
Description of the potential impact
Gender dimension of the impact (how women and men may be affected differently)
Suggestions for mitigating the negative impacts
Farmer producer organizations
. …impact the employment situation of FSC actors?
Will better organize the employment situation
Both men and women will gain better access to inputs and markets
-
… increase or reduce the workload of FSC actors?
No impact
…raise or increase the need for training to apply solutions?
Will increase the need for training and capacity-building
Women’s participation in FPO should be encouraged. -
…distribute benefits to the FSC actors? (income access and control)
Will increase income of individual farmers
VLA’s commission rates may get revised -
…impact dynamics of power in the FSC? (WHO has ownership of solutions?)
Farmers No impact Will give more power to producers leading to better opportunities
…cause some actors to be excluded from FSC activities?
VLA may be excluded as FPO will be directly involved in value addition of rice.
Women can be included as administrators of FPO(s)
Employment of the VLAs in the value chain might be a challenge
….adversely impact the environment? Water conservation No impact
Capacity-building
…impact the employment situation of FSC actors?
The training and technology will provide more employment at village
Will help involve women in capacity-building efforts -
… increase or reduce the workload of FSC actors?
Reduce the workload as new trainers will be developed
Addition of master trainers will also include women members
-
…raise or increase the need for training to apply solutions?
Will increase the need for training. Training the trainer model will include key farmers and machine operators
Women trainers will need to be approached separately
Woman trainers will be able to connect to their counterparts in a better way
…distribute benefits to the FSC actors? (income access and control)
Farmers’ income will be increased by reducing losses and operation efficiency of machine operators will be improved
Management of household economics by women will be better due to increased cash flow and storage owners can improve their operational efficiency with higher income
-
…impact dynamics of power in the FSC? (WHO has ownership of solutions?)
Agricultural institutes with government support will own the solution
Women extension workers will play an important role in reaching out to women farmers and workers
Increased engagement of women extension workers
….take into consideration mobility restrictions of FSC actors?
Mobility for training is a highly critical phase for the success of the solution
Mobility of women trainers will be a challenge
Incentives for women extension trainers to increase engagement
…coincide with cultural and social norms and will be culturally and socially acceptable?
Adoption of suggested solutions through trainings will take some time to be accepted
Women trainers will initially find it challenging to conduct training
Improve the socio-cultural acceptance of women trainers with actors in the FSC
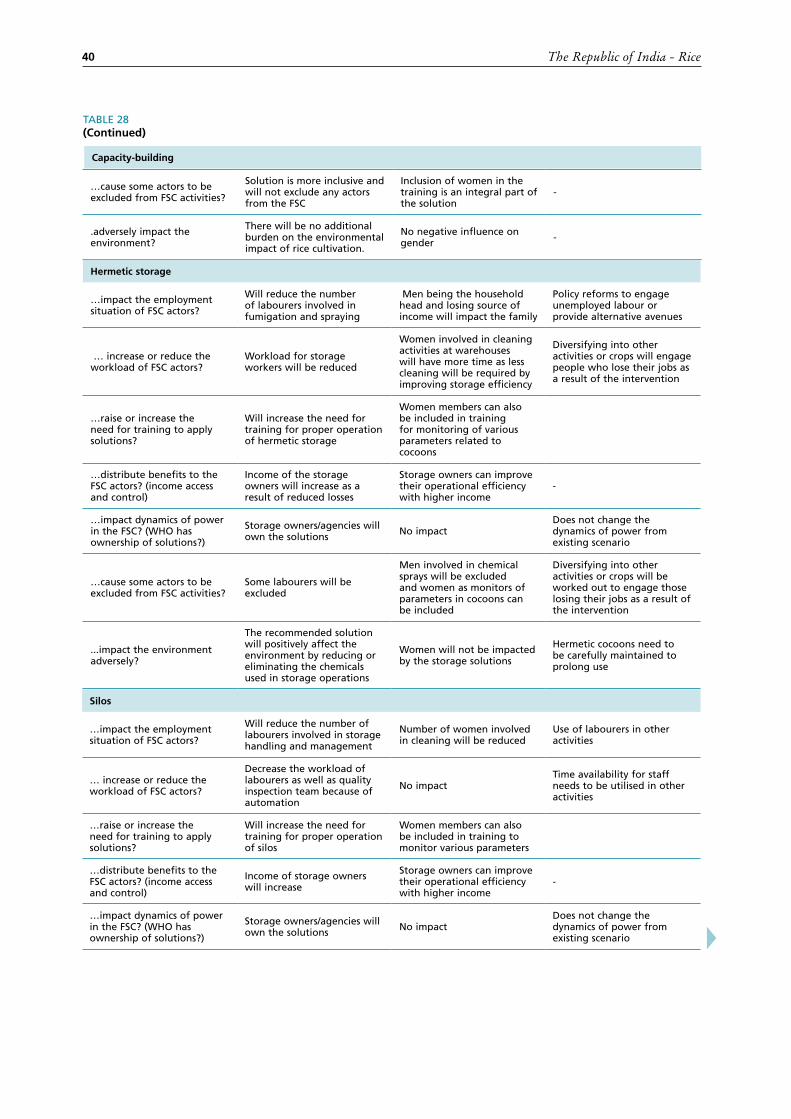
The Republic of India - Rice40
…cause some actors to be excluded from FSC activities?
Solution is more inclusive and will not exclude any actors from the FSC
Inclusion of women in the training is an integral part of the solution
-
.adversely impact the environment?
There will be no additional burden on the environmental impact of rice cultivation.
No negative influence on gender -
Capacity-building
TABLE 28(Continued)
Hermetic storage
…impact the employment situation of FSC actors?
Will reduce the number of labourers involved in fumigation and spraying
Men being the household head and losing source of income will impact the family
Policy reforms to engage unemployed labour or provide alternative avenues
… increase or reduce the workload of FSC actors?
Workload for storage workers will be reduced
Women involved in cleaning activities at warehouses will have more time as less cleaning will be required by improving storage efficiency
Diversifying into other activities or crops will engage people who lose their jobs as a result of the intervention
…raise or increase the need for training to apply solutions?
Will increase the need for training for proper operation of hermetic storage
Women members can also be included in training for monitoring of various parameters related to cocoons
…distribute benefits to the FSC actors? (income access and control)
Income of the storage owners will increase as a result of reduced losses
Storage owners can improve their operational efficiency with higher income
-
…impact dynamics of power in the FSC? (WHO has ownership of solutions?)
Storage owners/agencies will own the solutions No impact
Does not change the dynamics of power from existing scenario
…cause some actors to be excluded from FSC activities?
Some labourers will be excluded
Men involved in chemical sprays will be excluded and women as monitors of parameters in cocoons can be included
Diversifying into other activities or crops will be worked out to engage those losing their jobs as a result of the intervention
...impact the environment adversely?
The recommended solution will positively affect the environment by reducing or eliminating the chemicals used in storage operations
Women will not be impacted by the storage solutions
Hermetic cocoons need to be carefully maintained to prolong use
Silos
…impact the employment situation of FSC actors?
Will reduce the number of labourers involved in storage handling and management
Number of women involved in cleaning will be reduced
Use of labourers in other activities
… increase or reduce the workload of FSC actors?
Decrease the workload of labourers as well as quality inspection team because of automation
No impactTime availability for staff needs to be utilised in other activities
…raise or increase the need for training to apply solutions?
Will increase the need for training for proper operation of silos
Women members can also be included in training to monitor various parameters
…distribute benefits to the FSC actors? (income access and control)
Income of storage owners will increase
Storage owners can improve their operational efficiency with higher income
-
…impact dynamics of power in the FSC? (WHO has ownership of solutions?)
Storage owners/agencies will own the solutions No impact
Does not change the dynamics of power from existing scenario

Chapter 4 – Food loss reduction strategy – Conclusions and recommendations 41
left to dry on the fields. In the state of AP, under the Modified National Agricultural Insurance Scheme (MNAIS), paddy is covered for both kharif and rabi seasons for post-harvest loss. Loss or damage to the crop in a ‘cut and spread’ condi-tion is considered on an individual basis; thus it is essential that affected farmers submit their claims within 48 hours. The scheme reflects the gradual and increasing government emphasis on post-harvest losses.
Decentralized rice procurement policy – As man-dated by this policy, the state government is respon-sible for procuring paddy directly from the farmers on behalf of the central government. Though the
policy was launched by the central government in 1996–1997, it was adopted by the AP government in 2012. Under this policy, the Government is in the process of setting up its own centres in the catchment area of the paddy villages to further increase efficiency in the procurement of paddy. The state government also stores and distributes food grains under the PDS and welfare schemes, which has helped control losses during transit and has increased food availability and the supply of grains more suited to local tastes. Currently, how-ever, as the Government has limited infrastructure for procurement and storage, the model is being implemented in a public-private partnership mode to drive the supply chain more efficiently.
TABLE 28(Continued)
Silos
…cause some actors to be excluded from FSC activities?
Some labourers will be excluded as a number of activities will be automated
Women can be included as monitors of various parameters for storage in silos
Employment of male labourers in other activities will be a challenge
… adversely impact the environment?
The recommended solution will positively affect the environment by reducing chemicals used in storage operations through their more efficient use
Women will not be impacted by the storage solutions
Careful maintenance of the silos to prolong use
Source: field data

The Republic of India - Rice42
TAB
LE 2
9Su
mm
ary
of
foo
d lo
sses
, cau
ses
and
so
luti
on
s
Cri
tica
l Lo
ss P
oin
tM
agn
itu
de
of
loss
es in
th
e FS
CC
ause
of
loss
Inte
rven
tio
n
to r
edu
ce
loss
es
Loss
red
uct
ion
Co
st o
fin
terv
enti
on
(USD
)
Imp
licat
ion
s
%
age
USD
Eco
no
mic
Soci
alFo
od
se
curi
ty
Envi
ron
men
tal
and
clim
ate
chan
ge
Polic
y
Har
vest
ing
an
d
thre
shin
g6
298
757
64 3
46 2
24
Tim
ing
of
har
vest
, sh
atte
rin
g
vari
etie
s,
mac
hin
e m
ain
ten
ance
Cap
acit
y-b
uild
ing
3019
303
897
951
624
Incr
ease
d
inco
me
Skill
ed
wo
rkfo
rce
Imp
rove
dPo
siti
ve-
Sto
rag
e3.
3*27
7 20
010
6 72
2 00
0M
ois
ture
loss
, p
est
atta
cks
Her
met
ic
sto
rag
e 80
85 3
77 6
00
113
187
692
Incr
ease
d
inco
me
Red
uce
d
lab
ou
r Im
pro
ved
Po
siti
ve
-
57 7
47 6
92Su
bsi
dis
ing
p
urc
has
e o
f co
coo
ns
Sto
rag
e3.
3*27
7 20
010
6 72
2 00
0m
ois
ture
loss
, p
est
Att
acks
Met
al s
ilos
5016
431
842
482
323.
08In
crea
sed
in
com
eR
edu
ced
La
bo
ur
Imp
rove
d
Posi
tive
U
se o
f si
los
for
sto
rag
e
* In
clu
des
bo
th q
ual
itat
ive
and
qu
anti
tati
ve lo
sses
Sou
rce:
fie
ld d
ata

43
Agmarknet. 2003. Post-harvest profile of paddy/ rice
Amtul Waris, B. Nirmala, S. & Arun Kumar. 2015. Gender gap and female workforce participation in agriculture in Andhra Pradesh, India. Hyderbad, India, Directorate of Rice Research.
Basavaraja, H., Mahajanashetti, S.B. Naveen, C. & Udagatti. 2007. Economic analysis of post-harvest losses in food grains in India: A case study in Karnataka. Dharwad, Karnataka, Department of Agricultural Economics, College of Agriculture, University of Agricultural Sciences.
Cheralu, C. No date. Status paper on rice in Andhra Pradesh. Rice knowledge management portal, Hyderbad, India, Directorate of Rice Research.
Directorate of Economics and Statistics. 2014. Agricultural statistics at a glance 2014. New Delhi.
Gesellschaft für Internationale Zusammenarbeit (GIZ), GFP, Centre for Applied Rural Innovation (CARI), Sector Networt Rural Development (SNRD). 2014. Post-harvest losses of rice in Nigeria and their ecological footprint. Federal Ministry for Economic Cooperation and Development.
Government of Andhra Pradesh. 2007. Andhra Pradesh Development Report. Agrarian Economy of Andhra Pradesh Changing Structure, Performance in Crop Output and Agrarian Distress.
Goyal, S.K., Jogdand, S.V. & Agarwal, A.K. 2012. Energy use pattern in rice milling industries – a critical appraisal. Institute of Agricultural Sciences (KVK), Banaras Hindu University, also in J. Food Sci Technol. 51 (11): 2907–2916.
Gunmert, M. No date. Improved post-harvest technologies for reducing post-harvest losses and increasing of farmers’ income from their rice harvests. International Rice Research Institute. (Available at : http://www.thairice.org/doc_dl/AsiaRiceFoundationPresentation.pdf)
Jha, S.N., Vishwakarma, R.K., Ahmad, T., Anil Rai, & Dixit, A.K. 2015. Report on assessment of quantitative harvest and post-harvest losses of major crops and commodities in India. Ludhiana, India, All India Coordinated Research Project on Post-Harvest Technology (ICAR) – Central Institute of Post Harvest Engineering & Technology (CIPHET).
Madhusudhana Rao, K. 2015 to 2016. Agriculture Action Plan 2015-2016. Department of Agriculture, Government of Andhra Pradesh.
Villers, P., de Bruin, T. & Navarro, S. 2006. Development and applications of hermetic storage technology. Grain Pro. Inc., Ninth International Working Conference on Stored Product Protection.
Bibliography


Food and Agriculture Organization of the United Nations (FAO)Viale delle Terme di Caracalla, 00153 Rome, Italywww.fao.org
I9996EN/1/09.18
ISBN 978-92-5-130646-8
9 7 8 9 2 5 1 3 0 6 4 6 8