Case study on erosion–corrosion degradation of pipework ... · 3. Images of degradation seen...
7
Wear 271 (2011) 1295–1301 Contents lists available at ScienceDirect Wear jou rnal h om epage: www.elsevier.com/locate/wear Short communication Case study on erosion–corrosion degradation of pipework located on an offshore oil and gas facility Xinming Hu, Richard Barker ∗ , Anne Neville, Abinesh Gnanavelu Institute of Engineering Thermofluids, Surfaces and Interfaces, School of Mechanical Engineering, University of Leeds, Leeds LS2 9JT, United Kingdom a r t i c l e i n f o Article history: Received 14 September 2010 Received in revised form 27 January 2011 Accepted 27 January 2011 Keywords: Flow-induced corrosion Erosion–corrosion Corrosion inhibitor Pipework Jet impingement Sand a b s t r a c t Various carbon steel sections of pipework removed from an offshore facility were examined and found to have experienced exceptionally high wall thickness losses as a result of internal degradation. This prompted a case study to determine the mechanisms of degradation which had occurred and to ascertain the reasons why the implementation of corrosion inhibitor provided little protection to certain areas of the pipework. Initially, information for the pipework system was collated relating to the fluid chemistry, sand content, flow rate, temperature, inhibitor usage and pipe geometry. Computational fluid dynam- ics (CFD) modeling implemented for various regions of the pipework provided an insight into the flow behavior and expected local fluid velocities present. A metallurgical analysis for the pipework was per- formed, which included compositional and microstructural analysis, as well as hardness measurements across the welded regions of the pipework. Jet impingement tests were conducted, simulating field con- ditions in order to quantify the degradation rate. Experimental results were compared with field data to assist in determining the degradation mechanism. The effect of the corrosion inhibitors used on the pipework was also examined and degradation mechanisms were discussed based upon results obtained from micro-structural studies. © 2011 Elsevier B.V. All rights reserved. 1. Introduction With respect to the oil and gas industry, operational experi- ence has indicated that sand production may be regarded as being inevitable in many reservoirs which have a comparatively low for- mation strength (<1000 psi) [1], especially for aging assets after well pressure declines and water production commences [2]. It is becoming increasingly prevalent that the sand quantity in a given volume of process fluid increases as wells age and their formation strength reduces. The configuration of the oil–sand slurry produced from wells, combined with the presence of water, carbon dioxide and salts containing Cl − , HCO 3 − and SO 4 − ions create an exceptionally cor- rosive environment for pipework and equipment used to transport these fluids. The corrosive degradation experienced by these trans- portation lines is accelerated by the erosive mechanism attributed to the sand impingement from the moving slurry, resulting in a synergistic effect know as ‘erosion–corrosion’ [3]. Erosion–corrosion is a form of tribo-corrosion material loss mechanism caused by flowing fluid (in the presence or absence of solid particles) damaging both the surface layers (e.g. passive ∗ Corresponding author. Tel.: +44 1133432119; fax: +44 1132424611. E-mail address: [email protected] (R. Barker). film or corrosion products) and the base metal [4,5]. This process is beginning to receive greater attention because of its destructive nature and the fact that this regime of degradation is becoming more common due to increased sand production and the increas- ing severity of conditions attributed to extracting oil from deeper wells. Enormous costs are directed towards managing corrosion and erosion–corrosion in the oil and gas industry and important safety considerations are relevant to managing damage. The use of carbon steel with chemical inhibitors such as amines, imidazoline com- pounds and nitrogen-based organic surfactants [6] still tends to be a favorable choice for control of what is often still referred to as ‘corrosion’, compared to changing materials to corrosion resis- tant alloys (CRAs) such as duplex stainless steels because of their lower cost, superior weldability and high strength [7]. Several stud- ies have found that high shear resistant CO 2 corrosion inhibitors have been useful in reducing the material degradation in flow- induced corrosion and erosion–corrosion environments for carbon steel [8,9]. Various sections of pipework that were removed from several different regions of the pipework system of an offshore facility were found to have experienced exceptionally high wall thickness losses, preferential weld degradation and localized attack as a result of internal degradation. This prompted a case study to determine the susceptibility of carbon steel pipework and weld material to the 0043-1648/$ – see front matter © 2011 Elsevier B.V. All rights reserved. doi:10.1016/j.wear.2011.01.036
Transcript of Case study on erosion–corrosion degradation of pipework ... · 3. Images of degradation seen...
S
Co
XI
a
ARRA
KFECPJS
1
eimwbvs
ccrtpts
mo
0d
Wear 271 (2011) 1295– 1301
Contents lists available at ScienceDirect
Wear
jou rna l h om epage: www.elsev ier .com/ locate /wear
hort communication
ase study on erosion–corrosion degradation of pipework located on an offshoreil and gas facility
inming Hu, Richard Barker ∗, Anne Neville, Abinesh Gnanavelunstitute of Engineering Thermofluids, Surfaces and Interfaces, School of Mechanical Engineering, University of Leeds, Leeds LS2 9JT, United Kingdom
r t i c l e i n f o
rticle history:eceived 14 September 2010eceived in revised form 27 January 2011ccepted 27 January 2011
eywords:low-induced corrosion
a b s t r a c t
Various carbon steel sections of pipework removed from an offshore facility were examined and foundto have experienced exceptionally high wall thickness losses as a result of internal degradation. Thisprompted a case study to determine the mechanisms of degradation which had occurred and to ascertainthe reasons why the implementation of corrosion inhibitor provided little protection to certain areas ofthe pipework. Initially, information for the pipework system was collated relating to the fluid chemistry,sand content, flow rate, temperature, inhibitor usage and pipe geometry. Computational fluid dynam-ics (CFD) modeling implemented for various regions of the pipework provided an insight into the flow
rosion–corrosionorrosion inhibitoripeworket impingementand
behavior and expected local fluid velocities present. A metallurgical analysis for the pipework was per-formed, which included compositional and microstructural analysis, as well as hardness measurementsacross the welded regions of the pipework. Jet impingement tests were conducted, simulating field con-ditions in order to quantify the degradation rate. Experimental results were compared with field datato assist in determining the degradation mechanism. The effect of the corrosion inhibitors used on thepipework was also examined and degradation mechanisms were discussed based upon results obtainedfrom micro-structural studies.
. Introduction
With respect to the oil and gas industry, operational experi-nce has indicated that sand production may be regarded as beingnevitable in many reservoirs which have a comparatively low for-
ation strength (<1000 psi) [1], especially for aging assets afterell pressure declines and water production commences [2]. It is
ecoming increasingly prevalent that the sand quantity in a givenolume of process fluid increases as wells age and their formationtrength reduces.
The configuration of the oil–sand slurry produced from wells,ombined with the presence of water, carbon dioxide and saltsontaining Cl−, HCO3
− and SO4− ions create an exceptionally cor-
osive environment for pipework and equipment used to transporthese fluids. The corrosive degradation experienced by these trans-ortation lines is accelerated by the erosive mechanism attributedo the sand impingement from the moving slurry, resulting in a
ynergistic effect know as ‘erosion–corrosion’ [3].Erosion–corrosion is a form of tribo-corrosion material lossechanism caused by flowing fluid (in the presence or absence
f solid particles) damaging both the surface layers (e.g. passive
∗ Corresponding author. Tel.: +44 1133432119; fax: +44 1132424611.E-mail address: [email protected] (R. Barker).
043-1648/$ – see front matter © 2011 Elsevier B.V. All rights reserved.oi:10.1016/j.wear.2011.01.036
© 2011 Elsevier B.V. All rights reserved.
film or corrosion products) and the base metal [4,5]. This processis beginning to receive greater attention because of its destructivenature and the fact that this regime of degradation is becomingmore common due to increased sand production and the increas-ing severity of conditions attributed to extracting oil from deeperwells.
Enormous costs are directed towards managing corrosion anderosion–corrosion in the oil and gas industry and important safetyconsiderations are relevant to managing damage. The use of carbonsteel with chemical inhibitors such as amines, imidazoline com-pounds and nitrogen-based organic surfactants [6] still tends tobe a favorable choice for control of what is often still referred toas ‘corrosion’, compared to changing materials to corrosion resis-tant alloys (CRAs) such as duplex stainless steels because of theirlower cost, superior weldability and high strength [7]. Several stud-ies have found that high shear resistant CO2 corrosion inhibitorshave been useful in reducing the material degradation in flow-induced corrosion and erosion–corrosion environments for carbonsteel [8,9].
Various sections of pipework that were removed from several
different regions of the pipework system of an offshore facility werefound to have experienced exceptionally high wall thickness losses,preferential weld degradation and localized attack as a result ofinternal degradation. This prompted a case study to determine thesusceptibility of carbon steel pipework and weld material to the
1296 X. Hu et al. / Wear 271 (2011) 1295– 1301
Table 1Composition of process fluid.
Preparation (mg/L) Analysis (mg/L)
NaCl (sodium chloride) 24090 Na 10700KCl (potassium chloride) 706 K 370CaCl2·2H2O (calcium chloride di-hydrate) 1387 Ca 378MgCl2 (magnesium chloride) 4360 Mg 1113BaCl2·2H2O (barium chloride di-hydrate) 16 Ba 9SrCl2·6H2O (strontium chloride hexa-hydrate) 33 Sr 11
ptdir
2
ctbwd
miad
weFma
sdtzb(ta
biaw4
TN
Na2SO4 (sodium sulfate) 3522 SO4 2382NaHCO3 (sodium bicarbonate) 304 HCO3 221
rocess fluid environment as well as ascertaining the efficiency ofhe corrosion inhibitor currently used. Experimental results alsoetermined the effect of increasing the dose rate of the current
nhibitor and whether an alternative inhibitor could provide supe-ior surface protection.
. Field conditions and degradation analysis
The pipework of the offshore facility transports a mixture ofrude oil and process fluid at a water cut level of 95%. The composi-ion of the process fluid is provided in Table 1, which was providedy the company’s production chemistry department. Sand contentithin the system was recorded at a maximum of 500 mg/L throughata obtained from acoustic sand monitoring techniques.
Chemical inhibition techniques are currently being imple-ented on the lines. The commercially available corrosion inhibitor
njected into the lines (referred to as Corrosion Inhibitor A) isdministered at a dose rate of 10 ppm in an effort to mitigate theegradation.
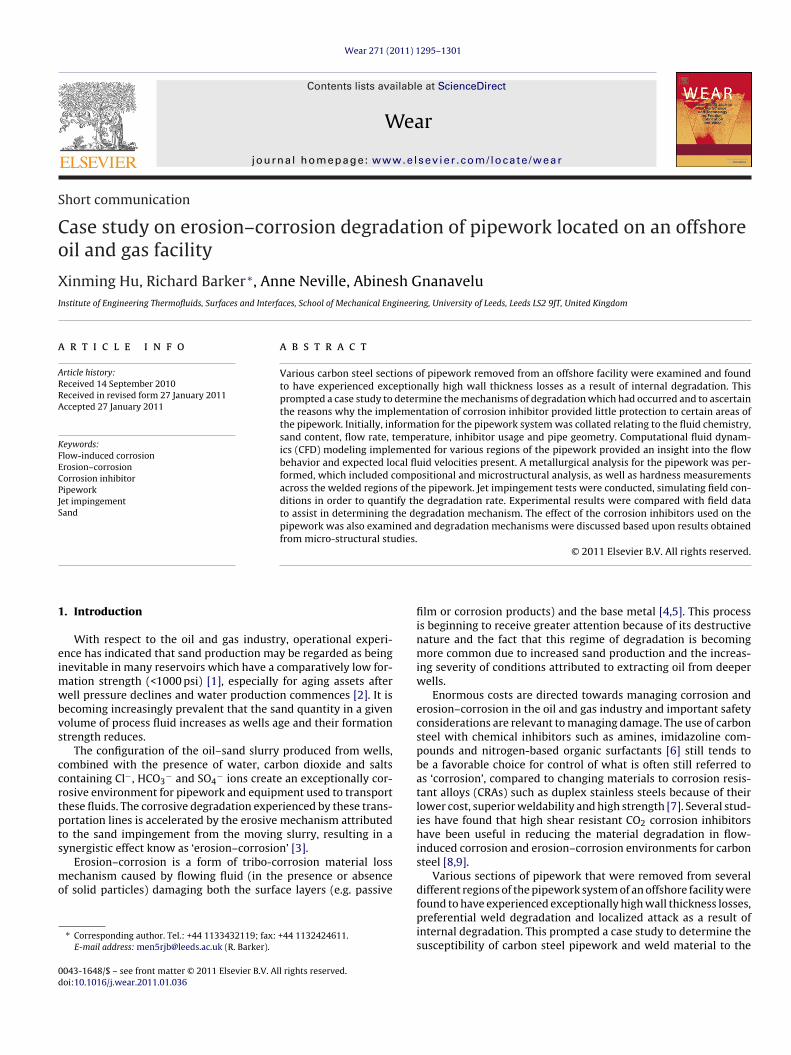
The examined compositions of the pipework material and theeld are shown in Table 2. Light microscope images of the par-
nt metal, heat affected zone (HAZ) and weld are provided inig. 1(a)–(c) after etching for 10 s in 2% nital solution. Hardnesseasurements across the weld were also conducted and results
re provided in Fig. 2.Severe degradation of pipework sections has been recorded as
hown in Fig. 3. The inspection data indicates that localized degra-ation rates are more significant than the average wall loss ofhe pipework sections including the parent metal, heat affectedone (HAZ) and the welds with degradation rates being predictedetween 0.50 and 6.18 mm/year. With a high level of water cut95%) the corrosive nature of the process fluid and the sand con-ent of 500 mg/L in the system, erosion–corrosion is considered toccount for such high rates of material loss.
The maximum flow velocity in the pipe was calculated at 4 m/sased on production rate data obtained from the offshore facil-
ty. CFD modeling of the pipework was implemented in order toscertain the behavior of the flow through bends and over internaleld beads. The analysis determined that for an inlet velocity of
m/s local velocities were capable of reaching up to nearly 7 m/s
able 2ominal compositions of carbon steel parent metal and weld material (wt%).
Element Parent metal Weld material
Carbon 0.120 0.200Silicon 0.210 0.230Manganese 0.960 1.120Phosphorus 0.019 0.010Sulfur 0.003 0.012Chromium 0.060 0.070Molybdenum 0.030 0.180Nickel 0.090 0.780Aluminum 0.035 <0.010
Fig. 1. Light microscope images of three regions of pipework after being polished
and etched in 2% nital solution for 10 s: (a) carbon steel parent metal from tangentialperspective (pearlite bands present in ferrite); (b) weld (1% Ni, 0.25% Mo) fromtangential perspective (acicular structure); (c) tangential view showing weld on leftand HAZ on right.in vertical sections of pipework which turned through 45◦ bends(Fig. 4).
3. Simulated field tests
A testing procedure, including static corrosion and jet impinge-ment experiments, was developed to assess the performance of the
parent metal and weld in simulated field environments with andwithout inhibition. The same brine solution was used for all exper-iments which is representative of the process fluid on the offshorefacility from where the pipework was taken (Table 1). Prior to start-ing every experiment the brine solution was sparged with CO2 for
X. Hu et al. / Wear 271 (
Fsi
a2ep
ri1cp
corrosion rate as a function of time for the parental metal and weld
Fw
ig. 2. Vickers hardness measurements across the welded region (the face of theample was polished and marked with equidistant points for Vickers diamondmpressions made using a load of 0.5 kg).
minimum of 8 h to achieve an oxygen concentration of below0 ppb to simulate the field conditions. The vessels were sealed invery test and CO2 was bubbled throughout to maintain CO2 partialressure at 1 bar.
The experimental procedure assessed the capability of the cur-ent pipework system corrosion inhibitor (Corrosion Inhibitor A)
n reducing material degradation at its current concentration of0 ppm. Further tests explored the effect of increasing the con-entration of Corrosion Inhibitor A to 100 ppm to determine if therotection could be improved. Finally, an assessment of a candi-ig. 3. Images of degradation seen on pipework: (a) localized attack on HAZ region of flhich the spool was in operation; (b) external view of localized corrosion; (c) preferentia
2011) 1295– 1301 1297
date inhibitor Corrosion Inhibitor B was undertaken at 100 ppmto establish if enhanced surface protection could be offered by analternative blend of chemicals.
In the cases where inhibition was used, the chemicals wereadded immediately before the test commenced. Samples (weld orparent metal) were cut from the pipework, machined down andprepared for measurements. All specimen surfaces were then wet-ground on 1200 grit silicon carbide abrasive paper and rinsed withdistilled water before starting the tests.
4. Static corrosion tests
Static corrosion tests were conducted in the brine solution (withand without inhibition) as a baseline for the erosion–corrosionexperiments. DC linear polarization measurements were con-ducted using a computer controlled potentiostat at a brinetemperature of 45 ◦C, the same temperature as in the field. A threeelectrode cell was used comprising of a Ag/AgCl reference electrode,a platinum auxiliary electrode and the specimen working/test elec-trode. The sample potential was scanned from 20 mV more negativethan the free corrosion potential (Ecorr) to 20 mV more positive thanthe free corrosion potential, at a scan rate of 0.25 mV/s. Tests ranfor 4 h in total. The corrosion rate in mm/year was calculated usingpolarization resistance values and Faraday’s law. Fig. 5 shows the
in the blank brine solution and with the addition of 10 ppm of Corro-sion Inhibitor A. The corrosion rate of the weld in blank conditions ismarginally higher (2.94 mm/year average) corresponding to that ofthe parent metal (2.65 mm/year). It is clear that Corrosion Inhibitor
ange on spool-penetration rate of 6.18 mm/year calculated based on time duringl weld attack on material; (d) close-up of preferential attack.

1298 X. Hu et al. / Wear 271 (2011) 1295– 1301
Fig. 4. Contours of velocity distribution magnitude for fluid flow of 4 m/s: (a) over an ipipework turning through 45◦; (c) along horizontal pipework turning down through 90◦
Fig. 5. Corrosion rate as a function of time for parent metal and weld material inCO2 saturated brine solution with and without the addition of 10 ppm of Inhibitor Aat 45 ◦C (converted to corrosion rate using Tafel slope values of ˇa = 120 mV/decadeand ˇc = 120 mV/decade).
nternal weld bead of vertical pipework; (b) within a section of vertical section ofwith a radius of 1.5D.
A is reducing the corrosion rate to the level of below 0.50 mm/yearfor both materials (0.44 and 0.28 mm/year final corrosion rates forparent metal and weld material, respectively), which is lower thanany of the wall thickness losses according to inspection data. It musttherefore be considered that the presence of flow within the systemcoupled with the existence of sand is enhancing the degradationprocess.
Increasing the dosage level to 100 ppm for Corrosion Inhibitor Aoffers no significant improvement on the mitigation for the parentmetal, reducing the corrosion rate to 0.41 mm/year as shown inFig. 6. Further protection of the weld was seen as corrosion ratesreduced from 0.28 to 0.05 mm/year as a result of the increase inconcentration of Inhibitor A. The introduction of Corrosion InhibitorB at 100 ppm produced similar results to that of Corrosion InhibitorA at the same concentration; reducing the final corrosion rate of the
parent and weld material to 0.36 and 0.10 mm/year, respectively.5. Jet impingement tests
Jet impingement tests were conducted using a submergedimpinging jet apparatus, shown in Fig. 7. A re-circulating system is

X. Hu et al. / Wear 271 (2011) 1295– 1301 1299
Fi1o
abodmts
butordflstm
rFei
I
wtspp
ig. 6. Corrosion rate as a function of time for parent metal and weld materialn CO2 saturated brine solution with the addition of 100 ppm of Inhibitor A and00 ppm of Inhibitor B at 45 ◦C (converted to corrosion rate using Tafel slope valuesf ˇa = 120 mV/decade and ˇc = 120 mV/decade).
dopted by the rig which enables the mixture of fluid and sand toe delivered through a dual nozzle arrangement which impingesnto a flat specimen at an angle of 90◦. The nozzle is 4 mm iniameter and positioned at a fixed distance of 5 mm from the speci-en. Gravimetric measurements were taken using a scale accurate
o 0.01 mg and then converted into a thickness loss based on theurface area of the sample (400 mm2) exposed to the jet.
Tests were conducted for 4 h and specimens were weighedefore and after the test (after removing the corrosion prod-ct with Clarke solution) to determine the total weight loss. Allests were conducted at flow velocity of 7 m/s and temperaturef 45 ◦C. Tests were conducted with 500 mg/L of sand added toepresent erosion–corrosion conditions. Blank tests were also con-ucted without the presence of sand to determine the effect ofow-induced corrosion. Spherical sand particles were used in thesetudies which have an average diameter of 250 �m. Scanning elec-ron microscopy (SEM) was utilized to study the material removal
echanisms.Material thickness loss rates under jet impingement envi-
onments for both parent metal and the weld are shown inig. 8. The efficiency of corrosion inhibitors under both static androsion–corrosion conditions has been calculated and is displayedn Table 3 using the following equation:
nhibitor efficiency = CRNI − CRWI
CRNI× 100 (1)
here CRWI and CRNI are the corrosion rates determined from theests with and without inhibition, respectively. Compared withtatic corrosion rate without inhibition, 7 m/s of flow without theresence of sand shows significant enhancement on the corrosionrocess. When blank flow-induced corrosion results are compared
Fig. 7. Re-circulation rig for CO2 jet impingement experiments.
Fig. 8. Total mass loss and thickness loss rate under erosion–corrosion for carbonsteel parent metal, and weld material at 7 m/s, with different sand loadings, at 45 ◦C,with and without the addition of different concentrations and types of inhibition.
with blank erosion–corrosion results at 500 mg/L sand concen-tration, the influence of flow-induced corrosion is the dominantprocess, accounting for more than 85% of the total material removal.
In terms of inhibitor performance, although over 80% protec-tion can be offered by Corrosion Inhibitor A in static conditions at10 ppm, the protection is significantly less when the parent metaland the weld are exposed to liquid–solid impingement at 10 ppmconcentration. Inhibitor efficiencies were calculated at 11.5 and7.8% for the parent metal and weld material, respectively. Thisis considered to be due to adsorption of the inhibitor onto sandparticles which has reduced concentration in the bulk solution,leading to a decrease in inhibitor performance [4]. The materialloss at 10 ppm Inhibitor A is comparable to the localized high pen-etration rate of 6.18 mm/year determined from the failed spool(Fig. 3(a)). An increase in the dosage of Corrosion Inhibitor A to100 ppm significantly reduced material losses, producing efficien-cies of 63.1 and 75.0% for the weld and parent metal, respectively.However, the introduction of Corrosion Inhibitor B as a candi-date with 100 ppm concentration demonstrated the best inhibitionefficiency for the materials under liquid–solid impingement condi-tions, reducing degradation by 92.5 and 89.9% for the parent metaland weld material, respectively. According to Schmitt [10], watersoluble inhibitors can form a rod-like structure which can inducedrag reduction effects so as to reduce wall shear stress and protectthe metal surface from erosion. This work indicates that inhibitoroptimization for erosion–corrosion may not be a simple translationfrom an effective corrosion inhibitor.
SEM analysis was conducted in the region 3–6 mm from the cen-tre of impingement for the parent metal specimens, as this wasthe area where particle impingement at low angles occurs accord-ing to a previous CFD analysis of the system [11]. Images for theflow-induced test in blank conditions revealed signs of material dis-solution with pearlite regions protruding, indicating the removalof ferrite regions had taken place (Fig. 9(a)). The introduction ofsand to the system in the blank test was not noticeable on the SEMimages, indicating that material dissolution was the more domi-nant process as opposed to the removal of material through particleimpingement (Fig. 9(b)). Addition of 10 ppm of Inhibitor A failedto change the visual appearance of the surface (Fig. 9(c)), but theincrease in concentration of Inhibitor A served to reduce signs ofmaterial dissolution, which agrees with the reduction in weightloss observed (Fig. 9(d)). The addition of 100 ppm of Inhibitor B
reduced material loss significantly, and this was displayed throughSEM images. The surface of the specimen showed no signs of dis-solution and impingement marks from sand particles were visible(Fig. 9(e)).
1300 X. Hu et al. / Wear 271 (2011) 1295– 1301
Table 3Inhibitor efficiencies for static corrosion and erosion–corrosion conditions.
Static corrosion Erosion–corrosion
10 ppm Inhibitor A 100 ppm Inhibitor A 100 ppm Inhibitor B 10 ppm Inhibitor A 100 ppm Inhibitor A 100 ppm Inhibitor B
Parent metal 82.9% 84.4% 86.3% 11.5% 75.0% 92.5%Weld material 90.5% 98.2% 96.3% 7.8% 63.1% 89.9%
F ated ci A (500I
6
iA
ig. 9. SEM analysis of parent metal surfaces under erosion–corrosion in CO2 saturn (a) brine (0 mg/L sand); (b) brine (500 mg/L sand); (c) brine + 10 ppm Inhibitor
nhibitor B (500 mg/L sand).
. Concluding remarks
The results from jet impingement tests clearly confirm the local-zed pipework wall thickness loss is due to erosion–corrosion.lthough the nominal flow rate is low by controlling the production
onditions at 7 m/s and 45 ◦C, between 3 and 6 mm from the centre of impingement mg/L sand); (d) brine + 100 ppm Inhibitor A (500 mg/L sand); (e) brine + 100 ppm
rate, flow velocity distribution needs to be taken into consid-eration as components with complex geometry can experiencesevere damage due to erosion–corrosion. Performance of corro-sion inhibitors in static corrosion differs from flow environmentscontaining sand. Therefore, the selection of a corrosion inhibitor

271 (
rnsaIa
R
X. Hu et al. / Wear
equires laboratory tests in dynamic conditions, where hydrody-amics and solid particle impacts can enhance the material lossignificantly. The concentration and type of corrosion inhibitor play
vital role in term of it is performance. 100 ppm of Corrosionnhibitor B offers the best protection for the pipework parent metalnd the weld according to the experimental results.
eferences
[1] M.M. Salama, Sand production management, Journal of Energy Resources Tech-
nology 122 (1) (2000) 29–33.[2] M.M. Salama, Influence of sand production on design and operations of pipingsystems, CORROSION 2000, paper no. 80, NACE, Orlando, FL, 2000.
[3] X. Tang, L.Y. Xu, Y.F. Cheng, Electrochemical corrosion behaviour of X-65 steel inthe simulated oil–sand slurry. II. Synergism of erosion and corrosion, CorrosionScience 50 (5) (2008) 1469–1474.
[
[
2011) 1295– 1301 1301
[4] A. Neville, C. Wang, Erosion–corrosion of engineering steels—can it be managedby use of chemicals? Wear 267 (11) (2009) 2018–2026.
[5] X. Hu, A. Neville, CO2 erosion–corrosion of pipeline steel (API X65) in oil andgas conditions—a systematic approach, Wear 267 (11) (2009) 2027–2032.
[6] A. Rim-Rukeh, A.J. Kehinde, Investigation of soil corrosivity in the corrosion oflow carbon steel pipe in soil environment, Journal of Applied Sciences Research8 (2) (2006) 466–469.
[7] J.A. McMahon, J.W. Martin, L. Harris, Effect of sand and interfacial adsorptionloss on corrosion inhibitor efficiency, CORROSION 2005, paper no. 274, NACE,Houston, TX, 2005.
[8] G. Schmitt, M. Mueller, Critical wall shear stresses in CO2 corrosion of carbonsteel, CORROSION 99, paper no. 44, NACE, San Antonio, TX, 1999.
[9] A. Neville, C. Wang, Erosion–corrosion mitigation by corrosion inhibitors—an
assessment of mechanisms, Wear 267 (2009) 195–203.10] G. Schmitt, Drag reduction by corrosion inhibitors—a neglected option for mit-igation of flow induced localized corrosion, Materials and Corrosion 52 (2001)329–343.
11] A. Gnanavelu, et al., An integrated methodology for predicting material wearrates due to erosion–corrosion, Wear 267 (11) (2009) 1935–1944.

![[ ADGAS_Co Module_04 ] Pipework](https://static.fdocuments.us/doc/165x107/543fef1cb1af9f560a8b4ad0/-adgasco-module04-pipework.jpg)