Improved lexicon-based sentiment analysis for social media analytics
Upload
ritesh-yadavCategory
view
90download
1
Copyright @ 2011. All rights reserved
Case Study on Data Analytics on improved Schedule Data Quality
Project Controls Expo – 16th Nov 2016Emirates Stadium, London
Ritesh YadavAssociate Consultant - Projcon Group

Copyright @ 2011. All rights reserved
ProjCon Group
Consulting
Offering innovation, advice, implementation, technical support inProject Controls.
Know more on http://projcon-group.com/
Project Controls Institute
Blended Learning Platform
Multi-accreditation system
Know more on http://www.projectcontrolsinstitute.com/

Copyright @ 2011. All rights reserved
About the Speaker
Ritesh Yadav Associate Consultant, Projcon Group.
Currently working for ProjCon Group; delivering & setting-up project controls processes and reporting framework for its clients.
Previously worked as a Sr. Planning Engineer in Dedicated Freight corridor CTP 1 & 2 Railway Project (1200 kms. Track laying) worth 1.2 Billion Dollar.
Holds Bachelors Degree in Civil Engineering; practicing application of Project Controls; expertise are in Earned Value Management, MI Reporting, Monitoring & Controls, and Schedule management.

Copyright @ 2011. All rights reserved
EVM Reporting
People Systems
Data Processes

Copyright @ 2011. All rights reserved
Data Cycle
Create
Schedule data
Progress data
Cost data
Evaluation
Evaluate and Assess the
Performance Parameters
Re-Baseline
Used to baseline other similar
projects
Lesson Learnt
Optimization
Location

Copyright @ 2011. All rights reserved
Data Cycle
Create
Schedule data
Progress data
Cost data
Evaluation
Evaluate and Assess the
Performance Parameters
Re-Baseline
Used to baseline other similar
projects
Lesson Learnt
Optimization
Location
What Happens if the Data
Quality is not up to the
mark?

Copyright @ 2011. All rights reserved
Effects of Poor Data Quality
Risk of Delays and Cost over-runincreases
Affects Progress Parameters (Reporting failure)
Reserve adequacy risk (Cash flow)
Material/Resource/Manpowerforecasting
Optimization failure
Difficulty to Baseline similar projects
Data driven decisions impacted
Image Source : Google
Copyright @ 2011. All rights reserved
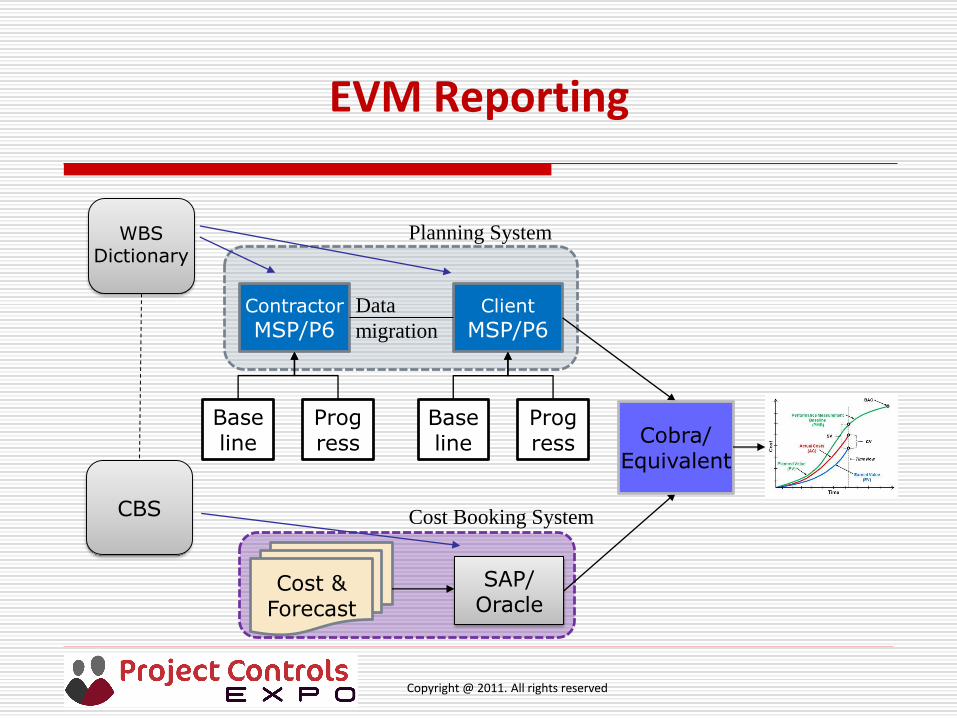
EVM Reporting
Contractor
MSP/P6Client
MSP/P6
SAP/Oracle
Cobra/Equivalent
WBS Dictionary
CBS
Data
migration
Cost Booking System
Planning System
Cost & Forecast
Baseline
Progress
Baseline
Progress

Copyright @ 2011. All rights reserved
Contractor
MSP/P6Client
MSP/P6
SAP/Oracle
WBS Dictionary
CBS
Cost Booking
System
Planning System
Cost & Forecast
Baseline
Progress
Baseline
Progress
Data
migration
Not on sync
Change in WBS
Dictionary.
Baseline
Management
Progress
Rollback
Cost
Rollback
Planning/Physical progress
& Cost booking/forecast
not in sync
EVM Reporting – Data Quality Issues
Schedule
Quality
Cobra/Equivalent

Copyright @ 2011. All rights reserved
Data Quality Assessment
Schedule Data (Planned / Baseline data)
Schedule quality metrics (Schedule Auditor)
Baseline management
Reporting Challenges & Limitations
Cost booked in invalid CBS (WBS – CBS integration)
Change in WBS Dictionary
Systems/Software induced issues
Cost & Progress Data
Cost Rollback (negative cost booking)
Progress Rollback
Co-relation between Cost & Progress booked

Copyright @ 2011. All rights reserved
Schedule Auditor
Project ID
Schedule Quality Score Average 71% ######### ####
Data Date
Performance % Complete
Schedule % Complete
Total No of Activities
Activities Completed
Activity % Complete
1 0% PASS 0 of 58 1% PASS 1 of 71
2 5% FAIL 3 of 58 4% PASS 3 of 71
3 0% PASS 0 of 58 0% PASS 0 of 71
4 0% PASS 0 of 58 0% PASS 0 of 71
5 45% FAIL 26 of 58 37% FAIL 26 of 71
6 Activities with Negative Float 0% PASS 0 of 58 0% PASS 0 of 71
7 65% FAIL 32 of 49 71% FAIL 41 of 58
8 0% PASS 0 of 58 0% PASS 0 of 71
9 8% FAIL 4 of 49 7% FAIL 4 of 58
10 97% FAIL 56 of 58 94% FAIL 67 of 71
11 87% FAIL 13 of 15
12 0% PASS 0 of 58 0% PASS 0 of 71
Project Name
PROJECT SUMMARY
Project Dates
Type of Activities
BaselineForecast
Start
Finish
F/B Cost(M)
15%
17%
71
Task Dependent
Milestones
Level Of Effort
NosPercentage
Incomplete Activities All Activities
Percentage
13
18% WBS Summary
58
13
0
0
0
Resource Dependent
DASH BOARD
Baseline Execution Index (BEI)
Schedule Quality Checks
Activities with High Float
Activities with Long Duration
Activities with Invalid Date
Activities W/o Predecessor
Activities W/o Successor
Dangling Activities
Activities with Constraints
Activities without Baseline
Result
S.No
Nos
Activities without Resources
Activities with Missing Target
Process All

Copyright @ 2011. All rights reserved
Schedule Auditor
SCHEDULE QUALITY REPORT - INCOMPLETE ACTIVITIES
03
0 0
26
0
32
0
4
56
000
10
20
30
40
50
60
70
Activities W/oPredecessor
Activities W/oSuccessor
DanglingActivities
Activities withConstraints
Activities withHigh Float
Activities withNegative Float
Activities withLong Duration
Activities withInvalid Date
Activitieswithout
Resources
Activities withMissing Target
BaselineExecution Index
(BEI)
Activitieswithout
Baseline
SCHEDULE QUALITY CHART: INCOMPLETE ACTIVITIES
Copyright @ 2011. All rights reserved
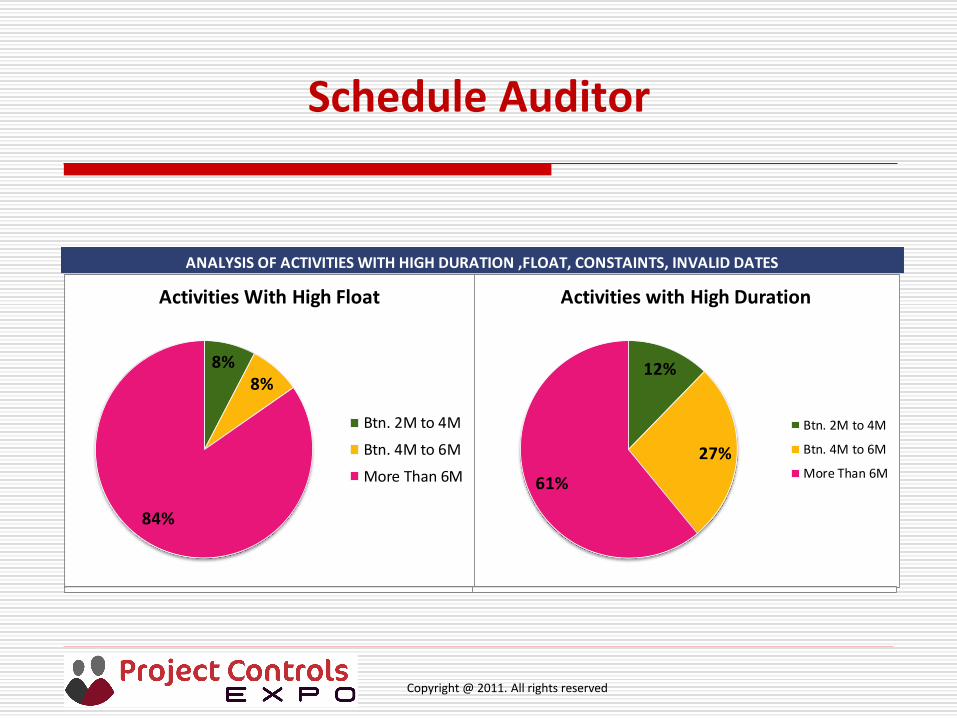
Schedule Auditor
ANALYSIS OF ACTIVITIES WITH HIGH DURATION ,FLOAT, CONSTAINTS, INVALID DATES
12%
27%
61%
Activities with High Duration
Btn. 2M to 4M
Btn. 4M to 6M
More Than 6M
8%8%
84%
Activities With High Float
Btn. 2M to 4M
Btn. 4M to 6M
More Than 6M

Copyright @ 2011. All rights reserved
Change in Baseline Historical Cost Profile

Copyright @ 2011. All rights reserved
Change in Baseline Historical Cost Profile

Copyright @ 2011. All rights reserved
Data Collection
Data
Normalization
Reporting
Database
Change in Baseline Historical Cost Profile
Analyse

Copyright @ 2011. All rights reserved
Reporting Challenges & Limitations
Alignment between the Core systems(Planning & cost control)
Dates
Forecast(cost & resource)
WBS – CBS integration
Invalid codes present systems
Old WBS codes remaining in the system;
Change in WBS dictionary
Transfer of Cost & Budget.
Systems/Software induced issues
Resource loading activity Start & Finish
% complete out of range
Invalid dates
Incomplete data transfer
Copyright @ 2011. All rights reserved
Cost & Progress Related Data Quality Issues

Copyright @ 2011. All rights reserved
75%
-25%
Actual Cost
Positive
Negative
Cost Rollback
-40000000
-20000000
0
20000000
40000000
60000000
80000000
100000000
Positive
Negative
77%
23%
WBS - AC Count
Positive
Negative

Copyright @ 2011. All rights reserved
-20000000
0
20000000
40000000
60000000
80000000
100000000
Positive
Negative
Progress Rollback
88%
12%
WBS - EV Count
Positive
Negative
86%
-14%
Earned Value
Positive
Negative

Copyright @ 2011. All rights reserved
Earned Value vs Actual Cost
Monthly plot for 2
Financial years
Linear Correl index = 0.3

Copyright @ 2011. All rights reserved
Data Quality Assessment is an important aspect of progress reporting, it helpsin
understanding the reporting gaps
Cleaning the data & make it reliable
Identifies the degree of variance in progress parameters
Creates a dependable back-up data for business decisions
Effective data quality management should be considered a basic requirementfor modern-day project management.
Create business rules for sustainable data quality improvement
Quality of data is a risk and should be monitored with other project/portfoliorisks.
Conclusion

Copyright @ 2011. All rights reserved