CASE STUDY OF TOURISM AND ICT SECTORS - ETFgetAttachment... · CASE STUDY OF TOURISM AND ICT...
24
WOMEN AND WORK IN EGYPT CASE STUDY OF TOURISM AND ICT SECTORS WORKING PAPER Prepared by Jesús Alquézar, Francesco Panzica and Natalia Popova (ETF staff) Special thanks to Gihan Abou Zeid for her insightful comments and inputs European Training Foundation, July 2009
Transcript of CASE STUDY OF TOURISM AND ICT SECTORS - ETFgetAttachment... · CASE STUDY OF TOURISM AND ICT...

WOMEN AND WORK IN EGYPT CASE STUDY OF TOURISM AND ICT SECTORS
WORKING PAPER Prepared by Jesús Alquézar, Francesco Panzica and Natalia Popova (ETF staff) Special thanks to Gihan Abou Zeid for her insightful comments and inputs European Training Foundation, July 2009

CONTENTS 1. INTRODUCTION ................................................................................................................... 3
1.1 Scope of the project ......................................................................................................... 3 1.2 General social and economic environment...................................................................... 4 1.3 Legal framework .............................................................................................................. 5 1.4 Demographic indicators ................................................................................................... 6 1.5 Traditional gender paradigm............................................................................................ 7
2. EDUCATIONAL ISSUES....................................................................................................... 8
2.1 Financing education....................................................................................................... 11 3. TRANSITION FROM SCHOOL TO WORK......................................................................... 12 4. EMPLOYMENT ISSUES ..................................................................................................... 13 5. WOMEN IN POLICY MAKING ............................................................................................ 16 6. THE TOURISM SECTOR.................................................................................................... 17
6.1 Subsectors and definitions............................................................................................. 18 6.2 Women in the tourism sector ......................................................................................... 18 6.3 Education and training in tourism .................................................................................. 19
7. THE ICT SECTOR............................................................................................................... 19 8. FINDINGS............................................................................................................................ 21 BIBLIOGRAPHY...................................................................................................................... 22
2

1. INTRODUCTION
1.1 Scope of the project
Women’s participation in economic activity brings benefits at both micro and macro levels.
At the macro level there is a positive correlation between female labour force participation rates and economic growth.
At the micro level the participation of women in the labour force is beneficial for the welfare of the family (income, health, children’s education etc.).
It is normally expected that raising the levels of education and training will increase women’s labour force participation rates. Also, generally, the more education an individual has, the greater their income potential. Comparative studies examining the impact of female education on gross domestic product (GDP) and poverty reduction demonstrate positive effects (World Bank, 2004). Education and skills enhance the productivity of both women and men, and increase their opportunities for paid employment in the formal sector (ILO, 2008).
The Middle East and North African (MENA) region has the lowest female labour force participation rates in the world. An increase in the educational levels of women has not led to a proportional increase in the female labour force participation rates. There is a loss of human resources in the productive process at the macro level, and women’s economic empowerment lags behind that of men at the micro level (World Bank, 2004).
For many years, the ETF has been an active partner for Egypt in the reform of vocational education, training and employment and, within this scope, various projects have been implemented, including the MEDA-ETE (Education and Training for Employment) regional project, the Transition from Education to Work, the National Qualifications Framework and the Observatory Function projects. Cooperation is ongoing with the Ministry of Manpower and Migration on a project linking migration to skills. The ETF also works closely with the Delegation of the European Commission and supports as well the implementation of the EU–MEDA TVET reform project.
The ETF project aims to promote sustainable gender equality policies in Egypt, Tunisia and Jordan in the areas of education, training and employment, taking into consideration the specific local socio-economic context.
The purpose of the project is to increase the knowledge and awareness of obstacles and opportunities for women’s employment in two potential growth sectors of the economy (information and communication technologies (ICT), and tourism) in the countries selected and to provide recommendations and advice to both the national authorities and the European Commission for strengthening the role of women in the labour market.
Given that (i) in order gain employment, women need skills for which there is a demand in the labour market, and (ii) youth unemployment in the Mediterranean region is primarily a first-entry problem (particularly for young females) (Amer, 2007; El-Zanaty and Associates, 2007), the research will focus on the labour force participation of young females (15–29 years old) in two potential growth sectors in Egypt, Jordan and Tunisia.
Tourism and ICT have been identified as the most appropriate sectors because:
they have good potential for generating employment;
the provision of a skilled labour force is crucial for ensuring their growth.
This report analyses the general conditions for women in Egypt, with a primary focus on education and employment issues linked to the two sectors identified.
The main research questions to be addressed include the following:
What is the potential of these two sectors for employment and income generation for women?
How do different types of education impact on women’s employment in these two sectors?
3

What are the reasons for participation or non-participation in the labour force of young females trained in occupations related to the two sectors?
How can women’s employment be enhanced in these sectors? What types of incentive can be implemented in order to increase female labour market participation?
What type of sector interventions – either through gender mainstreaming or special female-targeted interventions – would support greater gender equality?
What objectives and results related to gender equality could be included in sector strategies, programmes and initiatives? Furthermore, how could donors, in particular the European Commission, support these activities?
What indicators could be used to measure progress toward gender equality in education and employment at sector level?
1.2 General social and economic environment
The turning point in the recent history of Egypt was the revolution on 23 July 1952, which abolished the monarchy and established a republic with a state-led economy, with Gamāl Abd al-Nasser as president from October 1954.
At that time, the regime aimed to encourage economic and social participation in development. In order to achieve this, the state adopted measures enabling citizens, including women, to benefit from available opportunities for education and employment.
After Nasser’s death on 28 September 1970, Anwar al-Sādāt became the new president of Egypt. His government started a reform that aimed to move from a highly centralised economy to a more liberal economy by encouraging foreign and domestic private investment. Adopted in 1974, this policy was called Infitah (‘open door’). The process was continued even after the murder of al-Sādāt on 6 October 19811. In fact, in 1991 Egypt embarked on a major Economic Reform and Structural Adjustment Program (ERSAP) with support from the IMF and the World Bank, which was partly a response to the sharp fall in oil prices in 1986.
The liberalisation process that began with Infitah had negative effects for women: there were few opportunities for new entrants in the public sector, there was a ‘defeminisation’ of non-governmental jobs, and the gender gap in wages increased (Assaad and Arntz, 2004). In addition, the value system established by the reforms was questioned. Up until 1977 political Islam was favoured by the Egyptian government, which was interested in attracting the moderate Islamist intelligentsia (Keppel, 2000). The situation changed after 1977 as a result of President al-Sādāt’s visit to Israel, the Egyptian–Israeli Peace Treaty, the ‘Bread Riots’ against economic liberalisation and, finally, al-Sādāt’s assassination in 1981. Nevertheless, the strong influence of Islamism was established, in particular with regard to gender issues.
ERSAP included, inter alia: a stabilisation component that aimed to eliminate large, unsustainable fiscal and external imbalances; trade, exchange rate, and financial sector reforms aimed at liberalising the economy; and an ambitious privatisation programme. An explicit objective of ERSAP was the reorientation of the economy toward the market, and a reduction in the role of the state, including its role as a dominant employer.
Today the Egyptian economy is facing increased global competition in some of its key exporting sectors and suffers from structural problems (ETF, 2005), but between 2004 and 2007 both GDP and GDP per capita growth consistently increased to reach levels of around 7% in 2006 and 2007.
1 He was replaced by Muḥammad Ḥosnī Sayyid Ibrāhīm Mubārak.
4

Figure 1: GDP and GDP per capita growth (%), 1990–2007
-2-1012345678
1990
1991
1992
1993
1994
1995
1996
1997
1998
1999
2000
2001
2002
2003
2004
2005
2006
2007
GDP growth (annual %) GDP per capita growth (annual %)
Source: World Bank, World Development Indicators database
Economic growth has not been equally distributed across the whole population. Despite improvements in living conditions2, wealth has not led to equity: the richest 10% of the population account for 27.6% of the income of the country, while the poorest 20% must survive with 8.9% of the national income (World Bank, World Development Indicators database). Indeed, it is estimated that 18.9% of the population was living on less than $1 per day in 2008 (World Bank, 2008). As a result of the economic weakness, migration is playing an important role in Egypt (ETF, 2007).
1.3 Legal framework
The Egyptian Constitution, issued in 1971, provides for equality between men and women in all spheres. Article 40 stipulates: ‘Citizens are equal before the law. They have equal rights and duties regardless of sex, origin, language, religion or belief.’ All Egyptians also have a constitutional right to work, without discrimination.
While Egyptian women legally have equal rights in public life, work, health and education, they do not enjoy equal rights within the family as a marital unit. In Egypt the Personal Status Law is based on Islamic Shari’a law. In January 2000 the Personal Status Law was revised. Until then, only the husband had the right to a divorce, without his wife’s consent, or even her prior knowledge. The reform gave women the opportunity to obtain a divorce, without proving mistreatment. In the same year, Egyptian courts allowed women to obtain a passport or to travel without permission from their parents or husbands. Muslim women are nevertheless prohibited from marrying Christian men, and non-Muslim women who marry Muslim men are subject to Islamic law (UNDP Programme on Governance in the Arab Region (POGAR)).
The Labour Law No 12/2003 replaced previous laws on labour relations, but it does not apply to free zones, foreign investment companies, civil servants (who are subject to the Civil Service law), agricultural and domestic workers.
The Labour Law provided working women with special legal provisions during pregnancy and following childbirth. However, employers choose not to hire women, in order to avoid paying for their social insurance contributions and maternity rights. Article 91 of the Labour Law stipulates that: ‘maternity leave shall not be granted more than twice throughout the female worker’s period of service’. A pregnant worker is granted 90 days’ maternity leave from the estimated date of delivery and 45 days from the actual delivery day. In addition, Article 94 of the Labour Law states: ‘A female worker in an establishment employing 50 or more workers shall have the right to obtain leave without pay for a period not exceeding two years, to care
2 See below: indicators for literacy, access to education, employment and mortality rates have gradually improved over recent decades.
5

for her child. This leave shall not be granted more than twice throughout her period of service.’
A gender-specific measure is granted by Article 93 to the female worker who is breast-feeding her child. She has the right, during the 24 months following childbirth, to two per day breast-feeding breaks, each of not less than half an hour.
The attention given by the Egyptian government to the problems that are encountered by women in their public and private lives was confirmed by the establishment in March 2009 of the new Ministry of State for Family and Population. The ministry’s mandate is to establish policies, strategies and operational work plans relating to family empowerment and well-being, working across different sectors – education, health, labour, economic development, investment and information – in coordination with other relevant ministries.
Despite some relative successes, in 2005 a World Economic Forum study, ‘Women’s Empowerment: Measuring the Global Gender Gap’, ranked Egypt at the bottom of the list of the 58 countries surveyed (World Economic Forum, 2005). It is interesting to note that Egypt was given the lowest mark in all five areas of the analysis, namely:
economic participation
economic opportunity
political empowerment
educational attainment
health and well-being.
In the period 2007–08, according to the UNDP gender empowerment measures (GEM), Egypt was ranked at number 112 out of 177 countries (UNDP Human Development Report 2007/2008). For comparison purposes, in the same classification Jordan was ranked at 86 and Tunisia at 91.
1.4 Demographic indicators
According to the 2006 census, the Egyptian population is 76,699,427 (including non-residents), of whom 46.4% are women (CAPMAS, 2006 census).
Since 1992 the population has been increasing by 1.8–1.9 % every year, as a result of the combined effect of decreasing mortality (from 8.9‰ in 1990 to 5.7‰ in 2006) and decreasing fertility (from 4.3 children per woman in 1990 to 2.9 in 2006). Trends in the data on child mortality or life expectancy at birth show that, overall, sanitary and living conditions have been improving in Egypt in recent decades (World Bank, World Development Indicators database). Life expectancy for both males and females rose from 71 in 2000 to 74 in 2006; for males it rose from 66.7 in 2000 to 69.5 in 2006.
Egypt is going through a demographic transition known as a ‘youth bulge’, since in 2005 the population cohort 0–14 represented 33.3% of the population as a whole. Despite a tendency for a decrease in this age group, the projections for 2050 indicate 36 years (UN, 2008) as the average age of the Egyptian population.
6

Figure 2: Population growth projections 2000–50 in Egypt
Population
0
20,000
40,000
60,000
80,000
100,000
120,000
140,000
2000 2010 2020 2030 2040 2050
Source: UN, World Population
Demographic growth has two types of effect.
More than 42 million Egyptians (around 56% of the whole population) are younger than 25 years old. This is combined with increasing literacy levels in the population (71.4% of adults in 2005, compared with just 44.4% in 1986), especially among young people (85.0% in 2005); longer school-life expectancy; and increased levels of enrolment in secondary and higher education3, which implies enormous needs in terms of financial and human resources in order to respond to the demand for education. Under such conditions, the quality of education is an issue.
The Egyptian labour market is unable to absorb the working-age population, in particular potential new entrants in the labour market. In recent years Egypt has improved its activity rates (from 46% of the population aged 15–64 in 2003 to 50% in 2007), its employment rates (from 41% in 2003 to 46% in 2007) and unemployment rates (from 11% in 2003 to 9% in 2006)4, but employment levels remain low compared with those of other regions, and employment is unequally distributed.
1.5 Traditional gender paradigm
The promotion of certain customs and traditions can limit the activity of women and confine their existence to the framework of the family. The degree of application of customs and traditions varies between rural and urban communities. In the former, women are largely constrained, whereas in the latter they enjoy wider opportunities that allow them to participate in roles other than reproduction and farm labour (Abou Zeid, 2006).
Although these norms are changing in Egypt, women are still generally defined as dependants, and are expected to be subordinate to men. Reproduction and childcare are generally seen as their primary responsibilities. Particularly during times of high unemployment, there is an implicit understanding that women should stay at home, ceding their places in the labour force to men, especially in the private sector.
3 The net enrolment ratio in secondary education was 78.7% in 2001 and 82.1% in 2005, while the gross enrolment ratio in ISCED levels 5 and 6 increased from 29.2% in 2003 to 34.6% in 2005. Source: UNESCO Institute for Statistics, www.uis.unesco.org 4 CAPMAS, Labour Force Survey, based on MEDA-ETE data collection. Employment rates are the percentage of employed people aged 15–64 divided by the total population of the same age. Unemployment rates are the number of unemployed people divided by the active population.
7

2. EDUCATIONAL ISSUES
Gender norms and the traditions of society play an important role in deciding whether or not resources should be allocated to the education of women. In the traditional gender paradigm, men’s education is considered to be more profitable, since the man is expected to be the only bread-winner in the family. This should be taken into account when analysing educational trends in the MENA region, where considerable progress has been made in giving women proper access to education as well.
The Dakar Framework for Action to achieve Education for All (EFA) (World Education Forum, 2000) set ambitious goals for improving the female adult literacy rate and eliminating gender inequality in primary and secondary education. According to the 2008 EFA Global Monitoring Report, in 2005 there were 542,000 students enrolled in Egyptian pre-primary education (48% female), of which 31% were in private institutions. The gross enrolment rate (GER) was 17%; this had increased s from 11% in 1999 as a result of increased government investment. However, it is important to note that only 2% of children from the poorest households ever attended pre-schools (2005–2006 Egypt Household Education Survey).
Female literacy has increased in the MENA region, with some variations between countries. The positive trend is noticeable when comparing the youth and adult populations. These trends are also evident in Egypt, where literacy levels are lower among adult females (59.7%) than males (83.3%) (see Figure 3). These differences are less pronounced in the age group 15–24 (79% females; 90% males)5. Increasing youth literacy rates could be attributed to the success of illiteracy elimination campaigns and improved school enrolment levels, particularly for females (Nassar, 2008).
Figure 3: Adult literacy rates (%), by gender
57.067.2
83.3
31.443.6
59.7
44.455.6
71.4
0
20
40
60
80
100
1986 1996 2006
Males Females All
Source: UNESCO Institute for Statistics
Furthermore, only 5% of children aged 6–17 have never attended school at all. The most commonly given reason for not attending during the 2005/06 school year was the financial cost of schooling. The need for the child’s labour was the other most commonly cited factor, more often for female (39%) than for male (23%) children.
Egypt has almost achieved a full primary net enrolment rate (see Table 1). This is due to the very low drop-out rate – less than 1% – and substantial investment in this level of education. While enrolment in primary education increased considerably in most MENA countries during the period 1991–2004, enrolment rates in secondary education are far lower, especially for females (see Figure 4). There are economic, institutional and cultural reasons for the low enrolment rates in secondary education. Poverty remains a major barrier to schooling. When poor parents need to make a choice about which of their children should receive education, girls tend to be excluded first. Lack of nearby schools and the conservative nature of societies
5 www.unicef.org/infobycountry/egypt_statistics.html#46
8

in rural Upper Egypt are the main factors for the low female enrolment rates in secondary education. In rural Egypt, early marriage also constitutes a problem for women’s education, despite the face that the minimum female marriage age has been increased to 18 years (Nassar, 2008).
Table 1: Education statistics (%)
Country or territory
Pre-primary GER 2006
Primary NER 2006
Lower secondary GER 2006
Upper secondary GER 2006
Tertiary GER 2006
Adult literacy rate
2000–06
Egypt 17 96 77 88 35 71
Jordan 32 90 78 89 39 93
Tunisia Not available 98 70 85 31 77
Arab countries 18 84 54 68 22 72
Developing countries 36 85 46 60 17 79
World 41 88 53 66 25 84 GER: gross enrolment rate; NER: net enrolment rate Source: UNESCO, EFA Global Monitoring report, 2009
Figure 4: Secondary education female enrolment (%, public and private, all programmes), 2000–046
46.046.246.446.646.847.047.247.447.647.848.0
2000 2001 2002 2003 2004
Source: UNESCO Institute for Statistics
The gender gap in tertiary enrolment is often in favour of women, especially in the Gulf countries. In Egypt in 2004/05 women represented 49% of enrolments in higher education7. Furthermore, with the rising age of marriage, women have the option of either entering the labour market or continuing their education. The lower proportion of men entering universities indicates that men find it easier to access jobs and economic opportunities. However, female enrolment tends to be concentrate in the fields of study that are traditionally considered appropriate for girls (such as the arts, humanities, home economics and nursing), while their representation in natural sciences, engineering, computer sciences and medicine is relatively low.
6 For the school year 2006/07 the female enrolment rate was 48.34% (CAPMAS, Yearbook 2007). 7 Egyptian State Information Service (SIS), www.sis.gov.eg/En/Women/Society/Education/100303000000000001.htm
9

Table 2: Total number of graduates and percentage of female graduates, 1996/97–2003/04
1996/97 2003/04
Humanities Total number Female graduates (%) Total number Female
graduates (%)
Language 599 70 1,617 78
Economics and political science 261 56 593 79
Art 215 67 291 79
Literature 20,725 58 38,486 68
Information 174 68 918 76
Trade university 30,013 39 60,261 39
Law university 14,694 31 27,595 38
Technical/scientific Total number Female graduates (%) Total number Female
graduates (%)
Fine art 1,116 56 2,040 63
Dental care 392 41 1,741 52
Pharmaceutical 1,829 38 9,325 58
Medicine 3,305 35 8,150 48
Scientific 3,975 37 8,916 52
Agronomy 2,889 28 5,979 47
Veterinarian 817 25 2,622 53
Engineering 5,712 24 18,132 25Source: CAPMAS, ‘Working Men and Women’, 2007
Despite the progress made, Egypt’s gender parity index, which measures the ratio between female and male school-life expectancy rates, is less than 1, indicating a disparity in favour of males (see Figure 5)8.
8 Data on school expectancy between primary and tertiary is not available by gender. The figure is for primary to secondary.
10

Figure 5: Gender parity index for school-life expectancy (years), primary to secondary, by gender
0.75
0.80
0.85
0.90
0.95
1.00
1.05
Arab States Egypt Jordan Tunisia Central andEasternEurope
North Americaand Western
Europe
1999 2003 2006
Source: UNESCO, Institute for Statistics
2.1 Financing education
Several challenges remain in primary education in Egypt:
(i) an imbalance in the pattern of educational expenditure;
(ii) the inefficient allocation of education spending;
(iii) financial pressures resulting from the need to expand the physical infrastructure of education (Nassar, 2008).
In 1970, public expenditure on education represented 4.7% of GDP and 15.8% of total public expenditure. In the years 2007/08 and 2008/09 there was an increase of 12% of total public expenditure from the previous year. In the current year (2009/10), the state budget envisages that 10.2% of total public expenditure will be allocated to education. Looking at the distribution of the allocations for education, it is clear that the majority of funds (80%) go on wages and compensation for employees, while 10% go on the purchase of goods and services, and only 9% on investment9.
According to the 2005–2006 Egypt Household Education Survey (EHES), all households (100%) spent money on school-related expenses. The median total expenditure per household for each primary school student was EGP 357, for each preparatory school student EGP 599, and for each secondary school student EGP 950. There were no significant differences by sex in the median total expenditure.
Tutoring is a widespread phenomenon in Egypt. Private tutoring is officially prohibited and takes place outside the formal school system. In 2004/05, 41% of households spent money for a primary school student to attend private tuition, with 61% spending money on tuition for a preparatory school student and 61% for a secondary school student.
Formally, higher education in Egypt is free but, since public universities are subsidised up to 85% of their budget, students have to pay modest tuition fees. Tuition fees are very expensive in private institutions. For example, at the American University of Cairo (AUC) the tuition fees per credit, per semester for new students at undergraduate level in 2008/09 are EGP 2,494 for the first level and EGP 3,562 for international students (USD 528 and USD 754
9 Egyptian Ministry of Finance, www.mof.gov.eg/english/statistics
11

respectively)10. In order to help students to pay for tuition at private universities for undergraduate and graduate education, in 2008 the international finance corporation (IFC) launched a USD 39 million project for a loan programme. The timescale for maturity of the loans will be up to eight years, which will enable students to repay the loans from their earnings after graduation11.
3. TRANSITION FROM SCHOOL TO WORK12
The transition to the labour market for women is still influenced to varying degrees by a traditional gender paradigm, which implies that women have to comply with the central family role, and that the man is the only provider of economic means.
According to the ILO School-to-Work Transition Survey (SWTS), almost 60% of women are inactive. One explanation of this disparity between males and females is that a much higher proportion of women (47%) in the age bracket 15–29 are married, compared with men in the same age group (24%). Moreover, 60% of women who are classed as inactive have at least one child. In Egypt cultural and social norms constitute important barriers in preventing young women, especially those who are married, from working. This is particularly the case in the better-off parts of society, whereas in poor families there is a strong economic push towards employment. Indeed, the most frequent reasons for being inactive expressed by young women in the sample are: family objections (36%); childcare (32%); the workload of household chores (31%); and marriage (31%) (El-Zanaty and Associates, 2007).
Young individuals, and especially young men, tended to find a job more rapidly after leaving school in 2006 than in 1998. In 2006, 50% of males found a job within two years of leaving school, compared to thee years in 1998. Less than 25% of females found a job within eight years of leaving school.
It is important to note that youth unemployment is not a temporary situation that eventually leads to employment. Rather, it is a lengthy vicious circle in which young people move between low-quality, low-skilled and low-paid jobs. The increasing number of unemployed, highly educated young people is, among other factors, an indicator of the growing mismatch between the education system and the labour market. In the year 2006, in the age group 15–29, the number of unemployed individuals with university degrees and above reached 653,500 (313,700 women and 339,800 men). The highest unemployment rate was concentrated among young people with intermediate educational attainment (see Figure 6).
Figure 6: Unemployment estimates by educational attainment and sex
Source: LFS, CAPMAS 2006
10 http://aucadmin.aucegypt.edu/stufinance/tuition_and_fee_payment.htm 11www.ifc.org/ifcext/spiwebsite1.nsf/1ca07340e47a35cd85256efb00700cee/A1959CACF2A2E764852574500077047F12 Based on Amer, 2007.
12
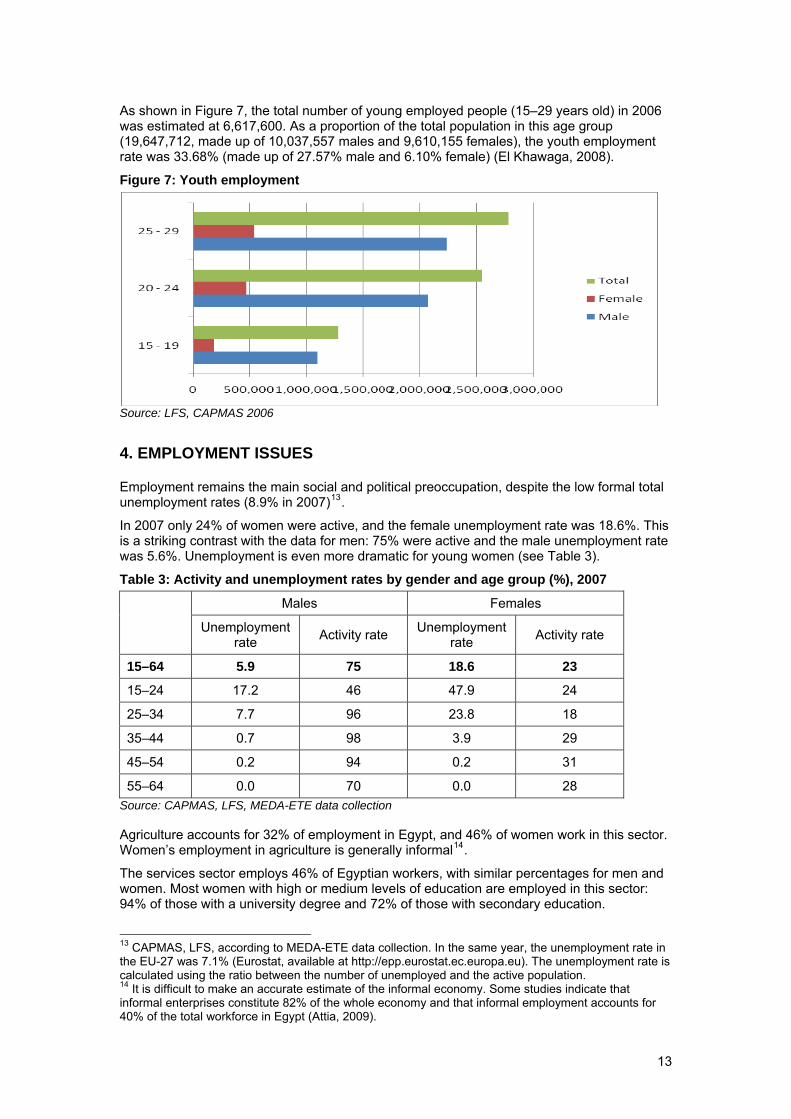
As shown in Figure 7, the total number of young employed people (15–29 years old) in 2006 was estimated at 6,617,600. As a proportion of the total population in this age group (19,647,712, made up of 10,037,557 males and 9,610,155 females), the youth employment rate was 33.68% (made up of 27.57% male and 6.10% female) (El Khawaga, 2008).
Figure 7: Youth employment
Source: LFS, CAPMAS 2006
4. EMPLOYMENT ISSUES
Employment remains the main social and political preoccupation, despite the low formal total unemployment rates (8.9% in 2007)13.
In 2007 only 24% of women were active, and the female unemployment rate was 18.6%. This is a striking contrast with the data for men: 75% were active and the male unemployment rate was 5.6%. Unemployment is even more dramatic for young women (see Table 3).
Table 3: Activity and unemployment rates by gender and age group (%), 2007
Males Females Unemployment
rate Activity rate Unemployment rate Activity rate
15–64 5.9 75 18.6 23
15–24 17.2 46 47.9 24
25–34 7.7 96 23.8 18
35–44 0.7 98 3.9 29
45–54 0.2 94 0.2 31
55–64 0.0 70 0.0 28 Source: CAPMAS, LFS, MEDA-ETE data collection
Agriculture accounts for 32% of employment in Egypt, and 46% of women work in this sector. Women’s employment in agriculture is generally informal14.
The services sector employs 46% of Egyptian workers, with similar percentages for men and women. Most women with high or medium levels of education are employed in this sector: 94% of those with a university degree and 72% of those with secondary education.
13 CAPMAS, LFS, according to MEDA-ETE data collection. In the same year, the unemployment rate in the EU-27 was 7.1% (Eurostat, available at http://epp.eurostat.ec.europa.eu). The unemployment rate is calculated using the ratio between the number of unemployed and the active population. 14 It is difficult to make an accurate estimate of the informal economy. Some studies indicate that informal enterprises constitute 82% of the whole economy and that informal employment accounts for 40% of the total workforce in Egypt (Attia, 2009).
13

Construction is a growing sector, but employs almost no women. Only 6% of women work in the industrial sector.
Women are disproportionately engaged in non-standard forms of work, such as informal, temporary or casual employment, part-time jobs or home-based work. The economic liberalisation that began in the 1970s (see Section 1.2), and particularly the reduction in the public sector, had the effect of pushing women out from their formal jobs. Informal work implies a higher level of job insecurity and an absence of social protection measures such as maternity leave and social insurance. Indeed, informality also reflects the persistence of traditional gender divisions of labour, in which women are compelled to seek forms of work that are compatible with their traditional domestic role.
In the past the government and the public sector were the main employers of women. Many MENA countries adopted privatisation and economic reform programmes that led to a shrinking of the public sector and diminished the role of government as an employer. This has resulted in a large number of women losing their jobs, and at the same time not finding appropriate alternative employment in the formal private sector. There are several factors that account for this situation, such as a private sector that operates in a challenging competitive environment, posing many obstacles for women. In these conditions, the informal sector has become a major source of employment.
However, despite lower wages, employment in the public sector is still preferred by women (40% of working women), mainly because of the availability of social security schemes and equal opportunities.
Figure 8 compares the situation of Egyptian women in terms of activity (X-axis) and unemployment rates (Y-axis) with other countries in the MEDA region and with some EU countries.
Figure 8: Female labour force participation (age 15–64) and female unemployment rates15
Egypt
Tunisia
Italy
Poland
EU-27
Jordan
Germany
Spain
France
0
5
10
15
20
25
30
0 10 20 30 40 50 60 70 80
Sources: World Bank, World Development Indicators and Eurostat (LFS) for the EU average X-axis: female labour force participation; Y-axis: female unemployment rate
Figure 8 shows that Egyptian women are in the worst position compared with other countries: labour force participation rates are the lowest, while unemployment rates are the highest. This means that very few women enter the labour market, and those who do enter are very often unemployed. It can also be concluded that high rates of unemployment may constrain female labour force participation (World Bank, 2004).
The active female population overall is better educated than the active male population (see Figure 9), especially among young people16. At the same time it is evident that one out of every three active women is not educated at all.
15 Data for Egypt and Tunisia relates to 2004, and for the other countries to 2005.
14

Figure 9: Educational level of the active population by gender (%), 2007
27.3
33.4
28.7
10.7
3.0
8.8
9.6
7.9
37.3
38.6
37.6
15.2
22.5
16.9
0% 20% 40% 60% 80% 100%
Males
Females
Total active population
No education Primary (ISCED 1) Lower secondary (ISCED 2)ISCED 3 Tertiary education (ISCED 5-6)
Source: CAPMAS, LFS, MEDA-ETE data collection
According to the 2005 UNDP Human Development Report, 35% of the population could not read or write, putting Egypt among the top ten countries in the world in terms of illiteracy. The figure was even worse for Egypt’s female population, with 45% percent of girls and women over the age of 15 being illiterate.
As shown in Figure 10, higher levels of female education do not necessarily translate into lower female unemployment. Unemployment is more concentrated among educated women, this being linked to the fact that low female unemployment rates are a result of low participation in the labour market.
Figure 10: Employment and unemployment rates for women aged 15–64 (%), by educational level, 2007
19.8
12.9
3.9
21.3
44.6
0.33.0
5.7
27.6 26.7
0
10
20
30
40
50
No education Primary (ISCED 1) Lower secondary(ISCED 2)
Upper secondary(ISCED 3) and
ISCED 4
Tertiary (ISCED 5-6)
Employment rate Unemployment rate
Source: CAPMAS, LFS, MEDA-ETE data collection
16 In 2007, 22% of the female labour force aged 15–24 and 30% of the female labour force aged 25–34 had a tertiary education diploma. For males, the percentages were 9% and 20% respectively. Source: CAPMAS, LFS, according to MEDA-ETE data collection.
15
5. WOMEN IN POLICY MAKING
Participation of women in prominent decision-making positions is limited. The number of women holding high-level jobs in public administration is low: in 2005 there were only three women with ministry-level responsibility (out of 79 ministerial positions in total), one female deputy minister (out of 14) and 1,378 women in the position of general director (out of 8,976)17. According to the IFC18, just 18% of private companies are owned by females, mainly micro enterprises. Nevertheless, the number of women in decision-making positions in the private sector has increased in recent years. This increase has been particularly visible in the media and tourism industries. The recent appointment of the first female university dean was an important step: Dr Hend Hanafi was elected the new president of Alexandria University.
In 2003 President Mubārak, for the first time in Egypt's history, appointed a female judge to the Supreme Constitutional Court19, and two other women became members of the panel of Commissioners of the same institution.
In the political sphere, only four women have been elected to the People’s Assembly (454 members). In 2005 President Mubārak added five more using his constitutional power. Thirteen women are members of the Shura Council20 and 774 women were elected in 2002 to local government councils21. The percentage of seats held by women in local councils was 1.8% in 200222.
Improvements are apparent in the area of female participation in public life: on 11 June 2009 the Shura Council unanimously approved an increase in the number of seats allocated to women in parliament to 64. As a result of this new bill, the number of elected lawmakers will increase from 444 to 508, thus not changing the original number of men in parliament, in addition to the 10 members appointed by the president of the Republic.
Figure 11 summarises this socioeconomic information, comparing conditions for women in Egypt with those in other countries in the region (i.e. Tunisia and Jordan). Life expectancy at birth is similar in the three countries, but Egypt scores significantly worse in education, literacy and employment indicators. The three countries share a common religion and culture, but differ strongly on GDP per capita and fertility rates.
17 CAPMAS, Yearbook 2007. 18www.ifc.org/ifcext/gempepmena.nsf/AttachmentsByTitle/EpyptGEMCountryBrief2007/$FILE/Egyptfinalgemmarch6.pdf 19 The Court is the highest judicial power in Egypt. It has judicial control in respect of the constitutionality of the laws and regulations and undertakes the interpretation of legislative texts in the manner prescribed by law. 20 The Shura Council (in Arabic, Majilis Al-Shura ) is the upper house of the Egyptian bicameral parliament. The lower house of parliament is the People's Assembly. The Council is composed of 264 members, of which 174 are directly elected and 88 are appointed by the president of the Republic for six-year terms. 21 UNDP-POGAR. 22 CAPMAS, Yearbook 2007. This is an average of 3.5% female membership in governorates, 4.5% in Marakez (a group of villages with one or more cities), 2.9% in cities, 5.2% in districts and only 1.3% in villages.
16

Figure 11: Empowerment of females in Egypt, Jordan and Tunisia
020406080
100GDP per capita
Life expectancy at bith (females)
Fertility rate
Young literacy ratio(females/males)
Ratio girls/boys in primary andsecondary
School enrolment tertiary(females/males)
Employment rate (females)
EG JO TU
Sources: World Bank, World Development Indicators database, and CAPMAS, LFS, according to MEDA-ETE data collection23
6. THE TOURISM SECTOR
Tourism is one of the main contributors to the Egyptian economy. The sector is a major generator of income and foreign exchange earnings, as well as a main provider of job opportunities. Tourism also exerts indirect economic impacts on other sectors supplying goods and services for tourist entities and activities, such as agriculture, fisheries, manufacturing and construction.
According to the annual report of the State Information Service, in 2007 the sector contributed 11.3% to national GDP, 40% of non-commodity exports and 19.3% to the income of foreign currencies24.
The travel and tourism sector employs 13.7% of the Egyptian workforce, i.e. it accounts for one in every 7.3 jobs. Direct employment alone was estimated to account for 2.8 million jobs in 2007. According to Ministry of Tourism sources, a hotel room generates between five and seven new jobs during its construction. When a hotel room is functioning, it produces between 1.5 and two new employment opportunities25.
23 Data are presented as percentage of the highest value of the three reference countries. The reference year varies from indicator to indicator and from country to country, from 2005 (literacy for Egypt and Jordan) to 2007 (GDP per capita). 24 www.sis.gov.eg/En/Tourism/Introduction/060100000000000001.htm
25 Ministry of Tourism sources and AmCham, BSAC 2008, p. 10.
17

Figure 12: Development in the number of tourism companies in Egypt
1,083 1,191 1,334 1,409 1,524
0
500
1,000
1,500
2,000
2004 2005 2006 2007 2008
Source: Egyptian Tourism Federation
6.1 Subsectors and definitions
According to the Ministry of Tourism, the tourism sector is divided into hotels and tourism companies. Each of these two categories is organised by an association. The Egyptian Tourism Federation organises the tourism sector; the Egyptian Hotels Association organises the hotels sector.
The General Authority for Investment and Free Zones (GAFI)26 has a different categorisation which is wider than the categories provided by law. GAFI classification increases the total number in the tourism sector to 4,857 companies, as illustrated in Table 4.
Table 4: Number of companies per category in the tourism sector
Category Number of companies established between Jan. 1970 and Dec. 2008
Hotels, tourist villages and resorts 2,582
Tourism development 364
Tourism transportation 777
Tourism management 374
Recreation 211
Others in tourism 450
Diving centres 99
Total 4,857 Source: GAFI
According to the Egyptian Federation for Tourism the number of companies with more than 25 employees is 155 (10.2% of the total), while 305 have 15 employees or more (20%). This indicates that most companies are very small.
6.2 Women in the tourism sector
According to CAPMAS data, in 2006 the proportion of female personnel in hotel and restaurant employment as a whole was 4.1%. Some sources cite different percentages as a result of inaccurate reporting and the failure to record casual jobs that are often carried out by women, as well as marginal forms of employment in small family restaurants and unclassified hotels.
26 The General Authority for Investment and Free Zones (GAFI) was created by the Investment Law No 8/1997. GAFI is Egypt's ‘one-stop shop’ for investment, easing the way for investors to have their proposed projects approved. GAFI represents the most tangible step undertaken by the Egyptian government to streamline investment procedures.
18

The degree of occupational segregation by gender is quite apparent in the tourism labour market. Most women are confined to low-level jobs, and are often dedicated to traditional professions or support functions. According to CAPMAS Hotels Statistics (2002/03), technical services jobs accounted for 15% of total male employment compared with only 4% in the case of women. However, for general services and assistant jobs, the share of male employment was 48% compared to 60% for females.
The distribution of female employment in the hotel industry by educational level indicates that almost 25% of women employees hold a university degree.
Educational level does not only affect the occupational structure of female employment, but also has a strong influence on the rates of mobility and entry into the labour market. Young women with high levels of education experience less difficulty in accessing the labour market. Data on the tourism business demonstrate that over 50% of female personnel are employed in five-star hotels; another 30% work in four- and three-star establishments. These figures show that within the hospitality sector, the three- to five-star hotels are the main providers of jobs for women who have relatively high educational qualifications. But this does not preclude the fact that hotel jobs occupied by women follow the ‘gender pyramid’ found in other sectors. In fact, women tend to be in occupations with low career-development prospects, while managerial positions are male-dominated.
With respect to remuneration, there is no notable gender wage differential for the same occupation in the formal hotel business. The Labour Code does not permit gender discrimination in remuneration (Article 35). However, in practice men often manage to earn extra income by working longer hours and night shifts, in addition to performing multi-skilled functions that enable them to gain bonuses and tips.
Finally, the regional distribution of female employment indicates a preference for hotel jobs in Cairo, Giza and Alexandria. Around 60% of female workers are employed in accommodation facilities in these cities. Another 20% work in the four main tourist destinations outside Greater Cairo, namely Luxor, Aswan, South Sinai and Red Sea areas (mainly Sharm El-Sheikh and Hurghada).
6.3 Education and training in tourism
There are no recent data on the enrolment of students in university faculties on courses linked to tourism. In 2002 the estimated number was 9,000.
There are only approximately 2,000 tourism and hotel graduates every year. Of this number, 600 go into the tour guide business, 800 into tourism services and 600 into hotel management (Rady, 2002).
There are many technical institutes that offer tourism-related courses, such as tourism studies, hotel management and tour guide courses. There are two different types of institutes. The first accepts students who finish secondary school, and has a study period of four years. The number of students studying tourism-related courses is estimated at over 17,000. The second category of technical institutes is similar to the first, except that the study period is two years. The number of students enrolled in this type of school is estimated at around 4,000. Between 400 and 800 students graduate from vocational schools every year.
7. THE ICT SECTOR
ICT opens potential new areas of employment for women. The government has invested heavily in the development of the ICT sector as a means of increasing the country’s competitiveness and attracting foreign direct investment (FDI). As a result, the number of ICT companies had increased to 2,100 by January 2007, almost four times the number of companies that existed in 2000.
Governance is provided by the Ministry of Communications and Information Technology (MCIT), which is also responsible for the preparation and implementation of the ICT Strategy 2007–2010. The government is supported in these tasks by an operational agency, the Information Technology Industry Development Agency (ITIDA), which is responsible for
19

enhancing and developing Egypt’s position as a leading global outsourcing location by attracting FDI to the industry and maximising exports of ICT services and applications.
According to ITIDA, the ICT sector encompasses:
software development
IT services (including call centres)
IT applications
telecommunications
hardware, computers and equipment.
The number of employees in the ICT sector had increased to 162,500 by the end of 2007, compared with 147,800 at the end of 2006, with an annual growth rate of 9%. The following figures demonstrate the rise in the number of companies working in the ICT sector (Figure 13) and in employment in this sector (Figure 14).
Figure 13: Number of companies in the ICT sector
266
1,1331,374
1,570 1,666
0200400600800
1,0001,2001,4001,6001,800
1999 2003 2004 2005 2006
Source: Egyptian Ministry of Communications and Information Technology
Figure 14: Employment in the ICT sector
Source: ITIDA
Egypt produces over 25,000 college graduates per year, with between 10,000 and 12,000 of these in the ICT field. A recent study commissioned by Cisco highlighted the networking skills gap that will hit the region in the coming years. It is still estimated that in 2009 the Middle East and Pakistan will have a shortage of 64,200 people with advanced IT skills, or 40.9% of the demand. Egypt alone will have a shortage of 9,700 IT professionals, or 37.1% of the demand. When networking skills are included, the gap is even greater (AmCham, 2005).
20

MCIT has initiated a number of training programmes to familiarise graduates with the use of computers, which would then help them to obtain better jobs. Egypt has put ICT training at the top of its agenda by including it in its National Plan, and the government has developed training programmes and formed partnerships with training institutes to invest and enhance ICT skills and capabilities.
University-level training is available in disciplines such as computer science, engineering and other ICT-related majors. Enrolment and graduation rates have been increasing since these programmes were launched in 1997.
It is possible to gain an overview by studying the statistics for higher and postgraduate ICT education and the ICT professional environment in which women work. The following description is based on factual statistics for a number of universities and some public and private ICT organisations (Ministry of Communications and Information Technology, 2005).
In the year 2008 the number of female graduates exceeded the number of male graduates in some universities, such as Alexandria and the Suez Canal. The proportion of female engineering graduates ranged from a substantial 44% to 49% of the total number of engineering graduates.
In southern Egypt the development of the employment market and equal opportunities resulted in the proportion of university female graduates reaching a satisfactory 38–44%, of which approximately 25% were engineering graduates. It is estimated that 30% of the total number of female university students belong to ICT faculties. It appears that the rate of female enrolment in university ICT departments is generally increasing, especially at Minufiya University, where the induction rate increased from 17% percent in 1998/99 to 25% in 2003/04.
The number of female students enrolling in postgraduate programmes at Cairo and Alexandria Universities has increased dramatically. The number of women obtaining Master of Science qualifications in the ICT field from Cairo University increased from 16% of the total number in 1998/99 to 18% in 2002/03. These figures are close to those for women enrolled in Master of Arts programmes, and show an encouraging continuing commitment towards postgraduate ICT studies, despite the social obstacles that women have traditionally faced.
Within the framework of the MCIT’s National Plan, the National Telecommunication Institute have held courses in telecommunications, specialised IT and basic IT skills. In March 2005 the total number of trainees in basic IT skills development was 101,669, while in specialised training the number was 21,834.
8. FINDINGS
A great deal of research has already been carried out at the macro level on female participation in education and training. However, there has been limited research at sector level, particularly in the areas of tourism and ICT. Furthermore, very few surveys have been conducted at company level to study the phenomenon.
Careful policy analysis should be conducted to better understand and target incentives and active policy measures to promote equal access to education and productive resources, and to facilitate the reconciliation of work and family life for women.
21

BIBLIOGRAPHY
Abou Zeid, G., ‘Women's access to the decision-making process across the Arab nation’, in Dahlerup, D. (ed.), Women, quotas and politics, Stockholm University, Routledge, 2006.
AmCham, Information and Communications Technology Developments in Egypt, May 2005.
Amer, M., Transition from education to work, ETF, 2007, available at www.etf.europa.eu/pubmgmt.nsf/(getAttachment)/7E3A1431CD4699AEC125744E004AF5DA/$File/NOTE7ESHZN.pdf
Assaad, R. and Arntz, M., ‘Constrained geographical mobility and gendered labor market outcomes under structural adjustment: Evidence from Egypt’, World Development, Vol. 33, No 3, 2005, pp. 431–54.
Attia, S.M., ‘The informal economy as an engine for poverty reduction and development in Egypt’, Munich Personal RePEc Archive, 27 January 2009.
CAPMAS, Final results of 2006 census, available at www.capmas.gov.eg
CAPMAS, ‘Working men and women’, 2007.
2005–2006 Egypt Household Education Survey (EHES), available at www.equip123.net/docs/e2-EgyptERPEducationReportEN.pdf
El-Deeb, B., ‘Population, labor and GDP growth rate gaps in Egypt’, Cairo University, February 2008.
El-Hamidi, F. and Said, M., ‘Have economic reforms paid off? Gender occupational inequality in the new millennium in Egypt’, Working paper No 128, The Egyptian Center for Economic Studies (ECES), February 2008, available at http://www.eces.org.eg/Uploaded_Files/%7B8F382378-12DB-497B-A4B9-2F49CE63FB9D%7D_ECESWP128e.pdf
El-Komsan, N., ‘Women between Islamic Shari’a and personal status law’, The Egyptian Center for Women’s Rights, Cairo, 2005, available at www.wluml.org/english/news/ecwr-women-personal-status-laws.pdf
El-Mahdi, A., ‘The changing economic environment and the development of the micro and small enterprises in Egypt 2006’, Economic Research Forum paper, 2006.
El-Mahdi, A., ‘Analysis of the economic situation of women in Egypt’, Euromed role of women in economic life programme, 2006, available at http://www.roleofwomenineconomiclife.net/downloads/Egypt-EconomicsituationanalysisE.pdf
El-Mowla S. Somaya Ahmed Mowla, ‘SME, youth unemployment and the investment climate in Egypt’, Cairo University, April 2008.
El-Zanaty and Associates, ‘School-to-work transition: Evidence from Egypt’, ILO-UNFPA, 2007.
ETF, Egypt country analysis, 2005, available at www.etf.europa.eu
ETF, The contribution of human resources development to migration policy in Egypt, 2007, available at www.etf.europa.eu
Femise Network, ‘Egypt country profile – The road ahead for Egypt’, Cairo 2004, available at www.femise.org/PDF/cp/cp-egy-0412.pdf
Ghoneim, A.F. and Mandour, D.A., ‘Egypt as a knowledge-based economy, with special emphasis on the role of youth’, Cairo University, 2008.
Hala, H., Abf Al-Ghaffar, S. and Amre Hashem, R., ‘Building democracy in Egypt’, IDEA, 2005.
22

Hamdy, A., ‘ICT in education in Egypt’, June 2007, www.infodev.org
ILO, ‘Gender education and child labour in Egypt’, 2004, available at www.ilo.org/ipecinfo/product/viewProduct.do?productId=343
ILO, ‘Skills for improved productivity, employment growth and development’, 2008, available at www.ilo.org/public/english/employment/skills/download/ilcreport.pdf
ILO, ‘Global employment trends’, January 2009, available at www.ilo.org/wcmsp5/groups/public/---dgreports/---dcomm/documents/publication/wcms_101461.pdf
Kattara, H., ‘Career challenges for female managers in Egyptian hotels’, International Journal of Contemporary Hospitality Management, Vol. 17, No 3, 2005, pp. 238–51.
Keppel, G., La Yihad: expansión y declive del islamismo, Península, Barcelona, 2000, pp. 116–18. Original (in French): Jihad: Expansion et déclin de l’islamisme, Gallimard, Paris, 2000.
Laframboise, N., Egypt on the move, IMF Survey, 21 August 2006, available at http://www.imf.org/EXTERNAL/PUBS/FT/SURVEY/2006/082106.pdf
Ministry of Communications and Information Technology, Egypt's information society, fourth edition, Cairo, 2005.
Ministry of Communications and Information Technology, ‘The future of the Internet economy in Egypt’, Statistical profile, Cairo, May 2008.
Nassar, H., ‘Socioeconomic conditions of work in greater Cairo – Gender differential and formal informal differences’, Social Research Center, The American University in Cairo, 1999.
Nassar, H., ‘Employment prospects for females in education in Egypt, with special emphasis on technical education’, Social Research Center, The American University in Cairo, 2002.
Nassar , H., ‘Summary of existing knowledge on micro and small enterprises’, Center for Economic and Financial Research and Studies, Faculty of Economics and Political Science, Cairo University, 2002.
Nassar,H., ‘Documentation on small and medium enterprises’, Euro Arab School of Management, Granada, 2005.
Nassar H., ‘Gender and work in the MENA region’, Presentation, Turin, August 2008.
Nassar, H. and El-Mowla, S., ‘Competitiveness of Egyptian human resources’, Conference on Egyptian competitiveness revisited: A sectoral view, Center for Economic and Financial Research and Studies, Faculty of Economics and Political Science, Cairo University, 2004.
Rady, A., ‘Tourism and sustainable development in Egypt’, 19 March 2002, www.planbleu.org/publications/livreblanc_egy.pdf
Salehi-Isfahani, D. (ed.), Labor and human capital in the Middle East, studies of markets and household behavior, Garner Publishing Limited, 2001.
Shono, S. and Smith, S., ‘MENA women’s transition from school to work’ (unpublished), Paper for the Rabat conference on Youth in the Middle East and North Africa’, 4-6 December 2006, http://publications.ksu.edu.sa/Conferences/Rabat%20Conference/Article036.pdf
Ubaru, M., Joint ECA-ITU-Issues Paper on the impact of ICTs on employment and poverty alleviation in Africa (Opportunities and challenges), 2008, www.uneca.org
UN, World population prospects, 2008, available at http://esa.un.org/unpp/p2k0data.asp
UNDP, ‘Egypt human development report 2005’, available at http://planipolis.iiep.unesco.org/upload/Egypt/Egypt_HDR%202005_en.pdf
UNDP, ‘Gender empowerment measure’, Human development report 2007/2008, UNDP, 2007, pp. 330-33, available at http://hdrstats.undp.org/indicators/280.html
23

UNDP, ‘Egypt human development report 2008’, available at www.undp.org.eg/Portals/0/2008%20Egypt%20Human%20Development%20Report%20Complete.pdf
UNDP-POGAR, ‘Gender and citizenship’, http://gender.pogar.org/countries/stats.asp?cid=5
UNESCO, EFA global monitoring report, 2008.
UNICEF, ‘Transforming policy and practice for gender in education’, November 2008, available at www.ungei.org/resources/files/Transforming_Policy_and_Practice_for_Gender_in_Education_120908.pdf
World Bank, World Development Indicators database.
World Bank, MENA development report – Gender and development in the Middle East and North Africa, 2004, available at http://siteresources.worldbank.org/INTMENA/Resources/2004GenderPresentation1.pdf
World Bank, ‘Egypt country brief’, 2008, available at http://siteresources.worldbank.org/INTEGYPT/Resources/EGYPT-ENG2008AM.pdf
World Economic Forum, ’Women’s empowerment: Measuring the global gender gap’, 2005, available at www.weforum.org/pdf/Global_Competitiveness_Reports/Reports/gender_gap.pdf
World Education Forum, Dakar, 26-28 April 2000, available at www.unesco.org/education/efa/ed_for_all/dakfram_eng.shtml
24