CASE STUDY NORTH NETHERLANDS (NL)
64
Contract No. 2008.CE.16.0.AT.020 concerning the ex post evaluation of cohesion policy programmes 2000‐2006 co‐financed by the European Regional Development Fund (Objectives 1 and 2) Work Package 4 “Structural Change and Globalisation” CASE STUDY NORTH NETHERLANDS (NL) Prepared by: Christien Enzing and Hanneke Bodewes (Technopolis group) for: European Commission, Directorate General Regional Policy Policy Development Evaluation Unit CSIL, Centre for Industrial Studies, Milan, Italy Joanneum Research, Graz, Austria Technopolis Group, Brussels, Belgium In association with Nordregio, the Nordic Centre for Spatial Development, Stockholm, Sweden KITE, Centre for Knowledge, Innovation, Technology and Enterprise, Newcastle, UK
-
Upload
vuongxuyen -
Category
Documents
-
view
215 -
download
1
Transcript of CASE STUDY NORTH NETHERLANDS (NL)

Contract No. 2008.CE.16.0.AT.020 concerning the ex post evaluation of cohesion policy programmes 2000‐2006 co‐financed by the European
Regional Development Fund (Objectives 1 and 2)
Work Package 4 “Structural Change and Globalisation”
CASE STUDY
NORTH NETHERLANDS (NL)
Prepared by: Christien Enzing and Hanneke Bodewes (Technopolis group)
for: European Commission,
Directorate General Regional Policy Policy Development Evaluation Unit
CSIL, Centre for Industrial Studies, Milan, Italy Joanneum Research, Graz, Austria Technopolis Group, Brussels, Belgium In association with Nordregio, the Nordic Centre for Spatial Development, Stockholm, Sweden KITE, Centre for Knowledge, Innovation, Technology and Enterprise, Newcastle, UK

Case Study ‐ North Netherlands (NL)
II
Acronyms
BC Board Committees
CBS Dutch National Bureau for Statistics (Centraal Bureau voor de Statistiek)
DG REGIO Directorate General for Regional Policy
EC European Commission
EDI Energy Delta Institute
ERDF European Regional Development Fund
ESF European Social Fund
EU European Union
EV Energy Valley
GDP Gross Domestic Product
GVA Grosse value Added
FTE Full time equivalent
HBO Higher vocational education (Hoger Beroeps Onderwijs)
HRM Human Resource Management
IAG Innovative Actions Programme for Groningen (Innovatief Actieprogramma Groningen)
ICT Information and Communication Technology
IPR Investment project scheme (Investeringspremieregeling)
ISP Integrated Structure Plan (Integraal Structuur Plan)
KITS Small‐scale investment in the tourism sector (Kleine investeringen in de touristische sector)
NIOF Northern Innovative Support Facility
NOM North‐Netherlands Development Agency (Noord‐Nederlandse Ontwikkelingsmaatschappij)
PBC Project Assessment Committee (Projectbeoordelingscommissie)
PPS Purchasing Power Standard
RTDI Research Technological Development and Innovation
R&D Research and Development
SME Small and Medium Enterprise
SNN Northern Netherlands Provinces (Samenwerkingsverband Noord‐Nederland )
SPD Single Programming Document
TCNN North‐Netherlands Technology Centre (Technologisch Centrum Noord‐Nederland)
TOR Terms of Reference
WP Work Package

Work Package 4: “Structural Change and Globalisation”
III
Table of contents
Executive summary 1
Introduction 7
1. Structural change and globalisation in perspective 9
1.1 The region at glance 9
1.2 Searching the roots of change: socio‐economic history of the region 17
1.3 Key research question and central hypothesis 20
1.4 Regional structural change and globalisation issues in 2000‐2006 21
1.4.1 Innovation potential 21
1.4.2 Human Resources 24
1.4.3 Understanding the geography of structural change 25
2. Regional policy 2000‐2006: strategy and objectives 29
2.1 Regional policy mix for structural change and globalisation 29
2.2 Overall strategy of the 2000‐2006 Objective 2 programme 31
2.3 Selected fields of intervention and measures 34
2.3.1 Selection logic 34
2.3.2 Detailed description of the relevant measures 38
3. Effects of the selected ERDF measures on the process of structural change and adaptation to globalisation 41
3.1 Assessment of the structural and socio‐economic effects 41
3.1.1 Performance of selected measures 41
3.1.2 Performance of specific schemes 42
3.1.3 Contribution of selected projects to structural change and globalisation 46
3.1.4 Conclusions 49
3.2 Assessment of the effects on institutional capacity and policy learning 50
4. Conclusions: key findings and main message 53
5. Annexes 57
5.1 References 57
5.2 List of persons interviewed 58
Case Study ‐ North Netherlands (NL)
IV
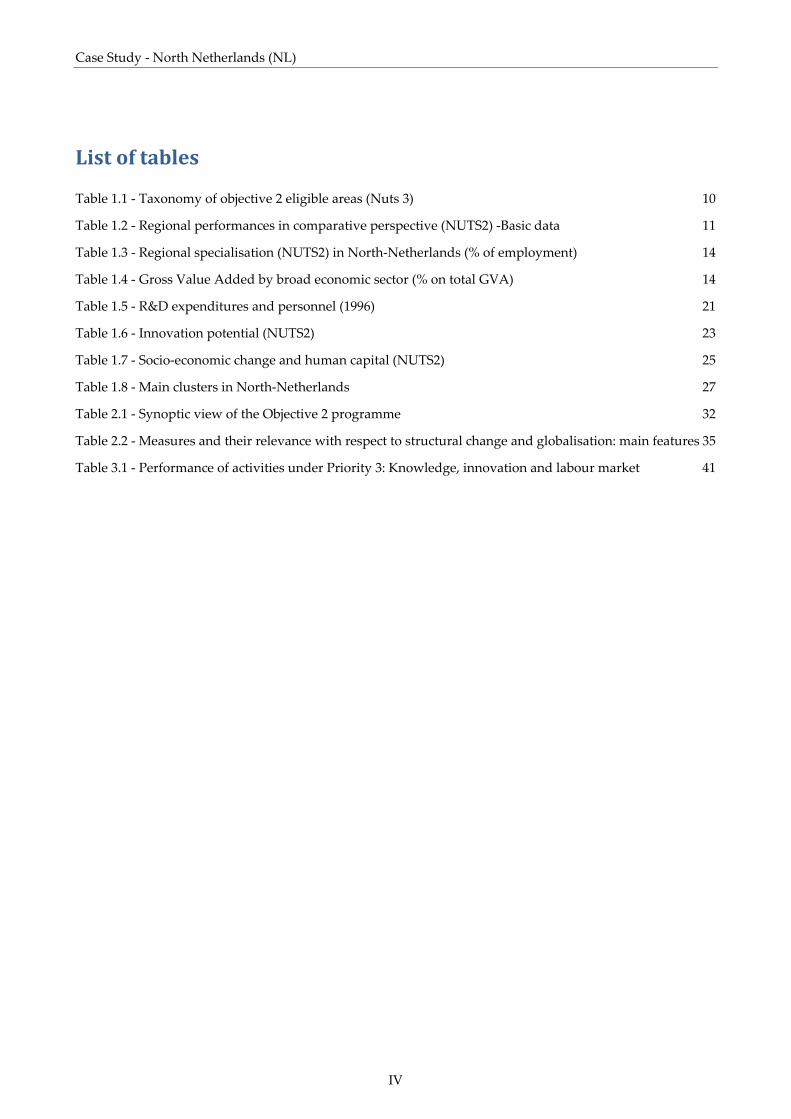
List of tables
Table 1.1 ‐ Taxonomy of objective 2 eligible areas (Nuts 3) 10
Table 1.2 ‐ Regional performances in comparative perspective (NUTS2) ‐Basic data 11
Table 1.3 ‐ Regional specialisation (NUTS2) in North‐Netherlands (% of employment) 14
Table 1.4 ‐ Gross Value Added by broad economic sector (% on total GVA) 14
Table 1.5 ‐ R&D expenditures and personnel (1996) 21
Table 1.6 ‐ Innovation potential (NUTS2) 23
Table 1.7 ‐ Socio‐economic change and human capital (NUTS2) 25
Table 1.8 ‐ Main clusters in North‐Netherlands 27
Table 2.1 ‐ Synoptic view of the Objective 2 programme 32
Table 2.2 ‐ Measures and their relevance with respect to structural change and globalisation: main features 35
Table 3.1 ‐ Performance of activities under Priority 3: Knowledge, innovation and labour market 41

Work Package 4: “Structural Change and Globalisation”
V
List of figures
Figure 1.1 ‐ Map of The Netherlands, North‐Netherlands and of the three provinces 9
Figure 1.2 ‐ Map of the Objective 1 and 2 regions in the Netherlands; including three NN‐provinces 12

Case Study ‐ North Netherlands (NL)
VI
Work Package 4: “Structural Change and Globalisation”
1
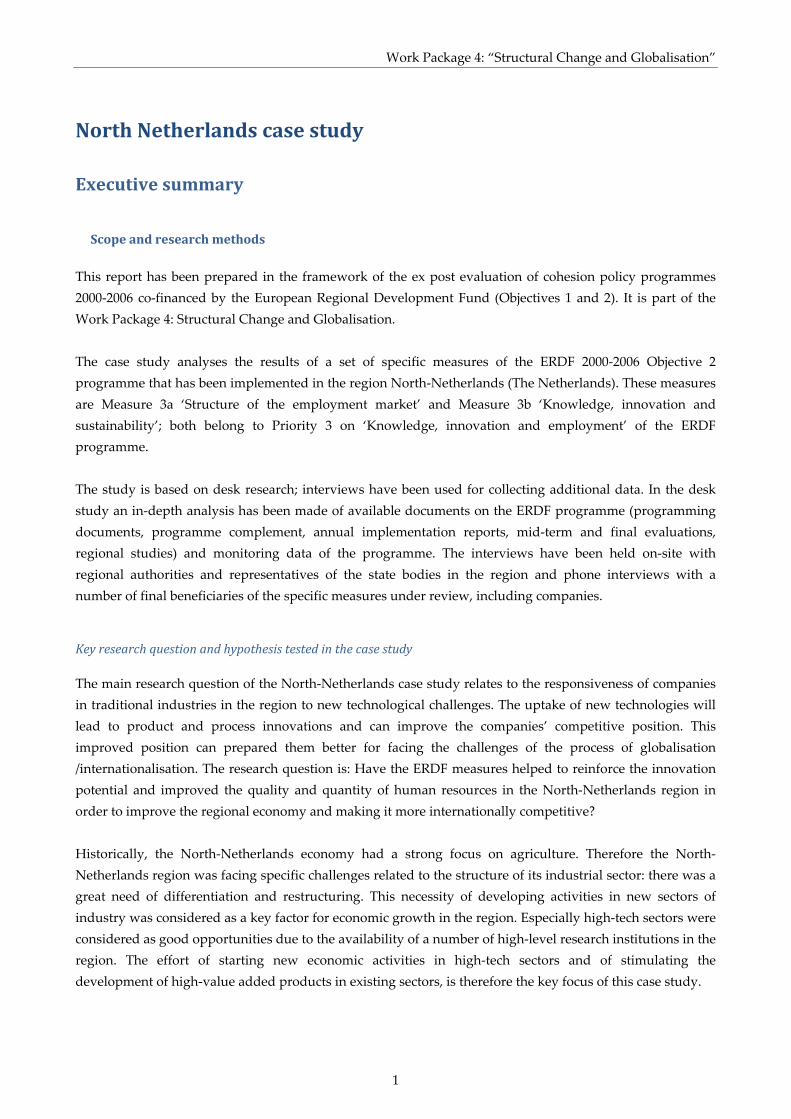
North Netherlands case study
Executive summary
Scope and research methods
This report has been prepared in the framework of the ex post evaluation of cohesion policy programmes 2000‐2006 co‐financed by the European Regional Development Fund (Objectives 1 and 2). It is part of the Work Package 4: Structural Change and Globalisation. The case study analyses the results of a set of specific measures of the ERDF 2000‐2006 Objective 2 programme that has been implemented in the region North‐Netherlands (The Netherlands). These measures are Measure 3a ‘Structure of the employment market’ and Measure 3b ‘Knowledge, innovation and sustainability’; both belong to Priority 3 on ‘Knowledge, innovation and employment’ of the ERDF programme. The study is based on desk research; interviews have been used for collecting additional data. In the desk study an in‐depth analysis has been made of available documents on the ERDF programme (programming documents, programme complement, annual implementation reports, mid‐term and final evaluations, regional studies) and monitoring data of the programme. The interviews have been held on‐site with regional authorities and representatives of the state bodies in the region and phone interviews with a number of final beneficiaries of the specific measures under review, including companies.
Key research question and hypothesis tested in the case study
The main research question of the North‐Netherlands case study relates to the responsiveness of companies in traditional industries in the region to new technological challenges. The uptake of new technologies will lead to product and process innovations and can improve the companies’ competitive position. This improved position can prepared them better for facing the challenges of the process of globalisation /internationalisation. The research question is: Have the ERDF measures helped to reinforce the innovation potential and improved the quality and quantity of human resources in the North‐Netherlands region in order to improve the regional economy and making it more internationally competitive? Historically, the North‐Netherlands economy had a strong focus on agriculture. Therefore the North‐Netherlands region was facing specific challenges related to the structure of its industrial sector: there was a great need of differentiation and restructuring. This necessity of developing activities in new sectors of industry was considered as a key factor for economic growth in the region. Especially high‐tech sectors were considered as good opportunities due to the availability of a number of high‐level research institutions in the region. The effort of starting new economic activities in high‐tech sectors and of stimulating the development of high‐value added products in existing sectors, is therefore the key focus of this case study.
Case Study ‐ North Netherlands (NL)
2
A crucial factor for the successful development of high‐tech industries in the region and for making existing regional industries more innovative, is the quality and quantity of human resources. For that reason it is highly relevant to evaluate to what extend the measures focusing on innovation (also in relation to human resources) supported by ERDF in the period 2000‐2006 have been able to contribute to structural changes in the region and also enabled the region to adapt to the process of globalisation. For the evaluation of the regional socio‐economic structural changes in the North‐Netherlands region during the period 2000‐2006, the role of innovation (and related human resources) and the increase in the absorptive capacity of the industrial sector will be the main focus of the study. This suits also best the specific challenges of the region as the region was facing a mismatch between the low level of innovativeness and of the qualification of the local workforce on the one hand and the needs of regional companies on the other hand. The main hypothesis that is tested in the study is: The innovation system of Objective 2 regions may suffer from missing innovation drivers on the demand side. Barriers to innovation are determined by a lack of absorptive capacity by local firms and path‐dependency from existing technological trajectories.
Regional context and key findings
The long‐term economic growth of the North‐Netherlands region has continuously lagged behind the growth in the rest of the country. The contribution of the North‐Netherlands to the gross national product (GDP) is relatively small. It belongs to the least productive regions in terms of contribution to national GDP. This is because of the relative small size of the North‐Netherlands region, but also of the low level of activities of the business sector. However, the downward trend that has dominated growth figures for decades seems to have been reversed since the end of the 1990s: the broad macro‐economic indicators have improved since then. The structure of the labour market in the North‐Netherlands region shows some marked differences with the rest of the country. Although the service sector is now the largest and fastest growing sector, the shares of agriculture, manufacturing and construction are still considerable and above those for the Netherlands as a whole. For that reason there was a need for the North‐Netherlands region to chance its economic structure and add new types of activities. Here innovation could play an important role. However, high‐tech/high‐value added activities were rather uncommon in the region and ‐ although the presence of research institutes can be considered as an important strength for building such high‐tech activities ‐, other factors such as the relatively low education level in the region and the fact that some high‐tech sectors such as biotechnology take relatively long investments times, made it a challenging task to invest in new innovative activities. Overall, the region’s innovation potential was rather low. Measured in terms of R&D intensity, this was about 6% in 1996, while the figure for the Netherlands was 10%. This low figure can be explained by the composition of the unilaterally economic sector structure of the North‐Netherlands region, which is characterised by its traditional and slow growth character. Also the indicators concerning human resources illustrated the region’s backlog.
Work Package 4: “Structural Change and Globalisation”
3
From the 1950s, regional policy in the Netherlands focuses also on the North‐Netherlands region. The regional infrastructure has benefited from these regional policy initiatives. The funds that were spent through the regional programmes had a positive impact on the regional economy. However, in spite of all regional policy measures, the regional disparities did not disappear. In 1997 it has been calculated that 43,000 additional jobs need to be created in order to make the employment rate (jobs per 1,000 inhabitants in the age group 15‐64) in the three Northern provinces equal to the national average. Partly due to measures such as those financed by ERDF programme, there has been a substantial increase in the number of jobs in the North‐Netherlands region during the last decade. The growth rate of employment has even been slightly higher in the Northern Netherlands provinces than in the rest of the country but still not enough to close the gap.
Impact of the ERDF programme on innovation potential and human resources
The primary focus of the case study is on Measures 3a and 3b. Their goals are to shape a sustainable and innovative industrial climate that is focused on knowledge and technological development in order to improve the economic structure in North‐Netherlands in a sustainable manner (Measure 3a) and to improve the working of the labour market by enhancing human resources management in companies, bring supply and demand together in an innovative way, increase the number of students in vocational training and raise the knowledge level of employees (Measure 3b). In addition, two schemes (Northern Innovative Support Facilities ‐ NIOF, Investment Project Scheme ‐ IPR) and a set of projects in a specific field where the region’s specialisation was focused on (energy) have been included in the analysis. Our analysis of the two measures, the two schemes and the set of energy projects ‐ all dealing with innovation and human resources – shows that the ERDF programme for the specific issues dealt with in the research question, has been successful. We conclude this because more than the targeted number of SMEs has been participating in innovation projects. This illustrates also there is sufficient absorptive capacity as these companies have been able writing successful project proposals which asks some minimum level of knowledge of the subject. Moreover, it can also be concluded that the absorptive capacity has been increased through these measures, schemes and projects. Also the participation grade of SMEs in human resource projects and the cooperative projects between companies and education centres was far above expectations. Possible existing barriers related to unqualified personnel have decreased as through the cooperative projects of companies with education centres, human resources have been upgraded. With respect to the specific barrier of path‐dependency (which would imply that companies keep to the traditional trajectories they are accustomed to follow) it can be observed for the energy field that new trajectories have been developed and been used. Projects on alternative energy sources, such as biomass and wind energy have been initiated. It can be concluded that the decision of regional authorities to select energy as a key area for growth for the North‐Netherlands has worked well. The focus on energy in the North‐Netherlands economic policy proved to be rather successful and has led to a relative strong increase in employment in the region. ERDF funds have been directly contributed to the formation and growth of the North‐Netherlands energy cluster, and indirectly contributed to the upgrading and extension of the physical (logistics, transport, ports) and knowledge infrastructures (innovation, training). These are activities companies are not intended to invest in.
Case Study ‐ North Netherlands (NL)
4
It was concluded that the IPR scheme is an important measure to strengthen the economic structure in the North‐Netherlands. The number of jobs created by IPR is substantial. Since only companies from ‘driving’ industries could apply (these are industries with over 50% of their turnover realized outside of North‐Netherlands), the scheme also strengthened the international competitiveness of these companies. Due to the very limited data on the outcomes and results of the NIOF scheme, no conclusions on the impact of this scheme on the regional innovation potential could be drawn. Our overall conclusion – thereby answering the main research question of the study – is the following: ERDF measures have been helpful in reinforcing the innovation potential and improving the quality and quantity of human resources in the North‐Netherlands region. It can be expected that in the mid‐ and long‐term positive effects of the improved innovation potential and improved human resources on the regional economy and more specific its international competitive position are to be expected. As innovation trajectories by definition can be very unsteady and the innovation’s contribution towards better economic performance of the region depends also on factors that often cannot be foreseen, we have set our conclusions in cautious terms. Moreover, what should be kept in mind is that many of the processes promoted through the ERDF measures (such as the reduction of the regional dependence on traditional industries, the shift in the structure of economic activity, the growth in innovative activities, etc.) are long‐term processes. For that reason they require a long time period to have a full effect that also can be measured. Our investigations provide also evidence on the basis of which we must reject the hypothesis. We conclude that absorptive capacity was available in the region and also that new trajectories (such as alternative energy) have been launched. The region has reacted well to the challenges posed by the new regional policies that focus in innovation and create new challenges for the region.
Main message with respect to structural change and globalisation
The subjects of structural change and globalisation challenge that are central to the overall study of which this case study is part of, has been relevant for the North‐Netherlands regional socio‐economic policy. We conclude this, as business support schemes have been the main measures through which the policy has been implemented. These schemes aim at strengthening regional companies and thus make them more competitive on the regional, but also on the national and international level.
At the start of the program its main goal was to raise the employment level in the region (and reach at least the national level). However, in more recent years internationalisation and improving economic infrastructure has become an explicit goal of regional policy, partly forced to this by the national regional policy: ‘Peaks in the Delta’ (‘Pieken in de Delta’). ERDF intervention directly relates to this; it is an integral part of the Compass (Kompas) policy and Direction (Koers) policy. Here EU, national and regional policies come together and have been integrated. Although globalisation and internationalisation were not explicitly mentioned in the regional policy documents, they have become more and more important in the course of the programme. This can be concluded from the policy documents in which goals such as stimulating exports and development of new products for markets outside the region became more relevant.

Work Package 4: “Structural Change and Globalisation”
5
The ERDF interventions concentrate on the main dimensions of structural change. Many projects have been initiated in order to stimulate regional clustering. We found that the energy clusters were successful (the clustering in the metal sector was less successful). The availability of human resources and innovation and knowledge transfer are very important conditions for successful working clusters. They are addressed by ERDF scheme’s measures and projects , but it will take considerable time before the goals set by the programme will be reached (new qualifications of workers, new products /processes /services). Also formation of clusters and networking and cooperation between SME’s and large firms are success factors for economic sectors; they were addressed very successfully for the energy sector.
The ERDF programme was closely related to the Compass policy; both mainly focused on having employment effects. During the mid‐term review in 2003 it was concluded that the program was rather good progressing: the 4,510 fte’s (full time equivalent) that had been created at that moment was almost half of what was set as the lower part of the final goal to be reached in 2006: 9,500 – 17,700 extra jobs that had to be reached in 2006. However, due to the changing economic circumstance in which the program is being executed it was uncertain if all parts of the program would be implemented.

Case Study ‐ North Netherlands (NL)
6

Work Package 4: “Structural Change and Globalisation”
7
Introduction
The main research question addressed throughout this case study of the North‐Netherlands region relates to the responsiveness of companies in traditional industries in the region to new technological challenges that will lead to product and process innovations. Not only demand factors within the companies themselves, such as absorptive capacity and path dependency are important, also other aspects of the regional innovation system are important for successful innovation processes. These include clustering of company activities that facilitates linkages and cooperation between companies and technology transfer from public research institutions to industry. The main research question is: Have the ERDF measures helped to reinforce the innovation potential and improved the quality and quantity of human resources in the North‐Netherlands region in order to improve the regional economy and making it more internationally competitive? We focus the analysis in the case study on the role of the Measures 3a and 3b (Priority 3: Knowledge, Innovation and Employment) in improving the region’s innovation potential and human capital. In Chapter 1, after an introduction on the main socio‐economic aspects of the North‐Netherlands region, the situation prior to the launch of the Objective 2 2000‐2006 Programme is briefly presented. Following the central issues of the research question we elaborate on the specific situation in the region with respect to innovation potential and human resources. Chapter 2 provides a synthetic description of the North‐Netherlands Objective 2 2000‐2006 programme and how it is related to the national and regional economic policies. Also it presents the arguments for selecting the specific measures for the case study analysis. The analysis of the specific measures and two relevant schemas and a set of selected projects and their contribution to improving the regions innovation potential and human capital are presented in Chapter 3. Chapter 4 summarizes the main findings of the effects of the ERDF intervention in the North‐Netherlands region.

Case Study ‐ North Netherlands (NL)
8

Work Package 4: “Structural Change and Globalisation”
9
1. Structural change and globalisation in perspective
This section provides a profile of the region North‐Netherlands. It first presents a number of important socio‐economic characteristics and subsequently it focuses on a number of relevant dimensions of structural change and the effects of globalisation.
1.1 The region at glance
The eligible area is situated in the North of the Netherlands and consists of major parts of the three Northern provinces Friesland (Fryslân in Frisian language), Groningen, and Drenthe, bordering on Germany in the east and the North Sea in the North (see Figure 1.1). The region’s surface covers about 25% of the Netherlands. However only 10% of the Dutch population is living in the region. In January 1995 the North‐Netherlands region had 1.6 million inhabitants (about 10.5 % of the Netherlands population)1. In 2006 this has grown to a population of 1.7 million (which corresponds to 10.3% of the Netherlands population in 2006). The region can be characterised as a rather open area, with about half the number of inhabitants per square metre (ca 200) as compared to the average value for the Netherlands.
Figure 1.1 ‐ Map of The Netherlands, North‐Netherlands and of the three provinces
Source: Eurostat, Ramon database
1 Objective 2 programme 2000‐2006 North Netherlands

Case Study ‐ North Netherlands (NL)
10
Within the North‐Netherlands region, the Objective 2 eligible area for support, involved a population of 1.1 million inhabitants, this is 66.7 % of the total regional population. Of these, 84% lived in intermediate rural areas the rest in predominantly rural areas, reflecting the typical rural character of the region. Table 1.1 provides further specification on population of the nine sub‐regions of the eligible area.
Table 1.1 ‐ Taxonomy of objective 2 eligible areas (Nuts 3)
Population, 2004,
thousands
% of regional population, within Objective 2 areas
Population in Obj 2 areas, thousands
Urban/rural category*
NL111 East‐Groningen 154.3 93.6% 144.4 21 NL112 Delfzijl 52.1 56.8% 29.6 21 NL113 Rest of Groningen 368.4 64.3% 237.1 21 NL121 North‐Fryslân 331.4 48.3% 160.1 21 NL122 SouthWest‐Fryslân 105.0 58.0% 61.0 21 NL123 SouthEast‐Fryslân 206.1 86.8% 179.0 31 NL131 North‐Drenthe 184.7 51.5% 95.1 21 NL132 SouthEast ‐Drenthe 171.0 80.8% 138.1 21 NL133 SouthWest ‐Drenthe 127.2 70.7% 90.1 21 *1 = predominantly urban; 21 = intermediate rural, close to a city; 22 = intermediate rural, remote; 31 = predominantly rural, close to a city; 32 = predominantly rural, remote regions Source: Applica – Ismeri – wiiw. Ex Post Evaluation of Cohesion Policy Programmes 2000‐2006 financed by the European Regional Development Fund in Objective 1 and 2 Regions. WP1, Task5 Final report.
Figure 1.2 shows the Objective 2 eligible areas including those in the three provinces of Groningen, Fryslân and Drenthe forming the North‐Netherlands region. There are some demographic problems in the composition of the population in the region. First there is the aging problem: the population growth is slower as compared to the national average. Also there is the small share of young persons (under 20 years). There is a strong representation of persons between 20 and 25, but these are students of the Groningen University and regional polytechnics and colleges. Most of them leave the region after having finished their studies: this has a negative impact on the labour supply, especially on its quality.
Economic performance
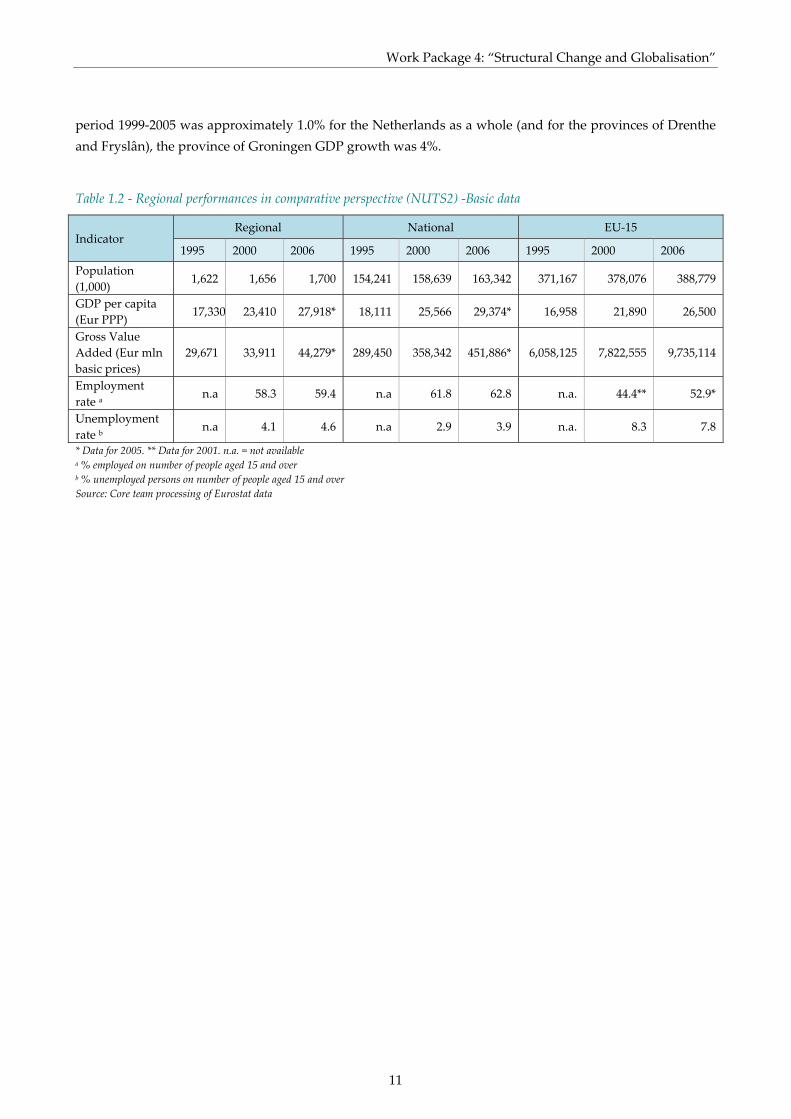
The long‐term economic growth of the North‐Netherlands region has continuously lagged behind the growth in the rest of the country. The contribution of the North‐Netherlands to the gross national product is relatively small. It belongs to the least productive regions in terms of contribution to national GDP. This is because of the relative small size and activities of the business sector and the relatively old population. However, this downward trend seems to have been reversed since the end of the 1990s, from when the broad macro‐economic indicators have improved. The GPD per capita growth in the region followed more or less the national and EU‐15 trends: strong increase (almost 40%) between 1995 and 2000 and a smaller increase (about 17%) in the period 2000‐2006 (Table 1.2). In 2000 GDP per capita was approximately 20% below the national level; in 2006 the gap has been reduced to 10%. While the GDP growth rate over the
Work Package 4: “Structural Change and Globalisation”
11
period 1999‐2005 was approximately 1.0% for the Netherlands as a whole (and for the provinces of Drenthe and Fryslân), the province of Groningen GDP growth was 4%.
Table 1.2 ‐ Regional performances in comparative perspective (NUTS2) ‐Basic data
Indicator Regional National EU‐15
1995 2000 2006 1995 2000 2006 1995 2000 2006
Population (1,000)
1,622 1,656 1,700 154,241 158,639 163,342 371,167 378,076 388,779
GDP per capita (Eur PPP)
17,330 23,410 27,918* 18,111 25,566 29,374* 16,958 21,890 26,500
Gross Value Added (Eur mln basic prices)
29,671 33,911 44,279* 289,450 358,342 451,886* 6,058,125 7,822,555 9,735,114
Employment rate a
n.a 58.3 59.4 n.a 61.8 62.8 n.a. 44.4** 52.9*
Unemployment rate b
n.a 4.1 4.6 n.a 2.9 3.9 n.a. 8.3 7.8
* Data for 2005. ** Data for 2001. n.a. = not available a % employed on number of people aged 15 and over b % unemployed persons on number of people aged 15 and over Source: Core team processing of Eurostat data

Case Study ‐ North Netherlands (NL)
12
Figure 1.2 ‐ Map of the Objective 1 and 2 regions in the Netherlands; including three NN‐provinces
Source. DG Regional Policy
The disposable income of the North‐Netherlands region was approximately 10% below the national level. Half of the 100 poorest Dutch municipalities (measured by disposable income per head of population) are in

Work Package 4: “Structural Change and Globalisation”
13
the three northern Dutch provinces, whilst only 2 of the 100 richest are in this region. In 2000 GDP per hour worked (labour productivity) was slightly below the national level but the productivity growth rate scores higher than the national one. Taking into account a wider time period (from 1990s onwards) the most remarkable diverging features of North‐Netherland’s economic performance with respect to the Netherlands as a whole consist in the higher (but decreasing) rate of unemployment and in the higher productivity growth. The acceleration of productivity growth rates in the northern part of the country represents a relevant point of strength since, especially with increasing globalisation and deregulation of international markets, productivity growth is the tool to enhance competitiveness. The sectoral specialisation of the economy and the shift of factors across sectors is a key component, which can play an important role in determining aggregate growth. Data concerning this dimensions document a clear process of structural change taking place in the North‐Netherlands region characterized by the shifting away from agriculture and industry toward services in term of both labour and output shares. The northern part of the Netherlands is the more rural part of the country and, in terms of land use, also the most agricultural part: in the Netherlands 57% of the total land surface, excluding water, is in agricultural use, whereas the same figure for the North is 78%. However, contrary to what one would expect, the share of the region in the total agricultural output of the Netherlands is rather low (13% in 2001). A main explanation for this is that the region is dominated by traditional, land‐based, relatively large scale agriculture (dairy and arable), while in the rest of the Netherlands capital‐intensive forms of not land‐based horticulture (greenhouse horticulture, permanent flower bulb cultivation and cultivation in pots and containers) and intensive husbandry are the predominant sectors. The specialisation of agriculture in the North is reflected in the agro‐industrial structure: the largest dairy cooperative of the Netherlands has based main production locations in the North (Royal FrieslandCampina); some 40% percent of the Dutch capacity in sugar refining was until mid 2009 located in the North (SuikerUnie); the largest potato‐starch producer (Avebe) and the second largest trading company in feed, cereals, and fertilizers (the cooperative Agrifirm) are also located in the North. Another effect of the urbanised environment is that more and more land is reserved for nature and recreation, causing a loss of agricultural land and a tendency towards de‐specialisation at farm level, combining agricultural and non‐agricultural activities. Especially in areas that are attractive for recreation (the Wadden islands, central Drenthe, central and south Fryslân) diversification of farming activities in the direction of recreation and tourism, is not uncommon. This last feature (the diversification of agriculture and the growing relevance of tourism) is illustrative for a broader process in regional economies of the shifting the employment structure towards a service orientation. Only in the last two decades, also the North‐Netherlands region became a primarily service‐oriented economy and today the services sector is increasingly seen as the engine of economic growth and employment: in 2005 it accounted for 73% of the employment (see Table 1.3) and 63% of GVA (see Table 1.4 on the next page: total of Financial Services, Public services and Private Services). However, during the programming period, the overall distribution of employment over the three main sectors (agriculture, industry, service) has been reinforced. The most important difference with the national profile was for the industrial sector; here employment dropped by 3.1% compared to 2.5% for the Netherlands as a whole (Table 1.3).

Case Study ‐ North Netherlands (NL)
14
Table 1.3 ‐ Regional specialisation (NUTS2) in North‐Netherlands (% of employment)
Employment by sector
Indicator Regional National EU‐15
2000 2005 ∆ (%) 00/05
2000 2005 ∆ (%) 00/05
2000 2005 ∆ (%) 00/05
Agriculture 4.2 4.5 7.1 3.0 3.2 6.7 5.6 4.6 ‐17.9
Industry 22.8 22.1 ‐3.1 20.1 19.6 ‐2.5 27.9 25.1 ‐10.0
Services 73.1 73.4 0.4 76.9 77.3 0.5 66.5 70.3 5.7
Source: Core team processing of Eurostat data
Within the service sector, there is an over‐representation of non‐commercial services and an under‐representation of commercial services (OP NN, 2007). However, during the past 15 years the differences of the North‐Netherlands with the overall Netherlands profile has decreased (ibid). The service sector (banking, insurance companies, trade, logistics, tourism) has been growing considerably recently. New economic sectors with high growth potentials such as ICT, medical technology and biotechnology, also have gained importance in North‐Netherlands. These developments have been responsible for economic growth figures in the eligible region. Table 1.4 shows clearly the importance of the energy sector (i.e. natural gas) for North‐Netherlands with positive growth figures, while those for the Netherlands as a whole and that of EU‐15 showed negative growth. Also Public Administration showed a growth over the period 2000‐2005, which was much larger as the national and the EU‐figures. This is mainly due to the University of Groningen and a number of college’s for higher vocational education (HBO) in the region. Together they have about 60,000 students.
Table 1.4 ‐ Gross Value Added by broad economic sector (% on total GVA)
Indicator Regional National EU‐15
1995 2000 2005 ∆ (%) 00/05
2000 2005 ∆ (%) 00/05
2000 2005 ∆ (%) 00/05
Agriculture, hunting, forestry and fishing
3.5 3.8 3.0 ‐21.1 2.4 2.0 ‐16.7 2.5 1.8 ‐28.0
Construction 5.4 4.8 4.5 ‐6.3 5.1 4.8 ‐5.9 5.4 5.7 5.6
Financial services: intermediation; real estate, renting and business activities
17.6 17.1 17.1 0.0 23.4 24.5 4.7 22.3 23.4 4.9
Manufacturing 38.9 12.3 12.2 ‐0.8 11.2 11.1 ‐0.9 11.4 11.5 0.9
Mining and quarrying; electricity, gas and water supply
0.0 27.1 27.7 2.2 17.9 16.5 ‐7.8 19.5 17.5 ‐10.3
Public Services a 20.3 20.2 22.2 9.9 20.0 21.7 8.5 19.2 20.3 5.7
Private services b 14.3 14.7 13.3 ‐9.5 20.0 19.4 ‐3.0 19.7 19.8 0.5 a Including: public administration, defence, compulsory social security; education; health and social work; other community, social and personal service activities; private households with employed persons b Including: wholesale and retail trade, repair of motor vehicles, motorcycles and personal and household goods, hotels and restaurants; transport, storage and communication Source: Core team processing of Eurostat data
Work Package 4: “Structural Change and Globalisation”
15
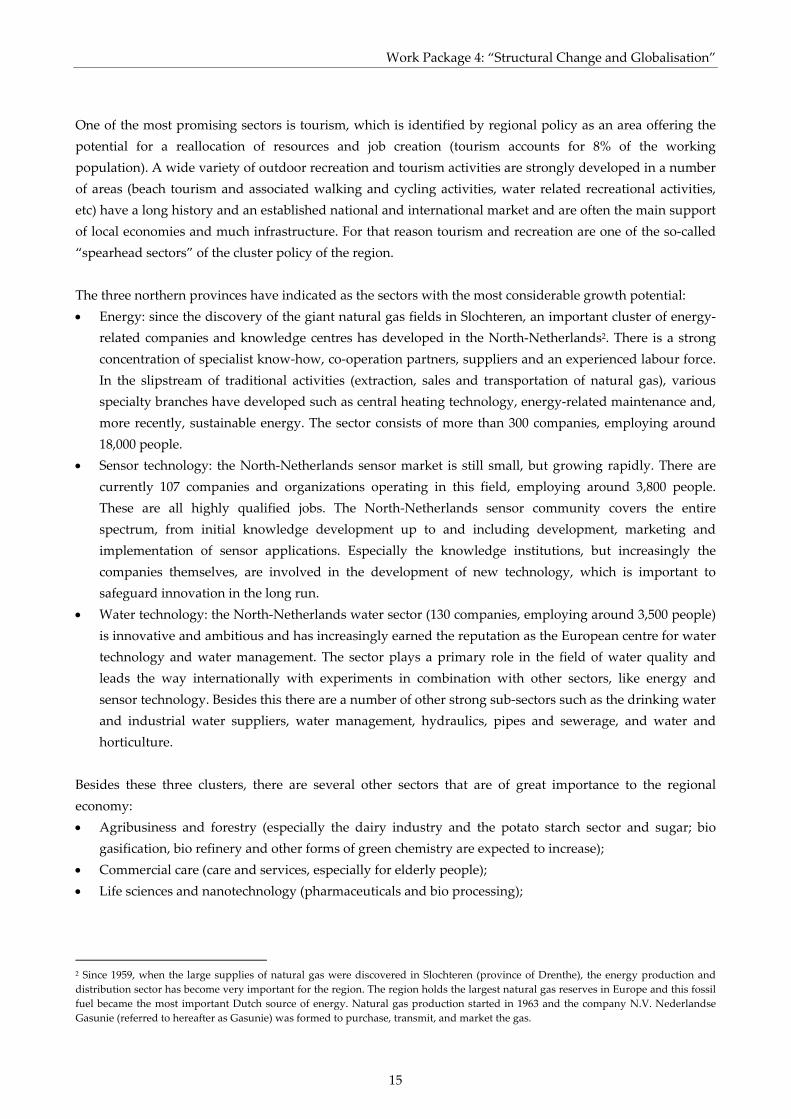
One of the most promising sectors is tourism, which is identified by regional policy as an area offering the potential for a reallocation of resources and job creation (tourism accounts for 8% of the working population). A wide variety of outdoor recreation and tourism activities are strongly developed in a number of areas (beach tourism and associated walking and cycling activities, water related recreational activities, etc) have a long history and an established national and international market and are often the main support of local economies and much infrastructure. For that reason tourism and recreation are one of the so‐called “spearhead sectors” of the cluster policy of the region. The three northern provinces have indicated as the sectors with the most considerable growth potential: • Energy: since the discovery of the giant natural gas fields in Slochteren, an important cluster of energy‐
related companies and knowledge centres has developed in the North‐Netherlands2. There is a strong concentration of specialist know‐how, co‐operation partners, suppliers and an experienced labour force. In the slipstream of traditional activities (extraction, sales and transportation of natural gas), various specialty branches have developed such as central heating technology, energy‐related maintenance and, more recently, sustainable energy. The sector consists of more than 300 companies, employing around 18,000 people.
• Sensor technology: the North‐Netherlands sensor market is still small, but growing rapidly. There are currently 107 companies and organizations operating in this field, employing around 3,800 people. These are all highly qualified jobs. The North‐Netherlands sensor community covers the entire spectrum, from initial knowledge development up to and including development, marketing and implementation of sensor applications. Especially the knowledge institutions, but increasingly the companies themselves, are involved in the development of new technology, which is important to safeguard innovation in the long run.
• Water technology: the North‐Netherlands water sector (130 companies, employing around 3,500 people) is innovative and ambitious and has increasingly earned the reputation as the European centre for water technology and water management. The sector plays a primary role in the field of water quality and leads the way internationally with experiments in combination with other sectors, like energy and sensor technology. Besides this there are a number of other strong sub‐sectors such as the drinking water and industrial water suppliers, water management, hydraulics, pipes and sewerage, and water and horticulture.
Besides these three clusters, there are several other sectors that are of great importance to the regional economy: • Agribusiness and forestry (especially the dairy industry and the potato starch sector and sugar; bio
gasification, bio refinery and other forms of green chemistry are expected to increase); • Commercial care (care and services, especially for elderly people); • Life sciences and nanotechnology (pharmaceuticals and bio processing);
2 Since 1959, when the large supplies of natural gas were discovered in Slochteren (province of Drenthe), the energy production and distribution sector has become very important for the region. The region holds the largest natural gas reserves in Europe and this fossil fuel became the most important Dutch source of energy. Natural gas production started in 1963 and the company N.V. Nederlandse Gasunie (referred to hereafter as Gasunie) was formed to purchase, transmit, and market the gas.
Case Study ‐ North Netherlands (NL)
16
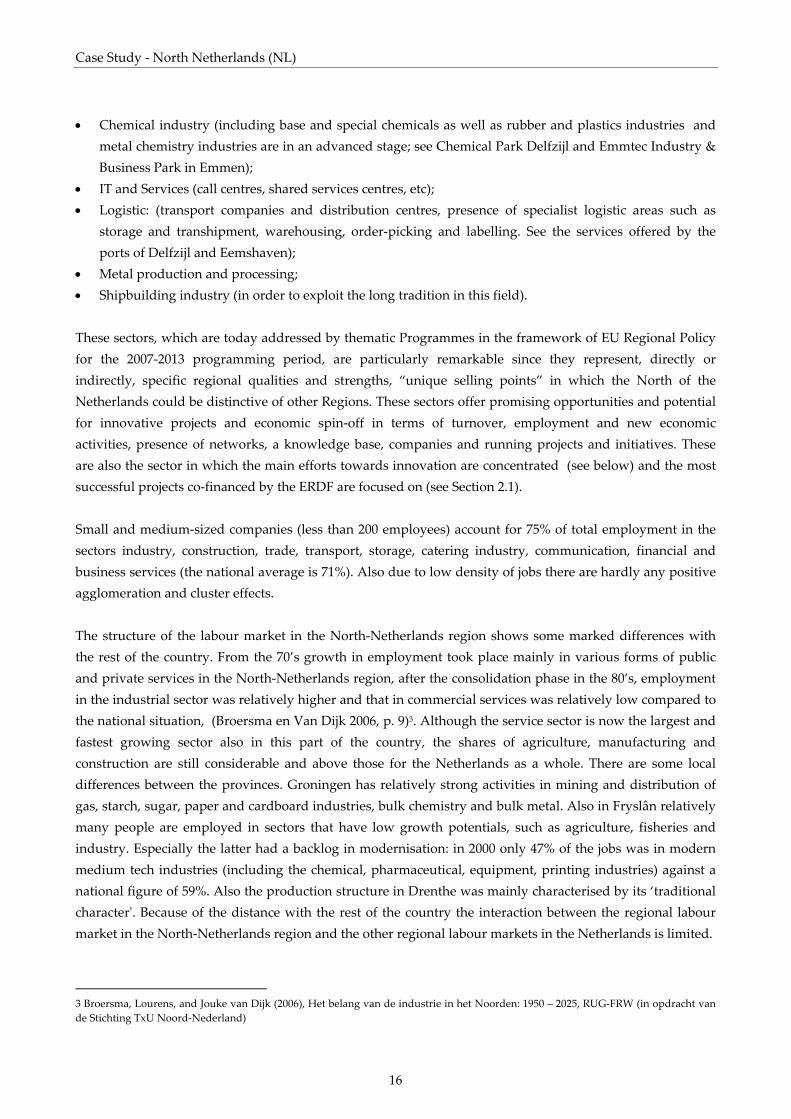
• Chemical industry (including base and special chemicals as well as rubber and plastics industries and metal chemistry industries are in an advanced stage; see Chemical Park Delfzijl and Emmtec Industry & Business Park in Emmen);
• IT and Services (call centres, shared services centres, etc); • Logistic: (transport companies and distribution centres, presence of specialist logistic areas such as
storage and transhipment, warehousing, order‐picking and labelling. See the services offered by the ports of Delfzijl and Eemshaven);
• Metal production and processing; • Shipbuilding industry (in order to exploit the long tradition in this field). These sectors, which are today addressed by thematic Programmes in the framework of EU Regional Policy for the 2007‐2013 programming period, are particularly remarkable since they represent, directly or indirectly, specific regional qualities and strengths, “unique selling points” in which the North of the Netherlands could be distinctive of other Regions. These sectors offer promising opportunities and potential for innovative projects and economic spin‐off in terms of turnover, employment and new economic activities, presence of networks, a knowledge base, companies and running projects and initiatives. These are also the sector in which the main efforts towards innovation are concentrated (see below) and the most successful projects co‐financed by the ERDF are focused on (see Section 2.1). Small and medium‐sized companies (less than 200 employees) account for 75% of total employment in the sectors industry, construction, trade, transport, storage, catering industry, communication, financial and business services (the national average is 71%). Also due to low density of jobs there are hardly any positive agglomeration and cluster effects. The structure of the labour market in the North‐Netherlands region shows some marked differences with the rest of the country. From the 70’s growth in employment took place mainly in various forms of public and private services in the North‐Netherlands region, after the consolidation phase in the 80’s, employment in the industrial sector was relatively higher and that in commercial services was relatively low compared to the national situation, (Broersma en Van Dijk 2006, p. 9)3. Although the service sector is now the largest and fastest growing sector also in this part of the country, the shares of agriculture, manufacturing and construction are still considerable and above those for the Netherlands as a whole. There are some local differences between the provinces. Groningen has relatively strong activities in mining and distribution of gas, starch, sugar, paper and cardboard industries, bulk chemistry and bulk metal. Also in Fryslân relatively many people are employed in sectors that have low growth potentials, such as agriculture, fisheries and industry. Especially the latter had a backlog in modernisation: in 2000 only 47% of the jobs was in modern medium tech industries (including the chemical, pharmaceutical, equipment, printing industries) against a national figure of 59%. Also the production structure in Drenthe was mainly characterised by its ‘traditional characterʹ. Because of the distance with the rest of the country the interaction between the regional labour market in the North‐Netherlands region and the other regional labour markets in the Netherlands is limited.
3 Broersma, Lourens, and Jouke van Dijk (2006), Het belang van de industrie in het Noorden: 1950 – 2025, RUG‐FRW (in opdracht van de Stichting TxU Noord‐Nederland)
Work Package 4: “Structural Change and Globalisation”
17
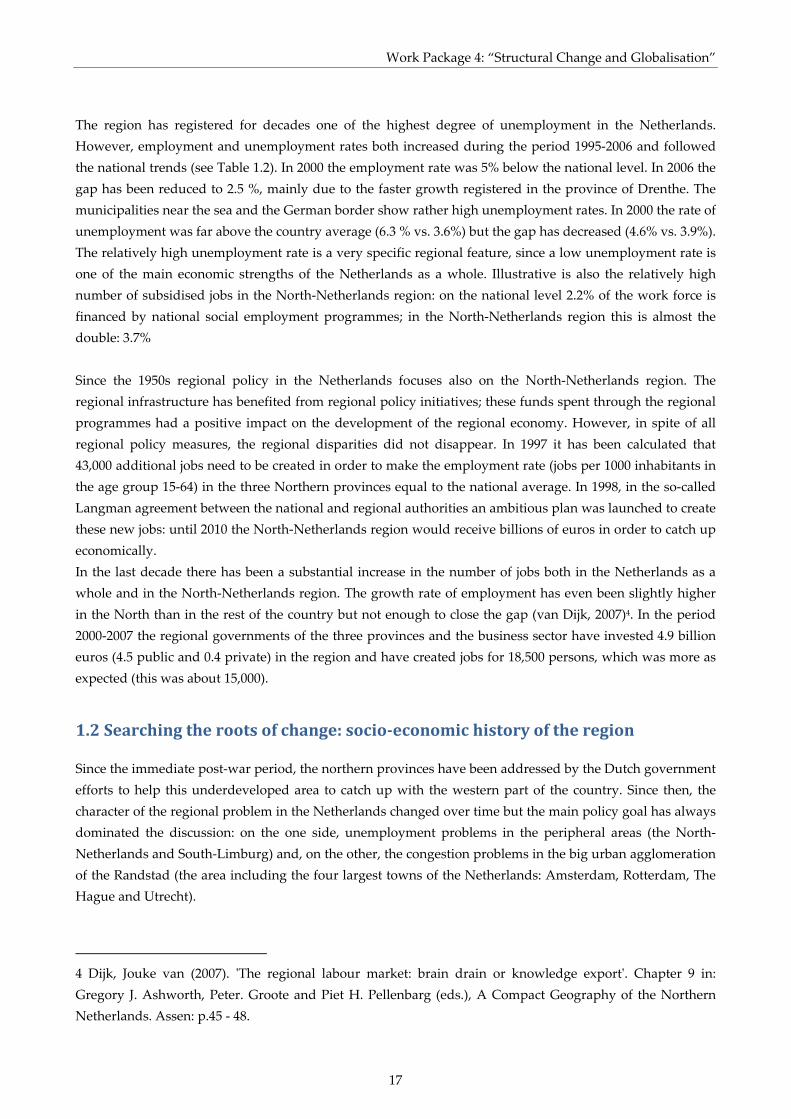
The region has registered for decades one of the highest degree of unemployment in the Netherlands. However, employment and unemployment rates both increased during the period 1995‐2006 and followed the national trends (see Table 1.2). In 2000 the employment rate was 5% below the national level. In 2006 the gap has been reduced to 2.5 %, mainly due to the faster growth registered in the province of Drenthe. The municipalities near the sea and the German border show rather high unemployment rates. In 2000 the rate of unemployment was far above the country average (6.3 % vs. 3.6%) but the gap has decreased (4.6% vs. 3.9%). The relatively high unemployment rate is a very specific regional feature, since a low unemployment rate is one of the main economic strengths of the Netherlands as a whole. Illustrative is also the relatively high number of subsidised jobs in the North‐Netherlands region: on the national level 2.2% of the work force is financed by national social employment programmes; in the North‐Netherlands region this is almost the double: 3.7% Since the 1950s regional policy in the Netherlands focuses also on the North‐Netherlands region. The regional infrastructure has benefited from regional policy initiatives; these funds spent through the regional programmes had a positive impact on the development of the regional economy. However, in spite of all regional policy measures, the regional disparities did not disappear. In 1997 it has been calculated that 43,000 additional jobs need to be created in order to make the employment rate (jobs per 1000 inhabitants in the age group 15‐64) in the three Northern provinces equal to the national average. In 1998, in the so‐called Langman agreement between the national and regional authorities an ambitious plan was launched to create these new jobs: until 2010 the North‐Netherlands region would receive billions of euros in order to catch up economically. In the last decade there has been a substantial increase in the number of jobs both in the Netherlands as a whole and in the North‐Netherlands region. The growth rate of employment has even been slightly higher in the North than in the rest of the country but not enough to close the gap (van Dijk, 2007)4. In the period 2000‐2007 the regional governments of the three provinces and the business sector have invested 4.9 billion euros (4.5 public and 0.4 private) in the region and have created jobs for 18,500 persons, which was more as expected (this was about 15,000).
1.2 Searching the roots of change: socioeconomic history of the region
Since the immediate post‐war period, the northern provinces have been addressed by the Dutch government efforts to help this underdeveloped area to catch up with the western part of the country. Since then, the character of the regional problem in the Netherlands changed over time but the main policy goal has always dominated the discussion: on the one side, unemployment problems in the peripheral areas (the North‐Netherlands and South‐Limburg) and, on the other, the congestion problems in the big urban agglomeration of the Randstad (the area including the four largest towns of the Netherlands: Amsterdam, Rotterdam, The Hague and Utrecht).
4 Dijk, Jouke van (2007). ʹThe regional labour market: brain drain or knowledge exportʹ. Chapter 9 in: Gregory J. Ashworth, Peter. Groote and Piet H. Pellenbarg (eds.), A Compact Geography of the Northern Netherlands. Assen: p.45 ‐ 48.
Case Study ‐ North Netherlands (NL)
18
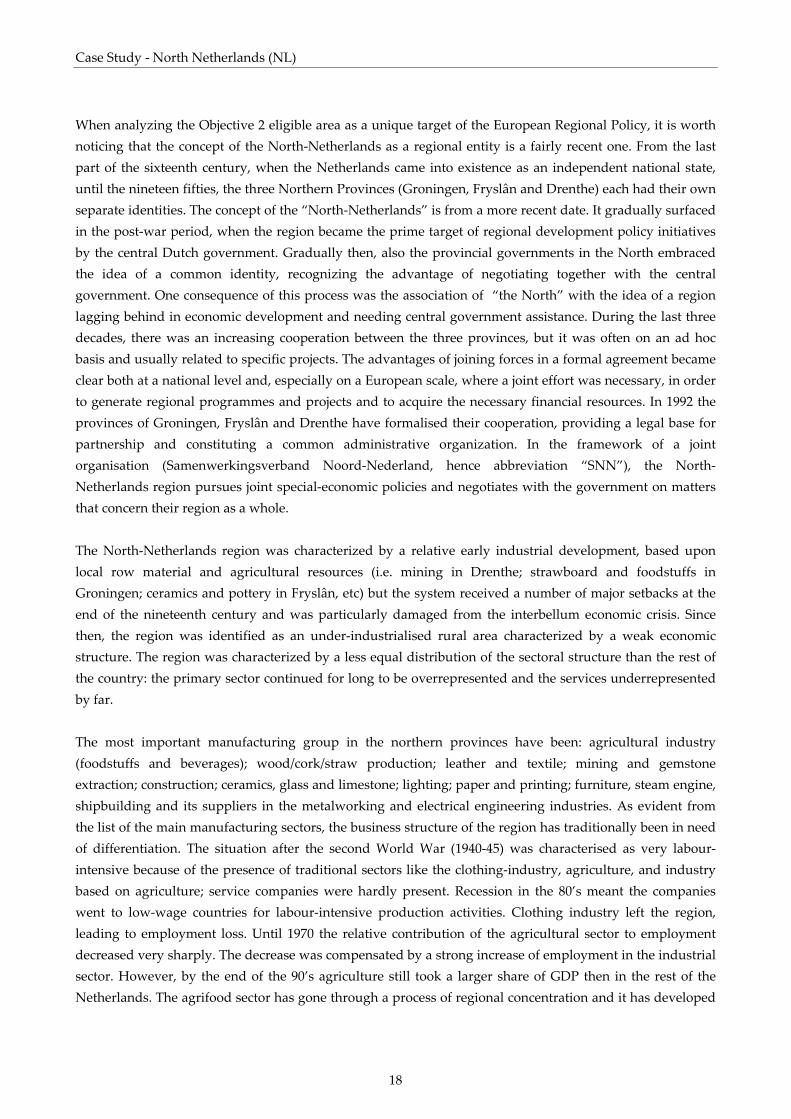
When analyzing the Objective 2 eligible area as a unique target of the European Regional Policy, it is worth noticing that the concept of the North‐Netherlands as a regional entity is a fairly recent one. From the last part of the sixteenth century, when the Netherlands came into existence as an independent national state, until the nineteen fifties, the three Northern Provinces (Groningen, Fryslân and Drenthe) each had their own separate identities. The concept of the “North‐Netherlands” is from a more recent date. It gradually surfaced in the post‐war period, when the region became the prime target of regional development policy initiatives by the central Dutch government. Gradually then, also the provincial governments in the North embraced the idea of a common identity, recognizing the advantage of negotiating together with the central government. One consequence of this process was the association of “the North” with the idea of a region lagging behind in economic development and needing central government assistance. During the last three decades, there was an increasing cooperation between the three provinces, but it was often on an ad hoc basis and usually related to specific projects. The advantages of joining forces in a formal agreement became clear both at a national level and, especially on a European scale, where a joint effort was necessary, in order to generate regional programmes and projects and to acquire the necessary financial resources. In 1992 the provinces of Groningen, Fryslân and Drenthe have formalised their cooperation, providing a legal base for partnership and constituting a common administrative organization. In the framework of a joint organisation (Samenwerkingsverband Noord‐Nederland, hence abbreviation “SNN”), the North‐Netherlands region pursues joint special‐economic policies and negotiates with the government on matters that concern their region as a whole. The North‐Netherlands region was characterized by a relative early industrial development, based upon local row material and agricultural resources (i.e. mining in Drenthe; strawboard and foodstuffs in Groningen; ceramics and pottery in Fryslân, etc) but the system received a number of major setbacks at the end of the nineteenth century and was particularly damaged from the interbellum economic crisis. Since then, the region was identified as an under‐industrialised rural area characterized by a weak economic structure. The region was characterized by a less equal distribution of the sectoral structure than the rest of the country: the primary sector continued for long to be overrepresented and the services underrepresented by far. The most important manufacturing group in the northern provinces have been: agricultural industry (foodstuffs and beverages); wood/cork/straw production; leather and textile; mining and gemstone extraction; construction; ceramics, glass and limestone; lighting; paper and printing; furniture, steam engine, shipbuilding and its suppliers in the metalworking and electrical engineering industries. As evident from the list of the main manufacturing sectors, the business structure of the region has traditionally been in need of differentiation. The situation after the second World War (1940‐45) was characterised as very labour‐intensive because of the presence of traditional sectors like the clothing‐industry, agriculture, and industry based on agriculture; service companies were hardly present. Recession in the 80’s meant the companies went to low‐wage countries for labour‐intensive production activities. Clothing industry left the region, leading to employment loss. Until 1970 the relative contribution of the agricultural sector to employment decreased very sharply. The decrease was compensated by a strong increase of employment in the industrial sector. However, by the end of the 90’s agriculture still took a larger share of GDP then in the rest of the Netherlands. The agrifood sector has gone through a process of regional concentration and it has developed

Work Package 4: “Structural Change and Globalisation”
19
into a relatively technology‐intensive industrial sector, which operates on a global scale. The product portfolio has changed from bulk products in the fifties of the last century, towards more high value added products in the end of last century. In 2000 the economic value of all industrial sectors was at the level of the national average. In order to rise the economic condition, the first policy measures promoted by the Dutch government were aimed at attracting “external” investments by stimulating the establishment of new firms, especially Dutch firm relocation from the core area (the Randstad) to the periphery through several tools (especially investment premiums in various forms, and infrastructure programmes of various arrangements), mainly related to cost‐reduction factor (i.e. cost of land, transportation cost, labour cost and availability, market size, etc). The so called “spreading policy” was implanted through relocation of government offices and the redistribution of public services, creation of new industrial sites, financial incentives for supporting investments in the designated “industrial nuclei”, tax exemptions, etc. In the first period, the number of new jobs grew considerably in the development areas and the new workers were mainly employed in large firms (i.e. Philips). However, the northern part of the country maintained a long tradition of structural unemployment largely as a consequence of agricultural rundown. To absorb this labour surplus, the structure of the economy had to be broadened and a process was started that is still ongoing. In the 1960s a new type of incentive the investment project scheme (Investeringspremieregeling ‐ IRP) was introduced, aimed particularly to increase its appeal to the technology advanced, capital intensive industries. Moreover, from the end of the 1970s onwards, due to a growing criticism of that kind of policy caused by the sharp increase of unemployment in all regions of the Netherlands major structural change in the regional policy happened, shifting towards a more decentralised model and increasing emphasis on framework measures (integrated development plans, strategies designed and delivered by a partnership between regional and local players, etc). For the northern provinces, Integrated Structure Plans (ISPs) were developed, which not only concentrated on economically aspects, but also contained spatial and social aspects. A regional development agency was created: the NOM (Noord‐Nederlandse Ontwikkelingsmaatschappij), founded by the national government in 1979 and still operating in the three provinces. According to the 1995 Government Memorandum “Room for regions, spatial economic policy until 2001”, there was a proposal to put an end to the fifty years of post‐war regional policy and only the northern provinces remained the target of a regional economic support measure, that was considered as “the last remaining component of classical regional policy”. The new policy goal became the creation of tailor‐made solutions in order to support for regions throughout the country to fully utilize their unique economic development potential in order to maximize their contribution to the national economy. Although the North‐Netherlands region remained the only “surviving” representative of classical regional policy, the need of enhance the economic structure of the region and promote its transition towards more innovative sectors and knowledge‐based economy, became promoted in the framework of the Integrated Structure Plan for the Northern Netherlands (Compass Strategy, see Section 2.1). Finally, a factor that will play a key role in shaping the forthcoming socio‐economic history of the North‐Netherlands region, will be the capacity of the region of take advantage of its proximity to the main economic centres of Europe, deriving optimal benefits from its strategic position between Northern and Eastern Europe (the so called Northeast Corridor). Following the 2004 EU enlargement the region is
Case Study ‐ North Netherlands (NL)
20
challenged by important developments in maritime Northeast Europe. High rates of economic growth in northern Poland, in the 3 Baltic states and in the Russian St. Petersburg region offer ample opportunities for private business investment and market expansion; on the other hand, based on an already high level of income in the Scandinavian Baltic Sea area as well as in Northwest Germany and in the Netherlands, innovative dynamics are concentrating in a trans‐European corridor of metropolitan regions stretching from Helsinki over Stockholm, the Øresund region to Hamburg and further on to Bremen, Groningen and the Randstad agglomeration. The dynamic economic developments that are expected to take place in this region could be highly significant for the further development of the North‐Netherlands, creating new opportunities on an international scale.
1.3 Key research question and central hypothesis
The overview presented above shows that the North‐Netherlands region was facing specific challenges related to the structure of its industrial sector: the business structure of the region was in need of differentiation. As a result of its history the structure of the North‐Netherlands economy still has a strong focus on agriculture. There was great need of developing activities in new types of industry, especially high tech as the availability of a number of high‐level research institutions in the region was considered as a key strong factor that could facilitate growth in the region. The effort of building new types of economic activities in high‐tech sectors and to stimulate the development of high‐value added products in existing sectors, is therefore the key focus of the analysis in this case study. There is a need for the North‐Netherlands region to broaden its economic structure and add new types of activities; innovation can play an important role. However, the high‐tech/high‐value added activities are rather new for the region and ‐ although the presence of research institutes can be considered as an important precondition for success ‐, other factors such as the relatively low education level in the region and the fact that some high‐tech sectors such as biotechnology take relatively long investments times, make it also a challenging task to invest in new innovative activities. For the development of high‐tech industries and for making existing industries more innovative the quality and quantity of human resources in the region is of crucial importance. For that reason it is highly relevant to evaluate to what extent the measures focusing on innovation (also in relation to human resources) supported by ERDF have been able to contribute to structural changes in the region and also enabled the region to adapt to the process of globalisation in the period 2000‐2006. The conceptual framework of the evaluation identified five dimensions that can be used for analysing the structural changes in the eligible regions. These include socio‐economic change and human capital, regional specialisation, changes in the organisation of the production system and service delivery, innovation potential and internationalisation and relocation. For the evaluation of the regional socio‐economic structural changes in the North‐Netherlands region during the period 2000‐2006, the role of innovation (and related human resources) and the increase in the absorptive capacity of the industrial sector will be the main focus as this suits best the specific challenges of the region mentioned above. The eligible area was facing a mismatch between a low level of innovativeness and of the qualification of the local workforce on the one hand and the needs of regional companies on the other hand.
Work Package 4: “Structural Change and Globalisation”
21
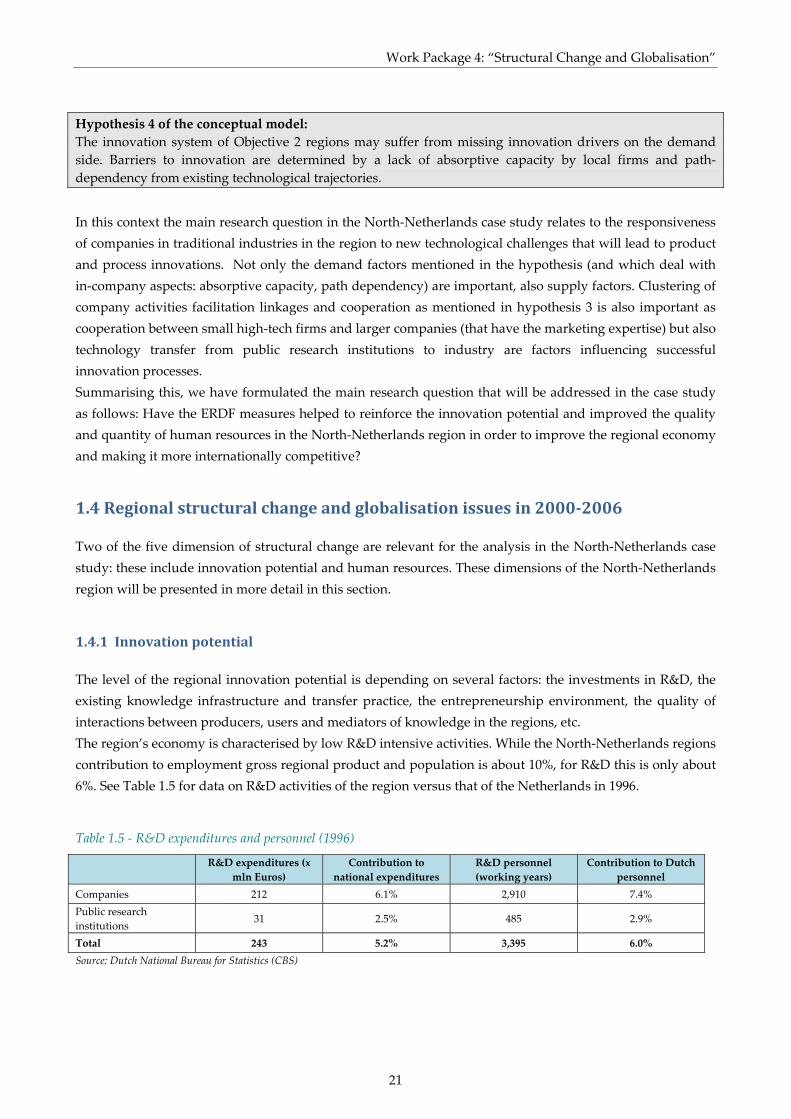
Hypothesis 4 of the conceptual model: The innovation system of Objective 2 regions may suffer from missing innovation drivers on the demand side. Barriers to innovation are determined by a lack of absorptive capacity by local firms and path‐dependency from existing technological trajectories.
In this context the main research question in the North‐Netherlands case study relates to the responsiveness of companies in traditional industries in the region to new technological challenges that will lead to product and process innovations. Not only the demand factors mentioned in the hypothesis (and which deal with in‐company aspects: absorptive capacity, path dependency) are important, also supply factors. Clustering of company activities facilitation linkages and cooperation as mentioned in hypothesis 3 is also important as cooperation between small high‐tech firms and larger companies (that have the marketing expertise) but also technology transfer from public research institutions to industry are factors influencing successful innovation processes. Summarising this, we have formulated the main research question that will be addressed in the case study as follows: Have the ERDF measures helped to reinforce the innovation potential and improved the quality and quantity of human resources in the North‐Netherlands region in order to improve the regional economy and making it more internationally competitive?
1.4 Regional structural change and globalisation issues in 20002006
Two of the five dimension of structural change are relevant for the analysis in the North‐Netherlands case study: these include innovation potential and human resources. These dimensions of the North‐Netherlands region will be presented in more detail in this section.
1.4.1 Innovation potential
The level of the regional innovation potential is depending on several factors: the investments in R&D, the existing knowledge infrastructure and transfer practice, the entrepreneurship environment, the quality of interactions between producers, users and mediators of knowledge in the regions, etc. The region’s economy is characterised by low R&D intensive activities. While the North‐Netherlands regions contribution to employment gross regional product and population is about 10%, for R&D this is only about 6%. See Table 1.5 for data on R&D activities of the region versus that of the Netherlands in 1996.
Table 1.5 ‐ R&D expenditures and personnel (1996)
R&D expenditures (x
mln Euros) Contribution to
national expenditures R&D personnel (working years)
Contribution to Dutch personnel
Companies 212 6.1% 2,910 7.4% Public research institutions
31 2.5% 485 2.9%
Total 243 5.2% 3,395 6.0% Source: Dutch National Bureau for Statistics (CBS)

Case Study ‐ North Netherlands (NL)
22
One of the reasons for this could be the composition of the unilaterally economic sector structure, which is characterised by its low‐tech and slow growth character (see above). Also the dominant types of economic activities in the region (production, assemblage, very few headquarters of companies or central staff’s of public organisations) explain these lower education level figures. This is also one of the reasons for the so‐called brain drain to other parts of the Netherlands. Compared to many other EU countries, regional governments in the Netherlands (the Provinces) had traditionally hardly any involvement in innovation policy. However a growing interest has been devoted to the promotion of innovation at a regional scale and regional authorities have a growing interest in establishing policies in strong sectors of their regional economy. Also their position has been recognised as the most suitable actor to fulfil an important role in promoting and coordinating regional initiatives and institutional structures and in linking this regional capacity to national structures. This is the case for the North Netherlands where, in line with the national orientation, “key areas and key technologies” are targeted: investments are focused on a limited number of key sectors, considered priority to the international competitiveness of the region. The main expertise and research area defined for the North Netherlands are: chemistry, life sciences and ICT (especially Groningen), water and domiciliary care (especially Fryslân), radio astronomy (Drenthe) and energy (all the three provinces). Clusters among the areas of expertise and overall networks to stimulate innovations have been created (examples are the Energy Valley and Wetsus clusters), and attempts to cross‐border cooperation are also present (an example is Nordconnect, a platform of activities aiming at increasing the contacts between organizations, companies, knowledge institutions, cultural and governmental organizations between the Northern Netherlands and Northern Europe). Especially regarding these fields, partnership and regional networking among companies and between companies and the research institutes are encouraged. To this end, the Northern Netherlands has several (applied) research facilities: a research university (the University of Groningen), and other universities/polytechnics of professional education (i.e. Hanzehogeschool Groningen, Noordelijke Hogeschool Leewarden, Christelijke Hogeschool Nederland, Van Hall Institute, Hogeschool Drenthe, etc). Furthermore there a number of research institutes are located in the region (Netherlands Foundation of Research in Astronomy/ASTRON; Centre for sustainable water technology/WESTUS; Energy Delta Institute/EDI; Knowledge Centre for Sustainable Innovation: TNO Quality of Life and TNO Information and Communication Technology) and dozens of small research centres and labs. In Northern Netherlands small and medium‐sized enterprises (SMEs) represent 95% of the companies and account for 75% of jobs. Although SMEs have the advantages of faster decision‐making processes and greater flexibility as compared to large firms, they have often limitations innovation resources (R&D investments, human capital, etc). According to a survey carried out by the Technologie‐Centrum Noord Nederland, the number of “innovative” SMEs are 2,500 (5%) and the “prudent innovative” SMEs are 9,000 (20%). For this reason in the Strategic Agenda focus is put on offering knowledge and skills to SMEs. In order to enhance the matching between knowledge demand and supply and to overcome transfer obstacles, the institutional context and, especially, the presence of intermediate organisations plays a catalyst role. Especially at regional level there are a large and increasing number of initiatives and structures in order to facilitate the innovative actors to profit from knowledge most effectively, ranging from local agencies, regional innovation platforms, knowledge networks and alliances, co‐operating municipalities or provinces, steering groups, regional sector organisations, regional knowledge networks, branches of employers
Work Package 4: “Structural Change and Globalisation”
23
organisations or lobby‐groups, regional knowledge foundations and Innovation funds (among the various subsidies granted by the Dutch local government), the Northern Provinces lead the way with the Northern Innovative Support Facility (NIOF), a scheme for stimulation of strategic activities in the field of innovation cooperation, market surveys, feasibility studies and internationalisation. Referring to knowledge transfer capacity within the region, there is available relevant publicly funded expertise and organized know‐how sources, that are expected to support further innovation development (i.e the Incubator Centres, as Meditech/Technoparter in Groningen; Stable/Spin Off Life Science in Leeuwarden; Action in Emmen, etc.). In addition to the Institutions whose overall objective is to stimulate the growth of regional trade and industry such as the Investment and Development Company for the North Netherlands (NOM) and the Chambers of Commerce, there are special organizations focused on promoting innovation and technology development (i.e. the governmental knowledge broker Syntens network, the Innovation Relay Centre, the TechnologieCentrum Noord Nederland, Business Development Friesland, the Syntens network, just to quote the main players). Although these efforts to boost the regional innovation system, the North‐Netherlands region doesn’t show consistently high innovation indicators and several challenges could be identified, especially related to the R&D intensity (see Table 1.6): • stagnating public R&D expenditures: gross domestic expenditures on R& D amounted to 1.01% of the
regional GDP in 2005, with no variation compared to 2000. Moreover this result is principally due to high expenditure of Groningen, while the Provinces of Fryslân and Drenthe lag far behind (only 0.5%);
• low level of business R&D expenditure which in 2006 amounted in approximately to 1% of the GRP, with no increase compared to 2000;
• high number of publications per million inhabitants (1,701 in 2006, nearly on Dutch average) but difficulties in the application of knowledge and R&D results: the number of patent applications is low, included in the Province of Groningen the indicator is relatively low with respect to the R&D expenditure, indicating a limited capacity of knowledge translation in new products and services (the paradox of having a very high performance in terms of scientific publications per capita but a rather disappointing position for the other innovation indicators, occurs also for the country as a whole;
• human resources for research: as above mentioned, the percentage of the population that has completed tertiary level of education is approximately 28% (against a country average of 30%) but the R&D personnel in all sectors was only 0.8% in 2006, indicating a looming shortage of knowledge workers;
• the percentage of employment in high tech manufacturing is slightly above the national average (2.1% vs. 1.4 %) while the percentage of employment in high tech services is slightly below the national average (2.7 vs. 3.2%).
The main factors influencing future innovation potential in North‐Netherlands are: • the extent to which Groningen can develop, diffuse and integrate its role as the central node in terms of
public knowledge and human resources. For instance, expertise in biomedical and nanotechnology at Groningen University are potential areas for generating business spin‐offs. In the public utility domain energy technology and water purification are promising areas.
• the enlargement of systemic innovation and RDTI activities in the economy, raising the level of public and business R&D expenditures;
• the uptake of ICT and broad band services.

Case Study ‐ North Netherlands (NL)
24
Table 1.6 ‐ Innovation potential (NUTS2)
Indicator (unit) Regional National EU‐15
1995 2000 2006 ∆ 00/06
2000 2006 ∆ 00/06
2000 2006 ∆ 00/06
Business enterprise expenditure on R&D (% of GDP) 0.5* 0.5 0.5** 0.0 1.1 1.0 ‐9.1 1.1 1.3 18.2
Gross domestic expenditure on R&D (% of GDP)
n.a 1.0 1.0** 0.0 1.8 1.7 ‐5.6 1.8 2.0 11.1
Employment in high‐tech sectors (% of total employment)
n.a 3.4 3.5 2.9 5.0 4.5 ‐10.0 4.7 4.6 ‐2.1
Number of total publications, per million capita
n.a 1664 1701 2.2 n.a n.a ‐ n.a. n.a. ‐
R&D personnel in all sectors (% of total employment)
n.a n.a 0.8 ‐ n.a 1.4** ‐ n.a. n.a. ‐
* Data for 1996 ** Data for 2005; n.a.: not available Source: Core team processing of Eurostat data
Recently innovation has become a high priority in the region. The Province of Groningen initiated the Programme of Innovative Actions (IAG), which was also financed by ERDF funds and ran for a four years period (2005 – 2008). The program was evaluated as rather successful and has been succeeded by IAG2 (see also Chapter 2).
1.4.2 Human Resources
Relevant aspects of Human Resources for economic structural change deal with the education level and employment versus unemployment. In the region 21% of the workforce has finished an academic or polytechnic (HBO) education; again a national average figure of 26% (figures for 1997; source: Survey of the Dutch National Bureau for Statistics, Workforce). Especially at the border of the region such as Eastern Groningen, South‐East Drenthe and South‐West Fryslân there is a large negative difference with the rest of the country. This has a negative impact on the regional labour productivity. There is also an under‐representation of technical training possibilities especially for the lower education levels (secondary vocational education); this is mainly due to concentration processes within the public education sector, which has led to fewer centres for secondary vocational training in the region. In the period 2000‐2006 the percentage of population with tertiary qualification has significantly increased, reaching the average of 26% (See Table 1.7). The knowledge economy is also making increasing demands on the professional population. Measures intended to strengthen professional education by more effectively linking learning and working occupy a high position in the regional policy. Overall, the education level in the region North‐Netherlands is below the average of the Netherlands (30%), notwithstanding the presence of a university and academic medical centre and a number of polytechnics in the region, but above the EU‐25 one (23%). Nevertheless, the increase of the share of people that has tertiary education was more than that of the national average figure (28.5% versus 24.8%).
Work Package 4: “Structural Change and Globalisation”
25
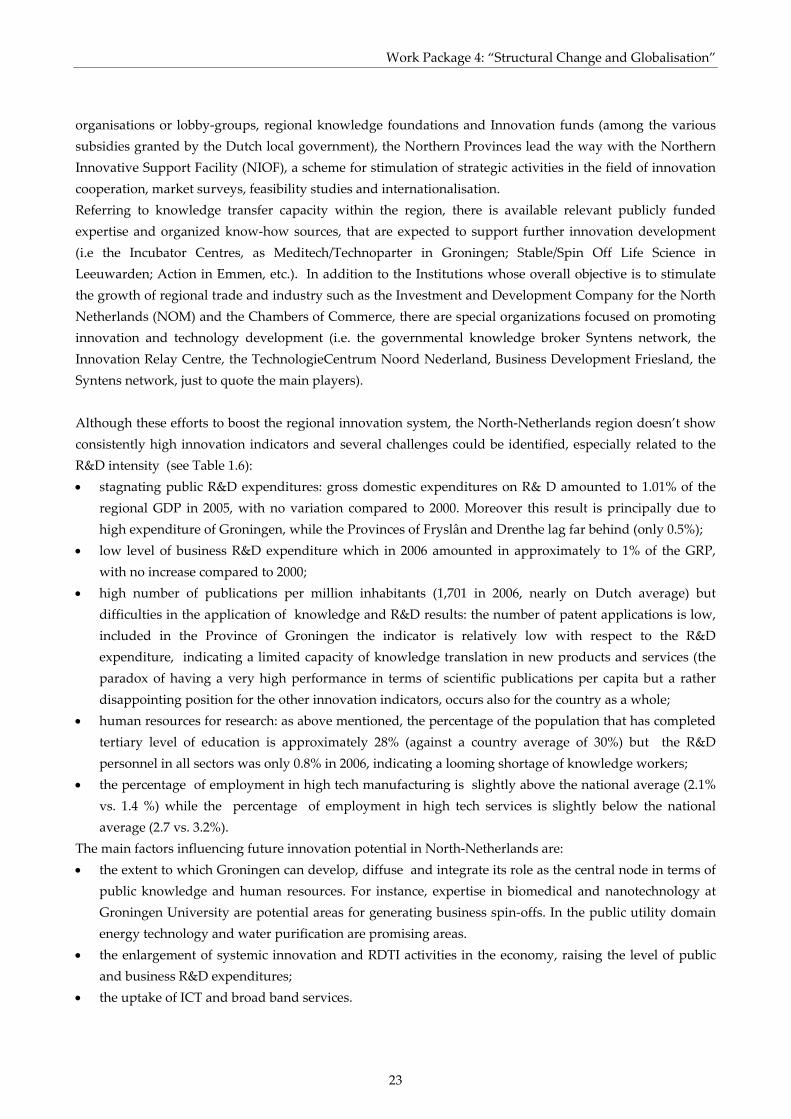
Table 1.7 ‐ Socio‐economic change and human capital (NUTS2)
Indicator Regional National EU‐15
2000 2006 ∆ 00/06
2000 2006 ∆ 00/06
2000 2006 ∆ 00/06
Share of people aged 25‐64 participating in education and training (%) 13.3 14.2 6.8 14.2 15.5 9.2 8.0 11.4* 42.5
Share of population aged 25‐64 with tertiary education (%)
20.7 26.6 28.5 23.8 29.7 24.8 20.3 25.1* 23.6
Share of students at tertiary level (%) 10.9 10.9 0.0 ‐ ‐ ‐ ‐ ‐ ‐
Crude rate of net migration (%) 2.7** ‐2.3* ‐185.2 n.a ‐1.9 ‐ 3.2 4.2 31.3
Long‐term unemployment rate (%) ‐ 42.7 ‐ ‐ 43.1 ‐ n.a. 42.3 ‐ Share of 25‐34 years employed on total employment (%)
26.0 21.5 ‐17.2 26.7 21.8 ‐18.3 n.a. 23.6 ‐
* Data for 2005 ** Data for 1999 Source: Core team processing of Eurostat data
The main change occurred over the period concerns the field of labour market where the North Netherlands has been succeeded in narrowing the so called “phase difference” between the region and the country as a whole in terms of employment rate, which has traditionally been considered the most relevant regional disparity from the rest of the Netherlands. One reason for this diverging picture is the unfavourable economic structure of the region, focused on declining or restructuring sectors (e.g. employment in agriculture diminished from the 1960s onwards and the remaining farms have been completely modernized and are less labour intensive). However, with respect to the long‐term unemployment figures the region is performing somewhat better than the national level. In 1995 the employment rate was approximately 60% and the unemployment rate was 8.5%, with a high share of long‐term unemployment (47.5%). Ten years later, the first became 72% and second has decreased (5%). The improvement is mainly due to the creation of net additional jobs in new sectors (especially the increasing size of the service sector) that make up the losses in traditional ones and to the growth in the participation rate explained by the greater number of women coming onto the labour market (reduction in the number of family workers in farming; relatively well representation of women in expanding branches of economic activity in the services sector). In the period 2000‐2006 the share of people between 25 and 34 employed as share of total employment was somewhat below the national figure (See Table 1.7). Although the notable decline of unemployment recorded, the North Netherlands has not caught up with the rest of the country and Groningen remains the province where the unemployment rate (6% in 2006) is highest (though below the European average).
1.4.3 Understanding the geography of structural change
Analyzing the indicators at NUT 3 level, it is possible to outline some features concerning the spatial dimension of structural change within the region. The province of Groningen could be roughly divided into three parts, the eastern portion (NL111), Delfzijl/Eemsmond (NL112), and the remainder (NL113), in which the provincial capital is situated. The first is characterized by the lowest GDP per capita of the region, relatively high unemployment rate (in 2006 it was 5.2%) and relevant score of GVA by industry: the area is one of the oldest industrial areas in the Netherlands (with a large agricultural industry, shipbuilding industry and its suppliers in the metalworking and electrical engineering industries.) and it is now in particular need of differentiation and restructuring. On the contrary, the main feature of Delfzijl, which

Case Study ‐ North Netherlands (NL)
26
performs well in term of GDP but is characterized by high level of unemployment, is the presence of capital‐intensive industrial units, such as chemical plants, while Eemshaven is specialized in logistics. The capital area has the highest GDP per capita of the whole North‐Netherland and the highest percentage of employment in the service sector (77%). Also within the province of Fryslân there are divergent economic trends, with a slowly growing economy in the parts of the North‐east and the South‐west. This is mainly due to the on‐sided nature of the employment structure in these rural areas, where the small agricultural sector is over‐represented. These areas have faced a net migration loss over the last few years. On the opposite side, the largest towns (Leewarden, Sneek, Drachten, Heerenveen), where almost 30% of population live and where business activities are concentrated have developed successfully, thanks to their convenient location, good infrastructure and a well‐developed service sector in particular. The development of north Drenthe (NL131), where the capital Assen is situated, is influenced by the commuting effect with the city of Groningen: the service sectors are important (public services, health care, etc), concerning 77% of employment. The development of the south‐east (NL132) Drenthe was determined by peat extraction before the war; since then it developed into one of the main industrial centres of the North: industry still accounts for 30% of employment and 50% of GVA. Finally, the South‐west area (NL133) has a relatively high unemployment rate, and the main activities are light industry and tourism. The relatively late arrival of the industrial development has meant an almost total absence of traditional sectors (such as textile and heavy metal); on the other hand, modern industries, such as production of optical equipment, chemicals and engineering are represented. About 26% of the total region’s population is living in the four largest cities of the region: Assen, Emmen (both Drenthe), Groningen (Groningen) and Leeuwarden (Fryslân). This distribution of population density has consequences for the economic performance of the region as the four largest cities are most responsible for keeping the economic motor in action: they absorb 38% of the total regional employment in the region; especially Groningen with 125,000 jobs with a workforce of 85,000 inhabitants. Also in Leeuwarden about half of the jobs are employed by peoples who are not inhabitants of the city. The trend of decreasing importance of manufacturing and rising of services can be clearly recognized in each of the three provincial capitals of the North of The Netherlands. In the early 1980’s, Leeuwarden (Fryslân) and Assen (Drenthe) still had shares of employment in manufacturing and construction of 30%‐35%, and in Groningen (Groningen) this was around 20%. These shares halved at the beginning of the 21st century and the three cities developed specialised types of services: Groningen in business services (its employment share has risen from 6% in the early 1980ʹs to 20% in 2003), although the two largest employers in Groningen are still the University Medical Centre and the University. In Leeuwarden financial services (banking and insurance sector) have become the focal point (its employment share doubled from 6% on 1980 to 12% in 2003). High shares in public administration and particularly health care services characterize employment in Assen.
Clusters
Table 1.8 provides information on the main clusters in North‐Netherlands as identified by the European Cluster Observatory. The method applied is based on measuring the clusters in terms of concentration of employment, using indicators for size, specialisation and focus. In each of these categories a star can be acquired. The ʹsizeʹ measure shows whether a cluster is in the top 10% of all clusters in Europe within the

Work Package 4: “Structural Change and Globalisation”
27
same cluster category in terms of the number of employees; those in the top 10% receive a star. For specialisation the region receives a star if a cluster category has a specialisation quotient of 2 or more and for focus the top 10% of clusters which account for the largest proportion of their regionʹs total employment receive a star. Although agriculture and food are important economic sectors for the North‐Netherlands region, their relative importance is not that high that they have received a star. For that reason they did not appear in Table 1.8.
Table 1.8 ‐ Main clusters in North‐Netherlands
Cluster category
Number of employees
Size, % of total EU
employment
Specialisation Focus Number of Stars
Exports
Finance 24,886 0.35% 0.91 3.52% * Weak Construction 18,957 0.29% 0.75 2.68% * N/A Education 20,479 0.58% 1.50 2.90% * N/A Oil and gas 5,657 1.60% 4.16 0.80% ** Strong Sporting 3,752 1.76% 4.59 0.53% ** Weak Source: http://www.clusterobservatory.eu
Innovation
With respect to innovation there is large disparities between the provinces: Groningen is the science centre of the region, as it is indicated by the high score on public R&D, the provinces of Fryslân and Drenthe show a lower share of higher educated (24%) and a low score on public R&D (Wintjes, 2006)5. The presence of high tech services and the business R&D expenditures are weak points in the profile of the knowledge economy of Fryslân. The share of value added of industry in the economy and of high‐tech manufacturing is higher than for the country as a whole. The profile of Drenthe is very similar to the one of Fryslân. Again the share of high tech manufacturing is better than for the country as a whole, but overall the indicators show a low performance relative to that of the country (ibid). The presence of a still limited capacity of innovation is confirmed by the Dutch spatial policy document (“Peaks in the Delta”) where two regions were clearly identified in the regarding their potential with respect to RTDI: the East (Twente within the Triangle of universities), and the South (the brain port of Eindhoven). The main challenges for North‐Netherlands still affecting its innovation potential is to improve public and business R&D, continuing to improve the share of high‐educated human resources, especially in the Province of Drenthe and the digitalization of society and increasing the embeddedness of the present major “branch‐plant” high‐tech manufacturing.
5 Wintjes, R. (2006) Strategic Evaluation on Innovation and the Knowledge Based Economy in relation to the Structural and Cohesion Funds, for the programming period 2007‐2013. Report for the European Commission, MERIT. Maastricht.

Case Study ‐ North Netherlands (NL)
28
Work Package 4: “Structural Change and Globalisation”
29
2. Regional policy 20002006: strategy and objectives
2.1 Regional policy mix for structural change and globalisation
Since the seventies the regional economic policy in the North‐Netherlands was laid down in Integrated Structure Plans (ISPs) for North‐Netherlands. The ISPs were integral plans for restructuring the socio‐economic situation in a region: in North‐Netherlands the focus was on both locations for companies and improvement of socio‐economic infrastructures. An ISP covered a period of five years. From 1990 to 1995 market sector committees for agriculture, port activities, cities, tourism and recreation, and SMEs were involved. During the second ISP – for the period 1995‐2000 ‐ the number of committees was reduced to three: agriculture, logistics and SMEs. In this period the Northern Development Agency (NOM) executed the policy presented in the ISP. The NOM was set up by the national government to provide direct regional support by financial participation in companies. In the second half of the 1990s, due to a reformulation of the regional policy of the European Commission, the region North‐Netherlands was characterized as ‘Objective 2’ area. Also in this period the Dutch national government had installed the Committee Langman6 to develop a vision on the spatial‐economic perspective for the North‐Netherlands region. The report of the ‘Commissie Langman’ in 1997 concluded that until 2010, 43.000 additional jobs should have been created in the region in order to become a self‐sustaining region. Estimated costs to be financed by the national and European governments were about €4,5 billion; the national part of the budget which should partly be paid from the state income of the natural gas. Three policy tracks were recommended: (1) clustering of economic activities in economic centres, (2) strengthening of cities and (3) increasing the quality of rural areas. Langman invited SNN to develop their vision for the three Northern provinces and in 1998 SNN presented the document ‘Compass for the future; Space for development of North‐Netherlands’ that was mainly in accordance with the recommendations of the Committee Langman.
The recommendations of both reports were laid down in the third IPS for the period 2000 to 2006, called ‘Compass for the North’ (‘Kompas voor het Noorden’). The Compass policy program is the framework for the economic and structural change policy of the three provinces Fryslân, Groningen and Drenthe and was developed in 1999 in close collaboration with the main stakeholders in the region. Not only the three provinces, but also the Social‐Economic Advisory Council North‐Netherlands, employers’ organisations in the agricultural sector, municipalities and regional employment agencies were involved. Social partners and company representatives were also invited to give comments on draft versions of the programme. Following the three policy tracks developed by the Committee Langman, the Compass document distinguished between three categories of areas for which separate policies are developed:
1. Economic centres: Policies in this category (business innovation climate, facilitation of interaction and networking between enterprises and between the business community and the knowledge
6 This committee is well‐known as the Committee Langman (the name of the chairman of the committee)
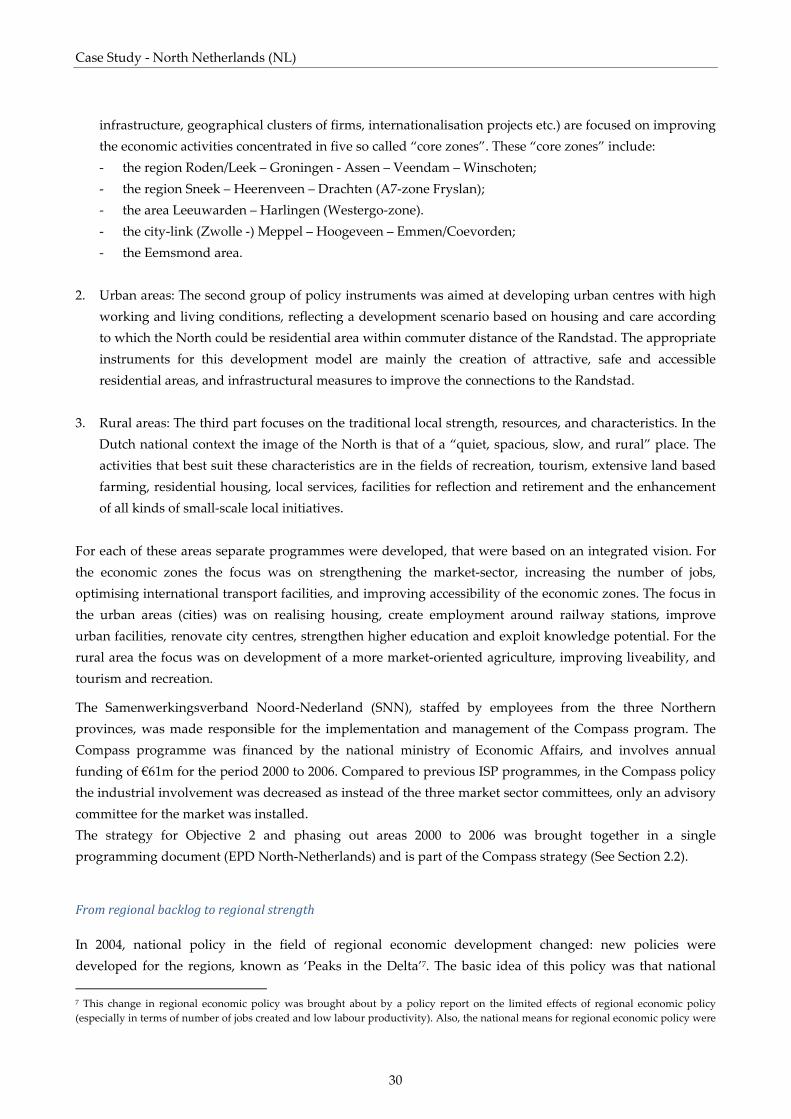
Case Study ‐ North Netherlands (NL)
30
infrastructure, geographical clusters of firms, internationalisation projects etc.) are focused on improving the economic activities concentrated in five so called “core zones”. These “core zones” include: ‐ the region Roden/Leek – Groningen ‐ Assen – Veendam – Winschoten; ‐ the region Sneek – Heerenveen – Drachten (A7‐zone Fryslan); ‐ the area Leeuwarden – Harlingen (Westergo‐zone). ‐ the city‐link (Zwolle ‐) Meppel – Hoogeveen – Emmen/Coevorden; ‐ the Eemsmond area.
2. Urban areas: The second group of policy instruments was aimed at developing urban centres with high
working and living conditions, reflecting a development scenario based on housing and care according to which the North could be residential area within commuter distance of the Randstad. The appropriate instruments for this development model are mainly the creation of attractive, safe and accessible residential areas, and infrastructural measures to improve the connections to the Randstad.
3. Rural areas: The third part focuses on the traditional local strength, resources, and characteristics. In the
Dutch national context the image of the North is that of a “quiet, spacious, slow, and rural” place. The activities that best suit these characteristics are in the fields of recreation, tourism, extensive land based farming, residential housing, local services, facilities for reflection and retirement and the enhancement of all kinds of small‐scale local initiatives.
For each of these areas separate programmes were developed, that were based on an integrated vision. For the economic zones the focus was on strengthening the market‐sector, increasing the number of jobs, optimising international transport facilities, and improving accessibility of the economic zones. The focus in the urban areas (cities) was on realising housing, create employment around railway stations, improve urban facilities, renovate city centres, strengthen higher education and exploit knowledge potential. For the rural area the focus was on development of a more market‐oriented agriculture, improving liveability, and tourism and recreation.
The Samenwerkingsverband Noord‐Nederland (SNN), staffed by employees from the three Northern provinces, was made responsible for the implementation and management of the Compass program. The Compass programme was financed by the national ministry of Economic Affairs, and involves annual funding of €61m for the period 2000 to 2006. Compared to previous ISP programmes, in the Compass policy the industrial involvement was decreased as instead of the three market sector committees, only an advisory committee for the market was installed. The strategy for Objective 2 and phasing out areas 2000 to 2006 was brought together in a single programming document (EPD North‐Netherlands) and is part of the Compass strategy (See Section 2.2).
From regional backlog to regional strength
In 2004, national policy in the field of regional economic development changed: new policies were developed for the regions, known as ‘Peaks in the Delta’7. The basic idea of this policy was that national 7 This change in regional economic policy was brought about by a policy report on the limited effects of regional economic policy (especially in terms of number of jobs created and low labour productivity). Also, the national means for regional economic policy were

Work Package 4: “Structural Change and Globalisation”
31
resources should not be used anymore for supporting regions to ‘catch up’, but for supporting the regional strengths (‘peaks’) and support (industrial) innovation.
In the first ‘Peaks’ policy document, the region North‐Netherlands was presented as a possible ‘linking pin’ between the urbanized western part of the Netherlands and North‐East Europe: this was one of the strengths of the North‐Netherlands region. All regions were asked to develop regional development plans, based on their strengths and on the basis of that, to apply in competition for national funding. This meant the end of the traditional regional economic policy in the Netherlands (with ‘fixed’ budgets for regions’ ISPs). These developments put a lot of pressure on the North‐Netherlands to review its regional economic structure and select strengths in order to fully develop its potential. In 2006, North‐Netherlands developed this programme, which was called ‘Direction North 2007‐2010’ (‘Koers Noord, 2007‐2010’). It builds on the strengths of the region North‐Netherlands. Energy, Water Technology and Sensor Technology were considered areas where North‐Netherlands could play an important role on a global market (representing the Netherlands as a whole). The specific focus in the support of these three main regional ‘peaks’ were: innovation and knowledge development in SMEs. Additionally, a number of specific sectors were earmarked that had to potentially operate in an international context; agribusiness, chemistry, commercial care, life sciences, ICT, ship building, and tourism. The ministry of Economic Affairs approved the ‘Direction North 2007‐2010’ programme and made budgets available, although significantly less than before8.
The ERDF objective 2 programme and Compass for the North
The ‘Objective 2 SPD’ was written by the three provinces of North‐Netherlands together and finished in May 2001. Both the Compass for the North programme and the SPD covered the 2000‐2006 period and adopted a common strategy and pursued the same approach to regional development. Although the two programmes have a slightly different architecture, the same broad themes are addressed. A few differences in focus are found: in the SPD no resources are available for support of agricultural sectors, whereas in the Compass programme less resources are available for knowledge, innovation and sustainability.
2.2 Overall strategy of the 20002006 Objective 2 programme
North‐Netherlands developed one programming document 2000‐2006 for both the Objective 2 and the phasing out areas. The strategy of the programme is operationalised in actions concerning the whole eligible area9. The overall objective of the programme and the priority areas are laid down in the programming document; Table 2.1 provides an overview.
cut back in 2004 to €150m. For more effective use of means, the government decided to focus on the strength of regions instead of increasing labour productivity and decreasing unemployment in lagging regions. 8 Total budgets for regional policy showed 40% decline. 9 The eligible areas of the three provinces together: before, there were three separate programmes.
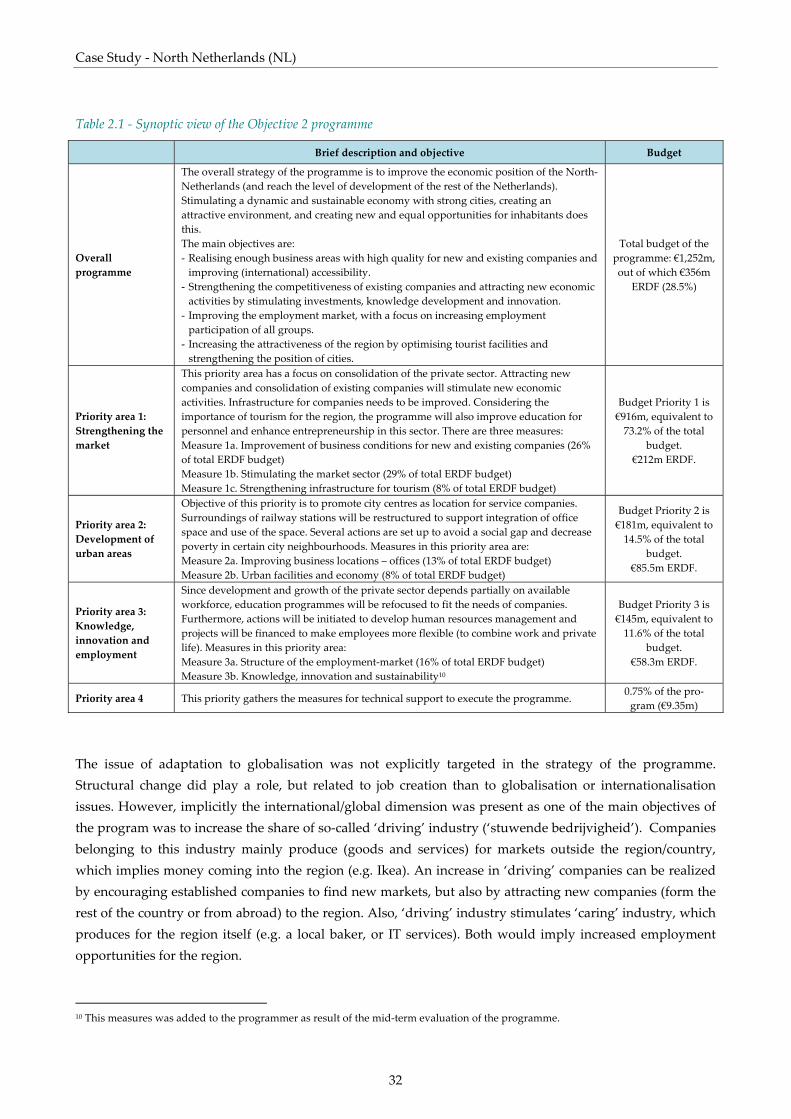
Case Study ‐ North Netherlands (NL)
32
Table 2.1 ‐ Synoptic view of the Objective 2 programme
Brief description and objective Budget
Overall programme
The overall strategy of the programme is to improve the economic position of the North‐Netherlands (and reach the level of development of the rest of the Netherlands). Stimulating a dynamic and sustainable economy with strong cities, creating an attractive environment, and creating new and equal opportunities for inhabitants does this. The main objectives are: ‐ Realising enough business areas with high quality for new and existing companies and improving (international) accessibility. ‐ Strengthening the competitiveness of existing companies and attracting new economic activities by stimulating investments, knowledge development and innovation. ‐ Improving the employment market, with a focus on increasing employment participation of all groups. ‐ Increasing the attractiveness of the region by optimising tourist facilities and strengthening the position of cities.
Total budget of the programme: €1,252m, out of which €356m
ERDF (28.5%)
Priority area 1: Strengthening the market
This priority area has a focus on consolidation of the private sector. Attracting new companies and consolidation of existing companies will stimulate new economic activities. Infrastructure for companies needs to be improved. Considering the importance of tourism for the region, the programme will also improve education for personnel and enhance entrepreneurship in this sector. There are three measures: Measure 1a. Improvement of business conditions for new and existing companies (26% of total ERDF budget) Measure 1b. Stimulating the market sector (29% of total ERDF budget) Measure 1c. Strengthening infrastructure for tourism (8% of total ERDF budget)
Budget Priority 1 is €916m, equivalent to 73.2% of the total
budget. €212m ERDF.
Priority area 2: Development of urban areas
Objective of this priority is to promote city centres as location for service companies. Surroundings of railway stations will be restructured to support integration of office space and use of the space. Several actions are set up to avoid a social gap and decrease poverty in certain city neighbourhoods. Measures in this priority area are: Measure 2a. Improving business locations – offices (13% of total ERDF budget) Measure 2b. Urban facilities and economy (8% of total ERDF budget)
Budget Priority 2 is €181m, equivalent to 14.5% of the total
budget. €85.5m ERDF.
Priority area 3: Knowledge, innovation and employment
Since development and growth of the private sector depends partially on available workforce, education programmes will be refocused to fit the needs of companies. Furthermore, actions will be initiated to develop human resources management and projects will be financed to make employees more flexible (to combine work and private life). Measures in this priority area: Measure 3a. Structure of the employment‐market (16% of total ERDF budget) Measure 3b. Knowledge, innovation and sustainability10
Budget Priority 3 is €145m, equivalent to 11.6% of the total
budget. €58.3m ERDF.
Priority area 4 This priority gathers the measures for technical support to execute the programme. 0.75% of the pro‐gram (€9.35m)
The issue of adaptation to globalisation was not explicitly targeted in the strategy of the programme. Structural change did play a role, but related to job creation than to globalisation or internationalisation issues. However, implicitly the international/global dimension was present as one of the main objectives of the program was to increase the share of so‐called ‘driving’ industry (‘stuwende bedrijvigheid’). Companies belonging to this industry mainly produce (goods and services) for markets outside the region/country, which implies money coming into the region (e.g. Ikea). An increase in ‘driving’ companies can be realized by encouraging established companies to find new markets, but also by attracting new companies (form the rest of the country or from abroad) to the region. Also, ‘driving’ industry stimulates ‘caring’ industry, which produces for the region itself (e.g. a local baker, or IT services). Both would imply increased employment opportunities for the region.
10 This measures was added to the programmer as result of the mid‐term evaluation of the programme.
Work Package 4: “Structural Change and Globalisation”
33
This focus on driving industries is illustrated by the fact that most of the industry‐supporting measures (Priority 1, Measure b) are intended for industrial sectors that mostly produce for markets outside the North‐Netherlands region. This can be either the rest of the Netherlands, but also the abroad. An example is an investment measure – the Investeringspremieregeling (in short: IPR), which was available for companies that realized over 50% of their turnover outside the North‐Netherlands. Globalisation and internationalisation also played an implicit role in the argument for including ‘infrastructure’ projects in the programme (Priority 1, Measure 1a. and Priority 2, Measure 2a). Even though the European Commission asked for a shift in focus from infrastructure measures to industry‐supporting measures, the region has chosen to continue to develop infrastructure because this is considered of core importance for the economic development of the eccentrically located region. First, economic activities were distributed over the region, limiting networking and innovation of companies and the attractiveness of the region for new companies. Therefore economic activities were planned to be concentrated in five areas, enabling economic development potential and synergy effects, i.e. the development of clusters. Second, the region is close to the north of Germany and has ports that can be further developed for (international) transit and export of goods. Infrastructure had to be at a sufficient level in order to reach the five core zones (see Section 2.1). Although even more indirectly, Priority 3 is related also to globalisation and internationalisation. An important barrier for increasing business activities was the lack of knowledgeable workforce. Measures to address these issues are for example stimulating (knowledge) networks on project bases11 and new education programmes.
Midterm evaluation of the programme
At the mid‐term stage, changes in orientation of the programme were made on the basis of the results of the mid‐term evaluation12. In December 2002 40% of EFRO funds had been committed to projects. In general the evaluators concluded that to realize economic structural change and create more jobs, the focus on ‘driving’ industry and concentrating this in five economic areas was still relevant. However, in the period 2002‐2003 the region was suffering from economic downturn, which had an impact on the relevance of specific measures. For that reason the evaluation concluded that for the second part of the programming period emphasis should be on supporting existing business. The focus should be on measures that in a structural way contribute to increasing these companies’ performance by cutting costs and/or making additional profits. This implied that Measure 1b, stimulating the market sector, should receive more emphasis. This extra support should lead to structural improvements of the market position of established companies in the region. The evaluators therefore advised to focus the set of measures on supporting companies to find new markets, stimulate their innovation processes, and improve specific management activities (export organisation, export management, marketing) in the companies.
11 Having one Objective 2 programme and not three separate programmes (as was the case in previous programming periods) makes initiating networking projects easier. 12 ECORYS‐NEI (2003) Mid term evaluatie EPD D2 Noord Nederland. In opdracht van SNN. ECORYS‐NEI, Rotterdam.

Case Study ‐ North Netherlands (NL)
34
Another important result of the evaluation was that little market‐oriented innovation was taking place in the region, which was worrisome considering the economic downturn. A combination of strengthening entrepreneurship and of the regional knowledge infrastructure was needed. However, this would require an extra stimulus in terms of funds for the knowledge‐infrastructure in North‐Netherlands. It was recommended to facilitate regional companies to apply for national and European funds for innovative activities and to develop a measure for supporting SMEs to make use of the knowledge‐infrastructure, especially by so called knowledge carriers. These recommendations of the evaluators led to an additional measure in the Objective 2 programme: Measure 3b. Enhancing Knowledge Innovation and Sustainability, to push economic policy more towards knowledge and innovation to enable companies to become more competitive and able to better operate on (inter)national markets.
The ERDF objective 2 programme and the European Social Fund
ESF funds (€498k) have been used to finance schemes that deal with employment and education. The four measures (co)‐financed by ESF funds all relate to Measure 1c aimed at improving the market sector in the economic core zones: ‘Strengthening job supply in North‐Netherlands’. Objective 2 ESF funds have been used for the scheme ‘Market‐oriented education’ (€105k). Also an ERDF financed scheme ‘Human resources management’ (HRM ‐ under Priority 3a) relates to the objective of market‐oriented education: this scheme is intended to professionalize HRM in SMEs. Objective 3 ESF funds have been used for three other schemes also under the ‘Strengthening of job supply’ part of the Compass programme: all deal with re‐integration (€393k). None of the four ESF (co)‐funded schemes were also co‐financed by ERDF. ERDF funding for schemes under Measure 1c included the measures ‘Improving the working of the labour market’ and ‘Create new employment’.
2.3 Selected fields of intervention and measures
2.3.1 Selection logic
The programme did not explicitly target the issues of structural change and globalisation. Nonetheless, in order to help companies face up to international competition, several strategies were proposed in the Objective 2 Programme, including: • Reinforcement of the expansion of firms through support for the establishment and/or extension of
enterprises (for either direct investments or remuneration costs of jobs created), and export projects (improvement of management, quality, products and processes). Schemes were intended for ‘driving’ industry only.
• The promotion of networking and create clusters of companies that are more competitive and therefore can operate on international markets: entering new markets together, coordination of product and process innovation.
• Strengthening the innovativeness of companies by projects that are focussed on increasing the number of knowledge workers in SMEs, and improving knowledge infrastructures and knowledge transfer from knowledge institutes to SMEs.
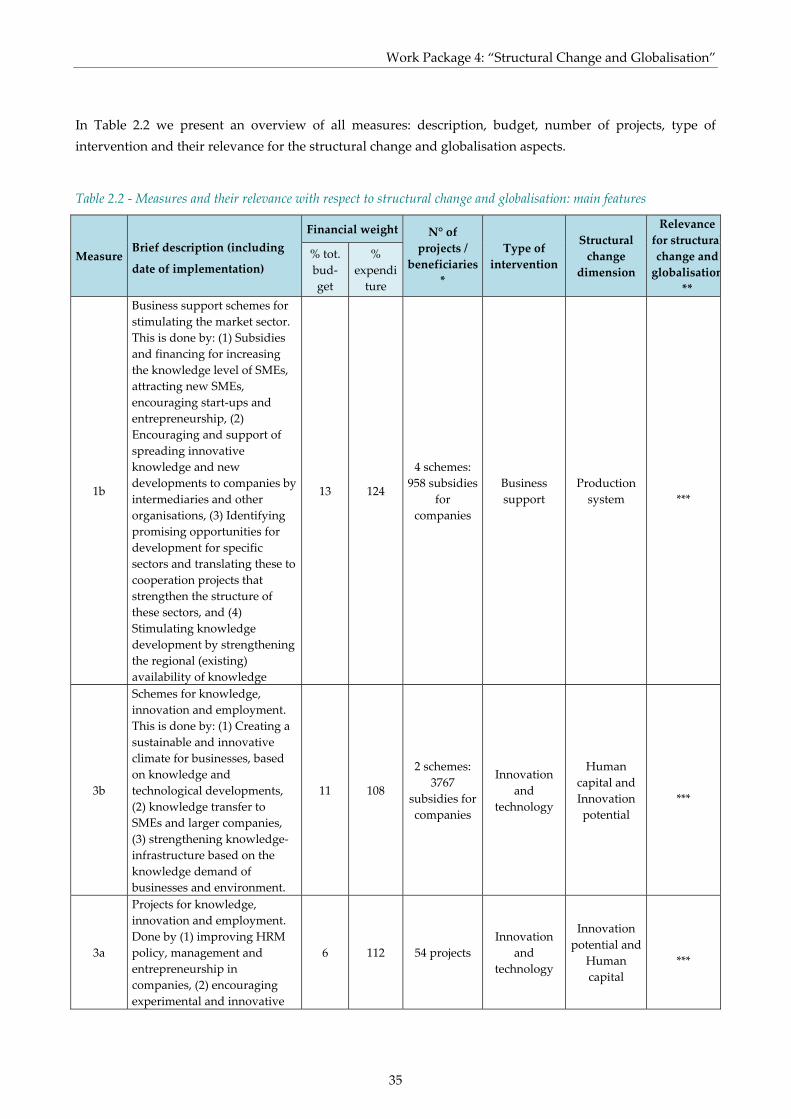
Work Package 4: “Structural Change and Globalisation”
35
In Table 2.2 we present an overview of all measures: description, budget, number of projects, type of intervention and their relevance for the structural change and globalisation aspects.
Table 2.2 ‐ Measures and their relevance with respect to structural change and globalisation: main features
Measure Brief description (including
date of implementation)
Financial weight N° of projects /
beneficiaries *
Type of intervention
Structural change
dimension
Relevance for structuralchange and globalisation
**
% tot. bud‐get
% expenditure
1b
Business support schemes for stimulating the market sector. This is done by: (1) Subsidies and financing for increasing the knowledge level of SMEs, attracting new SMEs, encouraging start‐ups and entrepreneurship, (2) Encouraging and support of spreading innovative knowledge and new developments to companies by intermediaries and other organisations, (3) Identifying promising opportunities for development for specific sectors and translating these to cooperation projects that strengthen the structure of these sectors, and (4) Stimulating knowledge development by strengthening the regional (existing) availability of knowledge
13 124
4 schemes: 958 subsidies
for companies
Business support
Production system
***
3b
Schemes for knowledge, innovation and employment. This is done by: (1) Creating a sustainable and innovative climate for businesses, based on knowledge and technological developments, (2) knowledge transfer to SMEs and larger companies, (3) strengthening knowledge‐infrastructure based on the knowledge demand of businesses and environment.
11 108
2 schemes: 3767
subsidies for companies
Innovation and
technology
Human capital and Innovation potential
***
3a
Projects for knowledge, innovation and employment. Done by (1) improving HRM policy, management and entrepreneurship in companies, (2) encouraging experimental and innovative
6 112 54 projects Innovation
and technology
Innovation potential and
Human capital
***

Case Study ‐ North Netherlands (NL)
36
initiatives that contribute to better harmonisation of supply and demand on the employment market, (3) improving and adapting education programmes to the needs of industry.
1a
Improving conditions of locations for new and existing companies. This is done by (1) realizing new industry locations in 5 economic areas and corresponding infrastructure, (2) improving existing industry areas, (3) realizing flexible housing for young entrepreneurs, and (4) Improving accessibility of economic centres (cities, office areas and business areas) by investing in infrastructure.
35 112 91 projects Infrastructure investments
Production system
**
1c
Strengthening infrastructure for tourism by (1) improvement of locations and tourist routes, (2) diversification and quality improvement of tourist attractions by physical investments, (3) widening opportunities for water sports.
18 115 36 projects Infrastructure investments
Regional specialisation
*
2a
Improving locations for businesses in urban areas – offices, by (1) development of office areas around railway stations, (2) further development of small business areas in cities, (3)
9 114 10 projects Infrastructure investments
Socio‐economic change
*
2b
Urban facilities. Sub‐measures are intended for (1) strengthening driving tourist and cultural activities in city‐centres, and (2) improving neighbourhoods of cities by stimulating entrepreneurship and vitality of the cities.
7 138 19 projects Other:
improvement of city centres
Socio‐economic change
*
** Legend: ∗ marginally relevant, ∗∗ relevant, ∗∗∗ extremely relevant * Data on expenditure and number of projects/beneficiaries from annual report 2007 SPD 2000‐2006
Relevant measures
As highlighted above the key hypothesis to be tested in this case study and the key research question relate to barriers to innovation within companies and to the availability of qualified human resources. For that reason, the core competences available in a region are an important prerequisite and so is development level
Work Package 4: “Structural Change and Globalisation”
37
of the regional innovation system. Important elements of this regional innovation system are knowledge (regional human capital) and the ability of companies to work together (within the supply‐chain and horizontal through intra‐industry collaborations) and have access to public sources of knowledge. As such innovation potential and human capital factors play a key role. The most relevant measures for the issue addressed in our hypothesis are those that fall under Priority 3 (Knowledge, innovation and employment); these measures are most likely to have a considerable impact on the region’s innovation potential and human capital/resources factors and include13: • Measure 3a. Projects for knowledge, innovation and employment (11% of total ERDF budget) • Measure 3b. Schemes for knowledge, innovation and employment (6% of total ERDF budget). At the start of the EPD North‐Netherlands 2002‐2006, Measure 3 included only human resources (3a) as main focal point (see also Table 2.1). After the mid‐term review in 2003 (ECORYS‐NEI, 2003)14 a new measure under 3 was added: 3b: Promoting of knowledge, innovation and sustainability). In the next period a reformulation of Measure 3 was made, leading to the Measures 3a and 3b as presented above. Additionally, the case study will include also the analysis of two related activities (projects and schemes) that fall under the Measures 3a and 3b, including: 1. Projects addressing a specific area of regional economic activity ‐ the energy sector ‐ as this is one of the
key areas for innovative growth for the region. We selected a number of three related projects falling under ‘Projects for knowledge, innovation and employment’, within Measure 3a in order to investigate how the regional innovation system was strengthened to support specialisation of the region towards an international promising market, i.e. the energy market. Energy (gas) has been the main source of income for the region, and this sector has known quite some international developments over the last few years, forcing the region to look at its role of energy supplier in the future. Energy became one of the five main sectors that the region has chosen to focus on in light of the new regional policy requirements (see section 2.1).
2. The Northern Innovation Support Facility (NIOF) scheme (funded under Measure 3b). This is a scheme for stimulation of strategic activities in the field of innovation cooperation, market surveys, feasibility studies and internationalisation.
In addition, Measure 1b is relevant. Its main goal is to stimulate companies in the region to invest, innovate, improve quality and export through schemes, intermediary and other organisations and knowledge supply and do this among others by stimulating the formation of clusters of companies and knowledge institutes. For that reason this measure and more specific its Investment project scheme (Investeringspremieregeling‐IPR) are also included in the case study.
13 After a review of the mid‐term evaluation in 2005 some measures were defined differently and resources shifted. Most important was shifting of budgets from Priority 2, to Priorities 1a and 3. Also, measures 3a and 3b were redefined: Measure 3a became ‘Projects for knowledge, innovation and employment’ (previously ‘Structure of the employment market’). Measure 3b became ‘Schemes for knowledge, innovation and employment’ (previously ‘Knowledge, innovation and sustainability’). 14 G39

Case Study ‐ North Netherlands (NL)
38
Measure 1a deals with the improvement of business conditions for new and existing companies (26% of total ERDF budget). On the basis of the outcomes of the Mid‐tern evaluation it was decided to extend the measure with non‐infrastructural projects. Some of these non‐infrastructural projects dealt also with innovation issues, such as the ‘Life Line’ project for the development of a medical database for North‐Netherlands, the Knowledge Intensive Network project for new companies after their start‐up phase and the project ‘Knowledge exploitation for innovation in Drenthe. However, these projects are just a fraction of all projects financed under this measure and for that reason we did not include them in the analyses of this case study.
2.3.2 Detailed description of the relevant measures
The programme complement15 provides a description of the measures including goals, background, content of the measures, and application areas for the situation in 2004. Measure 3a (Working Labour market, under Priority 3 ‘Knowledge, innovation and labour market’) has as its main goal to improve the working of the labour market by: • stimulating the human resource policy of companies to become more professional, • bringing together demand and supply in an innovative way, • improving the flow of students form vocational training centres, • increasing the education level of employees. Very important aspect in the measure is to bring companies and education centres in the region together in order to adjust education programmes to the specific qualification needs in the companies, also with respect to human resource management. These activities were stimulated through individual projects, including the projects dealing with the energy sector. Measure 3b (Stimulating of knowledge, innovation and sustainability, also under Priority 3) has as its main goal to create a sustainable and innovative climate within the business sector that is focused on knowledge and technological development, in order to improve the economic structure of the region North‐Netherlands. Sub measures included under this measure focus on innovation and sustainability of the business sector, transfer of innovative knowledge through intermediary and other organisations and stimulation of knowledge development. Not only companies and intermediary organisations but also research organisations can apply for projects under this measure. The two schemes under Measure 3b are NIOF and HRM (since reformulation of this measure after mid‐term review). The Northern Innovation Support Facility (NIOF) is the most important and also evaluated as very successful scheme that supports innovation in companies. This scheme does have a focus on specific themes and sectors. Companies can propose projects for strategic issues and other company activities. Also initiatives for technostarters or projects for clustering knowledge of companies were supported in this scheme. The Human Resource Management (HRM) scheme aimed at improving human resource policy of companies. Measure 1b is related to Measure 3b ‘Schemes for Knowledge, innovation and employment’.
15 Programmacomplement. Behorend bij het Enkelvoudig Programmeringsdocument Noord‐Nederland voor de periode 2000‐2006. Maart 2004.
Work Package 4: “Structural Change and Globalisation”
39
Where Measure 1b focuses on enhancing business in general (and its competitiveness), Measure 3b focuses on support and enhancing of companies related to knowledge, innovation and sustainability. Measure 1b ‘Stimulating market sector’ (under Priority 1. Strengthening Market Sector) has as its main goal to stimulate companies in the region to invest, innovate, improve quality and export through schemes, intermediary and other organisations and knowledge supply and do this among others by stimulating the formation of clusters of companies and knowledge institutes. The period 2000‐2006 was considered crucial for North‐Netherlands to catch up with the rest of the Netherlands and realize the same level of socio‐economic standards. Policies for the market sector intend to improve the competitiveness of companies, which should lead to increased employment. Especially existing companies and SMEs are expected to realize this growth. But SMEs in the region have many developments to deal with; new technologies, increasing international competition, increased use of ICT, a growing need for cooperation and cluster development, environmental issues, and limited availability of educated management personnel. The most important scheme within 1b is for investment projects: Investeringpremieregeling or in short: IPR. Only companies located in one of the five economic zones and considered ‘driving’ industries could apply for this subsidy.

Case Study ‐ North Netherlands (NL)
40
Work Package 4: “Structural Change and Globalisation”
41
3. Effects of the selected ERDF measures on the process of structural change and adaptation to globalisation
In this chapter an assessment is made of the contribution of the selected measures, and specific schemes and projects under these measures to improving the region’s innovation potential and human capital (Section 3.1). Secondly, the influence of the implementation of the ERDF Objective 2 program on policy learning is presented (Section 3.2).
3.1 Assessment of the structural and socioeconomic effects
This section aims at analysing the impact of the selected measures and specific projects and schemes under these measures on the structural change that took place in the region and enabled the region to face challenges arising from globalisation. The main aspects addressed relate to the impact of the measures on the region’s innovation potential and human capital. More specifically it addresses the question: Have the specific measures help to reinforce the innovation potential and improved the quality and quantity of human resources in order to improve the regional economy and making it more internationally competitive? After considering the available evidence on the implementation of the measures and scheme’s, evidence on the impact of the selected projects is presented as a result of fieldwork. On the basis of the analysis of the performance of the selected measures (Section 3.1.1) and the specific schemes (Section 3.1.2) and the selected projects (Section 3.1.3) conclusions are drawn concerning the hypothesis and the main research question of the case study is answered (Section 3.1.4). Both Sections 3.1.1 and 3.1.2 are based mainly on the available evidence, while the analyses of the projects is based mainly on fieldwork.
3.1.1 Performance of selected measures
This section presented the performance of the selected Measures: 3a and 3b. Three of the output indicators relate directly to innovation and human resources. Overall all goals set for these two measures at the start of the programme in 2000 have been met at the end of 2006. For our analysis three goals are relevant: the number of SMEs involved in innovation and in human resources projects and the number of co‐operative project involving education centres and companies. The results are more than positive: jobs created (3,828) is more than seven times as expected (519) and also the matching, the finance generated by the participants in the measures activities are far above what was set as goal at the start (€100.5 mln versus €26.3 mln).
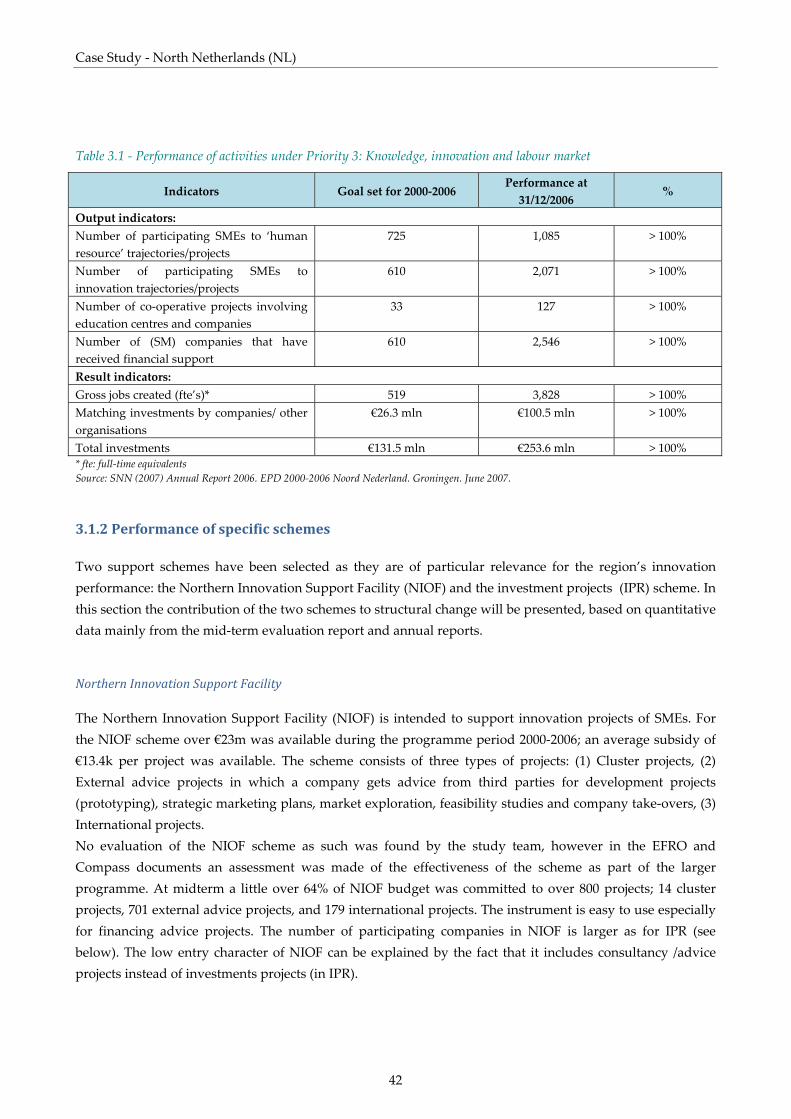
Case Study ‐ North Netherlands (NL)
42
Table 3.1 ‐ Performance of activities under Priority 3: Knowledge, innovation and labour market
Indicators Goal set for 2000‐2006 Performance at 31/12/2006
%
Output indicators: Number of participating SMEs to ‘human resource’ trajectories/projects
725 1,085 > 100%
Number of participating SMEs to innovation trajectories/projects
610 2,071 > 100%
Number of co‐operative projects involving education centres and companies
33 127 > 100%
Number of (SM) companies that have received financial support
610 2,546 > 100%
Result indicators: Gross jobs created (fte’s)* 519 3,828 > 100% Matching investments by companies/ other organisations
€26.3 mln €100.5 mln > 100%
Total investments €131.5 mln €253.6 mln > 100% * fte: full‐time equivalents Source: SNN (2007) Annual Report 2006. EPD 2000‐2006 Noord Nederland. Groningen. June 2007.
3.1.2 Performance of specific schemes
Two support schemes have been selected as they are of particular relevance for the region’s innovation performance: the Northern Innovation Support Facility (NIOF) and the investment projects (IPR) scheme. In this section the contribution of the two schemes to structural change will be presented, based on quantitative data mainly from the mid‐term evaluation report and annual reports.
Northern Innovation Support Facility
The Northern Innovation Support Facility (NIOF) is intended to support innovation projects of SMEs. For the NIOF scheme over €23m was available during the programme period 2000‐2006; an average subsidy of €13.4k per project was available. The scheme consists of three types of projects: (1) Cluster projects, (2) External advice projects in which a company gets advice from third parties for development projects (prototyping), strategic marketing plans, market exploration, feasibility studies and company take‐overs, (3) International projects. No evaluation of the NIOF scheme as such was found by the study team, however in the EFRO and Compass documents an assessment was made of the effectiveness of the scheme as part of the larger programme. At midterm a little over 64% of NIOF budget was committed to over 800 projects; 14 cluster projects, 701 external advice projects, and 179 international projects. The instrument is easy to use especially for financing advice projects. The number of participating companies in NIOF is larger as for IPR (see below). The low entry character of NIOF can be explained by the fact that it includes consultancy /advice projects instead of investments projects (in IPR).
Work Package 4: “Structural Change and Globalisation”
43
The mid‐term review also assesses the contribution of industry support measures to economic structural change; by December 2002 total investments through NIOF was €47.2 million. The NIOF scheme had a high level of private co‐finance; participating companies contributed about 66% of the total investment costs of the projects. NIOF was expected to lead to 90 new jobs by the end of the programme period (2% of the total of new jobs to be created with the Compass programme). NIOF together with the Human Resource scheme were responsible for 308 of the 3,828 full‐time equivalents ‐ fte’s (see Table 3.1) created by the all schemes under Measures 3a and 3b together. Due to its success, it was decided in 2006 to extend the NIOF scheme. An extra ERDF contribution of €3m was made available to finance the new projects for 2007.
Investment Projects Scheme (IPR)
Already since 1968, a scheme for investment projects (IPR) existed for North‐Netherlands. In 2000 it became part of the Compass programme and was partly financed by EFRO resources16. In total over €125m was available for this scheme for the period 2000‐2006. Companies can apply for a subsidy for investments (buildings, sustainable processes) or for employee salaries or positions that were created by the investment project. The investment projects can be for both establishment and extension of a ‘driving’ company (or a head office, pilot factory or lab) in the eligible region. For establishment of a company the subsidy amount was €240k and for extension of a company €120k. IPR is actually an instrument that tries to influence an entrepreneur in not only choosing a location for his company but also the scope and/or timing of the investments. In the North‐Netherlands five key zones for economic growth were designated. IPR was only applicable for investment projects in these areas. Of course, substantial direct private investments are required to get subsidy (matching requirement). An evaluation of IPR 1998‐200217 showed that in the period 2000‐2002 about 1,200 jobs were created as a result of IPR investment projects. Average public costs per job created is €12,833. Regional policy makers consider IPR a good instrument for influencing investment behaviour of companies; furthermore it is a very ‘welcoming’ scheme for new companies and investors. The availability of these subsidies implies that the region stays on the radar of international investors as an option for a new location. Results of IPR that are mentioned in the evaluation include: • entrepreneurs consider IPR the main investment impulse scheme; other scheme’s have significantly less
priority; • jobs created in companies that applied for IPR has grown with 43% in the period 1998 to 2004 which
means IPR also strengthens employment figures in the economic areas; • the most important reason for selection of a specific location for a company in IPR‐projects is the
availability of such location or the extension potential of the location and the location’s position towards the market and other places of residence of the company;
16 Only IPR Decentraal is considered in this report, because this is implemented at regional level 17 Evaluation IPR 1998‐2002, Buck Consultants International, July 2004
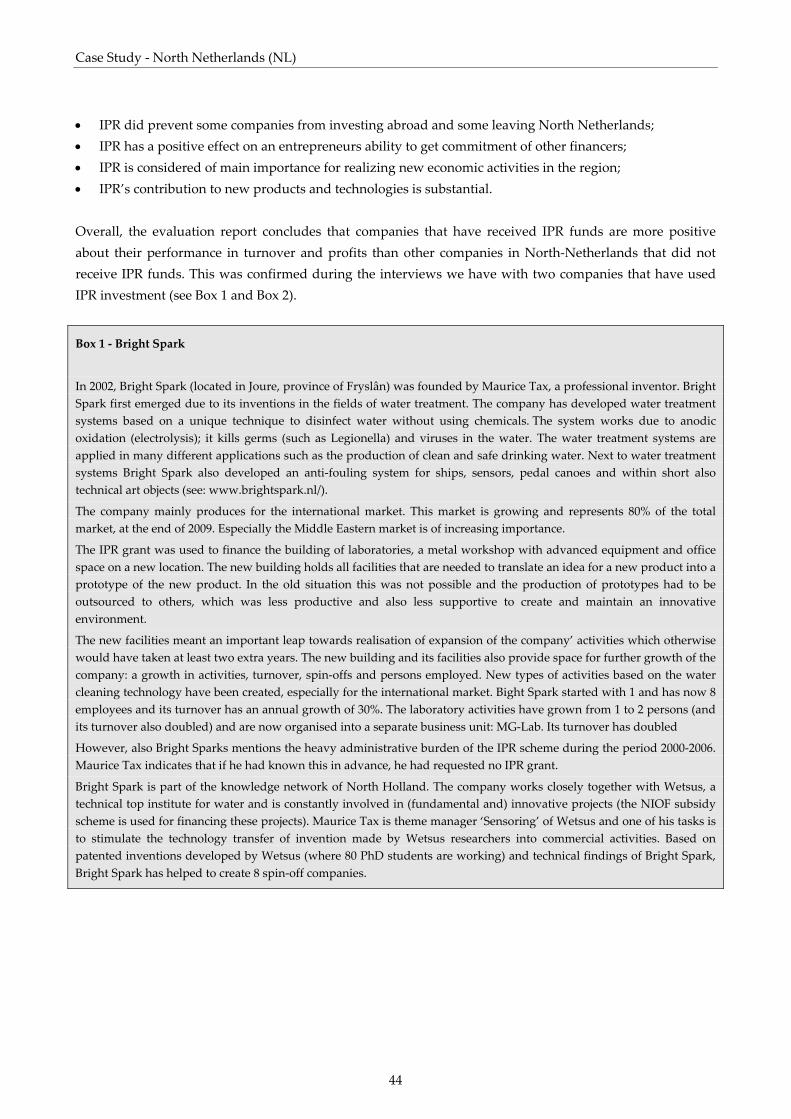
Case Study ‐ North Netherlands (NL)
44
• IPR did prevent some companies from investing abroad and some leaving North Netherlands; • IPR has a positive effect on an entrepreneurs ability to get commitment of other financers; • IPR is considered of main importance for realizing new economic activities in the region; • IPR’s contribution to new products and technologies is substantial. Overall, the evaluation report concludes that companies that have received IPR funds are more positive about their performance in turnover and profits than other companies in North‐Netherlands that did not receive IPR funds. This was confirmed during the interviews we have with two companies that have used IPR investment (see Box 1 and Box 2).
Box 1 ‐ Bright Spark
In 2002, Bright Spark (located in Joure, province of Fryslân) was founded by Maurice Tax, a professional inventor. Bright Spark first emerged due to its inventions in the fields of water treatment. The company has developed water treatment systems based on a unique technique to disinfect water without using chemicals. The system works due to anodic oxidation (electrolysis); it kills germs (such as Legionella) and viruses in the water. The water treatment systems are applied in many different applications such as the production of clean and safe drinking water. Next to water treatment systems Bright Spark also developed an anti‐fouling system for ships, sensors, pedal canoes and within short also technical art objects (see: www.brightspark.nl/).
The company mainly produces for the international market. This market is growing and represents 80% of the total market, at the end of 2009. Especially the Middle Eastern market is of increasing importance.
The IPR grant was used to finance the building of laboratories, a metal workshop with advanced equipment and office space on a new location. The new building holds all facilities that are needed to translate an idea for a new product into a prototype of the new product. In the old situation this was not possible and the production of prototypes had to be outsourced to others, which was less productive and also less supportive to create and maintain an innovative environment.
The new facilities meant an important leap towards realisation of expansion of the company’ activities which otherwise would have taken at least two extra years. The new building and its facilities also provide space for further growth of the company: a growth in activities, turnover, spin‐offs and persons employed. New types of activities based on the water cleaning technology have been created, especially for the international market. Bight Spark started with 1 and has now 8 employees and its turnover has an annual growth of 30%. The laboratory activities have grown from 1 to 2 persons (and its turnover also doubled) and are now organised into a separate business unit: MG‐Lab. Its turnover has doubled
However, also Bright Sparks mentions the heavy administrative burden of the IPR scheme during the period 2000‐2006. Maurice Tax indicates that if he had known this in advance, he had requested no IPR grant.
Bright Spark is part of the knowledge network of North Holland. The company works closely together with Wetsus, a technical top institute for water and is constantly involved in (fundamental and) innovative projects (the NIOF subsidy scheme is used for financing these projects). Maurice Tax is theme manager ‘Sensoring’ of Wetsus and one of his tasks is to stimulate the technology transfer of invention made by Wetsus researchers into commercial activities. Based on patented inventions developed by Wetsus (where 80 PhD students are working) and technical findings of Bright Spark, Bright Spark has helped to create 8 spin‐off companies.
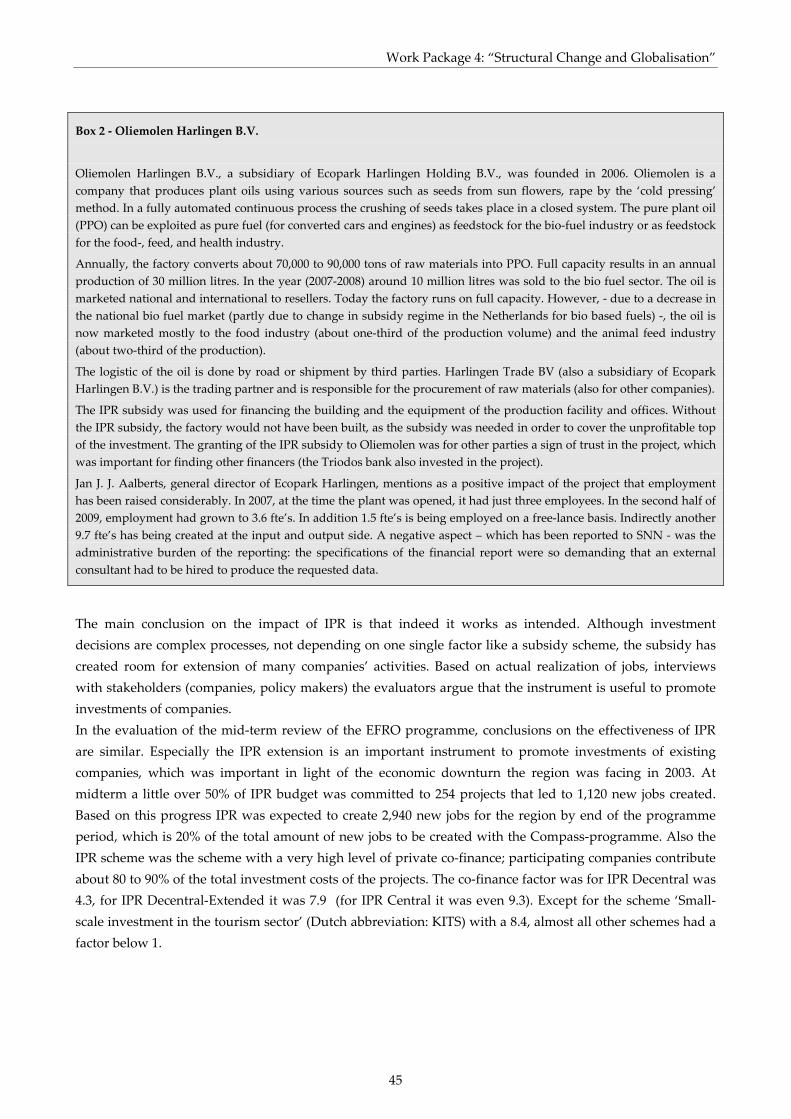
Work Package 4: “Structural Change and Globalisation”
45
Box 2 ‐ Oliemolen Harlingen B.V.
Oliemolen Harlingen B.V., a subsidiary of Ecopark Harlingen Holding B.V., was founded in 2006. Oliemolen is a company that produces plant oils using various sources such as seeds from sun flowers, rape by the ‘cold pressing’ method. In a fully automated continuous process the crushing of seeds takes place in a closed system. The pure plant oil (PPO) can be exploited as pure fuel (for converted cars and engines) as feedstock for the bio‐fuel industry or as feedstock for the food‐, feed, and health industry.
Annually, the factory converts about 70,000 to 90,000 tons of raw materials into PPO. Full capacity results in an annual production of 30 million litres. In the year (2007‐2008) around 10 million litres was sold to the bio fuel sector. The oil is marketed national and international to resellers. Today the factory runs on full capacity. However, ‐ due to a decrease in the national bio fuel market (partly due to change in subsidy regime in the Netherlands for bio based fuels) ‐, the oil is now marketed mostly to the food industry (about one‐third of the production volume) and the animal feed industry (about two‐third of the production).
The logistic of the oil is done by road or shipment by third parties. Harlingen Trade BV (also a subsidiary of Ecopark Harlingen B.V.) is the trading partner and is responsible for the procurement of raw materials (also for other companies).
The IPR subsidy was used for financing the building and the equipment of the production facility and offices. Without the IPR subsidy, the factory would not have been built, as the subsidy was needed in order to cover the unprofitable top of the investment. The granting of the IPR subsidy to Oliemolen was for other parties a sign of trust in the project, which was important for finding other financers (the Triodos bank also invested in the project).
Jan J. J. Aalberts, general director of Ecopark Harlingen, mentions as a positive impact of the project that employment has been raised considerably. In 2007, at the time the plant was opened, it had just three employees. In the second half of 2009, employment had grown to 3.6 fte’s. In addition 1.5 fte’s is being employed on a free‐lance basis. Indirectly another 9.7 fte’s has being created at the input and output side. A negative aspect – which has been reported to SNN ‐ was the administrative burden of the reporting: the specifications of the financial report were so demanding that an external consultant had to be hired to produce the requested data.
The main conclusion on the impact of IPR is that indeed it works as intended. Although investment decisions are complex processes, not depending on one single factor like a subsidy scheme, the subsidy has created room for extension of many companies’ activities. Based on actual realization of jobs, interviews with stakeholders (companies, policy makers) the evaluators argue that the instrument is useful to promote investments of companies. In the evaluation of the mid‐term review of the EFRO programme, conclusions on the effectiveness of IPR are similar. Especially the IPR extension is an important instrument to promote investments of existing companies, which was important in light of the economic downturn the region was facing in 2003. At midterm a little over 50% of IPR budget was committed to 254 projects that led to 1,120 new jobs created. Based on this progress IPR was expected to create 2,940 new jobs for the region by end of the programme period, which is 20% of the total amount of new jobs to be created with the Compass‐programme. Also the IPR scheme was the scheme with a very high level of private co‐finance; participating companies contribute about 80 to 90% of the total investment costs of the projects. The co‐finance factor was for IPR Decentral was 4.3, for IPR Decentral‐Extended it was 7.9 (for IPR Central it was even 9.3). Except for the scheme ‘Small‐scale investment in the tourism sector’ (Dutch abbreviation: KITS) with a 8.4, almost all other schemes had a factor below 1.

Case Study ‐ North Netherlands (NL)
46
3.1.3 Contribution of selected projects to structural change and globalisation
Two projects within Measure 3a were initiated to build a strong energy cluster, attract new companies, create knowledge infrastructure, realize sustainable energy etc. This specialisation should make North‐Netherlands an important energy supplier and innovator and internationally known and attractive for foreign energy industry. The Dutch national Innovation Platform has identified a number of key‐fields as ‘combinations of business and knowledge that can compete on an international level in a sustainable growth market’. Innovation is of crucial importance for the successful development of key fields. The region North Netherlands in answer to the request of the national government to formulate key areas in order to regionally implement the ‘Peaks in the Delta’ (Pieken in de Delta) innovation policy has selected energy as one of the three key fields that are of highest importance for the region. The other two are the water cluster and sensor technology. The largest part of the Dutch activities in the field of mining, transport, treatment, trade and research in the field of natural gas is concentrated in the Northern Netherlands. In addition there are important activities in the field of electricity production and distribution and sustainable energy. Also the infrastructure for energy distribution and related facilities are highly developed. Most important are the number of large players (Nederlandse Aardolie Maatschapij BV, N.V. Nederlandse Gasunie, Essent, Nuon, Electrabel) that form the centre of the energy cluster with dedicated suppliers, outsourcers and spin‐offs. Also there are strong network links with energy companies, within and outside the Netherlands. Apart from this natural gas and electricity cluster, there are also a number of initiatives in the region for the development of innovative sustainable energy concepts. Research groups in the region have provided important inputs for the national Programme’ Energy Transition, of the national Ministry of Economic Affairs.
Energy Valley
In 2003, due to the internationalisation of the energy market and subsequent EU legislation it was decided that Gasunie had to be split in a trading and a transporting part. This split also had some negative effects, as 250 persons lost their jobs. Also in the same period, the energy debate and issue like climate change and green house gases and energy security became important political issues. This was the starting point of Energy Valley in 2003: its main challenge was to keep the energy activities and capabilities within the region and make energy a key growth sector for the region for creating new activities. On 1 July 2005, N.V. Nederlandse Gasunie was demerged into two autonomous corporate entities. The separation was made mandatory through EU Directives concerning liberalisation of the European gas market. The companyʹs transport and infrastructure activities were continued under the name N.V. Nederlandse Gasunie, or Gasunie for short. Trading, purchases and sales activities were continued by GasTerra B.V. The relevant actors ‐ companies and other organisations involved in energy research and development, product and distribution ‐ showed that they were able to submit qualitatively sound funding applications relatively fast. As a result, the budget within this action category was allocated to projects quite rapidly; demonstration the high level of organisation within the energy sector. The Northern Netherlands Technology Centre (TCNN), as a non‐profit organisation focussing on economic development in the

Work Package 4: “Structural Change and Globalisation”
47
Northern Netherlands by innovation and cooperation, acted as lead manager for a number of projects and by handling in this respect the administrative and financial aspects of these projects. Energy Valley was set up in order to18: • contribute to the growth of new key technologies in the region; • create awareness in the SME sector of the need for innovation in clusters and the benefits to be derived
from it; • stimulate that more SMEs are able to master important aspects of innovation and knowledge
management; • have more SMEs involved in networks and clusters focusing on business/market growth; • have more companies and knowledge centres participating in regional partnerships; • realise a significant increase in the level of cooperation between regional parties on the supply and
demand sides, so that new knowledge is used as a business development tool more quickly; • decrease the reliance on alliances outside the region and the growth of a regional business identity. Energy Valley is a public‐private partnership in which 16 organisations participate: provinces, municipalities, research organisations and energy companies (and recently Groningen Seaports) , mainly financed by ERDF and regional funds. The Energy valley management (15 persons are employed) has two main tasks: • communication and clustering of energy activities within the region North‐Netherlands (5 persons). It is
a network organisation that brings all relevant parties together, large firms and SMEs and not only producers and suppliers of energy but also those important for the logistics were included (Groningen Seaport). Energy Valley developed and implemented a strategy for the energy sector in North‐Netherlands.
• realise ‐ together with company and other organisations ‐ opportunities (10 persons). In total in the region 300 energy projects are running. The energy projects are funded by SNN (including those by ERDF funds) and NOM. Energy Valley is involved in 100 of them. The budget of projects covered by EV was for 45% subsidies (ERDF, Compass) and 55% companies.
The 300 energy projects have a total budget of €20 billion: 75% is for the so‐called gas‐roundabout (production and distribution, including development of seaports) and 25% for the production of energy based on renewable sources (wind, biomass, etc) Almost all projects were so successful that a follow‐up project is intended. In most cases this follow‐up has already taken place or is currently in full swing. In the case of some projects, there are insufficient funds for the time being for a follow‐up. The contribution of the private sector was more than two and a half times the budgeted amount. An important effect is also that it accelerated the merger of the chemical and the energy sectors, mostly visible in the integration of the Energy and Chemical park, that is managed by Groningen Seaports (Eemshaven and Delfzijl). The chemical and metal industries in these ports are focused at ‘greening’ their production processes and physically are clustered together with other companies at the site as they mutually produce and use each other energy ‘left overs‘ (for instance from rest streams). So the energy focus is getting increasingly important and is linking the different economic activities on the site.
18 ERDF Innovative Actions 2000‐2006 Final Report (2009) Province of Groningen
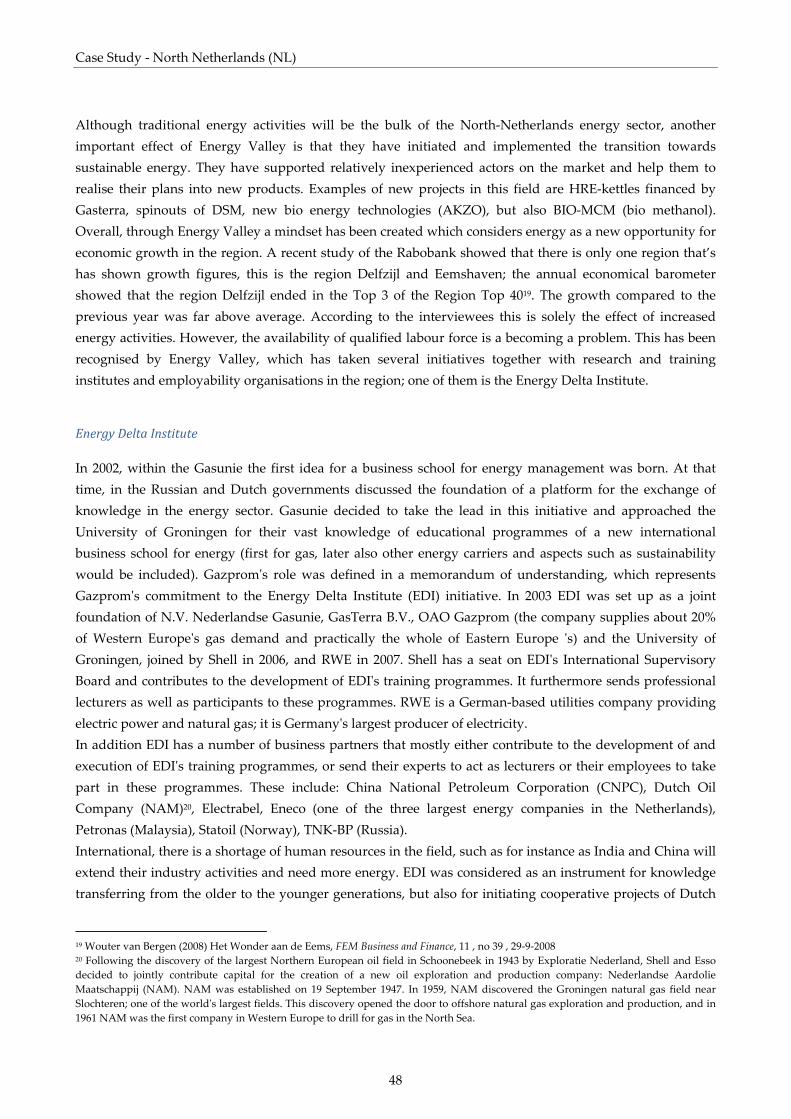
Case Study ‐ North Netherlands (NL)
48
Although traditional energy activities will be the bulk of the North‐Netherlands energy sector, another important effect of Energy Valley is that they have initiated and implemented the transition towards sustainable energy. They have supported relatively inexperienced actors on the market and help them to realise their plans into new products. Examples of new projects in this field are HRE‐kettles financed by Gasterra, spinouts of DSM, new bio energy technologies (AKZO), but also BIO‐MCM (bio methanol). Overall, through Energy Valley a mindset has been created which considers energy as a new opportunity for economic growth in the region. A recent study of the Rabobank showed that there is only one region that’s has shown growth figures, this is the region Delfzijl and Eemshaven; the annual economical barometer showed that the region Delfzijl ended in the Top 3 of the Region Top 4019. The growth compared to the previous year was far above average. According to the interviewees this is solely the effect of increased energy activities. However, the availability of qualified labour force is a becoming a problem. This has been recognised by Energy Valley, which has taken several initiatives together with research and training institutes and employability organisations in the region; one of them is the Energy Delta Institute.
Energy Delta Institute
In 2002, within the Gasunie the first idea for a business school for energy management was born. At that time, in the Russian and Dutch governments discussed the foundation of a platform for the exchange of knowledge in the energy sector. Gasunie decided to take the lead in this initiative and approached the University of Groningen for their vast knowledge of educational programmes of a new international business school for energy (first for gas, later also other energy carriers and aspects such as sustainability would be included). Gazpromʹs role was defined in a memorandum of understanding, which represents Gazpromʹs commitment to the Energy Delta Institute (EDI) initiative. In 2003 EDI was set up as a joint foundation of N.V. Nederlandse Gasunie, GasTerra B.V., OAO Gazprom (the company supplies about 20% of Western Europeʹs gas demand and practically the whole of Eastern Europe ʹs) and the University of Groningen, joined by Shell in 2006, and RWE in 2007. Shell has a seat on EDIʹs International Supervisory Board and contributes to the development of EDIʹs training programmes. It furthermore sends professional lecturers as well as participants to these programmes. RWE is a German‐based utilities company providing electric power and natural gas; it is Germanyʹs largest producer of electricity. In addition EDI has a number of business partners that mostly either contribute to the development of and execution of EDIʹs training programmes, or send their experts to act as lecturers or their employees to take part in these programmes. These include: China National Petroleum Corporation (CNPC), Dutch Oil Company (NAM)20, Electrabel, Eneco (one of the three largest energy companies in the Netherlands), Petronas (Malaysia), Statoil (Norway), TNK‐BP (Russia). International, there is a shortage of human resources in the field, such as for instance as India and China will extend their industry activities and need more energy. EDI was considered as an instrument for knowledge transferring from the older to the younger generations, but also for initiating cooperative projects of Dutch
19 Wouter van Bergen (2008) Het Wonder aan de Eems, FEM Business and Finance, 11 , no 39 , 29‐9‐2008 20 Following the discovery of the largest Northern European oil field in Schoonebeek in 1943 by Exploratie Nederland, Shell and Esso decided to jointly contribute capital for the creation of a new oil exploration and production company: Nederlandse Aardolie Maatschappij (NAM). NAM was established on 19 September 1947. In 1959, NAM discovered the Groningen natural gas field near Slochteren; one of the worldʹs largest fields. This discovery opened the door to offshore natural gas exploration and production, and in 1961 NAM was the first company in Western Europe to drill for gas in the North Sea.

Work Package 4: “Structural Change and Globalisation”
49
companies with foreign companies. The North‐Netherlands’ strength in the energy fields was considerable; not only in gas production and distribution, but also in dedicated the suppliers such as producers of energy production facilities. EDI in its initial stage was funded by EFRO, this was necessary to set up such a large scale organisation; now it runs on private money only. EDIs core activity is training; annually about 200 persons participate in training programs. Now they are extending their activities towards research; they want to become an international authority and knowledge centre in the field of energy management. Later also constancy will become an activity. Recently the Energy Business Campus initiative started especially focused at providing a structure for the start and early growth of SME in the field, by offering facilities such as office space, campus facilities and also start‐ups funds. In this way EDI contributes to the formation and growth of the North‐Netherlands energy cluster.
3.1.4 Conclusions
In this section we draw general conclusions thereby reflecting on the central hypothesis of the case study and answering the main research question. The central hypothesis is: The innovation system of Objective 2 regions may suffer from missing innovation drivers on the demand side. Barriers to innovation are determined by a lack of absorptive capacity by local firms and path‐dependency from existing technological trajectories. On the basis of the results dealing with the measures, schemes and projects that all deal with innovation and human resources and which are presented above, we come to the following conclusions. As more than the targeted number of SMEs has been participating in the schemes under Priority 3 it could be concluded that there is sufficient absorptive capacity as these companies have been able writing successful project proposals which asks some minimum level of knowledge of the subject and the projects itself have contributed to an increase in the innovation potential in SMEs. The subsidies have provided the necessary means for companies to expand their activities and have facilitated growth. The participation grade of SMEs in human resource projects is far above expectations (Table 3.1). It can be expected that barriers to economic growth such as the low education level of personnel have decreased due to the cooperative projects of companies with regional education centres. With respect to the barrier of path‐dependency we would conclude for the energy field that new trajectories have been developed and been used. We refer to the projects in the field of energy sources other than the fossil fuels, such as biomass and wind energy. The decision of regional authorities to select energy as a key area for growth for the North‐Netherlands has worked well; ERDF funds have helped in implementing this policy successfully. Although we have gathered most information of only two ERDF ‐funded projects, the interviewees provided their data on the two projects from within the broader framework of the energy cluster, providing ground for our conclusion. The focus on energy in the North‐Netherlands economic policy ‘Compass for the North’ (‘Kompas voor het Noorden’), midterm revised based on the chance in national regional policy proved to be rather successful and has led to a relative strong increase in employment in the region.
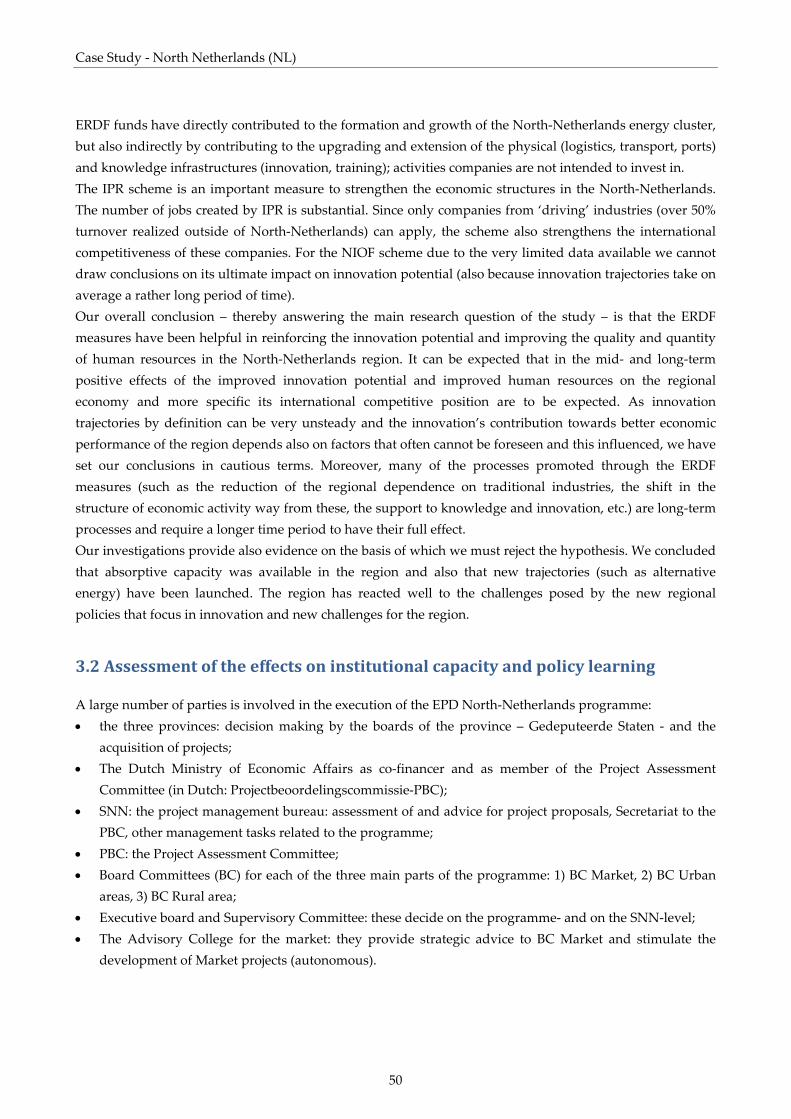
Case Study ‐ North Netherlands (NL)
50
ERDF funds have directly contributed to the formation and growth of the North‐Netherlands energy cluster, but also indirectly by contributing to the upgrading and extension of the physical (logistics, transport, ports) and knowledge infrastructures (innovation, training); activities companies are not intended to invest in. The IPR scheme is an important measure to strengthen the economic structures in the North‐Netherlands. The number of jobs created by IPR is substantial. Since only companies from ‘driving’ industries (over 50% turnover realized outside of North‐Netherlands) can apply, the scheme also strengthens the international competitiveness of these companies. For the NIOF scheme due to the very limited data available we cannot draw conclusions on its ultimate impact on innovation potential (also because innovation trajectories take on average a rather long period of time). Our overall conclusion – thereby answering the main research question of the study – is that the ERDF measures have been helpful in reinforcing the innovation potential and improving the quality and quantity of human resources in the North‐Netherlands region. It can be expected that in the mid‐ and long‐term positive effects of the improved innovation potential and improved human resources on the regional economy and more specific its international competitive position are to be expected. As innovation trajectories by definition can be very unsteady and the innovation’s contribution towards better economic performance of the region depends also on factors that often cannot be foreseen and this influenced, we have set our conclusions in cautious terms. Moreover, many of the processes promoted through the ERDF measures (such as the reduction of the regional dependence on traditional industries, the shift in the structure of economic activity way from these, the support to knowledge and innovation, etc.) are long‐term processes and require a longer time period to have their full effect. Our investigations provide also evidence on the basis of which we must reject the hypothesis. We concluded that absorptive capacity was available in the region and also that new trajectories (such as alternative energy) have been launched. The region has reacted well to the challenges posed by the new regional policies that focus in innovation and new challenges for the region.
3.2 Assessment of the effects on institutional capacity and policy learning
A large number of parties is involved in the execution of the EPD North‐Netherlands programme: • the three provinces: decision making by the boards of the province – Gedeputeerde Staten ‐ and the
acquisition of projects; • The Dutch Ministry of Economic Affairs as co‐financer and as member of the Project Assessment
Committee (in Dutch: Projectbeoordelingscommissie‐PBC); • SNN: the project management bureau: assessment of and advice for project proposals, Secretariat to the
PBC, other management tasks related to the programme; • PBC: the Project Assessment Committee; • Board Committees (BC) for each of the three main parts of the programme: 1) BC Market, 2) BC Urban
areas, 3) BC Rural area; • Executive board and Supervisory Committee: these decide on the programme‐ and on the SNN‐level; • The Advisory College for the market: they provide strategic advice to BC Market and stimulate the
development of Market projects (autonomous).

Work Package 4: “Structural Change and Globalisation”
51
The mid‐term evaluation showed that the institutional capacity involved in the management and decision making of the program and more specifically in the preparatory and project assessment phases could be improved21. In the preparatory phase of the project proposal more efforts should be put in informing the companies in the region on the programme and secondly on bringing companies together in demand‐driven cluster projects. Special task forces were proposed in which industrial organisations, individual companies, Chambers of Commerce, and knowledge brokers such as Syntens should participate. Also industrial organisations such as industry associations for specific industrial sectors and employers‘ organisations were asked to take their responsibility in developing cluster projects. There were some lacks in the communication between the provincial and the national level during the project assessment process. Moreover, in general a need was felt to strengthen the role of the Ministry of Economic Affairs in the decision‐making on the projects. There was a need for earlier consultation with representatives of the Ministry of Economic Affairs on the minimum quality of projects for being eligible for funding. Also provinces were asked not to decide on a project as a whole, but only to decide to co‐finance the project or not. SNN was advised to use the annual reporting only for financial overviews and a general overview of the results. It was advised to spend some efforts in describing in the Compass programme of what are exactly the criteria for financial support for projects that are funded by the national funds for the Compass programme. In order to increase the independency of the PBC it was recommended that one or two external independent experts should be included in the PBC. Also the teams that are meant to perform the approved projects should be informed more in detail about the arguments why their project had been approved in order to give them a better picture of the more general goals of the programme in which they are going to operate. The recommendations of the mid‐term review have been accepted and most of them have resulted in concrete actions, according to the update of the mid‐term review22. With respect to globalisation and internationalisation, an important conclusion in the mid‐term review of the Compass and ERDF programme was that schemes for strengthening the competitiveness of existing companies are very important. Most relevant are support measures that help to lower costs (especially personnel and production costs) or measures that contribute to increasing profits (especially new markets and new product development). The main rationale of the latter is that new markets decrease vulnerability of companies. This meant that measures for export and development of new products became more relevant after mid‐term review of the programme. Companies can now apply – also in clusters – for export stimulation projects. Because of the low innovation level in North‐Netherlands emphasis was put on demand‐oriented innovation initiatives, strengthening knowledge infrastructures and increasing the number of knowledge workers. There also has been considerable policy learning as – on the basis of the mid‐term review and the assessment of all instruments ‐ it was decided to continue only these schemes that were successful. Also we can conclude that internationalisation has become an issue for regional policy makers. Now it is explicitly mentioned in the mission statement of SNN that it has as its main goal to stimulate economic growth in the North‐Netherlands region in order to improve competitive position of regional companies
21 ECORYS‐NEI (2003) Mid term evaluatie EPD D2 Noord Nederland. In opdracht van SNN. ECORYS‐NEI, Rotterdam. 22 ECORYS (2005) Update MTE EPD Noord Nederland 2000‐2006. In opdracht van SNN. 13 december 2005. ECORYS Rotterdam.

Case Study ‐ North Netherlands (NL)
52
within the Netherlands and in Europe. Also SNN has improved its services towards companies that want to apply for regional funds, having now only one counter per subject.
Work Package 4: “Structural Change and Globalisation”
53
4. Conclusions: key findings and main message
Key findings
In this section we synthesises our findings concerning the relevance of the ERDF funds for improving the innovation potential and the level human resources in tackling structural change and enabling adaptation to globalisation in North‐Netherlands. We do this by answering the following five questions
1. What is the relevance of structural change and globalisation challenge for the region and regional policy? How
ERDF interventions fit in the regional policy context?
The structural change and globalisation challenge has – although indirectly ‐ been relevant for the regional socio‐economic policy. We conclude this as business support schemes have been the main measures through which the policy has been implemented; they aim at strengthening regional companies and thus make them more competitive on the regional, but also national and international scale. At the start of the program its main goals was to raise employment in the region (and reach at least the national level of employment). However, in recent years internationalisation and improving economic infrastructure has become an explicit goal of regional policy, partly forced to this by national regional policy ‘Peaks in the Delta’ (‘Pieken in de Delta’). ERDF intervention directly relates to this because it is an integral part of the Compass (Kompas) and Direction (Koers) policies; here EU, national and regional policies come together and get integrated.
2. To what extent did the ERDF intervention(s) concentrate on the main dimension of structural change: regional
specialisation?
Considering the business support measures we can conclude that ERDF interventions concentrate on the main dimension of regional specialisation. Within measure 3a several projects have been initiated in order to stimulate regional clusters; those focusing on energy were successful (those on the metal sector were less successful). Availability of human resources and innovation/knowledge transfer are very important conditions for successful working clusters and also have been initiated, but take much more time in order to reach goals (new qualifications of workers, new products/processes/services). Also formation of clusters and networking and cooperation between SME’s and large firms are success factors for economic sectors; they were addressed very successfully for the energy sector.
3. How did the ERDF intervention(s) analysed contribute to regional structural change in 20002006?
With respect to the two ERDF funded schemes that have been analysed in our case study – IPR and NIOF – it can be concluded that they might have contributed to regional structural change. IPR has subsidized projects that stimulated companies to settle in economic key zones. NIOF has subsidised SME’s in order to become more competitive.

Case Study ‐ North Netherlands (NL)
54
4. What are the key findings concerning the respective effectiveness of the policy instruments activated in support to
structural change in the region?
As the ERDF based programme for North‐Netherlands, the Compass policy was mainly focused on employment effects, the evaluation data available also focus on these effects. During the mid‐term review in 2003 it was concluded that with the created 4,510 fte’s (full time equivalent) at that moment, the goal of 9,500 – 17,700 extra jobs in 2006 not yet has been reached, but that the program was rather good progressing. However, due to the changing economic circumstance in which the program is being executed it was uncertain if all parts of the program would be implemented.
5. What are the key findings concerning the qualitative effects of the programme (political, policy and other
qualitative “added value”)?
The ERDF is an integral part of regional policy (Compass Policy). Regional policy makers in North‐Netherlands aimed at creating maximal synergy between national and international regional policy with their region’s regional policy. Although globalisation and internationalisation were not an explicit issue mentioned in the regional policy documents, this became more and more important as in the course of the programme goals such as stimulating exports and development of new products for markets outside the region became more relevant. Also it was explicitly mentioned in the mission statement of SNN that it has as its main goal to stimulate economic growth in the North‐Netherlands region in order to improve competitive position of regional companies within the Netherlands and in Europe.
Main message
In the North‐Netherlands region, as in many other regions throughout Europe, structural change of its economy and the globalisation challenges have been relevant goals for regional socio‐economic policies. The business support schemes evaluated in this case study have been important measures through which these policies have been implemented; they aim at strengthening regional companies and thus make them more competitive on the regional, but also national and international scale. At the start of the program its main goals was to raise the employment level in the region (and reach at least the national level). In recent years internationalisation and improving economic infrastructure became explicit goals of regional policy and ERDF intervention was directly related to this; here EU, national and regional policies come together and get integrated. The North‐Netherlands region has been successful in taking up the new challenge of focusing on growth sectors (instead of strengthening weak sectors); ERDF subsidies have been very helpful in increasing the innovation potential (including knowledge transfer) and improved human resources (in quality and quantity). Both are most important sources of innovation and are very important conditions for clusters to grow and work successfully. Measures have been created to stimulate both; it takes a long period of time in order to reach their goals: new qualifications of workers, new products/processes/services. The analysis showed that regional absorptive capacity was sufficient in order to provide a breeding ground for new innovative projects. The formation of clusters and networking and cooperation between SME’s and large firms are success factors for economic sectors; they were addressed very successfully for the energy sector.

Work Package 4: “Structural Change and Globalisation”
55
The analysis did not validate the hypothesis: the region was able to integrate and attract new technological findings and opened new trajectories.

Case Study ‐ North Netherlands (NL)
56
Work Package 4: “Structural Change and Globalisation”
57
5. Annexes
5.1 References
• Annual Report 2007 SPD 2000‐2006 • Broersma, Lourens, and Jouke van Dijk (2006), Het belang van de industrie in het Noorden: 1950 – 2025,
RUG‐FRW (in opdracht van de Stichting TxU Noord‐Nederland) • Dijk, Jouke van (2007). ʹThe regional labour market: brain‐drain or knowledge exportʹ. Chapter 9 in:
Gregory J. Ashworth, Peter. Groote and Piet H. Pellenbarg (eds.), A Compact Geography of the Northern Netherlands. Assen: p.45 ‐ 48.
• ECORYS (2005) Update MTE EPD Noord Nederland 2000‐2006. In opdracht van SNN. 13 December
2005. ECORYS Rotterdam. • ECORYS‐NEI (2003) Midterm evaluatie EPD D2 Noord Nederland. In opdracht van SNN. ECORYS‐NEI,
Rotterdam. • ERDF Innovative Actions 2000‐2006 Final Report (2009) Province of Groningen. • Evaluation IPR 1998‐2002, Buck Consultants International, July 2004 • Programmacomplement. Behorend bij het Enkelvoudig Programmeringsdocument Noord‐Nederland
voor de periode 2000‐2006. Maart 2004. • Wintjes, R. (2006) Strategic Evaluation on Innovation and the Knowledge Based Economy in relation to
the Structural and Cohesion Funds, for the programming period 2007‐2013. Report for the European Commission, MERIT. Maastricht.

Case Study ‐ North Netherlands (NL)
58
5.2 List of persons interviewed
Name Organisation Date and place
Mr. Aalberts Oliemolen Harlingen B.V. Telephone, 18‐11‐2009
Mr. Boneschansker Groningen Seaports Groningen, 20‐7‐2009
Mr. De Jong Energy Delta Institute Groningen, 21‐7‐2009
Mr. Emmes SNN Telephone, 11‐11‐2009
Mr. Hermans Groningen Seaports, chemical industry Groningen, 28‐7‐2009
Mr. Huisman Energy valley Groningen, 21‐7‐2009
Mr. Jansma SNN Groningen, 21‐7‐2009
Mr. Tax Bright Spark Telephone, 18/19‐11‐2009
Mr. Vogelaar Metalpark The Hague, 22‐7‐2009