Case Study Examples Illustrating Modeling of PV for...
16
Jeff Smith Manager, Power System Studies, EPRI Workshop on Achieving High Penetrations of PV Orlando, Florida 9/14/2012 Case Study Examples Illustrating Modeling of PV for Distribution Planning and Analysis
Transcript of Case Study Examples Illustrating Modeling of PV for...

Jeff Smith Manager, Power System Studies, EPRI
Workshop on Achieving High Penetrations of PV
Orlando, Florida
9/14/2012
Case Study Examples Illustrating Modeling of PV for Distribution Planning and Analysis

2 © 2012 Electric Power Research Institute, Inc. All rights reserved.
Industry Emphasis on Modeling – Why?
• Rapid-deployment of PV • Higher penetration levels than
ever before • Utilities need to have a handle
on potential PV impacts prior to interconnection
• Much easier to resolve potential issues before penetration levels exceed allowable limits
• Modeling enables the distribution planner to investigate solutions and “work arounds”
ANSI Voltage limit
Increasing PV Output
Local voltage limit
Example of an Existing PV System Causing Unacceptable Voltages Measured Overvoltage Resulting from PV

3 © 2012 Electric Power Research Institute, Inc. All rights reserved.
Right Tool for the Job
Modeling is only as good as the tool used, and the data that goes into it
Power System Modeling and
Analysis
Steady-State
Quasi-Steady State
Short-Circuit
Electromagnetic transient
Stability
Scheduling/ Dispatch
Distributed PV Interconnection
Analysis

4 © 2012 Electric Power Research Institute, Inc. All rights reserved.
Feeder Modeling
Power Delivery – Substation transformer – Primary conductors – Service transformers – Customer service drops
Power Conversion – Residential loads – Commercial loads – Existing PV systems
Power Control – Capacitors – Substation LTC – Line regulators
5 © 2012 Electric Power Research Institute, Inc. All rights reserved.
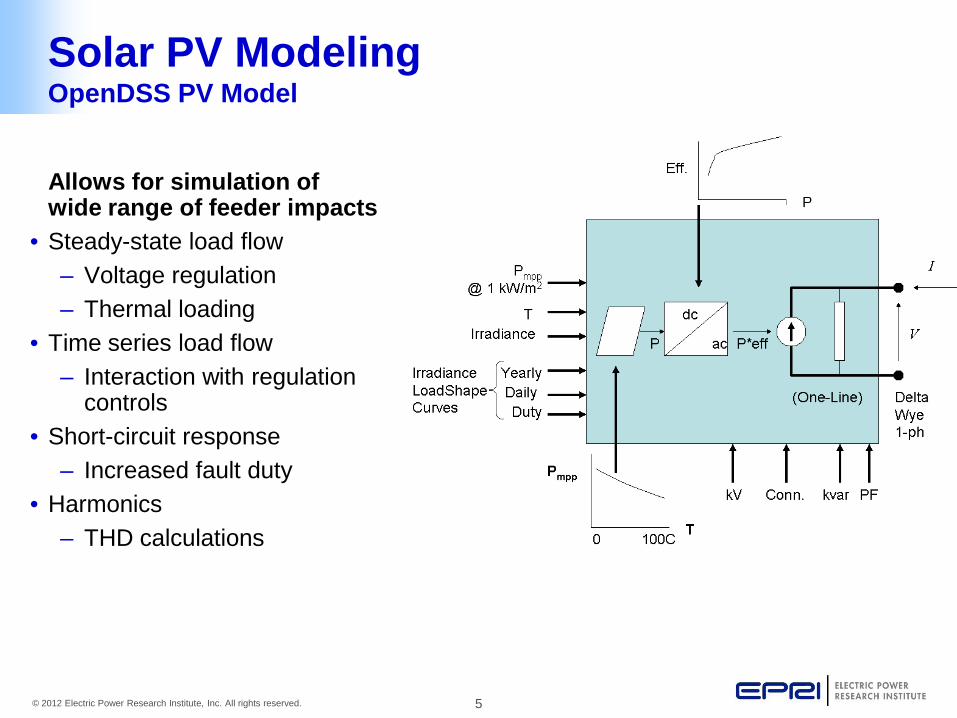
Solar PV Modeling OpenDSS PV Model
Allows for simulation of wide range of feeder impacts
• Steady-state load flow – Voltage regulation – Thermal loading
• Time series load flow – Interaction with regulation
controls • Short-circuit response
– Increased fault duty • Harmonics
– THD calculations

6 © 2012 Electric Power Research Institute, Inc. All rights reserved.
Solar Resource Modeling - Variability
• Essential to capture time-varying nature of the solar PV
– 15 minute - Hourly – energy related concerns such as peak demand, loading, overvoltage
– < 1 minute – voltage fluctuations, regulation control interaction
• Factors that contribute to variability – Size and layout of the solar facility – Local weather patterns – Centralized vs distributed
• Possible sources of data: – Location-specific measurement data – Proxy data from other PV systems – Mesoscale/satellite based models –
typically 30 minute - hourly interval
Solar Plant Size
Ramping (0-100%)
60 kW < 10 seconds
800 kW < 1 minute
6.5 MW 1.5-2 minutes
Feeder-wide 5-10 minutes
Example Ramp Rates from Existing PV
0.0
0.1
0.2
0.3
0.4
0.5
0.6
0.7
0.8
0.9
1.0
7 9 11 13 15 17 19Hour
Pow
er (p
er-u
nit)
1 min avg60 min avg
PV data “driving” the simulation must be sampled faster than the metric and/or control interaction being simulated

7 © 2012 Electric Power Research Institute, Inc. All rights reserved.
Feeder and PV Model Validation
OpenDSS Feeder and PV Model Validated Against Field Data
RegulatorsMetered Large-Scale PV
Substation
Small variations in voltage due to load fluctuations
Measured PV Production
Field vs Simulated (OpenDSS)

8 © 2012 Electric Power Research Institute, Inc. All rights reserved.
Considers Maximum Range of
PV Output
Static Load Flow - solve load flow - lock all controls - add generation - resolve
Basic Analysis – Voltage Change Test
3-Phase Voltage Profile Plot
0.92
0.93
0.94
0.95
0.96
0.97
0.98
0.99
1
1.01
1.02
1.03
1.04
1.05
1.06
0 2 4 6 8 10 12 14 16
Distance from Substation
Per U
nit V
olta
ge
V1V2V3
"HEADROOM""HEADROOM"
3-Phase Voltage Profile Plot
With 1600 kW Uniformly-Distributed Generation
0.92
0.93
0.94
0.95
0.96
0.97
0.98
0.99
1
1.01
1.02
1.03
1.04
1.05
1.06
0 2 4 6 8 10 12 14 16
Distance from Substation (km)
Per U
nit V
olta
geV1V2V3

9 © 2012 Electric Power Research Institute, Inc. All rights reserved.
Advanced Analysis – Time Series Quasi-Dynamic, Quasi-Static, etc
IEEE 8500 Node Test Case
1.025
1.03
1.035
1.04
1.045
04 06 08 10 12 14 16 18 20
volta
ge (p
u)
Hour
Daily Voltage Profile(Average Three Phase)
With PV
Without PV
Mid
-Fee
der
-4
-2
0
2
4
6
8
10
12
14
0 4 8 12 16 20
Tap O
pera
tion
Diffe
rent
ial
Hour
Phase A
Phase B
Phase C
A B C
4% 20% 7%
Increase in Tap Operations Due to PV
2MW PV
2MW PV System located Mid-Feeder Causing Increased Regulator Operation

10 © 2012 Electric Power Research Institute, Inc. All rights reserved.
Spatial- and Time-Based Modeling

11 © 2012 Electric Power Research Institute, Inc. All rights reserved.
Modeling Uncertainty Regarding Future PV Deployment Stochastic Analysis
• Can be used for determining a particular distribution feeder’s hosting capacity for PV by considering large number of possible future PV deployments
• Must consider wide range of – potential spatial interconnections – PV system sizes
• Likelihood of a simulated PV deployment resembling the actual future deployment increases with number of cases considered

12 © 2012 Electric Power Research Institute, Inc. All rights reserved.
Sample Stochastic Results Maximum Feeder Voltage
Blue – primary feeder voltage
Red – secondary customer voltage
Increasing penetration (kW)
Penetration level when violations occur Feeder exposure to violations
Max
imum
Fee
der V
olta
ge
# of
Fee
der N
odes
Vio
late
d
•Each point represents the worst-case voltage violation for a single PV deployment case
•5000 cases shown
Increasing penetration (kW)
ANSI voltage limit

13 © 2012 Electric Power Research Institute, Inc. All rights reserved.
What About Evaluating Smart Inverters?
Smart inverters for providing grid support functions
Volt-Var Control* Volt-Watt Control**
Dynamic Var Control** Volt-Var w/ Hysteresis**
*Currently in OpenDSS **available in OpenDSS Q1 2013

Applying PV Volt-Var ControlMitigating Voltage Issuesg g g
Solar Rooftop PVSolar Rooftop PVCustomer PVVolt-Var Control Solar Rooftop PVSolar Rooftop PV
With volt/var controlCustomer Load Customer PV
Gen
erated Capacitive System
Voltage
Q1
Q3Q2
Volt Var Control
VARs Inductive V1 V2 V3V4
Q4
Primary Voltage
1
1.025
1.05
20% PV20% PV withvolt/var control
0.925
0.95
0.975
1
Vol
tage
(pu)
Baseline – No PV
14© 2012 Electric Power Research Institute, Inc. All rights reserved.
0.90 4 8 12 16 20
Hour
Baseline – No PV

15 © 2012 Electric Power Research Institute, Inc. All rights reserved.
Open Discussions
Contact:
Jeff Smith Manager, Power System Studies EPRI [email protected]

16 © 2012 Electric Power Research Institute, Inc. All rights reserved.
Simulation Platform – OpenDSS
• Open source of EPRI’s Distribution System Simulator
– developed in 1997 – open sourced in 2008 to collaborate
with other research projects
• Used in 100’s of distribution studies • OpenDSS designed from the
beginning to capture – Time-specific impacts and – Location-specific impacts
• Differentiating features
– full multiphase model – numerous solution modes – “dynamic” power flow – system controls – flexible load models
• Needed for analysis of – DG/renewables – energy efficiency – PHEV/EV – non-typical loadshapes
http://sourceforge.net/projects/electricdss