CASE STUDY Data visualisation for Bristol Avon Rivers ...
6
Data visualisation for Bristol Avon Rivers Trust (BART) CASE STUDY CASE STUDY Riskaware were recently approached by local charity, the Bristol Avon Rivers Trust (BART), to help with one of their citizen science projects, the Bristol Avon WaterBlitz. BART delivers education, land and river management advice, and practical river restoration work throughout the Bristol Avon catchment. This work includes coordination of the Bristol Avon WaterBlitz, a project initiated globally by an organisation known as Earthwatch, where the public collect water samples of their local waterways to monitor river health. This provides BART with important data to help them prioritise and target their conservation and protection activities. To get the most insight from this data, and to accurately accumulate all the different data types and formats in a clear and engaging way, BART approached Riskaware to create a data visualisation platform that could display all the data that had been collected. Riskaware 2021 | www.riskaware.co.uk
Transcript of CASE STUDY Data visualisation for Bristol Avon Rivers ...
Data visualisationfor Bristol Avon Rivers Trust (BART)
CASE STUDY
CASE STUDY
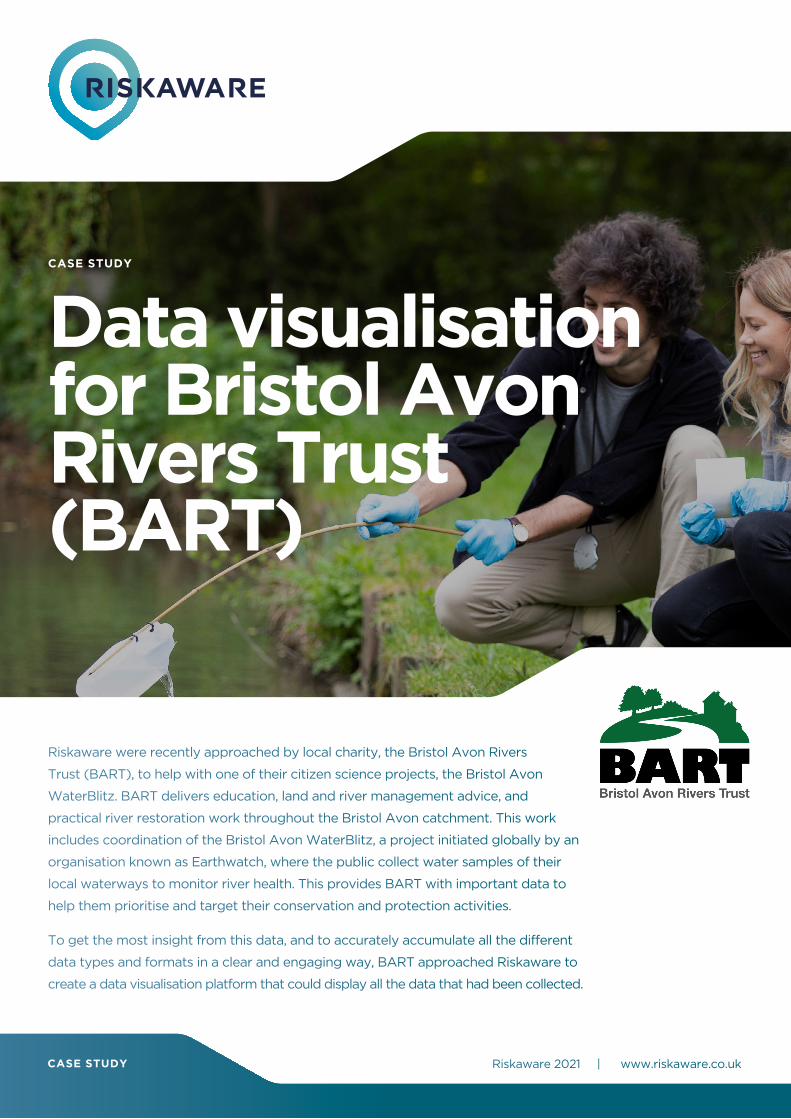
Riskaware were recently approached by local charity, the Bristol Avon Rivers
Trust (BART), to help with one of their citizen science projects, the Bristol Avon
WaterBlitz. BART delivers education, land and river management advice, and
practical river restoration work throughout the Bristol Avon catchment. This work
includes coordination of the Bristol Avon WaterBlitz, a project initiated globally by an
organisation known as Earthwatch, where the public collect water samples of their
local waterways to monitor river health. This provides BART with important data to
help them prioritise and target their conservation and protection activities.
To get the most insight from this data, and to accurately accumulate all the different
data types and formats in a clear and engaging way, BART approached Riskaware to
create a data visualisation platform that could display all the data that had been collected.
Riskaware 2021 | www.riskaware.co.uk
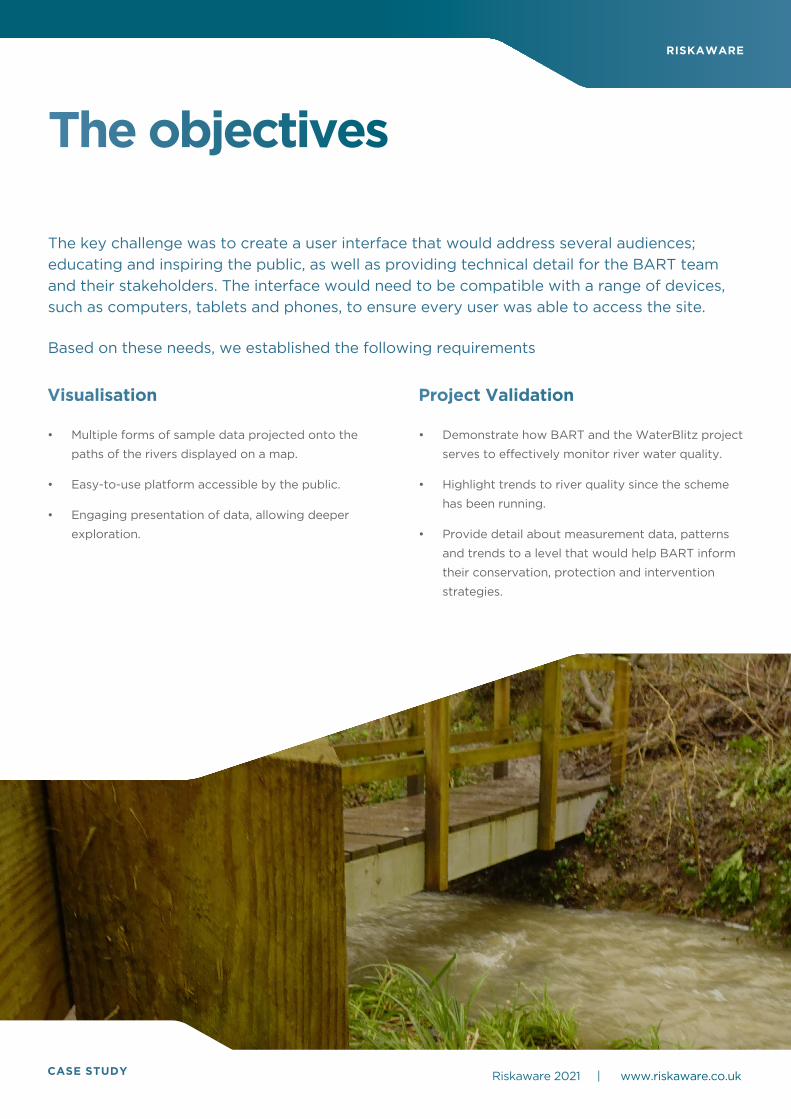
The key challenge was to create a user interface that would address several audiences;
educating and inspiring the public, as well as providing technical detail for the BART team
and their stakeholders. The interface would need to be compatible with a range of devices,
such as computers, tablets and phones, to ensure every user was able to access the site.
The objectives
CASE STUDY
RISKAWARE
Visualisation
• Multiple forms of sample data projected onto the
paths of the rivers displayed on a map.
• Easy-to-use platform accessible by the public.
• Engaging presentation of data, allowing deeper
exploration.
Project Validation
• Demonstrate how BART and the WaterBlitz project
serves to effectively monitor river water quality.
• Highlight trends to river quality since the scheme
has been running.
• Provide detail about measurement data, patterns
and trends to a level that would help BART inform
their conservation, protection and intervention
strategies.
Riskaware 2021 | www.riskaware.co.uk
Based on these needs, we established the following requirements
Extracting the Data
The first task was to process the data collected by BART
and the WaterBlitz volunteers such that it could be stored
securely and displayed efficiently to the users. A solution
was needed that could handle a range of geolocated data
of different types, such as measurement values, textual
descriptions, multiple choice answers and photographs.
Data fields included nitrate and phosphate concentration
readings, and visual observations of the river and its
surrounding environment.
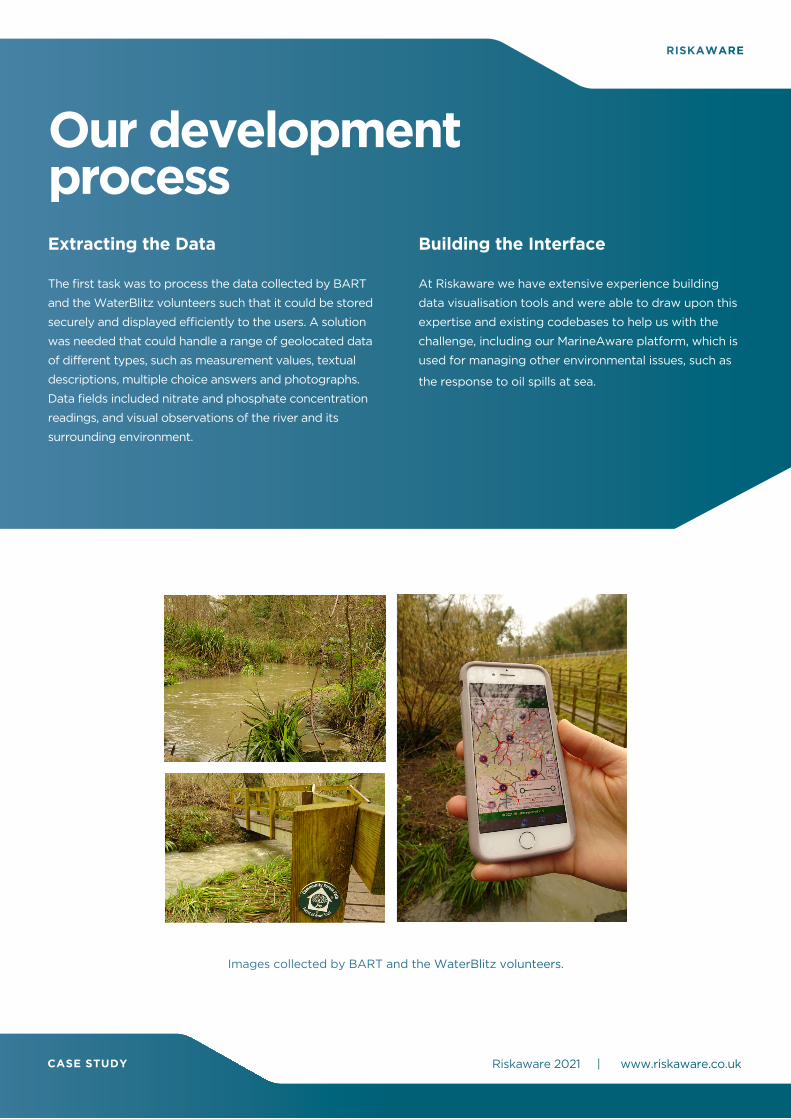
Images collected by BART and the WaterBlitz volunteers.
CASE STUDY Riskaware 2021 | www.riskaware.co.uk
RISKAWARE
Our development process
Building the Interface
At Riskaware we have extensive experience building
data visualisation tools and were able to draw upon this
expertise and existing codebases to help us with the
challenge, including our MarineAware platform, which is
used for managing other environmental issues, such as
the response to oil spills at sea.

At the core of the tool is an interactive
map of the Bristol Avon river catchment
area. Using open data for the rivers in the
catchment from the Ordinance Survey, we
were able to allocate the geo-referenced
river measurement sites to contextualise their
information with the overall river systems.
Here are the primary features that were
developed to balance the needs of the
diverse range of users.
The interactive WaterBlitz interface solution
CASE STUDY Riskaware 2021 | www.riskaware.co.uk
RISKAWARE
Multiple displays to represent varied data
Riskaware wanted to create an interface that
portrayed multiple data types with clarity. We
employed different visualisation methods, including
maps, charts, tables and photos to handle the data
recorded by the citizen scientists.
The map provides a picture of river health at different
viewing levels, with colour-coded segments indicating
the nutrient concentrations and other potential
pollution across the river system. As well as showing
the data available, the tool makes it clear where
testing hasn’t been completed, to give BART a clear
focus of where they can expand their testing sites and
river monitoring.
Learning about the site’s
features by following the
interactive tour
Getting an overview of the
phosphate levels across
the catchment

Interactive visualisation controls Using data clustering and charts, we enabled the large
datasets to be aggregated and displayed across a
wide area on the map, whilst still allowing users to
focus on smaller regions and individual testing sites
to uncover more details with a simple click. At each
level, the display shows key indicators of water quality
which BART and other organisations can use to inform
their activities.
The WaterBlitz data available in the tool goes back
five years to when BART first began organising the
events in 2016. During that time, data has been
recorded from over 700 measurement sites across the
catchment. Users can filter what is displayed on the
map by time range to focus on a particular year, or
see change over time.
We have put a lot of thought into the design of the
tool to make it intuitive to explore the data, both at a
high-level, and for individual measurements. The page
layout was designed to include discoverable features
and simple navigation to create an easy-to-use display.
By making the tool web-based, there is no need for
users to download an app or install any software;
users just need a device with an internet browser. The
interface seamlessly scales to different screen sizes,
allowing the tool to be used by everyone regardless of
the platform or device they are viewing it on.
To help introduce new users to the tool, there’s also an
interactive tour available, which takes users through
some of the tool’s key features.
Intuitive interface layout
CASE STUDY Riskaware 2021 | www.riskaware.co.uk
Understanding how nutrient pollution in the
rivers has changed over time
RISKAWARE
Viewing images of the measurement sites

BART continues to run WaterBlitz events, with
participation increasing every year. As this new data
is added to the tool, it will be become an even more
powerful resource for BART. We also hope that it will
encourage many more volunteers to become part of
the project.
Going forwards, we hope to expand the tool’s
capabilities and update the data as more WaterBlitz
events take place.
Tool deployment and future development
RISKAWARE
Checking for recorded signs of pollution along a stretch of river
Get in touch to learn more about our work
with Bristol Avon Rivers Trust, or to discuss
how we can help you.
Phone+44 (0) 117 929 1058
Whitefriars
Lewins Mead
Bristol
BS1 2NT
@RiskawareUK
riskaware
For more information or to discuss how we can work together, please contact us on:


![Surgical Technique - synthes.vo.llnwd.netsynthes.vo.llnwd.net/o16/LLNWMB8/INT Mobile/Synthes... · Clin Biomech (Bristol, Avon) (3)(2012). [Epub ahead of print] doi:10.1016/ j.clinbiomech.2012.03.003.](https://static.fdocuments.us/doc/165x107/5ed54f9b1dbb8245b96a732c/surgical-technique-mobilesynthes-clin-biomech-bristol-avon-32012.jpg)