Case Study 1: Exploring an Underwater Volcano
8
1 Exploring with Multibeam Sonar WATCHING IN 3D What is an Underwater Volcano? CASE STUDY 1: Exploring an Underwater Volcano This activity will guide you through exploration of the Kawio Barat seamount, also an underwater volcano, using the Ocean Exploration Digital Atlas (a searchable, interactive expedition data map) and a free version of Fledermaus, a powerful interactive mapping data visualization software used by ocean explorers, providing you first-hand experience using these tools to explore multibeam sonar capabilities in 3D. Multibeam sonar is one of the most powerful tools available for modern deep-sea exploration, and can create high-resolution maps, three dimensional models, or even “fly-through” videos that simulate a trip across an area being mapped. This activity will also introduce you to the NOAA Office of Ocean Exploration and Research website and the INDEX-Indonesia-USA Deep-Sea Exploration of the Sangihe Talaud Region Expedition web pages where Kawio Barat was studied. Four key technologies are used to gather baseline information on areas of ocean exploration: ✓ Photograph Remotely Operated Vehicles (ROV) 3 1 Listen Multibeam sonar mapping system 2 Test Conductivity, Temperature and Depth profilers (CTDs) 4 Share Telepresence technologies (Kawio Barat) oceanexplorer.noaa.gov Fledermaus 3D image of Kawio Barat. Submarine volcanic eruptions are characteristic of rift zones where crustal plates are being formed. These rift zones are known as seafloor spreading centers because they are places where tectonic plates are moving away from each other. Most seafloor spreading centers lie at depths greater than 2,000 meters (1.2 miles) and, as a consequence, approximately three-quarters of all volcanic activity on Earth occurs as deep, underwater eruptions. Spreading center volcanic eruptions typically produce basalt, the primary rock that makes up oceanic crust. Submarine basalt flows often have a “pillow” shape but they can also produce smooth sheet flows like basalt eruptions on land. Submarine eruptions most commonly occur along spreading centers, like the Mid- Atlantic Ridge and the East Pacific Rise, where the plates are moving apart at relatively rapid rates. However, they also occur in places where crustal plates collide and one plate dives beneath the other and is ultimately remelted. In such regions, known as subduction zones, the volcanic rock type is typically andesite, which is a product of the melting of the plate being subducted. Andesitic eruptions are usually violent and are only approachable because their explosiveness is dampened by the depths at which they occur. A third type of submarine eruption occurs as a consequence of a magma plume rising through the Earth’s crust overlying an area of melting in the Earth’s mantle. These eruptions are known as hotspot volcanoes and they often form chains of volcanic islands and seamounts. Submarine volcanoes are also interesting because of the unique habitats they create. Seamounts are often areas of high biological diversity; their shape acts to deflect food- carrying currents upward, attracting a variety of sessile organisms and those that feed on them. Some animals can even metabolize inorganic compounds emitted during volcanic activity, forming unique chemosynthetic communities around areas of hydrothermal venting.
Transcript of Case Study 1: Exploring an Underwater Volcano

1
E x p l o r i n g w i t h M u l t i b e a m S o n a rWATCHING IN 3D
What is an Underwater Volcano?
C A S E S T U D Y 1: Exploring an Underwater Volcano
This activity will guide you through exploration of the Kawio Barat seamount, also an underwater volcano, using the Ocean Exploration Digital Atlas (a searchable, interactive expedition data map) and a free version of Fledermaus, a powerful interactive mapping data visualization software used by ocean explorers, providing you first-hand experience using these tools to explore multibeam sonar capabilities in 3D. Multibeam sonar is one of the most powerful tools available for modern deep-sea exploration, and can create high-resolution maps, three dimensional models, or even “fly-through” videos that simulate a trip across an area being mapped.
This activity will also introduce you to the NOAA Office of Ocean Exploration and Research website and the INDEX-Indonesia-USA Deep-Sea Exploration of the Sangihe Talaud Region Expedition web pages where Kawio Barat was studied.
Four key technologies are used to gather baseline information on areas of ocean exploration:
✓
PhotographRemotely Operated Vehicles (ROV)
3
1 ListenMultibeam sonar mapping system
2 TestConductivity, Temperature and Depth profilers (CTDs)
4ShareTelepresence technologies
(Kawio Barat)
oceanexplorer.noaa.gov
Fledermaus 3D image of Kawio Barat.
Submarine volcanic eruptions are characteristic of rift zones where crustal plates are being formed. These rift zones are known as seafloor spreading centers because they are places where tectonic plates are moving away from each other. Most seafloor spreading centers lie at depths greater than 2,000 meters (1.2 miles) and, as a consequence, approximately three-quarters of all volcanic activity on Earth occurs as deep, underwater eruptions.
Spreading center volcanic eruptions typically produce basalt, the primary rock that makes up oceanic crust. Submarine basalt flows often have a “pillow” shape but they can also produce smooth sheet flows like basalt eruptions on land.
Submarine eruptions most commonly occur along spreading centers, like the Mid-Atlantic Ridge and the East Pacific Rise, where the plates are moving apart at relatively rapid rates. However, they also occur in places where crustal plates collide and one plate dives beneath the other and is ultimately remelted. In such regions, known as subduction zones, the volcanic rock type is typically andesite, which is a product of the melting of the plate being subducted. Andesitic eruptions are usually violent and are only approachable because their explosiveness is dampened by the depths at which they occur.
A third type of submarine eruption occurs as a consequence of a magma plume rising through the Earth’s crust overlying an area of melting in the Earth’s mantle. These eruptions are known as hotspot volcanoes and they often form chains of volcanic islands and seamounts.
Submarine volcanoes are also interesting because of the unique habitats they create. Seamounts are often areas of high biological diversity; their shape acts to deflect food-carrying currents upward, attracting a variety of sessile organisms and those that feed on them. Some animals can even metabolize inorganic compounds emitted during volcanic activity, forming unique chemosynthetic communities around areas of hydrothermal venting.
E x p l o r i n g a n U n d e r wate r Vo l c a n oCASE STUDY 1
2
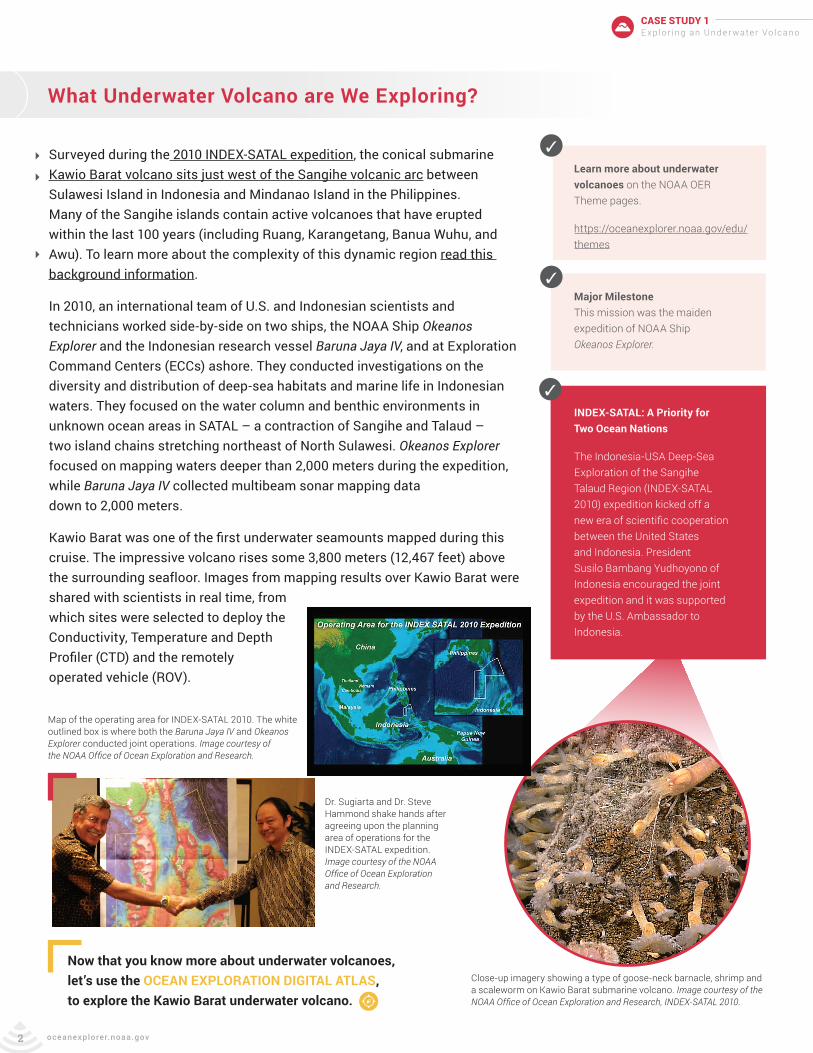
What Underwater Volcano are We Exploring?
Learn more about underwater volcanoes on the NOAA OER Theme pages.
https://oceanexplorer.noaa.gov/edu/themes
✓Surveyed during the 2010 INDEX-SATAL expedition, the conical submarine Kawio Barat volcano sits just west of the Sangihe volcanic arc between Sulawesi Island in Indonesia and Mindanao Island in the Philippines. Many of the Sangihe islands contain active volcanoes that have erupted within the last 100 years (including Ruang, Karangetang, Banua Wuhu, and Awu). To learn more about the complexity of this dynamic region read this background information.
In 2010, an international team of U.S. and Indonesian scientists and technicians worked side-by-side on two ships, the NOAA Ship Okeanos Explorer and the Indonesian research vessel Baruna Jaya IV, and at Exploration Command Centers (ECCs) ashore. They conducted investigations on the diversity and distribution of deep-sea habitats and marine life in Indonesian waters. They focused on the water column and benthic environments in unknown ocean areas in SATAL – a contraction of Sangihe and Talaud – two island chains stretching northeast of North Sulawesi. Okeanos Explorer focused on mapping waters deeper than 2,000 meters during the expedition, while Baruna Jaya IV collected multibeam sonar mapping data down to 2,000 meters.
Kawio Barat was one of the first underwater seamounts mapped during this cruise. The impressive volcano rises some 3,800 meters (12,467 feet) above the surrounding seafloor. Images from mapping results over Kawio Barat were shared with scientists in real time, from which sites were selected to deploy the Conductivity, Temperature and Depth Profiler (CTD) and the remotely operated vehicle (ROV).
INDEX-SATAL: A Priority for Two Ocean Nations
The Indonesia-USA Deep-Sea Exploration of the Sangihe Talaud Region (INDEX-SATAL 2010) expedition kicked off a new era of scientific cooperation between the United States and Indonesia. President Susilo Bambang Yudhoyono of Indonesia encouraged the joint expedition and it was supported by the U.S. Ambassador to Indonesia.
✓
Major Milestone This mission was the maiden expedition of NOAA Ship Okeanos Explorer.
✓
Dr. Sugiarta and Dr. Steve Hammond shake hands after agreeing upon the planning area of operations for the INDEX-SATAL expedition.Image courtesy of the NOAA Office of Ocean Exploration and Research.
Now that you know more about underwater volcanoes, let’s use the OCEAN EXPLORATION DIGITAL ATLAS, to explore the Kawio Barat underwater volcano.
Close-up imagery showing a type of goose-neck barnacle, shrimp and a scaleworm on Kawio Barat submarine volcano. Image courtesy of the NOAA Office of Ocean Exploration and Research, INDEX-SATAL 2010.
oceanexplorer.noaa.gov
Map of the operating area for INDEX-SATAL 2010. The white outlined box is where both the Baruna Jaya IV and Okeanos Explorer conducted joint operations. Image courtesy of the NOAA Office of Ocean Exploration and Research.

The Ocean Exploration Digital Atlas is a map-based interactive online atlas tool provided by NOAA’s National Centers for Environmental Information (NCEI). The atlas links to information about past expeditions of NOAA’s Office of Ocean Exploration and Research missions that began in 2001. This atlas orients users to expedition locations and provides experiences exploring data and associated discoveries from specific expeditions.
Note: For a more detailed step-by-step tool guide of how to use the Ocean Exploration Digital Atlas, see the Watching in 3D: Exploring with Multibeam Sonar activity package introduction.
1. OPEN THE OCEAN EXPLORATION DIGITAL ATLAS: https://www.ncei.noaa.gov/maps/oer-digital-atlas/mapsOE.htm
3. CHOOSE EXPEDITION: 2010 Okeanos Explorer INDEX-Indonesia-USA Deep-Sea Exploration of the Sangihe-Talaud Region (INDEX-SATAL) (EX1004L2).
TOOL 1: Exploring an Underwater Volcano with the Ocean Exploration Digital Atlas
EX1004L2: “EX” is used as an abbreviation for the NOAA Ship Okeanos Explorer, the last two digits of the year of the cruise (10) the number of the cruise (this was the fourth cruise for 2010), and the segment or leg (this was the second leg of cruise 04).
✓
Exploring an Underwater Volcano with Multibeam Sonar Tools
3
2. CHOOSE YEAR AND VESSEL: 2010; Okeanos Explorer; Search. The dots that appear are all the 2010 Okeanos Explorer expeditions.
E x p l o r i n g a n U n d e r wate r Vo l c a n oCASE STUDY 1
oceanexplorer.noaa.gov

Exploring an Underwater Volcano with Multibeam Sonar Tools cont.
4. PLOT ON MAP: Click on the GIS Tools tab in the pop-up window, select the appropriate boxes (the first three for this mission) and click Plot on Map.
5. LOOK CLOSER: Click on the map and holding the left mouse button down, move the view slightly to the right and use the center mouse button to zoom in until the names of the dives appear. 6. DIVE IN: Look for Dives 1 and 2. What do you think the ship was doing here to make those orange lines on the map? Can you think of anything in your life that makes similar patterns? The orange lines are the ship’s track, or where it “mowed the lawn.” Zoom in to get a closer look at the Kawio Barat volcano.
The color red is used to indicate the shallowest point, followed by orange, yellow, green, blue and purple, with purple being the deepest.
Now that you have found your dives, try the second tool, FLEDERMAUS, to explore the Kawio Barat underwater volcano even further.
✓GIS stands for Geographic Information Systems.
✓
Check longitude and latitude to make sure you are in the right place!
Longitude: 125.07 Latitude: 4.68
4
E x p l o r i n g a n U n d e r wate r Vo l c a n oCASE STUDY 1
oceanexplorer.noaa.gov
(provided in decimal format)

An important technique for studying multibeam images uses a three-dimensional data visualization system called Fledermaus. Fledermaus software allows the user to view and manipulate 3D models of seafloor features, providing insight into the geological structure of an area and helping to pinpoint ideal locations for further exploration.
Note: For a more detailed step-by-step tool guide of how to use Fledermaus software, see the Watching in 3D: Exploring with Multibeam Sonar activity package introduction.
1. DOWNLOAD THE (FREE) SOFTWARE (educators and/or students): Download the Fledermaus Viewer software (8.2.2 or newer) from the dropdown menu at https://www.qps.nl/downloads/fledermaus/. Fill in the contact form, selecting the version appropriate to your operating system. You will receive a link via email to download the program.
2. CHOOSE SCENE: Download this interactive, 3D scene file of Kawio Barat and save it onto your hard drive: https://www.ncei.noaa.gov/waf/OER-Media/INDEX2010/INDEX2010_mb_1.qsz. Then open the Viewer, and in the top left, select File and then Open Scene. Choose the scene you downloaded and this will open the 3D Kawio Barat scene file created from the multibeam sonar data collected as the ship traveled over and mapped the seafloor in this region.
TOOL 2: Exploring an Underwater Volcano with Fledermaus
✓Fledermaus, pronounced “FLEE-der-mouse,” is the German word for bat.
Exploring an Underwater Volcano with Multibeam Sonar Tools cont.
In the Fledermaus scenes, the ocean floor is shown as a three-dimensional image. Latitude and longitude are indicated in degrees, minutes and seconds. The x-axis represents longitude, the y-axis represents latitude, and the z-axis represents depth. When you move the cursor over the image, the window near the bottom of the screen shows the geo coordinates (x, y, and z) for the location beneath the cursor.
✓
5
E x p l o r i n g a n U n d e r wate r Vo l c a n oCASE STUDY 1
oceanexplorer.noaa.gov
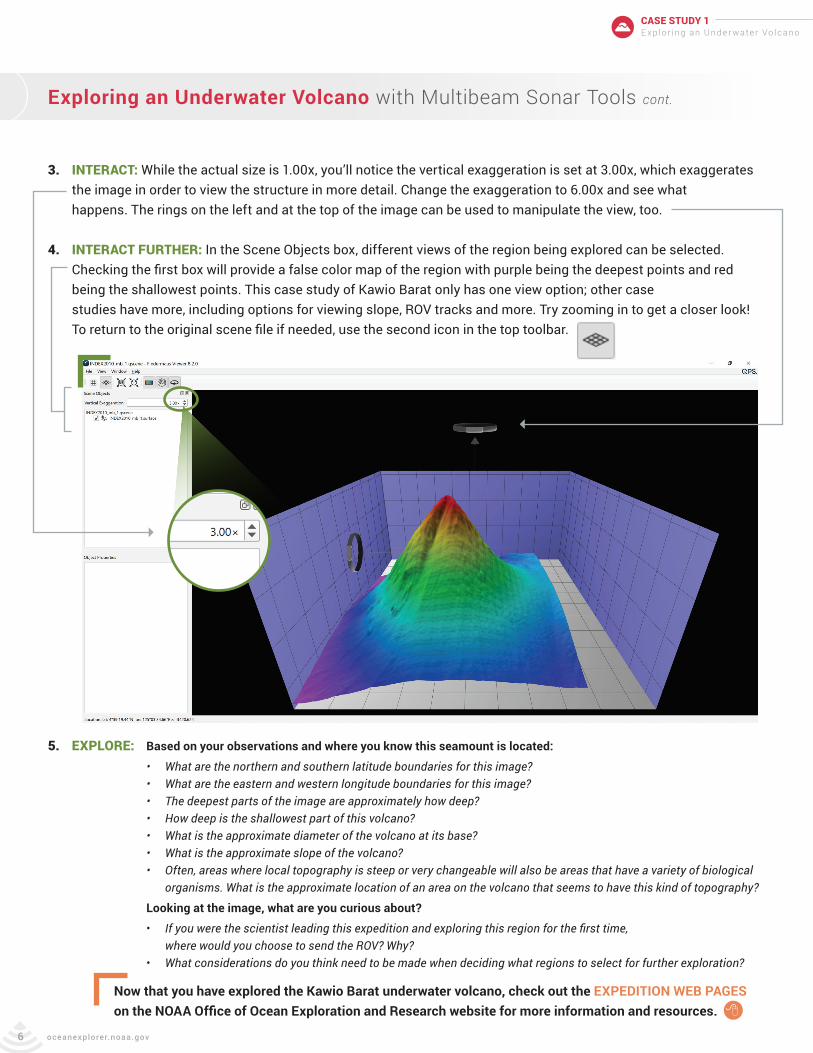
3. INTERACT: While the actual size is 1.00x, you’ll notice the vertical exaggeration is set at 3.00x, which exaggerates the image in order to view the structure in more detail. Change the exaggeration to 6.00x and see what happens. The rings on the left and at the top of the image can be used to manipulate the view, too.
4. INTERACT FURTHER: In the Scene Objects box, different views of the region being explored can be selected. Checking the first box will provide a false color map of the region with purple being the deepest points and red being the shallowest points. This case study of Kawio Barat only has one view option; other case studies have more, including options for viewing slope, ROV tracks and more. Try zooming in to get a closer look! To return to the original scene file if needed, use the second icon in the top toolbar.
6
Exploring an Underwater Volcano with Multibeam Sonar Tools cont.
5. EXPLORE: Based on your observations and where you know this seamount is located:
• What are the northern and southern latitude boundaries for this image? • What are the eastern and western longitude boundaries for this image? • The deepest parts of the image are approximately how deep? • How deep is the shallowest part of this volcano? • What is the approximate diameter of the volcano at its base? • What is the approximate slope of the volcano? • Often, areas where local topography is steep or very changeable will also be areas that have a variety of biological organisms. What is the approximate location of an area on the volcano that seems to have this kind of topography?
Looking at the image, what are you curious about?
• If you were the scientist leading this expedition and exploring this region for the first time, where would you choose to send the ROV? Why? • What considerations do you think need to be made when deciding what regions to select for further exploration?
Now that you have explored the Kawio Barat underwater volcano, check out the EXPEDITION WEB PAGES on the NOAA Office of Ocean Exploration and Research website for more information and resources.
E x p l o r i n g a n U n d e r wate r Vo l c a n oCASE STUDY 1
oceanexplorer.noaa.gov

TOOL 3: Expedition Web Pages
Each expedition has specific web pages on the NOAA Office of Ocean Exploration and Research website. The INDEX-SATAL 2010 Expedition web pages contain more information about the Kawio Barat underwater volcano that was studied, as well as additional discoveries that were made on this historic expedition. https://oceanexplorer.noaa.gov/okeanos/explorations/10index/welcome.html
Here you can...• read the mission plan• read daily updates• read mission logs• view beautiful imagery, videos and more!
This web page can also be accessed by repeating steps 1-3 of the Ocean Exploration Digital Atlas and selecting the Summary tab (see page 3).
Exploring an Underwater Volcano with Multibeam Sonar Tools cont.
7
1. BE THE EXPLORER
What was discovered?
On the INDEX-SATAL 2010 Expedition web page, click Mission Logs. • READ the Mission Log from June 26, 2010.
• WATCH the fly-through video of the multibeam sonar data. • Now ask yourself: • What types of ocean scientists were participating in this exploration? • Why do you think a variety of scientists is necessary to fully explore an area?
• READ the Mission Log from June 27, 2010, the day after the ROV explored the Kawio Barat volcano. • Now ask yourself: • What were the explorers looking for? • How is the exploration strategy being executed here?
• WATCH the Kawio Barat highlights video and note your observations.
• WATCH the more recent video from the 2016 Oasis of Life. • Discuss with a peer what amazes you about this habitat. • If you could go back to Kawio Barat now, what would you want to explore further and why?
E x p l o r i n g a n U n d e r wate r Vo l c a n oCASE STUDY 1
oceanexplorer.noaa.gov

8
For Educators: Additional Resources and Extension
1. EDUCATION TABIn the Ocean Exploration Digital Atlas instructions on page 3 of this lesson, repeat steps 1-3, select the Education tab for a variety of supplemental educational resources.
2. VENTS AND VOLCANOES THEME PAGEThe Vents and Volcanoes Theme page provides additional essays, lessons, images, videos and more.
3. FURTHER MULTIMEDIASeamounts, Les Watling Ph.D., University of Hawai’i at Manoa; In this 45-minute video, Dr. Les Watling, marine scientist the University of Hawai’i at Manoa, provides an excellent description of the formation of seamounts, their geology and their associated ecological and biological diversity.
4. EXTENSIONSTry The Oceanographic Yo-yo activity, or have students read the June 30, 2010 Daily Update to see what they found! (evidence of a hydrothermal vent and vent community)Have students read the July 11, 2010 Daily Update to learn what was found on another seamount in the area.
Underwater Volcano Lesson URLs/Links
We value your feedback on this activity package, including how you use it in your formal/informal education settings. Please send your comments to: [email protected]. If reproducing this lesson, please cite NOAA as the source, and provide the following URL: https://oceanexplorer.noaa.gov.
Information and Feedback
Page 1: Tectonic plates: https://oceanexplorer.noaa.gov/facts/plate-boundaries.html Pillow basalts: https://oceanexplorer.noaa.gov/okeanos/explorations/ex1605/dailyupdates/media/video/0503-pillow/0503-pillow.html Mid-Atlantic Ridge: https://oceanexplorer.noaa.gov/facts/mid-ocean-ridge.html East Pacific Rise: https://www.mbari.org/the-geologic-setting-of-the-gulf-of-california/ Subduction zones: https://oceanexplorer.noaa.gov/edu/learning/4_subduction_zones/subduction_zones.html Hotspot volcanoes: https://oceanexplorer.noaa.gov/facts/volcanic-hotspot.html Seamounts: https://oceanexplorer.noaa.gov/facts/seamounts.html Chemosynthetic communities: https://oceanexplorer.noaa.gov/facts/photochemo.html Listen (photo): https://oceanexplorer.noaa.gov/okeanos/edu/collection/media/hdwe-MMBkgnd.pdf Test (photo): https://oceanexplorer.noaa.gov/okeanos/edu/collection/media/hdwe-WCIntro.pdf Photograph (photo): https://oceanexplorer.noaa.gov/okeanos/edu/collection/media/hdwe-URintro.pdf Share (photo): https://oceanexplorer.noaa.gov/okeanos/edu/collection/media/hdwe-TPbkgnd.pdf Fly-through video: https://oceanexplorer.noaa.gov/explorations/12fire/background/laubasin/laubasin.htmlPage 2: Themes page: https://oceanexplorer.noaa.gov/edu/themes INDEX-SATAL Expedition Web Page: https://oceanexplorer.noaa.gov/okeanos/explorations/10index/welcome.html Sangihe volcanic arc (map): https://oceanexplorer.noaa.gov/okeanos/explorations/10index/logs/june27/media/mapping_hires.jpg Background Information: https://oceanexplorer.noaa.gov/okeanos/explorations/10index/background/geology/geology.html INDEX-SATAL partnership: https://oceanexplorer.noaa.gov/okeanos/explorations/10index/background/partnership/partnership.html INDEX-SATAL partnership (photo): https://oceanexplorer.noaa.gov/okeanos/explorations/10index/background/partnership/partnership.html Organisms living on the volcano (photo): https://oceanexplorer.noaa.gov/okeanos/explorations/10index/logs/photolog/photolog.html#cbpi=/okeanos/explorations/10index/logs/photolog/media/barnacle_zoom.html Map: https://oceanexplorer.noaa.gov/okeanos/explorations/10index/logs/june27/media/mapping_hires.jpgPage 3: Watching in 3D: Exploring with Multibeam Sonar activity package intro: https://oceanexplorer.noaa.gov/okeanos/edu/collection/media/hdwe-Watching3Dinstructions.pdf Ocean Exploration Digital Atlas: https://www.ncei.noaa.gov/maps/oer-digital-atlas/mapsOE.htmPage 5: Watching in 3D: Exploring with Multibeam Sonar activity package intro: https://oceanexplorer.noaa.gov/okeanos/edu/collection/media/hdwe-Watching3Dinstructions.pdf Fledermaus Viewer software: https://www.qps.nl/downloads/fledermaus/ Kawio Barat 3D scene file: https://www.ncei.noaa.gov/waf/OER-Media/INDEX2010/INDEX2010_mb_1.qszPage 7: NOAA Office of Ocean Exploration and Research website: https://oceanexplorer.noaa.gov/ INDEX-SATAL Expedition Web Page: https://oceanexplorer.noaa.gov/okeanos/explorations/10index/welcome.html Mission Log June 26: https://oceanexplorer.noaa.gov/okeanos/explorations/10index/logs/june26/june26.html Fly-through video: https://oceanexplorer.noaa.gov/explorations/12fire/background/laubasin/laubasin.html Mission Log (June 27, 2010): https://oceanexplorer.noaa.gov/okeanos/explorations/10index/logs/june27/june27.html Introduction to Ships of Exploration and Their Strategy for Ocean Exploration: https://oceanexplorer.noaa.gov/okeanos/edu/collection/media/hdwe-StrategyBkgnd.pdf Kawio Barat Highlights (video): https://oceanexplorer.noaa.gov/okeanos/explorations/10index/background/info/media/movies/ex_kawio_barat_highlights_960.mp4 Oases of Life (video): https://oceanexplorer.noaa.gov/edu/themes/vents-and-volcanoes/multimedia.html#cbpi=media/video/multimedia-ventshrimp.htmlPage 8: Ocean Exploration Digital Atlas: https://www.ncei.noaa.gov/maps/oer-digital-atlas/mapsOE.htm Vents and Volcanoes Theme page: https://oceanexplorer.noaa.gov/edu/themes/vents-and-volcanoes/welcome.html Seamounts (video): https://vimeo.com/88841596 The Oceanographic Yo-yo (activity): https://oceanexplorer.noaa.gov/okeanos/explorations/ex1103/background/edu/media/ex1103_oceanyoyo.pdf June 30: https://oceanexplorer.noaa.gov/okeanos/explorations/10index/logs/dailyupdates/dailyupdates.html#cbpi=/okeanos/explorations/10index/logs/dailyupdates/june30.html July 11: https://oceanexplorer.noaa.gov/okeanos/explorations/10index/logs/dailyupdates/dailyupdates.html#cbpi=/okeanos/explorations/10index/logs/dailyupdates/july11.html
E x p l o r i n g a n U n d e r wate r Vo l c a n oCASE STUDY 1
oceanexplorer.noaa.gov


![[Teacher Name] presents: Exploring an Active Volcano in Nicaragua](https://static.fdocuments.us/doc/165x107/5681632b550346895dd3a64b/teacher-name-presents-exploring-an-active-volcano-in-nicaragua.jpg)