Case Histories of an Electromagnetic Method for Petroleum ... · Case Histories of an...
308
Case Histories of an Electromagnetic Method for Petroleum Exploration The results of a five-year feasibility study of the utility of electrical measurements in petroleum exploration are very encouraging. Electrical anomalies were measured over 66% of the 29 oil and gas fields involved in the study. The fact that these fields represent both stratigraphic and structural traps at a wide range of depths, with varying production characteristics, and in diverse geologic environments, provides a particularly favorable indication that this technique can be used as a reliable exploration tool, complementing existing seismic and subsurface geology programs. Case histories of five field projects are presented in this volume in order to illustrate both the advantages and limitations of the method in the context of known geology. The field projects involve a variety of field characteristics. The results delineate the following general observations: 1) repeatable anomalies can be measured over oil and gas fields; 2) two types of anomalies are measured-an electrically conductive "deep anomaly," and a polarizable "shallow anomaly;" 3) the anomalies correlate relatively well in plan view with the limits of hydrocarbon production; 4) the anomalies are partly dependent on specific geologic characteristics of the stratigraphic sequence. As is the case in seismic interpretations, data processing techniques are crucially important in extracting the maximum of information from electrical data. Proprietary data processing techniques have been developed for this purpose. Great care must be taken during interpretation to evaluate effects of pipelines, well casings, topography, and subsurface geology, since many of these effects may result in spurious anomalies unrelated to alteration due to hydrocarbons. The case histories demonstrate the necessity for this type of evaluation. Table of Contents, list of PDF files: IP-Petro_1.pdf PART ONE: SUMMARIES Executive Summary Summary and Conclusions IP-Petro_2.pdf PART TWO: DATA INTERPRETATION 1. Introduction to the Data 1.1 Introduction 1.2 Definitions and Plotting Conventions 1.3 Electrical Noise 1.4 Instrumentation 1.5 Resistivity/Phase Data Acquisition and Field Logistics 1.6 Harmonic Complex Resistivity Data Acquisition and Field Logistics 1.7 Controlled Source AMT Data Acquisition and Field Logistics 1.8 Data Processing Techniques, Resistivity/Phase and Complex Resistivity Data 1.9 Parameters Used in Resistivity/Phase and Complex Resistivity Interpretation References 2. Interpreting Hydrocarbon Anomalies 2.1 Introduction 2.2 Statistical Analysis of Zonge Engineering Hydrocarbon Surveys, 1977 - 1982 2.3 The Direct Detection of Hydrocarbons 2.4 The Origin of Electrical Anomalies over Hydrocarbons 2.5 Well-Casing Effects 2.6 Surface Culture Effects
Transcript of Case Histories of an Electromagnetic Method for Petroleum ... · Case Histories of an...

Case Histories of an Electromagnetic Method for Petroleum Exploration
The results of a five-year feasibility study of the utility of electrical measurements inpetroleum exploration are very encouraging. Electrical anomalies were measured over 66%of the 29 oil and gas fields involved in the study. The fact that these fields represent bothstratigraphic and structural traps at a wide range of depths, with varying productioncharacteristics, and in diverse geologic environments, provides a particularly favorableindication that this technique can be used as a reliable exploration tool, complementingexisting seismic and subsurface geology programs.
Case histories of five field projects are presented in this volume in order to illustrate boththe advantages and limitations of the method in the context of known geology. The fieldprojects involve a variety of field characteristics. The results delineate the following generalobservations: 1) repeatable anomalies can be measured over oil and gas fields; 2) two typesof anomalies are measured-an electrically conductive "deep anomaly," and a polarizable"shallow anomaly;" 3) the anomalies correlate relatively well in plan view with the limits ofhydrocarbon production; 4) the anomalies are partly dependent on specific geologiccharacteristics of the stratigraphic sequence.
As is the case in seismic interpretations, data processing techniques are crucially importantin extracting the maximum of information from electrical data. Proprietary data processingtechniques have been developed for this purpose. Great care must be taken duringinterpretation to evaluate effects of pipelines, well casings, topography, and subsurfacegeology, since many of these effects may result in spurious anomalies unrelated to alterationdue to hydrocarbons. The case histories demonstrate the necessity for this type ofevaluation.
Table of Contents, list of PDF files:
IP-Petro_1.pdf
PART ONE: SUMMARIESExecutive SummarySummary and Conclusions
IP-Petro_2.pdf
PART TWO: DATA INTERPRETATION1. Introduction to the Data
1.1 Introduction1.2 Definitions and Plotting Conventions1.3 Electrical Noise1.4 Instrumentation1.5 Resistivity/Phase Data Acquisition and Field Logistics1.6 Harmonic Complex Resistivity Data Acquisition and Field Logistics1.7 Controlled Source AMT Data Acquisition and Field Logistics1.8 Data Processing Techniques, Resistivity/Phase and Complex Resistivity Data1.9 Parameters Used in Resistivity/Phase and Complex Resistivity InterpretationReferences
2. Interpreting Hydrocarbon Anomalies2.1 Introduction2.2 Statistical Analysis of Zonge Engineering Hydrocarbon Surveys, 1977 - 19822.3 The Direct Detection of Hydrocarbons2.4 The Origin of Electrical Anomalies over Hydrocarbons2.5 Well-Casing Effects2.6 Surface Culture Effects

2.7 Topographic Effects2.8 Subsurface Geologic Effects2.9 Anomalies Due to Hydrocarbon Alteration - What to Look ForReferences
IP-Petro_3.pdf
PART THREE: CASE HISTORIES3. Ryckman Creek and Whitney Canyon Fields, Uinta County, Wyoming
3.1 Introduction3.2 Geologic Background3.3 Detailed Discussion of the Data3.4 Summary and ConclusionsReferences
IP-Petro_4.pdf
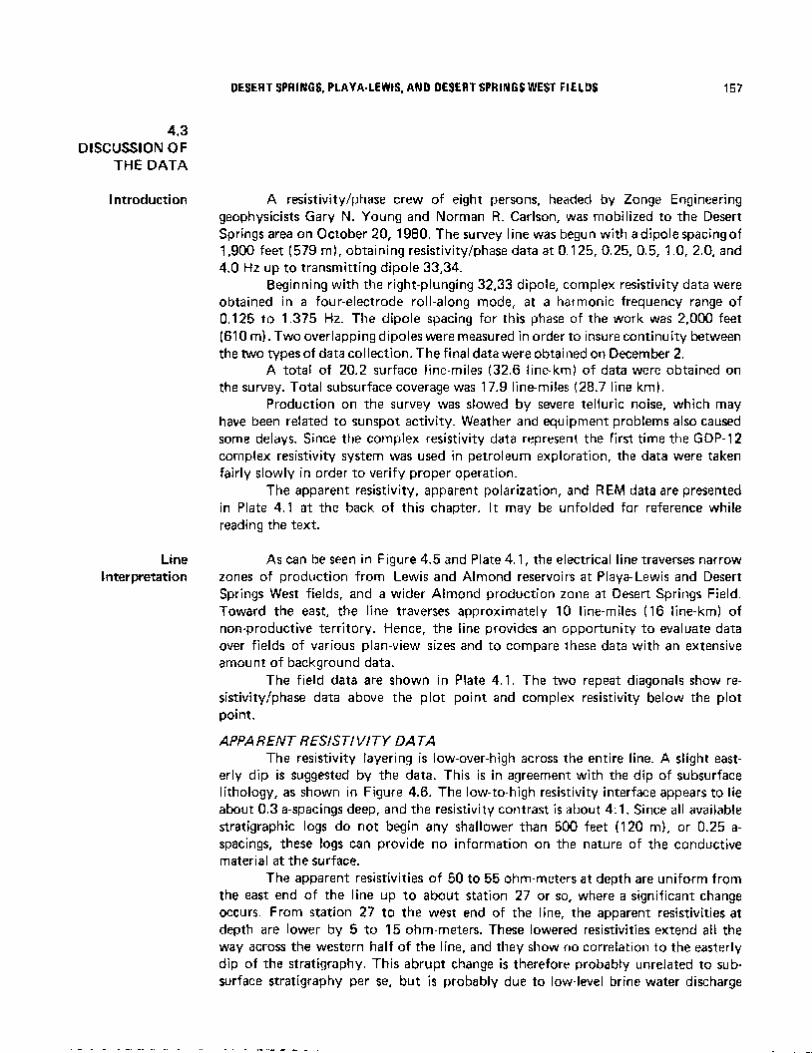
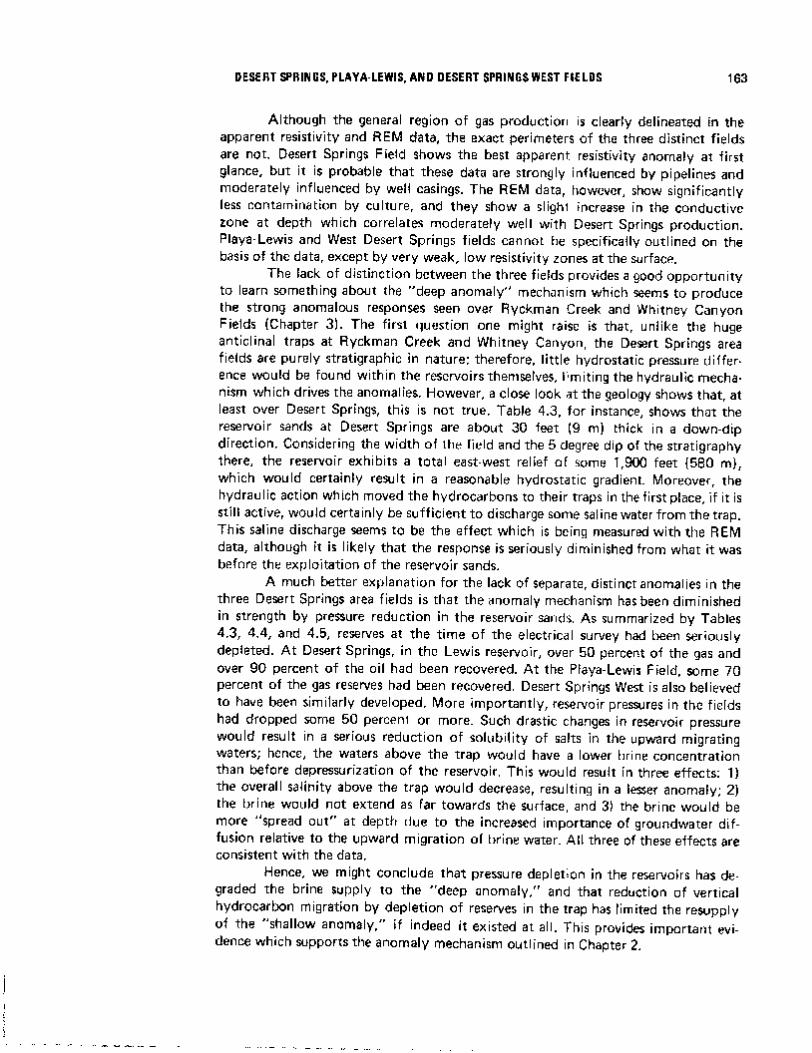
PART THREE: (continued)4. Desert Springs, Playa-Lewis, and Desert Springs West Fields, Sweetwater County,Wyoming
4.1 Introduction4.2 Geologic Background4.3 Detailed Discussion of the Data4.4 Summary and ConclusionsReferences
IP-Petro_5.pdf
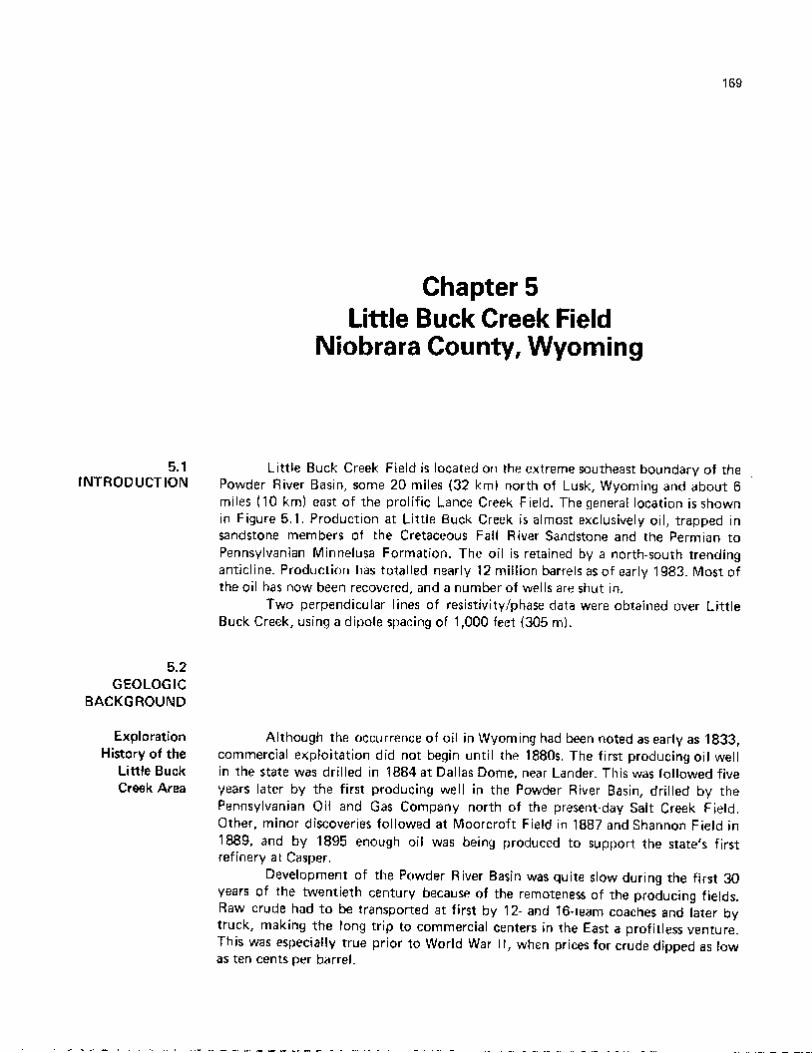
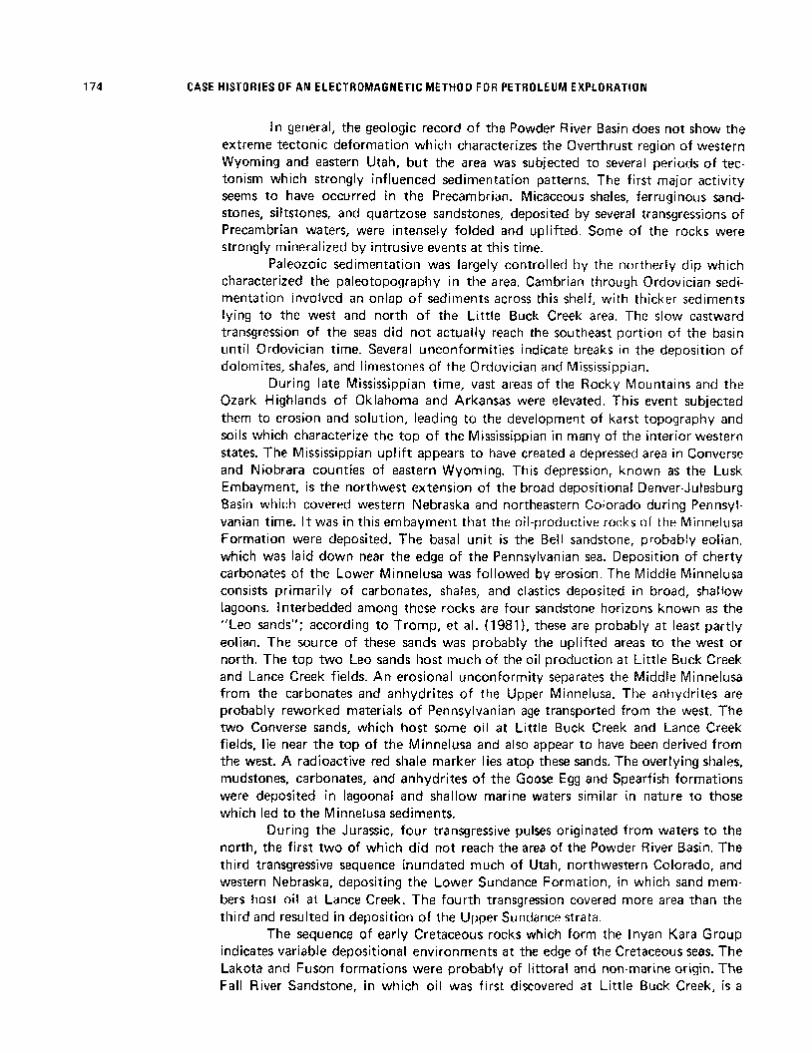
PART THREE: (continued)5. Little Buck Creek Field, Niobrara County, Wyoming
5.1 Introduction5.2 Geologic Background5.3 Detailed Discussion of the Data5.4 Summary and ConclusionsReferences
IP-Petro_6.pdf
PART THREE: (continued)6. Lisbon Field, San Juan County, Utah
6.1 Introduction6.2 Geologic Background6.3 Detailed Discussion of the Data6.4 Summary and ConclusionsReferences
IP-Petro_7.pdf
PART THREE: (continued)7. Trap Spring Field, Nye County, Nevada
7.1 Introduction7.2 Geologic Background7.3 Detailed Discussion of the Data7.4 Summary and ConclusionsReferences

IP-Petro_8.pdf
PART FOUR: ADDITIONAL INFORMATION8. Mechanisms of Current Flow in the Earth
8.1 Introduction8.2 Physical Mechanisms of Galvanic Current Flow8.3 The Origin of Inductive CouplingReferences
9. Principles of Electromagnetic Theory as Applied to Petroleum Exploration9.1 Introduction9.2 Maxwell's Equations9.3 Development of the Vector Wave Equation9.4 Boundary Conditions9.5 DC Solutions to the Vector Wave Equation9.6 AC Solutions to the Vector Wave Equation9.7 Complex Impedance of the Electric FieldReferences
IP-Petro_9.pdf
PART FOUR: (continued)10. A Short History of Electrical Techniques in Petroleum Exploration
10.1 Introduction10.2 The Early Years: 1900 - 194010.3 Continued Development: 1940 - 196010.4 Recent Electrical Work10.5 Into the FutureReferences

PROPRIETARY DATA SALE - 1983
Case Histories of an Electromagnetic Method
for Petroleum Exploration
Zonge Engineering & Research Organization, Inc.

Note of Confidentiality
All data, interpretations, and conclusions in this volume which pertain to the case histories or data processing techniques are proprietary in nature and are covered by the non-disclosure agreement between Zonge Engineering and Research Organization, Inc., and the purchaser. No portion of this information may be disclosed to a third party until the expiration date of this agreement, which is January 1, 1988. The purchaser may copy portions of this volume for his own use within the normal course of business and under the provisions of the non-disclosure agreement, providing that proper credits are given to Zonge Engineering and Research Organization, Inc. Copy No. of copies distributed to: Issued to Dr. Kenneth L. Zonge
Zonge Engineering & Research Organization, Inc. 3322 E. Fort Lowell Rd., Tucson, Arizona 85716 USA
Phone: (602) 327-5501 Telex: 165532 (CEERHO TUC) I

Preface
"Case Histories of an Electromagnetic Method for Petroleum Exploration" is the culmination of five years of field measurements, theoretical studies, and research into the utility of multifrequency electrical measurements in hydrocarbon detection. This volume discusses in detail the current level of understanding by Zonge Engineering of how these types of data are interpreted, why anomalies are observed over hydrocarbon accumulations, which mechanisms cause the anomalies, and the importance of this information in drilling for oil and gas.
The work is divided into four parts for the convenience of the reader. Part One presents two summaries, the Executive Summary, which provides a general overview of the project, and the Summary and Conclusions, which offers a more detailed synopsis of the individual case histories and the results of other work over the past five years.
Part Two covers most of the topics needed to understand the case histories which follow. This includes a review of how the data are acquired, processed, and analyzed for trends indicative of alteration over hydrocarbon traps. A brief discussion of anomaly mechanisms is offered, as well as an analysis of spurious effects due to metal pipelines, well casings, topography, and subsurface geology.
Part Three presents the case histories, which are accompanied by geologic information and detailed data interpretations. The case histories involve 81 line-miles (130 line-km) of electrical data obtained over oil and gas fields in the Rocky Mountain and midwest regions of the United States.
Part Four includes supplementary information which would be of interest to those readers who require additional information on electrical methods. The material includes both a physical and a theoretical description of how electrical current flows through the earth and how we can make sense of all the data we obtain in the field work. The final chapter provides a historical review of electrical measurements as applied to petroleum exploration, as well as some possibilities for future research.
The general approach in this volume is to bring together many ideas and observations which may be valid in electrical exploration, to clear up several misconceptions, and to present electrical data in a way which (hopefully) will help direct further effort in productive directions. However, the real advances of the science lie beyond the presentation of more electrical data. Only through dedicated research of anomaly mechanisms and through a sustained program of geophysical discoveries can the true potential of electrical techniques be fully realized as a valuable supplement to ongoing seismic and geologic exploration programs. Larry Hughes March, 1983
v

Acknowledgments
Putting this volume together has been a fascinating exercise in trying to enlarge the science of electrical exploration, and the satisfaction of having found some preliminary answers is the chief reward of this effort. However, no scientific endeavor is without its human aspects, and it is really humanity which helps give some perspective to scientific inquiry. Many thanks are owed, first and foremost, to the employees of Zonge Engineering for their hard work and cooperation in this and in related efforts. I wish to specifically thank several persons who have been instrumental in publishing this volume: Ken Zonge, for his efforts in reprocessing all the data and for the many helpful suggestions made along the way; Norman Carlson, for much of the processing, modeling, and interpretation, as well as a fortuitously timed Chateau Margaux '78; and my wife, Laura, for her great patience.
I also wish to thank Anne Urizar, for a tremendous drafting effort; Sheryl Recker, Tammy Zonge, Julie Gabriel, and Anne Olson, for typing and finalizing a hastily scribbled manuscript without significant outbreaks of violence; Marjorie Cole, for helping with the programming and modeling; Anita Pape for modeling and editing; and the field crews, for their conscientious efforts to obtain the best possible data. A number of other people helped greatly with the research and editing: Van Reed, Angus Scott-Fleming, Victoria Foscz, Bill Clapper, Don ("Elmo") Chislow, Debbie Newkirk, and Ross Rosenwald. I wish to express my special appreciation to Richard Clark, for putting a banana in my desk. It's still there, Richard. L.J.H. Tucson, Arizona
vii

Table of Contents Note of Confidentiality i Preface v Acknowledgments vii Table of Contents ix PART ONE: SUMMARIES
Executive Summary 1 Summary and Conclusions 5
PART TWO: DATA INTERPRETATION
1. lntroduction to the Data 25 1.1 lntroduction 1.2 Definitions and Plotting Conventions 1.3 Electrical Noise 1.4 lnstrumentation 1.5 Resistivity/Phase Data Acquisition and Field Logistics 1.6 Harmonic Complex Resistivity Data Acquisition and Field Logistics 1.7 Controlled Source AMT Data Acquisition and Field Logistics 1.8 Data Processing Techniques, Resistivity/Phase and Complex Resistivity Data 1.9 Parameters Used in Resistivity/Phase and Complex Resistivity Interpretation References
2. Interpreting Hydrocarbon Anomalies 55
2.1 lntroduction 2.2 Statistical Analysis of Zonge Engineering Hydrocarbon Surveys, 1977 - 1982 2.3 The Direct Detection of Hydrocarbons 2.4 The Origin of Electrical Anomalies over Hydrocarbons 2.5 Well-Casing Effects 2.6 Surface Culture Effects 2.7 Topographic Effects 2.8 Subsurface Geologic Effects 2.9 Anomalies Due to Hydrocarbon Alteration - What to Look For References
PART THREE: CASE HISTORIES
3. Ryckman Creek and Whitney Canyon Fields, Uinta County, Wyoming 101 3.1 lntroduction 3.2 Geologic Background 3.3 Detailed Discussion of the Data 3.4 Summary and Conclusions References
4. Desert Springs, Playa-Lewis, and Desert Springs West Fields, Sweetwater County,
Wyoming 141 4.1 Introduction 4.2 Geologic Background 4.3 Detailed Discussion of the Data 4.4 Summary and Conclusions References
ix

5. Little Buck Creek Field, Niobrara County, Wyoming 169 5.1 lntroduction 5.2 Geologic Background 5.3 Detailed Discussion of the Data 5.4 Summary and Conclusions References
6. Lisbon Field, San Juan County, Utah
6.1 lntroduction 6.2 Geologic Background 6.3 Detailed Discussion of the Data 6.4 Summary and Conclusions References
7. Trap Spring Field, Nye County, Nevada
7.1 lntroduction 7.2 Geologic Background 7.3 Detailed Discussion of the Data 7.4 Summary and Conclusions References
PART FOUR: ADDITIONAL INFORMATION
8. Mechanisms of Current Flow in the Earth 283 8.1 lntroduction 8.2 Physical Mechanisms of Galvanic Current Flow 8.3 The Origin of Inductive Coupling References
9. Principles of Electromagnetic Theory as Applied to Petroleum Exploration 293
9.1 lntroduction 9.2 Maxwell's Equations 9.3 Development of the Vector Wave Equation 9.4 Boundary Conditions 9.5 DC Solutions to the Vector Wave Equation 9.6 AC Solutions to the Vector Wave Equation 9.7 Complex Impedance of the Electric Field References
10. A Short History of Electrical Techniques in Petroleum Exploration 315
10.1 Introduction 10.2 The Early Years: 1900 - 1940 10.3 Continued Development: 1940 - 1960 10.4 Recent Electrical Work 10.5 Into the Future References
x

PART ONE _____________________________
SUMMARIES
xiii


1
Executive Summary
The results of a five-year feasibility study of the utility of electrical measurements in petroleum exploration are very encouraging. Electrical anomalies were measured over 66% of the 29 oil and gas fields involved in the study. The fact that these fields represent both stratigraphic and structural traps at a wide range of depths, with varying production characteristics, and in diverse geologic environments, provides a particularly favorable indication that this technique can be used as a reliable exploration tool, complementing existing seismic and subsurface geology programs.
Case histories of five field projects are presented in this volume in order to illustrate both the advantages and limitations of the method in the context of known geology. The field projects involve a variety of field characteristics, as illustrated in Table 1. The results delineate the following general observations: 1) repeatable anomalies can be measured over oil and gas fields; 2) two types of anomalies are measured-an electrically conductive "deep anomaly," and a polarizable "shallow anomaly;" 3) the anomalies correlate relatively well in plan view with the limits of hydrocarbon production; 4) the anomalies are partly dependent on specific geologic characteristics of the stratigraphic sequence.
TABLE 1 GEOLOGIC CHARACTERISTICS OF FIELDS IN CASE HISTORIES
'Not included specifically as a case history, but described in the text.
Original Reserves Production
Field and Location Type of Trap Oil
(MMBO) Gas
(BCF) Depths (feet)
Ryckman Creek (W. Wyoming Overthrust)
Structural 50 150 7,800 - 9,800
Whitney Canyon (W. Wyoming Overthrust)
Structural 66 3,100 9,200 - 14,200
Desert Springs (Green River Basin)
Stratigraphic 3 410 5,100 - 6,000
Playa-Lewis (Green River Basin)
Stratigraphic -- 9 3,400 - 3,500
Desert Springs West (Green River Basin)
Stratigraphic 1 15 3,800 - 3,850
Little Buck Creek (Powder River Basin)
Structural 12 - - 3,750 - 5,950
Lisbon (Paradox Basin)
Structural 44 250 7,500 - 8,500
Trap Spring (Basin & Range)
Structural & Stratigraphic
5 - - 3,000 - 5,000
Garza (Eastern Shelf, Texas)1
Stratigraphic ? - - 2,900 - 3,300
RESULTS OF THE STUDY

2 CASE HISTORIES OF AN ELECTROMAGNETIC METHOD FOR PETROLEUM EXPLORATION
Figure 1. Schematic representation of the chief mechanisms which may be responsible for electrical anomalies over hydrocarbons, and of typical data sets used for interpretation. A third data set, apparent resistivity, is also used for interpretation but is not illustrated here.

EXECUTIVE SUMMARY 3
As is the case in seismic interpretations, data processing techniques are crucially important in extracting the maximum of information from electrical data. Proprietary data processing techniques have been developed for this purpose. Great care must be taken during interpretation to evaluate effects of pipelines, well casings, topography, and subsurface geology, since many of these effects may result in spurious anomalies unrelated to alteration due to hydrocarbons. The case histories demonstrate the necessity for this type of evaluation.
Strong theoretical and empirical evidence is offered to demonstrate that hydrocarbons are not being detected directly. Instead, evidence shows that the technique is most sensitive to alteration of sediments overlying the oilfield. The alteration may be due to upward migration of saline wavers and separate-phase light hydrocarbons from the trap at depth. The driving mechanism for the upward migration is probably related to vertical hydraulic gradients in porous traps. These ideas are in keeping with many recent hydrologic, geologic, geochemical and theoretical investigations, and are specifically compatible with modern theories of hydrodynamic control of petroleum accumulation.
Figure 1 illustrates the essential aspects of the theory of anomaly generation. The "deep anomaly" appears to be related to slow brine discharge from the traps. The "shallow anomaly" is attributed to one or both of two effects: 1) alteration of the cation-exchange characteristics of layered silicates (primarily clays); 2) the genesis of micron-sized, disseminated pyrite by the chemical combination of iron oxides in sandstones with biogenic hydrogen sulfide. The pseudosections in the lower portion of Figure 1 represent typical data from two parameters normally used for interpretation of the "deep" and "shallow" anomalies.
The unique sets of information offered by seismic and electrical programs suggest using both in an integrated exploration strategy. Seismic data would be essential to providing structural detail of the subsurface, since the lateral and horizontal resolution of seismics is distinctly superior to that of electrical techniques. On the other hand, electrical techniques would be used as indirect, economical methods of evaluating the presence of hydrocarbons by detection of altered sediments above the traps. They would also offer information in areas of difficulty in seismic exploration, such as exploration for subtle stratigraphic traps, and in areas involving severely weathered overburdens, surface volcanics, fractured evaporites, etc. Thus, the combined efforts of geologic, seismic, and electrical programs should prove to be an effective strategic approach to evaluating hydrocarbon potential in geologically attractive target areas.
ORIGIN OF THE
ANOMALIES
EXPLORATION STRATEGY

4 CASE HISTORIES OF AN ELECTROMAGNETIC METHOD FOR PETROLEUM EXPLORATION

5
Summary and Conclusions Extensive field research and theoretical studies conducted over the past five
years have demonstrated that valid electrical anomalies have been measured consistently over oil and gas fields of diverse geologic characteristics, and that these anomalies are probably related in a causal way to the presence of hydrocarbons at depth. This volume presents multifrequency electrical data over nine oil and gas fields as examples of typical anomalies measured in the field. These data strongly suggest that the sediments overlying the hydrocarbons are altered by upward migrating light hydrocarbons and saline waters. Several case histories are presented to illustrate "classical" type anomalies, while other case histories serve to refine current theory as to the specific mechanisms which produce the anomalies. A significant effort is made to identify electrical anomalies which are unrelated to alteration caused by hydrocarbons, such as those due to "culture" (well casings, pipelines, powerlines, fences, etc.), topography, and subsurface geology. As is the case with seismic exploration, the use of advanced data processing techniques is essential to the proper interpretation of these data.
The present study involves multifrequency resistivity/phase and complex
resistivity data, in which both magnitude and phase angle are measured and corrected for array geometry. Data in the frequency range of 0.125 - 1 Hz were obtained with the dipole-dipole array, using currents of up to 18 amperes and dipoles as large as 2,000 feet (610 m). The equipment consisted of two-channel, fully programmable, 12-bit receivers (Figure 1). The data were originally obtained in 1979 and 1980. They have been reprocessed by proprietary techniques and have been reinterpreted with the aid of computer modeling.
Three unique parameters are derived from appropriate data processing techniques: apparent resistivity, apparent polarization, and residual electromagnetic (REM). Apparent resistivity measures the bulk resistance of the ground to the flow of current. Apparent polarization measures the capacitance, or energy storage characteristics of the ground. The REM parameter is an inductive parameter which senses relatively deep lateral resistivity interfaces in the ground. These three parameters are utilized most effectively when they are used together in an integrated interpretation. Figure 2 illustrates typical pseudosection plots of these parameters.
The concepts presented in this volume were developed during five years of
research into the utility of electrical techniques in petroleum exploration. Some 879 line-miles (1,414 line-km) of multifrequency data have been obtained over 29 oil and gas fields and 49 prospects in the United States and Canada (Figure 3). A number of projects have been conducted during this work in order to define the conditions under which the technique works best and to establish a statistically significant data base from which conclusions can be drawn.
The results of this work indicate that two types of anomalies are normally measured in the field. The most common type of anomaly is the so-called "deep anomaly," which consists of a conductive, plume-shaped structure extending vertically from the hydrocarbon trap into the overlying sediments. It is detected by the apparent resistivity and REM parameters. The "shallow anomaly" is much less common; it consists of a polarizable, occasionally conductive feature in the near-surface sediments. The "shallow anomaly" is normally detected by the apparent polarization parameter. The two types of anomalies appear to result from alteration of the
INTRODUCTION
TYPES OF DATA OBTAINED
RESULTS OVER KNOWN FlELDS

6 CASE HISTORIES OF AN ELECTROMAGNETIC METHOD FOR PETROLEUM EXPLORATION
sediments above the hydrocarbon trap by upward-migrating hydrocarbons and saline waters. The alteration mechanisms involve brine replacement of more resistive meteoric waters, clay alteration, and sulfide mineralization (primarily pyrite).
In an effort to establish the frequency with which these anomalies are measured, a statistical analysis was performed of all projects in the Zonge Engineering data base. Apparent resistivity, apparent polarization and REM anomalies were interpreted for spurious effects due to well casings, surface culture, topography, and subsurface structure, and were then analyzed for correlation with the lateral extent of the hydrocarbons at depth. The results of this investigation show that at least one of the three parameters normally used for interpretation shows a recognizable anomaly over 66 percent of the fields. Conductive apparent resistivity and REM anomalies were seen over about two-thirds of the fields, and polarizable anomalies were observed over about one-fourth of the fields. While it is likely that some of the data are still influenced by cultural and structural effects (which are exceedingly difficult to model in some cases), it is clear that a success ratio even as low as 50 percent would be an encouragement to utilize electrical techniques in prospect evaluation. Preliminary statistics on the drilling of electrical prospects suggest that the success ratio is probably much higher than 50 percent, probably because data over prospects are often less contaminated by cultural effects than are data over heavily developed fields.
Figure 1. Equipment calibration and check prior to data acquisition at Lisbon Field. The field work involved a crew of eight, operating three backpack-mounted receivers simultaneously. Present-day surveys require smaller crews.

SUMMARY AND CONCLUSIONS 7
The work done over the 29 fields is represented fairly well both statistically and geologically by the nine case histories presented in this volume. The case histories show a similar "success rate" in apparent resistivity and REM parameters as compared to the larger group, and a somewhat higher "success rate" in apparent polarization. In addition, the case histories show a higher percentage of "uninterpretable" resistivity and REM data due to cultural or subsurface faulting problems. This reflects the fact that the case histories represent a somewhat more difficult group of projects than the larger group of 29 projects.
As shown in Tables 1 and 2, the case histories vary considerably in geologic Characteristics - so much so that, collected together in one volume, they present an excellent opportunity to examine some important aspects of the possible driving mechanisms for the "deep" and "shallow" anomalies. The locations of the fields are shown in Figure 4. Ryckman Creek and Whitney Canyon present classic examples of well-defined anomalies. The line in the Desert Springs area shows how the anomalies change over depressurized stratigraphic reservoirs, while the data obtained over Little Buck Creek demonstrate a similarly depressurized and even more highly depleted reservoir in a structural trap. Data over Lisbon Field provide a fascinating but enigmatic view of how the anomalies are affected by a low-permeability evaporite layer which ov-
Figure 2. Typical data from a hydrocarbon survey are presented in pseudosection form, plotted here for the Ryckman Creekand Whitney Canyon survey. Shaded areas indicate electrically conductive zones (apparent resistivity and REM data) or electrically polarizable zones (apparent polarization data).
SUMMARY OF THE CASE
HISTORIES

8 CASE HISTORIES OF AN ELECTROMAGNETIC METHOD FOR PETROLEUM EXPLORATION
Figure 3. Locations of Zonge Engineering hydrocarbon surveys, 1977 - 1982.

SUMMARY AND CONCLUSIONS 9
erlies the reservoir rocks. Finally, the data over Trap Spring show the effects observed over a tight volcanic-tuff reservoir in which the oils contain no dissolved methane at all. An additional, abbreviated case history over Garza Field shows data over a well-developed but still productive stratigraphic trap before and after development drilling.
TABLE 1: GEOLOGIC CHARACTERISTICS OF FIELDS IN CASE HISTORIES
Original Reserves
Field & Location Discovery
Date Type of Trap Drive Oil
(MMBO) Gas
(BCFG) RYCKMAN CREEK W. Wyoming Overthrust Uinta Co., Wyoming
1976 Structural (thrust-faulted
anticline)
Water 50 150
WHITNEY CANYON W. Wyoming Overthrust Uinta Co., Wyoming
1977 Structural (thrust-faulted
anticline)
Gas expansion 66 3,100
DESERT SPRINGS Green River Basin Sweetwater Co., Wyoming
1958 Stratigraphic (updip facies
pinchout)
Pressure depletion 2.5 410
PLAYA-LEWIS Green River Basin Sweetwater Co., Wyoming
1963 Stratigraphic (isolated sand lens)
Pressure depiction - - > 9
DESERT SPRINGS WEST Green River Basin Sweetwater Co., Wyoming
1959 Stratigraphic Solution gas 1 15
LITTLE BUCK CREEK Powder River Basin Niobrara Co., Wyoming
1944 Structural (anticline) Water 12 - -
LISBON Paradox Basin San Juan Co., Utah
1960 Structural (faulted anticline)
Expanding gas cap & gravity drainage
(Leadville); Solution gas (McCracken)
44 250
TRAP SPRING Basin and Range Nye Co., Nevada
1976 Structural & stratigraphic
Water > 5 - -
GARZA1 Eastern Shelf (Texas) Garza Co., Texas
1935 Stratigraphic ? 0.32 - -
1 Not presented as a case history, but results presented in Chapter 2. 2 In the vicinity of the survey line only; total field reserves are much larger.

10 CASE HISTORIES OF AN ELECTROMAGNETIC METHOD FOR PETROLEUM EXPLORATION
Chapter 3 presents case histories of Ryckman Creek and Whitney Canyon fields, two very important producers in the western Wyoming Overthrust Belt. Ryckman Creek production occurs from an asymmetric, overturned, north-south trending anticline on the hanging wall of the Absaroka Thrust Plate, a major feature in Overthrust geology. Low-sulfur, paraffinic, 47o API gravity oil and sweet gas are found in the Triassic Nugget Sandstone. At present, oil is recovered, and gas is stripped and re-injected back into the structure in order to maintain the reservoir pressure. The system has an active water drive. Natural gas and condensate are also produced from the Triassic Thaynes Limestone. Whitney Canyon is a gas giant, with over 3.1 TCF of gas reserves. Sour gas and condensate are produced from seven pay zones in a thrust-faulted anticlinal trap similar to that at Ryckman Creek. At the time of the electrical survey, most of the wells were shut-in awaiting completion of a gas-sweetening plant, and reservoir pressures and gas reserves were virtually unchanged from the date of discovery. Most of the gas is found in the Mission Canyon Formation of Mississippian age, but other productive zones are found in Triassic to Ordovician units. The system
TABLE 2: RESERVOIR CHARACTERISTICS OF FIELDS IN CASE HISTORIES
Field Exploitation1
Field, Producing Formation & Age
Approx. Production
Depth (feet)
% Decline in Oil
Reserves
% Decline in Gas
Reserves
% Decline in Reservoir
Pressure % Methane
in Trap %
H2S
Connate WaterResistivity
(ohm-meters)RYCKMAN CREEK Nugget Ss. (TR) Thaynes Ls. (TR)
7,800 9,800
minor 3
minor 2
minor2 4
normal 78 79
none 0 0
low 0.2
WHITNEY CANYON Thaynes Ls. (TR) Phosphoria Fm. (P) Weber Ss. (P) Mission Canyon Fm. (M) Lodgepole Ls. (M) Darby Fm. (D) Bighorn Dol. (O)
9,200
11,800 11,200 12,600 13,000 13,500 14,200
minor minor
0 0 0 0 0 0
minor minor
0 0 0 0 0 0
none up 1
0 0 0 0 0 0
normal 80 74 57 67
85
very high 0
6.7 21.3 15.2 15.5 1.0 0.6
moderate 1.05
0.12 DESERT SPRINGS Almond Fm. (K)
5,900
major 90
major 49
major 54
normal 89
low < 0.1
low 0.5
PLAYA-LEWIS Lewis Sh. (K)
3,500
- -
major 68
major 54
normal low 0.18
DESERT SPRINGS WEST Almond Fm. (K)
3,800
major 74
major 98
major normal 91
low 0.03
moderate 1.2
LITTLE BUCK CREEK Fall River Ss. (K) Minnelusa Fm. (P)
3,850 5,500
major major major
- - - - - -
moderate 0.06 0.63
low
0.2 LISBON Leadville Fm. (M) McCracken Ss. (D)
8,000 8,300
major major
- -
minor minor3
minor minor3
normal 50
high 2
very low 0.05 0.05
TRAP SPRING Pritchards Stn. Fm. (T)
> 3,200
moderate moderate
- - - -
low 0
moderate 0.8
moderate 1
GARZA4 San Andres Fm. (P)
3,000
moderate moderate
- - - -
normal very low 0.04
1 Exploitation between discovery date and date of the electrical survey. 2 Pressure maintained by gas injection. 3 Gas stripped and re-injected; minimal pressure depletion. 4 Not presented as a case history, but results presented in Chapter 2.
Ryckman Creek and
Whitney Canyon

SUMMARY AND CONCLUSIONS 11
has a gas-expansion drive. Figure 5 shows the geology and inferred electrical cross-section for the project.
The case history of Whitney Canyon Field provides a classic example of a "deep" hydrocarbon-type anomaly. The apparent resistivity and REM data show strong conductive anomalies which correlate well with the lateral extent of the hydrocarbons at depth. The anomalies appear to extend from near the surface to considerable depth. Since development of the field was in suspension at the time of the survey, cultural interference was minimal. Modeling shows conclusively that the anomaly cannot be attributed to the effects of well casings, pipelines, or any other forms of culture. A study of the subsurface geology at Whitney Canyon rules out structure as an explanation of the anomaly, and modeling shows that the anomaly is not caused or significantly enhanced by the effects of topography. Hence. the very strong, conductive anomaly at Whitney Canyon appears to be the result of electrochemical alteration of some 2,500 feet (750 m) of Tertiary and Cretaceous sediments which overlie the overthrust strata. The direct correlation of the alteration zone with the lateral location of the hydrocarbons at depth suggests that the two are causally related. It is believed that the 4,500 feet (1.400 m) of closure in the Whitney Canyon anticline and the active gas-expansion
Figure 4. Locations of the case histories in this volume.

12 CASE HISTORIES OF AN ELECTROMAGNETIC METHOD FOR PETROLEUM EXPLORATION
drive there provides a strong hydraulic gradient which forces the lighter hydrocarbons and conductive brines vertically out of the trap into the overlying sediments. The brines would lower the bulk resistivities of the sediments either by displacing pore fluids of higher resistivities or by alteration of clays.
Whitney Canyon also shows a weak. polarizable, "shallow" type anomaly which correlates reasonably well with the lateral location of the hydrocarbons. This anomaly cannot be explained by effects due to well casings. surface culture, or subsurface structure. Instead, it is believed to be related to weak mineralization or clay alteration in the near-surface sediments due to upward migration of light hydrocarbons and waters from the trap below.
Figure 5. Combined geological and electrical cross-section of the Ryckman Creek / Whitney Canyon line, with no verticalscale exaggeration. The maximum depth of penetration of the electrical data is about 4.000 to 6,000 feet (1.200-1.800 m); the electrical interpretation below these depths is inferred.

SUMMARY AND CONCLUSIONS 13
Ryckman Creek is located 6 miles (1 0 km) east of Whitney Canyon. The field shows a strong, conductive, "deep anomaly" which is somewhat broader than the extent of the hydrocarbons, partly because of influences from overthrust strata which become shallower east of the field, and partly because of the influence of subsurface thrust faulting on water and hydrocarbon migration from the trap. A well-casing model clearly "overmodels" the data (that is, calculates too strong an effect), but the qualitative results of the model suggest that the anomaly may be explained either by effects of well casings or by hydrocarbon-related alteration. The latter explanation is preferred because of the apparent lack of response of well casings at Whitney Canyon. The 1,500 feet (450 m) of structural closure and the active water drive at Ryckman Creek make it an ideal example of a strong driving mechanism for brine discharge, which is believed to cause the "deep" conductive anomaly.
A fairly polarizable "shallow anomaly" correlates well with Ryckman Creek Field. Modeling indicates that this anomaly is not caused by cultural or structural features, although effects of well casings may enhance the overall response. The anomaly is believed to be related to clay alteration or pyrite mineralization in the shallow sediments, caused by interactions with upward-migrating hydrocarbons and waters from the trap below.
Two other "deep" anomalies which are as yet undrilled are observed on the Ryckman Creek - Whitney Canyon line. A broad, conductive zone at depth just west of Ryckman Creek is a reasonably attractive electrical target. It may possibly be related to a recent Ankareh discovery just 0.5 mile (0.8 km) south of the line. A combined electric-seismic-geologic investigation of this portion of the line would provide an optimum exploration strategy. A second anomaly occurs on the west end of the line. Although insufficient coverage of this feature prevents any conclusive interpretation regarding its origin, it lies on the portion of the line where Mesozoic strata are thrust to the surface by high-angle thrust faulting; hence, the anomaly may be more related to structure than to hydrocarbon-related alteration. This illustrates the necessity of thorough geologic analysis in interpreting electrical anomalies.
Chapter 4 presents data from three fields which differ considerably from Ryckman Creek and Whitney Canyon. Desert Springs, Playa-Lewis, and Desert Springs West production is primarily low-sulfur gas from stratigraphic traps at intermediate depths. Desert Springs gas production in the vicinity of the line is from two sandstone units in the upper Cretaceous Almond Formation. The sands pinch out on their updip sides by a facies change to shales and siltstones; production is limited downdip by the gas-water contact and laterally by facies changes and structure. The drive is pressure depletion. Playa-Lewis gas production is from an isolated sandstone lens in the Lewis Shale of upper Cretaceous age. The field has a pressure-depletion drive. Desert Springs West produces gas along a narrow corridor which crosses the west end of the survey line. The reservoir consists of thin, discontinuous, shoreline sands within the Almond Formation. The field has a solution-gas drive. The important things to note in the reservoir data of Table 2 are the depletion of hydrocarbon reserves in the traps (50 to 90 percent), and the depressurization of the reservoirs (around 50 percent or so). If the present theory as to the anomaly mechanism is correct, the depletion of pressure and hydrocarbon reserves should considerably weaken the driving mechanisms which produce electrical anomalies. Hence, this case history provides an opportunity to test the mechanism over three nearly depleted fields. The interpreted geoelectric cross-section is shown in Figure 6.
Desert Springs, Playa-Lewis,
and Desert Springs West

14 CASE HISTORIES OF AN ELECTROMAGNETIC METHOD FOR PETROLEUM EXPLORATION
The single electrical survey line traversed 10 miles (16 km) of productive area and 10 miles (16 km) of non-productive area. The productive area shows a broad, distinctive, conductive zone at depth, whereas the non-productive area does not. Apart from this broad conductive zone and a culturally-induced anomaly over Desert Springs, none of the three fields shows a strong, unique conductive anomaly which can be specifically related to alteration directly above the hydrocarbons. This is precisely what would be expected from a nearly depleted field: the pressure reduction in the trap would drastically reduce the solubility of salts, perhaps causing them to precipitate before being supplied to the overlying sediments. The broad, weak anomaly over the fields indicates that the anomaly mechanism is not yet completely neutralized.
No "shallow" anomalies are seen over any of the three fields. This suggests two possibilities: 1) "shallow" anomalies never existed in the area; 2) the anomalies existed once, but they were dependent upon resupply of hydrocarbons to maintain the anomalies, a supply which diminished as the reserves at depth were depleted. If true, this possibility could provide important information regarding migration speed.
Little Buck Creek The discussion of depressurized reservoirs in the Desert Springs area is followed in Chapter 5 by a slightly different example over Little Buck Creek Field. This field produces oil from an anticlinal structural trap. There are three producing horizons: the lower Cretaceous Fall River Sandstone (Dakota Sandstone), the Converse sands of the Permian Minnelusa Formation, and the Leo sands of the Minnelusa. The oils are brown to green with gravities of 33o to 42o API. The field has a water drive. The Little Buck Creek reserves are almost completely exhausted; average production for the entire 34-well field is currently only 50 barrels per day. Figure 7 shows the interpreted geoelectric cross-section.
Figure 6. Combined geological and electrical cross-section of the Desert Springs I Playa-Lewis I Desert Springs West line, with no vertical scale exaggeration. The maximum depth of penetration of the electrical data is about 4,000 to 6,000 feet(1,200-1,800 m); the electrical interpretation below these depths is inferred.

SUMMARY AND CONCLUSIONS 15
Two intersecting lines were run at Little Buck Creek. Line 1 is completely contaminated by strong conductive and polarizable effects from surface pipelines. The data from line 2 show a moderately conductive "deep" anomaly. This anomaly may be enhanced somewhat by well-casing effects, but modeling strongly suggests that a slightly conductive anomaly exists at depth on the eastern edge of the field. This anomaly cannot be explained by influences from surface culture, topography, or subsurface structure. Instead, it is believed that the anomaly results from brine discharge from the trap into the overlying sediments. The weakness of the anomaly suggests that the discharge mechanism is quite weak. The reason for this may be related to the depletion of oil and the probable loss of reservoir pressure in the trap. Pressure reduction would cause increased salt precipitation from brines rising from the trap, resulting in a weaker anomaly with less vertical extent.
A weak, polarizable, "shallow" anomaly is observed in the line 2 data. This anomaly may be the resuIt of clay alteration by vertically-migrating hydrocarbons, or low-grade mineralization.
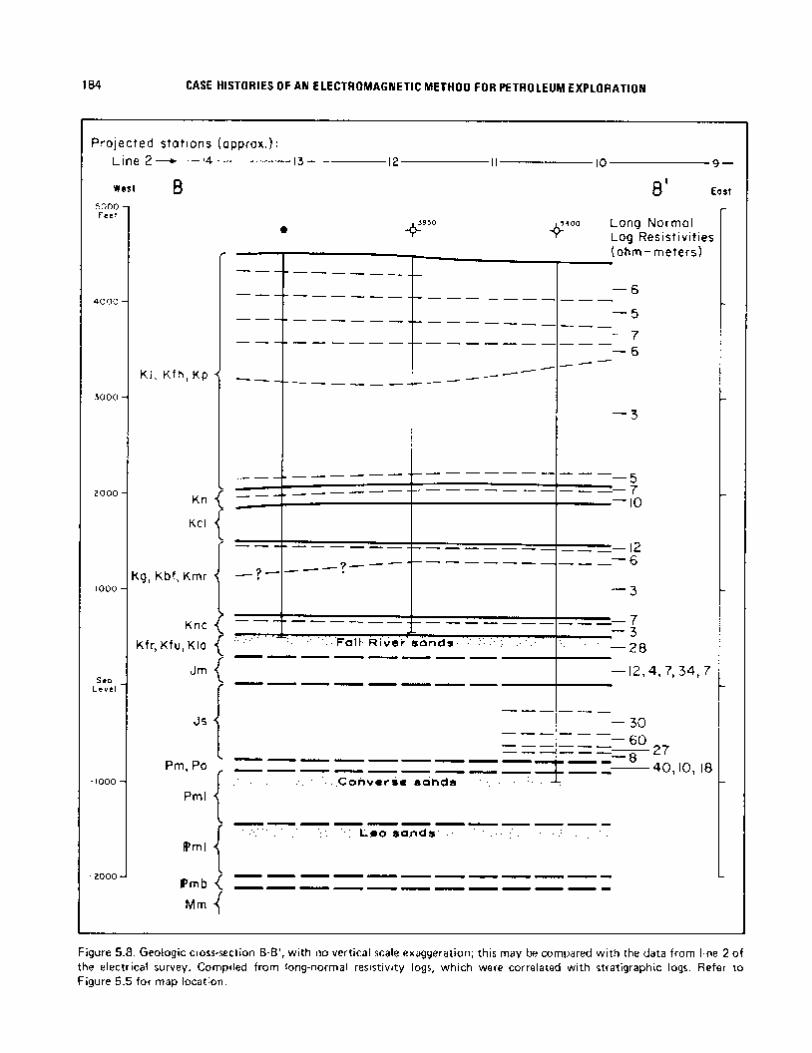
Figure 7. Combined geological, electrical, and electric-log cross-section of Little Buck Creek, line 2, with no vertical scale exaggeration. The maximum depth of penetration of the electrical data is about 2,000 to 3,000 feet (600-900 m); the electrical interpretation below these depths is inferred.

16 CASE HISTORIES OF AN ELECTROMAGNETIC METHOD FOR PETROLEUM EXPLORATION
A very interesting conductive anomaly is observed on the east end of line 2, in an area which has not yet been drilled. The anomaly is not obvious in the apparent resistivity or apparent polarization data, but it is well defined in the REM data due to the greater penetration depth of REM on this survey. Since the anomaly has the magnitude and shape characteristic of hydrocarbon-related anomalies seen elsewhere in the basin, follow-up work is strongly recommended.
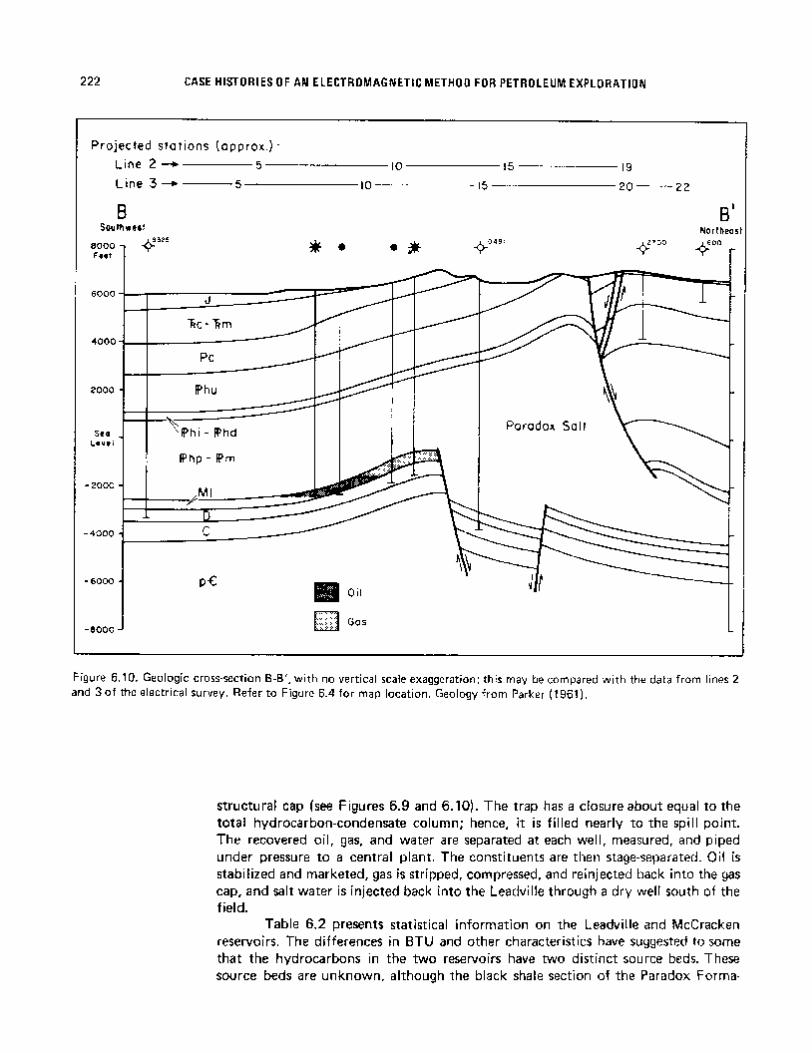
Lisbon Lisbon Field, discussed in Chapter 6, produces oil and gas from a faulted anticlinal trap in the Paradox Basin. The primary reservoir is the Leadville Formation of Mississippian age, which has an expanding gas cap and gravity drainage system. Oil is yellow to red, sour crude of 54o API gravity; gas is sour. Although much of the oil has now been recovered, reservoir pressures are maintained at their original levels by means of gas injection. A secondary, rather limited reservoir is found in the McCracken Sandstone member of the Elbert Formation, a Devonian unit. The reservoir has a solution-gas drive. Red, waxy, 43o to 50o API gravity oil and sweet gas are produced from the McCracken. As shown in the geologic and interpreted electrical cross-section of Figure 8, the Mississippian and Devonian reservoirs at Lisbon are directly overlain by the Pennsylvanian Paradox Salt, a thick section of low-permeability evaporites. The salt is in turn overlain by permeable, water-saturated sediments. The presence of the salt makes Lisbon an interesting project, because one might expect an evaporite of this type to present a permeability barrier to the upward-migrating hydrocarbons and waters which are thought to cause the anomalies.
Two sub-parallel lines and an intersecting cross-line were run at Lisbon. Intermediate to shallow conductive anomalies are seen on all three lines over the producing field, but no classical "deep" conductive anomalies or "shallow" polarizable anomalies are observed. Worst-case well-casing models fail to explain the existing anomalies, and it is also unlikely that the combined effects of surface culture, topography, and subsurface structure can cause the anomalies. Instead, it is believed that the anomalies result from alteration of the sediments overlying the hydrocarbons, as illustrated in Figure 8.
This project represents an interesting "limiting-case" to the anomaly mechanism due to the presence of the Paradox Salt. Hydrocarbons and waters rising from the trap at depth must pass through some 3,000 feet (900 m) of salts before reaching permeable, water-saturated sediments near the surface. At this point, it is difficult to understand the dynamic processes which connect the presence of hydrocarbons at depth to the strong conductive anomaly in the shallow sediments. However, the fact that such an anomaly exists cannot be denied, and this may have important implications in the study of driving mechanisms for the anomalies.
Trap Spring An opportunity to examine yet another "special case" of the anomaly mechanism is provided in Chapter 7 by the data over Trap Spring Field, an oil producer in the Basin and Range province of Nevada. The field is unusual because no methane is dissolved in the oils. Since methane leakage from hydrocarbon traps is believed to be important in producing "shallow" type anomalies, the data over Trap Spring are of particular interest.
Production at Trap Spring is black, 21.5o API gravity crude from the Pritchards Station Formation, a welded ash-flow tuff of Oligocene age. Intergranular permeability in the tuff is nonexistent, and oil is found exclusively in cooling joints and fractures. The trap is a combined structural and stratigraphic type; the producing zone is terminated updip by graben faulting, downdip by the oil-water contact, and laterally and vertically by loss of fracture permeability. Reserves are unknown; some 5 MMBO have been produced, and production is now declining.

SUMMARY AND CONCLUSIONS 17
Three lines of data were obtained over Trap Spring. Lines 1 and 2 appear to have been heavily influenced by effects due to sub-parallel graben faulting. Line 3 shows a strong "deep" anomaly, as shown in the geoelectric interpretation of Figure 9. Arguments are advanced to show that this anomaly is not easily explained by effects due to well casings, surface culture, or geologic structure. Instead, it is believed that the anomaly is the result of invasion of upward-migrating, saline waters into the overlying Horse Camp Formation, a valley fill unit. These waters could lower ground resistivities by replacing waters of higher resistivity, or by altering the abundant clays in the Horse Camp sediments.
A well-defined polarization anomaly observed on all three lines may be partly or totally due to the effects of well casings. The lack of a distinct "shallow anomaly" in the Horse Camp sediments tends to support the theory that upward migration of hydrocarbons causes polarizable mineralization and alteration. Since no light
Figure 8. Combined geological, electrical, and electric-log cross-section of Lisbon, line 3, with no vertical scale exaggeration. The maximum depth of penetration of the electrical data is about 4,000 to 6,000 feel (1,200-1,800 m); the electrical interpretation below these depths is inferred.

18 CASE HISTORIES OF AN ELECTROMAGNETIC METHOD FOR PETROLEUM EXPLORATION
hydrocarbons are present in the Trap Spring oils, none are available for migration, and hence no polarization effects are observed in the sediments overlying the trap.
Garza Presented as an illustration of ambiguities of well-casing modeling, the Garza
Field data in Chapter 2 show a strong polarizable anomaly over a stratigraphic trap in north-central Texas. Data obtained before and after the drilling of four step-out wells indicate that the anomaly is influenced by, but probably not caused by, well-casing effects. Instead, the anomaly mechanism is thought to be related to pyrite mineralization in the reducing environment over the oilfield, a frequent occurrence in the Texas-Oklahoma area. Brine discharge is probably responsible for a subtle "deep anomaly".
As suggested by the case histories, the anomalies measured by multi-
frequency electrical techniques appear to be related to hydraulic discharge of saline waters and light hydrocarbons from the trap at depth into the overlying sedimentary section. The upward-migration theory is in substantial agreement with recent geochemical, geothermal, and hydrological studies, and is specifically compatible with modern concepts of hydrodynamic petroleum accumulation. The theory of anomaly generation is presented in schematic form in Figure 10.
The origin of the conductive "deep anomaly" is believed to be related to the flow of saline water through the trap into the overlying sediments. Two possible anomaly mechanisms are envisioned which might lower the bulk resistivity of the sediments overlying the trap: 1 ) replacement of moderate resistivity interstitial pore fluids with the upward-migrating, lower resistivity, saline fluids; 2) alteration of clays by
Figure 9. Combined geological and electrical cross-section of Trap Spring, line 3, with no vertical scale exaggeration. The maximum depth of penetration of the electrical data is about 2,500 to 3,500 feet (750-1,100 m); the electrical interpretation below these depths is inferred.
POSSIBLE SOURCES
OF THE ANOMALIES

SUMMARY AND CONCLUSIONS 19
Figure 10. Proposed origin of the "deep" and "shallow" anomalies observed in electrical data. The presence and strengthsof the anomalies are variable from project to project, since the anomaly mechanisms are heavily dependent upon geology ofthe sedimentary overburden. This illustration presents an idealized picture of some possible alteration mechanisms.

20 CASE HISTORIES OF AN ELECTROMAGNETIC METHOD FOR PETROLEUM EXPLORATION
cation exchange with free calcium or sodium ions in brines, changes in pore-space geometry, or clay-hydrocarbon interactions.
The origin of the "shallow anomaly" seems to be related primarily to upward migration of light hydrocarbons. At least two theories can be advanced to explain these anomalies. The most common explanation involves the formation of pyrite in the near-surface sediments. Hydrogen sulfide, originating from the trap or created by the reduction of sulfates by anaerobic bacteria, rises through the sedimentary column and combines with iron cements and grain coatings in sandstones, precipitating pyrite. Pyrite has been found in relative abundance over many oil and gas fields, and it often shows a strong polarization response to electrical surveys of this type. The second explanation for the "shallow anomaly" involves clay alteration processes, either through interactions with the rising hydrocarbons or cation exchange interactions with the reduced waters overlying the hydrocarbons. Clays are often quite polarizable, although their responses vary considerably, depending upon clay type, pore space restrictions, lattice impurities, etc. Obviously, both the pyrite and clay theories are subject to the specific geology of the sedimentary column, and this may explain the extreme variability of the "shallow anomaly". Interpretation of the anomalies is therefore facilitated by a careful and detailed evaluation of subsurface lithology, structure, and hydrology.
CONCLUSIONS The case histories contain a large amount of information which may
ultimately prove to be of great value in understanding how electrical anomalies are influenced by geologic factors. Even today, little is known about the dynamics of hydrocarbon/fluid migration and alteration in the deep, geologically complex environments of sedimentary basins. A multidisciplinary approach involving electrical, hydrological, geochemical, geological, and theoretical studies should be undertaken in order to investigate these matters, so that the vast amount of information available in multifrequency electrical data can be utilized more fully.
However, the current problems in detailed understanding of anomaly mechanisms should not obscure the important evidence that electrical techniques such as the one illustrated in this volume seem to work well in many diverse environments, providing that great care is taken in data processing and interpretation. As an exploration tool, the chief advantage of the multifrequency electrical approach is that it can serve as an indirect indicator of the presence of hydrocarbons. This can complement existing reflection-seismic programs, which have structural mapping capabilities far superior to those of most electrical techniques, but which do not generally indicate hydrocarbon potential. In addition, electrical techniques offer valuable information in areas of difficulty in seismic exploration, such as in exploration for subtle stratigraphic traps, and in areas involving severely weathered overburdens, surface volcanics, and fractured evaporites. Hence, the combined efforts of geologic, seismic, and multifrequency electrical programs should form an effective strategy in evaluating hydrocarbon potential in geologically attractive targets.

SUMMARY AND CONCLUSIONS 21


315
Chapter 10 A Short History of Electrical Techniques
in Petroleum Exploration
The utilization of electrical techniques in oil and gas exploration has always been a subject of great interest to geophysicists, largely because of the hope that the application of such techniques would eventually lead to the direct detection of hydrocarbons through their insulating properties. However, 60 years of constant and at times frenzied debate over direct detection has failed to produce clear evidence of success, and wildly unrealistic claims by competitive service companies have done much to discredit the use of all electrical methods in petroleum exploration. Apparently, this was a problem from the very start. Even as early as the 1930s, while the seismic reflection method was evolving from infancy to a dominant role in the oil patch, electrical prospecting was still mired in an abyss of ignorance about the very fundamentals of electromagnetic theory. Peters and Bardeen (1932) commented:
At the present time electrical methods of prospecting for oil seem to be in disrepute. This is partly due to cost of electrical surveys as compared with other geophysical methods and partly due to the failure of the extravagant claims made for the process to materialize. However, the electrical method of prospecting for oil cannot be forgotten because it is one of the two prominent geophysical methods in which it is possible to control the field being employed. Improvements in methods of interpretation and field techniques should give electrical methods a definite field of usefulness in prospecting for oil.
This statement remains valid today, but the situation is even more complex than it was in 1932. The petroleum industry is bombarded with a large number of exploration proposals, some of which are aggressively marketed by persons with minimal technical understanding of the processes they claim to measure. As a result, most if not all electrical methods have quietly been filed in the bottom drawer of "unconventional methods” by the petroleum industry, despite their widespread acceptance and extensive utilization by the mining industry over the past 30 years.
To understand the origin of this prejudice, it is useful to review the efforts of electrical prospectors since they first applied the techniques to petroleum exploration in the 1920s. This will also provide a perspective for evaluating the recent resurgence of electrical techniques in petroleum exploration.
10.1INTRODUCTION

316 CASE HISTORIES OF AN ELECTROMAGNETIC METHOD FOR PETROLEUM EXPLORATION
The early years of electrical methods of geophysical exploration are reviewed in detail by Heiland (1932) and in summary form by Rust (1938). Rust notes that the first use of electrical methods in geophysics is attributed to R.W. Fox. Working in Cornwall mines in 1830, Fox found that the voltages resulting from induced currents were strongly influenced by the presence of ore bodies. He advocated the use of resistance measurements as an exploration tool, but this method was deemed impractical because of contamination of measured voltages by electrode polarization. In 1880, Barus solved this problem by developing a non-polarizing electrode made of a porous wood or unglazed clay cup filled with a metal sulfate solution. Interestingly enough, this invention was very similar in design to the "porous pots" used for potential measurements today. Barus used his new electrodes to trace the Comstock lode past its previously known position.
Electricity had very much captured the public's fancy at this time. Thomas Edison's invention of the incandescent lamp in 1879 was an unparalleled popular success, and further developments of electricity provided conveniences and opportunities never before imagined. It is not surprising, then, that electrical techniques were enthusiastically applied to geological exploration beginning early in this century.
In 1900, Brown and McClatchey applied for a patent on resistivity measurements in the United States, while Daft and Williams proposed the use of potential differences in resistivity work. However, little quantitative work appeared until 15 years later, when Wenner (1915) suggested the use of the four-electrode array which now bears his name. Other arrays were also in use at the time, and there was no general agreement as to which ones were best for exploration.
After testing the DC resistivity method during the years 1913 - 1920, Conrad Schlumberger began to use resistivity mapping as a tool for oil and gas exploration. The approach was to map salt domes and other structures. Work was done in the Pechelbronn oil region from 1921 to 1926, in Romania from 1923 to 1926, and in Alsace from 1926 to 1927. Schlumberger first worked in the United States for Roxana Petroleum Corporation and Shell Company of California from 1925 to 1929. The mapping work tapered off as Schlumberger became increasingly involved in downhole electric logging, but a number of other contractors were heavily involved in surface measurements, including the Swedish-American Prospecting Corporation, Elbof Company, Geophysical Service, Inc., McCollum Exploration Company, Radiore Company, and lnternational Geophysics, Inc. Several oil companies, including Sun Oil, Pure Oil (which later discovered Lisbon Field), and Midwest Refining, maintained in-house electrical prospecting groups. Unfortunately, very little of their work was ever published; and what was published was generally of poor quality.
By the 1930s, field logistics and techniques varied widely. Heiland (1932), Rust (1938, 1940), and other contemporary writers describe at least eight commonly used arrays, which used up to five electrodes. Many of the methodological distinctions drawn by these authors are now insignificant in terms of their application, and for the most part, they would be classified today as resistivity profile or sounding methods. Three field approaches were in common use during the 1930s: the "resistivity" method, the "potential-drop-ratio" method, and the "vertical electric drilling" method. The surveys were made at both AC and DC frequencies, and in some cases phase angle
Methodologyand
Equipment
10.2THE EARLY
YEARS:1900- 1940
GeophysicalDevelopment

A SHORT HISTORY OF ELECTRICAL TECHNIQUES IN PETROLEUM EXPLORATION 317
measurements were carried out, although there is little evidence that phase information was used to any extent for interpretation.
The so-called "resistivity" method involved the transmission of a signal into a long current dipole. The voltage was measured by potential electrodes located either between the current electrodes or near one of them, and an apparent resistivity map was produced.
A second approach, known as the "potential-drop-ratio" method, investigated potential ratios in the vicinity of one of the current poles. The receiving positions were advanced along a traverse, one dipole at a time, with the rear dipole repeating the position previously occupied by the front dipole. By obtaining a ratio of the voltages measured at each set-up by the two dipoles, and by propagating a series of ratios along a traverse, it was possible to make measurements which were independent of the current source strength.
Potential-drop-ratio surveys were laborious, and were not the preferred method used in oilfield work. Instead, the most common technique was one known as "vertical electric drilling," in which an array of three to four electrodes (usually using the Wenner array) was used as an expander around a point about to be drilled. This approach yielded a vertical apparent resistivity sounding, as opposed to the horizontal profile of the potential-drop-ratio method. Heiland notes that interpretation of these electrical data was based upon potential contour maps drawn for various depths of investigation and upon resistivity curves. Results were checked against in-hole electric logs, rock sample measurements, and modeling tank experiments.
Equipment during the 1930s generally consisted of various modifications of the Gish-Rooney apparatus developed in 1925. The receiver consisted of a milli-ammeter for current measurement, a potentiometer for voltage measurement, and a commutator, which provided a low-frequency AC signal. Power was supplied by a hand-driven DC generator, an electric engine, or batteries.
Prior to 1930, electrical exploration was used primarily for structure mapping. Specific targets included salt domes, anticlines, faults, fracture zones, lithologic contacts, and the mapping of glacial overburden. However, keen competition among the numerous service companies and encroachment on electrical "turf" by a rapidly developing seismic industry seem to have encouraged some companies to make claims which could not be supported. Elbof Company has the dubious distinction of being the first to claim success in the direct detection of hydrocarbons. Elbof's "current deflections" in electromagnetic data were made in an area of complex geology, at great depths; their work, which seems not to have been published, was widely disputed. Further work with resistivity and potential-drop-ratio methods was published in 1930, but the data are of poor quality and the conclusions are not convincing. Hedstrorn (1930) argued against the possibility of direct detection, claiming that resistivity contrasts greater than 10:1 would not produce responses significantly different from contrasts of 1000:1 or more, which might be expected at a hydrocarbon interface. Thus, he argued, an oil response could not be distinguished from many other responses in the ground which are unrelated to the presence of hydrocarbons. Heiland, in a carefully neutral discussion of direct detection, observes that direct detection might be viable in the future, but notes that he "believes that several authors who were involved in the animated discussion at that time wish now, in view of the recent developments, that they had not voiced their opinions in the [direct detection] matter."
Heiland does quote two examples of work supporting direct detection. The first is by Lee and Swartz (1930), who showed "vertical electric drilling" or resistivity sounding data from an oilfield in Allen County, Kentucky. The oil lies about 250 feet
Early Claims of Direct Detection
of Hydrocarbons

318 CASE HISTORIES OF AN ELECTROMAGNETIC METHOD FOR PETROLEUM EXPLORATION
beneath a sequence of limestones, cherts, and shales. At first glance, the data appear to show a resistor at depth, but it is difficult to believe that an insulator barely 25 feet (8 m) thick and 250 feet (75 m) deep was detected with the existing equipment. Nevertheless, Heiland was convinced, and he cites a second body of work by Swartz (1932) in which oil was detected at 500 to 800 feet (150 - 250 m), with predictions confirmed by subsequent drilling. One case presented by Swartz shows an anomaly which he attributes to a bed 4 feet thick (1.3 m) buried some 640 feet (195 m) deep. This, of course, is quite impossible to accept, as is Swartz's claim that ". . . the shielding effect of such low resistivity beds as are encountered in oil and gas fields are negligible as far as the detectability of underlying gas and oil horizons is concerned."
During the mid-1930s, the direct detection movement took a new course, de-emphasizing the search for insulators by DC resistivity soundings. Instead, attention was focused on finding electromagnetic transient reflections (Eltran). The psychological incentive to see reflections from depth was certainly understandable, considering the success of seismic reflection methods and the continued desire for a direct indicator of hydrocarbons.
Transient work can be traced back to 1933, when U.S. Patent 1,911,137 was issued to L.W. Blau, a research geophysicist with Humble Oil and Refining. Karcher and McDermott (1935) were evidently the first to advocate Eltran methods for direct detection of oil, and over the next five years, a number of other authors published their results. Keller (1968) provides a working bibliography of these references. Most of the Eltran publications advocate time-domain waveform transients using the four-electrode Schlumberger, Wenner, or dipole-dipole arrays. The results of these surveys, when reviewed in the context of current knowledge, are rather ambiguous. The detection of electromagnetic reflections with the instrumentation of the 1930s is highly unlikely. The first substantial theoretical arguments to this effect were not advanced until the 1950s, even though electromagnetic theory had been up to the task since work by Foster (1931) and Riordan and Sunde (1933).
Although the excitement over Eltran seems to have subsided after 1940, the
basic ideas were inherited by the Elflex company. The history of Elflex can be traced back to an interesting patent (U.S. patent 2,190,320) by Gennady Potapenko (1940), a professor at the California lnstitute of Technology. Potapenko describes laboratory measurements on oil-saturated sands over a frequency range of 0.01 Hz to 100 Hz. The claim was that an oil-saturated sand showed a substantially different voltage decay response than a sand which did not contain oil. Potapenko proposed a measurement system in which a Schlumberger array was used for depth sounding in the field. Haakon M. Evjen, a scientist with Shell Oil Company, evidently had worked with Potapenko for a time, and in 1940 he and Hal Edwards left Shell to apply some of Potapenko's ideas commercially in a company they called Elflex. Patents on electrical prospecting equipment similar to Potapenko's were issued to them in 1944 and 1945. Evjen's first electrical paper, published in 1938 while he was still with Shell, focuses on electrical detection of salt domes and faults. He disclaimed the detection of material at
Early Transient Methods
10.3CONTINUED
DEVELOPMENT:1940 – 1960
Later Transient Methods

A SHORT HISTORY OF ELECTRICAL TECHNIQUES IN PETROLEUM EXPLORATION 319
depth. In his second paper (1943), he expresses the hope that sandstone reservoirs could be traced horizontally, and that lateral changes in conductivity caused by the presence of oil might eventually be detected. In subsequent papers, Evjen and his colleague, W. Bradley Lewis, generally discuss structural mapping and technical considerations of their work; they avoid commenting on direct detection except in a few of their less technical papers (e.g., Evjen 1953). Although Evjen's technical papers in general are of fairly good quality, it is doubtful that he was actually measuring electromagnetic reflections, especially considering the primitive ballistic galvanometers in use at the time (see section 2.3).
During the late 1940s and the mid-1950s, the radio-wave method was applied enthusiastically to hydrocarbon detection. The method used a fixed current antenna and measured a voltage decay curve along an in-line radial. The signal used was at radio frequencies, typically 1 to 2 MHz. One of the chief proponents of this work was W.M. Barret, who claimed that the method lent itself to direct detection of oil. In one article (Barret, 1949), he states that 80.6 percent of the hydrocarbon prospects drilled proved to be productive, and that all condemned prospects proved to be nonproductive. Mooney (1954) investigated these claims and found them to be unsubstantiated, concluding that the true success ratio of radio-wave methods was no better than that which would be expected of a random drilling program in a petroliferous basin.
The whole radio-frequency episode seems odd in retrospect, because it should be fairly obvious that depth penetration in the 1 to 2 MHz range is very small due to severe skin depth attenuation. This was demonstrated by Yost (1952), Pritchett (1952), and Yost et al. (1952). These articles give theoretical and experimental proof that skin depth at such frequencies is hundreds of feet, not the thousands of feet necessary to sound down to oil reservoirs. For example, Pritchett lowered a 1.6 MHz transmitter into a well and found that the attenuation in shales and limestones was 0.75 to 2.0 db per foot (2.5-6.6 db/m). The diversity of opinions over this matter is well demonstrated by the lengthy debate which follows Pritchett's article. Radio methods fell into disfavor in the 1950s, but occasional "discoveries" of the method occurred even as late as the 1970s (Oilweek, 1974b).
The past five years have seen a remarkable resurgence of electrical techniques
in hydrocarbon exploration. Presentations on the subject have increased greatly at recent conventions of the Society of Exploration Geophysicists, and a review of geophysical activity reports shows a dramatic increase in expenditure on electrical work. The number of competing contractors in the field has increased from just a few in 1975 to several dozen in 1982. However, because much of the on-going work is proprietary or has not been published, it is difficult to document the increased activity very accurately. By necessity, therefore, this discussion is incomplete.
Radio-Wave Methods
10.4RECENT
ELECTRICALWORK
Introduction

320 CASE HISTORIES OF AN ELECTROMAGNETIC METHOD FOR PETROLEUM EXPLORATION
The variety of approaches used in the field is impressive, but most on-going work can be classified as follows:
1. Direct Detection of Hydrocarbons x Resistivity methods x Transient methods
2. Indirect Detection of Hydrocarbons (electrochemical alteration) x Induced polarization / resistivity methods x Self-potential methods (oxidation / reduction cells)
3. Structure Delineation x Magnetotelluric methods x Induced polarization methods
As discussed in Chapter 2, the direct detection of hydrocarbons is theoretically possible, providing that they are fairly shallow. However, the extreme difficulties in detecting an insulating target at normal depths have discouraged all but a few contractors from attempting such measurements.
RESISTIVITY METHODS The use of resistivity measurements in direct detection of hydrocarbons has
been the subject of several recent investigations. Kinghorn (1967) performed tests with a pole-dipole resistivity system, by which an insulator was detected at shallow depths; he concluded that direct detection was at least a possibility. George Keller, working at the Colorado School of Mines, has also been interested in the subject for some time. His article in the School of Mines Quarterly (1968) provides a sound discussion of general electrical techniques in the oil patch; in a second informative article in World Oil (1969), he expresses the hope, based on his research on Russian efforts, that improved instrumentation will eventually lead to direct detection of hydrocarbons by electromagnetic methods.
TRANSIENT METHODS The transient methods developed during the 1930s have recently been
practiced by two prominent contractors-Elflex and Electraflex. As mentioned earlier, Elflex was founded by Evjen and Edwards in 1940. Evjen fell ill in the early 1950s and Edwards took over as president of the company, moving its main office to Calgary, Alberta. In 1975, Edwards moved the company back to the United States. The Elflex method was being used under license as recently as 1979 (DESCO, 1979), and it is believed that Elflex had at least one or two crews in the field up to the late 1970s.
Until recently, the Elflex technique was used primarily as a direct-detection method and only secondarily as an indirect method. However, a recent paper by James Powell (1981) indicates that the company has undergone a significant change in its perception of the measurements. Powell pursues an enlightened discussion of alteration mechanisms over oil fields, and concludes:
Anomalously high decay voltages appear over hydrocarbon accumulations. This higher voltage occurs because of induced polarization effects, not because of electromagnetic "reflections." The induced polarization probably results from chemical changes caused by upward migration of hydrocarbons or other compounds from reservoirs. Chemical changes may produce higher induced polarization voltages via metal-electrolyte contact effects, or by means of membrane polarization.
Direct Detection of Hydrocarbons

A SHORT HISTORY OF ELECTRICAL TECHNIQUES IN PETROLEUM EXPLORATION 321
Elflex has recently merged with LaJet Energy Company of Abilene, Texas, and information regarding recent endeavors of the new company is generally unavailable.
Electraflex, a spin-off of EIflex, was formed around 1970. Although the two "flex" companies performed similar services, they were distinct from one another, and the atmosphere between them was not always amicable (Oilweek, 1974a). Electraflex has been propelled to the public spotlight largely through the writings of Jamil Azad, who joined the company as a vice president in 1971. Several of his statements may be of interest to those involved in electrical prospecting: "Electraflex, on the contrary, is 'blind' to conductive material of any kind and reacts only to extremely resistive bodies such as hydrocarbons or the cap rock of a salt dome" (1973) . . . "No effect from the lithologic nature and variability of the surface soil has been documented" (1979a) . . . "In my early writings, I found it impossible to avoid some theoretical discussion of the [Electraflex] subject because many editors pay lip service to the altar of theory, without which, apparently, there can be no respectability . . .” (1981). Such statements tend to cast doubt upon Electraflex's understanding of the phenomena they claim to measure.
The Electraflex method is based exclusively on the theory that oil is an excellent insulator, having a resistivity on the order of 3x10¹¹ ohm-meters, and as such, produces transient reflections when energized by a source current at the surface. A time-domain squarewave signal at about 1 Hz is used, and about 0.05 second after the pulse is turned off, the decay voltage is measured. This technique assumes that all polarization and electromagnetic coupling effects have decayed to a negligible amount after the 0.05 second interval, leaving a transient reflected by the high impedance oil interface. A Schlumberger array is used on all work. Up to 4 kw of power are transmitted into a 2,640-foot (805 m) current dipole; the return voltage is measured in the time domain by a 50-foot (152 m) receiving dipole.
Based upon a large statistical base of 843 wells drilled on anomalies in Canada between 1971 and 1981, Azad claims that 82% of the wells drilled on anomalies were producers, 9% were dry but had shows, and 9% were dry with no shows. Conversely, of 284 wells drilled in non-anomalous areas, 95% were dry. To support these statistics, Azad has published a number of case histories based primarily on relatively shallow fields, although he claims that oil horizons as deep as 16,000 feet (4,900 m) have been detected. Most of the articles dismiss the disruptive effects of well casings and pipelines (when they are perpendicular to the array), but his most recent writings indicate an increased awareness of their importance (Azad 1979a). He has also taken great pains recently to try to prove that the anomalous data are due to reflections from hydrocarbons and not to electrochemical alteration effects.
Electraflex equipment is manufactured by a separate concern, and only recently has the company converted to digital instrumentation. No substantive details are available on this equipment.
INDUCED POLARIZATlON / RESISTIVITY METHODS Indirect detection is a relatively new concept in electrical exploration for
hydrocarbons. Most of the indirect methods are variations of the induced polarization method, which has been used extensively by the mining industry since the 1950s. The use of induced polarization in oilfield applications was first suggested by Mueller (1934), and the induced polarization phenomenon was recognized by Potapenko (1940) when he patented his prospecting system. However, the full power of the multi-frequency induced polarization approach was not really utilized in oilfield work until the late 1970s. Since then, a number of contractors have become involved in the technique; there may be as many as two dozen active at this time. Geophysical activity reports, published
Indirect Detection of
Hydrocarbons (Electrochemical
Alteration)

322 CASE HISTORIES OF AN ELECTROMAGNETIC METHOD FOR PETROLEUM EXPLORATION
annually in Geophysics, show that oilfield induced polarization expenditures have increased from $179,000 (1979) to $1,260,000 (1980) to $3,895,728 (1981).
One of the first companies to apply induced polarization to oilfield exploration in recent years was Colfax Surveys, Ltd., which is mentioned as early as 1976 in the non-technical literature (Oilweek, 1976, 1978). Colfax Surveys used a Schlumberger array with a 440-foot (134 m) current dipole, a 400-foot (122 m) receiving dipole, and a time-domain signal. The method was based upon the geochemical fuel cell model postulated by Pirson (1971, 1974). The object of the surveys was to measure the polarization effect of reducing materials migrating from hydrocarbons at depth. The company is still in existence today.
Educational Data Consultants, Inc. (EDCON) was one of the first companies to publish a detailed case history of induced polarization work over an existing oilfield (Snyder et al. 1981). EDCON had previously specialized primarily in magnetic and gravity techniques, and had recently expanded to electrical methods largely under the direction of Donald Snyder. In early 1979, EDCON and Diversified Exploration Services, Inc. (DESI ) collaborated on a proposal for a speculative survey to investigate the use of induced polarization in oilfield exploration (EDCON-DESI, 1979). The authors of this proposal disputed the "flex" claims of measuring reflection transients, and they proposed that the speculative survey employ multifrequency induced polarization to determine the true source of measured anomalies. The proposal was well thought out, and was offered on a participation basis to the petroleum industry for about $50,000. About a dozen companies participated in the work.
The speculative survey included 13 test sites in Wyoming, Texas, Nevada, Utah, California, and North Dakota. Ten projects were known fields, three were prospects. The fields vary in size from fairly small to the very large Pineview Field. Production depths vary from 4,200 to 13,700 feet (1,300-4,200 m). Some of the data were obtained at four discrete frequencies; other data were acquired in a harmonic complex resistivity mode (Van Voorhis, Nelson, and Drake, 1973; Wynn and Zonge, 1975; Zonge and Wynn, 1975a), using a frequency range of 0.02 to 110 Hz. The dipole-dipole array was employed for most of the work. The digital receiver equipment was designed and manufactured by EDCON (Snyder, 1975; 1976).
The results of the project were somewhat favorable. Six of the known fields showed well-defined polarization responses, while four showed responses which were minimal or uncorrelated with the hydrocarbons. Of the prospects, one anomaly was later drilled; shows of gas were found in the well. Two non-anomalous areas were also drilled, resulting in dry holes. In their summary, Snyder et al. (1981a, 1981b) stated that several surveys were poorly designed; they also pointed out problems in coupling separation in low resistivity ground and the importance of selecting the correct dipole separation in survey work.
EDCON has published three case histories from the speculative survey in promotional literature (Snyder et al., 1981a, 1981b). Work at Lambert Field, in Oldham County, Texas, showed low resistivity and high negative phase angle anomalies which correlated well with the lateral extent of the hydrocarbons. Millis Field, located in the overthrust area of western Wyoming, was surveyed prior to the spudding of the discovery well; neither the resistivity or the phase data showed significant anomalies, possibly because the dipole spacing was too small. Data from Meridian Field, in Loving County, Texas, showed a strong negative phase anomaly, but the resistivity pseudosection was complicated and did not show a clear-cut anomaly.

A SHORT HISTORY OF ELECTRICAL TECHNIQUES IN PETROLEUM EXPLORATION 323
EDCON's conclusion from this work was that the polarization anomalies measured over the known oil and gas fields were caused by micron-sized pyrite particles in the overlying sediments, and not by electromagnetic reflections. It was proposed that pyrite was formed in the overlying sediments by the reaction of iron with sulfur supplied by the upward migration of hydrocarbons. However, Holladay and West (1982) posed an alternative view that the EDCON anomalies may have been from effects due to well casings rather than from any oil-caused alteration. Their paper presented the results of a three-dimensional modeling program in which the Lambert Field data were matched quite well with the calculated well-casing effects. The paper presents a serious objection to the attempts of EDCON, Zonge Engineering and others to prove the viability of induced polarization in oil exploration by showing anomalies over existing fields. This problem is still not fully resolved, and has been discussed at great length in Chapter 2.
Following the publication of the survey conclusions, Snyder left EDCON for a job with Mount Sopris Instruments Company. EDCON has since faded from the electrical exploration scene, and has concentrated on its expertise in gravity and magnetic methods. By 1981, it employed only one electrical oilfield crew; today, the company no longer advertises electrical work. Whether this is due to a change in company philosophy or Snyder's departure is not known.
Zonge Engineering performed its first contract services in hydrocarbon exploration in late 1977, using the harmonic complex resistivity method (Van Voorhis, Nelson, and Drake, 1973; Wynn and Zonge, 1975; Zonge and Wynn, 1975). The current application of the method was originally developed during the early 1970s by Ken Zonge (1972) for laboratory discrimination of various sulfides, and was patented by him in 1976 (U.S. Patent 3,967,190). The technique has been used in the field for the detection of massive disseminated sulfides, geothermal targets, and uranium prospects, and for structural mapping. Wynn and Zonge (1975) introduced the application of electromagnetic coupling to electrical exploration, using proprietary techniques to separate this information from the induced polarization data. With truck-mounted equipment consisting of a Digital Equipment Corporation PDP-8 computer, cassette drive, teletype, a Zonge-designed two-channel receiver, and a 10 to 20 kw transmitter (Zonge, 1973), field work was carried out with the dipole-dipole array at a frequency range of 0.1 to 110 Hz. Beginning in 1980, data were collected with Zonge's two-channel, microprocessor-controlled receiver (Zonge, 1975; Staley, Clark, and Zonge, 1978). At first, measurements at four to six discrete frequencies were made in the 0.125 to 4 Hz range, using a crew of eight and roll-along style logistics. In 1981, software was finalized for running harmonic complex resistivity with the Zonge equipment, and that system has been used since then. Controlled source audiofrequency magnetotelluric measurements were employed for the first time in hydrocarbon exploration in late 1982, although they had been used in mineral exploration since 1978.
A brief discussion of Zonge's hydrocarbon work was provided in 1979, but the first data were not published until three years later (Carlson, Hughes, and Zonge, 1982). This paper presented data from a line run over Lisbon Field, in San Juan County, Utah. A strong conductive anomaly correlates well with the lateral extent of the hydrocarbons. The phase data show a strong, near-surface anomaly, attributed to the influence of a surface pipeline which crosses the line near an electrode station; no residual phase anomaly was seen. A third set of information (called "REM," for residual electromagnetic data) shows a strong conductive feature which, according to the authors, originates from depth. Whereas EDCON had viewed polarization as the diagnostic parameter to be interpreted, the work of Carlson, Hughes, and Zonge indicates that apparent resistivity is the more reliable parameter, and that polarization
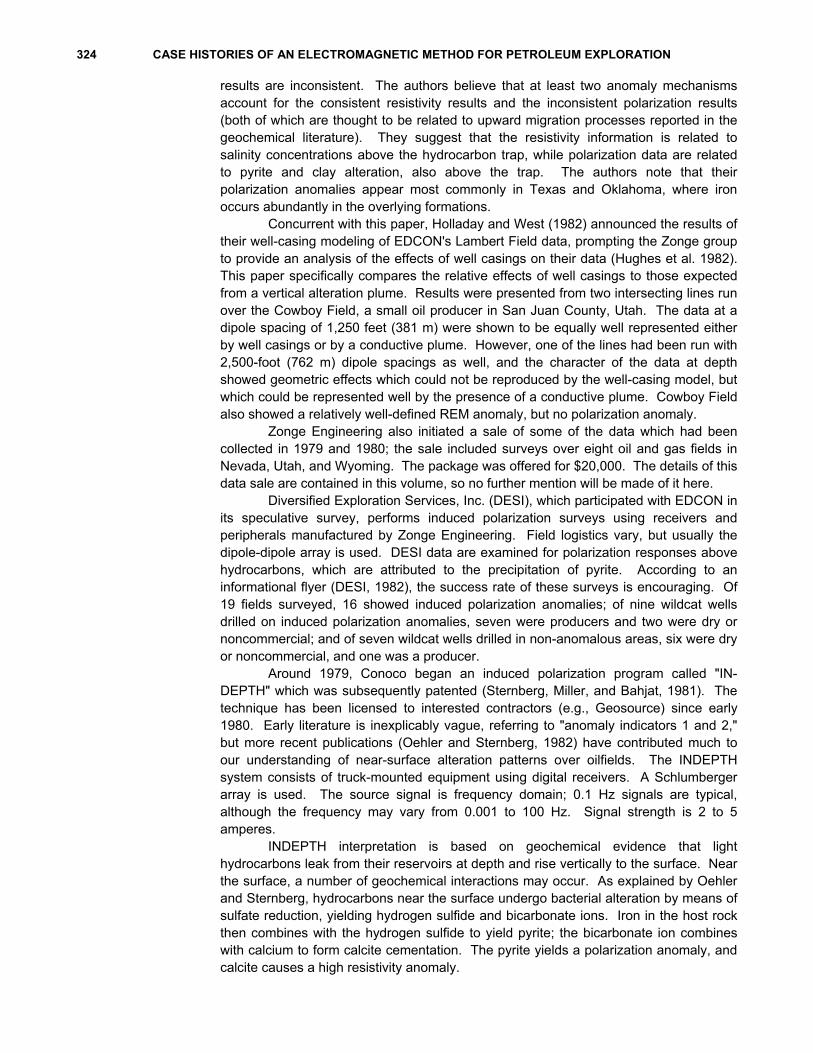
324 CASE HISTORIES OF AN ELECTROMAGNETIC METHOD FOR PETROLEUM EXPLORATION
results are inconsistent. The authors believe that at least two anomaly mechanisms account for the consistent resistivity results and the inconsistent polarization results (both of which are thought to be related to upward migration processes reported in the geochemical literature). They suggest that the resistivity information is related to salinity concentrations above the hydrocarbon trap, while polarization data are related to pyrite and clay alteration, also above the trap. The authors note that their polarization anomalies appear most commonly in Texas and Oklahoma, where iron occurs abundantly in the overlying formations.
Concurrent with this paper, Holladay and West (1982) announced the results of their well-casing modeling of EDCON's Lambert Field data, prompting the Zonge group to provide an analysis of the effects of well casings on their data (Hughes et al. 1982). This paper specifically compares the relative effects of well casings to those expected from a vertical alteration plume. Results were presented from two intersecting lines run over the Cowboy Field, a small oil producer in San Juan County, Utah. The data at a dipole spacing of 1,250 feet (381 m) were shown to be equally well represented either by well casings or by a conductive plume. However, one of the lines had been run with 2,500-foot (762 m) dipole spacings as well, and the character of the data at depth showed geometric effects which could not be reproduced by the well-casing model, but which could be represented well by the presence of a conductive plume. Cowboy Field also showed a relatively well-defined REM anomaly, but no polarization anomaly.
Zonge Engineering also initiated a sale of some of the data which had been collected in 1979 and 1980; the sale included surveys over eight oil and gas fields in Nevada, Utah, and Wyoming. The package was offered for $20,000. The details of this data sale are contained in this volume, so no further mention will be made of it here.
Diversified Exploration Services, Inc. (DESI), which participated with EDCON in its speculative survey, performs induced polarization surveys using receivers and peripherals manufactured by Zonge Engineering. Field logistics vary, but usually the dipole-dipole array is used. DESI data are examined for polarization responses above hydrocarbons, which are attributed to the precipitation of pyrite. According to an informational flyer (DESI, 1982), the success rate of these surveys is encouraging. Of 19 fields surveyed, 16 showed induced polarization anomalies; of nine wildcat wells drilled on induced polarization anomalies, seven were producers and two were dry or noncommercial; and of seven wildcat wells drilled in non-anomalous areas, six were dry or noncommercial, and one was a producer.
Around 1979, Conoco began an induced polarization program called "IN-DEPTH" which was subsequently patented (Sternberg, Miller, and Bahjat, 1981). The technique has been licensed to interested contractors (e.g., Geosource) since early 1980. Early literature is inexplicably vague, referring to "anomaly indicators 1 and 2," but more recent publications (Oehler and Sternberg, 1982) have contributed much to our understanding of near-surface alteration patterns over oilfields. The INDEPTH system consists of truck-mounted equipment using digital receivers. A Schlumberger array is used. The source signal is frequency domain; 0.1 Hz signals are typical, although the frequency may vary from 0.001 to 100 Hz. Signal strength is 2 to 5 amperes.
INDEPTH interpretation is based on geochemical evidence that light hydrocarbons leak from their reservoirs at depth and rise vertically to the surface. Near the surface, a number of geochemical interactions may occur. As explained by Oehler and Sternberg, hydrocarbons near the surface undergo bacterial alteration by means of sulfate reduction, yielding hydrogen sulfide and bicarbonate ions. Iron in the host rock then combines with the hydrogen sulfide to yield pyrite; the bicarbonate ion combines with calcium to form calcite cementation. The pyrite yields a polarization anomaly, and calcite causes a high resistivity anomaly.

A SHORT HISTORY OF ELECTRICAL TECHNIQUES IN PETROLEUM EXPLORATION 325
Using data from in-hole induced polarization measurements of the top 250 feet (75 m) over Ashland Field in southeastern Oklahoma, the authors showed that high polarization and high resistivity are highly correlated in the logs. Through core analysis, they also showed a direct correlation of calcite to high resistivity, and a fairly convincing correlation of pyrite to high polarization. They confirmed that high methane concentrations occur over the field, but not off the field. INDEPTH surface induced polarization measurements plotted in plan view are shown to be correlated with the known extent of the hydrocarbons: the center of the field was more resistive and polarizable than the background. The authors also discuss the false induced polarization anomalies encountered over the Salt Draw prospect in western Texas, which does not host hydrocarbons. The authors conclude that accurate interpretation of their work requires a combination of downhole geologic, geochemical, and electrical analyses correlated with surface electrical data.
Phoenix Geophysics brought its experience from the mining industry to oilfield exploration with a speculative survey in 1982, in which they proposed to develop a 100 kw transmitter to match their seven-channel induced polarization receiver. Fourteen oil companies signed on for the equipment development, for field work over about a dozen known fields, and for research projects related to induced polarization measurements. The total cost was about $110,000 per participant.
Details of the Phoenix program are proprietary, but available data seem to be of good quality. A dipole-dipole array and frequency domain signal are used over a frequency range of 0.0625 to 128 Hz. Resistivity and phase data are obtained, and a Cole-Cole dispersion model (Cole and Cole, 1941; Pelton et al., 1978) is used for decoupling the phase data. Data from the David Field in Alberta have been published (Klein, 1983; Petrick, 1983); they show a fairly distinctive phase anomaly and a minor resistivity anomaly. Sill (1983), basing his idea on the results of a well-casing model developed for Phoenix, suggests that phase data may be strongly affected by well casings.
Reeves Exploration is also engaged in near-surface induced polarization investigations. Using Zonge Engineering receivers and peripherals, Reeves works with a modified Schlumberger array consisting of a 2,640-foot (805 m) transmitting dipole, and a 500 foot (150 m) receiving dipole which is offset 250 feet (175 m) from the transmitting line. Both time-domain and frequency-domain data are obtained, and a convolution of frequency-domain phase, time-domain amplitude, and apparent resistivity is used for interpretation. Reeves has encountered low resistivities and high polarization over typical oil and gas fields. Two Reeves brochures (1980, 1982) present brief case histories of several Texas oilfields. Reeves has recently been acquired by a group of California investors; their future development is not known.
Auriga, Inc. performs its induced polarization services with a small, portable, microprocessor-controlled, two-channel receiver manufactured by Aquila Instruments, an Auriga subsidiary. The polarization parameter is used primarily for interpretation; pyrite is believed to be the causative mechanism for the measured anomalies (Auriga, 1982). William Frangos, the President of Auriga, had worked with EDCON and DESl on their speculative survey.
M.J. Exploration of St. Louis, Missouri (M.J. Exploration, 1982a, 1982b) conducts a time-domain induced polarization survey using a Schlumberger array. The squarewave is transmitted on a two-seconds-on, two-seconds-off cycle; measurements are taken 0.4, 0.8, and 1.6 seconds after the signal is turned off. The company claims to measure "electrically chargeable particles" which occur near the surface because of the upward migration of hydrocarbons from traps at depth. This movement is believed to take place through microseeps (hence the survey name, "MEAS," for "Microseep Electrical Analog Surveys"). Informational brochures claim that 81 percent of the MEAS

326 CASE HISTORIES OF AN ELECTROMAGNETIC METHOD FOR PETROLEUM EXPLORATION
anomalies are associated with hydrocarbons; the rest are due to ore zones and other causes. The two types are distinguished, according to the brochures, by varying the electrode separations. It is claimed that some 96 percent of the wells drilled subsequent to MEAS surveys have been producers.
Transiel, a system developed by Compagnie Générale de Geophysique (CGG 1982), is designed to map changes in polarization caused by the presence of hydrocarbons. A four-seconds-on, four-seconds-off time-domain signal is used in conjunction with a Schlumberger array. Currents of 10 to 50 amperes are used. The truck-mounted system consists of a six-channel digital receiver, magnetic tape recorder, and appropriate electronic gear.
SELF-POTENTIAL METHODS (OXIDATION / REDUCTION CELLS) Self-potential (SP) and magnetic field measurements have been used for over
a decade now in an effort to delineate the "redox fuel cells" popularized by Silvain Pirson. Although the practitioners of this method claim success, the specific details are beyond the scope of this volume. Pirson (1971, 1974, 1976, and 1980) has published some useful references.
The ability of seismic methods to map subsurface structure has greatly surpassed that of electrical methods in terms of penetration and resolution capabilities. For the most part, electrical structure methods are used only in certain areas where seismic methods fail. The structural delineation techniques are generally classified as magnetotelluric methods or as induced polarization methods.
MAGNETOTELLURIC METHODS Electromagnetic techniques have been used in oil exploration since the late
1920s (Sundberg, 1920), and electrotelluric surveys were in use by Schlumberger and by Soviet scientists during the 1930s. The magnetotelluric technique proper was first used in the 1940s, but the method did not become popular until after a pioneering paper by Cagniard (1953). It is beyond the scope of this paper to describe the large body of research in this matter, but useful information of U.S. magnetotelluric work can be obtained from contractors such as Woodward-Clyde Associates and Geotronics. The Soviets have been especially active in magnetotelluric research; some references on this work can be obtained in articles by Keller (1968, 1969) and Caldwell (1969).
INDUCED POLARIZATION METHODS INDESCO appears to be the only major contractor using induced polarization
measurements primarily for structure and lithology detection in the oil patch. The company was founded in 1981 by Howard Renick, Jr., who directed an Elflex speculative survey in 1979 under the company name "DESCO." Renick, James Pritchard (who had worked with George Keller of the Colorado School of Mines), and Jack Jordan are responsible for much of the development of the INDESCO system, which is essentially a hybrid induced polarization sounding system. Sounding curves are configured to resemble downhole electric logs. The data are used to detect lithologic units, changes in porosity or facies, the presence of reefs, and detrital material.
The truck-mounted equipment consists of an eight-channel digital receiver, CRT data display, and floppy disk storage. A 150 kw, 400 Hz, three-phase generator supplies a unipolar time domain signal at currents up to 100 amperes. The arrays used are Schlumberger, modified Schlumberger, or non-collinear dipole-dipole. The literature (INDESCO, 1981; Jordan, Pritchard, and Renick, 1982; Pritchard and Renick, 1982) describes in general terms a complex series of multi-layered models and
Structure Delineation

A SHORT HISTORY OF ELECTRICAL TECHNIQUES IN PETROLEUM EXPLORATION 327
smoothing routines which are applied to the data. Thickness resolution is claimed to be as good or better than 3 percent. A speculative survey in the Pedrogosa Basin of New Mexico was being advertised at the 1982 SEG convention, but no details are generally available.
If there is any value to the preceding discussion, it is in the form of a warning to those who promote electrical techniques: do not allow the enthusiasm of commercial success to overshadow the need for genuine scientific research. The problem of the past has been that some groups, apparently motivated by economic and personal interests, have made fantastic claims for electrical techniques which could not be substantiated. The result is the current atmosphere of suspicion which sometimes clouds an objective evaluation of these methods by the petroleum industry.
The key to the future seems to be in lowering our expectations of what electrical techniques can provide to an exploration program. They will not provide the answers to all exploration problems by themselves, as some have claimed in the past. As those of us who look at geophysical data on a daily basis know all too well, no geophysical interpretation is totally unique; it must be used sensibly in the context of geologic, geophysical, and other data. If we approach the future in this context, we may well find electrical techniques to be the valuable prospecting tool we have been hoping for.
Two exploration approaches show promise during the next decade: the detection of electrochemical alteration over oilfields and the direct detection of hydrocarbons at depth. The detection of alteration has already been demonstrated to be a viable technique, but a great deal of work remains to be done in distinguishing electrochemical anomalies from structural and cultural anomalies, and in providing more quantitative information to the exploration geologist. It is important to realize that anomalies can often be subtle, and the mechanisms which cause them can be very complex. Hence, a full understanding of these mechanisms must surely be gained in order to utilize the technique fully in oil exploration. The second approach, direct detection, should also be considered, despite its unsavory reputation in the past. Some of the evidence that direct detection of hydrocarbons can be achieved, at least over shallow fields in geologically simple environments, appears to be substantiated. However, a complete revolution in instrumentation sensitivity and data processing techniques will be necessary in order to use direct detection as a viable exploration technique for deep fields. Such a revolution is not imminent, but the incentive for it is certainly there.
10.5 INTO THE
FUTURE

328 CASE HISTORIES OF AN ELECTROMAGNETIC METHOD FOR PETROLEUM EXPLORATION
Auriga, 1982, Auriga performs: informational brochure. Azad, J., 1973, Direct oil prospecting with electrical transient reflections: Canadian Jour.
of Geophysics, v. 9, Dec., p. 1 - 11. —, 1979a, Mapping accumulations of oil and gas with electrical transients: Oil & Gas
Jour., Jan. 22, p. 80-84. —, 1979b, Seismic and electrical transients combine to discover oil and gas fields
(unpublished): presented at the 49th Annual lnternational SEG Meeting and Exposition, New Orleans.
—, 1981, Electrical transients – a pragmatic approach to oil and gas discoveries: Oil & Gas Jour., Dec. 21, p. 104-108.
Barret, W.M., 1949, Exploring the earth with radio waves: World Oil, Apr. Blau, L.W., 1933: U.S. Patent 1,911,137, issued May 23, 1933. Cagniard, L., 1953, Basic theory of the magnetotelluric method of geophysical
prospecting: Geophysics, v. 18, p. 605. Caldwell, R.L., 1969, Electrical methods of exploration in the Soviet Union, in
Unconventional methods in exploration for petroleum and natural gas: Dallas, Southern Methodist University, p. 87-104.
Carlson, N.R., Hughes, L.J., and Zonge, K.L., 1982, Hydrocarbon exploration using induced polarization, apparent resistivity, and electromagnetic scattering (abs.): Geophysics, v. 47, p. 451. Full paper available in Technical papers, 51st Annual lnternational Meeting and Exposition, SEG, Los Angeles, v. 3, p. 1339-1358.
CGG, 1982 (?), Transiel, an E.M. method applied to hydrocarbon exploration: information brochure.
Cole, K.S., and Cole, R.H., 1941, Dispersion and absorption in dielectrics: J. Chem. Phys., v. 9, p. 341-351.
Conoco, 1980 (?): INDEPTH informational paper. DESCO, 1979, Sweep: informational brochure on Elflex speculative survey. DESI, 1982, Annual cumulative statistical summary, induced polarization surveys for
hydrocarbons, December, 1982: informational flyer. EDCON-DESI, 1979, Proposal – evaluation of electrical techniques for direct detection
of hydrocarbons: informational paper. Evjen, H.M., 1938, Depth factors and resolving power of electrical methods:
Geophysics, v. 3, p. 78. —, 1942, Utility of the electric methods in geophysical exploration: Geophysics, v. 8,
p. 146. —, 1953, Surface method detects oil directly: World Oil, Feb. Foster, R.M., 1931, Mutual impedance of grounded wires lying on the surface of the
earth: Bell System Tech. Jour., v. 10, p. 408-419. Hedstrom, H., 1930, Geo-electrical exploration methods: The Oil Weekly, v. 58, Jul. 25,
p. 34-36. Heiland, C.A., 1932, Advances in technique and application of resistivity and potential-
drop-ratio methods in oil prospecting: reprinted in Early papers of the Society of Exploration Geophysicists, 1947, p. 420-496.
Holladay, J.S., and West, G.F., 1982, Effect of well casings on surface electrical surveys (abs.): Geophysics, v. 47, p. 439. Full paper available in Technical papers, 51st Annual lnternational Meeting and Exposition, SEG, Los Angeles, v. 2, p. 815-838.
Hughes, L.J., Nosal, E.A., Carlson, N.R., and Zonge, K.L., 1982, Distinguishing well casing from structural effects in electrical anomalies measured over hydrocarbons: a case history (extended abs.): Technical program abstracts & biographies, 52nd Annual lnternational Meeting and Exposition, SEG, Dallas, p. 443-445.
INDESCO, 1981, INDESCO: Electrical geophysics: informational brochure. Jordan, J.M., Pritchard, J.I., and Renick, H., Jr., 1982, Advances in surface-based
electrical resistivity methodology, data acquisition, and processing (abs.): Geophysics, v. 47, p. 438.
Karcher, J.C., and McDermott, E., 1935, Deep electrical prospecting: AAPG Bull., v. 19, p. 64-77.
REFERENCES

A SHORT HISTORY OF ELECTRICAL TECHNIQUES IN PETROLEUM EXPLORATION 329
Keller, G.V., 1968, Electrical prospecting for oil: Quarterly of the Colorado School of Mines, v. 63, no. 2, p. 267.
—, 1969, Electromagnetics may be the key to direct oil finding: World Oil, Dec., p. 85-88.
Kinghorn, G. F., 1967, Electrical methods for deep subsurface exploration: lEEE Trans. on Geoscience Electronics, v. GE-5, p. 51-62.
Klein, J.D., 1983, Spectral induced polarization survey, David Field, Alberta: presented at the 36th Annual Meeting of the Midwest SEG, Denver.
Lee, F.W., and Swartz, J.H., 1930, Resistivity measurements of oil-bearing beds: U.S. Bur. Mines Tech. Paper 48.
M.J. Exploration, 1982 (?)a, Microseep electrical analog surveys: informational brochure.
—, 1982 (?)b, Minimizing false anomalies: informational brochure. Mooeny, H.M., 1954, The status of (non-direct-current) electrical exploration with
special reference to uranium prospecting: Final report to the U.S. Atomic Energy Commission, Contract AT-(49-1)-900.
Mueller, M., 1934: Gerlands beitrage zur angewandten geophysik, v. 4, p. 302-315. Oehler, D.Z., and Sternberg, B.K., 1982, lnduced polarization for hydrocarbon
exploration: geochemical / geological interpretation (extended abs.): Technical program abstracts & biographies, 52nd Annual lnternational Meeting and Exposition, SEG, Dallas, p. 445-448.
Oilweek, 1974a, Electrics 100% accuracy disputed but no 'condemned' well ever came in: Oilweek, Sep. 30.
—, 1974b, From space: radio tool to look for oil and gas: Oilweek, Sep. 30, p. 30-31. —, 1976, Principle of induced polarization applied to geochemical exploration: Oilweek,
Sep. 27, p. 31-32. —, 1978, lnduced polarization explained: Oilweek, May 8, p. 21-23. Pelton, W.H., Ward, S.H., Hallof, P.G., Sill, W.R., and Nelson, P.H., 1978, Mineral
discrimination and removal of inductive coupling with multifrequency induced polarization: Geophysics, v. 43, p. 588-609.
Peters, L.J., and Bardeen, J., 1932, Some aspects of electrical prospecting application: reprinted in Early papers of the Society of Exploration Geophysicists, 1947, p. 145.
Petrick, W.R., 1983, Interpretation of induced polarization data, in Electrical methods in oil and gas exploration, v. 2: Salt Lake City, Earth Science Laboratory, University of Utah Research Institute.
Pirson, S.J., 1971, New electric technique can locate gas and oil: World Oil, Apr., p. 69-72, May, p. 72-74.
—, 1974, Unified magneto-electrotelluric exploration method: Oil & Gas Jour., Mar. 18, p. 138-140, Mar. 25, p. 142-148.
—, 1976, Prediction of hydrocarbons in place by magneto-electrotelluric exploration: Oil & Gas Jour., May 31, p. 82-86.
—, 1980, Pirson: oil is confined in the earth by redox potential barriers: Oil & Gas Jour., Jul 7, p. 153-158.
Potapenko, G., 1940, Method of determining the presence of oil: U.S. Patent 2,190,320, issued Feb. 14, 1940.
Powell, J.A., 1981, Electric transient surveys for hydrocarbon (abs.): Geophysics, v. 46, p. 432. Full paper available in Technical papers, 50th Annual lnternational Meeting and Exposition, SEG, Houston, v. 3, p. 1773-1794.
Pritchard, J.I., and Renick, H., Jr., 1982, Today's exploration capability of electrical method surveys (abs.): Geophysics, v. 47, p. 450.
Pritchett, W.C., 1952, Attenuation of radio frequency waves through the earth: Geophysics, v. 17, p. 193-217.
Reeves Exploration, 1980(?), Electrosearch: informational brochure. —, 1982(?), Electrosearch: information brochure. Riordan, J., and Sunde, E.D., 1933, Mutual impedance of grounded wires for stratified
two-layer earth: Bell Sys. Tech. Jour., v. 12, p. 162-177. Rust, W.M., Jr., 1938, A historical review of electrical prospecting methods:
Geophysics, v. 3, p. 1-6.

330 CASE HISTORIES OF AN ELECTROMAGNETIC METHOD FOR PETROLEUM EXPLORATION
—, 1940, Typical electrical prospecting methods: Geophysics, v. 5, p. 243-249. Sill, W.R., 1983, Cultural effects in induced polarization data, in Electrical methods in oil
and gas exploration, v. 2: Salt Lake City, Earth Science Laboratory, University of Utah Research Institute.
Snyder, D.D., 1975, A programmable digital electrical receiver (unpublished): presented at the 45th Annual lnternational SEG Convention.
—, 1976, Field tests of a microprocessor-controlled electrical receiver (unpublished): presented at the 46th Annual lnternational SEG convention.
Snyder, D.D., Kolvoord, R.W., Frangos, W., Bajwa, Y., Fleming, D.B., and Tasci, M.T., 1981a, Exploration for petroleum using complex resistivity measurements, in Advances in induced polarization and complex resistivity: Tucson, Arizona, short course reprints, University of Arizona, p. 209-253.
—, 1981b, Exploration for petroleum using complex resistivity measurements: information brochure (EDCON).
Staley, R.B., Clark, R.B., and Zonge, K.L., 1978, The GDP-12 geophysical data acquisition system: Proceedings of the Digital Equipment Computer Users Society, v. 5, no. 2.
Sternberg, B.K., Miller, D.E., and Bahjat, D.S., 1981, Electrode prospecting method providing calculable electromagnetic coupling for the indirect detection of hydrocarbon reservoirs: U.S. Patent 4,295,096, issued Oct. 13, 1981.
Sundberg, K., 1930, Electrical prospecting for oil structure: AAPG Bull., v. 14, p. 1145-1163.
Swartz, J.H., 1932, Oil prospecting in Kentucky by resistivity methods: U.S. Bur. of Mines Tech. Paper 521.
Van Voorhis, C.D., Nelson, P.H., and Drake, T.L., 1973, Complex resistivity spectra of porphyry copper mineralization: Geophysics, v. 38, p. 44-60.
Wenner, F., 1915, A Method of measuring earth resistivity: U.S. Bur. Standards Ser. Paper 258.
Wynn, J.C., and Zonge, K.L., 1975, EM Coupling, its intrinsic value, its removal and the cultural coupling problem: Geophysics, v. 40, p. 831-850.
Yost, W.J., 1952, The interpretation of electromagnetic reflection data in geophysical exploration: Geophysics, v. 17, p. 89-106.
Yost, W.J., Caldwell, R.L., Beard, C.I., McClure, C.D., and Skomal, E.N., 1952, The interpretation of electromagnetic reflection data in geophysical exploration (Part 2: Metallic model experiments): Geophysics, v. 17, p. 806-882.
Zonge, K.L., 1972, Electrical properties of rocks as applied to geophysical prospecting: PhD Dissertation, University of Arizona.
—, 1973, Minicomputers used in mineral exploration, or backpacking a box full of bits into the bush: 11th Symposium on Computer Applications in the Mineral Industry, University of Arizona, Tucson, Apr. 16-20.
—, 1975, Field application of minicomputers as used in economic mineral exploration (abs.): Geophysics, v. 41, p. 382.
—, 1976, Method using induced polarization for ore discrimination in disseminated earth deposits: U.S. Patent 3,967,190, issued Jun. 29, 1976.
Zonge, K.L., and Hughes, L.J., 1981, The complex resistivity method, in Advances in induced polarization and complex resistivity: Tucson, Arizona, short course reprints, University of Arizona, p. 163-208.
Zonge, K.L., and Wynn, J.C., 1975, Recent advances and applications in complex resistivity measurements: Geophysics, v. 40, p. 851.

A SHORT HISTORY OF ELECTRICAL TECHNIQUES IN PETROLEUM EXPLORATION 331
Notes

332 CASE HISTORIES OF AN ELECTROMAGNETIC METHOD FOR PETROLEUM EXPLORATION