
CASE FIL COPY - NASA · T _p n CL C1 C m C n CX Cy C Z constant control deflection, rad or deg 2...
98
NASA TECHNICAL NOTE P_ I Z ,¢¢ Z NASA TN D-7511 CASE FIL_ COPY FLIGHT-DETERMINED STABILITY AND CONTROL CHARACTERISTICS OF THE M2-F3 LIFTING BODY VEHICLE by Alex G. Sim Flight Research Center Edwards, Calif. 93523 NATIONAl. AERONAUTICSAND SPACE ADMINISTRATION • WASHINGTON, D. C. • DECEMBER1973 https://ntrs.nasa.gov/search.jsp?R=19740004421 2020-04-02T09:34:46+00:00Z
Transcript of CASE FIL COPY - NASA · T _p n CL C1 C m C n CX Cy C Z constant control deflection, rad or deg 2...

NASA TECHNICAL NOTE
P_I
Z
,¢¢Z
NASA TN D-7511
CASE FIL_COPY
FLIGHT-DETERMINED STABILITY
AND CONTROL CHARACTERISTICS
OF THE M2-F3 LIFTING BODY VEHICLE
by Alex G. Sim
Flight Research Center
Edwards, Calif. 93523
NATIONAl. AERONAUTICSAND SPACE ADMINISTRATION • WASHINGTON, D. C. • DECEMBER1973
https://ntrs.nasa.gov/search.jsp?R=19740004421 2020-04-02T09:34:46+00:00Z


7.
9.
12.
Report No. 2. Government Accession No.
NASA TN D-7511
Title and Subtitle
FLIGHT-DETERMINED STABILITY AND CONTROL CHARACTERISTICS
OF THE M2-F3 LIFTING BODY VEHICLE
Author(s)
Alex G. Sim
Performing Organization Name and Address
NASA Flight Research CenterP. O. Box 273
Edwards, California 93523
Sponsoring Agency Name and Address
National Aeronautics and Space Administration
Washington, D. C. 20546
3. Recipient's Catalog No.
5. Report Date
December 1973
6. Performing Organization Code
8. Performing Organization Report No.
H-791
10. Work Unit No.
756-48-01-00
tl. Contract or Grant No.
13. Type of Report and Period Covered
Technical Note
14. Sponsoring Agency Code
15. Supplementary Notes
i6. Abstract
Flight data were obtained over a Mach number range from
0.4 to 1.55 and an angle-of-attack range from -2 ° to 16 °. Lateral-
directional and longitudinal derivatives, reaction control rocket
effectiveness, and longitudinal trim information obtained from
flight data and wind-tunnel predictions are compared. The
effects of power, configuration change, and speed brake are dis-cussed.
17. Key Words (Suggested by Author(s))
Aerodynamic stability derivatives
M2-F3 lifting body vehicleReaction control rockets
Newton-Raphson method
18. Distribution Statement
Unclassified - Unlimited
19. Security Classif. (of this report)
Unclassified
20. Security Classif. (of this page) 21. No. of Pages 22. Price*Domestic, $3.75
Unclassified 93 Forei, gn, $6:25
* For sale by the National Technical Information Service, Springfield, Virginia 22151


FLIGHT-DETERMINED STABILITY AND CONTROL CHARACTERISTICS
OF THE M2-F3 LIFTING BODY VEHICLE
Alex G. Sim
Flight Research Center
SUMMARY
A flight evaluation of the stabilityand control characteristics of the M2-F3 lift-
ing body research vehicle was made at Mach numbers from 0.4 to 1.55 and angles of
attack from -2° to 16°. Lateral-directional and longitudinal derivatives, reaction con-
trol rocket effectiveness, and longitudinal trim information obtained from flightdata
and wind-tunnel predictions are compared. Data showing the effects of power, con-
figuration change, and speed brake are included.
The flight data for the directional stability derivative, C , were usually lowern_
than the results from wind-tunnel tests. Near a Mach number of 0.95, the flight-
determined aileron effectiveness derivative, C 1 , was lower than the wind-tunnel
a
prediction; otherwise, it was higher than predicted.
Although there was considerable scatter in the longitudinal data, the flight
values of the staticstabilityderivative, C m ,were near the wind-tunnel predic-
tions at Mach numbers of 0.5, 0.7, 0.8, and 1.3. However, at a Mach number of 1.1,
the flight values were higher than the wind-tunnel results.
Reaction control rocket lateral control effectiveness was adequate for maneuver-ing as well as for stability augmentation, whereas longitudinal control effectiveness
was adequate only for stability augmentation.
The longitudinal trim flight data indicated generally that more lower flap deflec-tion was needed to trim at a given angle of attack than was estimated from wind-tunnel data. Speed-brake deflection induced a nose-down pitching moment, andpower effects generally resulted in a nose-up pitching moment. An unsteady power-off trim phenomenon in the transonic Mach number range from 0.88 to 0.95 was indi-cated by the tendency of the vehicle to trim at more than one lower flap deflection forthe same angle of attack.
INTRODUCTION
Lifting bodies are a class of vehicle designed to enter the earth's atmosphere
from orbital speeds and make a horizontal landing. The M-2 shape was one of the
firstliftingbody shapes to evolve. After a lightweight plywood version of the M-2
vehicle (the M2-FI) was flown successfully, a heavier, aluminum vehicle (the M2-F2)
was built to investigate "in-the-atmosphere" vehicle characteristics at subsonic and
transonic speeds. On the sixteenth M2-F2 flight, lateral-directional handling-
qualities problems were experienced, followed by a gear-up landing which exten-
sively damaged the vehicle and terminated the flightprogram. Stability and control
derivatives of the M2-F2 vehicle are given in reference I, and the lateral-directional
handling qualities are analyzed in reference 2.
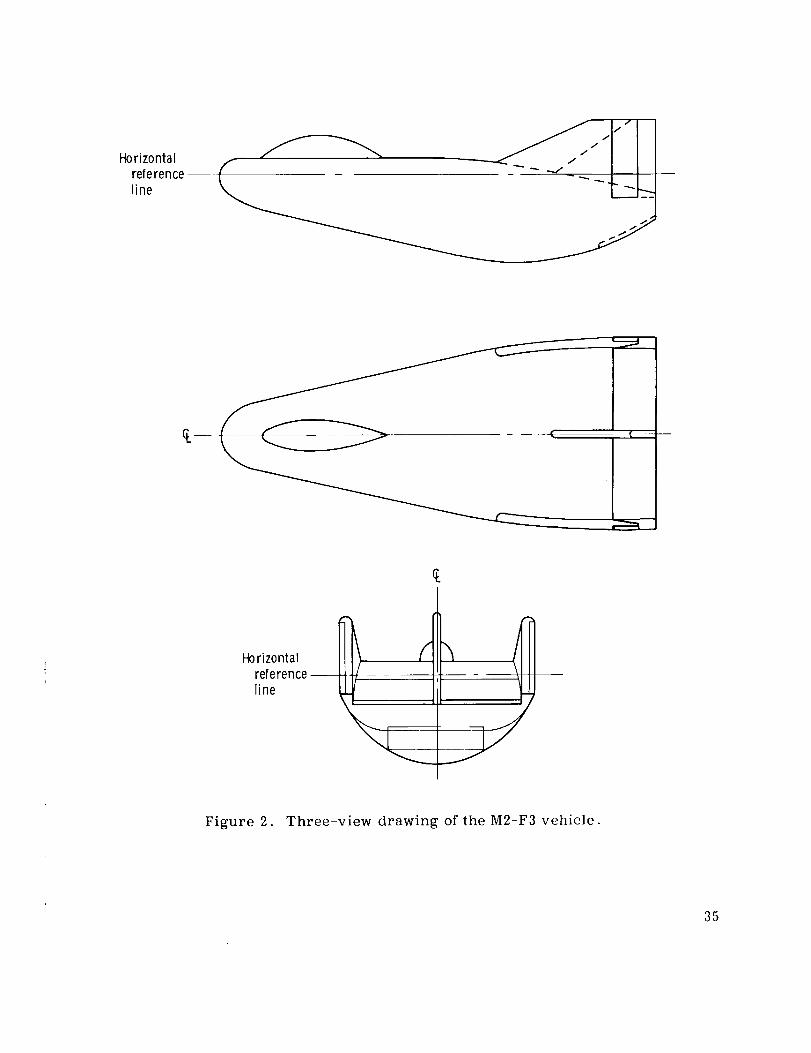
The M2-F2 vehicle was rebuilt and modified by the addition of a third verticalstabilizer. Extensive wind-tunnel tests and dynamic analysis indicated that thismodification would improve the lateral-directional handling qualities. The modifiedM2-F2 vehicle was redesignated the M2-F3. A photograph and three-view drawingof the vehicle are shown in figures 1 and 2, respectively.
During the M2-F3 flight-testprogram, conducted jointly by the National Aero-nautics and Space Administration and the U.S. Air Force, stabilityand control data
were obtained at Mach numbers from 0.4 to 1.55 and angles of attack from -2° to 16°.
These data were used to update the flightsimulator for flightplanning and pilottraining, revise the analysis of handling qualities, verify wind-tunnel predictions,
and document dynamic characteristics. Longitudinal trim information was also ob-
tained from flightdata.
In one of the control system studies made with the M2-F3 vehicle, reaction con-
trol rockets were used to control rollor pitch in the atmosphere.
This report presents the stability and control data obtained during the M2-F3flight program and compares the results with wind-tunnel predictions.
SYMBOLS
Derivatives are presented as standard NASA coefficients of forces and moments.
A right-hand sign convention (shown in fig. 3) is used to determine the direction ofall forces, moments, angular displacements, and velocity.
Physical quantities are given in the International System of Units (SI) and paren-thetically in U.S. Customary Units. All measurements were taken in U.S. CustomaryUnits. Conversion factors are included in reference 3.
A stability matrix, P X P
an
normal acceleration, g

ax
aY
B
b
C
e
F
G
g
H
h
I
IX
IXZ
Iy
IZ
M
M
m
0
P
P
q
q
longitudinal acceleration, g
lateral acceleration, g
control matrix, P × Q
reference body span, m (ft)
transformation matrix, P × P
reference longitudinal length, m (ft)
force, N (lb)
partition of matrix relating the state vector to the observation vector,(R-P) X P
acceleration due to gravity, 9.8 m/sec 2 (32.2 ft/sec2)
partition of matrix relating the control vector to the observation vector,(R-P) X Q
altitude, m (ft)
identity matrix
rolling moment of inertia, kg-m 2 (slug-ft 2)
product of inertia, kg-m 2 (slug-ft 2)
pitching moment of inertia, kg-m 2 (slug-ft 2)
yawing moment of inertia, kg-m 2 (slug-ft 2)
Mach number
moment, m-N (ft-lb)
mass, kg (slugs)
null matrix
number of state variables
rolling rate, rad/sec or deg/sec
number of control variables
pitching rate, rad/sec or deg/sec
3

R
r
S
S
U
U
V
W
X
X
Y
y
Z
3,
A
6a
61
6r
_sb
8U
dynamic pressure, N/m 2 (lb/ft 2)
number of observation variables
yawing rate, rad/sec or deg/sec
reference planform area, m 2 (ft 2)
Laplace transform variable, rad/sec
velocity along X-axis, m/sec (ft/sec)
control vector, Q X 1
velocity, m/sec (ft/sec)
velocity along Z-axis, m/sec (ft/sec)
X-axis
state vector, P × 1
Y-axis
observation vector, R X 1
Z-axis
angle of attack, deg
angle of sideslip, deg
flightpath angle, deg
increment
aileron deflection, 6 - 5 , degUleft u .right
lower-flap deflection, deg
rudder deflection, 6 + 6 , degrleft rright
1 6 vera espoedbrakede ection [<rle,t degaverage upper-flap position, 2 Uleft Uright

60
aI
Ie=_-
0
T
_p
n
C L
C 1
C m
Cn
C X
Cy
C Z
constant control deflection, rad or deg
2reaction control rocket chamber pressure, N/m (psia)
21XZ
arc tan_I Z _Ix)
damping ratio
pitching attitude, deg
time constant, see
angle of bank, deg
undamped natural frequency, rad/sec
lift coeffic'ient, Lif____tt
qS
rolling-moment coefficient,MX
qSb
pitching-moment coefficient,My
qSc
yawing-moment coefficient,qSb
axial-force coefficient,FX
side-force coefficient,Fy
normal-force coefficient,F Z

Nondimensional derivatives, where i --m, X, Z and j ---l, n, Y:
8C. aC.C. - 1 C. - ]
1a aa j6 a/3
aC. aC.C. - 1 C. =__L
_q a2___ ip aP-_2v
aC. 8C.
Ci M = 1 _ j• rb-OM Cjr 0_-_
oc. oc.c. - i c. =___L
081 38 08181 a a
aC. aC.C. - 1 C. - J
I_ 081 ]8 Or1 r
OC L 3cj
CL a = -_a C.JS1- b61
_C LC L -
51 aSl
Dimensional derivatives:
= qSc C
MS1 '_1 Iy mSl ,81
Zq = - qSe C2mY 2 Zq
+I
Z81,81 = m_vvCz61,81
= -qScxX81,81 m 51,81
X 0 = -g cos 0 = - g sin 0Zo V

Mc_= Iy L m_+ 2 tan (_) CmM
Z = C z + 2 tan (a) C z +-_- cosOL ¢i'
C_
-[ < cxM ]m MX =- CX + 2tan (a) C X +_- cos
-sc[M, j= q_c C tan (a) CMu VIy m M 2 2 mc
COS (_
[C z + CZ M M 1 al 2Z u = mV 2 -_ - _- tan (cQC zCOS
Xu qSICx+CxMM 1 _I2cos _=- mV _ _ tan (a) C X
L_ qSb= IX Cli3
qSb__2 C1Lp = 2VIx P
N =-S_cp 2VI z n P
L6 ,6r,61 IXa = C15a'6r'51
_ qSb CN6a,Sr,61 I Z n5
a,6r,61
Y6a,Sr,6 = mvCy 51 a,Sr,61
L r = 2VIx _I r
qSb2cN r = 2VIz n r
Y = sinP
7

Subscripts:
.thi i
.thJ J
X
Y
Z
component
component
X-axis component
Y-axis component
Z-axis component
A dot over a symbol signifies a derivative with respect to time.
M2-F3 VEHICLE
The M2-F3 vehicle is basically a 13 ° blunt, half cone with a boat-tailed afterbody
and three vertical fins. Powered flight was achieved by using any combination ofthe four chambers of the XLRII rocket engine. Physical characteristics of thevehicle are given in table I. Typical variations of the moments of inertia and centerof gravity with gross weight are presented in table 2.
Midway through the flight program, operational considerations dictated that thejettison tubes be moved from the base area to just aft of the outboard vertical fins.The repositioned tubes (fig. 4) are referred to as the outboard fin jettison tubes.
M2-F3 FLIGHT CONTROL SYSTEM
The primary manual control system of the M2-F3 vehicle was an irreversible,dual, hydraulic system. Pitch control was accomplished by moving the center sticklongitudinally, which positioned the lower flap. Roll control was achieved by movingthe center stick laterally, which differentially positioned the upper flaps. Yaw con-trol was obtained through the rudder pedals, which deflected one of the two ruddersijrfaces on the outboard side of the two outer vertical fins. Outboard bias of bothrudders was used as a speed brake. Coarse longitudinal trim (configuration change)was achieved by biasing the upper flaps. These control surface locations are shownin figure 3.
Two vehicle configurations--subsonic and transonic--were used to provide ade-quate stability at transonic speeds as well as low drag (increased lift-to-drag ratio)for approach and landing. Average upper-flap positio_m of -I1.8 ° and -20 ° were
used as the subsonic and transonic configurations, respectively. Control surfacedeflection limits and maximum rates used in the latter part of the flight program are
given in table 3.

The primary stability augmentation system was a three-axis rate feedback sys-tem. The feedback gains were adjustable in flight. Additional augmentation wasprovided by a rate commandaugmentation system or reaction control rockets.
The commandaugmentation system was mechanized in pitch and roll and in-cluded an angle-of-attack hold. The rate commandgains were adjustable in flight.When the commandaugmentation system was engaged, the pilot maneuvered the ve-hicle by means of a side stick on the right side of the cockpit.
The four 400-newton- (90-pound-) thrust reaction control rockets were normally
fired in pairs to control roll or pitch. At firstthe rockets were pulsed manually,
with a simple switch for roll control. Later they were mechanized with either a roll
or a pitch rate feedback and manually controlled through the side stick. The tworocket geometries used are illustrated in figure 5. Roll control was achieved by
using an outboard-opposite-inboard rocket combination. Wind-tunnel information
indicated that Geometry 1 would minimize the aerodynamic interference contribution
to yawing while providing proverse yaw from the staticgeometry during a roll man-euver. On the basis of flight-testresults, however, itwas decided that better
handling qualities in roll would result ifthe totalyawing moment were eliminated.
Thus Geometry 2 was used in succeeding flights.
INSTRUMENTATION
Data were obtained by means of a 9-bit pulse code modulation telemetry system
and were analyzed by using a ground-based computer.
Angle of attack, angle of sideslip, dynamic pressure, and static pressure weremeasured by an instrumented NACA nose boom (ref. 4). Angular positions andrates were measured by rate gyros, and linear accelerations by conventional accel-erometers. Control surface positions were determined by control position trans-mitters.
Corrections were made to the angle-of-attack and angle-of-sideslip data for boomposition, alinement, angular rate, and bending, as well as for upwash (ref. 4). Ve-locity, altitude, and Mach number were calculated on the basis of corrected dynamicand static pressures. Angular rates and linear accelerations were not corrected forinstrument location because this error was within the accuracy of the data acquisitionsystem. The parameters used and the resolution and accuracy of the instrumentationare presented in table 4.
FLIGHT TESTS
Procedures
Frequent weight and balance measurements were made to verify the location ofthe vehicle center of gravity. Moments of inertia were determined experimentallybefore the first M2-F3 flight by means of an inertia swing (ref. 5). The inertia esti-mate was updated analytically whenever the mass distribution changed.
9

Like other liftingbodies, the M2-F3 vehicle was air-launched from a modified
B-52 airplane at an altitude of approximately 14,000 meters (45,000 feet) and a Mach
number of 0.67. (Air launches of the M2-F2 liftingbody are analyzed in reference 6.)
After launch, the pilot flew a preplanned flightprofile. The unpowered, or glide,
flights lasted less than 4 minutes and were usually made below a Mach number of 0.7.
For powered flights, the engine was litimmediately after launch, angle of attack was
increased to gain altitude, and the vehicle was pushed over to increase Mach number.
The powered portion of the flight, which usually lasted from 90 seconds to 180 sec-
onds, was made in the transonic configuration (upper flap at -20°). A change to the
subsonic configuration (upper flap at -i I.8°) was made when the Mach number de-creased to about 0.7. The altitude at this time was about 9150 meters (30,000 feet).
Most of the stabilityand control data were obtained after engine burnout.
In general, maneuvers from which data were obtained were performed at
altitudes above approximately 6100 meters (20,000 feet) to provide the pilot with
enough time to set up for the final approach and landing. The trajectories flown
precluded steady flightconditions. To maintain satisfactory handling qualities, at
least one augmentation system was generally used throughout the flightprofile,
particularly above a Mach number of 0.75. However, damper gains were often re-duced or turned to zero for data maneuvers.
Maneuvers
Because of the limited time available for obtaining flight data and the rapidly
changing flightconditions, there was only one opportunity to perform each maneuver.
Thus maneuvers were practiced on a simulator before each flight. Postflight analysis
of these maneuvers showed that a doublet or pulse, followed by 2 seconds to 5 sec-
onds in which the pilot made no input, was most effectivein providing derivative
data when augmentation damper gains were zero or below 0.5 deg/deg/sec. An ex-
ample of this type of maneuver, which has been used often to obtain data from which
derivatives can be extracted, is shown in figure 6. When moderate-to-high damper
gains were used, a pilot-induced continuous control input produced better results.
An example of this type of maneuver is shown in figure 7. In the latterpart of the
flightprogram, the angle-of-attack-hold of the command augmentation system aided
the pilot in holding a constant angle of attack during lateral-directional maneuvers.
The effectiveness of the reaction control rockets was evaluated by manually
pulsing the rockets.
Power-off longitudinal trim information was obtained from planned pushover-
pullup maneuvers as well as during other portions of the flight. No planned maneu-
vers were used to obtain power-on trim data.
METHOD OF ANALYSIS
Derivative Determination
A digital computer program was used to identify either lateral-directional or
longitudinal sets of derivatives from flightdata. This computer program, which uses
I0

a modification of the Newton-Raphson method, is referred to as the Newton-Raphson
program. The program, its theory, and its application are discussed in detail inreferences 8 to 10. The sets of equations (model) used to identify the derivatives
for this report are given in appendix A.
The Newton-Raphson program is an iterative technique which usually takes from
three to six iterations to converge to a final set of derivatives. Basically, the pro-
gram simultaneously changes all derivatives to minimize the error between computedand measured time histories. This error is based on the integral of the sum of the
differences squared of each of an ensemble of flight and computed time histories.The output time histories are assumed to contain noise, but the (control) input timehistories are defined as noise free.
In the lateral-directional mode, the input time histories normally used were therecorded aileron and rudder deflections. Occasionally, reaction control rocket
chamber pressure was used. The output time histories used were roll rate, yaw rate,sideslip angle, bank angle, and lateral acceleration. Rolling and yawing angularacceleration were used when available. In the longitudinal mode, the input time
histories used were lower flap deflection and sometimes reaction control rocketchamber pressure. The output time histories used were angle of attack, pitch angle,pitch rate, and normal acceleration. Pitching angular acceleration was sometimesused.
A frequently used option, called "a priori," allowed the starting set of deriva-tives to be weighed, which tended to hold derivatives near their starting value if noinformation about them was contained in the maneuver. Early in the flight program,
wind-tunnel predictions were used as starting values. However, as different trends
in the data developed, previously obtained flight-determined derivatives were used.At first and then after every few flights, maneuvers were analyzed without using the
a priori option to insure that the a priori weighing values were not too high.
Effect of stability augmentation.-When augmentation systems are engaged, alinear dependence can develop between stability and control derivatives; therefore,the a priori option was used in this study. Furthermore, increasing the dampergains removes progressively more of the vehicle's transient response, so that thecontrol system characteristics gradually dominate the output time response. Theseeffects of the automatic control system may improve handling qualities; however, atthe same time, they make identifying the basic open-loop vehicle extremely difficult.Unfortunately, stability augmentation was generally used above a Mach number of0.75. If it is desirable to fly through an area where a vehicle has poor open-loopcharacteristics, then it will usually be the area of greatest interest, but unfortunately
also the one requiring the highest damper gains to insure satisfactory handling qual-ities. With the high damper gains, the resulting lack of transient response necessi-tated continuous pilot control inputs, because, it was reasoned, more informationwould be contained in forced motion than in no motion at all. Control derivatives
extracted were used only if the maneuver contained a pilot input for that control(i.e., rudder derivatives obtained from aileron maneuver data were not consideredvalid).
Longitudinal derivative considerations.-Both longitudinal and lateral-directionalderivatives were extracted from data obtained when an augmentation system was
ll

engaged. The longitudinal mode, because of additional problems, was the moretroublesome of the two. An indication of someof the problems experienced in thismode is evident in the nonlinearity of wind-tunnel pitching-moment curves at tran-sonic speeds. An example is shown in figure 8 for a Mach number of 0.95. Thenonlinearities in these pitching-moment curves cause the longitudinal static stabilityand the lower flap control effectiveness to be sensitive to small changes in angle ofattack and longitudinal trim. The curves also change significantly with upper flap
+1bias; however, in flight the bias was kept between _ of the wind-tunnel reference
values. All flight-determined longitudinal derivatives were corrected to the wind-tunnel reference center of gravity of 0.496 of chord (body length).
Longitudinal Trim
Longitudinal trim information was obtained during periods in the flights when the
pitching angular acceleration was less than +3 deg/sec 2, the pitching rate was less
than -+9 deg/sec, and the rate of lower flap movement was subjectively small. Trimdata that met the first two requirements were identified by using a simple digital com-puter program. Lower flap movement was scanned by hand. Data were categorizedby engine chamber, speed-brake setting, and configuration. All trim data werecorrected to the longitudinal wind-tunnel reference center of gravity (0.496 of chord).For comparison with wind-tunnel data, the lower flap position data were adjustedanalytically to compensate for the flight upper flap bias being slightly different fromthe selected references of-11.8 ° (subsonic configuration) and -20 ° (transonic config-uration).
Dynamic Characteristics
The open-loop dynamic characteristics were determined by fairing flight data fornine flight conditions. Data were calculated by using a three-degree-of-freedomdigital computer program which solved for the characteristic roots and transferfunction numerators. When flight data were not available, wind-tunnel data wereused. The open-loop characteristics of the vehicle are tabulated in appendix B.
WIND-TUNNEL DATA
Wind-tunnel tests of the M2-F3 vehicle were made at the Ames Research Center.
Although results of the tests have not yet been published, a limited amount of datafor a vehicle with a center fin configuration similar to that of the M2-F3 vehicle isincluded in reference II.
For this study, damping derivatives were estimated from trends of theoretical andflight results for earlier vehicle configurations (refs. 1 and 2). All other derivatives
and trim data referred to as wind-tunnel data are based on the unpublished M2-F3data. The wind-tunnel lateral-directional derivatives were obtained from data for
the available boattail angles (upper flap and lower flap settings) at wind-tunnel-predicted longitudinal trim conditions. Thus the boattail angles obtained from the
12

wind-tunnel tests are not necessarily the sameas those used in flight.
PRESENTATIONOF DATA
The flight conditions, in terms of Math number and angle of attack, at whichderivatives were obtained are presented in figure 9(a) for the lateral-directionalderivatives and in figure 9Cb) for the longitudinal derivatives. The lateral-directional derivatives are presented as a function of angle of attack for wind-tunnelMath numbers of 0.5, 0.7, 0.8, 0.9, 0.95, i.I, and 1.3 in figures I0 to 16. Thecorresponding longitudinal derivatives for Math numbers near 0.5, 0.7, 0.8, I. 1,and 1.3 are presented in figures 17 (a) to 17 (e). For Mach numbers from 0.86 toI. 08, longitudinal derivatives are presented in figures 18 (a) to 18 (c) as a functionof Math number for angles of attack of 3.6 °, 5.1 °, 7.2 °, I0.5 °, and 12.4 °, except for
the pitch-damping derivative, Cm , which was estimated only as a function of Machq
number. Flight derivatives were also determined for Math numbers and angles ofattack beyond those shown in the figures. The values of all the derivatives obtainedare presented in table 5.
Control-effectiveness data for the reaction control rockets are presented in theform of changes in moment coefficients due to the pulsing of one or two rockets.Data obtained during roiling maneuvers are presented in figures 19 and 20. Dataobtained in pitching maneuvers are shown in figures 21(a) and 21(b).
Longitudinal trim data for the subsonic configuration are presented as a functionof angle of attack for Mach numbers of 0.5 and 0.7 in figures 22(a) and 22(b). Data
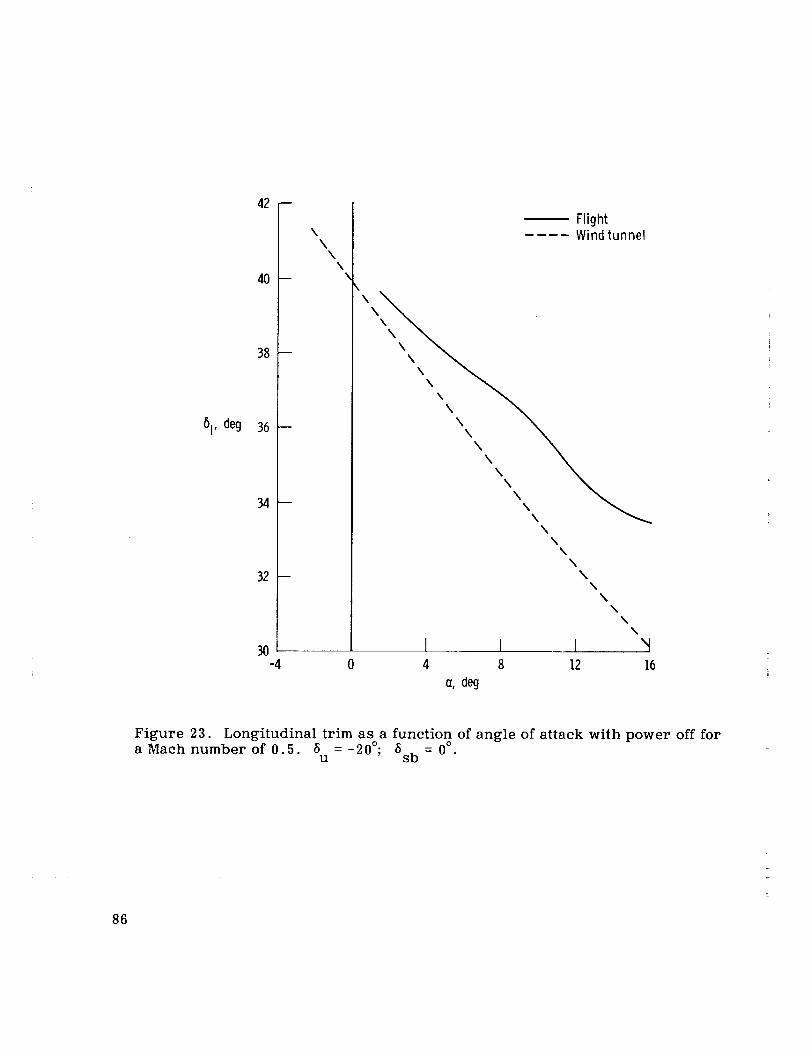
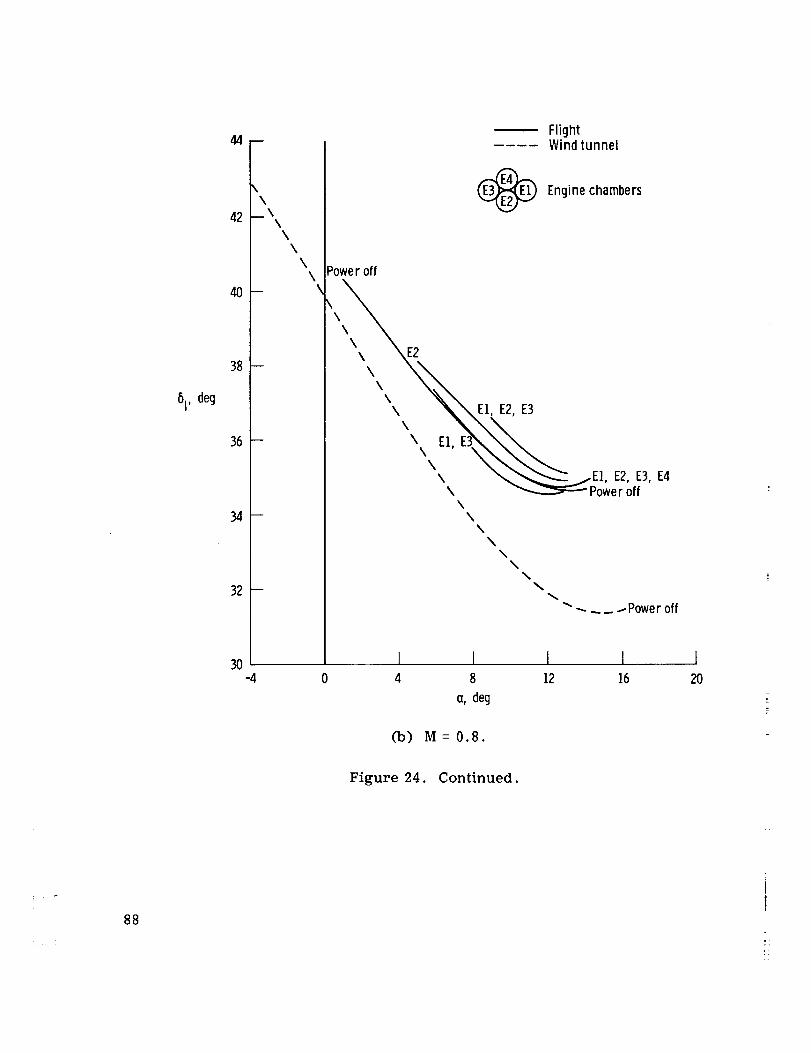
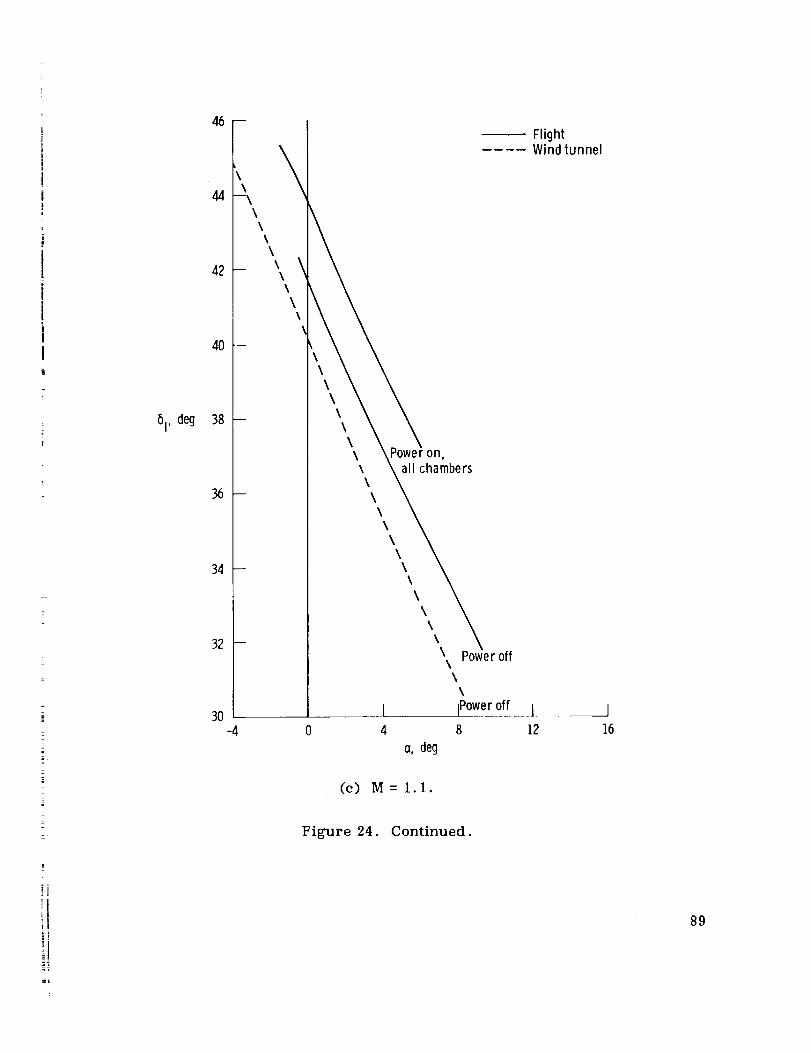
for the transonic configuration are presented in figures 23 and 24 for Mach numbersof 0.5, 0.7, 0.8, 1.1, and 1.3. Trim data are presented as a function of Mach num-ber, over the Math range from 0.88 to 1.04, in figures 25(a) to 25(c).
DISCUSSION
Lateral-Directional Derivatives
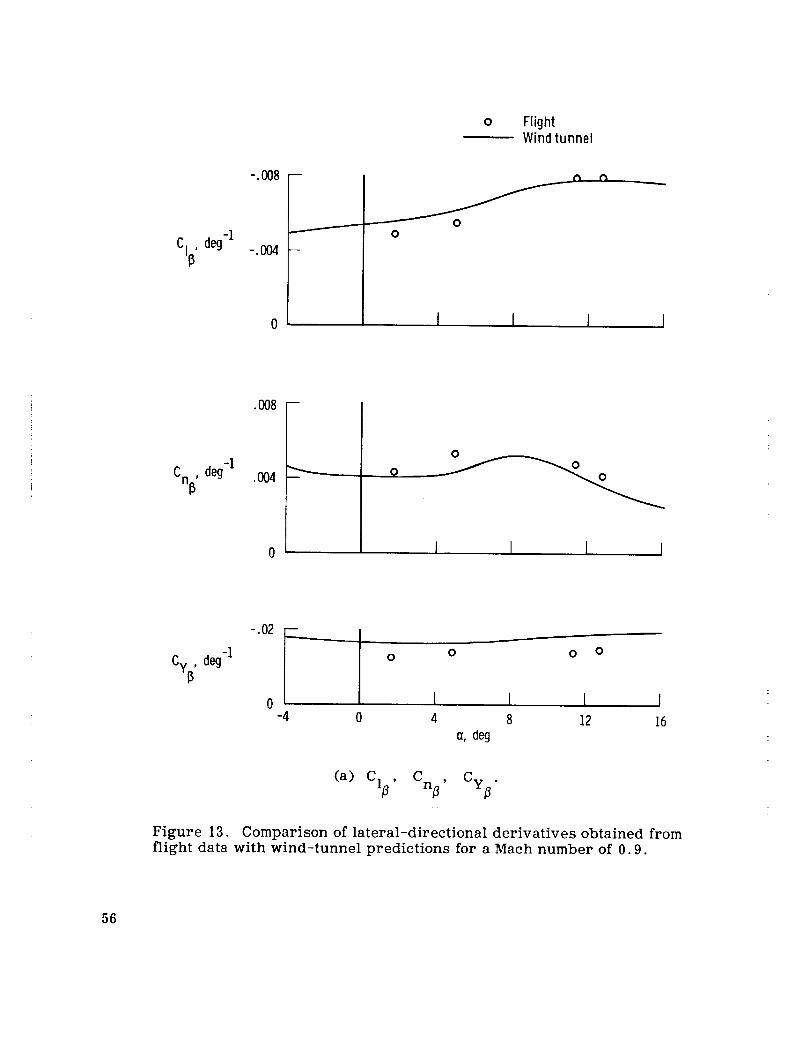
Figures I0 to 16 show that the effective dihedral derivative, C1, and the
yawing-moment coefficient due to aileron deflection, C , are generally in agree-n 8
a
ment with the wind-tunnel predictions, whereas the directional stability derivative,C , is usually lower than predicted, especially at subsonic speeds and high angles
of attack. At transonic Math numbers the agreement between wind-tunnel and flight
values of Cn_ is better. The side force derivative, Cy , and the roll-damping
derivative, C l , are also generally lower than predicted from wind-tunnel tests.P
13

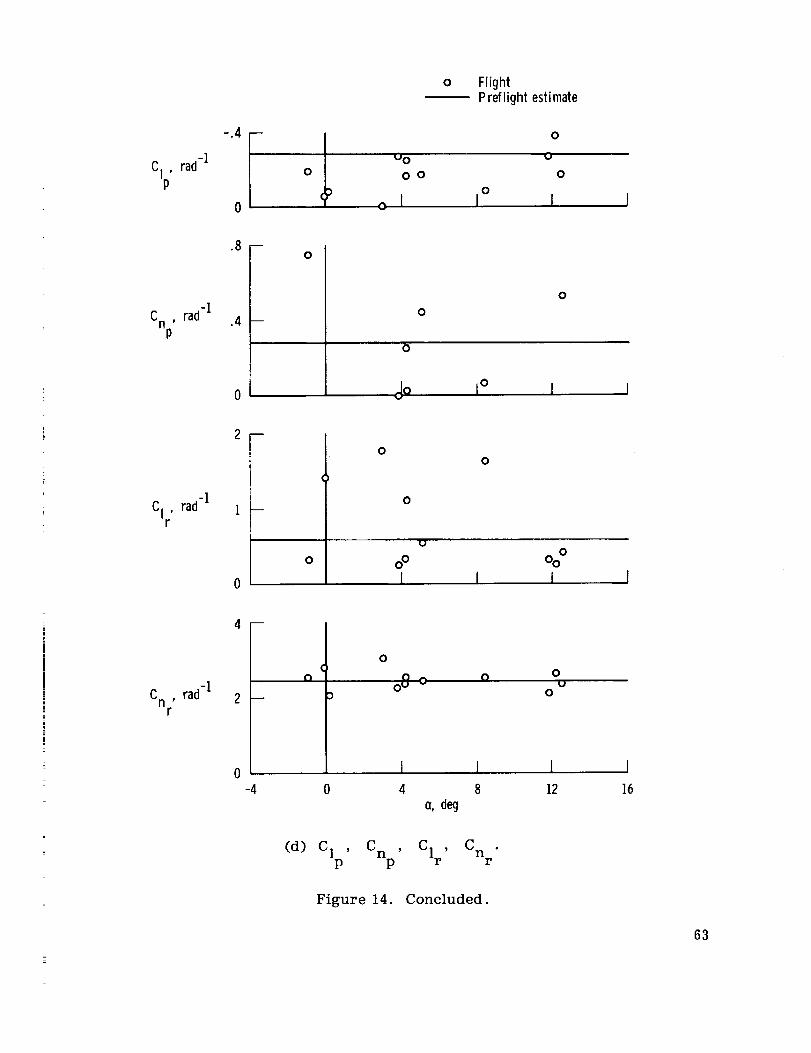
The rolling-moment coefficients due to rudder deflection and yawing rate,
Cl_ and Clr, the yawing-moment coefficient due to rolling rate, Cnp, andr
the side force coefficients due to aileron and rudder deflection, Cy_ and Cy_ ,a r
are difficult to identify as indicated by the amount of scatter in the flight data. How-ever, the data do indicate specific trends, and the derivatives are well defined at sub-
sonic Math numbers. The yaw-damping derivative, C n , is usually well defined,r
although the values are slightly different from the preflight estimates.
Except for the comparison at a Mach number of 0.95 (fig. 14(b)), flight values of
the aileron effectiveness derivative, Cl_ , were higher than the wind-tunnel results.a
However, near Mach 0.95 at low angles of attack, changes in Cl_ were found toa
significantly affect the handling qualities. In the flight program this Mach regionwas extremely troublesome. More than once, vehicle disturbances occurred thatwere followed by an oscillation sustained by damper augmentation. It was deter-
mined that a large reduction in C18 coupled with certain combinations of roll anda
yaw gains could produce an unstable closed-loop vehicle. Lower values of Cl_a
were determined from flight data; however, only one data point (fig. 14(b))-- at ao . . " rMath number of 0.936 and an angle of attack of 5.06 --ylelded hlgh quahty esults.
This point, as well as others of less than acceptable quality, showed that the flightvehicle followed the wind-tunnel curve based on longitudinally untrimmed data at
the flight upper flap bias setting. This is supported by the data in figure 25 (a)which show that the vehicle was seldom in longitudinal trim when these data were
obtained. Without the angle-of-attack-hold of the command augmentation system, itwas difficult for the pilot to hold a steady angle of attack in this region either with
the power on or off. This difficulty, coupled with the problem of not knowing thetrue Maeh number in flight at Math numbers near 0.95, made it difficult to performmaneuvers at these flight conditions.
As noted previously, midway through the flight envelope expansion, the vehiclegeometry was changed slightly just aft of the rudders (fig. 4). Figures i0 to 16 showthat although rudder control effectiveness may have been changed as a result of thisgeometry change, the effect on vehicle dynamics was negligible.
Longitudinal Derivatives
The flight data from which the longitudinal derivatives were obtained generallyhad an unusually large amount of scatter. The scatter was attributed to the nonlineartrends of the longitudinal characteristics with angle of attack (fig. 8), the large trim
changes with Mach number (fig. 25), the inability to maintain constant flight condi-tions with a boost-glide vehicle of this type, and the high stability augmentation
14

gains needed to provide acceptable handling qualities. However, despite the scatter,sometrends are evident.
The flight values of the longitudinal static stability derivative, C , were nearmo_
the wind-tunnel values at Math numbers of 0.5, 0.7, 0.8, and 1.3 (figs. 17 (a),
17(b), 17(e), and 17(e)). At Math 1.1, the flight values were higher than the wind-tunnel values (fig. 17(d)). In the transonic speed region, the trend of the flight-determined C is as nonlinear as that of the wind-tunnel data (fig. 18(a)).
mo_
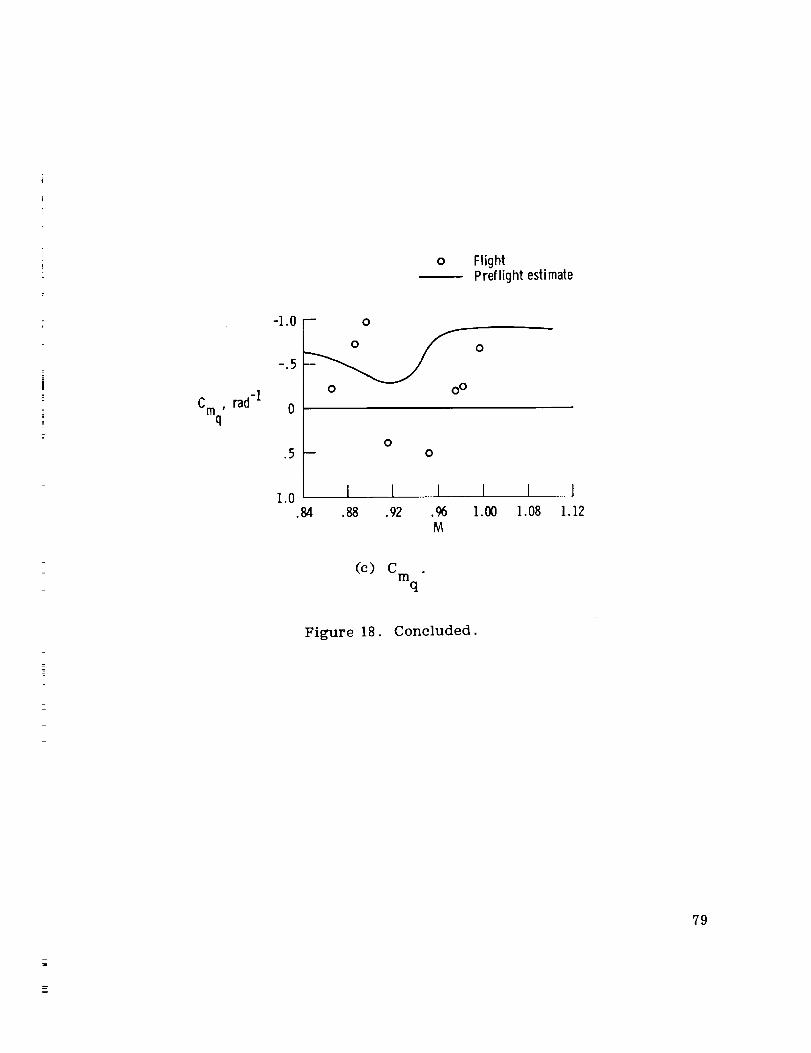
Transonic nonlinearities are also evident in the variations of the lower flap effec-
tiveness derivative, C m (fig. 18(b)), and the pitch-damping derivative, C61 mq
(fig. 18(e)), with Math number and are somewhat supported by the fluctuations ofthe trim curves in figure 25 (a). At subsonic speeds the flight-determined values ofC correlate well with the wind-tunnel values. At other Math numbers, C
m_ 1 m81
was not well defined.
The flight values of C m , although not well defined, are of about the same mag-q
nitude as the preflight estimates. Except in the transonic speed region, C gen-erally decreases with increasing angle of attack, mq
Effectiveness of the Reaction Control Rockets
The effectiveness of the reaction control rockets was determined from flight data
as part of a study of the usefulness of the rockets for terminal area maneuvering andstability augmentation.
Figure 19 compares flight and wind-tunnel results for rocket Geometry 1 when acombination of an outboard and an opposite inboard rocket was used. The flightroll control effectiveness data agree reasonably well with the predictions, but theaccompanying incremental yawing-moment coefficient data are higher. The resultinglateral control effectiveness was adequate for maneuvering as well as for stability
augmentation. Agreement between flight results and wind-tunnel predictions wasreasonably good.
Figures 20(a) and 20(b) show the results of operating either an outboard or aninboard reaction control rocket. These data have considerable scatter because of
the small vehicle motions produced by just one rocket. The resulting motions in
pitch were too small to analyze.
The pitch control effectiveness using either both inboard or both outboardrockets is shown in figures 21(a) and 21(b). The resulting control effectiveness
was adequate to provide stability augmentation over most of the flight envelope butwas not of enough magnitude to maneuver the vehicle adequately.
15
Longitudinal Trim
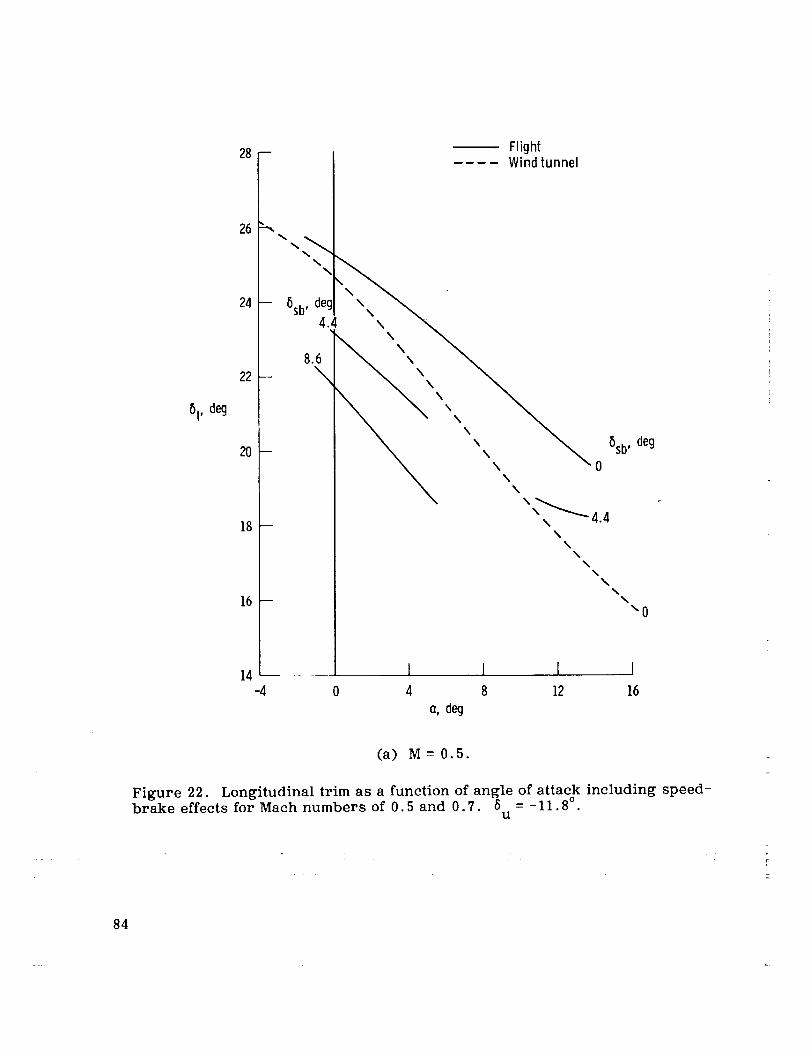
The flight trim data indicate, in general, that more lower flap deflection wasneeded to obtain a given angle of attack than predicted by data from power-off wind-tunnel tests (figs. 22 to 24). This difference increases with increasing angle ofattack. No attempt was made to predict power-on trim from wind-tunnel data. Asshown in figures 22(a) and 22(b), opening the speed brake induced a nose-downtrend. This trend was predicted by wind-tunnel data but is not shown. Fig-ure 22Co) shows that with a speed-brake setting of 27 °, an instability occurs at low
angles of attack, as indicated by the positive slope of the trim curve (which implies
a positive or unstable Cm). As a result of this instability, speed-brake deflec-
tions were limited to 20 °. The general effect of power is shown in figures 24 and 25to be a nose-up trim increment, even though the thrust line was above the vehiclecenter of gravity.
Figures 25(a) to 25(c) define the in-flight vehicle trim characteristics forvarious power levels. In figure 25(a) the solid lines indicate the trim curves that
were normally obtained from flight data. However, about 20 percent of the time, thecurves shown by the dashed lines were obtained. These curves show that the ve-
hicle can be trimmed at more than one lower flap deflection for the same angle ofattack, thus indicating that an unsteady power-off trim phenomenon occurs in the
transonic Mach number range from 0.88 to 0.95 at higher angles of attack. In thissame Math number range at lower angles of attack, no trim data were obtained eventhough many flights were made through this region.
CONCLUDING REMARKS
A flight investigation of the stability and control characteristics of the M2-F3
lifting body vehicle was made at Mach numbers from 0.4 to 1.55. The flight datawere compared with predictions based on wind-tunnel results.
Noticeable differences were observed between some flight and wind-tunnel lateral-directional results. The flight-determined values of the directional stability deriva-
tive, Cn, were usually lower than the values predicted from wind-tunnel tests,
especially at subsonic speeds and high angles of attack. Near Maeh 0.95 and at low
angles of attack, the flight values of the aileron effectiveness derivative, Cl_ i ,a
followed data based on longitudinally untrimmed wind-tunnel data, which were lowerthan those for trimmed conditions.
Although the longitudinal data had considerable scatter, flight values of the
static stability derivative, C m , were in fair agreement with wind-tunnel predic-
tions at Mach numbers of 0.5, 0.7, 0.8, and 1.3. At a Math number of 1.1, the flightvalues were higher than the wind-tunnel results.
16

The effectiveness of the reaction control rockets was determined from flightdata. Lateral control effectiveness was adequate for maneuvering as well as forstability augmentation; whereas longitudinal control effectiveness was adequateonly for stability augmentation. The agreement was reasonably good between theflight results and the wind-tunnel predictions for lateral-directional control effec-tiveness using the combination of an outboard and an opposite inboard rocket.
The longitudinal trim flight data indicated, in general, that more lower flapdeflection was needed to trim at a specified angle of attack than estimated from wind-tunnel data. Speed-brake deflection induced a nose-down pitching moment, whereaspower effects generally resulted in a nose-up pitching moment. An unsteady power-off trim phenomenon in the Mach number range from 0.88 to 0.95 was indicated bythe tendency of the vehicle to trim at more than one lower flap deflection for thesameangle of attack.
Flight Research Center,National Aeronautics and Space Administration,
Edwards, Calif., October 17, 1973.
17

APPENDIXA
EQUATIONSOF MOTIONMECHANIZEDIN THE NEWTON-RAPHSON
DIGITAL COMPUTERPROGRAM
The following state equations were used in the basic model for this study:
C_ = Ax + Bu
I= - +
where x, __, u,_ and _[ are time varying.
For the lateral-directional mechanization,
A
X
m
Lp
NP
YP
I*
m
P
r
Lr
Nr
-cos (_) *
tan(0)*
_-8-a
8r
81
L_
N_
Y_
0
_p-
r
a
y
0
0
g/V cos (_)*
0
*Normally held fixed.
18
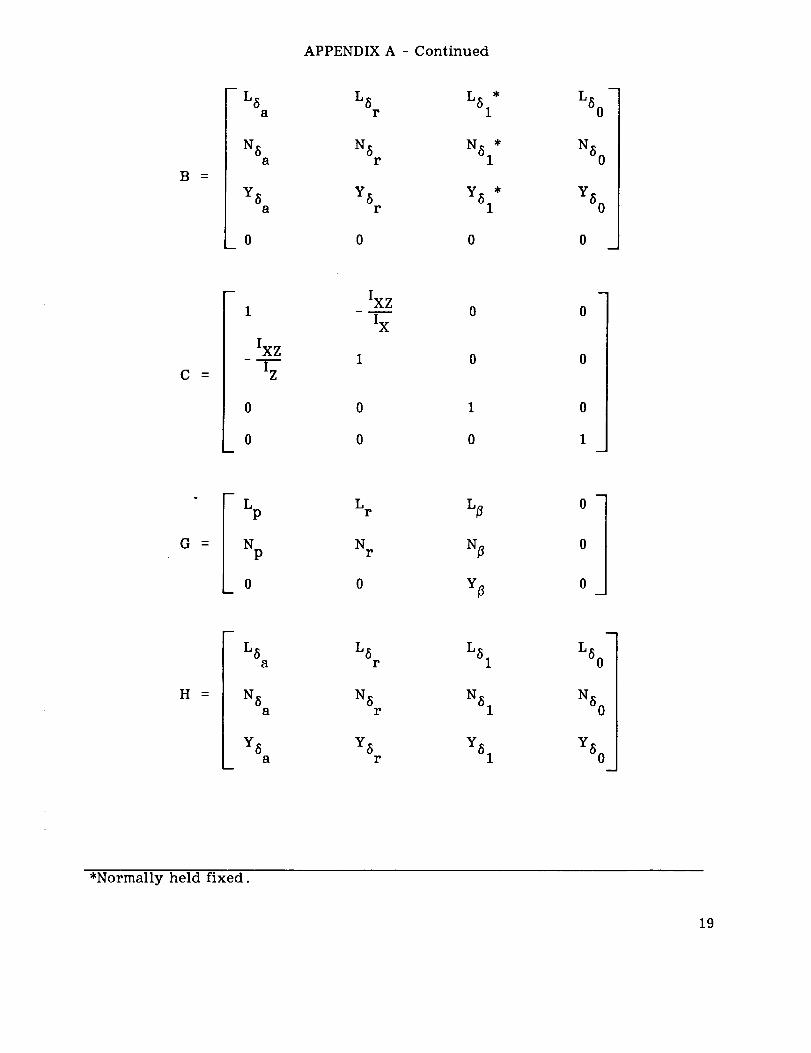
APPENDIXA - Continued
B
L5 L 8 *a r L51
NSa NSr NSl*
Y8 Y8 Y *a r 81
0 0 0D
L 80
N80
Y80
0
C
- IXZ -1 0 0
IX
IXZ1 0 0
I z
0 0 1 0
0 0 0 1
i
Lp L r Lfl
Np N r N_
_ o o
m
0
0
H
m
L 8a
= N 8a
Y8a
L8 r L81
N_ N 8r 1
Y8 r Y81
i
L80
N6 0
Y8 0
*Normally held fixed.
19

APPENDIXA - Continued
For the longitudinal mechanization:
X _w
m
q
o_
V
0m
U -=-
ioJ
q
o_
vI0
q
anJ
A
Mq
Z *q
X *q
l*B
MC_
Z
X *
M *u
Z *u
X *V
B
r
'61
X *
0
M61*
Z_I*
X_l*
0
M6 o
Z6 o
X60*
0
0
g/V
0
0
*Normally held fixed.
2O

APPENDIXA - Concluded
C = I
n
Mq Mc_ M u
Zq Za Zu
_ Xq Xc_ X u
a
m
M_ 1
Z61
X61
M_1
Z_1
X61
M60
Z6 o
X6 o
m
0
0
21

APPENDIX B
OPEN-LOOP DYNAMIC CHARACTERISTICS
The open-loop dynamic characteristics of the M2-F3 vehicle, in-
cluding flight conditions and mass parameters, are presented in thefollowing tables.
22

APPENDIXB - Continued
_.- e-_ to to
_ o
¢_t--_J
• ¢xioo e-_ to u_
ul
©
O(9
o
o
h_
_ to _ _ ¢_ _ ' ',5
b-
to _ I
• gnl •
t_ to v ,-_
¢-q
b,- _ •
=3U o_
k0
23
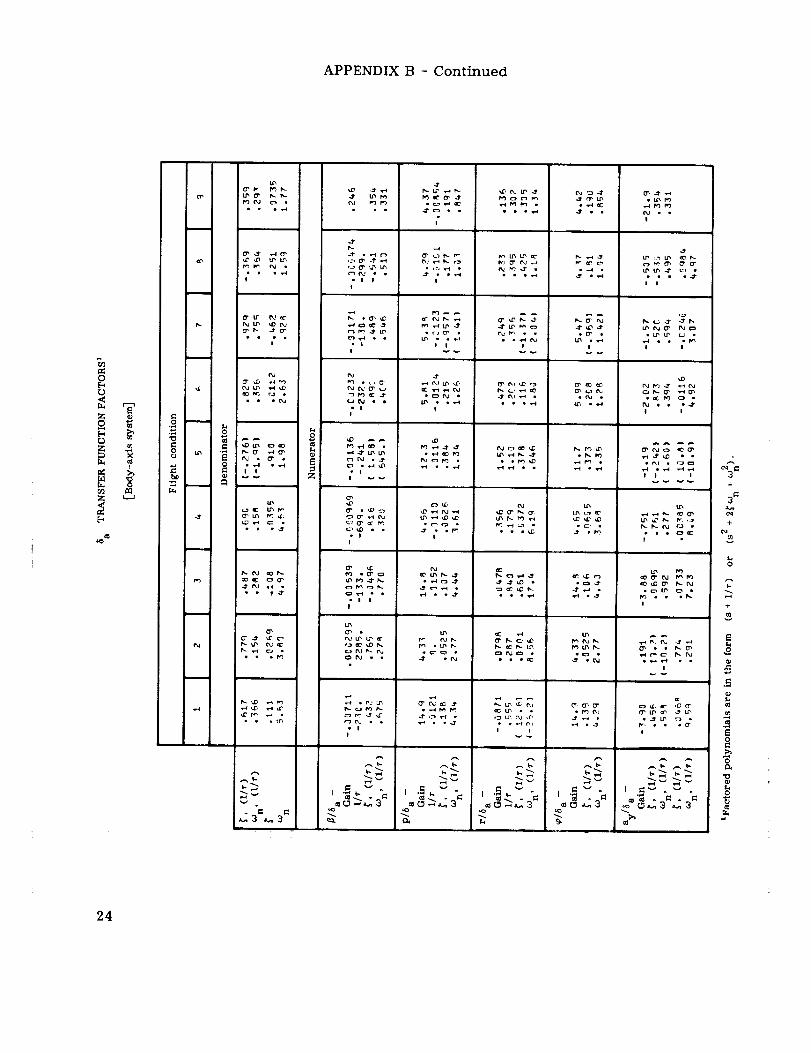
APPENDIX B - Continued
O
L_
TO
L_
I
8
• • 9-,-4
• = • ,_
!
i ! • •1_
I_OJ o01_
_ o0 _
0 _
• • .1"3
r_ _._ °
• . °tt_
_v
,_ 3=_ 3_
E
Z
P_
• ! !
I
• I
!
• II
¢_ .,,-4• I
• II
• I !
I
0" •
,,-.I • rJ l.r
• !
!
_ v
I
!
a- e,J I_.
• cJo" •
! !
v_
I
I
e ,_ ('dr-
I
I_ (_, ,,4 _O
• • e.-I
_.
_°°
! l
,mO_3
I
• f_j •
•,,=l
• ¢> •
a_ d3 e-_
ec_ •
!
• • . •_t _
! !
t_. (._ .._ _._1_
i_(_0 _ I_J¢_
! I
t%1 • • •_"
! I
!
ao_DO _ I_1%1
_;_. •!
IT' • • I_- 0"_
.M I_ r,J
I_v
O_ i._ a_3 .._L _
!
I _v v®'_ . "= . ",-
rO_3 _3
+
3 _
J
0
+
v
E
_oOJ
E0
0
o_r_
24

APPENDIX B - Continued
T
ID
I
0
0
O" .,T ,,-,I Cr
w • w,,-O
g
I_I_- .3"0 _
• t • •
!
(%.6 U_ q,-4 _C,
0 I /
l._ tr
1'_ ,,4 ¢._ •
• • .r_
_vv
3_ 3c
_P_.
J
_,j t_ ao
_0_ °t_U" •
_l ...+ !.P L_
r_ r,-
O_Cr
%_s_v
O"
ec_ • •
• !
!
! !
!
II
!
_-4 * ,P, r--
!
ru
!
• (M _'-"_ •
7 ";_
! !
_$) C3 _.-I (v')
I •
I I
I •
I
I I
r-_ or r,,l t'_
(,J . o_J
I I
I
,
JJJl
rm
JJJ!
!
JJJ!
_JJ!
I
I
• o
I
,,0 _ f--
-_jj!
!
!
I •
l
! !
I
!
I
I I
• ro c-- ,-_ _
i,- _4 k._ • •
I I
÷
3 _
+
+
25

APPENDIX B - Concluded
%0
_ 7
_L1 "0_ O
m _Z _
• . o('_
..t
• * .I _
L_
. • i_-4
• . we_
L_,U _ _-
_._ 3_._ 3 z
Z
i I
A
I !
! !
v
_'_ ,.-4 _
I !v_
_J_
! I
l !
I I
! !v
! !
_b
!
I
!
!
I
rJ
!
I
I
I
!
!
L_ {" -)
I
I
!
0 _
r_ _-_ r_
!
!
I
I
!
!
* I!
__!
r_
i
i
I
on, .
• !
i
I
! I
II
r_
I
_*° ,T
Iv
• I
I
" • *_c r,,_
b_
+
3 =
+
b÷
E
&
0
26
REFERENCES
I*
*
.
o
.
.
.
,
9_
10.
Ii.
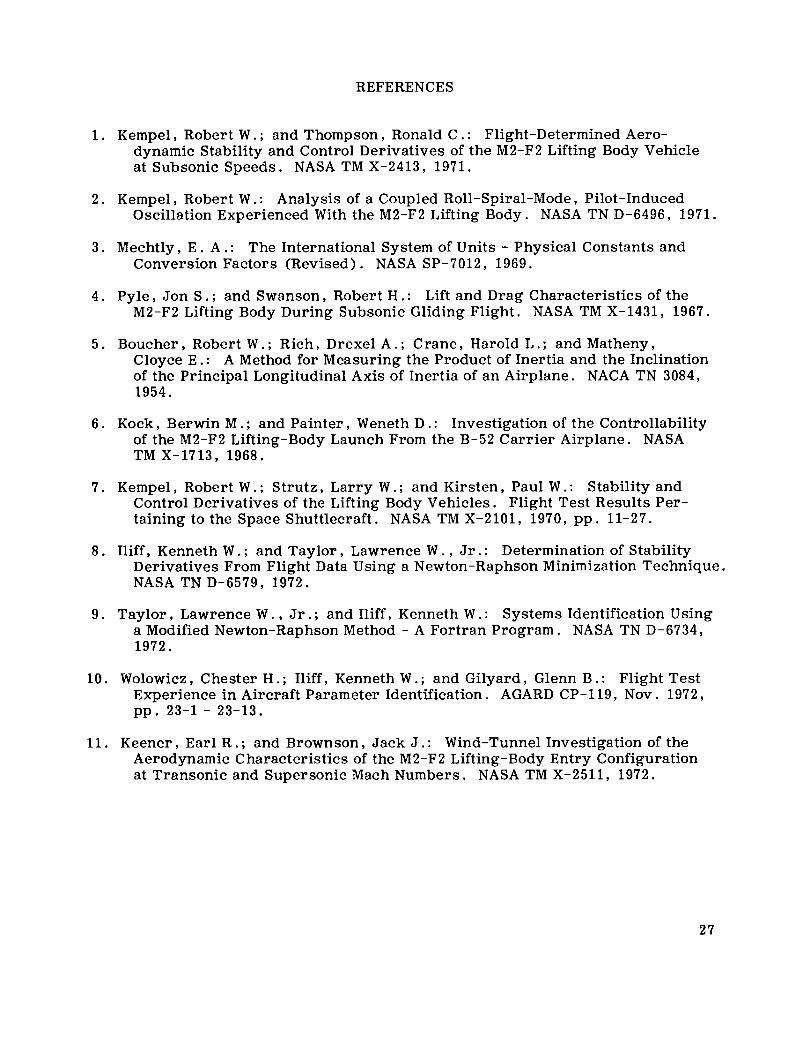
Kempel, Robert W. ; and Thompson, Ronald C .: Flight-Determined Aero-
dynamic Stability and Control Derivatives of the M2-F2 Lifting Body Vehicleat Subsonic Speeds. NASA TM X-2413, 1971.
Kempel, Robert W.: Analysis of a Coupled Roll-Spiral-Mode, Pilot-InducedOscillation Experienced With the M2-F2 Lifting Body. NASA TN D-6496, 1971.
Mechtly, E. A.: The International System of Units - Physical Constants and
Conversion Factors (Revised). NASA SP-7012, 1969.
Pyle, Jon S. ; and Swanson, Robert H.: Lift and Drag Characteristics of theM2-F2 Lifting Body During Subsonic Gliding Flight. NASA TM X-1431, 1967.
Boucher, Robert W.; Rich, Drexel A.; Crane, Harold L.; and Matheny,Cloyce E." A Method for Measuring the Product of Inertia and the Inclinationof the Principal Longitudinal Axis of Inertia of an Airplane. NACA TN 3084,1954.
Kock, Berwin M.; and Painter, Weneth D.: Investigation of the Controllability
of the M2-F2 Lifting-Body Launch From the B-52 Carrier Airplane. NASATM X-1713, 1968.
Kempel, Robert W.; Strutz, Larry W.; and Kirsten, Paul W.: Stability and
Control Derivatives of the Lifting Body Vehicles. Flight Test Results Per-
taining to the Space Shuttlecraft. NASA TM X-2101, 1970, pp. 11-27.
Iliff, Kenneth W.; and Taylor, Lawrence W., Jr.." Determination of StabilityDerivatives From Flight Data Using a Newton-Raphson Minimization Technique.NASA TN D-6579, 1972.
Taylor, Lawrence W., Jr.; and Iliff, Kenneth W.: Systems Identification Usinga Modified Newton-Raphson Method - A Fortran Program. NASA TN D-6734,1972.
Wolowicz, Chester H.; Iliff, Kenneth W.; and Gilyard, Glenn B.: Flight Test
Experience in Aircraft Parameter Identification. AGARD CP-119, Nov. 1972,pp. 23-1- 23-13.
Keener, Earl R.; and Brownson, Jack J.: Wind-Tunnel Investigation of the
Aerodynamic Characteristics of the M2-F2 Lifting-Body Entry Configurationat Transonic and Supersonic Mach Numbers. NASA TM X-2511, 1972.
27

TABLE I.-PHYSICAL CHARACTERISTICSOF M2-F3 VEHICLE
Body - 2Planform area, m -(ft2):
ActualReference (S)
Longitudinal length, m (ft):Reference (c)
Span, m (ft):ActualReference Co)
Leading-edge sweep, degLower flap -
Area, m 2 (ft 2)
Span, m (ft)Chord, m (ft) ,
Design hinge moment, m-N (in-lb)Upper flaps, two -
Area, each, m 2 (ft 2)
Span, each, m (ft)Chord, m (ft) .
Design hinge moment, each, m-N (in-lb)Vertical stabilizers, two -
Area, each, m 2 (ft 2)
Height, trailing edge, m (ft)Chord, m (ft):
RootTip . . =
Leading-edge sweep, degCenter fin -
Area, m 2 (ft 2)
Height, trailing edge, m (ft)Chord, m (ft):
Root, at horizontal reference planeTip .
Leading-edge sweep, degRudders, two -
Area, each, m 2 (ft 2)
Span, each, m (ft)Chord, m (ft) .
Design hinge moment, each, m-N (in-lb)Center of gravity, reference -
Decimal fraction of chord
14.49 (156.0)14.86 (160.0)
6,77 (22.2)
2.93 (9.63)
3.03 (9.95)77
1.42 (15.25)1.65 (5.42)0.86 (2.81)
7570 (67,000)
0.85 (9.20)1.26 (4.21)
0.68 (2.23)3390 (30,000)
1.50 (16.10)1.16 (3.79)
2.24 (_.36)0.79 (2.58)
62.3
1.12 (12.02)1.26 (4.13)
1.59 (5.21)0.30 (1.00)
58
0.49 (5.27)1.28 (4.20)
0.38 (1.25)2600 (23,000)
0.496
28

E_r_Zr_
O0
Z
ro_
i ro
7
0
I,_.J
I
EI
I
k.,.4 %._
!
t_
I
I
I
I
of_
0
• • •
t I t I I
(_1 L"- _ _,__ID _ t_ _'_ _'_
I I 1 I I
_r_ _ _, L_
_ _ _'% t"%
29

_D
(D
.¢
0
Z0o
Z
Ieo
P •
p _
I
% ,
p
%
%
%
+1
0
0
r_
%
+1+1
+1
%+1
E
_ E
o _ 1_
0
0E_
E
v
0
30
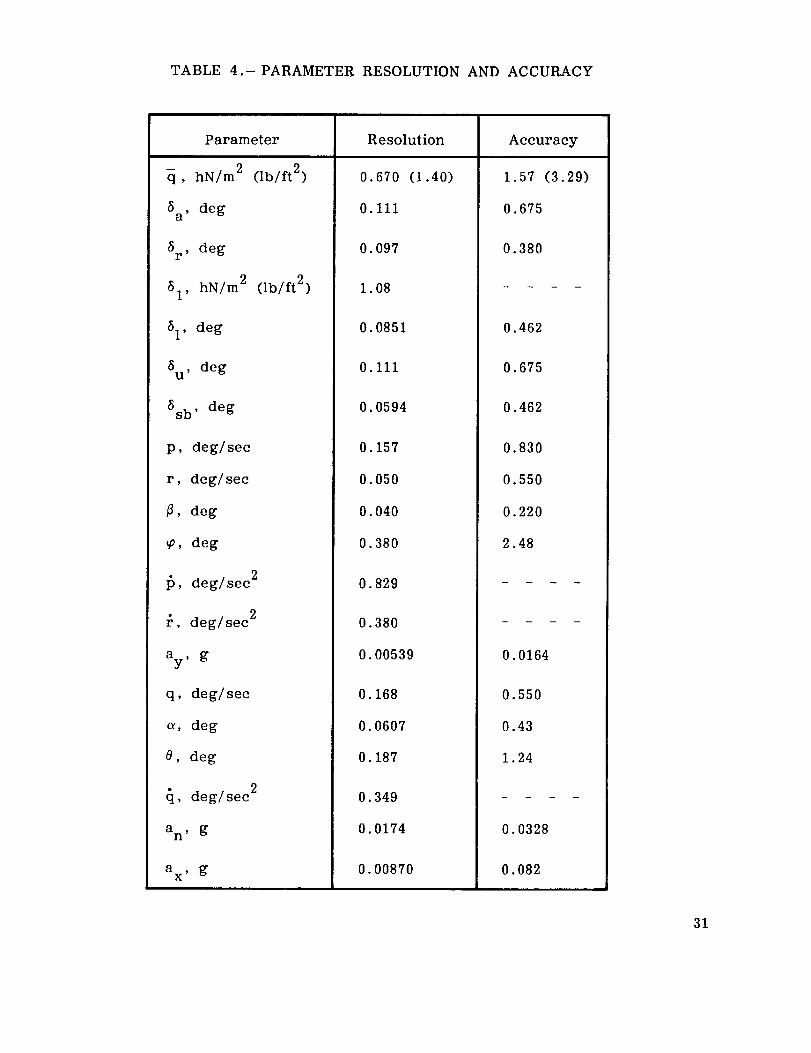
TABLE 4.-PARAMETER RESOLUTION AND ACCURACY
Parameter Resolution Accuracy
0.670 (1.40) 1.57 (3.29)q, hN/m2 (Ib/ft2)
8 a , deg
8r , deg
81 , hN/m 2 (lb/ft 2)
0.iii
0. 097
1.08
81 , deg
5 u , deg
8sb, deg
p, deg/sec
r, deg/sec
/_, deg
_o, deg
0.0851
0.Iii
0.0594
0.157
0.050
0.040
0.380
I_, deg/sec 2
_, deg/sec 2
ay, g
q, deg/sec
_, deg
0, deg
(], deg/sec 2
a n, g
a X , g
0.829
0.380
0.00539
0.168
0.0607
0.187
0.349
0.0174
0.00870
0.675
0.380
0.462
0.675
0.462
0.830
0.550
0.220
2.48
0.0164
0.550
0.43
1.24
0.0328
0.082
31
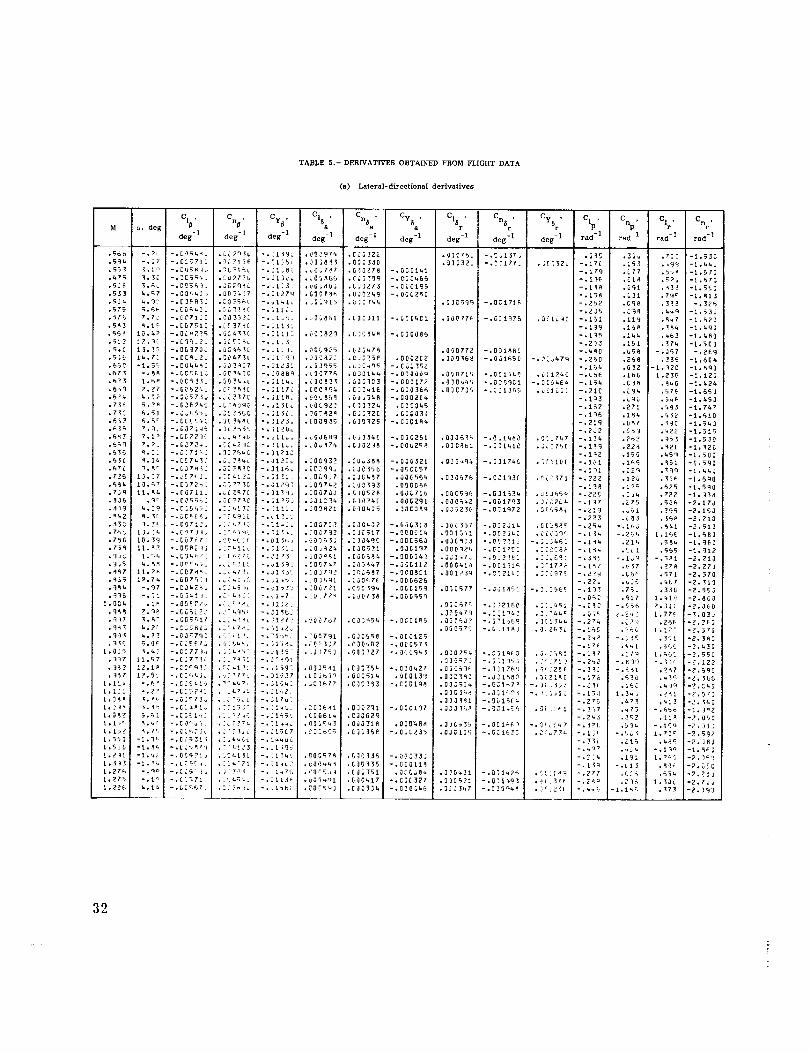
TABLE 5.- DERIVATIVES OBTAINED FROM FLIGHT DATA
(a) Lateral-d£rectional derivat_ves
M _, deg Cl_' Cn, Cy_, CiSa, Cn6 a , Cy5 a . Cn6 r,
deg -I deg -I deg -I deg-I deg -I deg -I deg -I
• _6 7,7_ -,C:?I_0 ,,_O_37Z -,3tJ__ ,-OG85t .C00311 -,GO04Ci ,00077_ -,G_lq75 ,O_1_gl -,15_
• 657 _,_r -,GC_L ,3C?_L -,2!2_ ,(00935 ,630325 -,OOOl_ -.21g
• _7 ?.I" -.GC7_: ._C_3*G -._tt6J .CG06g9 ._a03_ -.0)G261 .00063_i -.OO148J .CC=Z_7 -.i_
• 5_C q.O_ -.CC7_: .G_Y_[ o.j12G_ .C0_937 .C_38B -.000321 ._00_94 -.O_iT_C .]r_IC[ -.161
,h?_ q,R r -,C_7_J ,G_?_qC -.3116_ .Gc_9g5 ,CJ_]56 -,OGCGS7 -,131
.F25 ij._7 -._ZF_J. .:CcI_: ".;131 ._0_9]7 .CJ_7 ._0G56_ .030675 -,C0193[ ._C371 -,222
• /Jg tl,a_ -,[,_Tll_ ,LC_5?[ -,_I_9_ *CG_FGJ .5]05Z_ ,GOG715 *0_C, 5_5 -*5Ji6Z_ ,d_65_ -,22_
• _J6 ,qr -,COq_ ._CYZ_C -.jl_5] ._01:3_ .O)OZ_[ .OOGZgt .OJO6_Z -._D17_3 ._LC?6C -.1_7
, , CnpClSr CYbr' Clp , Clr, Cn r,
deg -I deg -I rad -1 rad I rad-l red-1
• _]C75. -,C51_7_ ,_5 ,30G ,_02 '-I,530
•Q]037_ =.?P177: .;{_32L -.lZ{ .t53 .-q9 -i._u
-.179 .C77 .55_ -i,570
-.l]_ .GLa .g?Q -1,573
-.iT8 .Ogl ._]3 -1.5£0
-*138 ,&31 ,7_ r -t,_l_
• 0]_599 -.0017_6 -.252 ,C98 .3_ -,3E5
-.235 ,69_ ,_q -1.53J
•llg ,_W? -1.522
• iSl ,]?_ ol.3C3
• b58 -,J57 -.2E9
• 268 ._35 -io5G4
,03Z -1._20 -1._90
• 156 1,23_ -1.120
,Zg_ .576 =1o65J
• 271 o_93 -i,747
• lq_ ,_32 -1.610
oS_g ,_Z2 -1,315
• _6Z ,_53 -1.530
• 15_ *459 -i,500
• 1_9 ._5£ -1,590
• C2q ._gg -loh_J
• 12G ,_3_ -1o5q0
• 1_5 ,525 -1,_qo
• GJ4 ,_2_ -1,g3_
,E?5 oS_ -2,17d
• _61 ,?gq -2,15_
• _33 1._r -oCg712. .T:_71Z_ -.il_J_ ._OGTCZ .OOC_O_ -.55_31_ .3_0157 -.O_ZJI4 .G[_ -oZq4 -.16J .5_1 -2.51_
• 7_G 10._q -.E_7_7: .!_LCI! -._1_6_ ._0D63; .C_9[ -.OGES_ o03G_3 ".00_]IJ -.JL_EL -.I_4 .ZI_ ._ -I.960
.75_ 11._ -.OG_5 .:_'11_ -._I_i .COJ_2_ .[_G571 .030197 .00Dq?_ -._GI_G .:[_C8_ ¸ -*I_ .£_I ._55 -log1?
°9J_! _._ -.0_'.5. .C_IL -o_I_01 .C0_7_? oC_]_47 -.OGCliZ .000_I_ -oOCI)I_ ._'I7_P -.I_7 .637 ._7_ "Z.ZTJ
• _7 I Ii.?_ -.C_7_ .CE47_Z -._1;b_ .[OJT_3 .0_6_7 -*OeO_C1 .O01Z3_ ".91Z£_Z ._C_7_ -oZZg .L6_ o_71 -2.570
._5 1 i_.7_ -._07qL_ ._15_ -.31_5_ .LO]6ql ._0_7_ -.000626 -.ZZ_ .uJ_ ._7 -?.31_
"_i -.07 -.CJ_E_ .:0_5_ -oJl_ .0B0721 .£_X9_ ._GG150 .030_77 -.0_I_5L -.OL?SE E -.13_ .75U .3_0 -_.553
_.03_ .IP -o_D_. .C_rT_ -.]_]Z. .0]G67 r¸ -.0J_160 .:_5; -*G_ -._S6 ?.3_ -2.060
• q_ _°2 r -.CCSRC_ .LC_I_L -.31_2_ *OOO_7S -.0311_2 .O._?L -._65 .EEC I.C2? -?°570
,�IT W,P_ -,_0_79:1 ,55;1% -,71"55L ,Z0_791 ,GJOSH8 -,0C_I_5 -,74_ -,C_6 ,351 -Z,3B3
t,O]5 _,_5 -,C_17), ,5:_'," -,J1_5" ..Jl/_2 ,000327 -,0_;94] *OOO?=_ -,C_iB_3 ,_,Z'_B:i-,LBI ,[?_ I,_L -_,550
.]_7 i_,57 -,OIl?K,5 ,:_3_ -._55_i *]]O_/J -,C51155 ._fJl_? I -.252 -._99 --_ -?,I72
• _B3 12,I_ -.;ccq_5 ,TC-I_L -,2159: ,O_O_I ,_J335L -,0_0477 ,0306_r -,_3176_! ,_125f -,3B: -,_1 ,747 -2,5q0
,1_7 I?.SL ".C_6_]_ .:_:?7_ -.31527 .L026]_ °_0051_ .000i39 .0}23B: -.JJIBS_ .3{?IR[ -.17_ ._30 ._l_ -2.]66
[,]BB _.71. -.GJr73u °.75.L -.JI?01 .220_1 -._'15[_ -.0TS .67_ ._:3 -2._&O
L,OB2 _._! -.C5_I_: .:L:?_{ -.5165_ .CO06t, .C30629 -._w3 .3_ .ti_ -2.050
1,15Z 4,7 _ -,_C67_ ,J::T%l( -,_15C7 ,PJC65q ,C]536_ -,0GC235 ,OJ_i3q ~.OCl5_ ,C:_7FL -,_;F -,L6_ [,7_ -?,_?
L.Z%E -I.'+.: -.G_?!_ .5:_.L]C -.i1_. .OOGSla ,_,3_]3_ -._0G33; -.25_ .191 t.?_5 -?,]f?1,_)3 -1,_ -,L_ST+. ,:}_:?l -,51*uL ,uO_4_ ,C25335 -,O00tl_ -.[_q -.LIJ ,B]+: -_._CI,?_6 -,_ -.C_5 _ ,) 7 _q -,.%_7i5 ,':OO£ul ,CdO351 ,ObGa8_ ,320_31 -,0]1426 ,SLZIR_ -,??l *LZ5 ,63_ -?,?|j
1,_75 -,I" -,_L%_I. ,.',4G,. -,;lt3_ ,_4q! ,_OG_t7 -,GOC327 ,O}0521 -.O:_r+¢_ ,,)[5_7_ -,Z_ ,Z_ i,_OC -Z,?u_
32

TABLE 5 - Concluded
(b) Longitudinal derivatives
M
.58?
,597
.522
.484
.56i
.466
.514
.572
.587
.544
.470
.a61
.4B4
.515
.590
.694
. 736
,¢;4B
.574
.711
.749
.724
.677
.806
._4q
._32
.785
.764
.906
.916
.935
.996
t.002.q72
I .136
1 .017
1.129
1.18_
1.340
1.210
_, deg
2.09
4.33
4.34
4.504.R4
5.10
6.E6
7.15
_.17
8.2_
9.909.76
10.29
1_.?0
-.40
3.145.28
6.72
6,72
7,89
9.:_412.50
15.._1
7.72
7.00
7.92_._1
9.q912.80
3.611]._O
10.70
12._4
3.77¢3.73
7.75
-.7Q
5.15r.q&,
a.12
.23
.ql
Cmo_'-i
deg
-.000729
-.OCO_tt-.00085_
-.000_30
-.001050
-.0008tq
-.000q9_
-,001036
-.000_1
-.OOttlP
-.0009_q
-.091169
-.OOICqo
-.000723
-.000 764
-.nOOTq_
-.00120_
-.0006_
-.0009_G
-.OO0_q
-.000874
-.00096_
-,OflO_t3
-.001_07
-.00112_
-.001176
-.0014_
-.0007_ _
-.000_4
-.001PlI
-.00072_
-.O00PS_
-.0n0387-.Of,,?P5 ?
-.0_234 _
-.noi_'.n
-.023860
-,00189n-.00217r]
-.OCP3gO
-.00177_
- .00172_
C
mSl'
-1deg
-.002120
-.031640
-.9018q7
-.311470-.001955
-.002053
-.001707
-.001557
-.00163_
-.80164r:-.0017E4
-.oo7n07
-.oo1_9 a
-.oo149o
-.00_733
-.001_13
-.09?440
-.002230
-.001565
-.001_62-.OOt7_U
-.00176 o
-.001250
-.00_16n
-,0023_q
-.001_54-.O03{PG
-.00_0_7
-.qnlBO0
-.O018qo
-,002175-.001573
-.0q1090
-.0017_z,
-.nottgO
-.0014_0
-.OOt_]3
-.00221_-.001480
-.0014_r
C
mq
tad -1
-.5700
-.161_
-.369C-.4260
-. q050
-.4iro-.&?O0
-.3_9_
-.0657
-.140C
-.2110
-.2184
-.I?O0
-. 5_+_0
-. _733
-.7670
-.2660
-.457n
-.7R70
.1q70
-.4_1n
.?gPR-.qZ2n
-1.230rl
-.sR6r
-.68_0
.1q_0
-.6070
-.TlOf
-.963n
.394_
_._qgo
-.24_.518n
-I._I00
-.6_0n
-. _,lor
-.750P
-.705l.
CL '-i
deg
.52_30
.02080
.02400
.OPO60
.02520
.C21+53
.02340
.02522
.O?tGO
.02250
.02260
.02229
.02440
.0?370
.0267_
.023_0
.02760
.02240
.023_0
.03800
.02270
.02_aO
.02530
.02450
.02_X0
.02510
._2_59
.02_05
.Otq30
.02126
.0t6_5.02095
.02520
.01858
.02250
.01_0
.016z0
.02070
._t�q_
C L ,
61
deg -I
-. 002120
. 002131• 002156
• 002870
-. on 2o a]. Oe 23 uO
• 000736
. O0 45 _0
• 0n116 a
• 0O 4_0• 00 3775
. 003300
n2317q
. 000430
• 000005
-. O00GZ5
. O0 1490
, 003360
. OOltiO
-, 00_I09
, O0_OqO
• 000143
. 0,30273
• 00278_
• 00 l Pg_.00 1339
-. ooi6tn
. 003140
• Oq 43_0
• On 8_,50
.00814_
• or,_830
-. 002280
• O031iq
• 001103
• 032350
. n_7219
• 0002q _.001_3_
33

L_
L_.
I
b_°_,,t
>
I
b_°_,_
34
Horizontalreferenceline
S
hne
Figure 2. Three-view drawing of the M2-F3 vehicle.
35

\
\
Figure 3. Sign convention and control surface location.
36
Topview
Rudder
Sideview
Figure 4. Right-hand jettison tube loeatzon on outboard vertical fin.
37
Center of gravity-_
\
0.020 (0.067)---i ..,,.
I
!< 1.346(4.417)
-,,.15o
/
_-15 °
(a) Geometry 1. (Dimensions in meters (feet) unless otherwise indicated.)
i_
15%.._Left outboard h,
15 °...i_
Right
/
inboard i
r'--"°_ I/
(b) Geometry 2.
Figure 5. Reaction control rocket geometries.
38

a, deg
6a, deg
p, deg/sec
10 F
ol I I I I
- =1
-8 I I I 1
-4 I I J
2oI-0 L /k
I-20
0 1 2 3 4
TJme, sec
r, deglsec
_, deg
@, deg
ay, g
20 ,0
-20
'I
I I I I-.i
0 1 2 :3
Time, sec
Figure 6. Typical doublet control input maneuver.
39

a, deg
5a, deg
6r, deg
p, deglsec
lO
0
16
0
-8
-16
4
-4
2O
-2O
-4O
r 1 I I I
I I I I
I
I 1 I
r, deglsec
_, deg
I 9, deg
-4
-1
-2 I I I
2O
-2o I I I
•1r-h.l_4 __
I "_ff'L I " LI -.1
1 2 3 4 0 1 2 3
Time, sec Time, sec
Figure 7. Typical pilot-induced oscillatory aileron control input maneuver.
4O

E
/
tl
c_
c}
!
II
L_Cr_
I1
I
O
O
I
c_
41

0
O0
o°o
%o o _o°
o
o OO
O
o o0
q 0
0 0 00
0 o 0oO o
o o
L
0
0 0
0
I
%
IO0
OO
O
O O
O
I
(3,)
o"
O
O --
O
_o°
)O --
O o
)
)
CD
_D
r-4
c_u
o_
oo
COor-4
I
4-J
_0
0_
or-4
oy
o_
o
_E
or..I
I
_o• _...I
e_
0.,'_
0
g7
_._
42

8u, dego -20a -11.8
a, deg
16--
12--
8--
4--
0
-4 :.4
0
oo
[]o 0
[] Qo 0 0
0
oO
--- f(M)--,--
0
(
0
0
0
0
0
0
0
o-a
00 0
0
0
I I I I.7 .8 .9 1.0
M
0
0
0
I1.1
0
1.2
I I1.3 1.4
(b) Longitudinal derivatives.
Figure 9. Concluded.
43
44
o Flight
Cl_' deg"I -.008 o °0
.008
Cn , deg"l_
Ooo__o °O0 0 0 0
".02
0 o
-4 _ oo o
e, deg 16
(a) C1 , Cn/j ' CyFigure I O. Corn • _ '
flight data . Paris on of lateral-dire .
,,,aennurnbe_,of o-ed fvorn

o FlightWind tunnel
CI , deg-1
5a
.001
I 0
6bo
I
0 00
0
I I I
C , deg-1
n5a
.001
o0 0
I I I
Cy ,deg-I
5a
.002
-.002
O0 00 0
I I-4 0 4 8
a, deg
0
I I12 16
(b) , ,Cl_ Cn_ Cy_
a 8 a
Figure i0. Continued.
45

-ICI ,deg
6r
.001
o FlightWind tunnel
00 0
0
I I I I
-.004 --
Cn , deg-15r -.002 q
00 0
I I I I
Cy , deg-1
5r
.OO4
-.004-4
0
0
I l l l0 4 8 12 16
a, deg
(c) , C ,C15 n_ CY 5
r r r
Figure 10. Continued.
46

-.8 --
0 FlightPreflight estimate
CI' rad-] -.4P
o
C
0
0
0 o 0 0
I J
0----
Cn, rad-1P
Cl, rad-1r
Cn , rad-1r
.4
0 o 0 0olo
0----
0 0 00
I I o I
I ooI I°
0
o
I
00
0
1 I
-2
I 0
@0 0
I °0 4
a, deg
Oo 0 0 0
I I o I8 12 16
(d) C 1 , C n , C1, C np p r r
Figure i0. Concluded.
47

o FlightWind tunnel
-.012 --
-.008
-.004
0
I I I ]
.012 --
-I
Cni5, (leg
.0O8
.(X)4 o__U
o_ oOo0 0 0 0
I I [ I
-.02
0
0O0 o o %_o oOO o
I I I
0 4 8 12a, deg
I16
(a) , , •Clp Cn_ CYI3
Figure 11. Comparison of lateral-directional derivatives obtained from
flightdata with wind-tunnel predictions for a Mach number of 0.7.
48

o FlightWind tunnel
CI , deg-1
8a
.OO1
0
00 0 0 0 0 _0 0
_..D__
Oo0 0
I I I J
-1Cn , deg
8a
.OO1
0 0 0 O___E_._ o
° I I
0 ° 0
I
.002
-.002
00
0--0
0 o 0 OQD 0
0
O0
0
I I I J-4 0 4 8 ]2 ]6
a, deg
Co) , C ,C18 n 8 CY 8
a a a
Figure i1. Continued.
49

C1 , deg-1
5r
.001
V0
0
o o"
0
I
FlightWind tunnel
Flag denotes 5sb = 10°
Slash denotes outboard fin
jettison tubes on
0
0 00
I 1
Cn , deg-15r
-.002j 0 0
1 I I
Cy , deg-15r
.OO4
o d _d o0
0
1 1 I
0 4 8 12 16a, deg
(e) , C ,C16 n 5 CY 8
r r r
Figure 11. Continued.
50

0 FlightPreflight esti mate
-1
Cip, rad
-.4
V0
0
0
00 o o 8o _ ooo o
0
I I I
Cn, rad-1P
.4
0
0
0
00
o 80 0 0 O0
J I o J J
_
Ci, rad-1r
0
0
0
00 0
00
° ° _ @ oo
I I I
Cn, rad-1r
0-4
0 00 0
0
l
o oe oO°
0 4 8a, deg
U
I I I12 16
(d) C 1 , C n , C 1 , C np p r r
Figure 11. Concluded.
51

o FlightWind tunnel
-.012 --
Cll3, deg-1
-.008
-.004
0
I I I I
Cn, deg-I
.008
.004 n
I I ] ]
Cy, deg-1
-.02
0 0 00(Z) 0
I I I I4 8 12 16
a, deg
(a) ,CI_ Cn, Cy_
Figure 12. Comparison of lateral-directional derivatives obtained from
flightdata with wind-tunnel predictions for a Mach number of 0.8.
52

CI , deg-1
6a
.OO2
.OOl w 0
o FlightWind tunnel
0_o o
I I I I
-ICn ,deg
6a
.001
I° I I I
Cy ,deg-I
5a
.002 --
0 0o o
Q
J I I I0 4 8 12 16
a, deg
(l_'_ C,_, , ,C16 n 8 CY 6
a a a
Figure 12. Continued.
53

.002 --
0 Flight_- Wind tunnel
Slash denotes outboard finjettison tubes on
CI5, deg-1r
001
0
00
0
0t
0
l 1 I
-.004 --
-1
Cn6, degr
-.002i,j
I 1 I 1
-1
Cy6 , degr
OO4
-004
(2 0
0 4
a, deg
0
0
I
12
(e) , C ,CI 6 n_ Cy_
r r r
I
15
Figure 12. Continued.
54
-ICI, rad
P
-.4
0 FlightPreflight estimate
0 0 0 00 00
I I I
Cn '
P
-Irad
.4
0
0 Oo
jo i J i
_
-iCI , rad
r
Cn, rad-1r
0
-4 --
-2--
0-4
0
o o o
0 0
I I I I
0 U
00
0 00
I ] I I0 4 8 12 16
a,deg
(d) C l , C n , C 1 , C .p p r nr
Figure 12. Concluded.
55
o FlightWind tunnel
Cii3, deg-1
-.008
-.0040
C1L
I I I I
.OO8
.OO4 Q
0
I I I I
-.02
deg-1CYI3'
0
0 0 0 0
-4 0 4 8
a, deg
I I I I12 i6
(a) ,CI/3 Cn, Cy_
Figure 13. Comparison of lateral-directional derivatives obtained fromflight data with wind-tunnel predictions for a Mach number of 0.9.
56

o FlightWind tunnel
CI ,deg-1
8a
.OOl0
0 00
I I I I
.0010 o,v- j
I I I I
.002 --
Cy ,deg-I
8a0
0
I
0 4 8a, deg
0
0
I ]
12
J16
(b) , C ,Cl_ n6 CY 8
a a a
Figure 13. Continued.
57

Ci6, deg-1r
.0O2
0ol
0
0
0
FlightWindtunnelSlash denotes outboard fin
jettison tubes on
®
I ] I I
-1
Cns, degr
-.004
-002 -- 0
I I I I
Cy , deg-16r
.0O4
0
0 4a, {leg
0i
12
J16
(c) , C ,C18 n5 CY 6
r r r
Figure 13. Continued.
58

O FlightPreflight estimate
Cip, rad-1
-.4
0
O
OO 0
I
-1Cn, rad
P
.8--
.4--
0
I I °lo I
-ICi, rad
r
1
V0
t3_O
O
-1Cn, rad
r
-4--
-2 -
0-L
O OO
u
t I I I0 4 8 12 16
a, deg
(d) C 1 , C n , C 1 , C .p p r nr
Figure 13. Concluded.
59

o FlightWind tunnel
Cll3,deg-I
-.008
-.0040
0
0 o
I I I I
Cnl3, deg"l
.OO8
.0O40
I I 1 I
CYI3'deg-]
-.04
-.02
0
0
o _o Oo0
) 0
J I I I0 4 8 12 16
a, deg
0
(a) , , .C1_ Cn_ Cy_
Figure 14. Comparison of lateral-directional derivatives obtained fromflight data with wind-tunnel predictions for a Mach number of 0.95.
6O

.002
CI , deg-16a .001
0
0 FlightWind tunnel, trimmed
Wind tunnel, 5u = -20°, 51= 35°
O0 0
o M = O.936I 1 I J
.002 -
Cn , deg-15a .001
I I
0
] J
•002 --
-ICy , deg
5a
-.002
oO0
0
0
0
0
.1. I I J0 4 8 12 16
a, deg
Co) , C ,C16 n6 Cy_
II a II
Figure 14. Continued.
61

0 FlightWind tunnelSlash denotes outboard fin
jettison tubes on
@@
0
t I
-.004 --
Cn , deg-1
6r-.002
-----.___(D
0
Q)
t I I I
Cy , deg-18r
.004 --
0@
-.004
-L
@
Z} •i
@
0
I4
a, deg
I I I8 12 16
(c) , C ,C16 n8 Cyb
r r r
Figure 14. Continued.
62
CI, rad-1P
-.4
0 FlightPreflight estimate
0 o
O0
o l I °
0
G
0
I
C rad-1np'
.8 --0
0
0
0
c[o I° I
Cl, rad-1r
_
0
I
0
0
U
@I
0
0oo
I I
Cn, tad-1r
4
0
0
-4
0
OU v0 0
U
0
I I I I
4 8 12 16a, deg
(d) C 1 , Cn , C l , C np p r r
Figure 14. Concluded.
63

o FlightWind tunnel
Ci, deg-I
-.O08
-.004
0
00
0
oo
I I I I
Cnl3, deg-1
.O08
.O04
I I I I
-.04 m
Cy, deg-1 -.02
i ............
-4 0
0o o°
I I I I4 8 12 16
a, deg
a) , , •C1_ Cn/3 Cy_
Figure 15. Comparison of lateral-directional derivatives obtained from
flightdata with wind-tunnel predictions for a Mach number of 1.1.
64

o FlightWind tunnel
CI , deg-16a
.0ol
I °! , 0.-0
I I
Cn , deg-]6a
.001
Cy , deg-16a
.0O2
-.0O2
0 oo
0 4a, deg
0
I12
I15
(b) C 1_ , Cn8 , Cy8a a a
Figure 15. Continued.
65

CI , deg-1
8r
.OO1
I
0 FlightWind tunnelSlash denotesoutboard fin
jettison tubes on
0
0 0
I I° I I
-1C deg
n6r'
-.002o 0
1 I I I
.004 --
-.004-_ 0
0
4
(_, deg
1 I I8 12 16
(c) , C ,C18 n 8 CY 8
r r r
Figure 15. Continued.
66

Ci, rad-1P
-.4
0V°t.8 --
0 FlightPreflight estimate
00
0 0
0
.... I I [ I
-1Cn, rad
P
Ci, rad-1r
.4
0
2 --
1 --
0
0 0
0
0
o
I I I
0
0
00
0
I o I I I
-ICn , rad
r-2 -- u,3
-4
0oo
[ , , I
4 8a, deg
0
0
(d) C 1 , Cnp C 1 C np r r
Figure 15. Concluded.
I I12 16
67

o FlightWind tunnel
-.008
-.004
O 0
1 I I I
Cnl_, deg-1
.0O8
.0O4
I I I I
0 n
Cyi3, deg-1
o ] I I I-4 0 4 8 12 16
a, deg
(a) , , .el/3 Cn_ Cy_
Figure 16. Comparison of lateral-directional derivatives obtained fromflight data with wind-tunnel predictions for a Maeh number of 1.3.
68

o FlightWind tunnel
CI , deg-16a
.OO1
0
I I I I
Cn , deg-1
6a
.OO1
0
I l 1 ]
.002 --
j ,
!!i!
Cy , deg-1
6a
-.002
£'l
I I I8 12 160 4
a, deg
(b) , C ,CI_ n_ CY 6
8 8 8
Figure 16. Continued.
69

CI , deg-1
6r
.O01
0 FlightWind tunnelSlash denotes outboard fin
jettison tubes on
l I I I
Cn , deg-1
5r
-.002
I I I
.004 --
Cys, deg-1r
-.004-4
_e 0
I I I I4 8 12 16
a, deg
(c) , Cn6CI_ , Cy6r r r
Figure 16. Continued.
70

-.8
0 FlightPreflight estimate
-1
Cip, rad
-1Cn, rad
P
-.4
0
.8
.4--
0
00
0
0
0
I I I I
0
0
0 o
I I I I
-1CI , rad
r
0
-4 --
0
0
0t_
0
I I I I
Cn , rad-1 -2r
o
-4 0 4 8a, deg
I I I12 16
(d) C 1 , Cn , C 1 , C np p r r
Figure 16. Concluded.
71

-.0016
0
0
Flight, 8u =-20 °
Flight, 5u = -11.8 °
Windtunnel, 5u = -20°
.... Wind tunnel, 6u =-11.8 °
.w Preflight estimate
-.0008
o13 O0 1_ 0 0
o 0
I I I 1
-.004 --
Cm , deg-1
61-.002 0
dl=-_g
I I I I
-l.O --
C , rad -1mq
-.5
-Z
o0
0_3 O0 0
O00 0 0
J Ia I J0 4 8 12 16
a, deg
(a) M= 0.5.
Figure 17. Comparison of longitudinal derivatives obtained from flight data withwind-tunnel predictions for Mach numbers of 0.5, 0.7, 0.8, I.i, and 1.3.
72

Cm , deg"]a
-.0016
-.0008
f/'
f
o Flight, 6u =-20 °
o Flight, 8u =-11.8 °
Wind tunnel, 8u = -20,°
.... Wind tunnel, 6 =-ll.8 °um.__ Preflight estimate
Solid symbol denotes power on
f
,'0'_" .s -" ""
nf
r _ ..o....-'---._-- 0
\\
I I \'_1
C , deg-1
rn61
-.004
-.002 B0 A
v •
I I I I
-1.0 --
Cm, rad-1q
-.5
0-4
0
00
I0 4
o
o
I
a, de9
ow mm
I I12 16
(b) M= 0.7.
Figure 17. Continued.
73

0 Flight-- Wind tunnel.... Preflight estimate
Solid symbol denotes power on
Cm , deg-1
-.0016 --
-.0008
0
0
t [
-.004 --
Cm , deg-]6e -002
r0
• •• 0
1 I I t
Cm, rad-1q
-! 0 --
-.5 --
0
0
_IL
0
• 0
I I I I4 8 12 16
cz,deg
(c) M= 0.8.
Figure 17. Continued.
74

0 FlightWind tunnel
Preflight estimateSolid symbol denotespower on
-.0024
-.0016
-.0008
-- 0
I I I I
-.004 --
C , deg-1
m51-.002 m
0
0
I I I I
-I.0 -- o
Cm, rad-1q
-..5
0
I I I I4 8 12 16
a, deg
(d) M= I.I.
Figure 17. Continued.
75

-.003
0 FlightWindtunnelPreflight estimate
Cm , deg-1a
-.002
-.001
0
u o
I l l 1
-1Cm , deg
51
-.002
0
Io I] I I
-1.0 --
Cmq, rad-1 -.5
00
I I ] I
4 8 12 16a, deg
(e) M= 1.3.
Figure 17. Concluded.
76

2I
I!
/J!
iI
o Flight
003 a ._ Wind tunnel-" _ -- - Interpolation
, ".002 - o
C , degTM ".001/- o
'"a l "--'a°---a" .......... ..a
,-.oo2F-
cm ,deg'Z /-----v-. o......
a -.OOI/-- .o.......
O_ , a=5"l °-.003 -
Cm , deg "Ia
Cm , deg-Ia
Ca) c
FigUre 18. Comparison of longitudinal derivatives obtained from t'Hght data inthe transonic Speed region With wind-tunnel Predictions.
7T

o Fliglltn Wind tunnel
I nte rpolatio n
Cm , deg-1
{)1
-1Cm , deg
81
Cm , deg-1
51
C , deg"1
m81
°f-.002 - - -
0
-.004
-.002
a_-3.6 °
I I
I0
°fl-.002
0
"" _ '1:} .... 0
a=5.1 °
I 1 I I •
a=7.2 °
"-El
0
o-.002 o
0 [....... 1
a = 10.5 °
0
-.004 _---o
-.002 ---.-o-a.
0 I I•84 .88 .92
I I I I
(I = 12.4°
I:!
I I I ].96 1.00 1.04 1.08M
Co) cm_ 1
Figure 18. Continued.
78
Cm, rad-1
q
-1.0
-.5
0 FlightPreflight estimate
.5
1.0.84
-- 0
o oo
00
I [ I I
.88 .92 .% 1.00M
I1.08
I1.12
(c) Cm
q
Figure 18. Concluded.
79

O
[]
<>A
q, hN/m2 (Ib/ft2)58.9 (123)68.0 (142)105.3 (220)I11.1(232)
47.9(100)
.... 95.8 (200)w.m 143.6(300)
Flight
Wind tunnel
AC I
.008
.OO4o BO
o <>
I I I I I
.008 --
t'C n .004
.4
80
[] 08 A
I I I I I.5 .6 .7 .8 .9
iV1
Figure 19. Comparison of flight and wind-tunnel incremental moment coeffi-cients due to reaction control rocket operation. Outboard and opposite in-
board rocket. Sign convention based on right outboard/left inboard rockets.Data normalized to two 400-N- (90-1b-) thrust rockets. Geometry I.
8O

.OO4
q, hN/m2 (Ib/ft2)
o 69.9 (144)o 95.8 (200)
!
i
AC I
O
0 D0 D
0
I I 1
AC n
O O
O
O
B
I I I
(a)
.4
Outboard rocket.
.5 .6 .7M
Sign convention based on right outboard rocket.
Figure 20. Incremental moment coefficients due to outboard and inboardreaction control rocket operation. Data normalized to one 400-N- (90-1b-)thrust rocket. Geometry 1.
81

.OO4
O
o
q, hNIm2 (Ib/ft2)
69.9 (144)87.6 (183)
AC I0
0
a
[]
.004--
AC n
.4
O
[]0
a
I.5
M
I.6
I.7
(b) Inboard rocket. Sign convention based on left inboard rocket.
Figure 20. Concluded.
82

.OO8
q, hNIm2 (Iblff2)
o 71.8 (150)m 85.7 (179)
&C m .004
.4
I I I.5 .6 .7
M
(a) Outboard rockets.
&Crn
-.012
-.008
-.004
.4
I I I.5 .6 .7
M
(b) Inboard rockets.
Figure 21. Incremental moment coefficient due to either both outboard or both
inboard reaction control rocket operation. Data normalized to two 400-N-(90-1b-) thrust rockets. Geometry 2.
83
61, deg
28--
26 _-_
24--
22--
20--
18--
16--
14
FlightWind tunnel
\',, \\
\x_'-..._ 4.4\
\
\\\\\
\
\0
Osb, deg
0
I I I J
0 4 8 12 16
a,deg
(a) M-- 0.5.
Figure 22. Longitudinal trim as a function of angle of attack including speed-brake effects for Mach numbers of 0.5 and 0.7. 8 = -11.8 ° .
U
84

81, deg
28 --
26 --
24 --
22--
20--
18 --
15 --
14 --
12-Z
Flight.... Wind tunnel
27
10 "- "\
\\\ _ 5sb,deg
--o\
\\
\
\
I4
I I8 12
a,deg
I
16
]
20
(b) M= 0.7.
Figure 22. Concluded.
85
5I, deg :36
42 --
\\
\\
40 --
38 --
34--
32--
3O-4
Flight.... Wind tunnel
\\\\
\\\\\\\\_
\\
\\
\\
\\
\\
I I l N0 4 8 12 16
a, deg
Figure 23. Longitudinal trim as a function of angle of attack with power off for
aMachnumber of 0.5. 5u =-20°; Gsb = 0°"
86

4 --
Flight.... Wind tunnel
51, deg
42
4O
38
36
34
32
3O
"\\
-%
-Z
(_ Engine chambers
\\
,/):\\ _ _EI, E2,E3,E4
\ _ Power off\
\\
\\
\
- Power off
I I 1 1 I4 8 12 16 20
a,deg
(a) M= 0.7.
Figure 24. Longitudinal trim as a function of angle of attack including powereffects for Mach numbers of 0.7, 0.8, 1.1, and 1.3. 6 =-20 ° .
U
.i
_z
87
61, deg
4 --
\\
42 --\
40--
38--
36 --
34--
32 --
30-,_
\\
\\
\\
FlightWind tunnel
Engine chambers
Power off
X\
\\ El, E2, E3
\\
\\
\\
\\
"" --- _ _ -.-Power off
I I I I8 12 16
a, deg
Co) M= 0.8.
I2O
Figure 24. Continued.
88
t!
,i
'\\
44 --\\\\\
42 --
40 --
51,deg 38 --
36 --
34 --
32 --
30_,_
\ \\\\\
\\\\\\\
ower on,all chambers
\\\\\\\\\\\ Power off\\\
1Poweroff
0 4 8
a, deg
(c) M= 1.1.
Figure 24. Continued.
-- Flight.... Wind tunnel
l
12
I
16
89

6I, deg
46
44
42
4O
38
36
34_
32-J
m
",\ weron,all chambers
Power off
\\
-- \\\\\
-- \\\\\\\\\
\ Power off\ I
a, deg
8 12
FlightWindtunnel
I16
(d) M= 1.3.
Figure 24. Concluded.
90
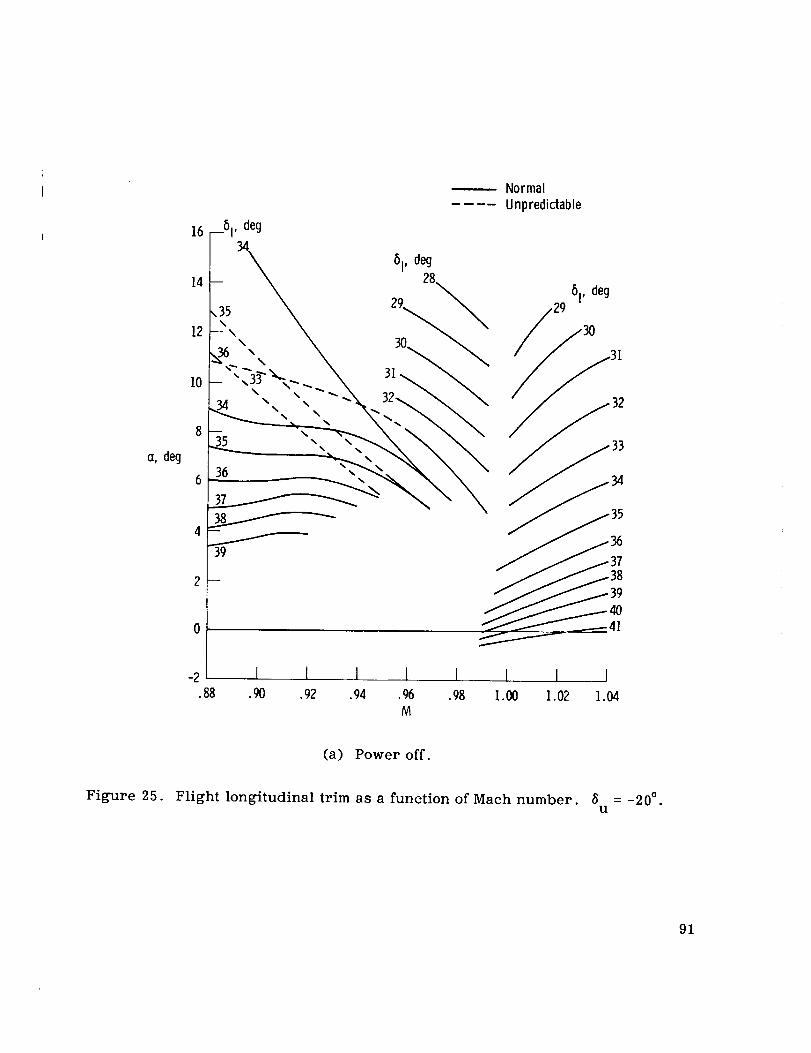
a, deg
16 --61' deg
14
12
10
Normal
Unpredictable
34_ 5 I, deg_ 28
29 61' deg/
-- /, 3O31
i35
-z I I l I t I I I.88 ._ .92 .94 ._ .98 1.00 1.02 1.04
M
(a) Power off.
Figure 25. Flight longitudinal trim as a function of Maeh number. 8 = -20 °.U
91

a, deg
16
14
12
I0
L2
-4.88
61, deg
-- 35 34 32 30 28 26
61, deg
43__
_36 _ 37
I I I 1 I 1
.94 .96 .98 1.00 1.02 1.04
v
I I
.90 .92
M
Co) Power on, all chambers.
Figure 25. Continued.
92
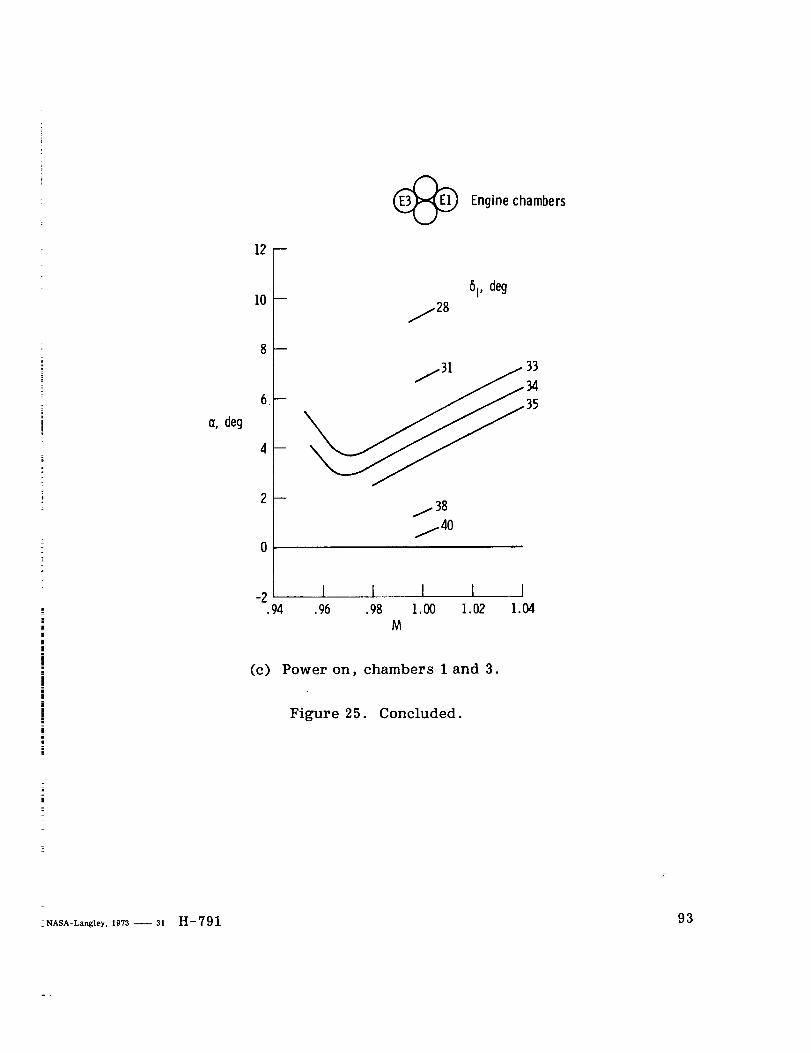
12--
(__ Engine chambers
a, deg
10
-2
51, deg
/31 / 33
-- 35
_38
I I I 1 I.94 .96 .98 1.00 1.02 1.04
M
(c) Power on, chambers 1 and 3.
Figure 25. Concluded.
:NASA-Langley, 1973 -- 31 H-79193

i


![z D x —1 z z z z a. c C) c 20 z z N w W U.] L 222 E (3 E C ... · c uold c z O'6L x õ E z E 10 ... 1-0100 c O LUZ CD 2 . S c C o E C E A > A n > o 20,0 z o ! o c N c 9 o](https://static.fdocuments.us/doc/165x107/5b157a977f8b9a332f8c6b19/z-d-x-1-z-z-z-z-a-c-c-c-20-z-z-n-w-w-u-l-222-e-3-e-c-c-uold-c-z.jpg)


