CASE FATALITY RATES: USER GUIDE – record-based FULL … · Case fatality rates (CFR) are used by...
21
CASE FATALITY RATES: USER GUIDE – FULL REPORT Alastair Mason and Michael Goldacre National Centre for Health Outcomes Development March 2004 UNIT OF HEALTH-CARE EPIDEMIOLOGY UNIVERSITY OF OXFORD REPORT MR6 record-based O U T C O M E measures record-based O U T C O M E measures record-based O U T C O M E measures
Transcript of CASE FATALITY RATES: USER GUIDE – record-based FULL … · Case fatality rates (CFR) are used by...
CASE FATALITY RATES: USER GUIDE – FULL REPORT
Alastair Mason and Michael Goldacre
National Centre for Health Outcomes Development
March 2004
UNIT OF HEALTH-CARE EPIDEMIOLOGY
UNIVERSITY OF OXFORD
REPORT MR6
record-based
O U T C O M E
measures
record-based
O U T C O M E
measures
record-based
O U T C O M E
measures

Alastair Mason and Michael Goldacre National Centre for Health Outcomes Development
March 2004
Sections Page Executive summary 2 1. Introduction 3 2. Condition-based indicators 6 3. Procedure-based indicators 11 4. Specialty-based indicators 15
1
UHCE OXFORD REPORT: CALCULATING CASE FATALITY RATES TO COMPARE HOSPITAL PERFORMANCE
A GUIDE TO METHODOLOGY
EXECUTIVE SUMMARY
This user guide summarises the results of the case fatality rate methodological studies carried out by the Oxford University part of the National Centre for Health Outcomes Development from 2001-2004. The main objective of the NCHOD work has been to identify indicators that could be useful in comparing hospital performance. Work has also been done on comparing performance over time. To enable the making of hospital comparisons, NCHOD has specified case fatality indicators based on: • individual conditions or diseases • individual operations • sub-sets of the activities of clinical specialties
2
1. INTRODUCTION
Purpose The purpose of this Guide is to assist information analysts specify outcome indicators relating to case fatality rates. It summarises the work commissioned by the Department of Health and carried out by the National Centre for Health Outcomes Development (NCHOD) from 2001 to 2004. Background Death after a hospital admission may be an unavoidable event, a consequence of the natural history of illness or it may be an adverse event that reflects poorly on the care provided. Case fatality rates (CFR) are used by the Department of Health and the NHS to compare hospital performance and are recommended in five of the ten condition-specific reports published in 1999 by NCHOD: • asthma • acute myocardial infarction • diabetes • fractured proximal femur • stroke.
Case fatality rates have also been used as clinical indicators and in star ratings. Those produced have included indicators for deaths within 30 days of: • elective admission operation • emergency admission operation • heart by-pass • angioplasty • emergency admission for fractured hip • emergency admission for acute myocardial infarction • emergency admission for stroke.
NCHOD work The main objective of the NCHOD work on case fatality measures has been to identify indicators that could be useful in comparing hospital performance. Work has also been done on comparing performance over time, but this guide does not specifically address specific issues arising from it. To enable the making of hospital comparisons, NCHOD has specified indicators of case fatality based on: • specific conditions and diseases (see Section 2) • specific operations (see Section 3) • sub-sets of the activities of clinical specialties (see Section 4).
3

Guidance common to all approaches Guidance about indicator specifications common to all three approaches is shown below. Case fatality indicators should only be derived from a file of linked hospital episode and death certificate data. Using only in-hospital deaths derived from a hospital episode file may be misleading if the indicator is to be used to compare hospitals. Numerous NCHOD studies have been published to demonstrate the importance of using linked data. Continuous in-patient spells (CIPS), relating to the duration of stay in a hospital, should be used rather than finished consultant episodes (FCE) because they: • are a more clinically relevant measure than FCEs • obviate having to handle transfers between FCEs in an analysis.
Elective (with and without day cases) and emergency admissions should be analysed separately because for all patient groups the rate of adverse events is significantly greater following emergency admissions as shown in Exhibit 1. Case fatality rates should be age/sex standardised. In common with the clinical indicator specifications, indirect standardisation should be used and the indicators standardised for age and sex. Indirect standardisation is to be preferred because it is: • More robust with small numbers and avoids the distortions caused by direct
standardisation based on unstable age-specific rates. • More flexible with respect to future requirements such as standardising for other
factors such as deprivation. Sources of data used in this guide Three main sources of data have been used in the preparation of this document: • English linked HES/ONS deaths file 1998/2000 linked and processed by NCHOD • Oxford Record Linkage Study (ORLS) file 1996/1998 processed by NCHOD • English linked HES/ONS deaths file 2000/2001 linked and processed by IBM.
4

Exhibit 1: Indirectly age and sex standardised mortality rates for ICD Chapter heads for elective and emergency admissions ICD Elective admissions Emergency admissions Chapter Cases Deaths Rate Cases Deaths Rate x 103 number per 105 x 103 number per 105 1. Infectious 19 119 1041 115 4336 7933 2. Neoplasms 1060 10519 846 152 37031 14710 3. Blood 101 363 319 47 1585 2274 4. Endocrine 66 158 324 57 2587 3589 5. Mental 45 215 594 113 1483 1477 6. Nervous 107 229 273 86 2516 2328 7. Eye 363 319 41 22 73 284 8. Ear 73 10 54 12 19 264 9. Circulatory 293 2120 647 473 56557 5766 10. Respiratory 134 844 1218 417 36274 6568 11. Digestive 756 1123 175 342 15913 3818 12. Skin 147 115 105 94 1489 1507 13. Musculoskeletal 487 532 123 121 1944 1209 14. Genitourinary 526 478 119 173 5737 2860 15. Pregnancy 93 1 8 975 36 84 16. Perinatal 2 6 1859 20 275 7052 17. Congenital 61 74 757 10 219 9658 18. Symptoms 455 2077 465 852 25761 2482 19. Injuries 79 250 407 550 10496 1934 21. Health status 415 710 179 141 1286 1833
Information obtained from the 2000/2001 linked HES file processed by IBM
5

2. CONDITION-SPECIFIC INDICATORS
Issues For condition-specific indicators the issues that need to be considered, relating to the selection of index admissions, are: • Definition of the characteristics of an index admission. • Position of the diagnosis on the HES record. Do you include:
- all admissions with the diagnosis regardless of its position on the record - only those admissions in which the diagnosis is the principal one?
The issues that need to be considered, relating to the deaths to be included in the numerator, are: • Time interval from start of an index admission to death. • Presence and position of diagnosis on the death certificate. Do you include:
- all deaths regardless of cause - only those deaths with the diagnosis given as main cause of death - only those deaths with the diagnosis anywhere on the record?
Defining characteristics of index admission The ‘index’ admission is usually taken to be the first admission with the defining characteristics in a time period for an individual. Defining characteristics include: • a time period, e.g. all admissions in a calendar year • diagnoses and/or procedures of interest in the analysis • features of the admission such as method of admission (e.g. elective/emergency) • organisational characteristics such as hospital and specialty • patients’ demographic characteristics such as age and sex • definitions relating to sequence if a patient has more than one admission for the
defining characteristics (e.g. the patient’s first admission in the year, or all admissions in the year).
When a second admission with same defining characteristics as the index admission occurs between the index admission and the death, a decision is needed about whether such an admission should be considered as a new index admission. The key question to consider is whether the second admission is likely to be a re-admission that is related to the first event (e.g. a re-admission soon after discharge from a first myocardial infarction) or whether it is a new occurrence of disease (e.g. a second myocardial infarction). In analyses where the defining characteristic may occur more than once (such as an initial followed by a subsequent myocardial infarct or stroke) an admission-free period may be used to define a new event. For example, a second admission for myocardial infarction within 30 days of discharge from a first might be considered as a likely complication of the first and omitted from analysis. On the other hand, a second admission for myocardial infarction more than 30 days after discharge from a first might be considered as a likely
6
second infarct. Thus, in identifying and counting index events for myocardial infarction an admission-free period of 30 days between a first and second event might be specified. For stroke, there might be a longer ‘admission-free’ period of say 90 or even 365 days. Position of diagnosis on the HES record The frequency with which the diagnosis is recorded in the position for principal diagnosis, rather than elsewhere on the record, will differ according to the condition under investigation. Exhibit 2 shows for some of the conditions studied in the ten condition-specific reports the extent to which the condition was recorded as the first diagnosis in either the first or last FCE of the CIPS. There is considerable variation between conditions. For the three conditions in Exhibit 2 the diagnosis was first in the first FCE of over 80 % of emergency CIPS, while only 6% of elective admissions with asthma have the diagnosis in this position. One convention is to designate the principal diagnosis of the first FCE as the principal diagnosis of the spell. Another is to consider the principal diagnosis on the last FCE as the principal diagnosis of the spell. The decision needs to be informed, for any given clinical condition, by information about how commonly the diagnosis differs according to whether the first or last FCE is chosen, and, when they differ, whether there is a sound clinical reason for selecting the first or last. Further work is required on how to handle continuous spells with multiple FCEs and multiple diagnoses, and whether the diagnosis under study should be selected if it occurs in the first, last or any FCE. Factors to be considered in deciding whether to include as index admissions all records with the diagnosis or only those with the diagnosis in the first position in either the first or last FCE are: • Relative clinical importance of other diagnoses recorded in the main position
compared to the diagnosis under study. • Whether the diagnosis, such as asthma, is a common co-morbidity. • Possibility of an event such as a stroke, acute MI or fractured proximal femur
occurring in hospital rather than being present at start of the admission. • Possibility of an event, such as a stroke, being the most important diagnosis in an
initial FCE but other diagnoses, such as pneumonia, being important in later FCEs. • Possible variability between hospitals of identifying the first diagnosis in a FCE.
Time interval from admission to death The clinically appropriate time interval between discharge and death for which the calculation is done will differ depending on the clinical condition. Exhibit 3 shows for index emergency admissions of three diagnoses the standardised mortality ratios (with 95% confidence limits) for three time periods. Current clinical indicators usually use 30-day mortality data and it can be seen that the 60-89 day SMR was significantly raised for the emergency index admissions for all three conditions.
7

Clinicians find it difficult to relate care given in an index admission to events occurring more than three months after. It is thus unusual to use indicators over time periods longer than 90 days to compare hospital performance. It should be noted that stroke and fractured proximal femur have raised SMRs for up to a year after emergency admission. Position of diagnosis on the death certificate There are considerable differences between conditions with respect to the frequency with which a death has the condition coded as a cause. Exhibit 4 shows for index emergency admissions of three diagnoses the proportion of deaths that had a diagnosis of the condition being studied coded on the death certificate either as underlying or main cause of death or anywhere on the record. The recording of cause of death is subject to multiple factors and there is considerable variation between the diagnoses of the frequency with which they appear on the record and as underlying cause. Examples of specifications Three conditions that NCHOD have addressed in depth are acute myocardial infarction, fractured proximal femur and stroke. For fractured proximal femur: • ICD-10 codes used are S72.0, 72.1, 72.2 and 72.9. • Only emergency admissions are included. • Only patients aged 65 years and over are included. • Time interval from admission to death is 90 days. • Deaths due to all causes are included.
The majority (94%) of emergency admissions for fractured proximal femur have the condition coded as the first diagnosis in the first FCE of a CIPS. An analysis of the other conditions that were coded as first in the first FCE showed that none of them were more clinically serious than fractured femur. With respect to position on the record, two approaches have been taken, namely using: • all admissions with a diagnosis recorded anywhere on the record • only those admissions with diagnosis recorded as first diagnosis on the first FCE.
For acute myocardial infarction (AMI): • ICD-10 codes used are I21-22. • Emergency admissions are included, except those:
- ending with the patient discharged home in three days or less (these are assumed not to have had an AMI).
- occurring within 30 days of discharge from a previous admission for AMI (these are assumed to be for complications from the first admission).
• Time interval from admission to death is 90 days. • Deaths due to all causes are included.
8

The majority (85%) of emergency admissions for AMI have the condition coded as the first diagnosis in the first FCE. An analysis of the other conditions that were coded as first in the first FCE has showed that none of them were more clinically serious than AMI. With respect to position on the record, two approaches have been taken, using: • all admissions with a diagnosis recorded anywhere on the record • only those admissions with diagnosis recorded as first diagnosis on the first FCE.
In some studies comparing hospitals’ performance in managing AMI, admissions where death occurs on the same day as admission have been excluded as it can be proposed that hospital care in these cases will have made little difference to the outcome. For stroke: • ICD-10 codes used are I61-64. • Only emergency admissions are included. • Emergency admissions occurring within 90 days of a previous admission for stroke
are excluded (these are assumed to be for complications occurring in the first admission.
• Time interval from admission to death is 90 days. • Deaths due to all causes are included.
The majority (81%) of emergency admissions for stroke have the condition coded as the first diagnosis in first FCE. An analysis of the other conditions that were coded as first in the first FCE has showed that none of them were more clinically serious than stroke. With respect to position on the record, two approaches have been taken, using: • all admissions with a diagnosis recorded anywhere on the record • only those admissions with diagnosis recorded as first diagnosis on the first FCE.
9

Exhibit 2: Position of diagnosis code on the FCE and within the CIPS for index emergency admissions - number and percentage of CIPS with just one FCE; and number and percentage of FCEs, including the diagnosis, where the diagnosis was the first diagnosis on either the first or the last FCE Condition CIPS First in first FCE First in last FCE No % 1 FCE Number % Number % Acute MI 173197 70 147620 85 151642 88 Fractured femur 102820 76 96796 94 88061 86 Stroke 183996 62 148263 81 147818 80 Information obtained from 1998/2000 NCHOD English file Exhibit 3: SMRs for index emergency admissions for each of three diagnoses Diagnosis 0-29 day SMR (CI) 30-59 day SMR (CI) 60-89 day SMR (CI) Acute MI 4317 (4131-4508) 612 (528-703) 378 (311-452) Fractured femur 953 (884-1026) 570 (512-631) 347 (301-398) Stroke 3919 (3783-4058) 1166 (1073-1263) 600 (530-676) Information obtained from 1996/1998 ORLS file Exhibit 4: Percentage of deaths within 30 and 90 days of admission that had the condition coded as a cause of death on the death certificate following index emergency admissions Diagnosis Death certificates with diagnosis coded as cause (%) 0-29 days 0-89 days Main Other Absent Main Other Absent Acute MI 81 7 12 88 9 3 Fractured femur 0 28 72 5 78 17 Stroke 62 9 29 74 15 11 Information obtained from 1996/1998 ORLS file
10

3. OPERATIVE PROCEDURE INDICATORS
Issues For indicators of operative procedures, the issues that need to be considered, relating to the selection of index admissions, are: • Definition of the characteristics of an index admission. • Decisions about inclusion as an index admission when there are two or more
operations in a CIPS. Do you include: - all admissions with the procedure, regardless of there being other
operations as well - only those admissions in which the procedure is the first or principal one?
The issues that need to be considered, relating to the deaths to be included in the numerator, are: • Time interval from start of an index admission to death. • Cause of death. Do you include:
- all deaths regardless of cause - only those deaths with a clinical diagnosis relevant to the operation?
Defining characteristics of index admission The ‘index’ admission is usually taken to be the first admission with the defining characteristics in a time period for an individual. Defining characteristics may include: • patients’ demographic characteristics such as age and sex • emergency or elective admission • operative codes • diagnoses • organisational characteristics such as hospital and specialty.
Operations such as coronary artery by-pass grafting (CABG) and cataract frequently need more than one operative code to describe them. In an analysis of the Oxford English file: • 31% of CABG admissions had one, 66% two, and 3% three or four relevant codes. • 10% of cataract admissions had one and 90 % had two relevant codes.
The complex operations that require description by multiple codes must only be counted as one operation. Operations may be associated with diagnoses with very different prognoses and it may be important to specify a procedure indicator using specific diagnosis codes.
11
Multiple operations in a CIPS Problems arise when there is more than one operation recorded in a CIPS as to whether to include it as an index admission. When there is more than one operative procedure, one of them is designated as the principal operation. However, in some cases the principal procedure is interpreted as the first one performed rather than the clinically most important. An analysis, using the Oxford English file, of the 6% of CABG admissions in which CABG was not recorded as the principal operation showed: • 86% of these cases having a principal operation code relating to plastic repair of
mitral valve or aortic valve and occurring on the same day as the CABG procedure. • 14% of these cases having a principal procedure coded as contrast radiology of the
heart and usually occurring on a day before the CABG procedure. Operations such as appendicectomy and cholecystectomy may be carried out as secondary procedures on the same day as a more major operation. Analyses have shown: • In 9% of appendicectomy CIPS the operation code was not designated as the
principal one and a review of the principal codes showed them to be usually operations done on the same day and clinically more important than appendicectomy.
• In 6% of cholecystectomy CIPS the operation code was not designated as the principal one and a review of the principal codes showed them to be usually operations done on the same day and clinically more important than cholecystectomy.
Decisions about the inclusion as index cases of CIPS with multiple procedures can only be taken: • Following careful analysis of what the other procedures were and when they
occurred with relation to the procedure being investigated. • Clinical advice about the relative seriousness of the different procedures.
Time interval from admission to death Exhibit 5 show standardised mortality ratios (with 95% confidence limits) for three time periods for five groups of trauma and orthopaedic operations, calculated from the Oxford English file. Current clinical indicators usually use 30-day mortality data and it can be seen that the 60-89 day SMR was significantly raised for the emergency index admissions for all three operation groups. Clinicians find it difficult to relate care given in an index admission to events occurring more than three months after. It is thus unusual to use indicators over time periods longer than 90 days to compare hospital performance.
12
Cause of death It is not possible with any precision to analyse causes of death after an operation and distinguish between those diagnoses that may be clinically related to the index admission and those that were not. Thus the specification of operation case fatality rates includes deaths from all causes. Examples of specifications Three conditions that NCHOD have addressed in depth are coronary by-pass grafting, hip operations and appendicectomy. For CABG: • OPCS codes K40-46 are used and, if there are multiple codes, only one operation is
counted. • Admissions with operative codes in addition to K40-46 are included. • Only elective admissions are included. • Time interval used is 30 days. • Deaths due to all causes are included.
For appendicectomy: • OPCS codes H01-03 are used, and if there are multiple codes, only one operation is
counted. • Only emergency admissions are included. • When operations other than appendicectomy are recorded, clinical advice should
be taken about which cases to include. • Admissions with a diagnosis of cancer are excluded. • Time interval used is 30 days. • Deaths due to all causes are included.
For hip operations: • OPCS codes W37-39 and W46-48, and if there are multiple codes, only one
operation is counted. • Emergency and elective admissions are analysed separately. • When operations other than those for the hip are recorded, clinical advice should be
taken about which cases to include. This is particularly important for cases of multiple trauma that should be analysed separately.
• Only patients aged 65 years and over are included. • Time interval used is 30 days for elective and 90 days for emergency admissions. • Deaths due to all causes are included.
13
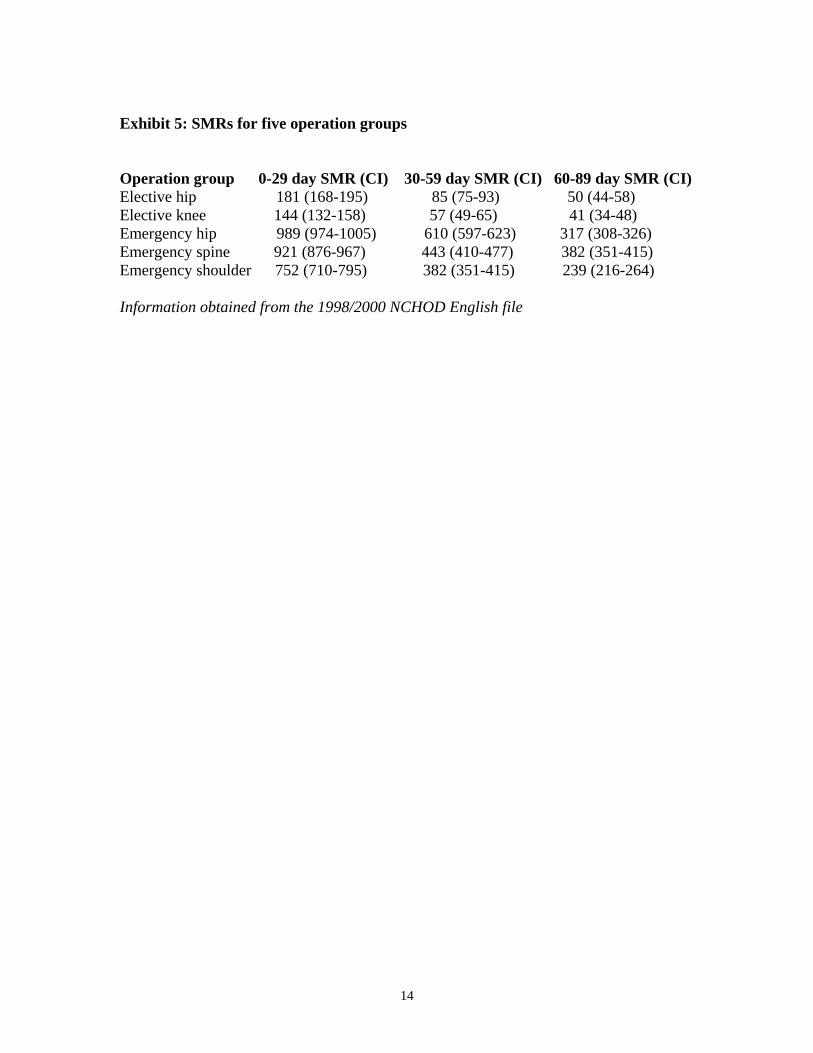
Exhibit 5: SMRs for five operation groups Operation group 0-29 day SMR (CI) 30-59 day SMR (CI) 60-89 day SMR (CI) Elective hip 181 (168-195) 85 (75-93) 50 (44-58) Elective knee 144 (132-158) 57 (49-65) 41 (34-48) Emergency hip 989 (974-1005) 610 (597-623) 317 (308-326) Emergency spine 921 (876-967) 443 (410-477) 382 (351-415) Emergency shoulder 752 (710-795) 382 (351-415) 239 (216-264) Information obtained from the 1998/2000 NCHOD English file
14

4. SPECIALTY-BASED INDICATORS
Issues Hospital work is organised on the basis of specialties. Clinicians within a specialty are responsible for their performance and are more likely to relate to outcome indicators relating to their specialty than to those relating to a whole hospital or trust. Within a specialty there are admissions with high and low risks of death. Case fatality rates calculated for a specialty will be greatly affected by volume of work that is: • low risk increasing the denominator with no effect on the numerator • very high risk, such as cancer patients, leading to increases in the numerator with
minimal effect on the denominator. NCHOD has been working to identify groups of patients within specific specialties with: • No increased risk of mortality and in which any death should be considered
unexpected and investigated • Significant risk of mortality and adequate numbers of admissions and deaths to
produce a discriminating comparative indicator.
Surgical specialties NCHOD has done studies in: • Trauma and orthopaedics • Gynaecology • General surgery/urology comprising:
- gastro-intestinal surgery - vascular surgery - breast surgery - urology.
General principles arising from this work are: • Omit admissions with cancer from the index admissions. • Include admissions which had and did not have operations as index admissions
The decision was made to remove admissions with cancer diagnoses because: • The routine databases of HES and ONS mortality are poor sources from which to
derive cancer mortality statistics. • Cancer survival measures are more appropriate indicators for comparing
performance than case fatality rates. • Comparative cancer mortality performance needs to be based on cancer networks
not individual hospitals or trusts. • Cancer diagnoses are associated with a disproportionately high rate of deaths
during or following admission and thus may mask the effect of less common causes of death.
15

The decision was made to include admissions in which an operation did not occur because the rate of adverse events following them for some patient groups was as great or greater than for those in which an operation took place. Exhibit 6 shows an analysis, using the ORLS file for admissions with cancer cases removed, of the SMRs for groups of patients that had and did not have an operation. The results of the studies done on individual specialties are shown in Annexes A and B. Exhibit 6: SMRs for specialty groups with and without an operation (cancer patients excluded) Patient group 0-29 day SMR (CI) 30-59 day SMR (CI) 60-89 day SMR (CI) Trauma & orthopaedics elective admissions ( no day cases) With operation 211 (162-266) 83 (54-119) 77 (49-115) No operation 256 (71-294) 155 (49-250) 122 (6-58)
Trauma & orthopaedics emergency admissions With operation 2185 (2009-2367) 1466 (1291-1610) 904 (774-1043) No operation 1795 (1636-1961) 464 (380-556) 355 (281-438)
General surgery/urology elective admissions (no day cases) With operation 354 (304-408) 242 (201-287) 171 (137-201) No operation 645 (456-866) 334 (201-521) 160 (73-304)
General surgery/urology emergency admissions With operation 2138 (1984-2298) 767 (670-869) 489 (411-573) No operation 2465 (2303-2633) 559 (476-648) 375 (307-450) Gynaecology elective admissions (no day cases) With operation 109 (96-124) 70 (59-82) 70 (59-84) No operation 435 (335-554) 427 (328-547) 221 (152-310)
Gynaecology emergency admissions With operation 204 (167-246) 221 (183-265) 112 (85-145) No operation 728 (656-806) 459 (401-523) 305 (257-359) Information for T&O and gynaecology from the 1998/2000 NCHOD English file Information for general surgery/urology from the 1996/1998 ORLS file
16

ANNEX A: TRAUMA AND ORTHOPAEDICS
Methods We used the Oxford English linked file and produced a subset containing all continuous in-patient hospital spells with at least one episode in the care of a trauma and orthopaedic consultant. The numerators were deaths recorded on the hospital record and/or a death certificate 0-29 and 0-89 days after elective and emergency admissions respectively, as previous work had shown these to be appropriate time periods. The mortality rates were converted to age-standardised mortality ratios (SMRs) by using the indirect method of standardisation. For the groups with cancer diagnoses, the age-specific mortality rates in the English population were applied to the number of people in the equivalent age strata admitted in the sub-groups analysed. For the groups without cancer diagnoses, the calculation of the age-specific mortality rates in the English population excluded people who had died from cancer. Cases with cancer diagnoses were defined as ICD-10 codes C00-99. The ‘high-risk’ elective admission group was defined as overnight stays with ICD-10 diagnoses S70-79, T84-85 and 87; and/or OPCS-4 operations V22-27 and 37-50, W37-42 and 46-48. The ‘high-risk’ emergency admission group was defined as ICD-10 diagnoses S10-19, 22, 32, 40-49 and 70-79, T85 and 87; and/or OPCS-4 operations V22-27, 29, 31 and 37-54, and W19, 24, 28, 29, 37-42, 46-51, and X07-12. For both elective and emergency admissions, the ‘low-risk’ group was defined as admissions except those with cancer and the high-risk diagnoses and procedures. The five anatomical high-risk groups were defined by the appropriate diagnoses and operations in the respective ‘high risk’ groups. Results The results are shown in Exhibit A. Admissions with cancer diagnoses, accounting for 3% of elective and 4% of emergency admissions, should be analysed separately. Elective and emergency admissions should then be analysed separately as only the 0-29 day SMR for elective admissions is significantly elevated, while for emergency admissions there is a significant excess mortality at 90 days after admission. Elective admissions have a comparatively low mortality rate. Once cases with cancer diagnoses have been removed, the task is to identify whether there is a group with an adequate number of admissions and deaths to provide a potentially useful comparative
17

indicator. The hip/femur (9% of elective admissions) and knee (7% of elective admissions) groups may fit these criteria. The elective admissions low-risk group with day cases accounted for 78% of all elective admissions and had a low SMR. Any death in a group with a normal or low SMR should be considered unexpected and investigated and trusts should be screened to identify any with an elevated SMR for such a group. The group of emergency admissions with cancer cases removed has a comparatively high SMR of 696 and is a potential comparative indicator. It was not possible to identify a group of emergency admissions of significant size with a normal SMR. The high risk group (42% of emergency admissions) and the hip/femur group (21% of emergency admissions) may also have sufficient numbers and deaths to be suitable candidates to become comparative indicators. Exhibit A: Summary of key results Index admission In-patient spells Deaths 0-29 day SMR
No (%) No (95% CIs)
Elective admissionsAll including day cases 1495604 (100) 2701All less cancer diagnoses 1453625 (97) 2343 169 (162 -176) Low-risk group with day-cases 1163043 (78) 807 104 (97 - 111) Low-risk group less day-cases 450160 (30) 552 153 (141 - 167)High-risk group with day-cases 290582 (19) 1536 252 (240 - 265)Hip/femur group 134762 (9) 862 279 (261 - 279)Knee group 107999 (7) 585 226 (208 - 245)
0-89 day SMRs (95%CIs)
Emergency admissions All 1048226 (100) 58152All less cancer diagnoses 1006056 (96) 48278 696 (690 - 703)Low-risk group 570085 (54) 9568 516 (506 - 526)High-risk group 435971 (42) 38710 762 (755 - 770)Hip/femur group 223766 (21) 33350 812 (803 - 821)Spine group 55689 (5) 3093 703 (679 - 729)Shoulder group 69558 (7) 2499 601 (578 - 625)
18
ANNEX B: GYNAECOLOGY
Methods We used a file which has linked English hospital admission data and death certificates for the four financial years 1998/2002 and produced a subset containing all continuous in-patient hospital spells with at least one episode in the care of a gynaecology consultant. The numerators were deaths recorded on the hospital record and/or a death certificate 0-29, 30-59, 60-89 and 0-89 days after elective and emergency admissions. The mortality rates were converted to age-standardised mortality ratios (SMRs) by using the indirect method of standardisation. For the groups with cancer diagnoses, the age-specific mortality rates for all causes in the English population were applied to the number of people in the equivalent age strata admitted in the sub-groups analysed. For the groups without cancer diagnoses, the standard age-specific mortality rates for the English population used to calculate SMRs excluded people who had died from cancer. Cases with cancer diagnoses were defined as ICD-10 codes C00-99.
High-risk diagnoses identified for the emergency admissions were: • N70, 73 associated with inflammatory diseases of females • N82, 83, 89 and 93 associated with non-inflammatory diseases of females.
In the analyses of groups with and without gynaecological procedures, the procedure codes used were: • all P procedures • all Q procedures • all T procedure • all M procedures except M47 (catherisation).
For emergency admissions, the ‘low-risk’ group was defined as admissions except those with cancer and the high-risk diagnoses and procedures. For elective admissions the ‘low-risk’ group was defined as admissions except those with cancer Results and discussion The key results are shown in Exhibit B. Cancer cases accounted for: • 3% of the elective admissions (including day cases) and 64% of the 0-29 day deaths • 3% of the emergency admissions and 79% of the 0-29 day deaths.
Once the patients with cancer diagnoses had been excluded from analyses of elective admissions, the SMR for the groups including and excluding day cases were less than 100. Women without cancer who have elective admissions for gynaecology have no greater risk of dying than women in the general population.
19
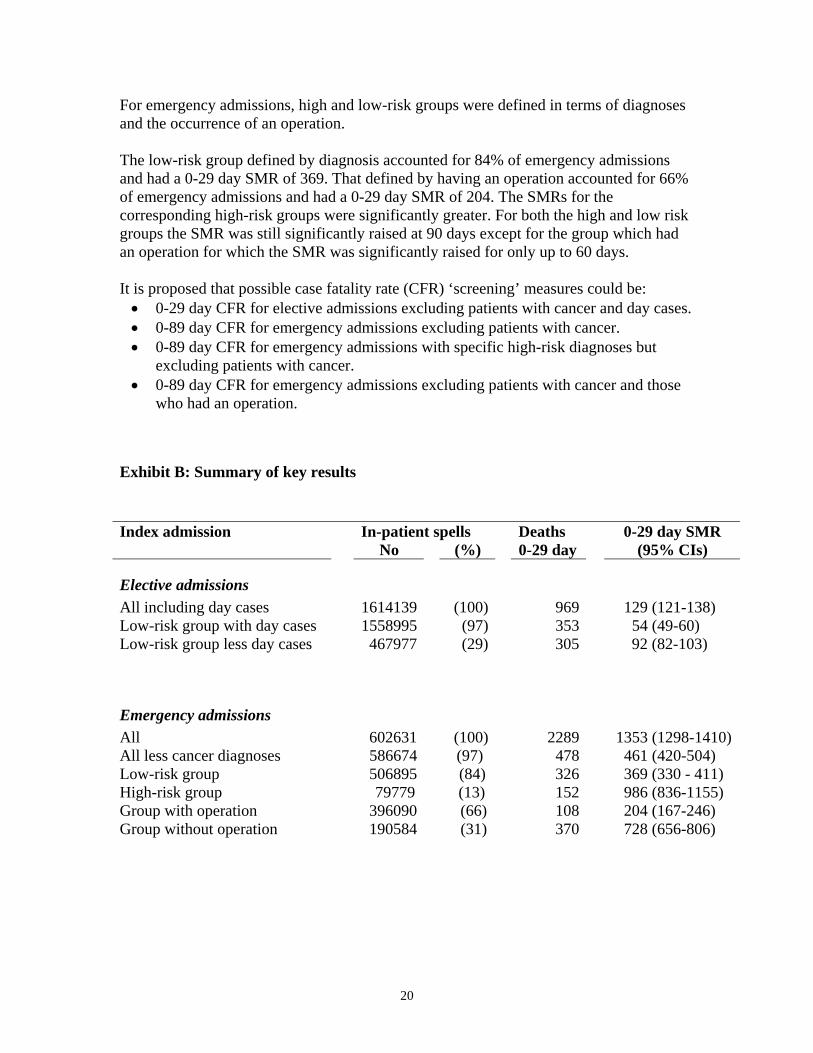
For emergency admissions, ined in terms of diagnoses and the occurrence of an operation.
he low-risk group defined by diagnosis accounted for 84% of emergency admissions
ays.
es.
Ex i
In-patient spells Deaths 0-29 day SMR
high and low-risk groups were def
Tand had a 0-29 day SMR of 369. That defined by having an operation accounted for 66% of emergency admissions and had a 0-29 day SMR of 204. The SMRs for the corresponding high-risk groups were significantly greater. For both the high and low riskgroups the SMR was still significantly raised at 90 days except for the group which had an operation for which the SMR was significantly raised for only up to 60 d It is proposed that possible case fatality rate (CFR) ‘screening’ measures could be: • 0-29 day CFR for elective admissions excluding patients with cancer and day cas• 0-89 day CFR for emergency admissions excluding patients with cancer. • 0-89 day CFR for emergency admissions with specific high-risk diagnoses but
excluding patients with cancer. • 0-89 day CFR for emergency admissions excluding patients with cancer and those
who had an operation.
hib t B: Summary of key results
Index admission No (%) 0-29 day (95% CIs)
E t
lec ive admissions A n (100) 969 129 (121-138)
ow-risk group with day cases 1558995 (97) 353 54 (49-60) 3)
ll 602631 (100) 2289 1353 (1298-1410) 6674 (97) 478 461 (420-504)
ow-risk group 506895 (84) 326 369 (330 - 411) 79779 (13) 152 986 (836-1155)
G 6) G 728 (656-806)
ll i cluding day cases 1614139LLow-risk group less day cases 467977 (29) 305 92 (82-10
Emergency admissions AAll less cancer diagnoses 58LHigh-risk group
roup with operation 396090 (66) 108 204 (167-24roup without operation 190584 (31) 370
20