
Cascading Behavior in Yelp Reviews - arXiv.org e … Behavior in Yelp Reviews Muhammad Raza Khan∗...
9
Cascading Behavior in Yelp Reviews Muhammad Raza Khan ∗ University of California, Berkeley [email protected] ABSTRACT Social media has changed the landscape of marketing and consumer research as the adoption and promotion of businesses is becoming more and more dependent on how the customers are interacting and feeling about the business on platforms like Facebook, Twitter, Yelp etc. Social review websites like Yelp have become an important source of information about different businesses. Social influence on these online platforms can result in individuals adopting or promoting ideas and actions resulting in information cascades. Re- search on information cascades have been gaining popularity over the last few years but most of the research has been focused on platforms like Twitter and Facebook. Research on the adoption or promotion of product using cascades can help determine important latent patterns of social influence. In this work, we have analyzed the spread of information i.e. cascades in Yelp across different cities in Europe and North America. We have enumerated and analyzed different cascade topologies that occur in the Yelp social networks. Some of our significant findings include the presence of a significant number of cascades in Yelp reviews indicating the importance of social influence, heavy tailed distribution of cascades and possibility to accurately predict the size of cascades on the basis of initial reviews. In addition, we have also found that the characteristics of the non root nodes and the non root reviews are much more important type of feature as compared to the properties of the root nodes and root reviews of the cascade. These findings can help social scientists to analyze customer behavior across different cities in a much more systematic way. Furthermore, it can also help the businesses in a city to figure out different consumer trends and hence improve their processes and offerings. CCS CONCEPTS • Human-centered computing → Social network analysis; ACM Reference Format: Muhammad Raza Khan. 2017. Cascading Behavior in Yelp Reviews. In Pro- ceedings of ACM Conference (Conference’17). ACM, New York, NY, USA, 9 pages. https://doi.org/10.1145/nnnnnnn.nnnnnnn 1 INTRODUCTION Social media websites like Facebook and Twitter etc. have become an important source of information to analyze human behavior in different circumstances. Before the popularity of these social media websites, the research on human behavior in many cases was constrained by the lack of availability of data. However, these social media websites have become the biggest observatory of hu- man behavior, as a result of which quite a significant number of research projects on human behavior analysis have employed social media data. People express their personal feelings and concerns and at the same time review businesses and products on these social media websites. On the other end, businesses and companies have been using these social media outlets to promote their products, customer service and quality. The way customers deal with these promotions or express their views about these companies can tell a lot of information about these businesses. The research on social media analytics is primarily dominated by the work correlating business performances with the reviews, however the impact of the reviews of the individuals on others has been a relatively less popular theme. The impact of the reviews of an individual activity in the social network over other individuals’ activity is the broader theme of this work. Social networks impact human behavior at different levels in different contexts and it has been difficult to estimate the social influence on individual’s behavior specially when it comes to buy- ing something or dealing with a business. To quote Subramani and Rajagopalan [14], "there needs to be a greater understanding of the contexts in which viral marketing strategy works and the characteristics of products and services for which it is most ef- fective. ... What is missing is an analysis of viral marketing that highlights systematic patterns in the nature of knowledge-sharing and persuasion by influencers and responses by recipients in online social networks". Part of the problem in effectively analyzing the influence of social networks has been the lack of availability of data, however the growing research on Facebook and Twitter data indicates that this is becoming less of a problem. The other half of the problem is that the impact of users on other users can be a complex function of different latent features. The influence of influencers on others can be different even with in a social network ∗ Under review Permission to make digital or hard copies of all or part of this work for personal or classroom use is granted without fee provided that copies are not made or distributed for profit or commercial advantage and that copies bear this notice and the full citation on the first page. Copyrights for components of this work owned by others than ACM must be honored. Abstracting with credit is permitted. To copy otherwise, or republish, to post on servers or to redistribute to lists, requires prior specific permission and/or a fee. Request permissions from [email protected]. Conference’17, July 2017, Washington, DC, USA © 2017 Association for Computing Machinery. ACM ISBN 978-x-xxxx-xxxx-x/YY/MM. . . $15.00 https://doi.org/10.1145/nnnnnnn.nnnnnnn arXiv:1712.00903v1 [cs.SI] 4 Dec 2017
-
Upload
truongtruc -
Category
Documents
-
view
218 -
download
1
Transcript of Cascading Behavior in Yelp Reviews - arXiv.org e … Behavior in Yelp Reviews Muhammad Raza Khan∗...
Cascading Behavior in Yelp ReviewsMuhammad Raza Khan∗
University of California, [email protected]
ABSTRACTSocial media has changed the landscape of marketing and consumerresearch as the adoption and promotion of businesses is becomingmore and more dependent on how the customers are interactingand feeling about the business on platforms like Facebook, Twitter,Yelp etc. Social review websites like Yelp have become an importantsource of information about different businesses. Social influenceon these online platforms can result in individuals adopting orpromoting ideas and actions resulting in information cascades. Re-search on information cascades have been gaining popularity overthe last few years but most of the research has been focused onplatforms like Twitter and Facebook. Research on the adoption orpromotion of product using cascades can help determine importantlatent patterns of social influence.
In this work, we have analyzed the spread of information i.e.cascades in Yelp across different cities in Europe and North America.We have enumerated and analyzed different cascade topologies thatoccur in the Yelp social networks. Some of our significant findingsinclude the presence of a significant number of cascades in Yelpreviews indicating the importance of social influence, heavy taileddistribution of cascades and possibility to accurately predict the sizeof cascades on the basis of initial reviews. In addition, we have alsofound that the characteristics of the non root nodes and the nonroot reviews are much more important type of feature as comparedto the properties of the root nodes and root reviews of the cascade.
These findings can help social scientists to analyze customerbehavior across different cities in a much more systematic way.Furthermore, it can also help the businesses in a city to figure outdifferent consumer trends and hence improve their processes andofferings.
CCS CONCEPTS• Human-centered computing→ Social network analysis;
ACM Reference Format:Muhammad Raza Khan. 2017. Cascading Behavior in Yelp Reviews. In Pro-ceedings of ACM Conference (Conference’17). ACM, New York, NY, USA,9 pages. https://doi.org/10.1145/nnnnnnn.nnnnnnn
1 INTRODUCTIONSocial media websites like Facebook and Twitter etc. have becomean important source of information to analyze human behaviorin different circumstances. Before the popularity of these socialmedia websites, the research on human behavior in many caseswas constrained by the lack of availability of data. However, thesesocial media websites have become the biggest observatory of hu-man behavior, as a result of which quite a significant number ofresearch projects on human behavior analysis have employed socialmedia data. People express their personal feelings and concerns andat the same time review businesses and products on these socialmedia websites. On the other end, businesses and companies havebeen using these social media outlets to promote their products,customer service and quality. The way customers deal with thesepromotions or express their views about these companies can tell alot of information about these businesses. The research on socialmedia analytics is primarily dominated by the work correlatingbusiness performances with the reviews, however the impact ofthe reviews of the individuals on others has been a relatively lesspopular theme. The impact of the reviews of an individual activityin the social network over other individuals’ activity is the broadertheme of this work.
Social networks impact human behavior at different levels indifferent contexts and it has been difficult to estimate the socialinfluence on individual’s behavior specially when it comes to buy-ing something or dealing with a business. To quote Subramaniand Rajagopalan [14], "there needs to be a greater understandingof the contexts in which viral marketing strategy works and thecharacteristics of products and services for which it is most ef-fective. ... What is missing is an analysis of viral marketing thathighlights systematic patterns in the nature of knowledge-sharingand persuasion by influencers and responses by recipients in onlinesocial networks". Part of the problem in effectively analyzing theinfluence of social networks has been the lack of availability ofdata, however the growing research on Facebook and Twitter dataindicates that this is becoming less of a problem. The other halfof the problem is that the impact of users on other users can bea complex function of different latent features. The influence ofinfluencers on others can be different even with in a social network
∗Under review
Permission to make digital or hard copies of all or part of this work for personal orclassroom use is granted without fee provided that copies are not made or distributedfor profit or commercial advantage and that copies bear this notice and the full citationon the first page. Copyrights for components of this work owned by others than ACMmust be honored. Abstracting with credit is permitted. To copy otherwise, or republish,to post on servers or to redistribute to lists, requires prior specific permission and/or afee. Request permissions from [email protected]’17, July 2017, Washington, DC, USA© 2017 Association for Computing Machinery.ACM ISBN 978-x-xxxx-xxxx-x/YY/MM. . . $15.00https://doi.org/10.1145/nnnnnnn.nnnnnnn
arX
iv:1
712.
0090
3v1
[cs
.SI]
4 D
ec 2
017
Conference’17, July 2017, Washington, DC, USA Muhammad Raza Khan
City No of businesses No of reviews No of users Total no of cascades CL90=Cascades Length90Long Cascades(Length > CL90)
Karlsruhe 2,905 33,888 12,266 8 2.2 1Edinburgh 3,539 50,781 12,261 300 6.0 28Montreal 6,668 131,927 52,160 561 5.0 46Pittsburgh 8,091 212,107 76,577 823 8.0 63Charlotte 10,177 282,884 99,345 896 6.0 69Madison 3,899 102,140 38,698 449 7.0 34Urbana Champaign 1,556 33,176 15,431 185 4.1 15Cleveland 9,966 228,990 81,176 108 2.0 6Waterloo 24,507 585,119 126,970 462 2.0 24Las Vegas 28,214 1,846,944 627,609 5,665 4.0 312Pheonix 43,492 1,556,500 429,634 3,267 3.0 188
Notes: CL90 indicates the 90th percentile for the length of all the cascades in a particular cityLast column indicates the number of long cascades in each of the city
Table 1: Summary statistics by city
depending on the geographic location or other characteristics of theusers. Information cascades are a common phenomena in the socialnetworks in which the user adopt a new idea or perform an actionunder the influence or recommendation of other users. Informationcascades are an ideal tool to analyze the impact of social influence.Furthermore, they can also help in the analysis of important factorsbehind social influence in different contexts. In this work, we haveanalyzed millions of reviews over the social review website Yelpfrom million of users across different cities in Europe and NorthAmerica.
1.1 Present WorkUsing the data officially provided by Yelp1, we explore the followingquestions in this research paper.
• What kind of information cascades frequently arise in Yelpreviews across different cities?
• What are the significant features of cascades across differentcities?
• Given information about a few early reviews, can one predictthe longevity of the influence? (i.e. Whether these reviewsare a part of a big or small cascade?)
Using Yelp reviews and Yelp network data from different cities wehave tried to have a systematic understanding of patterns of influ-ence across different cities exploring what sort of generic patternscan be deduced.
1.2 Summary of resultsThere are four substantive and one methodological contributionsof this study. Substantively, we (1) develop a richer understand-ing of what drives the diffusion of information in Yelp reviews; (2)construct a supervised learner that can predict, to varying degreesof accuracy depending on the city context, the likelihood than acascade is going to be a big one or short one; (3) analyze the struc-tural properties of the cascades across different cities and indirectlyanalyze the properties of the underlying social network; and (4)analyze the features that can help in predictability of the virality
1https://www.yelp.com/dataset_challenge/
of the cascade. To our knowledge, the analysis of information dif-fusion at this scale across different cultural contexts has not beenperformed earlier.
Methodologically, we have developed a framework to (1) enu-merate and analyze cascades in a scalable and efficient manner; (2)extract the features of cascades (3) and predict whether the cascadeis a long one or short one.
The analysis of cascades can be beneficial for both the businessowners and the review websites (Yelp in this case) as it can unearthlatent trends of consumer behaviors in different cultures which canin turn help the business owners to improve their processes.
2 RELATEDWORKOur work builds on several distinct strands in the academic litera-ture. The first is concerned with the general diffusion of informationin social networks. This has been a popular topic of research overthe last decade.[2] et al. have tried to analyze the cascading behav-ior in Flickr and their key finding has been that growth of cascadesin Flickr can be much faster as compared to some epidemics likeinfectious diseases indicating that social networks can be a veryeffective medium for transmission of information. [4] et al. havetried to compare and contrast the growth of two cascades on Face-book. Consistent with other studies they have found out that smallproportion of content generates cascades of non-trivial size anddepth. However, their finding that different cascades can reach thesame level of popularity through different network topologies anddifferent source and chain characteristics is of special relevancefor us. This is because, we also wanted to find out what are thefrequent cascades shapes in different contexts and what part do thefeatures of the source node and the features of the chains play inthe growth of the cascade.
[10] have tried to analyze the impact of blogs on each other. Themost relevant literature to our work is the work on patterns ofinfluence in recommendation networks [11], [9]. In these works,the authors have tried to analyze the patterns of social influencein recommendation networks. Their work and our work is quitesimilar in methods but we want to find the patterns of influencespecifically in the Yelp social network. Futhermore, we want toidentify important determinants for the growth of cascades in socialnetworks. Our work also confirms the finding of the [3] as we also
Cascading Behavior in Yelp Reviews Conference’17, July 2017, Washington, DC, USA
find out that cascades can be predicted quite accurately using theinformation about the seed nodes and initial nodes of the cascades.
Another set of literature related to this research includes thework that explores the impact of different structural characteris-tics of social networks to model product adoption and diffusionof information. Bakshy et al. found that the adoption rate in theSecond Life social network increases as the number of adoptingfriends increases and the effect of the number of adopting friendsdepends on the connectivity of the individual user [1]. In anotherrelated strand of literature, the researchers have tried to analyzethe impact of social networks on product adoption across differentsocial networks (For instance, Khan et al. have tried to the explorethe impact of different features like the alter of an ego node forthe purpose of product adoption in developing countries [8]) andthere has been mixed evidence about the impact of social network.Though the consensus is that the social networks generally do playa role in product adoption, the extent of impact of these socialnetworks varies. Similarly, Ugander et al. found that probability ofcontagion is more tightly connected to the structural componentsin an individual’s network than the actual size of the network [15]while Romero et al. have tried to analyze the interplay betweensocial and topical structure for predicting the growth of hashtags[13]. Their work is related to our research as we also try to analyzethe impact of different features on the growth of the cascades.There has been limited work on diffusion of information in Yelpreviews. For instance Gee et al. [6] have tried to explore whether amodified herding model better explains the existence of cascadesin yelp or not. Though the dataset that they have been using isquite similar to what we are doing but we are more focused on thefeatures that can help predicting the growth of the cascades acrossdifferent cultures.One distinguishing feature of this study is that we have analyzedthe spread of cascades on Yelp which can be slightly different fromthe platforms like Facebook and Twitter where the users may nothave to purchase any thing. To conclude, this work is different fromother works as it deals with the Yelp social network and is focusedon finding systematic patterns of influence across different cities.Relative to the studies mentioned in this section, our study confirmsthe existence and heavy tailed nature of cascades. But by focusingon the different type of features that can help in distinguishingbetween long and short cascades we have tried to narrow downon the factors that determine the popularity or virality of cascadesgenerically across different cities.
3 DATA AND CONTEXTFor this particular study, we have been using the data provided bythe Yelp under its Dataset challenge initiative2. As our basic aim inthis research was to see the underlying patterns of social influenceacross different cities we decided to use the data both from theRound 8 and Round 9 of the challenge. The data in total consistsof around 6 million reviews and 1.5 million tips for more than amillion users and 150 thousand users across 11 different cities inthe Europe and North America. In addition, to the reviews and tipsthe dataset also contains the business attributes like hours, parkingavailability and ambiance etc. as well. Though the dataset is quite
2https://www.yelp.com/dataset_challenge/
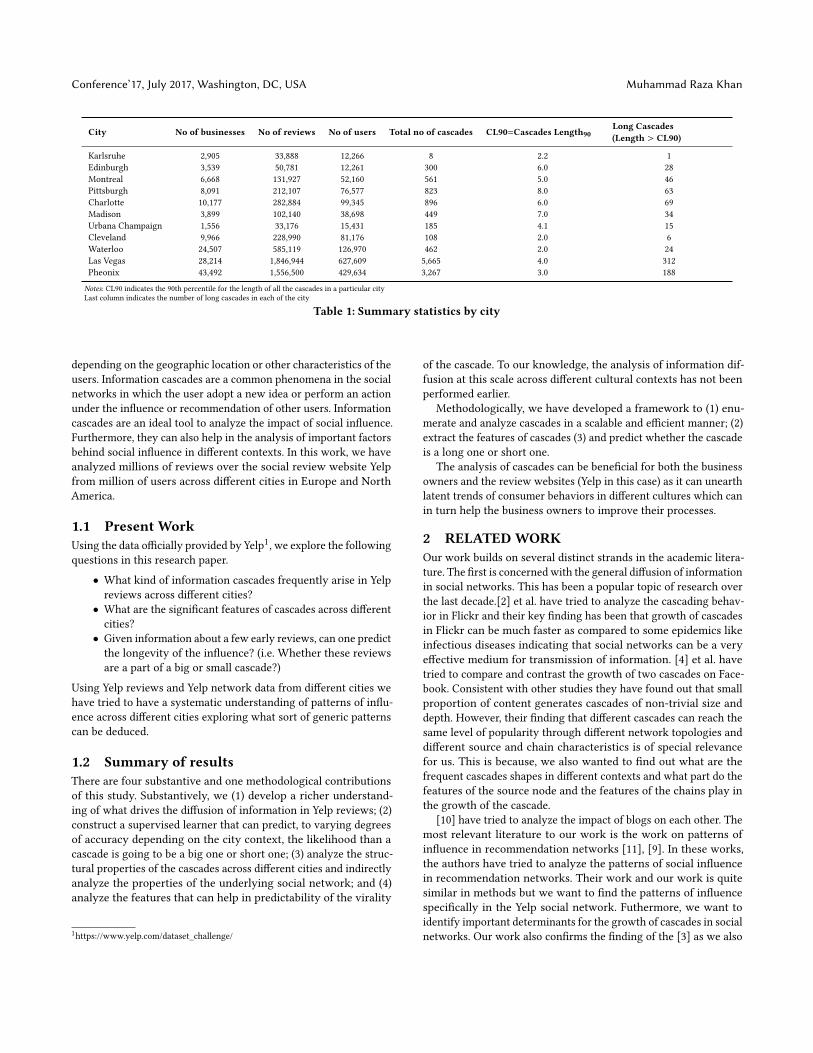
Figure 1: No of reviews and tips per year
big in total but the number of reviews is quite low in the earlieryears as shown in the Figure 1. For the purpose of this research,we have focused on cascades resulting from reviews and tips forthe year 2015, though a similar analysis can be easily done for anyother year provided sufficient data is present. Some of the summarystatistics for each of the cities in our analysis can be found in theTable 1.
To find out cascades in the data we had to find out the reviewsand tips that result in future review and tips. Though the behaviorof the person deciding to deal with a business can be influenced bymany different factors like visibility of the reviews, explicit referralfrom an acquaintance; we are adopting a more strict approach suchthat only the friends of a user can be influenced by the reviews ortips of the users. In other words, an edge (u,v) will be part of acascade for a business b if the user u writes a review or tip at timet and the user v write a review or tip at the time t ′ such that t ′ > tand v ∈ N (u), where N (u) specifies the neighboring nodes of u. Allthe edges that specify this property will constitute a cascade forthe business b.
To frame the problem, as a prediction task, we calculate thelength of each cascade for a business as the number of nodes orusers who participate in the cascade either by writing a review ortip for the business. Furthermore, we categorized the cascades aslong or short cascades as explained below
• Long Cascades: If the length of a cascade is greater than orequal to the 90th percentile of the length of all the cascades ofthe city. The 90th percentile of the lengths of all the cascadesfor a city is shown in the second last column of the table 1.
• Short Cascades: If the length of a cascade is less than the90th percentile of the length of all the cascades of the city.
As our primary interest in this work was to compare long vsshort cascades in a city, we had to eliminate Karlsruhe, Waterlooand Cleveland from our analysis as most of the cascades in thesecities were short cascades. However, given enough data our modelsand analysis can be easily extended to these cities as well.
Conference’17, July 2017, Washington, DC, USA Muhammad Raza Khan
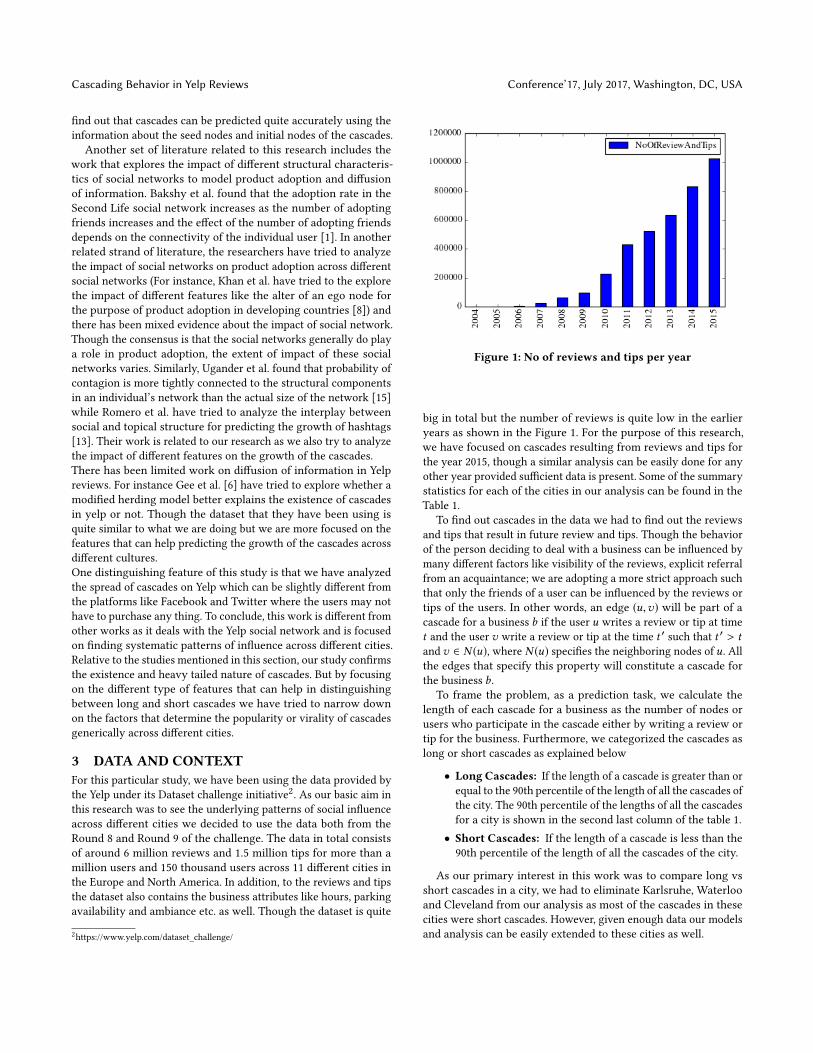
Figure 2: Distribution of cascades across cities
4 STRUCTURAL ANALYSIS OF CASCADESSize Distribution of CascadesAs the first step in our analysis, we analyze the distribution ofthe size of cascades in different cities. The distribution of size ofcascades for different cities is shown in Fig. 2. It is obvious fromthe Fig. 2 that cascades in all of the cities follow a heavy taileddistribution. Most of the cascades are small but large cascadesdo happen. Furthermore, this figure also shows that the cascadedistribution across different cities has a power-law exponent in therange −2.15 and −1.68. Las Vegas and Pheonix have the highestnumber of large cascades but large cascades do exist for other citiesas well.
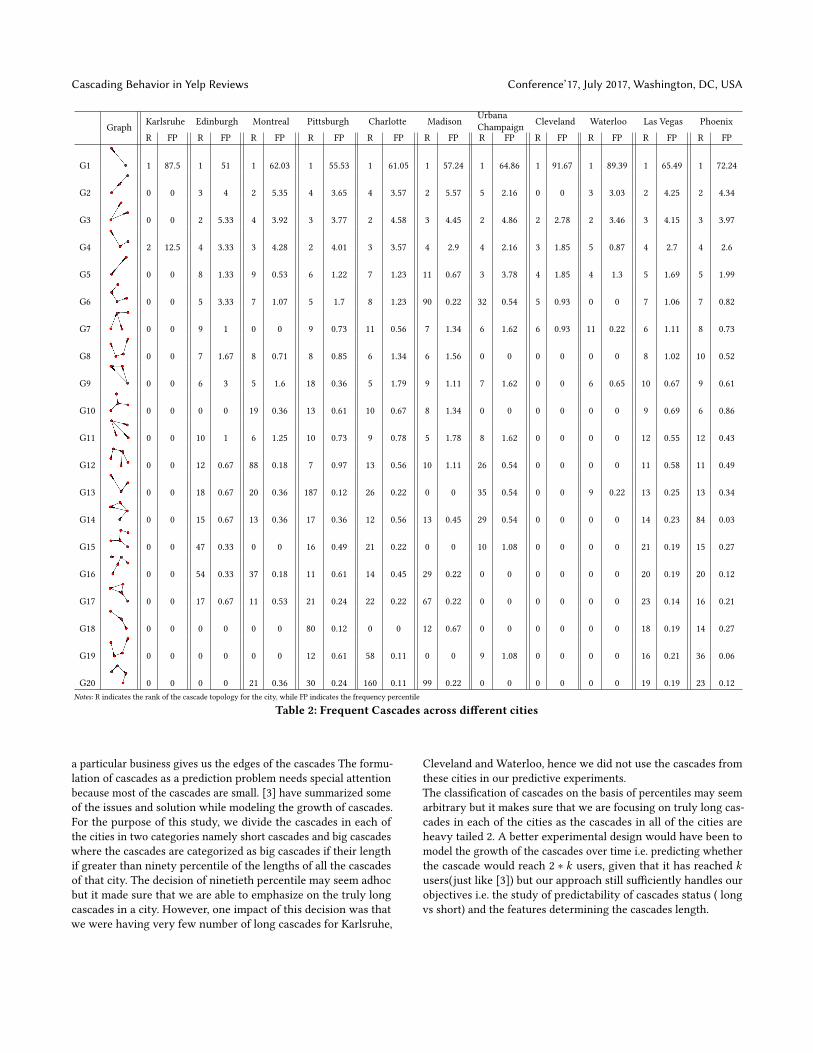
Frequent Cascade TopologiesAs the next step in the structural analysis of cascades we wantedto see that what kind of cascades frequently arise in Yelp reviewsacross different cities. As discussed in [11], no polynomial timegraph isomorphism algorithms exist and for the purpose of enu-merating graphs one has to generate an efficiently computablesignature of a graph and count the number of graphs with similarsignatures. [11] have proposed a multiple level signature for fre-quent subgraph mining. The signature used for hashing the graphsconsists of a) Number of Nodes in the graph; b) Number of edgesin the graph; c) Sorted in degree sequence of each of the node; andd) Sorted out degree sequence of each node. Using this techniquewe count the frequency of frequent cascades for each of the cities.Rank and frequency of the frequent cascade topologies for each ofthe cities is shown in the Table 2. As expected, the most commoncascade i.e. G1 as shown in the Table 2 corresponds to the casein which a person participates in a cascade under the influence ofonly one other node. This corresponds to more than fifty percent ofthe cascades across all the cities and in some cases this particulartype of cascade represents more than eighty percent of all the cas-cades of a city (e.g. Karlsruhe). Comparing G2 and G10, we can seethat receiving the recommendation or influence by more than oncechannel increases the likelihood of participation but at the same
time, G3 and G11 shows that the presence of “influential“ nodesalso makes cascades longer. The cascades like G5 occur when boththe user and the friend f either review or write tip for the samebusiness id on the same day.
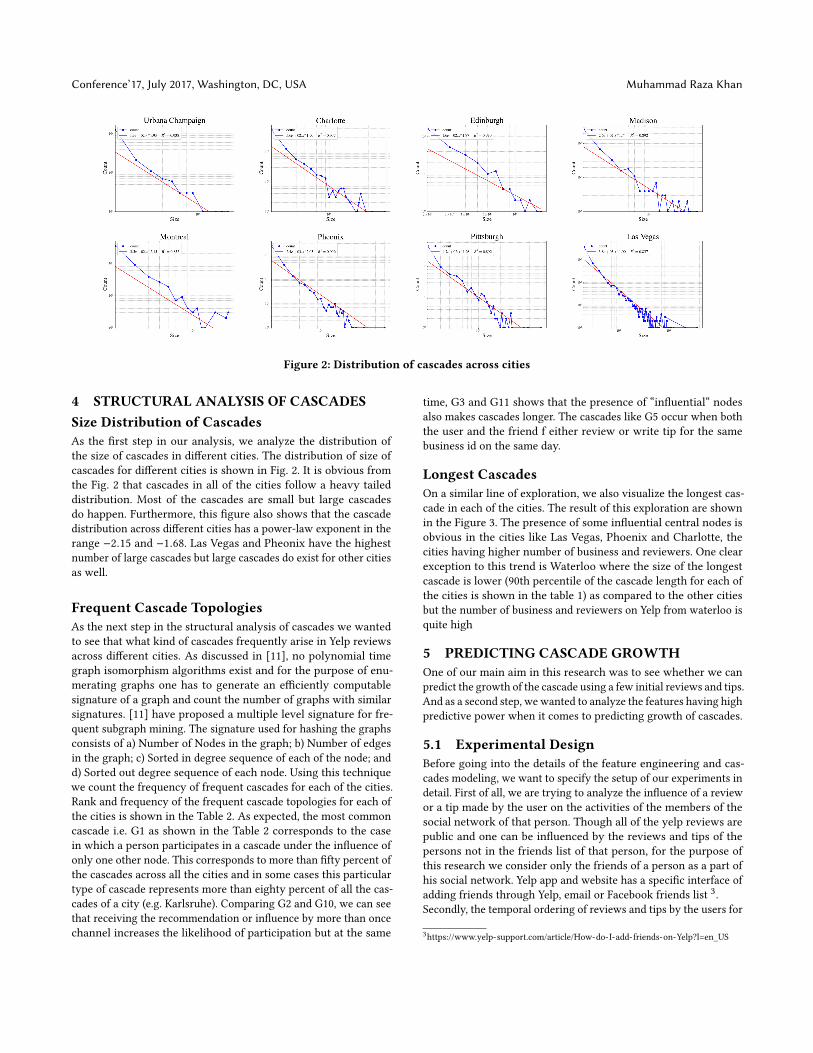
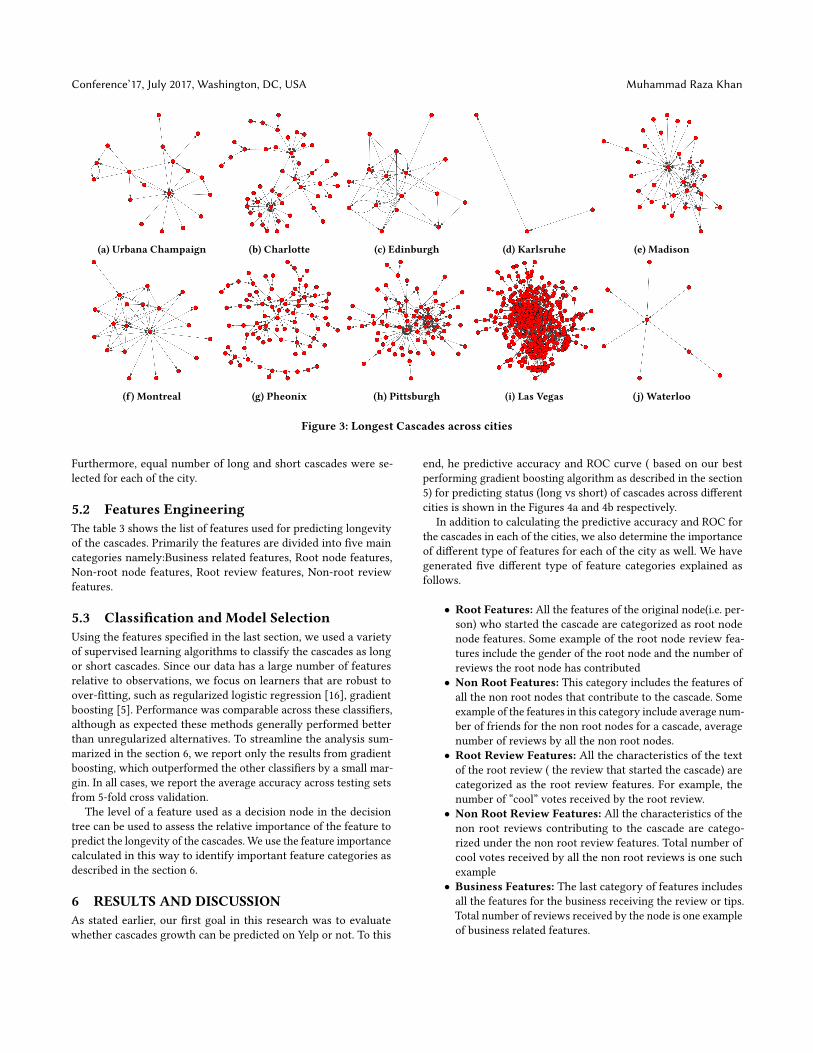
Longest CascadesOn a similar line of exploration, we also visualize the longest cas-cade in each of the cities. The result of this exploration are shownin the Figure 3. The presence of some influential central nodes isobvious in the cities like Las Vegas, Phoenix and Charlotte, thecities having higher number of business and reviewers. One clearexception to this trend is Waterloo where the size of the longestcascade is lower (90th percentile of the cascade length for each ofthe cities is shown in the table 1) as compared to the other citiesbut the number of business and reviewers on Yelp from waterloo isquite high
5 PREDICTING CASCADE GROWTHOne of our main aim in this research was to see whether we canpredict the growth of the cascade using a few initial reviews and tips.And as a second step, we wanted to analyze the features having highpredictive power when it comes to predicting growth of cascades.
5.1 Experimental DesignBefore going into the details of the feature engineering and cas-cades modeling, we want to specify the setup of our experiments indetail. First of all, we are trying to analyze the influence of a reviewor a tip made by the user on the activities of the members of thesocial network of that person. Though all of the yelp reviews arepublic and one can be influenced by the reviews and tips of thepersons not in the friends list of that person, for the purpose ofthis research we consider only the friends of a person as a part ofhis social network. Yelp app and website has a specific interface ofadding friends through Yelp, email or Facebook friends list 3.Secondly, the temporal ordering of reviews and tips by the users for
3https://www.yelp-support.com/article/How-do-I-add-friends-on-Yelp?l=en_US
Cascading Behavior in Yelp Reviews Conference’17, July 2017, Washington, DC, USA
Graph Karlsruhe Edinburgh Montreal Pittsburgh Charlotte Madison UrbanaChampaign Cleveland Waterloo Las Vegas Phoenix
R FP R FP R FP R FP R FP R FP R FP R FP R FP R FP R FP
G1 1 87.5 1 51 1 62.03 1 55.53 1 61.05 1 57.24 1 64.86 1 91.67 1 89.39 1 65.49 1 72.24
G2 0 0 3 4 2 5.35 4 3.65 4 3.57 2 5.57 5 2.16 0 0 3 3.03 2 4.25 2 4.34
G3 0 0 2 5.33 4 3.92 3 3.77 2 4.58 3 4.45 2 4.86 2 2.78 2 3.46 3 4.15 3 3.97
G4 2 12.5 4 3.33 3 4.28 2 4.01 3 3.57 4 2.9 4 2.16 3 1.85 5 0.87 4 2.7 4 2.6
G5 0 0 8 1.33 9 0.53 6 1.22 7 1.23 11 0.67 3 3.78 4 1.85 4 1.3 5 1.69 5 1.99
G6 0 0 5 3.33 7 1.07 5 1.7 8 1.23 90 0.22 32 0.54 5 0.93 0 0 7 1.06 7 0.82
G7 0 0 9 1 0 0 9 0.73 11 0.56 7 1.34 6 1.62 6 0.93 11 0.22 6 1.11 8 0.73
G8 0 0 7 1.67 8 0.71 8 0.85 6 1.34 6 1.56 0 0 0 0 0 0 8 1.02 10 0.52
G9 0 0 6 3 5 1.6 18 0.36 5 1.79 9 1.11 7 1.62 0 0 6 0.65 10 0.67 9 0.61
G10 0 0 0 0 19 0.36 13 0.61 10 0.67 8 1.34 0 0 0 0 0 0 9 0.69 6 0.86
G11 0 0 10 1 6 1.25 10 0.73 9 0.78 5 1.78 8 1.62 0 0 0 0 12 0.55 12 0.43
G12 0 0 12 0.67 88 0.18 7 0.97 13 0.56 10 1.11 26 0.54 0 0 0 0 11 0.58 11 0.49
G13 0 0 18 0.67 20 0.36 187 0.12 26 0.22 0 0 35 0.54 0 0 9 0.22 13 0.25 13 0.34
G14 0 0 15 0.67 13 0.36 17 0.36 12 0.56 13 0.45 29 0.54 0 0 0 0 14 0.23 84 0.03
G15 0 0 47 0.33 0 0 16 0.49 21 0.22 0 0 10 1.08 0 0 0 0 21 0.19 15 0.27
G16 0 0 54 0.33 37 0.18 11 0.61 14 0.45 29 0.22 0 0 0 0 0 0 20 0.19 20 0.12
G17 0 0 17 0.67 11 0.53 21 0.24 22 0.22 67 0.22 0 0 0 0 0 0 23 0.14 16 0.21
G18 0 0 0 0 0 0 80 0.12 0 0 12 0.67 0 0 0 0 0 0 18 0.19 14 0.27
G19 0 0 0 0 0 0 12 0.61 58 0.11 0 0 9 1.08 0 0 0 0 16 0.21 36 0.06
G20 0 0 0 0 21 0.36 30 0.24 160 0.11 99 0.22 0 0 0 0 0 0 19 0.19 23 0.12Notes: R indicates the rank of the cascade topology for the city, while FP indicates the frequency percentile
Table 2: Frequent Cascades across different cities
a particular business gives us the edges of the cascades The formu-lation of cascades as a prediction problem needs special attentionbecause most of the cascades are small. [3] have summarized someof the issues and solution while modeling the growth of cascades.For the purpose of this study, we divide the cascades in each ofthe cities in two categories namely short cascades and big cascadeswhere the cascades are categorized as big cascades if their lengthif greater than ninety percentile of the lengths of all the cascadesof that city. The decision of ninetieth percentile may seem adhocbut it made sure that we are able to emphasize on the truly longcascades in a city. However, one impact of this decision was thatwe were having very few number of long cascades for Karlsruhe,
Cleveland and Waterloo, hence we did not use the cascades fromthese cities in our predictive experiments.The classification of cascades on the basis of percentiles may seemarbitrary but it makes sure that we are focusing on truly long cas-cades in each of the cities as the cascades in all of the cities areheavy tailed 2. A better experimental design would have been tomodel the growth of the cascades over time i.e. predicting whetherthe cascade would reach 2 ∗ k users, given that it has reached kusers(just like [3]) but our approach still sufficiently handles ourobjectives i.e. the study of predictability of cascades status ( longvs short) and the features determining the cascades length.
Conference’17, July 2017, Washington, DC, USA Muhammad Raza Khan
(a) Urbana Champaign (b) Charlotte (c) Edinburgh (d) Karlsruhe (e) Madison
(f) Montreal (g) Pheonix (h) Pittsburgh (i) Las Vegas (j) Waterloo
Figure 3: Longest Cascades across cities
Furthermore, equal number of long and short cascades were se-lected for each of the city.
5.2 Features EngineeringThe table 3 shows the list of features used for predicting longevityof the cascades. Primarily the features are divided into five maincategories namely:Business related features, Root node features,Non-root node features, Root review features, Non-root reviewfeatures.
5.3 Classification and Model SelectionUsing the features specified in the last section, we used a varietyof supervised learning algorithms to classify the cascades as longor short cascades. Since our data has a large number of featuresrelative to observations, we focus on learners that are robust toover-fitting, such as regularized logistic regression [16], gradientboosting [5]. Performance was comparable across these classifiers,although as expected these methods generally performed betterthan unregularized alternatives. To streamline the analysis sum-marized in the section 6, we report only the results from gradientboosting, which outperformed the other classifiers by a small mar-gin. In all cases, we report the average accuracy across testing setsfrom 5-fold cross validation.
The level of a feature used as a decision node in the decisiontree can be used to assess the relative importance of the feature topredict the longevity of the cascades. We use the feature importancecalculated in this way to identify important feature categories asdescribed in the section 6.
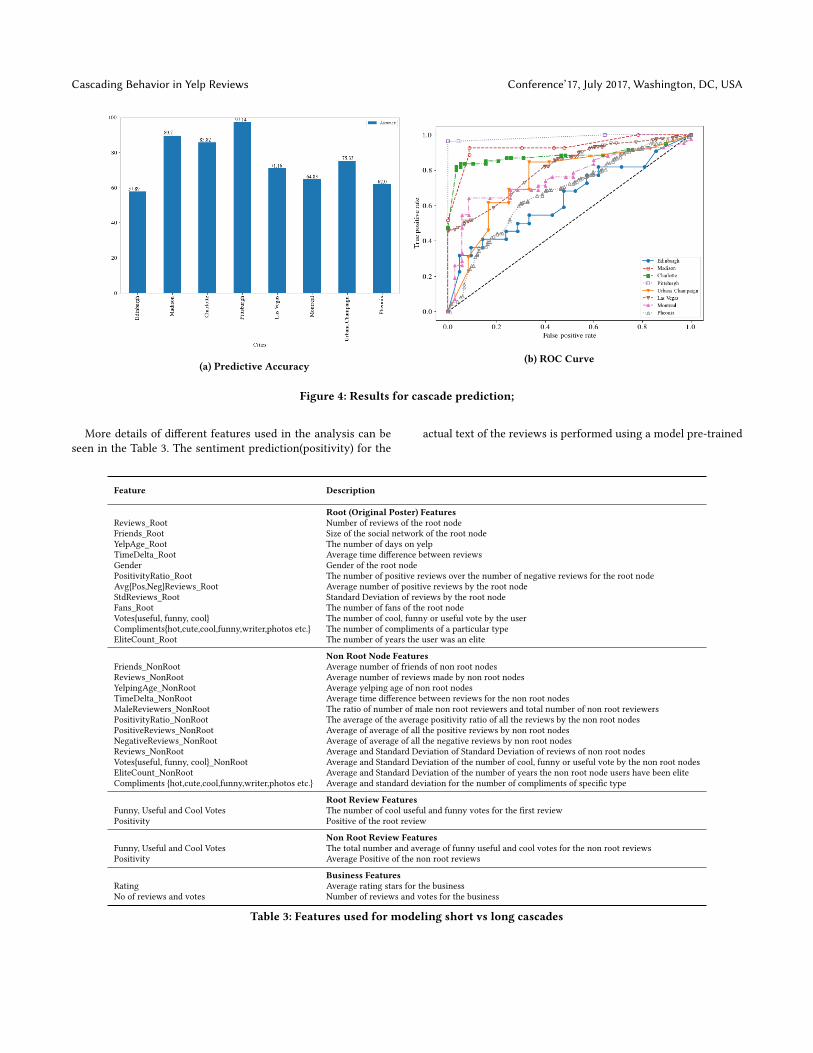
6 RESULTS AND DISCUSSIONAs stated earlier, our first goal in this research was to evaluatewhether cascades growth can be predicted on Yelp or not. To this
end, he predictive accuracy and ROC curve ( based on our bestperforming gradient boosting algorithm as described in the section5) for predicting status (long vs short) of cascades across differentcities is shown in the Figures 4a and 4b respectively.
In addition to calculating the predictive accuracy and ROC forthe cascades in each of the cities, we also determine the importanceof different type of features for each of the city as well. We havegenerated five different type of feature categories explained asfollows.
• Root Features: All the features of the original node(i.e. per-son) who started the cascade are categorized as root nodenode features. Some example of the root node review fea-tures include the gender of the root node and the number ofreviews the root node has contributed
• Non Root Features: This category includes the features ofall the non root nodes that contribute to the cascade. Someexample of the features in this category include average num-ber of friends for the non root nodes for a cascade, averagenumber of reviews by all the non root nodes.
• Root Review Features: All the characteristics of the textof the root review ( the review that started the cascade) arecategorized as the root review features. For example, thenumber of “cool” votes received by the root review.
• Non Root Review Features: All the characteristics of thenon root reviews contributing to the cascade are catego-rized under the non root review features. Total number ofcool votes received by all the non root reviews is one suchexample
• Business Features: The last category of features includesall the features for the business receiving the review or tips.Total number of reviews received by the node is one exampleof business related features.
Cascading Behavior in Yelp Reviews Conference’17, July 2017, Washington, DC, USA
(a) Predictive Accuracy(b) ROC Curve
Figure 4: Results for cascade prediction;
More details of different features used in the analysis can beseen in the Table 3. The sentiment prediction(positivity) for the
actual text of the reviews is performed using a model pre-trained
Feature Description
Root (Original Poster) FeaturesReviews_Root Number of reviews of the root nodeFriends_Root Size of the social network of the root nodeYelpAge_Root The number of days on yelpTimeDelta_Root Average time difference between reviewsGender Gender of the root nodePositivityRatio_Root The number of positive reviews over the number of negative reviews for the root nodeAvg{Pos,Neg}Reviews_Root Average number of positive reviews by the root nodeStdReviews_Root Standard Deviation of reviews by the root nodeFans_Root The number of fans of the root nodeVotes{useful, funny, cool} The number of cool, funny or useful vote by the userCompliments{hot,cute,cool,funny,writer,photos etc.} The number of compliments of a particular typeEliteCount_Root The number of years the user was an elite
Non Root Node FeaturesFriends_NonRoot Average number of friends of non root nodesReviews_NonRoot Average number of reviews made by non root nodesYelpingAge_NonRoot Average yelping age of non root nodesTimeDelta_NonRoot Average time difference between reviews for the non root nodesMaleReviewers_NonRoot The ratio of number of male non root reviewers and total number of non root reviewersPositivityRatio_NonRoot The average of the average positivity ratio of all the reviews by the non root nodesPositiveReviews_NonRoot Average of average of all the positive reviews by non root nodesNegativeReviews_NonRoot Average of average of all the negative reviews by non root nodesReviews_NonRoot Average and Standard Deviation of Standard Deviation of reviews of non root nodesVotes{useful, funny, cool}_NonRoot Average and Standard Deviation of the number of cool, funny or useful vote by the non root nodesEliteCount_NonRoot Average and Standard Deviation of the number of years the non root node users have been eliteCompliments {hot,cute,cool,funny,writer,photos etc.} Average and standard deviation for the number of compliments of specific type
Root Review FeaturesFunny, Useful and Cool Votes The number of cool useful and funny votes for the first reviewPositivity Positive of the root review
Non Root Review FeaturesFunny, Useful and Cool Votes The total number and average of funny useful and cool votes for the non root reviewsPositivity Average Positive of the non root reviews
Business FeaturesRating Average rating stars for the businessNo of reviews and votes Number of reviews and votes for the business
Table 3: Features used for modeling short vs long cascades
Conference’17, July 2017, Washington, DC, USA Muhammad Raza Khan
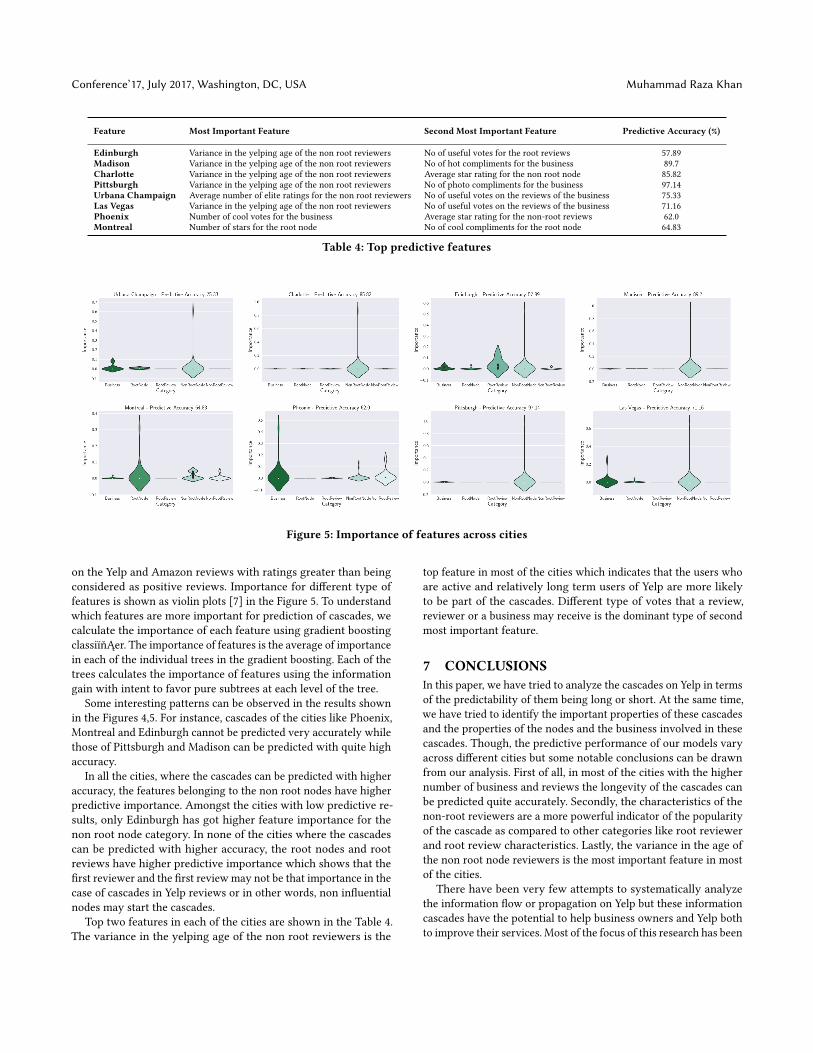
Feature Most Important Feature Second Most Important Feature Predictive Accuracy (%)
Edinburgh Variance in the yelping age of the non root reviewers No of useful votes for the root reviews 57.89Madison Variance in the yelping age of the non root reviewers No of hot compliments for the business 89.7Charlotte Variance in the yelping age of the non root reviewers Average star rating for the non root node 85.82Pittsburgh Variance in the yelping age of the non root reviewers No of photo compliments for the business 97.14Urbana Champaign Average number of elite ratings for the non root reviewers No of useful votes on the reviews of the business 75.33Las Vegas Variance in the yelping age of the non root reviewers No of useful votes on the reviews of the business 71.16Phoenix Number of cool votes for the business Average star rating for the non-root reviews 62.0Montreal Number of stars for the root node No of cool compliments for the root node 64.83
Table 4: Top predictive features
Figure 5: Importance of features across cities
on the Yelp and Amazon reviews with ratings greater than beingconsidered as positive reviews. Importance for different type offeatures is shown as violin plots [7] in the Figure 5. To understandwhich features are more important for prediction of cascades, wecalculate the importance of each feature using gradient boostingclassiïňĄer. The importance of features is the average of importancein each of the individual trees in the gradient boosting. Each of thetrees calculates the importance of features using the informationgain with intent to favor pure subtrees at each level of the tree.
Some interesting patterns can be observed in the results shownin the Figures 4,5. For instance, cascades of the cities like Phoenix,Montreal and Edinburgh cannot be predicted very accurately whilethose of Pittsburgh and Madison can be predicted with quite highaccuracy.
In all the cities, where the cascades can be predicted with higheraccuracy, the features belonging to the non root nodes have higherpredictive importance. Amongst the cities with low predictive re-sults, only Edinburgh has got higher feature importance for thenon root node category. In none of the cities where the cascadescan be predicted with higher accuracy, the root nodes and rootreviews have higher predictive importance which shows that thefirst reviewer and the first review may not be that importance in thecase of cascades in Yelp reviews or in other words, non influentialnodes may start the cascades.
Top two features in each of the cities are shown in the Table 4.The variance in the yelping age of the non root reviewers is the
top feature in most of the cities which indicates that the users whoare active and relatively long term users of Yelp are more likelyto be part of the cascades. Different type of votes that a review,reviewer or a business may receive is the dominant type of secondmost important feature.
7 CONCLUSIONSIn this paper, we have tried to analyze the cascades on Yelp in termsof the predictability of them being long or short. At the same time,we have tried to identify the important properties of these cascadesand the properties of the nodes and the business involved in thesecascades. Though, the predictive performance of our models varyacross different cities but some notable conclusions can be drawnfrom our analysis. First of all, in most of the cities with the highernumber of business and reviews the longevity of the cascades canbe predicted quite accurately. Secondly, the characteristics of thenon-root reviewers are a more powerful indicator of the popularityof the cascade as compared to other categories like root reviewerand root review characteristics. Lastly, the variance in the age ofthe non root node reviewers is the most important feature in mostof the cities.
There have been very few attempts to systematically analyzethe information flow or propagation on Yelp but these informationcascades have the potential to help business owners and Yelp bothto improve their services. Most of the focus of this research has been
Cascading Behavior in Yelp Reviews Conference’17, July 2017, Washington, DC, USA
to identify the structural and nonstructural features of the cascadeson Yelp and see the relationship between these features and lengthof the cascades. In future, we want to incorporate additional datasources like pictures and images of the businesses in our analysis.We also want to experiment with the recent deep learning basedmethods (e.g. [12]) to model the growth of cascades.
Right now, we are not imposing any time bound on the edgesof the cascades which may imply that the successive edges in acascade may be months apart. In our future work, we want to applyadditional constraint of time bound on the successive edges in acascade. Though our focus in this work has been on the cascadesin Yelp social networks but a similar analysis can be extended toother types of social network provided significant data is available.
REFERENCES[1] Eytan Bakshy, Brian Karrer, and Lada A. Adamic. 2009. Social Influence and the
Diffusion of User-created Content. In Proceedings of the 10th ACM Conferenceon Electronic Commerce (EC ’09). ACM, New York, NY, USA, 325–334. https://doi.org/10.1145/1566374.1566421
[2] Meeyoung Cha, Alan Mislove, Ben Adams, and Krishna P Gummadi. 2008. Char-acterizing social cascades in flickr. In Proceedings of the first workshop on Onlinesocial networks. ACM, 13–18.
[3] Justin Cheng, Lada Adamic, P Alex Dow, Jon Michael Kleinberg, and JureLeskovec. 2014. Can cascades be predicted?. In Proceedings of the 23rd inter-national conference on World wide web. ACM, 925–936.
[4] P Alex Dow, Lada A Adamic, and Adrien Friggeri. 2013. The Anatomy of LargeFacebook Cascades. In Seventh International AAAI Conference on Weblogs andSocial Media.
[5] Jerome H Friedman. 2001. Greedy function approximation: a gradient boostingmachine. Annals of statistics (2001), 1189–1232.
[6] Grace Gee, Chris Lengerich, and E ONeill. 2011. Identifying Cascades in YelpReviews. Technical Report. Tech. rep., Stanford University.
[7] Jerry L Hintze and Ray D Nelson. 1998. Violin plots: a box plot-density tracesynergism. The American Statistician 52, 2 (1998), 181–184.
[8] Muhammad R. Khan and Joshua E. Blumenstock. 2016. Predictors Without Bor-ders: Behavioral Modeling of Product Adoption in Three Developing Countries.In Proceedings of the 22nd ACM SIGKDD International Conference on Knowl-edge Discovery and Data Mining (KDD ’16). ACM, New York, NY, USA, 145–154.https://doi.org/10.1145/2939672.2939710
[9] Jure Leskovec, Lada A Adamic, and Bernardo A Huberman. 2007. The dynamicsof viral marketing. ACM Transactions on the Web (TWEB) 1, 1 (2007), 5.
[10] Jure Leskovec, Mary McGlohon, Christos Faloutsos, Natalie Glance, and MatthewHurst. 2007. Patterns of cascading behavior in large blog graphs. In Proceedingsof the 2007 SIAM international conference on data mining. SIAM, 551–556.
[11] Jure Leskovec, Ajit Singh, and Jon Kleinberg. 2006. Patterns of influence in arecommendation network. In Pacific-Asia Conference on Knowledge Discovery andData Mining. Springer, 380–389.
[12] Cheng Li, Jiaqi Ma, Xiaoxiao Guo, and Qiaozhu Mei. 2017. DeepCas: an End-to-end Predictor of Information Cascades. In Proceedings of the 26th InternationalConference on World Wide Web. International World Wide Web ConferencesSteering Committee, 577–586.
[13] Daniel M Romero, Chenhao Tan, and Johan Ugander. 2013. On the Interplaybetween Social and Topical Structure. In Seventh International AAAI Conferenceon Weblogs and Social Media.
[14] Mani R. Subramani and Balaji Rajagopalan. 2003. Knowledge-sharing and Influ-ence in Online Social Networks via Viral Marketing. Commun. ACM 46, 12 (Dec.2003), 300–307. https://doi.org/10.1145/953460.953514
[15] Johan Ugander, Lars Backstrom, Cameron Marlow, and Jon Kleinberg. 2012.Structural diversity in social contagion. Proceedings of the National Academy ofSciences 109, 16 (2012), 5962–5966.
[16] Hui Zou and Trevor Hastie. 2005. Regularization and variable selection via theelastic net. Journal of the Royal Statistical Society: Series B (Statistical Methodology)67, 2 (2005), 301–320.