Cartography 101 The Basics of Maps, Map Making and Location.
15
Cartography 101 The Basics of Maps, Map Making and Location
-
Upload
barrie-wilkins -
Category
Documents
-
view
234 -
download
2
Transcript of Cartography 101 The Basics of Maps, Map Making and Location.
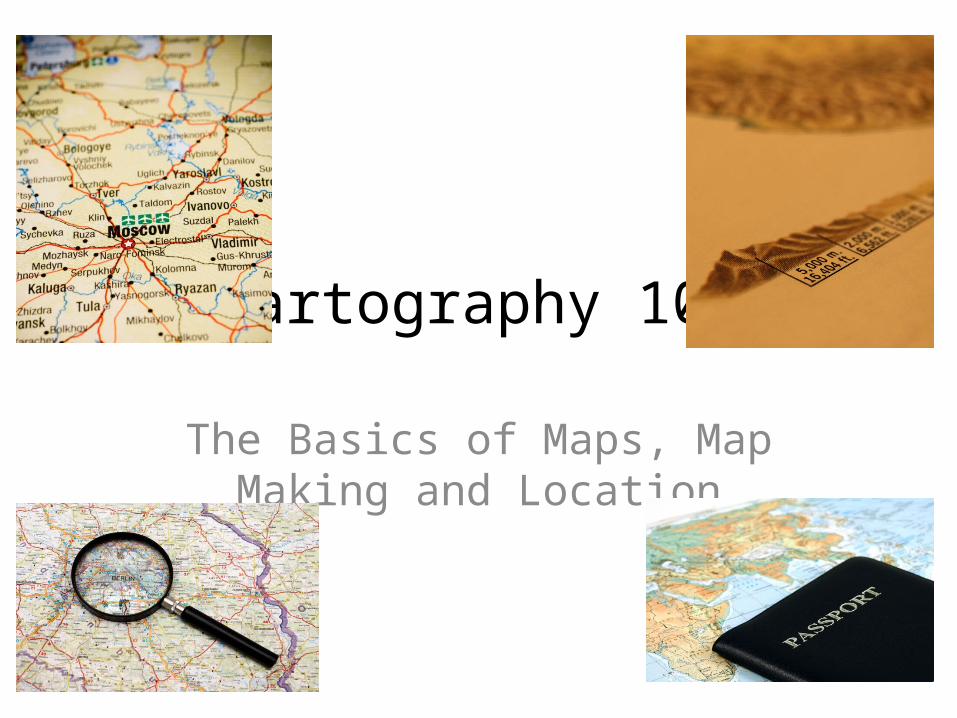
Cartography 101
The Basics of Maps, Map Making and Location

Map BasicsAll quality maps have the following Basic Traits:• Title: gives the map purpose and thematic focus• Compass: gives cardinal directions & orientation• Key/Legend: decodes symbols or defines colors used • Scale: converts size on map to distances in real life
– 3 Types of Scales• Graphic Scale (drawn)• Written Scale ex: 1 inch = 5 miles• Representative Scale (RF) ex: 1:9,778,000
– To convert into “Inches in a Mile” – 1st divide # by 5280 (feet/mile)– 2nd divide the answer by 12 (inches/foot) = How many miles in an inch.

Reading Maps – which map has is large scale and which is small?

In the picture above, color is being used to show what?
Find a map in your atlas that uses color differently…How it is used?
Color & ShadingGives meaning to colors used:
population enviro-regions
bordersprecipitation
**gradients**
Map Projections
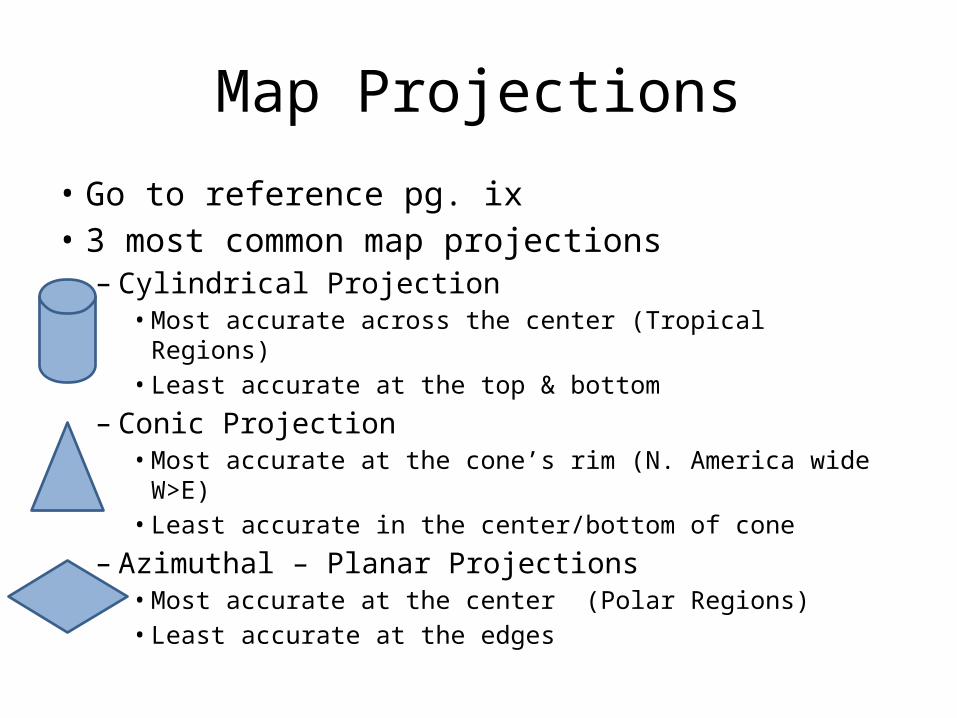
• Go to reference pg. ix• 3 most common map projections
– Cylindrical Projection• Most accurate across the center (Tropical Regions)• Least accurate at the top & bottom
– Conic Projection • Most accurate at the cone’s rim (N. America wide W>E)• Least accurate in the center/bottom of cone
– Azimuthal – Planar Projections• Most accurate at the center (Polar Regions)• Least accurate at the edges

Relative LocationRelative: Where a place is located in relation to another known place
Which could be a….• Nation, landmark or physical feature (water or land)
Make sure that….• Your chosen features are close to the actual location

Examples:
• Monarch High School is located to the North of 36, South of Dillon Rd and Southeast of Harper Lake
• Japan is located to the East of China but South of Sea Okhotsk
• Provide a relative description of your house using three relative landmark mix’em up!
(physical feature, well known building, street)

Provide a relative location for….

Absolute Location
• Absolute: The exact latitude and longitude coordinates of a place
• Divided into degrees first and minutes second
Example: Louisville, CO – 39° 58’N, 105° 08’W

Latitude Latitude... is measured North and South of the Equator lines run East - West on the globe/map lines are parallel to one another (never intersect) Lines are NOT equal in length
Biggest @ Equator & Smallest @ N/S Poles There are 90 latitude lines in each hemisphere
180 Total lines
Important Lines of Latitude0° = Equator90°N = North Pole90°S = South Pole23.5°N = Tropic of Cancer23.5°S = Tropic of Capricorn66.5°N = Arctic Circle66.5°S = Antarctic Circle

LongitudeLongitude... is measured East and West of the Prime Meridian lines run North - South on the globe/map lines are equidistant to one another (intersect @ the Poles) Lines are equal in length (all = to Equator length) There are 180 longitude lines in each hemisphere
360 Total lines
Important Lines of Longitude0° = Prime Meridian – Greenwich Meridian180° = International Date Line - Is not an exact Meridian because it jogs around countries -When you cross it you change the date
Youtube review! http://
www.youtube.com/watch?v=swKBi6hHHMA&safety_mode=true&persist_safety_mode=1&safe=active

PracticeWhat is at....?23° N, 72° E =58° N, 30° E =4° S, 105° E =30° N, 81° W =25° S, 57° W =69° N, 30° W =
Ahmadabad, IndiaSt. Petersburg, RussiaPalembang, IndonesiaJacksonville, FloridaAsuncion, ParaguayMt. Gunnbjorn, Greenland
Google Earth – Miracle?47.110579, 9.227568

TopographyTopography – topo – “place" + graphia - "writing" a place’s signature or mark
• The variation of the earth’s surface showing natural features such as rivers, canyons, lakes, and most importantly, variations in ground elevations. Relief and terrain
• Shows the contour of the land from plains and rolling hills to steep canyons and mountains– Lines are plotted in intervals of elevation change
ex: 250ft, 500ft or 1,000ft• Lines that are close together represent rapid or steep vertical change
ex: steep canyons walls or cliffs• Wide spaces between lines represent gradual or slow vertical change
ex: rolling hills, plains, valley floors, beaches
• Students should be able to look at two locations and draw a vertical profile of the journey traveled
• Topo your knuckles or simulate a false mountain
http://www.youtube.com/watch?v=DQPEIjhBdII&safety_mode=true&persist_safety_mode=1&safe=active

Topographic Maps USE:
• Color to show elevation
• Shaded relief• Contour lines to
location of similar elevation

Physical Maps Include* Major Landforms
-Mnt. ranges, peninsulas, etc.-Escarpments, depressions
* Major Biomes/ Environ Regions-Jungles, deserts, plains-Altiplano, steppe, llanos
* Major Water Features-Bays, oceans, seas, straits-Rivers, lakes, reservoirs-Waterfalls, rapids
* Elevation & Topography-Shows relief of land-Provides elevation examples
Political Maps Include* Political Boundaries
-International Borders-State, province, territory-Disputed borders
* Major Cities & Towns-Medium and Large-Relative to population size- ● ◦ ·-Capital city
* Infrastructure & Development-Roads, Interstate highway - Major railways, pipelines- Urban Centers -City & suburbs-Large developed areas
Physical vs. Political Maps