Cartilage Development and Maturation In Vitro and In Vivo
145
Cartilage Development and Maturation In Vitro and In Vivo Johnathan Ng Submitted in partial fulfillment of the requirements for the degree of Doctor of Philosophy in the Graduate School of Arts and Sciences Columbia University 2017
Transcript of Cartilage Development and Maturation In Vitro and In Vivo

Cartilage Development and Maturation In Vitro and In Vivo
Johnathan Ng
Submitted in partial fulfillment of
the requirements for the degree of
Doctor of Philosophy
in the Graduate School of Arts and Sciences
Columbia University
2017

© 2017
Johnathan Ng
All rights reserved

Abstract
Cartilage Development and Maturation In Vitro and In Vivo
Johnathan Ng
The articular cartilage has a limited capacity to regenerate. Cartilage lesions often
result in degeneration, leading to osteoarthritis. Current treatments are mostly palliative
and reparative, and fail to restore cartilage function in the long term due to the
replacement of hyaline cartilage with fibrocartilage. Although a stem-cell based approach
towards regenerating the articular cartilage is attractive, cartilage generated from human
mesenchymal stem cells (hMSCs) often lack the function, organization and stability of
the native cartilage. Thus, there is a need to develop effective methods to engineer
physiologic cartilage tissues from hMSCs in vitro and assess their outcomes in vivo.
This dissertation focused on three coordinated aims: establish a simple in vivo
model for studying the maturation of osteochondral tissues by showing that subcutaneous
implantation in a mouse recapitulates native endochondral ossification (Aim 1), (ii)
develop a robust method for engineering physiologic cartilage discs from self-assembling
hMSCs (Aim 2), and (iii) improve the organization and stability of cartilage discs by
implementing spatiotemporal control during induction in vitro (Aim 3).
First, the usefulness of subcutaneous implantation in mice for studying the
development and maintenance of osteochondral tissues in vivo was determined. By
studying juvenile bovine osteochondral tissues, similarities in the profiles of
endochondral ossification between the native and ectopic processes were observed. Next,
the effects of extracellular matrix (ECM) coating and culture regimen on cartilage
formation from self-assembling hMSCs were investigated. Membrane ECM coating and
seeding density were important determinants of cartilage disc formation. Cartilage discs
were functional and stratified, resembling the native articular cartilage. Comparing
cartilage discs and pellets, compositional and organizational differences were identified
in vitro and in vivo. Prolonged chondrogenic induction in vitro did not prevent, but
expedited endochondral ossification of the discs in vivo. Finally, spatiotemporal
regulation during induction of self-assembling hMSCs promoted the formation of
functional, organized and stable hyaline cartilage discs. Selective induction regimens in
dual compartment culture enabled the maintenance of hyaline cartilage and potentiated
deep zone mineralization. Cartilage grown under spatiotemporal regulation retained zonal
organization without loss of cartilage markers expression in vivo. Instead, cartilage discs
grown under isotropic induction underwent extensive endochondral ossification.
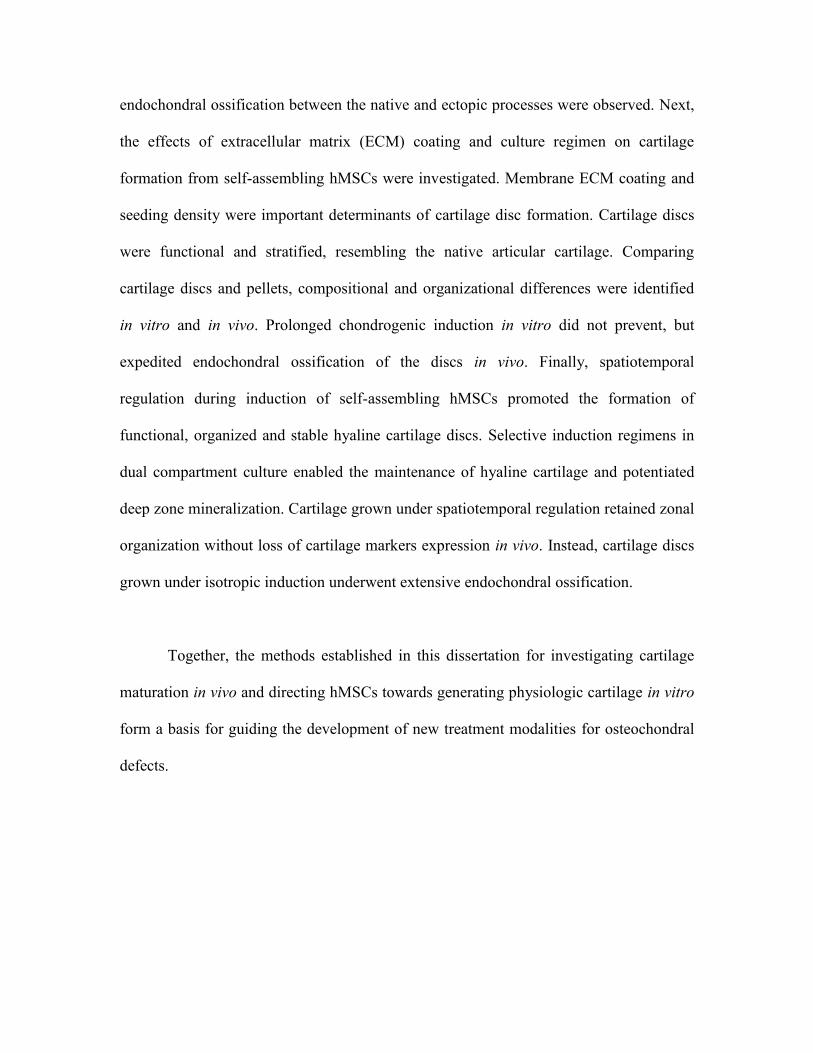
Together, the methods established in this dissertation for investigating cartilage
maturation in vivo and directing hMSCs towards generating physiologic cartilage in vitro
form a basis for guiding the development of new treatment modalities for osteochondral
defects.

i
Table of Contents
List of Tables and Figures ............................................................................................... iv
Acknowledgments ......................................................................................................... xiv
Chapter 1: Background ................................................................................................... 1
1.1 Cartilage Development .............................................................................................. 1
1.2 Clinical Problem ........................................................................................................ 4
1.3 Cartilage Tissue Engineering and Its Challenges ...................................................... 6
Chapter 2: Goals, Rationale and Approach ................................................................. 12
2.1 Goals ........................................................................................................................ 12
2.2 Hypothesis ............................................................................................................... 13
2.3 Overall Approach and Specific Aims ...................................................................... 13
Aim 1: Investigate subcutaneous implantation in mice as an ectopic model for
studying osteochondral tissues in vivo .................................................................. 14
Aim 2: Develop a robust self-assembly method for making cartilage discs from
hMSCs and evaluate the in vitro and in vivo outcomes ........................................ 15
Aim 3: Improve the organization and stability of cartilage discs by implementing
spatiotemporal regulation during induction .......................................................... 16

ii
Chapter 3: Subcutaneous implantation in mice as an ectopic model for studying
osteochondral tissues in vivo .......................................................................................... 17
3.1 Abstract .................................................................................................................... 17
3.2 Introduction ............................................................................................................. 18
3.3 Methods ................................................................................................................... 20
3.4 Results ..................................................................................................................... 26
3.5 Discussion ................................................................................................................ 39
3.6 Conclusion ............................................................................................................... 45
3.7 Future Work ............................................................................................................. 47
Chapter 4: Evaluation of cartilage discs grown from self-assembling hMSCs in vitro
and in vivo ........................................................................................................................ 48
4.1 Abstract .................................................................................................................... 48
4.2 Introduction ............................................................................................................. 49
4.3 Methods ................................................................................................................... 51
4.4 Results ..................................................................................................................... 58
4.5 Discussion ................................................................................................................ 68
4.6 Conclusion ............................................................................................................... 74
4.7 Future Work ............................................................................................................. 75

iii
Chapter 5: Spatiotemporal regulation promotes organization and in vivo stability of
cartilage grown from hMSCs ......................................................................................... 76
5.1 Abstract .................................................................................................................... 76
5.2 Introduction ............................................................................................................. 77
5.3 Methods ................................................................................................................... 79
5.4 Results ..................................................................................................................... 85
5.5 Discussion .............................................................................................................. 102
5.6 Summary ................................................................................................................ 106
5.7 Future Work ........................................................................................................... 107
References ..................................................................................................................... 108
iv
List of Tables and Figures
List of Tables
Table 4-1. Summary of studies on disc culture of self-assembling chondrocytes or
MSCs for in vitro cartilage formation. In some cases, MSCs failed to form discs. ...... 50
Table 4-2. List of primers used for qPCR ..................................................................... 57
Table 4-3. Comparison of the frequency of successful disc formation in different
experimental groups. Col1 coating enabled the highest yield of disc formation, but this
effect was abolished at high seeding density (1.5×10⁶ per well)................................... 63
Table 5-1. List of primers used for qPCR ..................................................................... 82
List of Figures
Figure 1-1. A summary of major genes associated with the stages of mesenchymal
condensation during cartilage development: Initiate, Set Boundary, Proliferate, Adhere,
Grow, and Differentiate. TGF-β mediates condensation, driving the expression of Sox-
9 during early chondrogenesis. BMPs mediate overt chondroblast differentiation and is
regulated by Noggin for joint formation between skeletal elements. Adapted from Hall
et al [1]. ............................................................................................................................ 2
Figure 1-2. Schematic diagram of joint formation. Interzone appears and forms within
an uninterrupted condensed mesenchymal structure, and cavitation within the interzone
gives rise to the joint capsule. Adapted from Pacifici et al [2]. ....................................... 2
Figure 1-3. Histology of a developing (a) and a mature articular cartilage (b) of the
tibial plateau in 2-weeks (a) and 3-months (b) old mice. (a) The developing articular
cartilage is characterized by zones with morphologically distinct chondrocytes: resting,
proliferating, pre-hypertrophic, and hypertrophic. (b) The mature articular cartilage has
a calcified interface layer bridging the subchondral bone to the cartilage comprising
superficial, transition and radial layers. Adapted from Iwamoto et al [3]. ...................... 3
Figure 1-4. Treatment algorithm for cartilage lesions. MFX: Microfracture, OATS:
Osteochondral autograph transfer, OCA: Osteochondral allografting. ACI: Autologous
chondrocyte implantation. Adapted from Cole et al. ....................................................... 5
Figure 1-5. Schematics of NeoCart production and implantation. Adapted from
Crawford et al [21]. ......................................................................................................... 6

v
Figure 1-6. Self-assembling MSCs in chondrogenic culture form cartilage layers in
osteochondral constructs. (A) MSCs differentiated in membrane culture form stratified
cartilage on CPP scaffold. (B) MSCs differentiated in pellet culture and fused to form
stratified cartilage on decellularized bone. Adapted from Lee et al and Bhumiratana et
al. ..................................................................................................................................... 9
Figure 1-7. Histology of implanted cartilage tissues formed from chondrocytes (top
row) and BMSCs (bottom row). Stains for proteoglycans (Alcian blue) (A and F),
calcium (alizarin red/fast green) (B and G), type II collagen (C and H), type X collagen
(D and I), and type I collagen (E and J) are shown. Cartilage tissues formed from
chondrocytes do not undergo endochondral ossification. In contrast, cartilage tissues
formed form BMSCs undergo endochondral ossification. Adapted from Pelttari et al
[42]................................................................................................................................. 10
Figure 3-1. Experimental design. 4mm diameter cylindrical cores were harvested from
juvenile (2 month old) bovine femoral condyles and sectioned in the axial direction into
1mm slices. One slice from each core was fixed for analysis and one slice was
implanted subcutaneously in immunocompromised mouse for 4 weeks or 10 weeks. . 21
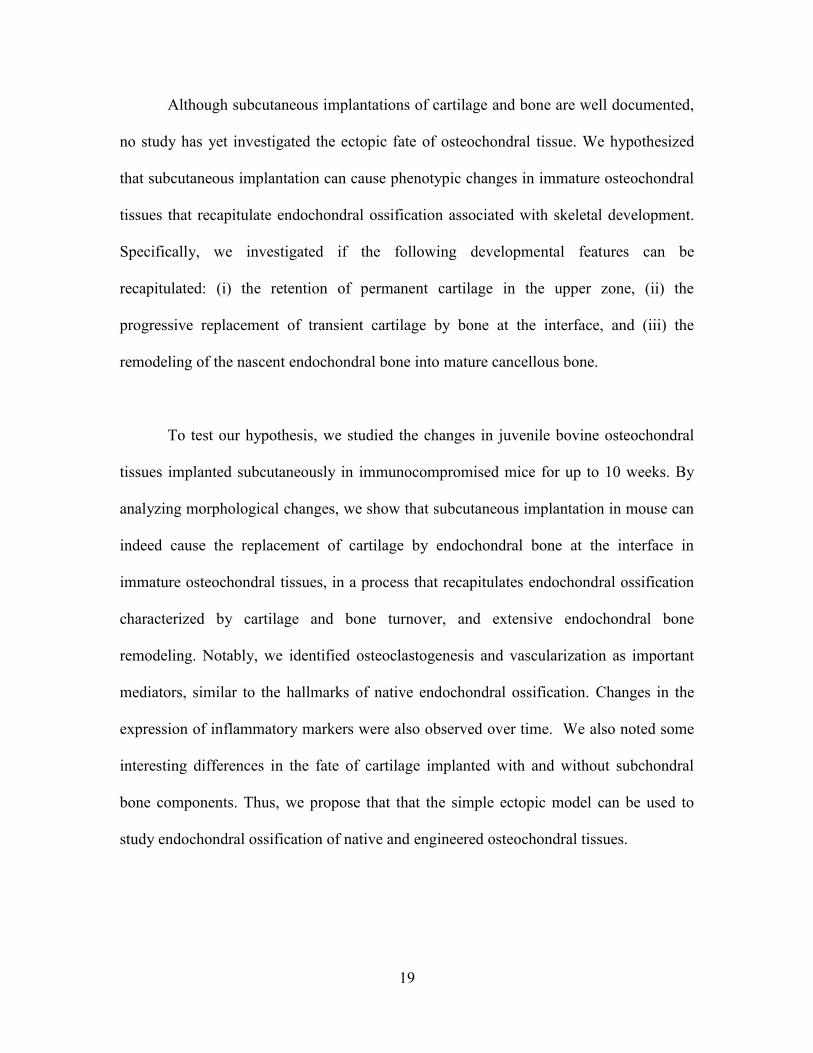
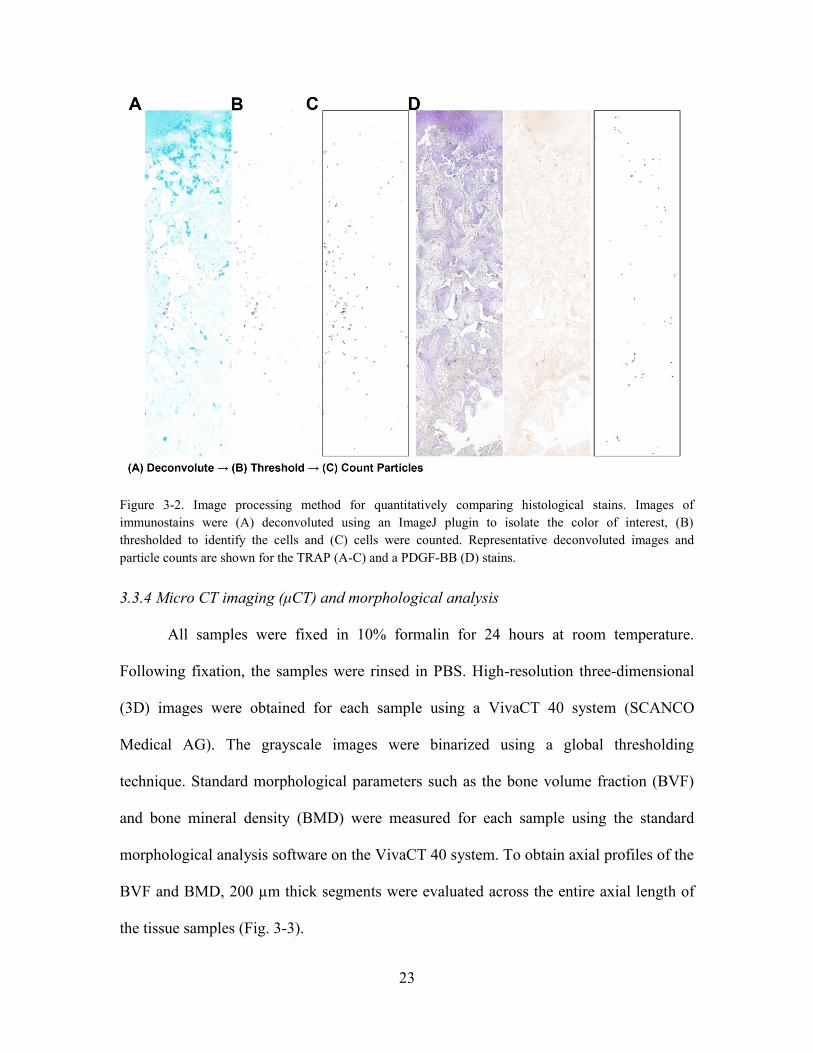
Figure 3-2. Image processing method for quantitatively comparing histological stains.
Images of immunostains were (A) deconvoluted using an ImageJ plugin to isolate the
color of interest, (B) thresholded to identify the cells and (C) cells were counted.
Representative deconvoluted images and particle counts are shown for the TRAP (A-C)
and a PDGF-BB (D) stains. ........................................................................................... 23
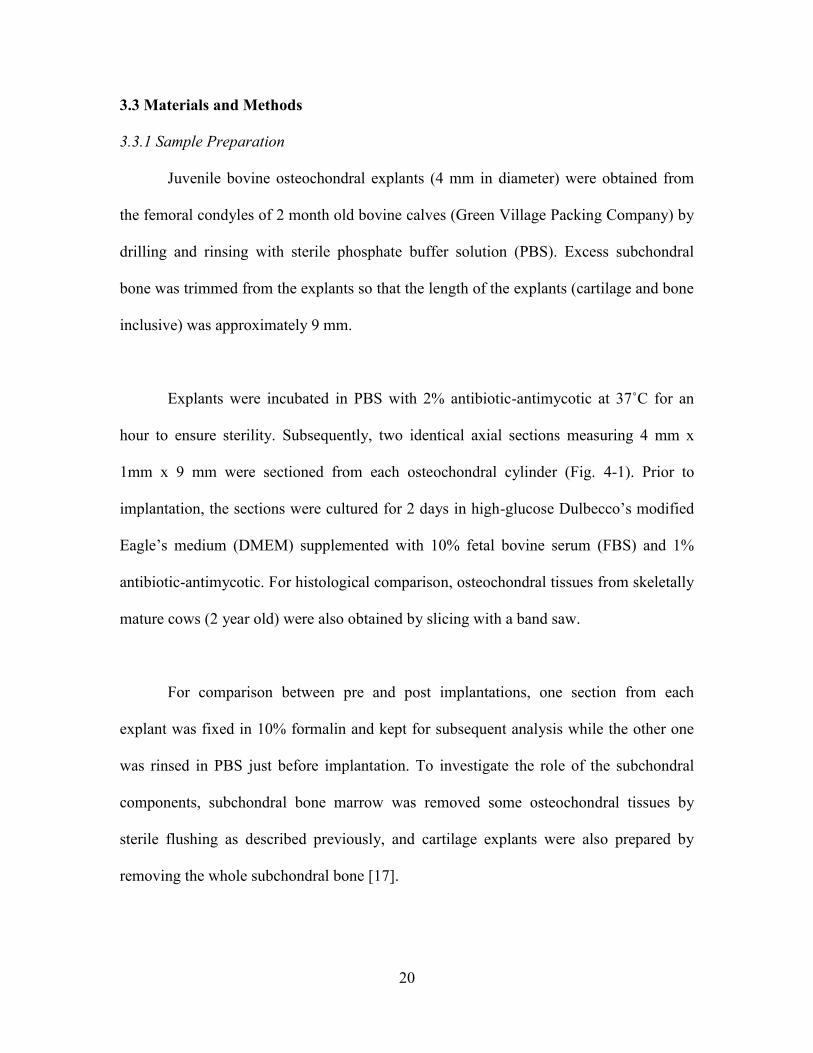
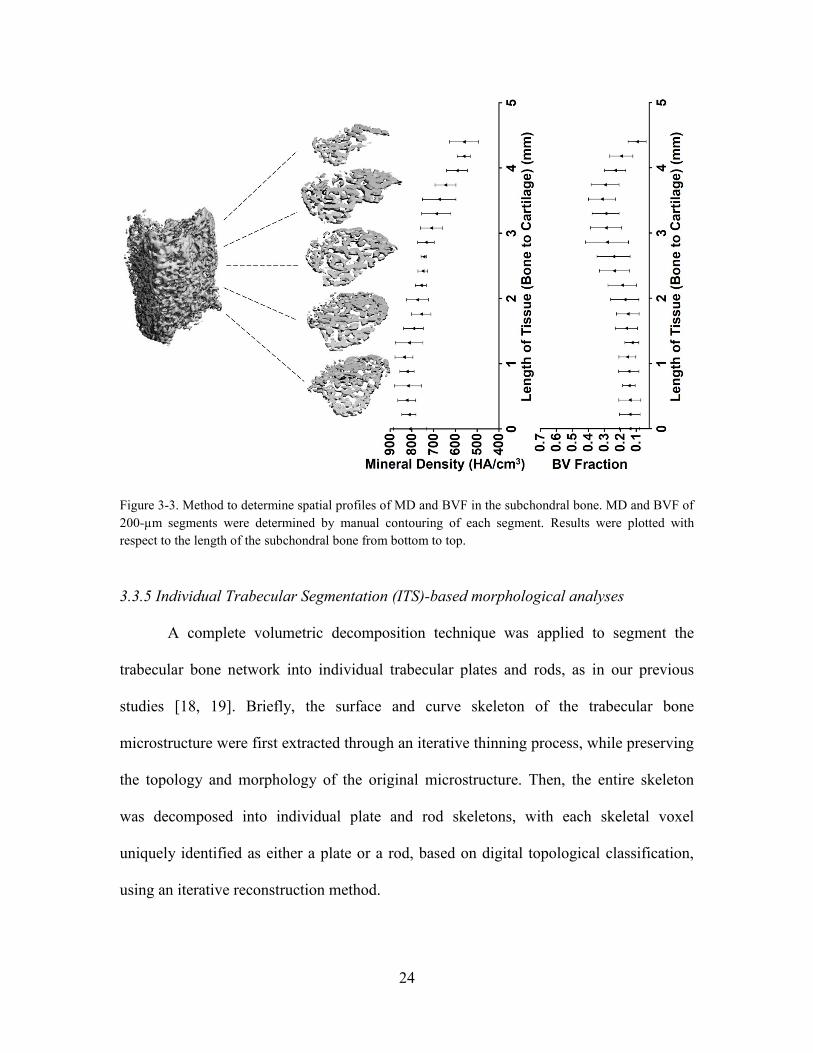
Figure 3-3. Method to determine spatial profiles of MD and BVF in the subchondral
bone. MD and BVF of 200-µm segments were determined by manual contouring of
each segment. Results were plotted with respect to the length of the subchondral bone
from bottom to top. . ...................................................................................................... 24
Figure 3-4. Representative H&E stains of osteochondral sections at day 0, and after 4
weeks and 10 weeks of subcutaneous implantation, and of a skeletally mature cow (2
year old). Articular cartilage and subchondral bone are denoted as AC and SB. Deep
zone cartilage was replaced by endochondral bone at the interface. Trabeculation was
nascent in the subchondral bone at 4 weeks and well established at 10 weeks. Scale bar:
200 µm. .......................................................................................................................... 26
Figure 3-5. Changes in tissue length and composition. (Top) Representative
photographs of whole tissue sections at day 0, after 4 weeks and 10 weeks of
vi
implantation. Scale bar: 1 mm. (Bottom) Length of cartilage determined from
representative histologies, and length of bone determined by µCT analysis, showing
osteochondral tissue composition before and after implantation. Cartilage length
decreased and bone length increased apparently by 4 weeks, and significantly at 10
weeks, respectively (n=4). . ........................................................................................... 27
Figure 3-6. Representative type X collagen stains of osteochondral sections at day 0,
after 4 weeks and 10 weeks of implantation. Hypertrophic chondrocytes (indicated by
red arrowheads) were observed initially at the interface, but diminished over time.
Scale bar: 200 µm. ........................................................................................................ 28
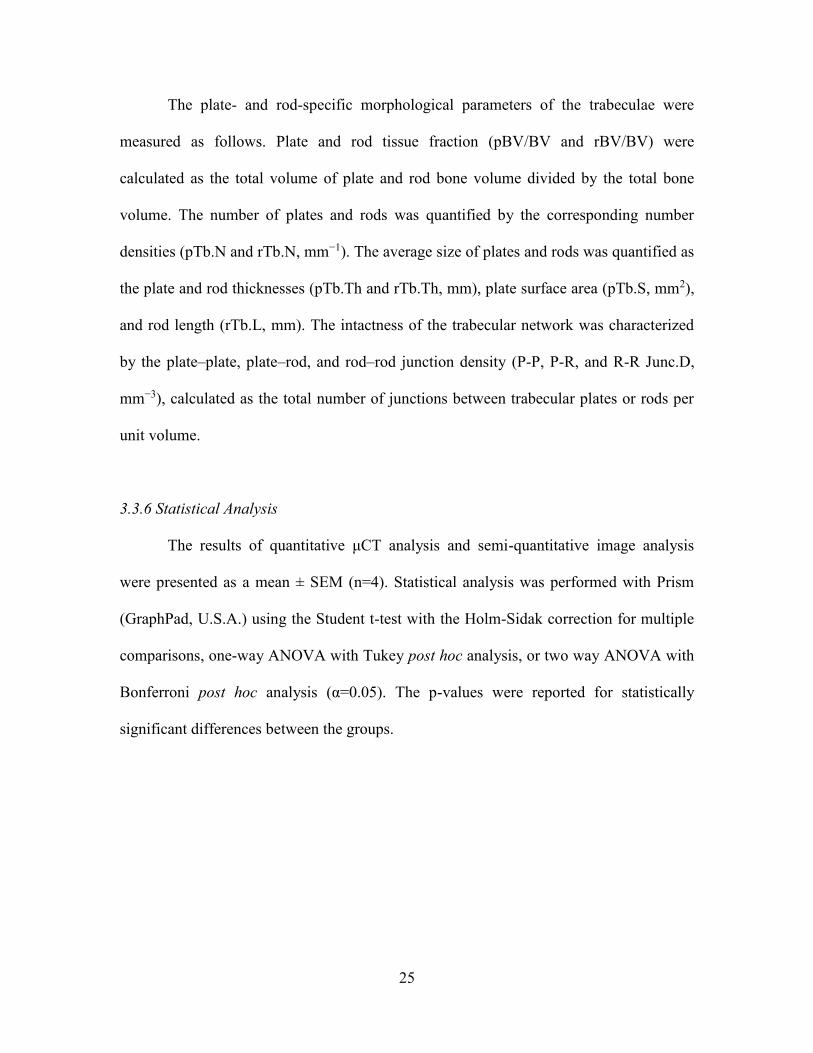
Figure 3-7. Representative Movat’s pentachrome stains of osteochondral tissues at day
0, and after 4 weeks and 10 weeks of implantation. Scale bar: 200 µm. ...................... 29
Figure 3-8. Representative µCT images of osteochondral tissues at day 0, and after 4
weeks and 10 weeks of implantation. Scale bar: 1mm. ................................................. 30
Figure 3-9. Spatial profiles of the mineral density (MD) and bone volume fraction
(BVF) of the subchondral bone at day 0, after 4 weeks and 10 weeks of implantation.
The 4 weeks group is shown in a lighter shade for ease of comparison between day 0
and 10 weeks. Newly formed bone at the interface exhibited higher BVF and lower
MD than native bone, whereas the bone in the deeper region exhibited significantly
higher MD and lower BVF after remodeling (*p<0.05; **p<0.01; n=4). ..................... 31
Figure 3-10. Visualization of plates (green) and rods (red) identified from µCT images
of osteochondral tissues at day 0 and 10 weeks. Plates were predominant at day 0,
whereas rods where predominant at 10 weeks .............................................................. 32
Figure 3-11. ITS-based analysis showed significant decrease in the plate volume and
density, increase in the rod volume and density, and increase in the rod-rod junction
density (****p<0.001; n=4). ......................................................................................... 32
Figure 3-12. Representative stains of TRAP with Alcian Blue of osteochondral sections
at day 0, and after 4 weeks and 10 weeks of implantation. Magnified images with
pseudo-colored nuclear counterstains (DAPI) are shown in the right panels. TRAP+
cells were more abundant at 4 weeks than at 10 weeks following implantation. Large,
multi-nuclear TRAP+ cells (indicated by red arrowheads) seen at 4 weeks indicate the
presence of mature osteoclasts mediating cartilage resorption and bone remodeling.
Scale bars: 200 µm (main images) and 100 µm (magnified images). ........................... 34

vii
Figure 3-13. Quantitative analysis of TRAP stains. The number of TRAP+ cells and
average stain area of TRAP+ cells were significantly higher at 4 weeks than at 10
weeks following implantation (n=4).............................................................................. 34
Figure 3-14. Representative PDGF-BB stains of osteochondral sections at day 0, and
after 4 weeks and 10 weeks following implantation. Magnified images are shown in the
right panels. PDGF+ cells were seen at 4 weeks and 10 weeks following implantation,
and were more abundant at 4 weeks. Scale bars: 200 µm (main images) and 100 µm
(magnified images). ....................................................................................................... 35
Figure 3-15. Representative CD-31 stains of osteochondral sections at 4 weeks and 10
weeks. Vascular lumens (indicated by red arrowheads) were seen at 4 weeks but not 10
weeks following implantation. Scale bar: 100 µm. ....................................................... 35
Figure 3-16. Quantitation of PDGF-BB and CD-31 stains. The numbers of PDGF-BB+
cells and CD-31+ area were significantly greater at 4 weeks than at 10 weeks (n=4). . 36
Figure 3-17. Host cells populate the subchondral bone and drive endochondral
ossification. (A) Representative H&E stains of osteochondral sections at day 0 and at 4
weeks following implantation. Sections were stripped of bone marrow (BM) cells in
the subchondral bone prior to implantation by sterile rinsing. Magnified images are
shown in the right panels. The subchondral bone was densely populated with cells at 4
weeks, indicating host involvement. Scale bar: 200 µm. (B) Representative µCT
images of osteochondral sections at day 0 and at 4 weeks following implantation
showing new endochondral bone formation and subchondral bone remodeling. (C) The
lengths of cartilage (determined from representative histologies) and bone (determined
by µCT analysis) showing osteochondral tissue composition before and after
implantations. Cartilage length decreased and bone length increased markedly by 4
weeks following implantation (n=4). (D) Implantation outcomes of cartilage-only
grafts. H&E and Von Kossa stains at day 0 and after 4 weeks of implantation.

viii
Hypertrophic chondrocytes mineralized during implantation without visible
endochondral bone formation. Scale bar: 200 µm. ........................................................ 37
Figure 3-18. Macrophages selectively regulate cartilage and bone turnover. (Left) Cells
expressing classically activated (M1) marker iNOS were observed extensively at the
interface as well as in the subchondral bone region at 4 weeks. At 10 weeks, the
presence of iNOS+ cells persisted near the interface but attenuated in the subchondral
bone. (Right) Cells expressing alternatively activated (M2) marker Arg-1 were
observed extensively at 4 weeks, especially at the interface. At 10 weeks, Arg-1+ cells
were abundant near the interface and lined the newly formed endochondral bone in the
subchondral region. ....................................................................................................... 38
Figure 3-19. Semi-quantitative analyses of iNOS and Arg-1 immunohistochemistry.
Particles were counted using multiple representative frames of binarized images. There
were slightly more iNOS+ cells than Arg-1+ cells at 4 weeks, albeit not significantly.
In contrast, there were more Arg-1+ cells than iNOS+ cells at 10 weeks. .................... 39
Figure 3-20. Summary of ectopic implantation outcomes. Schematics illustrating that
osteochondral tissues comprising articular cartilage (AC) and subchondral bone (SB)
with or without bone marrow (BM) underwent endochondral ossification (EO)
characterized by the replacement of cartilage by bone at the interface. Instead, full-
thickness cartilage mineralized in the deep zone but did not undergo EO. ................... 46
Figure 4-1. Self-assembly methods for cartilage formation by hMSCs. (A) Top, disc
culture: hMSCs were seeded in transwell inserts coated with vehicle control (Veh),
type I collagen (Col1), or type II collagen (Col2); Veh group failed to form discs.
Bottom, pellet culture: hMSCs were seeded in round-bottom wells and formed
spherical aggregates. (B) Representative images of hyaline discs formed in coated
transwells are shown. ..................................................................................................... 52
Figure 4-2. Histology of Col1, Col2, vehicle control and pellet. Poor ECM deposition
in the deep zone was seen in Col2 discs. Vehicle control condensed into a hemisphere.
Type I collagen rich fibrillar structure formed at the surface of the pellet and vehicle
control. Discs exhibited more uniform type II collagen and GAG distribution whereas
GAG was visibly denser at the center of the pellet. Scale bar: 200 µm.. ...................... 59
Figure 4-3. Histology of Col1 and Col2 discs after 17 days and 42 days of
chondrogenic induction. Although both groups formed stratified discs that grew in
thickness and deposited ECM over time, less ECM was observed in the deep zone of
Col2 discs. Scale bar: 200 µm. ...................................................................................... 60
ix
Figure 4-4. Histology comparing lubricin stains. Lubricin was expressed at the entire
pellet surface but only at the top surface of the discs. Scale bar: 50 µm. ...................... 60
Figure 4-5. H&E stains show that Col1 discs seeded at 1.0×10⁶ were thicker than those
seeded at 0.5×10⁶. Scale bar: 200 µm............................................................................ 60
Figure 4-6. Type I collagen stains of pellets at different time points after chondrogenic
induction show initial expression throughout the pellet, and reduction to the surface
layer over time. Scale bar: 200 µm. ............................................................................... 61
Figure 4-7. Mechanical and physical properties of discs formed by self-assembling
hMSCs. (A) Young’s modulus measured by unconfined compressive loading revealed
that Col1 discs outperformed Col2 discs. Increasing seeding density from 0.5×10⁶ to
1.0×10⁶ further improved Col1 discs. (B) Disc thicknesses were comparable for the
Col1 and Col2 discs; increasing seeding density increased the thickness of Col1 discs.
(C) Representative stress-strain curves. Engineered and native tissues exhibited similar
profiles. .......................................................................................................................... 62
Figure 4-8. Biochemical quantification of glycosaminoglycan (GAG), collagen (COL)
and cellular (DNA) contents. (A) Comparisons of Col1 discs, Col2 discs and pellets
after 17 days or 42 days of chondrogenic induction. At day 42, pellets exhibited higher
GAG and DNA contents (per wet weight) and discs exhibited higher COL/DNA and
COL/GAG ratios; Col1 discs had higher GAG and DNA contents than Col2 discs. (B)
Comparisons of Col1 discs at different seeding densities. Doubling seeding density
from 0.5×10⁶ to 1.0×10⁶ increased GAG content (per wet weight) but not COL content.
....................................................................................................................................... 64
Figure 4-9. Gene expression analysis. Data are shown for Col1 discs, Col2 discs and
pellets after 17 days or 42 days of chondrogenic induction (by quantitative real-time
polymerase chain reaction, qPCR). Col2 discs displayed lower expression of
chondrogenic markers at day 17 than Col1 discs. Pellets displayed lower
COL2A1/ACAN ratio and higher expression of COL1A1 than discs at day 42. All gene
expressions, unless otherwise stated, are normalized to GAPDH and expressed as 2-∆Ct.
....................................................................................................................................... 65
Figure 4-10. Overview of implantations. Discs cultured for 6 weeks, 8 weeks or 10
weeks, and pellets cultured for 10 weeks were implanted subcutaneously in mice.
Tissues were explanted after 4 weeks. ........................................................................... 66

x
Figure 4-11. Histological stains showed organization of discs after endochondral
ossification. (Left) Discs were more mineralized with length of culture and mature
bone was seen in 10w4Q discs. Bone formed at the bottom of the discs and the
infiltrating marrow-like cells were observed. This layer was covered by calcified
cartilage, with traces of non-calcified cartilage at the surface. (Right) Whole tissue
sections of pellets after endochondral ossification. Bone formed at the surface, with
infiltrating marrow-like cells beneath gradually resorbing the calcified cartilage. Scale
bar: 200 µm. ................................................................................................................... 67
Figure 4-12. µCT images and quantitative analysis. (Top) Representative images
showing mineralization of discs increased with length of culture. Whereas the discs
formed a sheet of mineral, the pellet formed a spherical shell. (Bottom) Quantitative
µCT analysis. Mineral density and volume increased with the length of culture; 10w4Q
discs exhibited the greatest mineral density and bone volume. ..................................... 68
Figure 5-1. Schematic of the induction regimens. hMSCs seeded in coated transwells
were cultured under isotropic chondrogenic induction for 3 weeks. After 3 weeks,
induction in the basal compartment was switched to a hypertrophic regimen to set up a
dual compartment culture. Isotropic chondrogenic or hypertrophic regimens were
maintained in control groups. All tissues were cultured for up to 10 weeks. ................ 80
Figure 5-2. Histology showing deep mineralization in the CH group (Von Kossa), and
maintenance of hyaline cartilage in both groups (Alcian Blue). Scale bar: 200 µm. .... 85
Figure 5-3. Histology showing widespread loss of GAG (Movats) and peripheral
mineralization (Von Kossa) in the IH group at 10 weeks. Scale bar: 200 µm. ............. 85
Figure 5-4. Transverse brightfield images of whole cartilage discs at 6 weeks (top) and
10 weeks (bottom). IC discs are shown on the left and CH discs are shown on the right.
....................................................................................................................................... 86
Figure 5-5. Histology confirming hyaline cartilage formation at 10 weeks. Uniform
deposition of type II collagen, but not type I collagen. Alcian Blue stains showed rich
GAG deposition. Von Kossa stains showed only the CH group was mineralized in the
deep zone. Scale bar: 200 µm. ....................................................................................... 87
Figure 5-6. Biochemical analyses. Lower DNA content (6 weeks) and GAG content (10
weeks) in the CH group. COL content, GAG and COL productivities (normalized to
DNA) were similar. ....................................................................................................... 88

xi
Figure 5-7. Cleaved caspase-3 expression. Following deep zone hypertrophic induction,
some apoptosis was seen as 6 weeks with incipient mineralization in the deep zone. In
contrast, no apoptosis was seen at 10 weeks, or in the isotropic control groups at both 6
weeks and 10 weeks. Scale bar: 200 µm. ...................................................................... 88
Figure 5-8. Scatter plot showing correlation between GAG and DNA data of both IC
and CH groups at 6 weeks and 10 weeks. Pearson correlation was determined to be
0.53. ............................................................................................................................... 89
Figure 5-9. Mechanical analyses showing similar attributes. The compressive Young’s
modulus and thickness of the CH group was slightly lower. ........................................ 89
Figure 5-10. Biochemical analyses. Significant, near complete loss of GAG in the IH
group at 10 weeks. ......................................................................................................... 90
Figure 5-11. Gene expression analyses of IC and CH groups at multiple time points.
CH group showed increased expression of cartilage homeostasis (SOX9, S100A1),
chondrocyte maturation (COL9A1, COL11A1), terminal differentiation (COL10A1,
RUNX2, SPP), and trophic markers (DKK1, BMP2, IHH) expression. Differences
between groups reached significance at 10 weeks. ACAN and COL2A1 expressions
were similar between groups. All gene expressions (2-∆∆Ct) are normalized to
GAPDH and 2 week controls. ....................................................................................... 91
Figure 5-12. Gene expression analyses of CH, IC, and IH groups at 10 weeks. Cartilage
maintenance markers (ACAN, COL2A1, SOX9) were downregulated and terminal
maturation marker (RUNX2) was upregulated. All gene expressions (2-∆Ct) are
normalized to GAPDH. ................................................................................................. 91
Figure 5-13. Type X collagen immunohistochemical stains and inverted images. Red
arrows indicate band of hypertrophy. Scale bar: 200 µm. ............................................. 92
Figure 5-14. Intensity profile of type X collagen stains showed distinct deep zone peaks
in the CH group. ........................................................................................................ 92
Figure 5-15. Overview of implantation. Tissues cultured for 10 weeks were implanted
for 4 weeks..................................................................................................................... 93
Figure 5-16. Histology of IH and CH discs post- implantation. H&E, Movat’s
pentachrome and Von Kossa stains showed mature bone infiltrated with marrow cells

xii
at the bottom of the IC but not the CH discs. Instead, the CH discs displayed columnar
chondrocytes and tidemark formation. Scale bar: 200 µm. ........................................... 94
Figure 5-17. Quantification of histological comparison. (Top) Segmentation and
quantitation of Movat’s pentachrome stains showed significant fractions of bone and
marrow present in the IC but not the CH group. (Bottom) Quantitation and profiling of
Von Kossa stains showed greater and more extensive mineralization in the IC group. 94
Figure 5-18. µCT analyses of the implanted IC and CH discs. (Left) Reconstructed
µCT images showed extensive mineral deposition in the IC group following
implantation but not the CH group. (Right) The increase in mineral volume was
significantly greater in the IC group than the CH group post-implantation, with a
slightly greater mineral density. .................................................................................... 95
Figure 5-19. Immunohistochemistry of implanted discs. IC group showed type I
collagen deposition, loss of type II collagen, faint lubricin expression in upper and
lower aspects and extensive osteopontin expression. CH group showed homogenous
type II collagen deposition, superficial zone lubricin expression and deep zone
osteopontin expression. PDGF-BB stains revealed pre-osteoclasts/osteoclasts invading
IC but not CH discs. ...................................................................................................... 96
Figure 5-20. Immunohistochemistry of type X collagen and ALP after implantation.
(A) Strong type X collagen expression was seen in the deep zone of the CH group and
near the superficial zone of the IC group that was undergoing endochondral
ossification. (B) ALP was expressed in the deep zone of the CH group and extensively
in the IC group. Scale bar: 200 µm. ............................................................................... 97
Figure 5-21. Immunohistochemistry of SOX9 and RUNX2 expression after
implantation. SOX9 expression was maintained in the upper zone of the CH group and
RUNX2 expression was limited to the deep zone. Instead, trace SOX9 expression and
extensive RUNX2 were seen in the IC group. Scale bar: 200 µm. ............................... 98
Figure 5-22. Biochemical analyses of implanted discs. GAG content of CH group
recovered whereas that of IC group deteriorated post-implantation. COL contents were
similar. ........................................................................................................................... 99
Figure 5-23. Gene expression analyses of implanted discs. Expression of cartilage
maintenance (SOX9, ACAN, COL2A1, COL9A1, COL11A1) and chondrocyte
terminal differentiation (COL10A1, RUNX2) markers persisted in the CH group but

xiii
not the IC group post-implantation. All gene expressions (2-∆Ct) are normalized to
GAPDH. ........................................................................................................................ 99
Figure 5-24. Immunohistochemistry stains of iNOS and Arg-1. iNOS+ and Arg-1+
cells were seen in IC discs where endochondral ossification was occurring, with greater
Arg-1 expression. Superficial zone chondrocytes in the CH discs expressed Arg-1 but
not iNOS. Scale bar: 200 µm.. ..................................................................................... 100
Figure 5-25. Histology of IH discs post-implantation. Extensive endochondral
ossification with bone formation and marrow infiltration from all sides of the tissue.
Scale bar: 200 µm. ....................................................................................................... 101
Figure 5-26. µCT analyses of the IH disc after implantation. (Top) Reconstructed µCT
images of the IH disc after implantation, in comparison with the CH and IC discs. The
implanted IH disc was mineralized everywhere. Scale bar: 1 mm. (Bottom) The IH
discs exhibited higher mineral density (not significant) and mineral volume than the
CH and IC discs. .......................................................................................................... 101

xiv
Acknowledgments
First and foremost, I would like to thank my advisor Gordana Vunjak-Novakovic
for her unfailing support of my current and future plans, and for guiding me through the
difficult periods. Her optimism and passion for her work are truly inspiring
I would further like to thank past and present members of the Laboratory for Stem
Cells and Tissue Engineering: Yiyong, for his encouragement, mentorship and assistance
with the conduct of all my studies; Jon and David, for the conversations and being
mainstays in the osteochondral team; Sarindr, for helping to shape my projects; Sue, for
ensuring that we have what we need; Aonnicha, for her diligence; Bohao, Diogo, Zen,
Jenny, Hesam, Tim, Stephen, Olaia, Ying, Holly, Jinho, Kacey, Keith, Sara, Nina,
Supansa, Ben, Ale, George and Amandine for their friendship and help along the way.
My gratitude also goes to the members of my thesis committee: Kara Spiller, for
being my first mentor in lab and her continuous guidance; Edward Guo, for his
invaluable collaborative effort; Clark Hung and Warren Grayson, whose pioneering work
on osteochondral tissue engineering inspired my projects, for their feedback.
This work would also not have been possible without the full scholarship from the
Agency for Science, Technology and Research (A*STAR Singapore). I am grateful for
my sureties, and all the mentors and administrators of A*STAR.
I am also grateful for my collaborators and friends at Columbia: Bin and Sam, for
their help with µCT scanning and analyses; Milos, Emily, Eben, Andrea, Jen, Arthur,
Mike, and Sau Yin, for making graduate school more enjoyable; Redeemer Presbyterian
Church, for teaching me God’s words and helping me to find my worth in Jesus.
I would also like to thank my friends in Singapore who helped reinvigorate me
every time I went home: Karen, Shona, Joanna, and Sarah for sharing in the precious
weddings (with Kenneth and baby Talia, Steve, Wayne); Malvin, Ben, XinKai, Clemens,
Joseph, Zhi Wei (and baby Gabrielle), Cheng Hui, Norbert and Eugene for being the
most enduring group of buddies; Peiyi, Nicole (and baby Zachary), Jaehee, Sharon,
Jayce, Kawa, Lionel, Yan Chuan, Alex, Jon, Katrina, Jingwei, Hong Li, and Yisin for
their friendship since the Illinois years; Yuming (and baby Edward), Jasmin, Simeon, and
the Sapporo group, for staying in touch all these years
Finally, I thank the loving support of my parents, my brother (and Desmond), my
god-parents, my god-siblings and the love of my life, Susie. All the work in the world
would not mean a thing without your generous and self-giving love.

xv
To God be the glory, for the things He has done.

1
Chapter 1
Background
1.1 Cartilage Development
During development, the primordial limb bud consists of an uninterrupted
mesenchymal pre-chondrogenic condensed mesenchymal structure [1-3]. Cell
aggregation is mediated by morphogenetic factors such as transforming growth factor
beta (TGF-β) and adhesion factors such as fibronectin and type I collagen. Cell-to-cell
interactions mediated by adhesion molecules such as N-cadherin in turn upregulates the
expression of chondrogenic genes such as SOX-9 and boundary proteins such as tenascin
(Fig. 1-1). The condensed mesenchymal cells continue to proliferate prior to
differentiation into chondroblasts [1].
Progression to differentiation phase is mediated by downregulation of genes
controlling cell-to-cell binding and proliferation, and upregulation of bone morphogenetic
proteins (e.g. BMP-2, BMP-4). Exposure of BMP-2 to chondroprogenitor cells enables
chondroblast differentiation, bypassing a condensation phase. BMP activity is
antagonized by Noggin, which provides negative feedback and enables joint formation
between skeletal elements. As the mesenchymal cells differentiate into chondroblasts,
they deposit extracellular matrix rich in type II collagen and glycosaminoglycan
(GAG)[1].
2
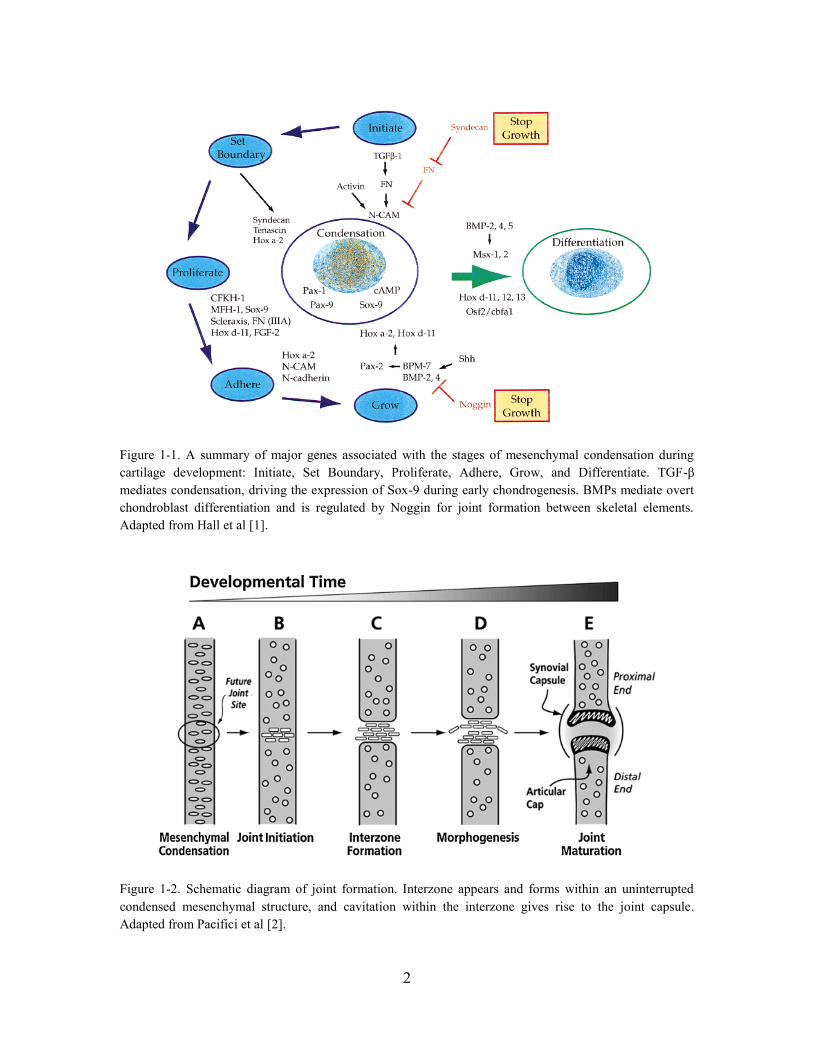
Figure 1-1. A summary of major genes associated with the stages of mesenchymal condensation during
cartilage development: Initiate, Set Boundary, Proliferate, Adhere, Grow, and Differentiate. TGF-β
mediates condensation, driving the expression of Sox-9 during early chondrogenesis. BMPs mediate overt
chondroblast differentiation and is regulated by Noggin for joint formation between skeletal elements.
Adapted from Hall et al [1].
Figure 1-2. Schematic diagram of joint formation. Interzone appears and forms within an uninterrupted
condensed mesenchymal structure, and cavitation within the interzone gives rise to the joint capsule.
Adapted from Pacifici et al [2].

3
Interzone cells forming the synovial joints appear in the cartilaginous anlage and
cavitation within the interzone gives rise to the joint capsule (Fig. 1-2). Subsequently, the
differentiation of proliferating chondroblasts into chondrocytes and hypertrophic
chondrocytes is regulated by signaling pathways involving Indian hedgehog (Ihh), which
induces the expression of parathyroid hormone related peptide (PTHrP) that provides
negative feedback to regulate Ihh activity[1, 3].
Thus, the developing cartilage comprises zones with morphologically distinct
chondrocytes including the permanent (resting) zone, and the transient (proliferating, pre-
hypertrophic and hypertrophic) zones. Hypertrophic chondrocytes trigger vascular
invasion, and deposits mineral to create a bone template (Fig. 1-3). Osteoblasts remodel
the template with osteoclasts into mature bone. This process of endochondral ossification
is used in the growth plate, and drives bone elongation during skeletal development. The
mature articular cartilage consists of a superficial layer, a radial layer, and a calcified
layer which bridges it with the subchondral bone (Fig. 1-3) [3].
Figure 1-3. Histology of a developing (a) and a mature articular cartilage (b) of the tibial plateau in 2-weeks
(a) and 3-months (b) old mice. (a) The developing articular cartilage is characterized by zones with
morphologically distinct chondrocytes: resting, proliferating, pre-hypertrophic, and hypertrophic. (b) The
mature articular cartilage has a calcified interface layer bridging the subchondral bone to the cartilage
comprising superficial, transition and radial layers. Adapted from Iwamoto et al [3].
4
1.2 Clinical Problem
The articular cartilage is essential for joint function and quality of life. It lines
bone ends in the synovial joints, provides lubrication, and cushions impacts. However, it
is also avascular and has a limited capacity to regenerate upon skeletal maturation. Once
damaged, recovery of structure and function is difficult and degeneration with age and
injury is common. Osteoarthritis is a degenerative joint disease affecting 33.6% of people
above 65 years old in the U.S. characterized by progressive loss of the articular cartilage
and underlying bony changes, causing movement limitation in 80% of patients [4, 5].
Full-thickness chondral lesion (grade III, IV) is a common articular cartilage
injury [6]. Current treatment approaches include debridement and lavage, marrow
stimulation techniques such as microfracture, cell-based therapies such as autologous
chondrocyte implantation (ACI), and osteochondral autografts and allografts [7-9].
Depending on the size of the lesion, a treatment algorithm has been proposed [10].
Although microfracture is a common procedure for smaller sized chondral
lesions, it is not restorative and often results in the formation of fibrocartilage with
inferior mechanical properties [11, 12]. Although ACI is a clinically approved procedure
currently marketed by Vericel as Carticel, it does not consistently promote hyaline
cartilage repair [9, 13]. Furthermore, the periosteal flap that overlays the injected
chondrocytes and supports cartilage formation is prone to arthrofibrosis and hypertrophy
[9, 14]. Long-term follow ups on survivors of microfracture and ACI found no
significant difference in clinical scores between the treatment groups. Importantly, 57%

5
of patients who received ACI and 48% of patients treated with microfracture displayed
radiographic evidence of early osteoarthritis at 15 years post procedure [15]. Thus, the
risk of treatment failure necessitates the development of other treatment modalities.
Figure 1-4. Treatment algorithm for cartilage lesions. MFX: Microfracture, OATS: Osteochondral
autograph transfer, OCA: Osteochondral allografting. ACI: Autologous chondrocyte implantation. Adapted
from Cole et al.
Although osteochondral autografts transfer can be restorative, the use of
autografts is limited in their availability, size, shape, and donor site morbidity. The use of
allografts permits repair of larger lesions but requires sourcing from cadavers and
immunosuppression. The shortcomings of current treatment approaches have motivated
new treatment modalities in the form of living cartilage replacements grown from cells
by tissue engineering [16]. In particular, the use of chondrocytes and mesenchymal stem
cells (MSCs) for cartilage tissue engineering (TE) has been widely investigated.

6
1.3 Cartilage Tissue Engineering and Its Challenges
1.3.1 Chondrocytes-Based Methods
In cartilage TE, scaffolding materials such as agarose, alginate, polyglycolic acid
(PGA), poly-L-lactic acid (PLLA), type I and II collagens have been used with
chondrocytes to great effect [17-20]. As well as trophic factors such as TGF-β,
deformational loading enhanced cartilage formation from chondrocytes in vitro to
achieve properties approximating those of native tissues [21, 22].
Figure 1-5. Schematics of NeoCart production and implantation. Adapted from Crawford et al [23].
The clinical relevance of cartilage TE is exemplified by NeoCart, a tissue
engineered cartilage implant grown in vitro by seeding autologous chondrocytes in type I
collagen scaffolds and culturing in a bioreactor (Fig. 1-4). Studies in a porcine model

7
demonstrated hyaline-like cartilage repair of full-thickness femoral cartilage defects with
NeoCart [23]. Preclinical success motivated clinical Phase I and II trials showing the
safety and efficacy of NeoCart for the repair of full-thickness cartilage injuries [23, 24].
Still, the use of chondrocytes has its limitations. It is well documented that
chondrocytes have a limited proliferative ability in vitro and are prone to de-
differentiation with prolonged culture [19]. Furthermore, articular cartilage needs to be
harvested from another non-load bearing site, which could result in donor site morbidity
and other complications.
1.3.2 Engineering Cartilage from MSCs
Mesenchymal stem cells (MSCs) are an attractive alternative cell source that can
be harvested from a variety of tissues. Despite source-dependent variability, they can
readily proliferate and differentiate into multiple skeletal lineages in vitro [25, 26].
However, attempts to use scaffolding materials to engineer cartilage from MSC have only
found limited success. Particularly, MSCs seeded in agarose formed cartilage tissues with
subnormal properties when held in direct comparisons with chondrocytes [27, 28].
Still, long-term culture with TGF-β supplementation, deformational loading,
osmotic loading and enzymatic treatment have been shown to improve properties of
cartilage grown from MSCs [27-30]. The incorporation of native glycosaminoglycans
such as hyaluronic acid and chondroitin sulfate by into hydrogels also enhanced
chondrogenesis [31-33]. Scaffolds with architecture mimicking that of native cartilage

8
matrix, such as interlocking woven polycaprolactone (PCL), also supported cartilage
formation from MSCs to result in large anatomically shaped joint surface [34]. To
enhance cartilage formation, these scaffolds can also be modified to deliver bioactive
cues via incorporation of native molecules such as N-cadherin or viral vectors to drive
endogenous TGF-β expression [35, 36].
1.3.3 Self-Assembly Methods
Tissue engineering relies on biological principles to recapitulate tissue formation
in vitro with physiologic likeness. Not surprisingly, biomimetic methods have been
shown to enhance cartilage formation from MSCs by recapitulating some aspects of the
native microenvironment. Developmental studies highlighting the importance of
mesenchymal condensation have motivated self-assembly methods to engineer cartilage
without scaffolding material in vitro. In the earliest examples of self-assembly culture,
chondrocytes seeded in culture inserts deposited cartilaginous matrix and formed hyaline
cartilage discs over time under chondrogenic induction [37, 38].
Similarly, self-assembly methods have also been adapted successfully to grow
cartilage from MSCs. In pellet culture, MSCs aggregate and deposit cartilaginous matrix
to form spheres following induction with TGF-β supplementation. This process
recapitulates the cellular and molecular events during chondrogenesis [39, 40]. Our
laboratory recently showed that pellets turned into free-forming cartilage tissues with
physiologic likeness (Fig. 1-5A) [41]. The pellets formed condensed mesenchymal bodies
resembling the prechondrogenic mesenchyme, and they could be fused prior to the onset
9
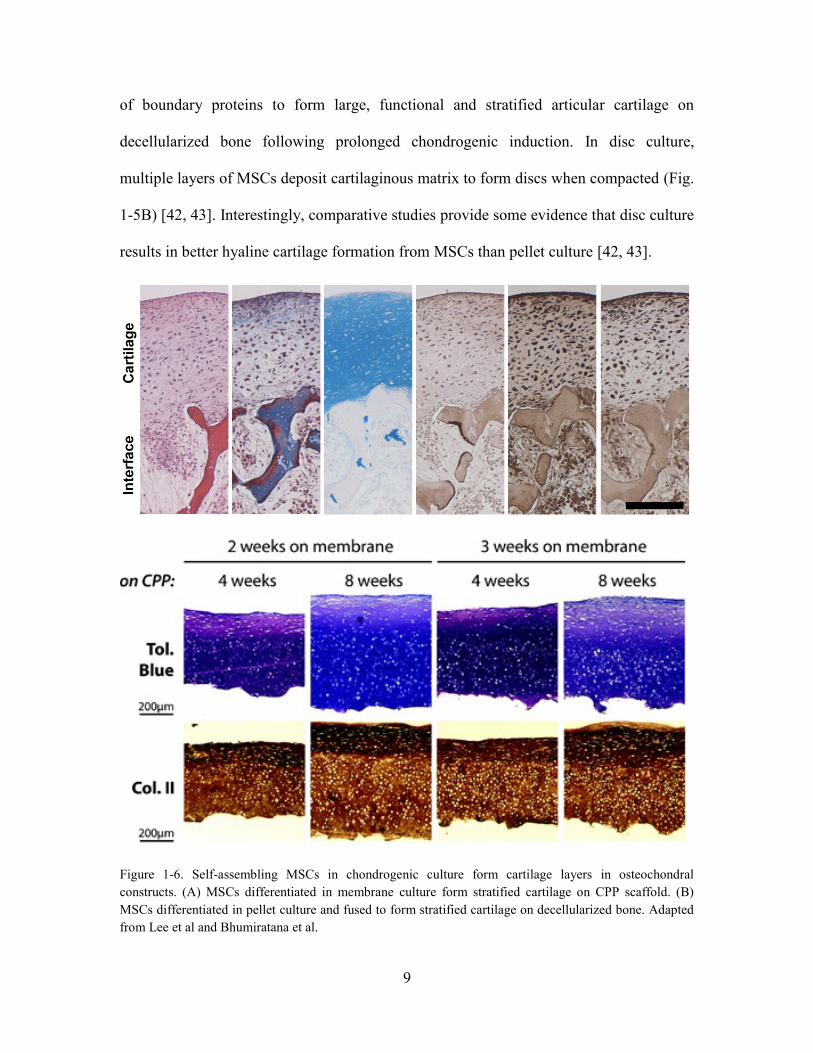
of boundary proteins to form large, functional and stratified articular cartilage on
decellularized bone following prolonged chondrogenic induction. In disc culture,
multiple layers of MSCs deposit cartilaginous matrix to form discs when compacted (Fig.
1-5B) [42, 43]. Interestingly, comparative studies provide some evidence that disc culture
results in better hyaline cartilage formation from MSCs than pellet culture [42, 43].
Figure 1-6. Self-assembling MSCs in chondrogenic culture form cartilage layers in osteochondral
constructs. (A) MSCs differentiated in membrane culture form stratified cartilage on CPP scaffold. (B)
MSCs differentiated in pellet culture and fused to form stratified cartilage on decellularized bone. Adapted
from Lee et al and Bhumiratana et al.

10
1.3.4 Stability of Engineered Cartilage In vivo
Despite recent advances in materials and methods, cartilage tissues engineered
from MSCs lack stability in vivo. During ectopic implantation, cartilage tissues grown
from MSCs undergo endochondral ossification. This is characterized by extensive
mineralization of the cartilaginous matrix, and the formation of mature bone around a
bone marrow cavity.
Figure 1-7. Histology of implanted cartilage tissues formed from chondrocytes (top row) and BMSCs
(bottom row). Stains for proteoglycans (Alcian blue) (A and F), calcium (alizarin red/fast green) (B and
G), type II collagen (C and H), type X collagen (D and I), and type I collagen (E and J) are shown.
Cartilage tissues formed from chondrocytes do not undergo endochondral ossification. In contrast, cartilage
tissues formed form BMSCs undergo endochondral ossification. Adapted from Pelttari et al [44].
Interestingly, a study on the in vivo outcomes of cartilage tissues grown from
MSCs found that the spontaneous expression of type X collagen by MSCs after
prolonged chondrogenic induction correlated with endochondral ossification (Fig. 1-5).
This suggests that endochondral ossification is mediated by spontaneous differentiation
of MSCs into hypertrophic chondrocytes during in vitro chondrogenesis. Instead,
11
chondrocytes did not express type X collagen and cartilage tissues grown from
chondrocytes are stable in vivo [44]. Interestingly, the proneness of cartilage formed from
MSCs to undergo endochondral ossification has motivated a new strategy to repair bone
defect using a cartilage template formed from MSCs [45-48]. However, more effective
strategies are needed to that ensure that cartilage grown from MSC can be maintained for
lasting cartilage repair [49, 50].

12
Chapter 2
Goals, Rationale and Approach
2.1 Goals
Although there is a need to engineer cartilage replacements from adult stem cells,
current methods do not adequately address existing challenges. Scaffolding methods used
successfully with chondrocytes have found limited success when used with MSCs. While
self-assembly methods have been shown to form stratified and functional cartilage from
MSCs, culture parameters are not well defined and the in vivo outcomes of cartilage
tissues grown using different methods have not been investigated. Further, recapitulation
of a mature articular cartilage phenotype has not been achieved, presumably due in part
to the failure of isotropic culture to recapitulate spatiotemporal aspects of native cartilage
development. As the in vivo outcomes of engineered cartilage tissues ultimately
determine the experimental success, there is also a need for a convenient model that
evaluates the tissues in a physiologically relevant way.
The goal of this dissertation is to establish an ectopic implantation model for
studying the development of osteochondral tissues in vivo, regulate the in vitro
development of cartilage engineered from hMSCs, and study the in vivo maturation of
engineered cartilage via ectopic implantation.

13
2.1 Hypothesis
The proposed hypothesis is that ectopic implantation is useful for studying
maturation of osteochondral tissues in vivo, and recapitulation of physiological
development can result in the formation of cartilage from hMSCs with native-likeness in
vitro and in vivo. Specifically, subcutaneous implantation in a mouse can recapitulate
endochondral ossification associated with native development. Cartilage disc formation
from self-assembling hMSCs can be controlled by the ECM coating of the membrane and
the culture regimen to resemble the native articular cartilage. The stability and
organization of cartilage discs can be improved by implementing a spatiotemporally
regulated regimen that induces superficial zone maintenance and deep zone maturation.
2.3 Overall Approach and Specific Aims
The overall investigational approach was to develop a method for engineering
stable and organized cartilage from self-assembling hMSCs, and study the in vivo
outcomes of native and engineered cartilage subcutaneously in a mouse. To achieve that,
the research in this dissertation is divided into three coordinated aims: (i) establish an in
vivo model by studying juvenile bovine osteochondral tissues in the subcutaneous
environment of a mouse and showing that ectopic implantation recapitulates native
endochondral ossification (Aim 1), (ii) develop a robust method for engineering
physiologic cartilage discs from self-assembling hMSCs by regulating the ECM coating
and culture regimen (Aim 2), and (iii) improve the organization and stability of cartilage
discs by implementing spatiotemporal control during induction in vitro (Aim 3).

14
Aim 1: Investigate subcutaneous implantation in mice as an ectopic model for
studying osteochondral tissues in vivo
Rationale
Subcutaneous implantation has been used to study the in vivo maturation of
standalone cartilage and bone tissues. Chondrocytes form cartilage that resists
endochondral ossification whereas hMSCs form cartilage that undergo endochondral
ossification into an ossicle engrafting hematopoietic cells. However, it is unclear whether
the ectopic process recapitulates native endochondral ossification. During skeletal
development, endochondral ossification occurs at the cartilage-bone interface and the
endochondral bone is remodeled into trabecular bone containing marrow. This aim
investigated the directionality and dynamics of endochondral ossification in juvenile
osteochondral tissues during subcutaneous implantation, highlighting similarities and
differences between the ectopic and native processes.
Approach
Age-matched juvenile osteochondral tissue slices were harvested from bovine
femoral condyles and implanted subcutaneously in immunocompromised mice.
Explanted tissues following different lengths of implantation were analyzed
histomorphometrically and radiographically, and compared with native adult tissues.
Cartilage and bone turnover, including changes in bone parameters, were examined. The
involvements of vascularization, osteoclastogenesis, and inflammation were also
investigated and correlated with tissue turnover to propose a mechanism.

15
Aim 2: Develop a robust self-assembly method for making cartilage discs from
hMSCs and evaluate the in vitro and in vivo outcomes
Rationale
Pellet culture of hMSCs recapitulates mesenchymal condensation and serves as a
convenient method for studying chondrogenesis in vitro. However, pellet culture tends to
from fibrocartilaginous tissues that lack stratification of the native articular cartilage and
are prone to endochondral ossification in vivo. Recent studies showed that disc culture
promotes stratified hyaline cartilage formation from self-assembling hMSCs. Still, the
effects of important culture parameters are not well understood, and culture regimens
remain poorly defined. This aim investigated the effects of ECM coating and seeding
density on disc formation from self-assembling hMSCs, compared the composition and
organization of discs and pellets in vitro and in vivo, and established the effects of
prolonged chondrogenic induction on maturation of cartilage discs in vivo.
Approach:
To induce disc formation, hMSCs were compacted in transwell inserts on
membranes with or without ECM coating at different seeding densities. The ability of the
self-assembling hMSCs to form discs and the properties of the discs formed under
different conditions were assessed. Discs and pellets were evaluated for compositional
and organizational differences in vitro and in vivo. The effects of prolonged chondrogenic
induction on maturation of cartilage discs in vivo were studied by culturing discs for
different lengths of time prior to implantation.
16
Aim 3: Improve the organization and stability of cartilage discs by implementing
spatiotemporal regulation during induction
Rationale
Cartilage development is regulated by complex crosstalk among multiple
signaling pathways and across different tissue zones. This results in cartilage
maintenance in the superficial zone, proliferation of chondrocytes in the middle zone and
hypertrophic maturation of chondrocytes leading to mineralization in the deep zone.
However, current methods to grow cartilage in vitro rely on isotropic culture which fails
to recapitulate spatiotemporal gradients present natively. Consequently, cartilage
engineered from hMSCs was prone to turnover and failed to retain organization
resembling the native articular cartilage upon implantation. This aim investigated the
effects of spatiotemporal regulation in vitro on the function, organization and stability of
cartilage engineered from hMSCs, and showed that spatiotemporal regulation in vitro
recapitulated some aspects of native development and promoted physiologic likeness.
Approach
Cartilage discs were formed in transwell inserts by compacting multiple layers of
hMSCs and maintained in isotropic culture or dual compartment culture. Concurrent
maintenance of hyaline cartilage and deep zone mineralization were induced via selective
application of key trophic factors in the dual compartment culture. Discs formed under
spatiotemporal regulation were evaluated in vitro and in vivo, and compared with control
discs formed in isotropic culture.

17
Chapter 3
Subcutaneous implantation in mice as an ectopic model
for studying osteochondral tissues in vivo
3.1 Abstract
Subcutaneous implantation in a mouse can be used to investigate tissue
maturation in vivo. Here, we demonstrate that this simple model can recapitulate
endochondral ossification associated with native skeletal development. By histological
and µCT analysis, we investigated morphological changes of immature bovine
osteochondral tissues over the course of subcutaneous implantation in
immunocompromised mice for up to 10 weeks. We observed multiple similarities
between the ectopic process and native endochondral ossification: (i) permanent cartilage
retention in the upper zones, (ii) progressive loss of transient cartilage accompanied by
bone formation at the interface, and (iii) remodeling of nascent endochondral bone into
mature cancellous bone. Importantly, these processes were mediated by
osteoclastogenesis and vascularization, and modulated by inflammation. Taken together,
these findings advance our understanding of how the simple ectopic model can be used to
study phenotypic changes associated with endochondral ossification of native and
engineered osteochondral tissues in vivo.

18
3.2 Introduction
The articular cartilage consists of a superficial zone that forms permanent
cartilage and a transient deep zone originating from the developing epiphysis that
undergoes endochondral ossification prior to skeletal maturity [2]. During endochondral
ossification, chondrocytes at the cartilage-bone interface stop proliferating, differentiate
and hypertrophy before calcifying [51]. Subsequently, the calcified cartilage forms a
template for bone formation by osteoprogenitors [52]. To develop a model for
understanding the in vivo maturation of osteochondral tissues, we were interested if
subcutaneous implantation in mouse can recapitulate endochondral ossification
associated with native skeletal development.
Subcutaneous implantation in a mouse is a model commonly used to evaluate
biocompatibility and tumorigenicity [53, 54], and also to study the in vivo fate of cells in
cartilage or bone [44, 55-57]. In this model, articular chondrocytes formed stable
cartilage whereas growth plate chondrocytes underwent endochondral ossification [44,
49, 58, 59]. Instead, mesenchymal stem cells (MSC) formed fibrous tissue or underwent
endochondral ossification, depending on the extent of in vitro chondrogenic
differentiation [44, 50]. Interestingly, MSC formed cartilage that resembled a fracture
callus with prolonged chondrogenic differentiation, and underwent endochondral
ossification reminiscent of that seen during native long bone repair [45-47]. Such insights
have motivated new strategies in bone tissue engineering for healing long bone defects
[48].
19
Although subcutaneous implantations of cartilage and bone are well documented,
no study has yet investigated the ectopic fate of osteochondral tissue. We hypothesized
that subcutaneous implantation can cause phenotypic changes in immature osteochondral
tissues that recapitulate endochondral ossification associated with skeletal development.
Specifically, we investigated if the following developmental features can be
recapitulated: (i) the retention of permanent cartilage in the upper zone, (ii) the
progressive replacement of transient cartilage by bone at the interface, and (iii) the
remodeling of the nascent endochondral bone into mature cancellous bone.
To test our hypothesis, we studied the changes in juvenile bovine osteochondral
tissues implanted subcutaneously in immunocompromised mice for up to 10 weeks. By
analyzing morphological changes, we show that subcutaneous implantation in mouse can
indeed cause the replacement of cartilage by endochondral bone at the interface in
immature osteochondral tissues, in a process that recapitulates endochondral ossification
characterized by cartilage and bone turnover, and extensive endochondral bone
remodeling. Notably, we identified osteoclastogenesis and vascularization as important
mediators, similar to the hallmarks of native endochondral ossification. Changes in the
expression of inflammatory markers were also observed over time. We also noted some
interesting differences in the fate of cartilage implanted with and without subchondral
bone components. Thus, we propose that that the simple ectopic model can be used to
study endochondral ossification of native and engineered osteochondral tissues.
20
3.3 Materials and Methods
3.3.1 Sample Preparation
Juvenile bovine osteochondral explants (4 mm in diameter) were obtained from
the femoral condyles of 2 month old bovine calves (Green Village Packing Company) by
drilling and rinsing with sterile phosphate buffer solution (PBS). Excess subchondral
bone was trimmed from the explants so that the length of the explants (cartilage and bone
inclusive) was approximately 9 mm.
Explants were incubated in PBS with 2% antibiotic-antimycotic at 37˚C for an
hour to ensure sterility. Subsequently, two identical axial sections measuring 4 mm x
1mm x 9 mm were sectioned from each osteochondral cylinder (Fig. 4-1). Prior to
implantation, the sections were cultured for 2 days in high-glucose Dulbecco’s modified
Eagle’s medium (DMEM) supplemented with 10% fetal bovine serum (FBS) and 1%
antibiotic-antimycotic. For histological comparison, osteochondral tissues from skeletally
mature cows (2 year old) were also obtained by slicing with a band saw.
For comparison between pre and post implantations, one section from each
explant was fixed in 10% formalin and kept for subsequent analysis while the other one
was rinsed in PBS just before implantation. To investigate the role of the subchondral
components, subchondral bone marrow was removed some osteochondral tissues by
sterile flushing as described previously, and cartilage explants were also prepared by
removing the whole subchondral bone [17].

21
3.3.2 Subcutaneous Implantation in SCID Mice
Animal study was done following an IACUC approved protocol at Columbia
University. Explants were implanted into subcutaneous pouches of female SCID mice
aged 8-10 weeks (Jackson Laboratory). Two incisions were prepared on the backs of the
mice, and a blunt forceps was used to create a pocket in the subcutaneous space inserting
the explant sections. After implantation, wounds were closed with two sutures and mice
were monitored daily. No signs of discomfort were observed following surgery in any of
the experimental animals throughout the study. Samples were explanted at 4 weeks and
10 weeks, fixed in 10% formalin and analyzed. All animal experiments followed federal
guidelines and were conducted under a protocol approved by the Columbia University
Animal Care and Use Committee.
Figure 3-1. Experimental design. 4mm diameter cylindrical cores were harvested from juvenile (2 month
old) bovine femoral condyles and sectioned in the axial direction into 1mm slices. One slice from each core
was fixed for analysis and one slice was implanted subcutaneously in immunocompromised mouse for 4
weeks or 10 weeks.

22
3.3.3 Histologic Evaluation and Analysis
All samples were fixed in 10% formalin for 24 hours, and except for cartilage-
only samples, decalcified using Immunocal (Fisher Scientific). Subsequently, samples
were dehydrated in ethanol, embedded in paraffin and sectioned to 5 µm thick. Sections
were stained for (i) Hematoxylin and Eosin (H&E), (ii) Movat’s Pentachrome, (iii) Von
Kossa with Nuclear Fast Red, or (iv) tartrate resistant acid phosphatase (TRAP) with 1%
Alcian Blue (pH 1.0). All reagents unless otherwise specified were from Sigma, Aldrich.
Immunohistochemical analyses were performed using the following antibodies:
type X collagen (Abcam, U.S.A.), PDGF-BB (Abcam), and CD31 (BD Pharmingen,
U.S.A.). Dilutions of antibodies were prepared as recommended by manufacturers
(1/1000 for type X collagen, 1/100 for PDGF-BB and CD31, and 1/500 for iNOS and
Arginase-1). Antigen retrieval was performed with pronase E and hyaluronidase
treatment for type X collagen, and 10 mM citrate buffer (pH 6.0) for all other markers.
Sections were blocked with serum in PBS and incubated with primary antibody solution
overnight at 4 ˚C. Immunobinding was detected with biotinylated secondary antibodies
using the Vectastain ABC kit and sections were counterstained with hematoxylin (Vector
Laboratories). All images were acquired using an Olympus FSX-100 microscope. To
quantitatively compare staining, corresponding images were balanced and analyzed using
ImageJ (National Institutes of Health). TRAP and PDGF-BB stains were deconvoluted
using an ImageJ plugin, set to a threshold, and positively stained cells were counted as
particles (Fig. 3-2).
23
Figure 3-2. Image processing method for quantitatively comparing histological stains. Images of
immunostains were (A) deconvoluted using an ImageJ plugin to isolate the color of interest, (B)
thresholded to identify the cells and (C) cells were counted. Representative deconvoluted images and
particle counts are shown for the TRAP (A-C) and a PDGF-BB (D) stains.
3.3.4 Micro CT imaging (μCT) and morphological analysis
All samples were fixed in 10% formalin for 24 hours at room temperature.
Following fixation, the samples were rinsed in PBS. High-resolution three-dimensional
(3D) images were obtained for each sample using a VivaCT 40 system (SCANCO
Medical AG). The grayscale images were binarized using a global thresholding
technique. Standard morphological parameters such as the bone volume fraction (BVF)
and bone mineral density (BMD) were measured for each sample using the standard
morphological analysis software on the VivaCT 40 system. To obtain axial profiles of the
BVF and BMD, 200 µm thick segments were evaluated across the entire axial length of
the tissue samples (Fig. 3-3).
24
Figure 3-3. Method to determine spatial profiles of MD and BVF in the subchondral bone. MD and BVF of
200-µm segments were determined by manual contouring of each segment. Results were plotted with
respect to the length of the subchondral bone from bottom to top.
3.3.5 Individual Trabecular Segmentation (ITS)-based morphological analyses
A complete volumetric decomposition technique was applied to segment the
trabecular bone network into individual trabecular plates and rods, as in our previous
studies [18, 19]. Briefly, the surface and curve skeleton of the trabecular bone
microstructure were first extracted through an iterative thinning process, while preserving
the topology and morphology of the original microstructure. Then, the entire skeleton
was decomposed into individual plate and rod skeletons, with each skeletal voxel
uniquely identified as either a plate or a rod, based on digital topological classification,
using an iterative reconstruction method.
25
The plate- and rod-specific morphological parameters of the trabeculae were
measured as follows. Plate and rod tissue fraction (pBV/BV and rBV/BV) were
calculated as the total volume of plate and rod bone volume divided by the total bone
volume. The number of plates and rods was quantified by the corresponding number
densities (pTb.N and rTb.N, mm−1). The average size of plates and rods was quantified as
the plate and rod thicknesses (pTb.Th and rTb.Th, mm), plate surface area (pTb.S, mm2),
and rod length (rTb.L, mm). The intactness of the trabecular network was characterized
by the plate–plate, plate–rod, and rod–rod junction density (P-P, P-R, and R-R Junc.D,
mm−3), calculated as the total number of junctions between trabecular plates or rods per
unit volume.
3.3.6 Statistical Analysis
The results of quantitative μCT analysis and semi-quantitative image analysis
were presented as a mean ± SEM (n=4). Statistical analysis was performed with Prism
(GraphPad, U.S.A.) using the Student t-test with the Holm-Sidak correction for multiple
comparisons, one-way ANOVA with Tukey post hoc analysis, or two way ANOVA with
Bonferroni post hoc analysis (α=0.05). The p-values were reported for statistically
significant differences between the groups.

26
3.4 Results
3.4.1 Juvenile osteochondral tissues undergo endochondral ossification during ectopic
implantation
Native juvenile osteochondral tissues were harvested from bovine femoral
condyles and implanted subcutaneously in immunocompromised mice for 4 weeks and
10 weeks (Fig. 3-1). Following implantation, the osteochondral tissues displayed
cartilage retention in the upper zone and endochondral bone formation in the deep zone,
in continuity with the pre-existing subchondral bone (Fig. 3-4). The replacement of
cartilage by bone at the interface progressed axially towards the articular surface.
Figure 3-4. Representative H&E stains of osteochondral sections at day 0, and after 4 weeks and 10 weeks
of subcutaneous implantation, and of a skeletally mature cow (2 year old). Articular cartilage and
subchondral bone are denoted as AC and SB. Deep zone cartilage was replaced by endochondral bone at
the interface. Trabeculation was nascent in the subchondral bone at 4 weeks and well established at 10
weeks. Scale bar: 200 µm.

27
There was no significant change in the total length of the graft, suggesting a lack
of interstitial cartilage growth during the implantation (Fig. 3-5). Most endochondral
bone formation occurred over the first 4 weeks of implantation, by which time the
cartilage length decreased and the bone length increased by approximately 1.2 mm each.
In comparison, the corresponding change in the cartilage length (decrease) and bone
length (increase) were 2 mm each over the total of 10 weeks of implantation (Fig. 3-5).
Figure 3-5. Changes in tissue length and composition. (Top) Representative photographs of whole tissue
sections at day 0, after 4 weeks and 10 weeks of implantation. Scale bar: 1 mm. (Bottom) Length of
cartilage determined from representative histologies, and length of bone determined by µCT analysis,
showing osteochondral tissue composition before and after implantation. Cartilage length decreased and
bone length increased apparently by 4 weeks, and significantly at 10 weeks, respectively (n=4).

28
Morphological analysis revealed that hypertrophic chondrocytes were initially
abundant at the interface, but their presence was markedly reduced by 4 weeks following
implantation and was barely visible after 10 weeks of implantation. Similarly, the
expression of type X collagen at the interface was observed at day 0 and after 4 weeks
but attenuated after 10 weeks of implantation (Fig. 3-6).
Figure 3-6. Representative type X collagen stains of osteochondral sections at day 0, after 4 weeks and 10
weeks of implantation. Hypertrophic chondrocytes (indicated by red arrowheads) were observed initially at
the interface, but diminished over time. Scale bar: 200 µm.
Using osteochondral tissue explanted from a skeletally mature animals (2 year old
cows) as a benchmark, we found that ectopic implantation did not progress to the extent
of native skeletal maturity. The final cartilage thickness (~4 mm) did not reach that of a
fully mature native articular cartilage (~2 mm), suggesting ectopic implantation
recapitulated the early but not the final stages of endochondral ossification reminiscent of
native skeletal development. High turnover of cartilage and bone over the first 4 weeks
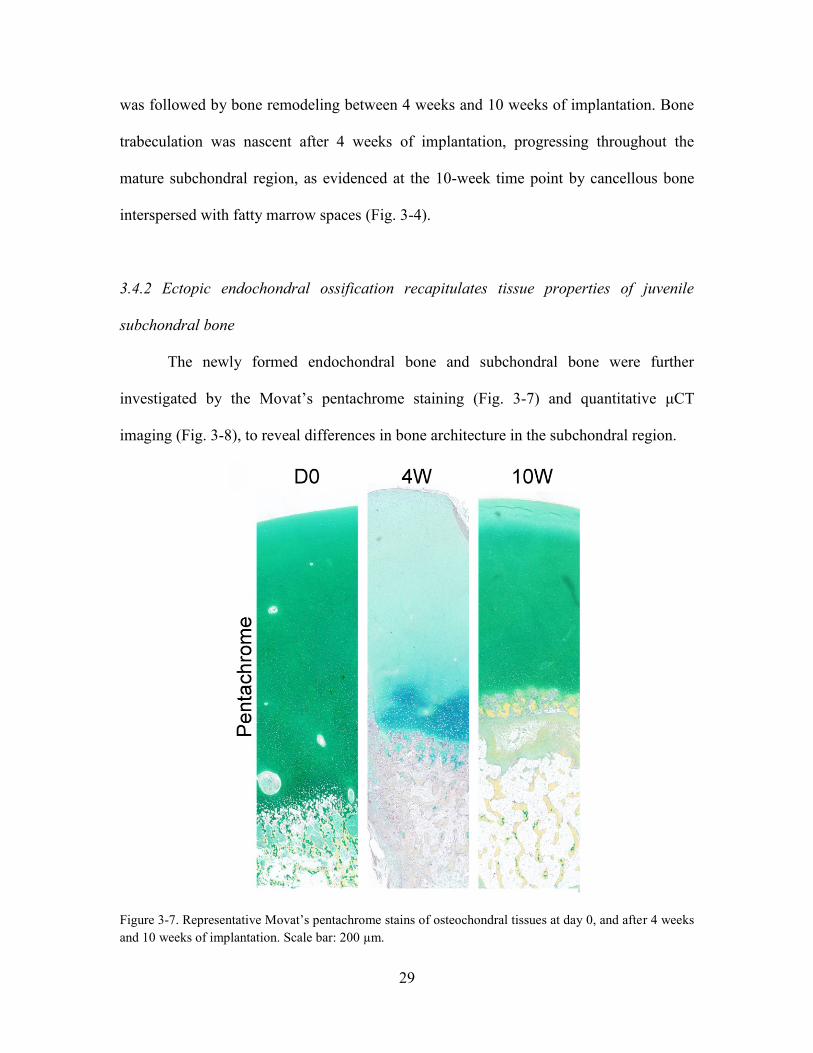
29
was followed by bone remodeling between 4 weeks and 10 weeks of implantation. Bone
trabeculation was nascent after 4 weeks of implantation, progressing throughout the
mature subchondral region, as evidenced at the 10-week time point by cancellous bone
interspersed with fatty marrow spaces (Fig. 3-4).
3.4.2 Ectopic endochondral ossification recapitulates tissue properties of juvenile
subchondral bone
The newly formed endochondral bone and subchondral bone were further
investigated by the Movat’s pentachrome staining (Fig. 3-7) and quantitative μCT
imaging (Fig. 3-8), to reveal differences in bone architecture in the subchondral region.
Figure 3-7. Representative Movat’s pentachrome stains of osteochondral tissues at day 0, and after 4 weeks
and 10 weeks of implantation. Scale bar: 200 µm.
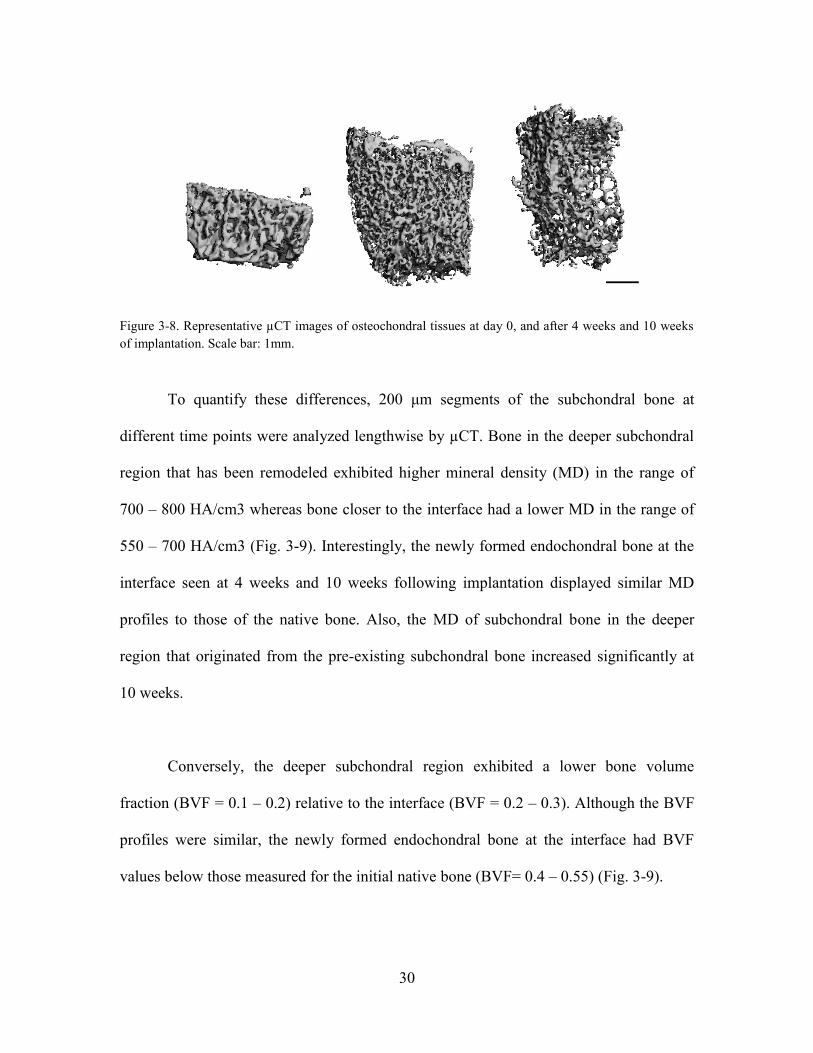
30
Figure 3-8. Representative µCT images of osteochondral tissues at day 0, and after 4 weeks and 10 weeks
of implantation. Scale bar: 1mm.
To quantify these differences, 200 μm segments of the subchondral bone at
different time points were analyzed lengthwise by µCT. Bone in the deeper subchondral
region that has been remodeled exhibited higher mineral density (MD) in the range of
700 – 800 HA/cm3 whereas bone closer to the interface had a lower MD in the range of
550 – 700 HA/cm3 (Fig. 3-9). Interestingly, the newly formed endochondral bone at the
interface seen at 4 weeks and 10 weeks following implantation displayed similar MD
profiles to those of the native bone. Also, the MD of subchondral bone in the deeper
region that originated from the pre-existing subchondral bone increased significantly at
10 weeks.
Conversely, the deeper subchondral region exhibited a lower bone volume
fraction (BVF = 0.1 – 0.2) relative to the interface (BVF = 0.2 – 0.3). Although the BVF
profiles were similar, the newly formed endochondral bone at the interface had BVF
values below those measured for the initial native bone (BVF= 0.4 – 0.55) (Fig. 3-9).
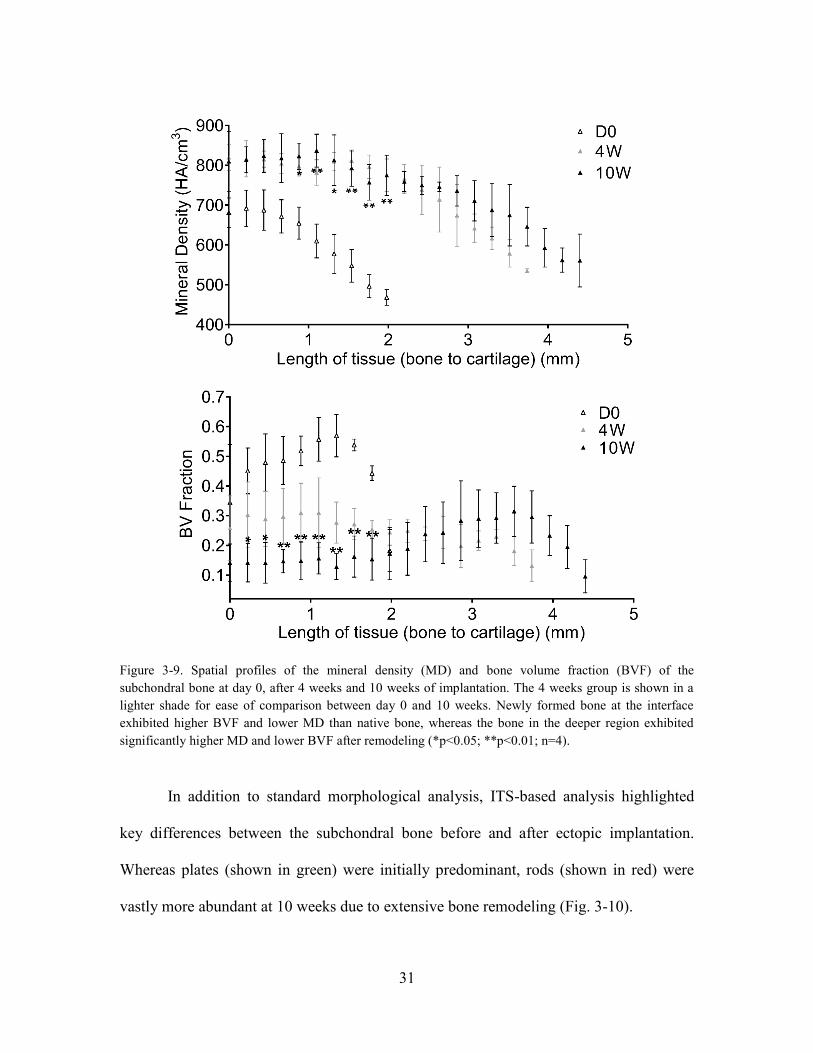
31
Figure 3-9. Spatial profiles of the mineral density (MD) and bone volume fraction (BVF) of the
subchondral bone at day 0, after 4 weeks and 10 weeks of implantation. The 4 weeks group is shown in a
lighter shade for ease of comparison between day 0 and 10 weeks. Newly formed bone at the interface
exhibited higher BVF and lower MD than native bone, whereas the bone in the deeper region exhibited
significantly higher MD and lower BVF after remodeling (*p<0.05; **p<0.01; n=4).
In addition to standard morphological analysis, ITS-based analysis highlighted
key differences between the subchondral bone before and after ectopic implantation.
Whereas plates (shown in green) were initially predominant, rods (shown in red) were
vastly more abundant at 10 weeks due to extensive bone remodeling (Fig. 3-10).

32
Figure 3-10. Visualization of plates (green) and rods (red) identified from µCT images of osteochondral
tissues at day 0 and 10 weeks. Plates were predominant at day 0, whereas rods where predominant at 10
weeks
Figure 3-11. ITS-based analysis showed significant decrease in the plate volume and density, increase in
the rod volume and density, and increase in the rod-rod junction density (****p<0.001; n=4).

33
This was documented by the decreasing bone volume fraction of plates (pBV/BV
= 0.76 to 0.22) and increasing volume fractions of rods (rBV/BV = 0.24 to 0.78).
Similarly, the density of plates decreased from 3.79 mm-1 to 2.24 mm-1 while the
density of rods increased from 3.32 to 4.17 mm-1 (Fig. 3-11). Besides substantial
decrease in the density of junctions between plates and between plates and rods (P-P and
P-R), the junction density between rods (R-R) also increased (from 16 to 62 mm-1).
Consistently, the plate surface area (pTb.S) and the trabecular thickness (pTb.Th and
rTb.Th) also decreased, whereas the rod length (rTb.l) increased.
3.4.3 Osteoclastogenesis and vascularization mediate ectopic endochondral ossification
TRAP staining revealed a vast presence of TRAP+ cells after 4 weeks of
implantation that was attenuated by 10 weeks (Fig. 3-12). Comparing multiple regions
across multiple samples, the number of TRAP+ cells in the subchondral bone decreased
significantly by more than 70% from 4 weeks to 10 weeks following implantation (Fig.
3-13). As mononuclear TRAP+ cells (pre-osteoclasts) form larger multinuclear cells
(osteoclasts) during osteoclastogenesis, we counterstained TRAP with DAPI and
compared pseudo-colored stains to detect increased presence of large multinuclear
osteoclasts [60]. Corresponding to the greater number of TRAP+ cells, the TRAP-stained
areas that are indicative of the osteoclast maturation were significantly larger at 4 weeks
than at 10 weeks following implantation (Fig. 3-13). Notably, the numbers of large
TRAP+ cells at the interface were also higher at the 4-week than 10-week time point.
Taken together, these data suggest the early osteoclastogenesis mediated greater cartilage
resorption and bone turnover after 4 weeks than after 10 weeks of implantation.

34
Figure 3-12. Representative stains of TRAP with Alcian Blue of osteochondral sections at day 0, and after
4 weeks and 10 weeks of implantation. Magnified images with pseudo-colored nuclear counterstains
(DAPI) are shown in the right panels. TRAP+ cells were more abundant at 4 weeks than at 10 weeks
following implantation. Large, multi-nuclear TRAP+ cells (indicated by red arrowheads) seen at 4 weeks
indicate the presence of mature osteoclasts mediating cartilage resorption and bone remodeling. Scale bars:
200 µm (main images) and 100 µm (magnified images).
Figure 3-13. Quantitative analysis of TRAP stains. The number of TRAP+ cells and average stain area of
TRAP+ cells were significantly higher at 4 weeks than at 10 weeks following implantation (n=4).
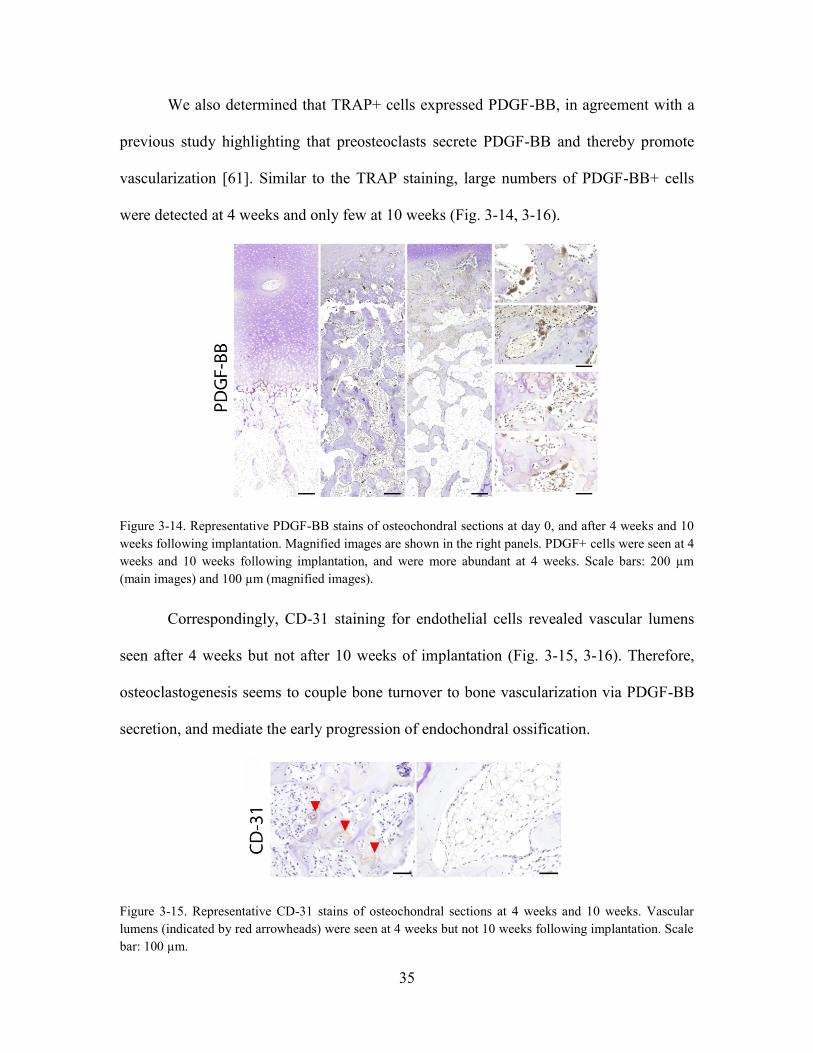
35
We also determined that TRAP+ cells expressed PDGF-BB, in agreement with a
previous study highlighting that preosteoclasts secrete PDGF-BB and thereby promote
vascularization [61]. Similar to the TRAP staining, large numbers of PDGF-BB+ cells
were detected at 4 weeks and only few at 10 weeks (Fig. 3-14, 3-16).
Figure 3-14. Representative PDGF-BB stains of osteochondral sections at day 0, and after 4 weeks and 10
weeks following implantation. Magnified images are shown in the right panels. PDGF+ cells were seen at 4
weeks and 10 weeks following implantation, and were more abundant at 4 weeks. Scale bars: 200 µm
(main images) and 100 µm (magnified images).
Correspondingly, CD-31 staining for endothelial cells revealed vascular lumens
seen after 4 weeks but not after 10 weeks of implantation (Fig. 3-15, 3-16). Therefore,
osteoclastogenesis seems to couple bone turnover to bone vascularization via PDGF-BB
secretion, and mediate the early progression of endochondral ossification.
Figure 3-15. Representative CD-31 stains of osteochondral sections at 4 weeks and 10 weeks. Vascular
lumens (indicated by red arrowheads) were seen at 4 weeks but not 10 weeks following implantation. Scale
bar: 100 µm.

36
Figure 3-16. Quantitation of PDGF-BB and CD-31 stains. The numbers of PDGF-BB+ cells and CD-31+
area were significantly greater at 4 weeks than at 10 weeks (n=4).
3.4.4 Host cells populate the subchondral space and drive endochondral ossification
To decouple the roles of host and graft cells, similar implantation studies were
conducted with osteochondral tissues stripped of marrow cells in the subchondral bone
prior to implantation, and using cartilage-only tissues. Earlier comparisons revealed that
pre-implanted tissues had residual graft-derived marrow cells in the subchondral bone,
and it was unclear if these cells or the host cells were driving endochondral ossification.
Thus, the cells were completely removed from the subchondral bone using saline buffer
and the implantation outcomes were evaluated. Prior to implantation, it was evident that
the cells, except for osteocytes, were not present in the subchondral bone. The vacant
subchondral bone was infiltrated by the host cells over 4 weeks of implantation (Fig. 3-
17A). In line with the other data, endochondral ossification was apparent as the
replacement of cartilage by bone progressed from the interface (Fig. 3-17B). Bone length
at 4 weeks increased and cartilage length decreased by a similar amount (Fig. 3-17C).
Notably, the cartilage-only tissues did not undergo endochondral ossification.
Instead, the deep zone hypertrophic chondrocytes at day 0 mineralized to form distinct
zone of calcified cartilage at 4 weeks without visible bone formation (Fig. 3-17D). Our

37
results suggest that host cells populate the subchondral space and drive endochondral
ossification, and confirm that native cartilage is resistant to endochondral ossification
during ectopic implantation despite deep zone mineralization.
Figure 3-17. Host cells populate the subchondral bone and drive endochondral ossification. (A)
Representative H&E stains of osteochondral sections at day 0 and at 4 weeks following implantation.
Sections were stripped of bone marrow (BM) cells in the subchondral bone prior to implantation by sterile
rinsing. Magnified images are shown in the right panels. The subchondral bone was densely populated with
cells at 4 weeks, indicating host involvement. Scale bar: 200 µm. (B) Representative µCT images of
osteochondral sections at day 0 and at 4 weeks following implantation showing new endochondral bone
formation and subchondral bone remodeling. (C) The lengths of cartilage (determined from representative
histologies) and bone (determined by µCT analysis) showing osteochondral tissue composition before and
after implantations. Cartilage length decreased and bone length increased markedly by 4 weeks following
implantation (n=4). (D) Implantation outcomes of cartilage-only grafts. H&E and Von Kossa stains at day 0
and after 4 weeks of implantation. Hypertrophic chondrocytes mineralized during implantation without
visible endochondral bone formation. Scale bar: 200 µm.
3.4.5 Macrophages selectively regulate cartilage and bone turnover
To investigate the role of inflammation on ectopic endochondral ossification, we
stained samples at 4 weeks and 10 weeks for markers associated with classically (M1)

38
and alternatively (M2) activated macrophages, inducible nitric oxide synthase (iNOS)
and arginase 1 (Arg-1). Corresponding to the greater turnover and number of TRAP+
cell, both iNOS+ and Arg-1+ cells were more prevalent at 4 weeks than at 10 weeks. In
particular, iNOS+ cells were seen extensively in the subchondral bone region at 4 weeks
but not at 10 weeks. Arg-1+ cells were also extensive at 4 weeks, especially near the
interface where deep zone cartilage was being replaced by endochondral bone. In the
subchondral region, Arg-1+ cells lined the surface the trabecular bone.
Figure 3-18. Macrophages selectively regulate cartilage and bone turnover. (Left) Cells expressing
classically activated (M1) marker iNOS were observed extensively at the interface as well as in the
subchondral bone region at 4 weeks. At 10 weeks, the presence of iNOS+ cells persisted near the interface
but attenuated in the subchondral bone. (Right) Cells expressing alternatively activated (M2) marker Arg-1
were observed extensively at 4 weeks, especially at the interface. At 10 weeks, Arg-1+ cells were abundant
near the interface and lined the newly formed endochondral bone in the subchondral region.
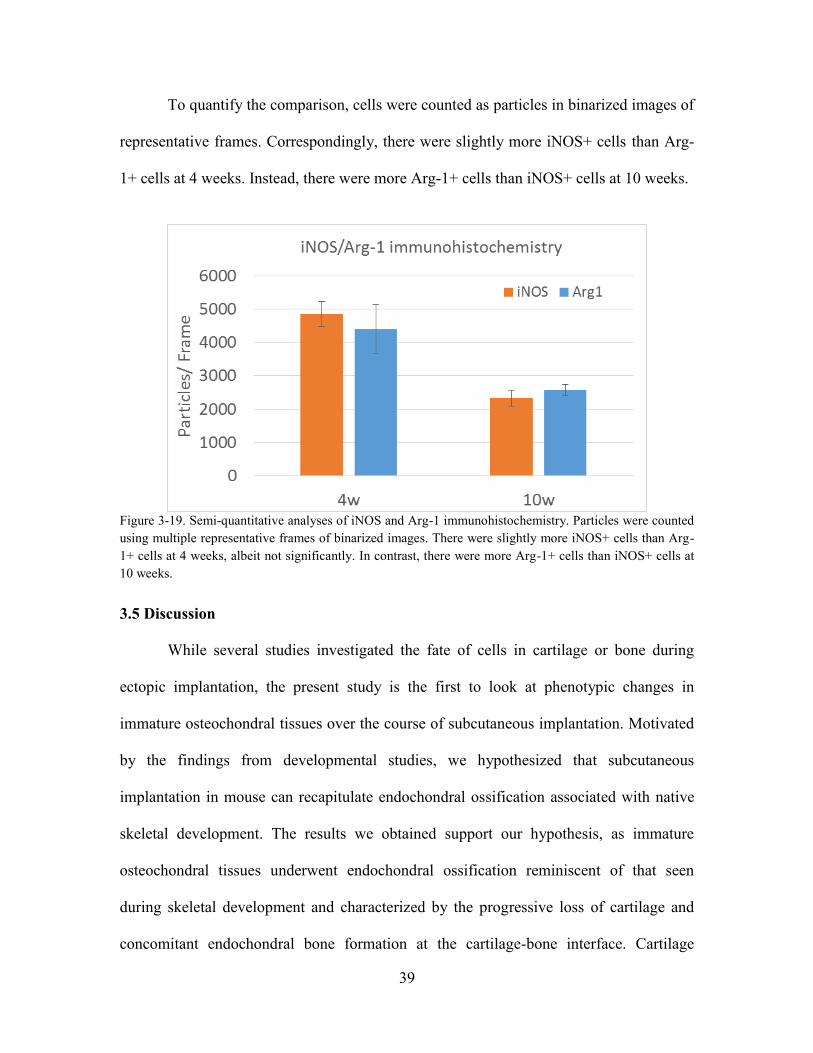
39
To quantify the comparison, cells were counted as particles in binarized images of
representative frames. Correspondingly, there were slightly more iNOS+ cells than Arg-
1+ cells at 4 weeks. Instead, there were more Arg-1+ cells than iNOS+ cells at 10 weeks.
Figure 3-19. Semi-quantitative analyses of iNOS and Arg-1 immunohistochemistry. Particles were counted
using multiple representative frames of binarized images. There were slightly more iNOS+ cells than Arg-
1+ cells at 4 weeks, albeit not significantly. In contrast, there were more Arg-1+ cells than iNOS+ cells at
10 weeks.
3.5 Discussion
While several studies investigated the fate of cells in cartilage or bone during
ectopic implantation, the present study is the first to look at phenotypic changes in
immature osteochondral tissues over the course of subcutaneous implantation. Motivated
by the findings from developmental studies, we hypothesized that subcutaneous
implantation in mouse can recapitulate endochondral ossification associated with native
skeletal development. The results we obtained support our hypothesis, as immature
osteochondral tissues underwent endochondral ossification reminiscent of that seen
during skeletal development and characterized by the progressive loss of cartilage and
concomitant endochondral bone formation at the cartilage-bone interface. Cartilage

40
retention was evident in the upper zone whereas all cartilage turnover occurred at the
interface and progressed axially towards the surface. Instead, previous studies reported
that ectopic implantation of callus-like cartilage formed from MSC resulted in bone
formation at the surface and cartilage loss that progressed into the bulk of the tissue.
We also noted several interesting differences between the ectopic and the native
processes. Despite the steady progression of endochondral ossification, there was no
increase in the graft size, suggesting a lack of interstitial cartilage growth. During skeletal
development, cartilage thickens as chondrocytes proliferate and deposit matrix prior to
terminal differentiation. This process is regulated by the signaling crosstalk between
multiple pathways such as bone morphogenetic protein (BMP) and Wingless (Wnt), and
signaling feedback such as that between parathyroid hormone-related peptide (PTHrP)
and Indian Hedgehog (Ihh) [51, 52]. In ectopic environment, the lack of trophic factor
gradients might have disrupted signaling crosstalk and feedback between the multiple
pathways that are necessary for cartilage growth.
Similarly, the osteochondral tissue could have been subjected to supranormal
oxygen tension in the vascularized subcutaneous environment across different cartilage
zones, which in turn could have disrupted cartilage growth. In addition, the extent of
endochondral ossification was also limited as its progression attenuated after 10 weeks of
subcutaneous implantation. Notably, the diminished presence of hypertrophic
chondrocytes, as indicated by cell morphology and type X collagen expression, at the
interface with prolonged implantation suggests that terminal differentiation of
41
chondrocytes was inhibited in the absence of native gradients of trophic factors.
Consequently, the final cartilage thickness did not reach that of mature native tissue. As
mice are known to reach skeletal maturity around 5 months of age, it is unlikely that the
skeletal maturity of the host affected morphogenesis of osteochondral grafts [62].
There were also similarities and differences in bone turnover between the native
and ectopic processes. Morphological comparisons (by μCT imaging and analysis)
revealed that the new endochondral bone exhibited similar BVF and MD profiles as the
native juvenile subchondral bone after bone remodeling. Just like the initial subchondral
bone, endochondral bone at the interface had a higher BVF and a lower MD than
cancellous bone in the deeper subchondral regions. These similarities suggest that
endochondral bone formed during ectopic endochondral ossification was also
progressively remodeled into mature cancellous bone.
Still, there were important differences in the quality of the cancellous bone and
the composition of the marrow within the trabeculae. ITS-based analysis revealed that
unlike the initial subchondral bone that was mostly composed of plates, the remodeled
bone following subcutaneous implantation was mostly composed of rods. The prevalence
of rods is reminiscent of osteoporosis and indicative of pathological bone remodeling. As
mechanical loading affects bone maturation, it is likely that the lack of physiologic
loading resulted in adverse bone remodeling and the formation of cancellous bone of
subnormal properties [63]. Trabecular bone microstructure and mechanical properties
vary among different skeletal sites [64-66]. We confirmed in our earlier studies such

42
differences in trabecular plate-rod microstructures among different anatomic locations,
and found their dependence on local mechanical environment [67]. In addition, the
marrow that filled the spaces between the trabeculae during later stages of implantation
was fatty and not hematopoietic. Because adipocytes limit hematopoiesis and cause fatty
marrow formation, it is likely that the access of cells from the adipocyte-rich hypodermis
enabled fatty marrow formation and inhibited hematopoiesis [68, 69].
Besides morphological comparisons, we also identified osteoclastogenesis and
vascularization as important mediators of ectopic endochondral ossification. Initial
progression of endochondral ossification was characterized by a vast presence of
mononuclear pre-osteoclasts and mature multinuclear osteoclasts. TRAP staining was
evident at 4 weeks throughout the subchondral bone, particularly at the interface where
cartilage was resorbed and endochondral bone was formed. Concomitantly,
vascularization was evident at site of bone formation. Attenuation of endochondral
ossification at 10 weeks post-implantation correlated with the diminished presence of
pre-osteoclasts, osteoclasts and vasculature. Motivated by recent studies showing that
PDGF-BB couples bone formation and angiogenesis, we studied PDGF-BB expression
and found that the results mirrored those of TRAP staining [61, 70]. Our data suggest that
PDGF-BB mediated early endochondral ossification during ectopic implantation by
coupling osteoclastogenesis with vascularization.
By stripping osteochondral tissues of the subchondral bone marrow and
comparing their implantation outcome with that of intact osteochondral tissues, we found

43
that cells populated the subchondral space to drive endochondral ossification with or
without pre-existing bone marrow. Interestingly, we also implanted cartilage-only tissues
and found that they did not undergo endochondral ossification but instead mineralized in
the deep zone. This suggests that the subchondral bone was necessary for the recruitment
of hematopoietic and vascular cells in the ectopic environment to initiate endochondral
ossification via a mineralized cartilage template. Recent developmental studies using
tamoxifen-inducible genetic recombination and in situ hybridization challenged the
paradigm that hypertrophic chondrocytes undergo apoptosis during endochondral
ossification, by showing that they can become osteoblasts via transdifferentiation [71,
72]. Still, based on the findings from this study, we propose that the host cells populate
the subchondral space and potentiate ectopic endochondral ossification as there has been
no evidence that chondrocytes or osteocytes are capable of transdifferentiating into cells
of hematopoietic or vascular origin.
To investigate the role of inflammation, we stained for markers associated with
different macrophage phenotypes. Macrophages are broadly classified into classically
activated (M1) and alternatively activated (M2) phenotypes [73]. M1 macrophages kill
intracellular pathogens by converting arginine into nitric oxide (NO) via iNOS. Instead,
M2 macrophages inhibit NO production by converting arginine into ornithine, a precursor
of hydroxyproline and polyamines [74-76]. Thus, M2 macrophages are associated with
repair and implicated in the wound healing response [74, 76, 77] However, the effects of
iNOS and Arg-1 on bone and cartilage turnover are not clear. Whereas one study found
that NO autoregulate osteoclastogenesis mediated by receptor activator of nuclear factor

44
kappa-B (NFκB) ligand (RANK-L), another study found that bone resorption mediated
by NFκB is dependent on IL-1 induction and activation of iNOS [78, 79]. In this study,
we found that extensive presence of iNOS+ cells at the interface and subchondral region
correlated with high bone and cartilage turnover at 4 weeks, as well as the extensive
presence of TRAP+ osteoclasts. Previous studies reported that high NO production due to
Arg-1 knockdown resulted in enhanced osteoclast differentiation, which suggests that
Arg-1 is a negative regulator of osteoclast differentiation and bone resorption. Addition
of recombinant Arg-1 was also shown to abolish RANK-L mediated osteoclast
differentiation [80]. In our study, we found a slightly greater presence of Arg-1+ cells
than iNOS+ cells at 10 weeks. Arg-1+ cells populated the interface and lined the newly
formed bone in the subchondral region. This could be indicative of anabolic activity and
negative regulation of bone resorption following early tissue turnover [74]. This also
agrees well with M1 to M2 transition which is characteristic of bone healing during
fracture repair [81]. Interestingly, osteoclasts reciprocally suppress the immune response
via crosstalk with T-cells [82]. Although the mice used for this study were
immunocompromised, it is likely that autoregulation occurred reciprocally between
macrophages and osteoclasts as both the presence of iNOS+ and Arg-1+ cells attenuated
by 10 weeks, similar to TRAP+ osteoclasts.
Despite showing the usefulness of the ectopic model for investigating
development of juvenile osteochondral tissues, the present study has limitations. For
example, we did not study the expression of other characteristic markers associated with
endochondral ossification such as MMP-13. Despite borrowing mechanistic evidence

45
from native developmental studies, we showed only correlation but not causality, which
would require rigorous gain and loss of function experiments. This is true for establishing
the importance of osteoclastogenesis, vascularization and inflammation associated with
differential macrophage response. Although the lack of transdifferentiation evidence
suggests that host cells populate the subchondral bone and potentiate ectopic
endochondral ossification, we did not track cell lineages and thus could not accurately
define the contribution of host and graft cells towards phenotypic changes.
Future studies could help gain insights into the mechanism of ectopic
endochondral ossification. For example, the reversibility of the adverse subchondral bone
remodeling can be probed by administering the mice with bisphosphonates. In situ
hybridization could clarify the origin and fate of different cell types during ectopic
endochondral ossification of osteochondral tissues. With further mechanistic
understanding, the utility of this model can also be extended towards the evaluation of
tissue-engineered osteochondral tissues in vivo prior to their orthotopic implantation in
large animal models.
3.6 Conclusion
This study shows that subcutaneous implantation of osteochondral tissues in a
mouse recapitulates endochondral ossification resembling that occurring during native
skeletal development. We observed the cartilage retention in the upper zone, and the
formation of endochondral bone progressing from the cartilage/bone interface towards
the cartilage surface. We show that the endochondral bone remodeled into mature

46
cancellous bone resembling the native subchondral bone. However, we also noted
several important differences between the ectopic and native processes, which could be
attributed to the inability of the ectopic process to recapitulate the native trophic and
mechanical factors. The lack of physiologic stimuli likely disrupted chondrocyte
differentiation and bone maturation.
Figure 3-20. Summary of ectopic implantation outcomes. Schematics illustrating that osteochondral tissues
comprising articular cartilage (AC) and subchondral bone (SB) with or without bone marrow (BM)
underwent endochondral ossification (EO) characterized by the replacement of cartilage by bone at the
interface. Instead, full-thickness cartilage mineralized in the deep zone but did not undergo EO.

47
3.7 Future Work
Transient cartilage in juvenile osteochondral tissues can undergo ectopic
endochondral ossification during subcutaneous implantation in mice. Thus, the
subcutaneous implantation model could be used to evaluate the in vivo stability and
maturation state of the engineered cartilage or osteochondral tissue.
In the subsequent chapters, studies summarized in Aim 2 (Chapter 4) and Aim 3
(Chapter 5) will utilize subcutaneous implantation to assess the in vivo outcomes of
cartilage tissues engineered from self-assembling hMSCs.
48
Chapter 4
Evaluation of cartilage discs grown from self-
assembling MSCs in vitro and in vivo
4.1 Abstract
Methods of cartilage formation by self-assembly of human mesenchymal stem
cells (MSCs) recapitulate important cellular events during mesenchymal condensation
that precedes native cartilage development. Here, we show that the cartilaginous
extracellular matrix (ECM) coating and the cell seeding density are important
determinants of functional cartilage disc formation by self-assembling hMSCs. Type I
collagen, expressed in the prechondrogenic mesenchyme, enabled disc formation and
enhanced early chondrogenesis. High cell seeding density improved tissue properties but
resulted in less frequent disc formation. Comparing the discs and the pellets, we
identified previously unreported compositional and organizational differences in vitro
and in vivo. Further, we found that prolonged chondrogenic induction of the discs in vitro
expedited endochondral ossification in vivo. These results demonstrate that the in vitro
and in vivo outcomes of cartilage formation by self-assembling MSCs can be modulated
by the control of culture parameters. Insights gained from this study could motivate new
directions for engineering cartilage and bone via a cartilage template from self-
assembling MSCs.

49
4.2 Introduction
The articular cartilage has limited capability for intrinsic healing due to its
avascular nature. Current approaches to treat focal cartilage lesions include autograft,
mosaicplasty and autologous chondrocyte implantation [7, 8]. However, these methods
are limited by donor site morbidity and the proliferative ability of chondrocytes. Thus,
there is an ongoing effort towards developing stem cell-based therapies for cartilage
regeneration [16].
In cartilage tissue engineering (TE), scaffolding materials have been successfully
used for cultivation and delivery of chondrocytes. However, scaffolding methods have
resulted in subnormal cartilage formation by MSCs – the most attractive cell source for
clinical application [27]. In contrast, self-assembly of MSCs recapitulated mesenchymal
condensation that precedes joint development, and enhanced the in vitro chondrogenesis
of MSCs [39-42].
In pellet culture, cells form spherical aggregates that deposit matrix and grow
over time [5, 6]. In disc culture, multiple layers of cells deposit matrix and form a disc
that grows in thickness over time [8, 9]. Cartilage formed in pellet culture of self-
assembling MSCs lacks physiological stratification and is not well suited for cartilage
repair due to its tendency to undergo endochondral ossification in vivo [3, 10, 11]. While
the pellet culture has been well established, the exact conditions for cartilage disc culture
are not known [37, 42]. In some cases, MSCs could not form discs due to the forces

50
associated with self-assembly (Table 4-1). It remains to be determined how the
conditions of MSC self-assembly in vitro affect cartilage fate in vivo.
Table 4-1. Summary of studies on disc culture of self-assembling chondrocytes or MSCs for in vitro
cartilage formation. In some cases, MSCs failed to form discs.
Cell Type Source
Density
(× 106/
mm2)
Insert
Type Substrate
Disc
Formation
(Yes/ No)
Thickness
(mm) Ref.
Chondrocytes Bovine
MCC joint
0.050 Millicell
PTFE
Type II
Collagen
Yes - [37]
Bovine
MCC joint
0.016 Millicell
PTFE
Type II
Collagen
Yes 0.3 [38]
Bovine
MCC joint
0.160 - CPP Yes 0.94 [83]
Sheep
MCC joint
0.160 - CPP Yes 0.5 [84]
Bovine
hock joint
0.067 Millicell
PTFE
Type II
Collagen
Yes 0.45 [85]
Bovine
MCC joint
0.033 Millicell
PTFE
Type II
Collagen
Yes - [86]
Bovine
distal femur
0.172 - Agarose Yes 0.15 [87]
Bovine
distal femur
0.289 - Agarose Yes 0.8 [88]
Human
femoral
cartilage
0.006 Millicell
PTFE
Type I/
Type II
Collagen
Yes 0.15 [89]
Human
articular
cartilage
0.102 - Agarose Yes 0.6 [90]
MSCs Human BM 0.015 Corning
PC
None Yes 0.8 [42]
Porcine
BM
0.392 Millicell
PET
None Yes 1.3 [91]
Human BM 0.015 Corning
PC
None No - [46]
Sheep BM 0.033 Millicell
PTFE
Type IV
Collagen
/CPP
Yes 0.5 [43]
Equine
cord blood
0.033 Millicell Fibronectin Yes 0.1 [92]
Human BM 0.102 - Agarose No - [90]
51
We hypothesized that (i) the membrane ECM coating and (ii) the cell seeding
density determine functional disc formation in vitro. To this end, we investigated if the
control of these two parameters would enable reliable formation of cartilage discs by self-
assembling MSCs. Further, we asked whether the in vivo fate of cartilage can be
modulated by the self-assembly regimen (disc versus pellet) and the length of in vitro
culture.
To test the hypotheses, we analyzed gene expression, biochemical, mechanical
and morphological changes of self-assembling human MSCs (hMSCs) in membrane
inserts with or without ECM coating, following chondrogenic induction at different cell
seeding densities. Further, we compared the composition and organization of the discs
and pellets in vitro and in vivo. Finally, we investigated the in vivo fate of discs cultured
under different durations in vitro. Overall, the study was designed to clarify the effects of
in vitro culture parameters on the in vitro properties and in vivo fate of cartilage formed
by self-assembling hMSCs.
4.3 Materials and Methods
4.3.1 Cell source and preparation
Fresh bone marrow aspirates were obtained from Cambrex and processed as in
our previous studies [41]. Bone-marrow–derived hMSCs were isolated and expanded to
the fifth passage in high glucose DMEM containing 10% fetal bovine serum, 1% Pen-
Strep and 1 ng/mL of fibroblast growth factor-2 (FGF-2). All reagents were from Life
Technologies, unless specified otherwise. At P5, hMSCs were seeded for experiments.

52
4.3.2 Cell seeding and differentiation
For chondrogenic differentiation, serum-free chondrogenic media consisting of
high glucose DMEM, ITS+ supplement (BD Biosciences), 5 mM L-proline, HEPES,
sodium pyruvate, dexamethasone, 50 μM ascorbic acid (Sigma Aldrich) and 10 ng/mL
transforming growth factor beta-3 (TGF-β3) (PeproTech) was used. All reagents were
from Life Technologies, unless otherwise specified.
For disc formation, 6.5 mm diameter transwell inserts with polycarbonate
membranes were used (Corning). To each transwell, 50 µL of vehicle (1mM acetic acid
with ethanol), 1.5 mg/mL type I collagen (BD Biosciences) or type II collagen (Elastin
Products) was added and the transwells were air dried overnight. Transwells were seeded
with hMSCs, loaded in 24-well plates, and centrifuged at 200g for 5 minutes. The next
day, chondrogenic media was added so that every transwell was fully submerged.
Medium was changed every 2 days for up to 6 weeks.
Figure 4-1. Self-assembly methods for cartilage formation by hMSCs. (A) Top, disc culture: hMSCs were
seeded in transwell inserts coated with vehicle control (Veh), type I collagen (Col1), or type II collagen
(Col2); Veh group failed to form discs. Bottom, pellet culture: hMSCs were seeded in round-bottom wells
and formed spherical aggregates. (B) Representative images of hyaline discs formed in coated transwells
are shown.
53
For pellet formation, 0.25×10⁶ hMSCs were seeded in a low-attachment round-
bottomed 96-well plate (Fisher Scientific), and the plates were centrifuged at 200g for 5
minutes. Medium was changed twice a week for up to 6 weeks. For implantation studies,
pellets were cultured for up to 10 weeks prior to implantation.
4.3.3 Subcutaneous Implantation in SCID Mice
For implantation studies, discs were cultured for 6 weeks, 8 weeks, or 10 weeks,
and pellets were cultured for 10 weeks prior to implantation. All animal experiments
followed federal guidelines and were conducted under a protocol approved by the
Columbia University Animal Care and Use Committee. Tissues were implanted into
subcutaneous pouches of 8-10 week old female SCID mice (Jackson Laboratory). Two
incisions were made on the back of each mice, and a blunt forceps was used to create a
pocket in the subcutaneous space into which the tissue samples were inserted. After
implantation, the skin was closed with two sutures, and mice were monitored daily. No
signs of discomfort were observed following surgery in any of the animals throughout the
study. Samples were explanted at 4 weeks and analyzed.
4.3.4 Histology and Immunohistochemistry
For histology, samples were fixed in 10% formalin for 24 hours, decalcified with
Immunocal (Fisher Scientific), dehydrated in ethanol, embedded in paraffin, and
sectioned to 5 µm. Sections were stained for (i) Hematoxylin and Eosin (H&E), (ii)
Alcian Blue with Nuclear Fast Red, (iii) Picosirius Red, and (iv) Movat’s pentachrome.
All reagents were from Sigma Aldrich, unless otherwise specified.

54
Immunohistochemistry was performed using the following antibodies: type I collagen,
type II collagen, type X collagen, lubricin, and osteopontin (Abcam, U.S.A). Sections
were processed according to manufacturer’s instructions. Immunobinding was detected
with biotinylated secondary antibodies using the Vectastain ABC kit (Vector
Laboratories). Images were acquired using an Olympus FSX-100 microscope (Olympus).
4.3.5 Mechanical testing
The compressive Young’s modulus of the cartilage was measured on samples
submerged in PBS using unconfined compression as described by a previous stud, with
some modifications [41]. From the tissue samples (n=4 per group), 3mm diameter discs
were cored using a biopsy punch. The disc thickness was measured by the position of
tissue contact to that of the platform. To achieve a very low strain rate, the cylindrical
constructs were compressed at a rate of 100 nm/s (∼0.02% strain per second) for up to
2,000 s, and the compressive load was measured.
Instead of determining the Young’s modulus by establishing equilibrium stress
values at different strains, the discs were loaded continuously at a very low strain rate and
the transient stress was measured at every increment. The transient stress was plotted
against strain at every increment, generating a stress-strain curve with 2000 data points
for each measurement. This enabled the identification of the elastic range during
compression loading from which the ramp modulus was calculated as the gradient of the
linear slope (20-30% strain). Full thickness cartilage discs were obtained from the tibial
plateau of 2-month old calves (Green Village Packing) to serve as a reference.

55
Due to the presence of interstitial fluid pressure, the articular cartilage exhibits a
stress-relaxation response and the Young’s modulus (approximately 0.5 MPa) determined
from equilibrium stress is ideal for assessing the structure function of the engineered
cartilage following fluid exudation [93]. However, the equilibrium response is not
physiological as it only occurs after hours of static loading. For this reason, investigators
have also studied the dynamic modulus of the articular cartilage to better understand its
mechanical response under physiological loading conditions. Displacement controlled
studies found that the dynamic moduli of the bovine articular cartilage at 1 Hz under
strain amplitudes of 0.5, 1, and 2.5% were 13, 20, and 37 MPa [94-96]. Similarly, a load
controlled study found that the incremental dynamic modulus at 0.1 Hz increased from
14.6 MPa at zero applied stress to 48.2 MPa at 4 MPa of applied stress [97]. Thus,
interstitial fluid pressurization in the articular cartilage results in a frequency and load
dependent mechanical response under cyclical loading at physiological frequencies
In our measurement, the ramp loading rate is similar to the first leg of a sawtooth
cyclical loading profile with an amplitude of 10% and a frequency of 0.0005 Hz.
Although this rate is sub-physiological (0.01 – 2 Hz), we tested for interstitial fluid
pressurization and found that the ramp modulus at 0.02%/s was approximately 2.7 times
that of the equilibrium modulus. Thus, there was significant interstitial fluid
pressurization. Still, this enabled us to compare the mechanical response of the
engineered and native cartilage. The biochemical composition of the engineered cartilage
correlated with the ramp modulus. Also, the ramp modulus of the engineered cartilage
was significantly lower but in the same order of magnitude as the native cartilage.

56
4.3.6 Biochemical analysis
DNA, sulfated glycosaminoglycan (GAG), and collagen (COL) contents were
measured as previously described (2). All reagents unless otherwise specified were from
Sigma Aldrich. Briefly, the samples (n = 4) were blotted dry and weighed. Subsequently,
the samples were digested in 0.5 mL proteinase K solution at 60 °C. With the sample
digests, the DNA content was determined using the Molecular Probes Picogreen assay
(Life Technologies). The GAG content of the sample digests was determined using the
1,9-dimethylmethylene blue (DMMB) dye calorimetric assay with chondroitin-6-sulfate
as a standard. The remaining sample digests were hydrolyzed at in 6 N hydrochloric acid
overnight and the hydroxyproline content, assumed to be 10% of the total collagen
content, was determined.
4.3.4 Gene expression analysis
Samples (n=4 per group) were crushed with pestles and homogenized by mixing
in the TRIzol reagent. RNA was extracted according to the manufacturer’s instructions
using the TRIzol method. The quantity of RNA was measured on the Nanodrop ND1000
(Fisher Scientific). Following treatment with DNase I removal kit, cDNA synthesis was
performed using the Applied Biosystems High Capacity kit according to the
manufacturer’s instructions. Quantitative RT-PCR analysis was done using 20 ng cDNA
per reaction and the Applied Biosystems SYBR® Green PCR Master Mix. All primers
(Table 4-2) were synthesized by Life Technologies. The expression of target genes was
normalized to the housekeeping gene GAPDH (2-∆Ct) and calculated from the mean CT
values of technical duplicates for each sample. All reagents were from Life Technologies.
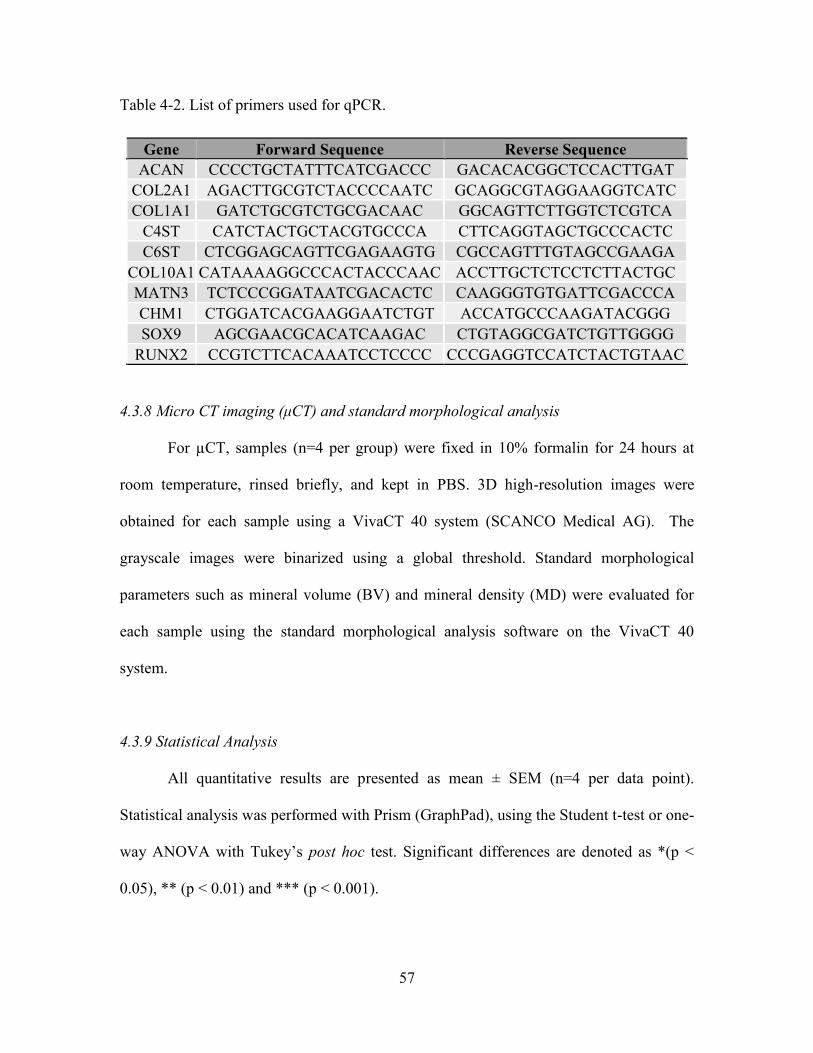
57
Table 4-2. List of primers used for qPCR.
Gene Forward Sequence Reverse Sequence
ACAN CCCCTGCTATTTCATCGACCC GACACACGGCTCCACTTGAT
COL2A1 AGACTTGCGTCTACCCCAATC GCAGGCGTAGGAAGGTCATC
COL1A1 GATCTGCGTCTGCGACAAC GGCAGTTCTTGGTCTCGTCA
C4ST CATCTACTGCTACGTGCCCA CTTCAGGTAGCTGCCCACTC
C6ST CTCGGAGCAGTTCGAGAAGTG CGCCAGTTTGTAGCCGAAGA
COL10A1 CATAAAAGGCCCACTACCCAAC ACCTTGCTCTCCTCTTACTGC
MATN3 TCTCCCGGATAATCGACACTC CAAGGGTGTGATTCGACCCA
CHM1 CTGGATCACGAAGGAATCTGT ACCATGCCCAAGATACGGG
SOX9 AGCGAACGCACATCAAGAC CTGTAGGCGATCTGTTGGGG
RUNX2 CCGTCTTCACAAATCCTCCCC CCCGAGGTCCATCTACTGTAAC
4.3.8 Micro CT imaging (μCT) and standard morphological analysis
For µCT, samples (n=4 per group) were fixed in 10% formalin for 24 hours at
room temperature, rinsed briefly, and kept in PBS. 3D high-resolution images were
obtained for each sample using a VivaCT 40 system (SCANCO Medical AG). The
grayscale images were binarized using a global threshold. Standard morphological
parameters such as mineral volume (BV) and mineral density (MD) were evaluated for
each sample using the standard morphological analysis software on the VivaCT 40
system.
4.3.9 Statistical Analysis
All quantitative results are presented as mean ± SEM (n=4 per data point).
Statistical analysis was performed with Prism (GraphPad), using the Student t-test or one-
way ANOVA with Tukey’s post hoc test. Significant differences are denoted as *(p <
0.05), ** (p < 0.01) and *** (p < 0.001).

58
4.4 Results
4.4.1 Morphological analysis of cartilage discs and pellets
Type I collagen and type II collagen are important fibrillar collagens that are
expressed during different stages of chondrogenesis [98, 99]. Multiple layers of hMSCs
were seeded on transwell membrane inserts coated with type I collagen (Col1), type II
collagen (Col2), or vehicle (Veh), and allowed to self-assemble. Pellets were also formed
from self-assembling hMSCs in round-bottomed wells. (Fig. 4-1).
Following chondrogenic induction, the Col1 and Col2 groups formed 6.5mm
hyaline discs, but not the Veh group (Fig. 4-2). The lack of ECM coating in the Veh
group abrogated disc formation and resulted in condensation, yielding a hemispherical
tissue that resembled the pellet (Fig. 4-2). The Veh hemispheres and pellets exhibited rich
sulfated glycosaminoglycan (sGAG) deposition (shown by Alcian Blue) in the center
regions, and dense fibrillar structures (shown by PicoSirius Red) that was rich in type I
collagen at the surface of the tissues. In contrast, the Col1 and Col2 discs were stratified
and exhibited more homogenous deposition of sGAG and type II collagen. To highlight
the organizational differences, the tissues were stained for lubricin, the superficial zone
protein. Whereas lubricin lined the entire surface of the pellets, its expression on the discs
was limited to the top surface but not the bottom side in contact with the membrane.
Although resembling the pellets, the Veh hemispheres was lined with lubricin only at the
surface but not the bottom side in contact with the membrane (Fig. 4-4) Whole tissue
comparison between the Col1 and Col2 discs revealed an overall increase in the
deposition of sGAG and type II collagen with prolonged chondrogenic induction, from
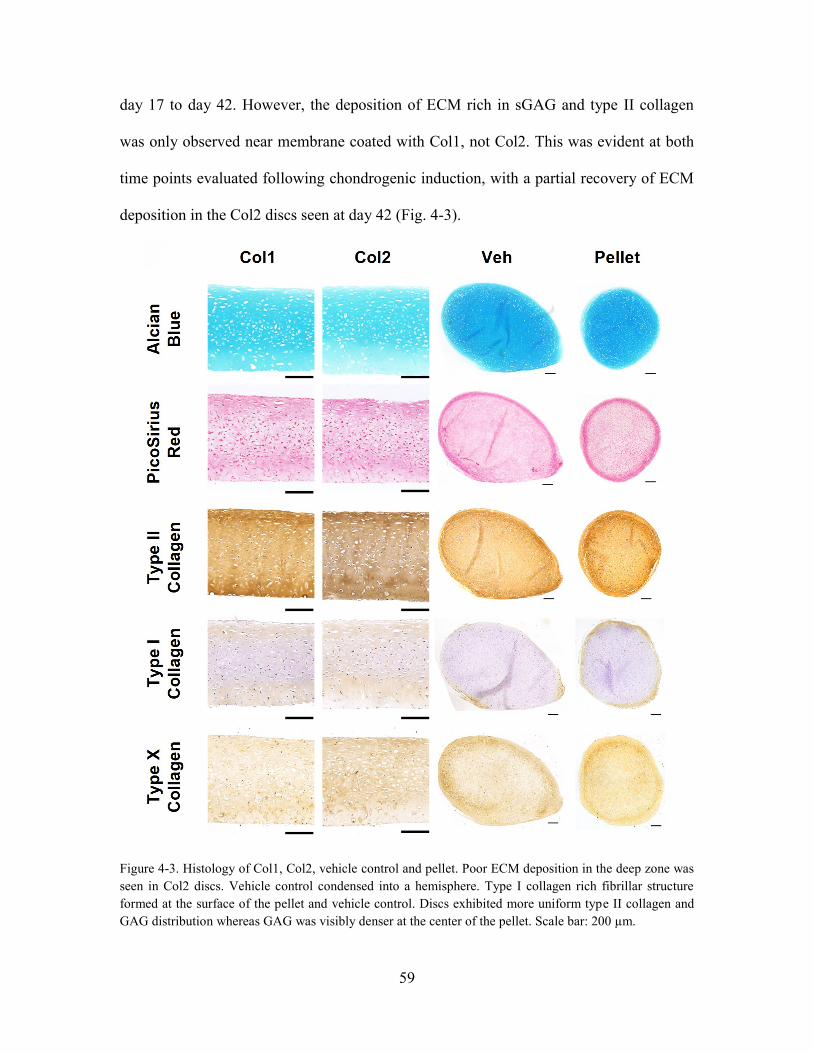
59
day 17 to day 42. However, the deposition of ECM rich in sGAG and type II collagen
was only observed near membrane coated with Col1, not Col2. This was evident at both
time points evaluated following chondrogenic induction, with a partial recovery of ECM
deposition in the Col2 discs seen at day 42 (Fig. 4-3).
Figure 4-3. Histology of Col1, Col2, vehicle control and pellet. Poor ECM deposition in the deep zone was
seen in Col2 discs. Vehicle control condensed into a hemisphere. Type I collagen rich fibrillar structure
formed at the surface of the pellet and vehicle control. Discs exhibited more uniform type II collagen and
GAG distribution whereas GAG was visibly denser at the center of the pellet. Scale bar: 200 µm.

60
Figure 4-4. Histology of Col1 and Col2 discs after 17 days and 42 days of chondrogenic induction.
Although both groups formed stratified discs that grew in thickness and deposited ECM over time, less
ECM was observed in the deep zone of Col2 discs. Scale bar: 200 µm.
Figure 4-5. Histology comparing lubricin stains. Lubricin was expressed at the entire pellet surface but only
at the top surface of the discs. Scale bar: 50 µm.
Using Col1 as the choice coating, the effects of cell seeding density on tissue
morphology was evaluated. Increasing cell seeding density from 0.5×10⁶ to 1 ×10⁶ per
well increased the disc thickness without causing appreciable changes in tissue
morphology (Fig. 4-5).
Figure 4-6. H&E stains show that Col1 discs seeded at 1.0×10⁶ were thicker than those seeded at 0.5×10⁶.
Scale bar: 200 µm.

61
To investigate the prevalence of type I collagen during chondrogenesis of self-
assembling hMSCs, pellets were stained for type I collagen at different time points
following chondrogenic induction. Type I collagen was expressed in early condensed
mesenchymal bodies, and reduced to the perichondral margin over time (Fig. 4-6). This
confirms previous findings highlighting the importance of type I collagen for early
chondrogenesis during mesenchymal condensation.
Figure 4-7. Type I collagen stains of pellets at different time points after chondrogenic induction show
initial expression throughout the pellet, and reduction to the surface layer over time. Scale bar: 200 µm.
4.4.2 Compressive properties of cartilage discs
In agreement with the results of histological analysis, mechanical evaluation
revealed that the compressive modulus of Col1 discs (~280kPa) was significantly higher
than that of the Col2 discs (~170kPa), with little difference in tissue thickness. However,
neither group reached the level of native cartilage (~800kPa) (Fig. 4-7A). Consistent with
our previous findings, cartilage formed by self-assembling hMSCs achieved a
compressive modulus exceeding that of cartilage formed in scaffold culture by MSCs
reported in earlier studies [41]. Increasing the cell seeding density from 0.5×10⁶ per well
(0.015×10⁶ /cm2) to 1 ×10⁶ per well (0.030×10⁶ /cm2) tended to increase the thickness
(from 0.5 mm to 0.7 mm) and the compressive modulus (from 280 kPa to 400 kPa) of
Col1 discs (Fig. 4-7B). Comparing the stress-strain curves, the engineered and native

62
tissues exhibited similar profiles with toe and elastic regions. However, the toe region (0-
10% strain) associated with the native tissue was smaller than that of the engineered
tissue (0-15% strain). Also, yield points and subsequent escalations were seen in the
native tissues but not the engineered tissues which remained elastic through 40% strain
(Fig. 4-7C). These differences could be attributed to the maturity of the native cartilage
(adult bovine) used as a reference.
Figure 4-8. Mechanical and physical properties of discs formed by self-assembling hMSCs. (A) Young’s
modulus measured by unconfined compressive loading revealed that Col1 discs outperformed Col2 discs.
Increasing seeding density from 0.5×10⁶ to 1.0×10⁶ further improved Col1 discs. (B) Disc thicknesses were
comparable for the Col1 and Col2 discs; increasing seeding density increased the thickness of Col1 discs.
(C) Representative stress-strain curves. Engineered and native tissues exhibited similar profiles.
4.4.3 Disc formation under different culture conditions
In addition to the compressive modulus and thickness, the frequency of successful
disc formation was assessed. At 0.5×10⁶ per well, the Col1 group formed disc in all cases
(100%; 12/12) but not the Col2 group (75%; 9/12). The Veh group failed to form discs in
all cases. Increasing cell seeding density to 1 ×10⁶ per well resulted in less frequent disc
formation in the Col1 group (50%; 6/12) and almost no disc formation (8%; 1/12) in the
Col2 group (Table 4-3). Further increase to 1.5×10⁶ per well almost abolished disc

63
formation (1 out of 12) in the Col1 group. Thus, Col1 enables more reliable formation of
cartilage discs with better mechanical properties, but only up to a critical seeding density.
Table 4-3. Comparison of the frequency of successful disc formation in different experimental groups. Col1
coating enabled the highest yield of disc formation, but this effect was abolished at high seeding density
(1.5×10⁶ per well).
4.4.4 Biochemical analysis of cartilage discs and pellets
In agreement with the results of histological and mechanical evaluations,
biochemical analysis revealed compositional differences between the Col1 and Col2
groups. Both the sGAG and collagen (COL) contents, normalized to wet weight, were
higher in the Col1 group than the Col2 group and the differences reached significance at
day 42. Comparing the pellets with the discs, compositional differences in agreement
with histological analysis were also identified. Whereas the pellets had a higher sGAG
content, the discs had a higher COL content, and consequently a higher COL to sGAG
ratio. The higher COL content can be attributed to increased collagen productivity of
cells differentiated in the disc culture than in pellet culture, as indicated by COL content
normalized to DNA content (Fig. 4-8A).
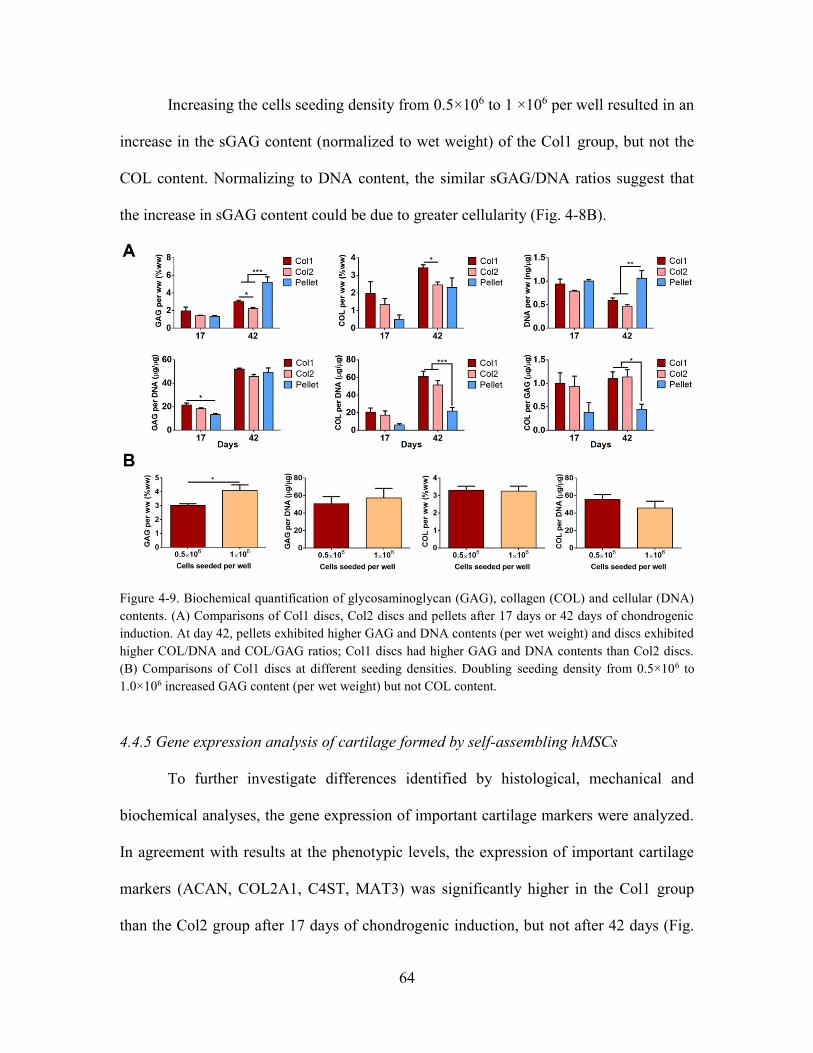
64
Increasing the cells seeding density from 0.5×10⁶ to 1 ×10⁶ per well resulted in an
increase in the sGAG content (normalized to wet weight) of the Col1 group, but not the
COL content. Normalizing to DNA content, the similar sGAG/DNA ratios suggest that
the increase in sGAG content could be due to greater cellularity (Fig. 4-8B).
Figure 4-9. Biochemical quantification of glycosaminoglycan (GAG), collagen (COL) and cellular (DNA)
contents. (A) Comparisons of Col1 discs, Col2 discs and pellets after 17 days or 42 days of chondrogenic
induction. At day 42, pellets exhibited higher GAG and DNA contents (per wet weight) and discs exhibited
higher COL/DNA and COL/GAG ratios; Col1 discs had higher GAG and DNA contents than Col2 discs.
(B) Comparisons of Col1 discs at different seeding densities. Doubling seeding density from 0.5×10⁶ to
1.0×10⁶ increased GAG content (per wet weight) but not COL content.
4.4.5 Gene expression analysis of cartilage formed by self-assembling hMSCs
To further investigate differences identified by histological, mechanical and
biochemical analyses, the gene expression of important cartilage markers were analyzed.
In agreement with results at the phenotypic levels, the expression of important cartilage
markers (ACAN, COL2A1, C4ST, MAT3) was significantly higher in the Col1 group
than the Col2 group after 17 days of chondrogenic induction, but not after 42 days (Fig.

65
4-9). The early deficits in gene expression indicate that Col2 coating delayed the onset of
chondrogenesis by self-assembling hMSCs and resulted in poor long term ECM
deposition and mechanical properties.
Figure 4-10. Gene expression analysis. Data are shown for Col1 discs, Col2 discs and pellets after 17 days
or 42 days of chondrogenic induction (by quantitative real-time polymerase chain reaction, qPCR). Col2
discs displayed lower expression of chondrogenic markers at day 17 than Col1 discs. Pellets displayed
lower COL2A1/ACAN ratio and higher expression of COL1A1 than discs at day 42. All gene expressions,
unless otherwise stated, are normalized to GAPDH and expressed as 2-∆Ct.
Gene expression analysis also confirmed a cellular basis for compositional
differences between the discs and the pellets as the ratio of COL2A1 to ACAN
expression by cells differentiated in disc culture was higher than that in pellet culture.
Greater expressions of chondroitin sulfotransferases (C4ST and C6ST) by cells in pellet
culture also suggest increased GAG sulfation, which might have contributed to the higher

66
sGAG content. Furthermore, COL1A1 expression was significantly higher in the pellets
than in the discs, confirming the results of histological analysis which revealed dense
fibrillar structures rich in type I collagen at the surface of the pellets. However,
COL10A1 expression was similar among the different groups. This suggests that disc
culture does not prevent chondrocyte hypertrophy, despite promoting hyaline cartilage
formation (Fig. 4-9).
4.4.6 In vivo outcomes of subcutaneously implanted cartilage discs and pellets
Next, we investigated the effects of the culture regimen on the vivo fate of the
cartilage formed by self-assembling hMSCs in vitro. We implanted pellets, as well as
discs cultured for different durations in vitro, subcutaneously in SCID mice (Fig. 4-10).
Figure 4-11. Overview of implantations. Discs cultured for 6 weeks, 8 weeks or 10 weeks, and pellets
cultured for 10 weeks were implanted subcutaneously in mice. Tissues were explanted after 4 weeks.
After 4 weeks in vivo, μCT and histological analysis of the explanted tissues
revealed interesting morphological and compositional differences. As expected, the
pellets underwent endochondral ossification and μCT documented the formation of a

67
spherical shell of mineralized tissue. Movat’s pentachrome revealed an outer layer of
mature bone, under which marrow-like cells infiltrated into the extensively calcified
cartilage interior (Fig. 4-11). The discs also underwent endochondral ossification but
exhibited a remarkably different tissue organization (Fig. 4-11). Mature bone and
infiltrating marrow-like cells lined the bottom of the disc, and the calcified cartilage was
directly above the nascent bone. Residual cartilage was observed at the superficial zone.
Figure 4-12. Histological stains showed organization of discs after endochondral ossification. (Left) Discs
were more mineralized with length of culture and mature bone was seen in 10w4Q discs. Bone formed at
the bottom of the discs and the infiltrating marrow-like cells were observed. This layer was covered by
calcified cartilage, with traces of non-calcified cartilage at the surface. (Right) Whole tissue sections of
pellets after endochondral ossification. Bone formed at the surface, with infiltrating marrow-like cells
beneath gradually resorbing the calcified cartilage. Scale bar: 200 µm.
Furthermore, the rate of endochondral ossification in the discs increased with the
duration of in vitro chondrogenic induction. After 4 weeks in vivo, discs cultured for 10
weeks (10w4Q) exhibited greater mineral volume and density than discs cultured for 6
weeks or 8 weeks (6w4Q, 8w4Q) (Fig. 4-12). Movat’s pentachrome revealed distinct
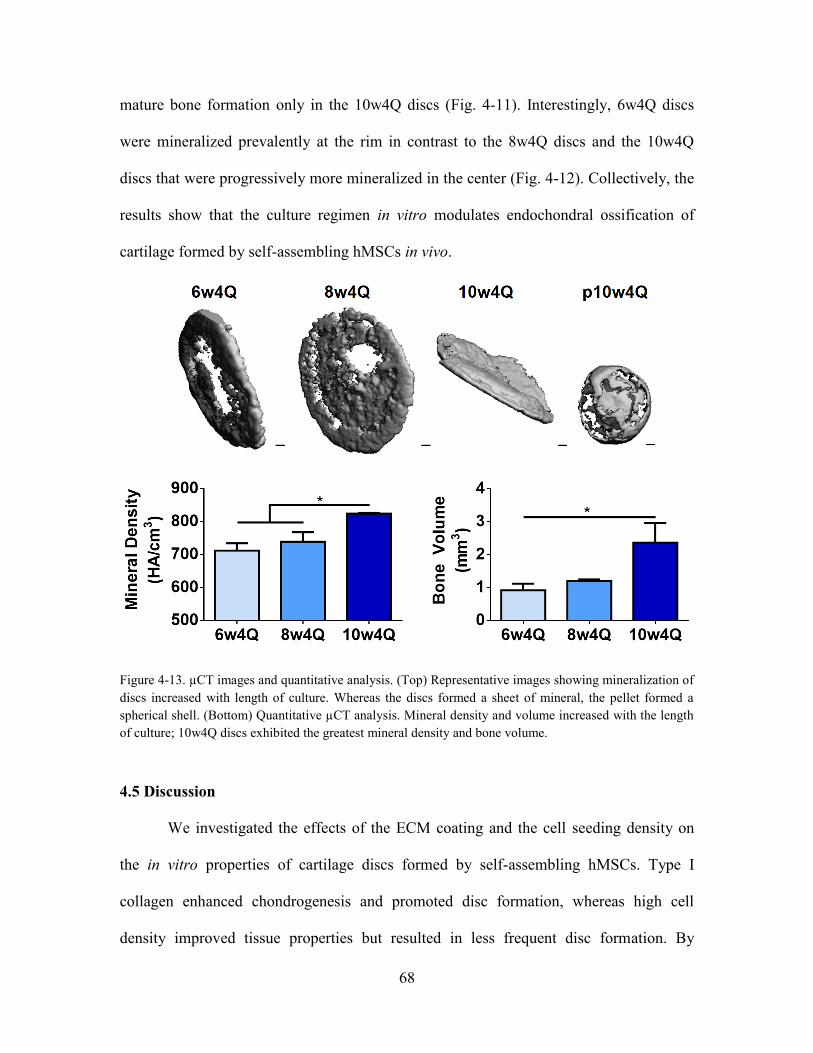
68
mature bone formation only in the 10w4Q discs (Fig. 4-11). Interestingly, 6w4Q discs
were mineralized prevalently at the rim in contrast to the 8w4Q discs and the 10w4Q
discs that were progressively more mineralized in the center (Fig. 4-12). Collectively, the
results show that the culture regimen in vitro modulates endochondral ossification of
cartilage formed by self-assembling hMSCs in vivo.
Figure 4-13. µCT images and quantitative analysis. (Top) Representative images showing mineralization of
discs increased with length of culture. Whereas the discs formed a sheet of mineral, the pellet formed a
spherical shell. (Bottom) Quantitative µCT analysis. Mineral density and volume increased with the length
of culture; 10w4Q discs exhibited the greatest mineral density and bone volume.
4.5 Discussion
We investigated the effects of the ECM coating and the cell seeding density on
the in vitro properties of cartilage discs formed by self-assembling hMSCs. Type I
collagen enhanced chondrogenesis and promoted disc formation, whereas high cell
density improved tissue properties but resulted in less frequent disc formation. By
69
studying self-assembly regimens, we identified compositional and morphological
differences between the cartilage discs and pellets, during in vitro culture and following
in vivo implantation. We also showed that prolonged chondrogenic induction in vitro
expedited endochondral ossification of cartilage discs in vivo.
The importance of ECM for chondrogenic differentiation of MSCs has been
studied in vivo and in vitro. Developmental studies revealed interesting dynamics of
ECM formation as the prechondrogenic mesenchyme was enriched with type I collagen
whereas the mature cartilage was enriched with type II collagen [98, 99]. Although both
collagen types have been used for in vitro chondrogenic induction of MSCs, a recent
study found important differences between the early and late stage ECM during
chondrogenesis [100-102]. Early stage ECM was rich in type I collagen and other cell
binding proteins, and strongly induced chondrogenesis of MSCs. In contrast, late stage
ECM was rich in type II collagen, deficient in type I collagen and other cell binding
proteins, and resulted in poor chondrogenic induction of MSCs [102]. Due to alternative
splicing, mature chondrocytes synthesize type IIB pro-collagen that lacks a TGF-β
binding chordin-like domain [103]. Thus, it was proposed that type II collagen in ECM
produced during late chondrogenesis disrupted TGF-β mediated chondrogenesis.
Interestingly, we observed similar differences between the cartilage discs formed
on membranes coated with type I collagen (Col1) versus type II collagen (Col2). Col1
discs exhibited better tissue properties as revealed by biochemical, histological and
mechanical analyses. The poor ECM deposition and mechanical properties of Col2 discs

70
can be attributed to early deficits in the gene expression of cartilage markers. In
agreement with the developmental studies, we found uniform expression of type I
collagen within the first week of chondrogenic induction, which confirms its importance
during early chondrogenesis of hMSCs.
Furthermore, Col1 coating enabled disc formation most reproducibly. In contrast,
self-assembling hMSCs on uncoated membranes condensed and failed to form discs. Disc
formation on type II collagen was less frequent than on type I collagen. Although we
could not compare binding forces, our results suggest that type I collagen serves as a
better anchor for the self-assembling hMSCs to resist condensation forces. Cell seeding
density was shown to modulate cartilage formation by MSCs cultured in scaffold [28,
104]. Here, we showed that increasing the cell seeding density improved the compressive
modulus, sGAG content and thickness of the discs significantly. However, increasing the
cell seeding density also promoted condensation and yielded less frequent disc formation.
During mesenchymal condensation, MSCs undergo actomyosin contraction and
cytoskeletal rearrangement [105]. It is likely that the increased condensation forces at
high cell densities overcame the anchoring forces between the membrane ECM and the
attached cells.
Disc culture formed hyaline cartilage while pellet culture formed fibrocartilage
with more type I collagen. This outcome was attributed to the fibrogenic tensile forces
associated with the increase in surface area of the pellet, but not the disc which grew in
thickness [42]. Disc culture also enhanced collagen network maturity [106]. We

71
confirmed these findings and found that whereas pellet culture formed fibrocartilage with
dense type I collagen at the surface, and disc culture formed hyaline cartilage with
uniform deposition of sGAG and type II collagen. Furthermore, hMSCs differentiated in
disc culture expressed more COL2A1 relative to ACAN than in pellet culture.
Consequently, the discs exhibited a higher COL relative to sGAG content than the
pellets. Morphologically, the discs were stratified and resembled the articular cartilage,
with lubricin lining only the top surface.
Although cartilage pellets and discs formed from self-assembling hMSCs both
achieved structural integrity, other methods may be necessary to grow tissues for large-
scale therapeutic applications. One such method for forming large and anatomically
shaped cartilage is the fusion of pellets atop bone substrate that we demonstrated in our
previous study [7]. Foreseeably, larger discs could also be formed by inducing cartilage
formation from self-assembling hMSCs on a larger coated membranes. However, our
studies suggest that improving the thickness and mechanical property of the discs comes
at a cost of a lower yield of disc formation, necessitating the use of scaffolds for the
cultivation of larger tissue constructs.
Studies of pellets in vivo showed that insufficient in vitro conditioning resulted in
fibrous tissue formation, and that prolonged chondrogenic culture enabled endochondral
ossification [44, 50]. To the best of our knowledge, the in vivo fate of the cartilage discs
has not been studied. Thus, we assessed the in vivo implications of different culture
regimens and found that both the pellets and the discs underwent endochondral

72
ossification following prolonged chondrogenic induction, with remarkably different
outcomes. Endochondral ossification of the pellets resembled callus maturation during
long bone repair, whereby bone enveloped the pellet and cartilage loss progressed into
the bulk of the tissue. Instead, endochondral ossification of the discs resembled
epiphyseal cartilage maturation during skeletal development, whereby bone formed at the
bottom and cartilage loss progressed towards the surface [52].
Recent studies showed that hypertrophic induction following chondrogenic
induction advanced maturation of cartilage formed by hMSCs in vitro and enhanced
endochondral ossification in vivo [46, 107]. Here, we showed that prolonged
chondrogenic culture of cartilage discs formed by self-assembling hMSCs similarly
expedited endochondral ossification in vivo. After 4 weeks of implantation, discs cultured
for 10 weeks exhibited greater mineral volume and density than discs cultured for 6
weeks or 8 weeks. Interestingly, mineralization initiated at the rim. The normal
compressive force at the insert wall might have induced more rapid peripheral maturation
[108]. These results demonstrate that the in vitro culture regimen can modulate
endochondral ossification of cartilage formed by self-assembling hMSCs in vivo.
As the primary goal of the in vivo study was to evaluate cartilage stability, we
only evaluated the tissue outcomes after 4 weeks of ectopic implantation. However, it is
likely that the tissues would undergo further endochondral ossification with prolonged
implantation. A recent 8-week implantation study on the fate of chondrocytes terminally
differentiated from hMSCs found that chondrocytes released from lacunae during

73
endochondral ossification underwent a reversion of differentiation to become marrow
stromal cells within the ossicle [109]. With prolonged implantation, it is possible that
terminally differentiated chondrocytes in both the discs and the pellets could have
undergone a similar reversion, leading to the formation of bone and marrow stroma.
However, the presence of osteopontin and mineral indicated that during early
stages of ectopic implantation, the in vivo environment promoted terminal differentiation
of chondrocytes along a chondrogenic pathway. While a switch to osteogenic
differentiation would also have resulted in the deposition of osteopontin and mineral,
Movat’s pentachrome staining showed that the cells were residing in cartilage matrix, and
were unlikely to have undergone a reversion of chondrogenic differentiation.
During in vitro culture, we did not observe a significant decrease in DNA content
up to 6 weeks of chondrogenic differentiation in disc or pellet culture. This suggests that
there was no progressive loss of cells during chondrogenic induction. Likewise,
histological observations confirmed that the lacunae in the cartilage tissues remained well
nucleated after implantation, suggesting the persistence of viable chondrocytes. However,
prior studies suggest that terminal differentiation of chondrocytes can result in apoptosis
which mediates cartilage turnover [110, 111].
The long-term stability of control of cartilage formed from MSCs remains a
challenge [3, 16]. Recent studies found that modulation of Wnt signaling and hypoxia can
enhance the in vivo stability of cartilage formed by MSCs in pellet culture [112, 113].

74
Conceivably, trophic and biophysical stimuli can improve the disc culture and enable the
growth of a functional, organized and stable articular cartilage in vitro from MSCs. As
the articular cartilage is anisotropic, implementation of spatiotemporal control during in
vitro culture could recapitulate native gradients and further improve tissue organization
and stability [114].
4.6 Conclusion
This study shows that culture parameters affect the in vitro and in vivo outcomes
of cartilage formation by self-assembling hMSCs. Disc formation on a membrane could
not be achieved without ECM coating. Type I collagen, uniformly expressed in the
prechondrogenic mesenchyme, most frequently enabled disc formation and improved
long term tissue properties by enhancing early chondrogenesis. Increasing cell seeding
density improved tissue properties, but also increased the condensation burden and
resulted in less frequent disc formation. Disc culture formed stratified hyaline cartilage
with uniform deposition of GAG and type II collagen, and pellet culture formed
fibrocartilage callus with type I collagen at the surface.
Following ectopic implantation, endochondral ossification of the discs progressed
bottom up, resembling epiphyseal cartilage maturation. Instead, endochondral
ossification of the pellet progressed outside in, resembling callus maturation. Prolonged
chondrogenic induction in vitro expedited endochondral ossification of the discs in vivo,
starting at the rim. These results provide new directions for engineering cartilage and
bone via a cartilage template from hMSCs by self-assembly methods.
75
4.7 Future work
Despite establishing the important culture parameters for growing stratified and
functional cartilage discs from self-assembling hMSCs, the engineered cartilage still
lacks in vivo stability. Implementation of spatiotemporal regulation recapitulating
developmental aspects of native cartilage formation could enhance maturation of the
engineered cartilage in vitro. The next chapter (Chapter 5) will present findings on the
study summarized in Aim 3, seeking to address the importance of spatiotemporal
regulation.

76
Chapter 5
Spatiotemporal regulation during induction of self-
assembling hMSCs promotes organization and in vivo
stability of engineered cartilage
5.1 Abstract
Standard isotropic culture fails to recapitulate the spatiotemporal gradients present
during native development. Cartilage grown from human mesenchymal stem cells
(hMSCs) is poorly organized and unstable in vivo. In this study, cartilage with
physiologic organization and in vivo stability was grown in vitro from self-assembling
hMSCs by implementing spatiotemporal regulation during induction. Self-assembling
hMSCs formed cartilage discs in transwell inserts following isotropic chondrogenic
induction to set up a dual compartment culture. Following a switch in the basal
compartment to a hypertrophic regimen, the cartilage discs underwent progressive deep
zone hypertrophy and mineralization. Concurrent chondrogenic induction in the apical
compartment enabled the maintenance of functional hyaline cartilage. Cartilage formed
under spatiotemporal regulation in vitro resisted endochondral ossification and remained
organized following subcutaneous implantation in immunocompromised mice, whereas
the isotropic control groups underwent endochondral ossification. Spatiotemporal
regulation during induction in vitro potentiated the maturation of self-assembling hMSCs
into stable and organized cartilage resembling the native articular cartilage.
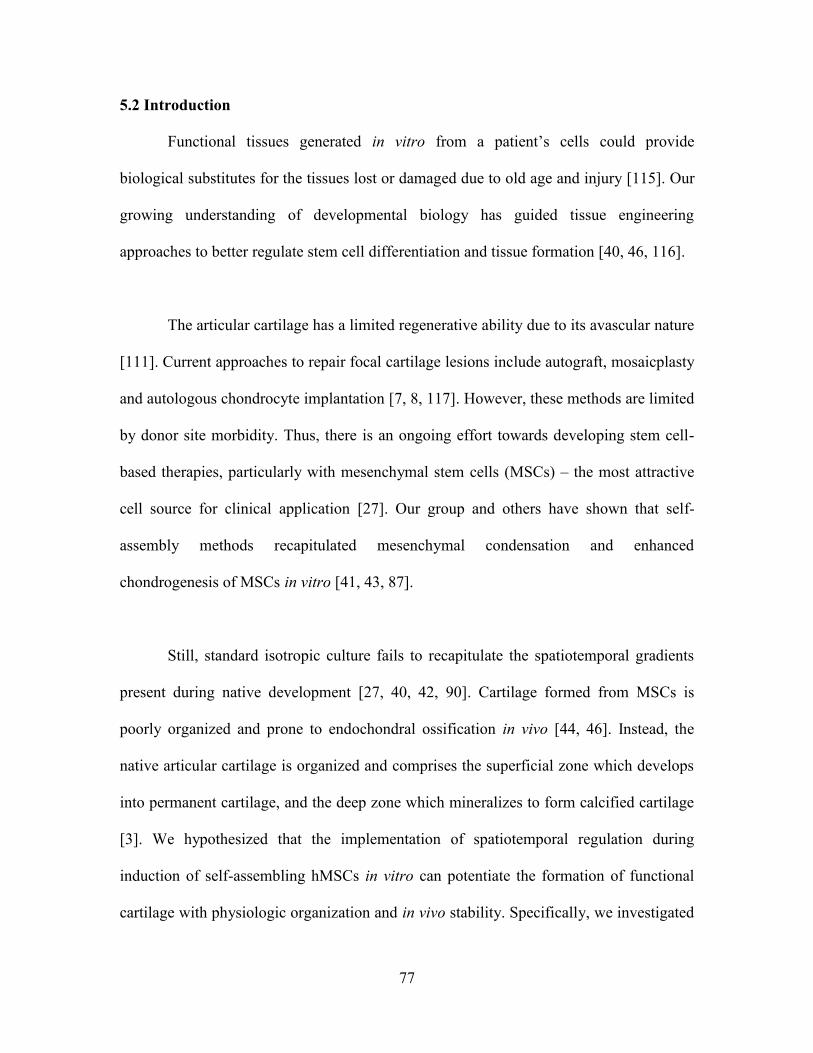
77
5.2 Introduction
Functional tissues generated in vitro from a patient’s cells could provide
biological substitutes for the tissues lost or damaged due to old age and injury [115]. Our
growing understanding of developmental biology has guided tissue engineering
approaches to better regulate stem cell differentiation and tissue formation [40, 46, 116].
The articular cartilage has a limited regenerative ability due to its avascular nature
[111]. Current approaches to repair focal cartilage lesions include autograft, mosaicplasty
and autologous chondrocyte implantation [7, 8, 117]. However, these methods are limited
by donor site morbidity. Thus, there is an ongoing effort towards developing stem cell-
based therapies, particularly with mesenchymal stem cells (MSCs) – the most attractive
cell source for clinical application [27]. Our group and others have shown that self-
assembly methods recapitulated mesenchymal condensation and enhanced
chondrogenesis of MSCs in vitro [41, 43, 87].
Still, standard isotropic culture fails to recapitulate the spatiotemporal gradients
present during native development [27, 40, 42, 90]. Cartilage formed from MSCs is
poorly organized and prone to endochondral ossification in vivo [44, 46]. Instead, the
native articular cartilage is organized and comprises the superficial zone which develops
into permanent cartilage, and the deep zone which mineralizes to form calcified cartilage
[3]. We hypothesized that the implementation of spatiotemporal regulation during
induction of self-assembling hMSCs in vitro can potentiate the formation of functional
cartilage with physiologic organization and in vivo stability. Specifically, we investigated

78
whether a spatiotemporally regulated induction regimen can i) generate hyaline cartilage
discs with physiologic organization from self-assembling hMSCs, ii) induce deep zone
hypertrophy and mineralization to guide cartilage maturation, and iii) enable the cartilage
discs to remain stable and organized in vivo.
To this end, we compacted human MSCs (hMSCs) on coated transwell
membranes by centrifugation, and allowed the cells to differentiate under chondrogenic
induction. At 3 weeks, we switched induction in the basal compartment to a hypertrophic
regimen in the experimental group, and maintained isotropic chondrogenic or
hypertrophic regimens in the control groups. After 10 weeks, all groups were implanted
ectopically in immunocompromised mice to evaluate their stability in vivo.
Through extensive quantitative and morphological analysis, we showed that the
implementation of spatiotemporal regulation during induction of self-assembling hMSCs
in vitro resulted in the formation of cartilage discs with physiologic stratification and
deep zone mineralization. Cartilage discs formed under spatiotemporal regulation resisted
endochondral ossification following subcutaneous implantation, and retained zonal
organization with a nascent tidemark. Thus, mimicry of native spatiotemporal gradients
can be achieved in vitro to enhance the organization and stability of cartilage tissues
formed by self-assembling MSCs.

79
5.3 Methods
5.3.1 Cell source and preparation
Fresh bone marrow aspirates were obtained from Cambrex and processed as in
our previous studies [41]. Bone-marrow–derived hMSCs isolated were expanded to the
fifth passage (P5) in high glucose DMEM containing 10% fetal bovine serum, 1% Pen-
Strep and 1 ng/mL of fibroblast growth factor-2 (FGF-2) (Life Technologies).
5.3.2 Disc Formation
Type I collagen (Corning) was diluted to 1.5 mg/mL in ethanol and used to coat
the polycarbonate membrane (0.4 µm pore size) of 96-well HTS Transwell inserts
(Corning). The inserts were air dried overnight and rinsed with PBS. Multiple layers of
hMSCs (250,000/ well) were seeded into the inserts and compacted by centrifugation
(200 g, 5 minutes). Seeded inserts were assembled with the reservoir plates, each filled
with 20 mL of chondrogenic media. Media in the inserts were carefully topped up 3 hours
postcentrifugation (200 µL/ well). Tissues were incubated in a controlled humidified
chamber (37 °C, 5 vol% CO2) and media were replaced every other day. Samples were
fixed in 10 vol% formalin for histological and analysis or snap frozen and stored at – 80
˚C prior to gene expression and biochemical analyses.
5.3.3 Induction Regimens
Chondrogenic medium comprises high glucose DMEM with 10 ng/mL TGF-β3,
100 nM dexamethasone, 50 μM ascorbic acid-2 phosphate, 100 μM sodium pyruvate, 5
μg/mL proline, 1% insulin, transferrin, sodium selenite mix (ITS+), and 1% penicillin–

80
streptomycin (P/S). Hypertrophic medium comprises high glucose DMEM with 50
ng/mL T4, 5 mM β-glycerophosphate, 1 nM dexamethasone, 50 μM ascorbic acid-2
phosphate, 100 μM sodium pyruvate, 5 μg/mL proline, 1% ITS+, and 1% P/S.
Figure 5-1. Schematic of the induction regimens. hMSCs seeded in coated transwells were cultured under
isotropic chondrogenic induction for 3 weeks. After 3 weeks, induction in the basal compartment was
switched to a hypertrophic regimen to set up a dual compartment culture. Isotropic chondrogenic or
hypertrophic regimens were maintained in control groups. All tissues were cultured for up to 10 weeks.
After 3 weeks of chondrogenic induction in both compartments, induction in the
basal compartment (reservoir) was switched to a hypertrophic regimen in the
experimental (CH) group. Chondrogenic induction was maintained in both compartments
for the isotropic chondrogenic (IC) control group. Inductions in both compartments were
switched to hypertrophic regimens and maintained for the isotropic hypertrophic (IH)
control group. All groups were kept in culture for up to 10 weeks. Samples were taken at
different time points for gene expression (n=4), biochemical (n=4), histological (n=4),
µCT, and mechanical (n=4) analyses.
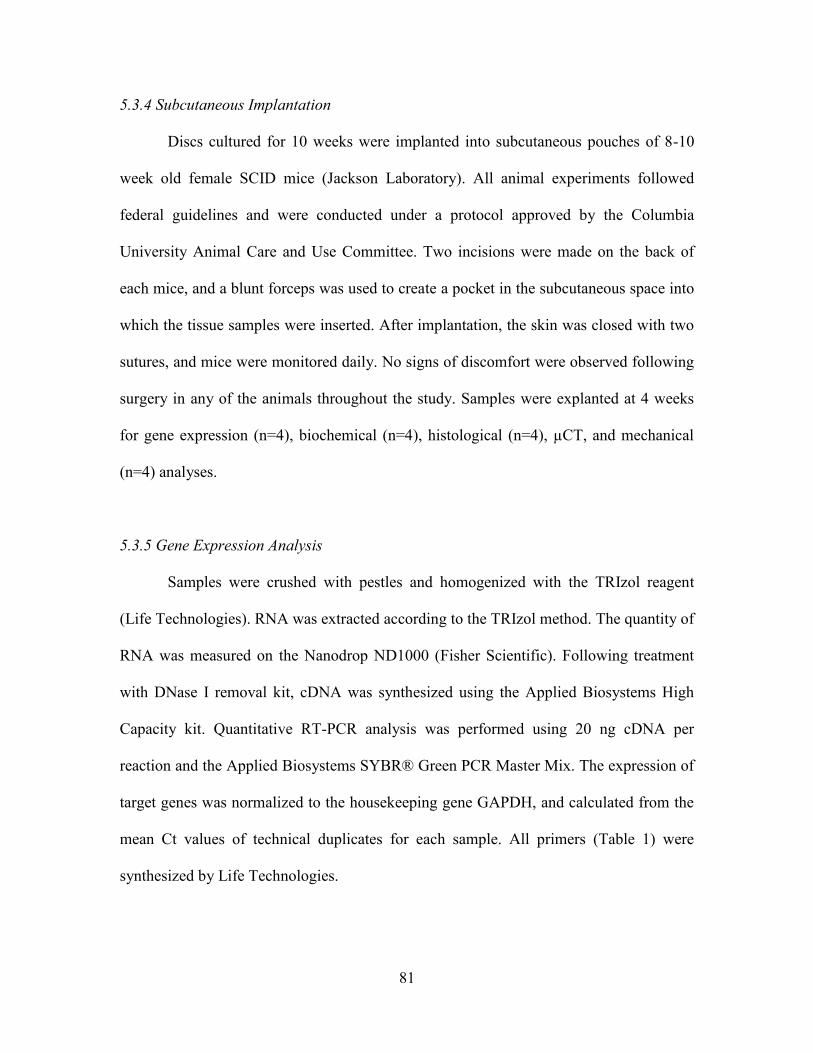
81
5.3.4 Subcutaneous Implantation
Discs cultured for 10 weeks were implanted into subcutaneous pouches of 8-10
week old female SCID mice (Jackson Laboratory). All animal experiments followed
federal guidelines and were conducted under a protocol approved by the Columbia
University Animal Care and Use Committee. Two incisions were made on the back of
each mice, and a blunt forceps was used to create a pocket in the subcutaneous space into
which the tissue samples were inserted. After implantation, the skin was closed with two
sutures, and mice were monitored daily. No signs of discomfort were observed following
surgery in any of the animals throughout the study. Samples were explanted at 4 weeks
for gene expression (n=4), biochemical (n=4), histological (n=4), µCT, and mechanical
(n=4) analyses.
5.3.5 Gene Expression Analysis
Samples were crushed with pestles and homogenized with the TRIzol reagent
(Life Technologies). RNA was extracted according to the TRIzol method. The quantity of
RNA was measured on the Nanodrop ND1000 (Fisher Scientific). Following treatment
with DNase I removal kit, cDNA was synthesized using the Applied Biosystems High
Capacity kit. Quantitative RT-PCR analysis was performed using 20 ng cDNA per
reaction and the Applied Biosystems SYBR® Green PCR Master Mix. The expression of
target genes was normalized to the housekeeping gene GAPDH, and calculated from the
mean Ct values of technical duplicates for each sample. All primers (Table 1) were
synthesized by Life Technologies.

82
Table 5-1. List of primers used for qPCR.
5.3.6 Histology and Immunohistochemistry
Samples were fixed in 10% formalin for 24 hours, and if necessary, decalcified
with Immunocal (Fisher Scientific). Following dehydration in ethanol series, samples
were embedded in paraffin and sectioned to 5 µm. Sections were stained for hematoxylin
and eosin (H&E), Alcian blue for GAG, Von Kossa for phosphates and Movat’s
pentrachrome. Samples were also stained immunohistochemically for lubricin,
osteopontin, PDGF-BB, cleaved caspase-3 (Cell Signaling Technology), SOX9, RUNX2,
type I, II and X collagen. All antibodies were from Abcam unless otherwise stated.
5.3.7 Image quantitation
For type X collagen and Von Kossa stains, images were balanced, binarized and
inverted using ImageJ (National Institutes of Health). Intensity profiles were established
across representative regions. To quantify composition, inverted images were thresholded
and the area stained was determined as a fraction of the total tissue area. For Movat’s
Gene Forward Sequence (5' to 3') Reverse Sequence (5' to 3')
ACAN CCCCTGCTATTTCATCGACCC GACACACGGCTCCACTTGAT
BMP2 ACCCGCTGTCTTCTAGCGT TTTCAGGCCGAACATGCTGAG
COL10A1 CATAAAAGGCCCACTACCCAAC ACCTTGCTCTCCTCTTACTGC
COL11A1 ACCCTCGCATTGACCTTCC TTTGTGCAAAATCCCGTTGTTT
COL2A1 AGACTTGCGTCTACCCCAATC GCAGGCGTAGGAAGGTCATC
COL9A1 GCCTTCCGGGCATTAAGGG GCAAACCGTTGGGACCTCTT
DKK1 ATAGCACCTTGGATGGGTATTCC CTGATGACCGGAGACAAACAG
GAPDH TGTTGCCATCAATGACCCCTT CTCCACGACGTACTCAGCG
IHH AACTCGCTGGCTATCTCGGT GCCCTCATAATGCAGGGACT
RUNX2 CCGTCTTCACAAATCCTCCCC CCCGAGGTCCATCTACTGTAAC
S100A1 GACCCTCATCAACGTGTTCCA CCACAAGCACCACATACTCCT
SOX9 AGCGAACGCACATCAAGAC CTGTAGGCGATCTGTTGGGG
SPP1 GTTTCGCAGACCTGACATCCA GCTTTCCATGTGTGAGGTGAT

83
pentachrome stains, images were segmented with the Color Deconvolution plugin,
binarized, inverted and thresholded to determine the stain areas of bone, cartilage, and
marrow.
5.3.8 Biochemical Analysis
Samples were blotted dry, weighed and digested in 0.5 mL proteinase K solution
at 60 °C. DNA and sulfated glycosaminoglycan (GAG) contents were measured from the
sample digests using the Molecular Probes Picogreen assay (Life Technologies) and the
1, 9-dimethylmethylene blue (DMMB) dye colorimetric assay respectively. The
remaining sample digests were then hydrolyzed at 110°C with 6N HCl. Hydroxyproline
content was determined from the hydrolysates and assumed to be 10% of the total
collagen content.
5.3.9 Mechanical Testing
As described in Chapter 4, the loading regimen for measuring the Young’s
modulus of the discs was adapted from a previous study with some modifications.
Samples (whole discs) submerged in PBS and tested with unconfined compression. Disc
thickness was measured by the position of tissue contact to that of the platen. The
cartilage discs were compressed at a very low strain rate (100 nm/s; ∼0.02% strain per
second) for up to 2,000 s, and the compressive load was measured. The ramp modulus
was calculated from the linear slope (20-30% strain) of the stress–strain curve. Based on
tests performed on native cartilage tissues, the ramp modulus at 0.02%/s is approximately
2.77 times that of the equilibrium modulus.

84
5.3.10 µCT Analysis
Samples were fixed in 10% formalin for 24 hours at room temperature and kept in
PBS. For each sample, 3D high-resolution images were obtained using a VivaCT 40
system (SCANCO Medical AG). Grayscale images were binarized using a global
threshold. Mineral volume and mineral density were evaluated using the standard
morphological analysis software on the VivaCT 40 system.
5.3.11 Statistical Analysis
All quantitative results are presented as mean ± SEM (n=4 per data point).
Pairwise comparisons were performed on results using multiway analysis of variance
(ANOVA) followed by Tukey’s post hoc test (Prism Software). Significant differences
are denoted as *(p < 0.05), ** (p < 0.01) and *** (p < 0.001).

85
5.4 Results
5.4.1 Hyaline Cartilage Formation and Deep Zone Mineralization
Both the IC and CH groups formed hyaline cartilage rich in sulfated
glycosaminoglycan (GAG). The CH group exhibited deep zone mineralization as
indicated by Von Kossa stains, starting at 6 weeks and progressing through 10 weeks
(Fig. 5-2). Alcian Blue stains confirmed maintenance of hyaline cartilage. In contrast,
the IH control group exhibited near complete loss of cartilage and mineralized
everywhere at the edge after 10 weeks (Fig. 5-3).
Figure 5-2. Histology showing deep mineralization in the CH group (Von Kossa), and maintenance of
hyaline cartilage in both groups (Alcian Blue). Scale bar: 200 µm.
Figure 5-3. Histology showing widespread loss of GAG (Movats) and peripheral mineralization (Von
Kossa) in the IH group at 10 weeks. Scale bar: 200 µm.
86
Similarly, transverse brightfield images of the whole discs revealed peripheral
deep zone mineralization at 6 weeks in the CH group and complete deep zone
mineralization by 10 weeks. Instead, the hyaline cartilage in the IC group remained
translucent.
Figure 5-4. Transverse brightfield images of whole cartilage discs at 6 weeks (top) and 10 weeks (bottom).
IC discs are shown on the left and CH discs are shown on the right.
At 10 weeks, both the IC and CH groups exhibited uniform type II collagen
deposition and no type I collagen deposition. As well as the Alcian Blue stains, these
results confirmed that hyaline cartilage with mature extracellular matrix was formed
despite the induction of deep zone mineralization in the CH group.

87
Figure 5-5. Histology confirming hyaline cartilage formation at 10 weeks. Uniform deposition of type II
collagen, but not type I collagen. Alcian Blue stains showed rich GAG deposition. Von Kossa stains
showed only the CH group was mineralized in the deep zone. Scale bar: 200 µm.
5.4.2 Biochemical and Mechanical Analysis
The DNA content of the CH group was lower at 6 weeks suggests the onset of
apoptosis with cartilage mineralization. Collagen contents, GAG and collagen
productivities (contents normalized to DNA) were similar between the groups at both 6
weeks and 10 weeks (Fig. 5-4). Interestingly, the decrease in DNA content of the CH
group at 6 weeks correlated with cleaved caspase-3 expression in the deep zone. This
suggests incipient deep zone apoptosis with the induction of mineralization. Furthermore,
the GAG content of the correlated the DNA content as determined by a correlation plot of
all data points. Thus, the slightly lower GAG content of the CH group can be attributed to
lower DNA content.

88
Figure 5-6. Biochemical analyses. Lower DNA content (6 weeks) and GAG content (10 weeks) in the CH
group. COL content, GAG and COL productivities (normalized to DNA) were similar.
Figure 5-7. Cleaved caspase-3 expression. Following deep zone hypertrophic induction, some apoptosis
was seen as 6 weeks with incipient mineralization in the deep zone. In contrast, no apoptosis was seen at 10
weeks, or in the isotropic control groups at both 6 weeks and 10 weeks. Scale bar: 200 µm.

89
Figure 5-8. Scatter plot showing correlation between GAG and DNA data of both IC and CH groups at 6
weeks and 10 weeks. Pearson correlation was determined to be 0.53.
Corresponding to the biochemical data, both groups exhibited similar mechanical
attributes. Although the compressive Young’s modulus and thickness of the CH group
was slightly lower, they are comparable to the IC group and the deficit can be attributed
to the difference in biochemical composition as elaborated (Fig. 5-5). In contrast to both
the IC and CH group, the GAG and COL contents of the IH group deteriorated
significantly (Fig. 5-6).
Figure 5-9. Mechanical analyses showing similar attributes. The compressive Young’s modulus and
thickness of the CH group was slightly lower.
90
Figure 5-10. Biochemical analyses. Significant, near complete loss of GAG in the IH group at 10 weeks.
5.4.3 Changes in Gene Expression
We assessed the gene expression of the IC and CH groups at different time points.
Correlating with the biochemical compositions, the expression of aggrecan (ACAN) and
type II collagen (COL2A1) were similar between the groups. Instead, the expression of
markers associated with chondrogenesis (SOX9, S100A), chondrocyte maturation
(COL9A1, COL11A1), and terminal differentiation (COL10A1, RUNX2, SPP1) were
significantly upregulated in the CH group from 6 weeks to 10 weeks (Fig. 5-7). Similarly,
the expression of trophic factors promoting cartilage maintenance (DKK1) and
maturation (IHH, BMP2) were also upregulated in the CH group.
In contrast, the expression of chondrogenic markers was abolished and terminal
maturation markers were upregulated in the IH group at 10 weeks (Fig. 5-8). This
correlated with the loss of hyaline cartilage matrix and extensive mineralization of the IH
discs as shown in histological and biochemical analyses.

91
Figure 5-11. Gene expression analyses of IC and CH groups at multiple time points. CH group showed
increased expression of cartilage homeostasis (SOX9, S100A1), chondrocyte maturation (COL9A1,
COL11A1), terminal differentiation (COL10A1, RUNX2, SPP), and trophic markers (DKK1, BMP2, IHH)
expression. Differences between groups reached significance at 10 weeks. ACAN and COL2A1
expressions were similar between groups. All gene expressions (2-∆∆Ct) are normalized to GAPDH and 2
week controls.
Figure 5-12. Gene expression analyses of CH, IC, and IH groups at 10 weeks. Cartilage maintenance
markers (ACAN, COL2A1, SOX9) were downregulated and terminal maturation marker (RUNX2) was
upregulated. All gene expressions (2-∆Ct) are normalized to GAPDH.
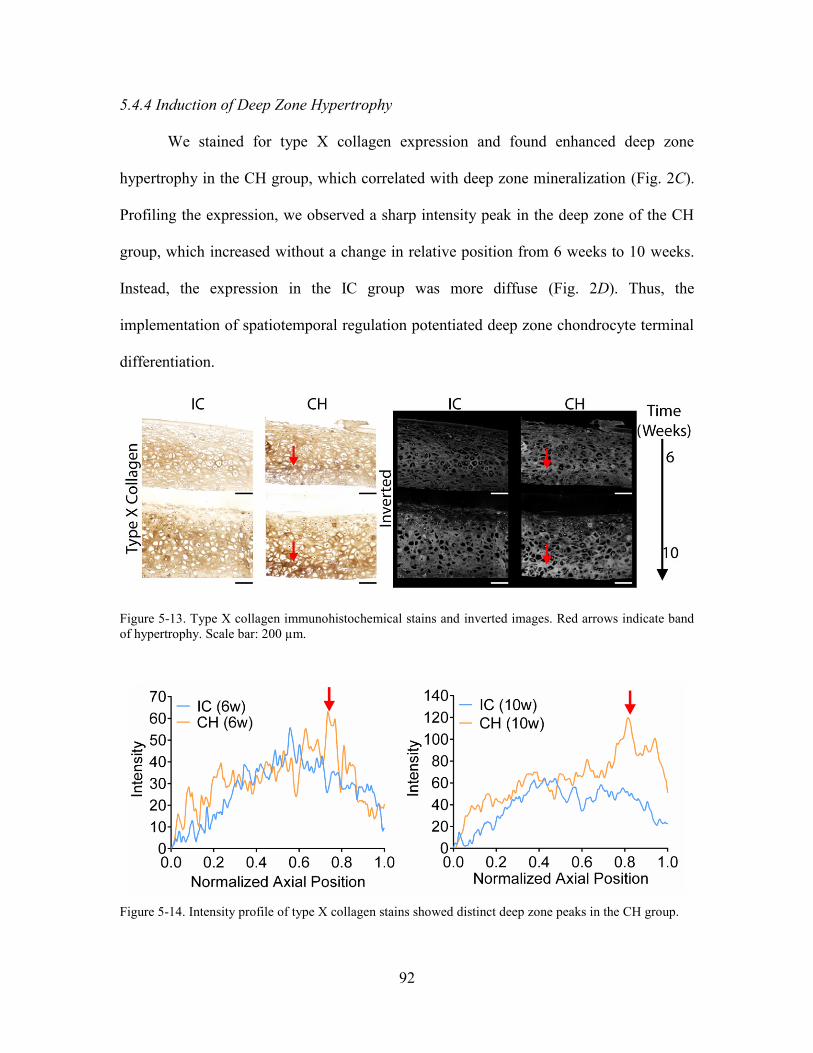
92
5.4.4 Induction of Deep Zone Hypertrophy
We stained for type X collagen expression and found enhanced deep zone
hypertrophy in the CH group, which correlated with deep zone mineralization (Fig. 2C).
Profiling the expression, we observed a sharp intensity peak in the deep zone of the CH
group, which increased without a change in relative position from 6 weeks to 10 weeks.
Instead, the expression in the IC group was more diffuse (Fig. 2D). Thus, the
implementation of spatiotemporal regulation potentiated deep zone chondrocyte terminal
differentiation.
Figure 5-13. Type X collagen immunohistochemical stains and inverted images. Red arrows indicate band
of hypertrophy. Scale bar: 200 µm.
Figure 5-14. Intensity profile of type X collagen stains showed distinct deep zone peaks in the CH group.

93
5.4.4 Cartilage Maintenance and Stability In vivo
We implanted all groups subcutaneously in immunocompromised mice to assess
cartilage maintenance in vivo (Fig. 5-9). After 4 weeks, the IC group underwent
endochondral ossification as marrow cells infiltrated into the nascent bone at the bottom
of the discs. Remarkably, the CH group resisted endochondral ossification, and exhibited
columnar chondrocytes and tidemark formation (Fig. 5-10).
Figure 5-15. Overview of implantation. Tissues cultured for 10 weeks were implanted for 4 weeks.
Movat’s pentachrome stains confirmed endochondral ossification in the IC group
but not the CH group. Von Kossa stains also indicated extensive cartilage mineralization
and bone formation in the IC group (Fig. 5-10). To quantify the comparison, the bone,
cartilage and marrow fractions were quantified by color segmentation of the pentachrome
stain images. Significant bone and marrow fractions were observed in the IC group but
not the CH group. Similarly, the Von Kossa stain images were quantified and profiled to
reveal a significantly larger fraction of mineralized tissue in the IC group and
maintenance of deep zone mineralization in the CH group.

94
Figure 5-16. Histology of IH and CH discs post- implantation. H&E, Movat’s pentachrome and Von Kossa
stains showed mature bone infiltrated with marrow cells at the bottom of the IC but not the CH discs.
Instead, the CH discs displayed columnar chondrocytes and tidemark formation. Scale bar: 200 µm.
Figure 5-17. Quantification of histological comparison. (Top) Segmentation and quantitation of Movat’s
pentachrome stains showed significant fractions of bone and marrow present in the IC but not the CH
group. (Bottom) Quantitation and profiling of Von Kossa stains showed greater and more extensive
mineralization in the IC group.
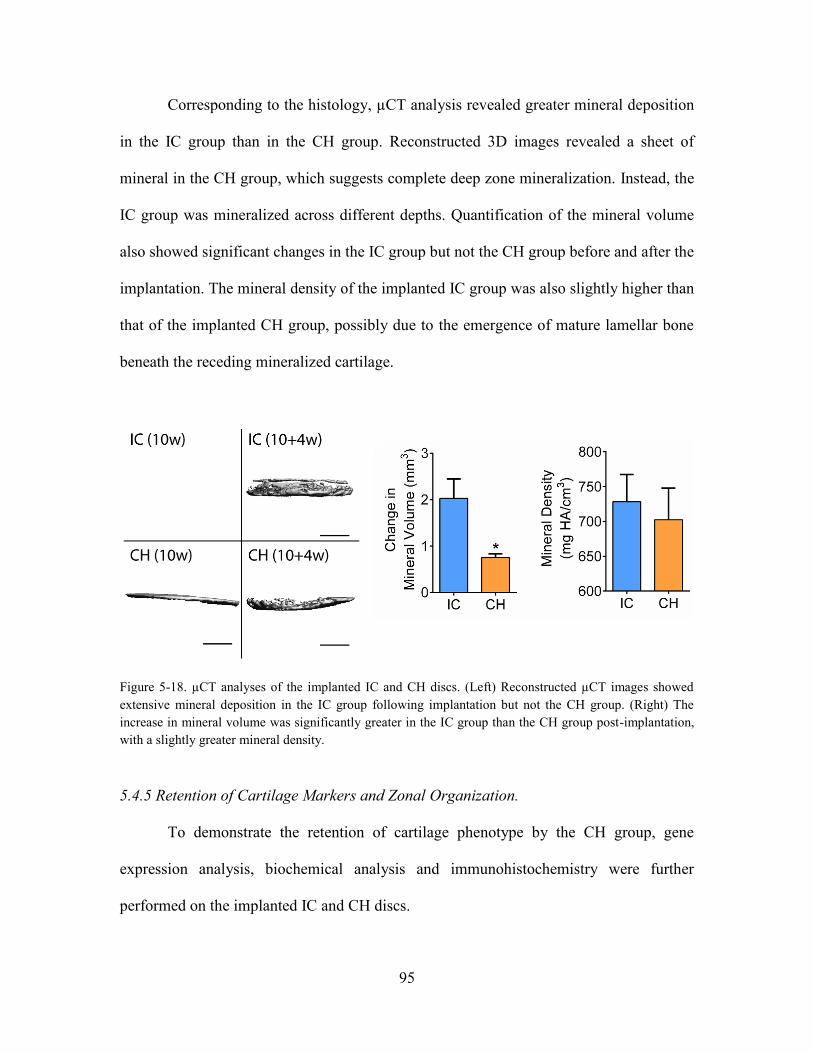
95
Corresponding to the histology, µCT analysis revealed greater mineral deposition
in the IC group than in the CH group. Reconstructed 3D images revealed a sheet of
mineral in the CH group, which suggests complete deep zone mineralization. Instead, the
IC group was mineralized across different depths. Quantification of the mineral volume
also showed significant changes in the IC group but not the CH group before and after the
implantation. The mineral density of the implanted IC group was also slightly higher than
that of the implanted CH group, possibly due to the emergence of mature lamellar bone
beneath the receding mineralized cartilage.
Figure 5-18. µCT analyses of the implanted IC and CH discs. (Left) Reconstructed µCT images showed
extensive mineral deposition in the IC group following implantation but not the CH group. (Right) The
increase in mineral volume was significantly greater in the IC group than the CH group post-implantation,
with a slightly greater mineral density.
5.4.5 Retention of Cartilage Markers and Zonal Organization.
To demonstrate the retention of cartilage phenotype by the CH group, gene
expression analysis, biochemical analysis and immunohistochemistry were further
performed on the implanted IC and CH discs.

96
Figure 5-19. Immunohistochemistry of implanted discs. IC group showed type I collagen deposition, loss of
type II collagen, faint lubricin expression in upper and lower aspects and extensive osteopontin expression.
CH group showed homogenous type II collagen deposition, superficial zone lubricin expression and deep
zone osteopontin expression. PDGF-BB stains revealed pre-osteoclasts/osteoclasts invading IC but not CH
discs.

97
The CH group remained type II collagen rich, and distinctly expressed lubricin in
the superficial zone and osteopontin in the deep zone. In contrast, the IC group exhibited
loss of type II collagen in the cartilage layer and deposition of type I collagen in the bone
layer. The IC group exhibited faint lubricin expression and extensively expressed
osteopontin. PDGF-BB staining revealed infiltration of preosteoclasts and multinuclear
osteoclasts into the bottom of the IC but not the CH discs (Fig. 4A). In addition to
osteopontin, type X collagen and alkaline phosphatase (ALP) were also expressed
extensively in the IC group and in the deep zone of the CH group. Furthermore, SOX9
and RUNX2 expressions were zonally delineated in the CH discs but not the IC discs
(Fig. S5).
Figure 5-20. Immunohistochemistry of type X collagen and ALP after implantation. (A) Strong type X
collagen expression was seen in the deep zone of the CH group and near the superficial zone of the IC
group that was undergoing endochondral ossification. (B) ALP was expressed in the deep zone of the CH
group and extensively in the IC group. Scale bar: 200 µm.

98
Figure 5-21. Immunohistochemistry of SOX9 and RUNX2 expression after implantation. SOX9 expression
was maintained in the upper zone of the CH group and RUNX2 expression was limited to the deep zone.
Instead, trace SOX9 expression and extensive RUNX2 were seen in the IC group. Scale bar: 200 µm.
Compositionally, GAG content recovered in the CH group but decreased in the IC
group (Fig. 4B). Correspondingly, the expression of genes associated with cartilage
maintenance (SOX9, ACAN, COL2A1, COL9A1 and COL11A1) and chondrocyte
terminal differentiation (COL10A1, RUNX2) persisted in the CH group following
implantation. In contrast, all cartilage maintenance markers were significantly
downregulated in the IC group.

99
Figure 5-22. Biochemical analyses of implanted discs. GAG content of CH group recovered whereas that of
IC group deteriorated post-implantation. COL contents were similar.
Figure 5-23. Gene expression analyses of implanted discs. Expression of cartilage maintenance (SOX9,
ACAN, COL2A1, COL9A1, COL11A1) and chondrocyte terminal differentiation (COL10A1, RUNX2)
markers persisted in the CH group but not the IC group post-implantation. All gene expressions (2-∆Ct) are
normalized to GAPDH.
5.4.6 Role of inflammation
To investigate the role of inflammation in modulating turnover, the tissues were
stained for markers associated with M1 and M2 macrophages, iNOS and Arg-1. Whereas
both iNOS+ cells and Arg-1+ cells were present in the deep zone of the IC discs where
endochondral ossification was taking place, no iNOS+ or Arg-1+ cells were observed in

100
the deep zone of the CH discs. Particularly, Arg-1 was expressed more intensely than
iNOS by cells populating the endochondral ossification region in the IC discs, suggesting
greater anabolic activity and bone formation following early cartilage turnover.
Interestingly, superficial zone chondrocytes in the CH discs expressed Arg-1 but not
iNOS.
Figure 5-24. Immunohistochemistry stains of iNOS and Arg-1. iNOS+ and Arg-1+ cells were seen in IC
discs where endochondral ossification was occurring, with greater Arg-1 expression. Superficial zone
chondrocytes in the CH discs expressed Arg-1 but not iNOS. Scale bar: 200 µm.
5.4.7 Endochondral Ossification following IH Induction
Following implantation, the IH group also underwent endochondral ossification.
However, unlike the IC and CH groups, bone formation and marrow infiltration occurred
all around the discs (Fig. 5-11).
Corresponding to the histology, µCT analysis revealed greater mineral deposition
in the IH group than in the IC and CH groups. Both the mineral density and mineral

101
volume were higher, albeit only the difference in mineral volume reached significance.
Reconstructed µCT images also indicated mineralization everywhere.
Figure 5-25. Histology of IH discs post-implantation. Extensive endochondral ossification with bone
formation and marrow infiltration from all sides of the tissue. Scale bar: 200 µm.
Figure 5-26. µCT analyses of the IH disc after implantation. (Top) Reconstructed µCT images of the IH
disc after implantation, in comparison with the CH and IC discs. The implanted IH disc was mineralized
everywhere. Scale bar: 1 mm. (Bottom) The IH discs exhibited higher mineral density (not significant) and
mineral volume than the CH and IC discs.

102
5.5 Discussion
Standard isotropic culture conditions fail to recapitulate native spatiotemporal
gradients, and tend to form poorly organized cartilage tissues that are prone to
endochondral ossification in vivo [44, 46]. Here, we implemented spatiotemporal
regulation during the induction of self-assembling hMSCs in vitro, and showed that it
potentiated the formation of physiologic cartilage discs with deep zone mineralization
and in vivo stability.
Tissue engineering approaches are increasingly guided by biological principles.
Mesenchymal condensation has been adapted into self-assembly methods to enhance
cartilage formation in vitro [41, 87]. TGF-β and thyroxine, potent effectors of cartilage
maintenance and chondrocyte terminal differentiation, have been used in chondrogenic
and hypertrophic induction regimens to guide MSC differentiation [39, 46, 90, 107, 118-
121]. Thus, we chose these two factors as culture supplements to implement
spatiotemporal regulation. Chondrogenesis of MSCs in vitro is defined by a temporal
sequence of cellular and molecular events [40]. We recently showed that isotropic
chondrogenic induction of hMSCs encapsulated in hydrogel formed cartilage with a
deficient core [114]. In other studies, isotropic hypertrophic induction of
chondrogenically differentiated hMSCs resulted in uncontrolled mineralization [46, 122].
Thus, spatiotemporal regulation poses a significant challenge in the quest to engineer
physiologic cartilage.

103
To enable compartmentalization and stepwise maturation, we switched deep zone
induction to a hypertrophic regimen at 3 weeks. The formation of cartilage discs isolated
the apical compartment from the basal compartment to set up a dual compartment culture.
This process recapitulates some aspects of the spatiotemporal gradient present during
native cartilage development. Following the switch, hyaline cartilage was maintained and
deep zone mineralization progressed through 10 weeks of culture.
Cartilage maintenance and maturation are governed by complex signaling
crosstalk involving multiple pathways and transcription factors [51, 123]. SOX9 and its
target S100A1 are required for chondrogenesis during limb development and postnatal
cartilage homeostasis [124, 125]. DKK1 is a canonical Wnt inhibitor that prevents
terminal differentiation [126]. On the contrary, BMP2 and IHH promote terminal
differentiation and the upregulation of RUNX2 [127]. Type II, IX and XI collagen are
indicative of mature articular chondrocytes whereas type X collagen and mineral binding
proteins such as osteopontin are indicative of hypertrophic chondrocytes [51]. In the
present study, spatiotemporal regulation in vitro potentiated the upregulation of these
genes associated with cartilage maintenance, matrix maturation and terminal
differentiation. As well as the increased type X collagen expression in the deep zone,
these data suggest that the increase in local terminal differentiation was concurrent with
overall cartilage maturation.
Interestingly, gene expressions at 6 weeks were not significantly different
between groups. This could be attributed to the heterogeneous differentiation states of the

104
cells during induction. At 6 weeks, the discs were mineralized at the rim which suggests
deep zone cells at the rim underwent terminal differentiation before cells in the middle.
At 10 weeks, the mineralization was complete and differences in gene expression of
relevant markers reached significance.
Notably, we showed that the cartilage discs formed under spatiotemporal
regulation in vitro were stable and remained organized during ectopic implantation in
mice. Instead, discs formed in isotropic cultures underwent uncontrolled mineralization
and endochondral ossification in vivo, in agreement with previous studies [44, 46]. The
stratification was evidenced by superficial zone expression of lubricin and deep zone
expression of osteopontin. We previously showed that self-assembling MSCs formed
cartilage with a superficial lubricin lining after 5 weeks of chondrogenic induction [41].
In the present study, zonal lubricin expression was observed after implantation. Despite
the heterogeneous differentiation states as indicated by patchy expressions, SOX9 was
generally expressed in the upper zone and RUNX2 in the deep zone. These indicated
zonal delineation of cartilage homeostasis and chondrocyte terminal differentiation.
Persistent expression of cartilage maintenance and maturation markers, and a recovery in
GAG content further confirmed the in vivo stability of the discs.
Probing the role of inflammation, we found that iNOS+ cells and Arg-1+ cells
populated deep zone of the IC discs where endochondral ossification was occurring. The
expression of Arg-1 was also visibly greater than iNOS. Whereas M1 macrophages
convert arginine into NO via iNOS to mount a “kill” response, M2 macrophages promote
105
“repair” as they convert arginine into ornithine, a precursor of polyamines, via Arg-1 [77,
81]. Similarly, in vivo studies of bone fracture repair reported a transition in macrophage
phenotype from M1 to M2 during endochondral ossification [81]. Thus, the greater
expression of Arg-1 suggests more anabolic activity leading to bone formation following
earlier cartilage turnover. Interestingly, we also observed Arg-1 expression in the
superficial zone of the CH discs. Although the function of Arg-1 in chondrocytes is
unknown, it could exert a chondroprotective effect by inhibiting NO production or
promoting cartilage matrix synthesis.
The native calcified cartilage bridges the articular cartilage and the subchondral
bone, and protects the articular cartilage by blocking vascular invasion and selectively
permitting the passage of small molecules from the subchondral bone [128]. A recent
study showed that engineered mineralized cartilage increased the interfacial shear
strength of osteochondral composites [122]. In this study, mineralized cartilage bore a
tidemark following implantation that the native calcified cartilage, and resisted
endochondral ossification. We determined that the mineral found in the calcified cartilage
formed from hMSCs is apatite, similar to that of the native cartilage, and established that
the mineral density increased during implantation prior to endochondral ossification
(unpublished observations). In the present study, deep zone mineralized cartilage discs
formed from hMSCs remained stable and organized in vivo. Interestingly, the mineralized
cartilage bore a tidemark following implantation and resembled the native calcified
cartilage. The lack of endochondral ossification in vivo could be attributed in part to the
chondroprotective effects of the engineered calcified cartilage.

106
5.6 Conclusion
This study provides evidence to support the hypothesis that organized and stable
cartilage with physiologic likeness can be grown in vitro from self-assembling hMSCs by
implementing spatiotemporal regulation during induction that recapitulates some aspects
of native development. Selective application of induction regimens in dual compartment
culture enabled the maintenance of hyaline cartilage and potentiated deep zone
mineralization.
For the first time to our knowledge, stratified cartilage grown in vitro from
hMSCs resisted endochondral ossification and retained zonal organization without loss of
cartilage markers expression in vivo. Conceivably, this method can be applied towards
engineering other tissues from self-assembling progenitor cells also patterned with
spatiotemporal gradients during native development.

107
5.7 Future work
Despite the encouraging results, we also acknowledge the limitations of this
study. Although we thoroughly investigated the approach with hMSCs from one donor,
future studies will evaluate the approach with MSCs from more donors and sources such
as the adipose and synovium. Furthermore, we could not clearly define underlying
mechanisms to explain the similarities in the organization and maturation profiles exist
between the engineered cartilage and the native articular cartilage. RNA in situ
hybridization could further clarify expression patterns, and gain-or-loss of function
experiment could provide causal explanations.
To achieve cartilage formation at a clinically relevant scale, the cartilage
thickness needs to be doubled. Towards that end, we could integrate our novel approach
with a method we developed to engineer large cartilage by fusing condensed
mesenchymal bodies on bone scaffolds [41]. Importantly, this approach locally regulated
but did not inhibit type X collagen expression. The incorporation of other factors such as
hypoxia and compressive loading could be necessary to inhibit spontaneous hypertrophy
and improve functional properties of the engineered cartilage [113]. Whether bona fide
articular cartilage can be formed from MSCs requires validation with well-defined
markers that distinguish between mature chondrocytes and MSCs [49]. Developmentally,
the articular cartilage is formed by outer interzone cells originating from the
chondrogenic mesoderm [129]. The use of pluripotent stem cells would also enable
unprecedented control as they can generate chondrocytes with distinct articular and
growth plate phenotypes [130].

108
References
1. Hall BK, Miyake T. All for one and one for all: condensations and the initiation
of skeletal development. Bioessays 2000; 22:138-147.
2. Pacifici M, Koyama E, Shibukawa Y, Wu C, Tamamura Y, Enomoto-Iwamoto M,
Iwamoto M. Cellular and molecular mechanisms of synovial joint and articular
cartilage formation. In Skeletal Development and Remodeling in Health, Disease,
and Aging. Volume 1068. Edited by Zaidi M; 2006; 74-86: Annals of the New
York Academy of Sciences].
3. Iwamoto M, Ohta Y, Larmour C, Enomoto-Iwamoto M. Toward regeneration of
articular cartilage. Birth Defects Res C Embryo 2013; 99:192-202.
4. Lawrence RC, Felson DT, Helmick CG, Arnold LM, Choi H, Deyo RA, Gabriel
S, Hirsch R, Hochberg MC, Hunder GG, et al. Estimates of the prevalence of
arthritis and other rheumatic conditions in the United States. Arthritis Rheum
2008; 58:26-35.
5. Guccione AA, Felson DT, Anderson JJ, Anthony JM, Zhang YQ, Wilson PWF,
Kellyhayes M, Wolf PA, Kreger BE, Kannel WB. THE EFFECTS OF SPECIFIC
MEDICAL CONDITIONS ON THE FUNCTIONAL LIMITATIONS OF
ELDERS IN THE FRAMINGHAM-STUDY. Am J Public Health 1994; 84:351-
358.
6. Curl WW, Krome J, Gordon ES, Rushing J, Smith BP, Poehling GG. Cartilage
injuries: A review of 31,516 knee arthroscopies. Arthroscopy: The Journal of
Arthroscopic & Related Surgery 1997; 13:456-460.

109
7. Hangody L, Kish G, Karpati Z, Szerb I, Udvarhelyi I. Arthroscopic autogenous
osteochondral mosaicplasty for the treatment of femoral condylar articular
defects. A preliminary report. Knee Surg Sports Traumatol Arthrosc 1997; 5:262-
267.
8. Brittberg M, Lindahl A, Nilsson A, Ohlsson C, Isaksson O, Peterson L. Treatment
of deep cartilage defects in the knee with autologous chondrocyte transplantation.
N Engl J Med 1994; 331:889-895.
9. Knutsen G, Engebretsen L, Ludvigsen TC, Drogset JO, Grontvedt T, Solheim E,
Strand T, Roberts S, Isaksen V, Johansen C. Autologous chondrocyte
implantation compared with microfracture in the knee - A randomized trial. J
Bone Joint Surg Am 2004; 86A:455-464.
10. Cole BJ, Pascual-Garrido C, Grumet RC. Surgical Management of Articular
Cartilage Defects in the Knee. J Bone Joint Surg Am 2009; 91a:1778-1790.
11. Akeson WH, Bugbee W, Chu C, Giurea A. Differences in mesenchymal tissue
repair. Clin Orthop Relat Res 2001:S124-S141.
12. Kreuz PC, Steinwachs MR, Erggelet C, Krause SJ, Konrad G, Uhl M, Sudkamp
N. Results after microfracture of full-thickness chondral defects in different
compartments in the knee. Osteoarthritis Cartilage 2006; 14:1119-1125.
13. Horas U, Pelinkovic D, Herr G, Aigner T, Schnettler R. Autologous chondrocyte
implantation and osteochondral cylinder transplantation in cartilage repair of the
knee joint - A prospective, comparative trial. J Bone Joint Surg Am 2003;
85A:185-192.

110
14. Micheli LJ, Browne JE, Erggelet C, Fu F, Mandelbaum B, Moseley JB,
Zurakowski D. Autologous chondrocyte implantation of the knee: Multicenter
experience and minimum 3-year follow-up. Clin J Sport Med 2001; 11:223-228.
15. Knutsen G, Drogset JO, Engebretsen L, Grontvedt T, Ludvigsen TC, Loken S,
Solheim E, Strand T, Johansen O. A Randomized Multicenter Trial Comparing
Autologous Chondrocyte Implantation with Microfracture: Long-Term Follow-up
at 14 to 15 Years. J Bone Joint Surg Am 2016; 98:1332-1339.
16. Tuan RS. Stemming cartilage degeneration: Adult mesenchymal stem cells as a
cell source for articular cartilage tissue engineering. Arthritis Rheum 2006;
54:3075-3078.
17. Freed LE, Marquis JC, Nohria A, Emmanual J, Mikos AG, Langer R.
NEOCARTILAGE FORMATION IN VITRO AND IN VIVO USING CELLS
CULTURED ON SYNTHETIC BIODEGRADABLE POLYMERS. J Biomed
Mater Res 1993; 27:11-23.
18. Vunjak-Novakovic G, Martin I, Obradovic B, Treppo S, Grodzinsky AJ, Langer
R, Freed LE. Bioreactor cultivation conditions modulate the composition and
mechanical properties of tissue-engineered cartilage. J Orthop Res 1999; 17:130-
138.
19. Benya PD, Shaffer JD. Dedifferentiated chondrocytes reexpress the differentiated
collagen phenotype when cultured in agarose gels. Cell 1982; 30:215-224.
20. Paige KT, Cima LG, Yaremchuk MJ, Schloo BL, Vacanti JP, Vacanti CA. De
novo cartilage generation using calcium alginate-chondrocyte constructs. Plast
Reconstr Surg 1996; 97:168-178.
111
21. Mauck RL, Soltz MA, Wang CCB, Wong DD, Chao PHG, Valhmu WB, Hung
CT, Ateshian GA. Functional tissue engineering of articular cartilage through
dynamic loading of chondrocyte-seeded agarose gels. J Biomech Eng T ASME
2000; 122:252-260.
22. Mauck RL, Nicoll SB, Seyhan SL, Ateshian GA, Hung CT. Synergistic action of
growth factors and dynamic loading for articular cartilage tissue engineering.
Tissue Eng 2003; 9:597-611.
23. Crawford DC, Heveran CM, Cannon WD, Foo LF, Potter HG. An Autologous
Cartilage Tissue Implant NeoCart for Treatment of Grade III Chondral Injury to
the Distal Femur Prospective Clinical Safety Trial at 2 Years. Am J Sports Med
2009; 37:1334-1343.
24. Crawford DC, DeBerardino TM, Williams RJ. NeoCart, an Autologous Cartilage
Tissue Implant, Compared with Microfracture for Treatment of Distal Femoral
Cartilage Lesions An FDA Phase-II Prospective, Randomized Clinical Trial After
Two Years. J Bone Joint Surg Am 2012; 94A:979-989.
25. Pittenger MF, Mackay AM, Beck SC, Jaiswal RK, Douglas R, Mosca JD,
Moorman MA, Simonetti DW, Craig S, Marshak DR. Multilineage potential of
adult human mesenchymal stem cells. Science 1999; 284:143-147.
26. Bianco P, Robey PG, Simmons PJ. Mesenchymal stem cells: Revisiting history,
concepts, and assays. Cell Stem Cell 2008; 2:313-319.
27. Mauck RL, Yuan X, Tuan RS. Chondrogenic differentiation and functional
maturation of bovine mesenchymal stem cells in long-term agarose culture.
Osteoarthritis Cartilage 2006; 14:179-189.

112
28. Huang AH, Stein A, Tuan RS, Mauck RL. Transient Exposure to Transforming
Growth Factor Beta 3 Improves the Mechanical Properties of Mesenchymal Stem
Cell–Laden Cartilage Constructs in a Density-Dependent Manner. Tissue Eng
Part A 2009; 15:3461-3472.
29. Sampat SR, Dermksian MV, Oungoulian SR, Winchester RJ, Bulinski JC,
Ateshian GA, Hung CT. Applied osmotic loading for promoting development of
engineered cartilage. J Biomech 2013; 46:2674-2681.
30. O'Connell GD, Nims RJ, Green J, Cigan AD, Ateshian GA, Hung CT. TIME
AND DOSE-DEPENDENT EFFECTS OF CHONDROITINASE ABC ON
GROWTH OF ENGINEERED CARTILAGE. Eur Cell Mater 2014; 27:312-320.
31. Suh JKF, Matthew HWT. Application of chitosan-based polysaccharide
biomaterials in cartilage tissue engineering: a review. Biomaterials 2000;
21:2589-2598.
32. Varghese S, Hwang NS, Canver AC, Theprungsirikul P, Lin DW, Elisseeff J.
Chondroitin sulfate based niches for chondrogenic differentiation of mesenchymal
stem cells. Matrix Biol 2008; 27:12-21.
33. Kim IL, Mauck RL, Burdick JA. Hydrogel design for cartilage tissue engineering:
A case study with hyaluronic acid. Biomaterials 2011; 32:8771-8782.
34. Moutos FT, Freed LE, Guilak F. A biomimetic three-dimensional woven
composite scaffold for functional tissue engineering of cartilage. Nat Mater 2007;
6:162-167.
113
35. Bian L, Guvendiren M, Mauck RL, Burdick JA. Hydrogels that mimic
developmentally relevant matrix and N-cadherin interactions enhance MSC
chondrogenesis. Proc Natl Acad Sci U S A 2013; 110:10117-10122.
36. Brunger JM, Huynh NPT, Guenther CM, Perez-Pinera P, Moutos FT, Sanchez-
Adams J, Gersbach CA, Guilak F. Scaffold-mediated lentiviral transduction for
functional tissue engineering of cartilage. Proc Natl Acad Sci U S A 2014;
111:E798-E806.
37. Kandel RA, Boyle J, Gibson G, Cruz T, Speagle M. In vitro formation of
mineralized cartilagenous tissue by articular chondrocytes. In Vitro Cell Dev Biol
- Animal 1997; 33:174-181.
38. Yu H, Grynpas M, Kandel RA. Composition of cartilagenous tissue with
mineralized and non-mineralized zones formed in vitro. Biomaterials 1997;
18:1425-1431.
39. Johnstone B, Hering TM, Caplan AI, Goldberg VM, Yoo JU. In Vitro
Chondrogenesis of Bone Marrow-Derived Mesenchymal Progenitor Cells. Exp
Cell Res 1998; 238:265-272.
40. Sekiya I, Vuoristo JT, Larson BL, Prockop DJ. In vitro cartilage formation by
human adult stem cells from bone marrow stroma defines the sequence of cellular
and molecular events during chondrogenesis. Proc Natl Acad Sci U S A 2002;
99:4397-4402.
41. Bhumiratana S, Eton RE, Oungoulian SR, Wan LQ, Ateshian GA, Vunjak-
Novakovic G. Large, stratified, and mechanically functional human cartilage

114
grown in vitro by mesenchymal condensation. Proc Natl Acad Sci U S A 2014;
111:6940-6945.
42. Murdoch AD, Grady LM, Ablett MP, Katopodi T, Meadows RS, Hardingham TE.
Chondrogenic Differentiation of Human Bone Marrow Stem Cells in Transwell
Cultures: Generation of Scaffold-Free Cartilage. Stem Cells 2007; 25:2786-2796.
43. Lee WD, Hurtig MB, Kandel RA, Stanford WL. Membrane Culture of Bone
Marrow Stromal Cells Yields Better Tissue Than Pellet Culture for Engineering
Cartilage-Bone Substitute Biphasic Constructs in a Two-Step Process. Tissue Eng
Part C 2011; 17:939-948.
44. Pelttari K, Winter A, Steck E, Goetzke K, Hennig T, Ochs BG, Aigner T, Richter
W. Premature induction of hypertrophy during in vitro chondrogenesis of human
mesenchymal stem cells correlates with calcification and vascular invasion after
ectopic transplantation in SCID mice. Arthritis Rheum 2006; 54:3254-3266.
45. Scotti C, Piccinini E, Takizawa H, Todorov A, Bourgine P, Papadimitropoulos A,
Barbero A, Manz MG, Martin I. Engineering of a functional bone organ through
endochondral ossification. Proc Natl Acad Sci U S A 2013; 110:3997-4002.
46. Scotti C, Tonnarelli B, Papadimitropoulos A, Scherberich A, Schaeren S,
Schauerte A, Lopez-Rios J, Zeller R, Barbero A, Martin I. Recapitulation of
endochondral bone formation using human adult mesenchymal stem cells as a
paradigm for developmental engineering. Proc Natl Acad Sci U S A 2010;
107:7251-7256.
115
47. Bahney CS, Hu DP, Taylor AJ, Ferro F, Britz HM, Hallgrimsson B, Johnstone B,
Miclau T, Marcucio RS. Stem Cell- Derived Endochondral Cartilage Stimulates
Bone Healing by Tissue Transformation. J Bone Miner Res 2014; 29:1269-1282.
48. Harada N, Watanabe Y, Sato K, Abe S, Yamanaka K, Sakai Y, Kaneko T,
Matsushita T. Bone regeneration in a massive rat femur defect through
endochondral ossification achieved with chondrogenically differentiated MSCs in
a degradable scaffold. Biomaterials 2014; 35:7800-7810.
49. Dell'Accio F, Cosimo De B, Luyten FP. Molecular markers predictive of the
capacity of expanded human articular chondrocytes to form stable cartilage in
vivo. Arthritis Rheum 2001; 44:1608-1619.
50. De Bari C, Dell'Accio F, Luyten FP. Failure of in vitro-differentiated
mesenchymal stem cells from the synovial membrane to form ectopic stable
cartilage in vivo. Arthritis Rheum 2004; 50:142-150.
51. Goldring MB, Tsuchimochi K, Ijiri K. The control of chondrogenesis. J Cell
Biochem 2006; 97:33-44.
52. Kronenberg HM. Developmental regulation of the growth plate. Nature 2003;
423:332-336.
53. Hentze H, Soong PL, Wang ST, Phillips BW, Putti TC, Dunn NR. Teratoma
formation by human embryonic stem cells: Evaluation of essential parameters for
future safety studies. Stem Cell Res 2009; 2:198-210.
54. VandeVord PJ, Matthew HWT, DeSilva SP, Mayton L, Wu B, Wooley PH.
Evaluation of the biocompatibility of a chitosan scaffold in mice. J Biomed Mater
Res 2002; 59:585-590.

116
55. Haynesworth SE, Goshima J, Goldberg VM, Caplan AI. CHARACTERIZATION
OF CELLS WITH OSTEOGENIC POTENTIAL FROM HUMAN MARROW.
Bone 1992; 13:81-88.
56. Tsigkou O, Pomerantseva I, Spencer JA, Redondo PA, Hart AR, O'Doherty E,
Lin Y, Friedrich CC, Daheron L, Lin CP, et al. Engineered vascularized bone
grafts. Proc Natl Acad Sci U S A 2010; 107:3311-3316.
57. Reinisch A, Etchart N, Thomas D, Hofmann NA, Fruehwirth M, Sinha S, Chan
CK, Senarath-Yapa K, Seo E-Y, Wearda T, et al. Epigenetic and in vivo
comparison of diverse MSC sources reveals an endochondral signature for human
hematopoietic niche formation. Blood 2015; 125:249-260.
58. Lipman JM, McDevitt CA, Sokoloff L. XENOGRAFTS OF ARTICULAR
CHONDROCYTES IN THE NUDE-MOUSE. Calcif Tissue Int 1983; 35:767-
772.
59. Wright GC, Miller F, Sokoloff L. INDUCTION OF BONE BY XENOGRAFTS
OF RABBIT GROWTH PLATE CHONDROCYTES IN THE NUDE-MOUSE.
Calcif Tissue Int 1985; 37:250-256.
60. Blumer MJF, Hausott B, Schwarzer C, Hayman AR, Stempel J, Fritsch H. Role of
tartrate-resistant acid phosphatase (TRAP) in long bone development. Mech Dev
2012; 129:162-176.
61. Xie H, Cui Z, Wang L, Xia Z, Hu Y, Xian L, Li C, Xie L, Crane J, Wan M, et al.
PDGF-BB secreted by preosteoclasts induces angiogenesis during coupling with
osteogenesis. Nat Med 2014; 20:1270-1278.

117
62. Henderson JE, Gao C, Harvey EJ. Skeletal Phenotyping in Rodents: Tissue
Isolation and Manipulation. 2011.
63. Zaidi M. Skeletal remodeling in health and disease. Nat Med 2007; 13:791-801.
64. Amling M, Herden S, Posl M, Hahn M, Ritzel H, Delling G. Heterogeneity of the
skeleton: Comparison of the trabecular microarchitecture of the spine, the iliac
crest, the femur, and the calcaneus. J Bone Miner Res 1996; 11:36-45.
65. Hildebrand T, Laib A, Muller R, Dequeker J, Ruegsegger P. Direct three-
dimensional morphometric analysis of human cancellous bone: Microstructural
data from spine, femur, iliac crest, and calcaneus. J Bone Miner Res 1999;
14:1167-1174.
66. Lochmueller E-M, Matsuura M, Bauer J, Hitzl W, Link TM, Mueller R, Eckstein
F. Site-Specific Deterioration of Trabecular Bone Architecture in Men and
Women With Advancing Age. J Bone Miner Res 2008; 23:1964-1973.
67. Zhou B, Liu XS, Wang J, Lu XL, Fields AJ, Guo XE. Dependence of mechanical
properties of trabecular bone on plate-rod microstructure determined by
individual trabecula segmentation (ITS). J Biomech 2014; 47:702-708.
68. Naveiras O, Nardi V, Wenzel PL, Hauschka PV, Fahey F, Daley GQ. Bone-
marrow adipocytes as negative regulators of the haematopoietic
microenvironment. Nature 2009; 460:259-U124.
69. Torisawa Y-s, Spina CS, Mammoto T, Mammoto A, Weaver JC, Tat T, Collins
JJ, Ingber DE. Bone marrow-on-a-chip replicates hematopoietic niche physiology
in vitro. Nature Methods 2014; 11:663-+.

118
70. Kreja L, Brenner RE, Tautzenberger A, Liedert A, Friemert B, Ehrnthaller C,
Huber-Lang M, Ignatius A. Non-Resorbing Osteoclasts Induce Migration and
Osteogenic Differentiation of Mesenchymal Stem Cells. J Cell Biochem 2010;
109:347-355.
71. Yang L, Tsang KY, Tang HC, Chan D, Cheah KSE. Hypertrophic chondrocytes
can become osteoblasts and osteocytes in endochondral bone formation. Proc Natl
Acad Sci U S A 2014; 111:12097-12102.
72. Zhou X, von der Mark K, Henry S, Norton W, Adams H, de Crombrugghe B.
Chondrocytes Transdifferentiate into Osteoblasts in Endochondral Bone during
Development, Postnatal Growth and Fracture Healing in Mice. PLoS Genet 2014;
10.
73. Briken V, Mosser DM. Editorial: Switching on arginase in M2 macrophages. J
Leukocyte Biol 2011; 90:839-841.
74. Hoemann CD, Chen GP, Marchand C, Tran-Khanh N, Thibault M, Chevrier A,
Sun J, Shive MS, Fernandes MJG, Poubelle PE, et al. Scaffold-Guided
Subchondral Bone Repair Implication of Neutrophils and Alternatively Activated
Arginase-1+Macrophages. Am J Sports Med 2010; 38:1845-1856.
75. Loke P, Gallagher L, Nair MG, Zang X, Brombacher F, Mohrs M, Allison JP,
Allen JE. Alternative activation is an innate response to injury that requires
CD4(+) T cells to be sustained during chronic infection. J Immunol 2007;
179:3926-3936.
119
76. Stein M, Keshav S, Harris N, Gordon S. Interleukin-4 Potently Enhances Murine
Macrophage Mannose Receptor Activity - a Marker of Alternative Immunological
Macrophage Activation. J Exp Med 1992; 176:287-292.
77. Hesse M, Modolell M, La Flamme AC, Schito M, Fuentes JM, Cheever AW,
Pearce EJ, Wynn TA. Differential regulation of nitric oxide synthase-2 and
arginase-1 by type 1/type 2 cytokines in vivo: Granulomatous pathology is shaped
by the pattern of L-arginine metabolism. J Immunol 2001; 167:6533-6544.
78. van't Hof RJ, Armour KJ, Smith LM, Armour KE, Wei XQ, Liew FY, Ralston
SH. Requirement of the inducible nitric oxide synthase pathway for IL-1-induced
osteoclastic bone resorption. Proc Natl Acad Sci U S A 2000; 97:7993-7998.
79. Zheng H, Yu X, Collin-Osdoby P, Osdoby P. RANKL stimulates inducible nitric-
oxide synthase expression and nitric oxide production in developing osteoclasts -
An autocrine negative feedback mechanism triggered by RANKL-induced
interferon-beta via NF-kappa B that restrains osteoclastogenesis and bone
resorption. J Biol Chem 2006; 281:15809-15820.
80. Yeon JT, Choi SW, Kim SH. Arginase 1 is a negative regulator of osteoclast
differentiation. Amino Acids 2016; 48:559-565.
81. Schlundt C, El Khassawna T, Serra A, Dienelt A, Wendler S, Schell H, van
Rooijen N, Radbruch A, Lucius R, Hartmann S, et al. Macrophages in bone
fracture healing: Their essential role in endochondral ossification. Bone 2015.
82. An G, Acharya C, Feng XY, Wen K, Zhong MK, Zhang L, Munshi NC, Qiu LG,
Tai YT, Anderson KC. Osteoclasts promote immune suppressive

120
microenvironment in multiple myeloma: therapeutic implication. Blood 2016;
128:1590-1603.
83. Waldman SD, Grynpas MD, Pilliar RM, Kandel RA. Characterization of
cartilagenous tissue formed on calcium polyphosphate substrates in vitro. J
Biomed Mater Res 2002; 62:323-330.
84. Kandel RA, Grynpas M, Pilliar R, Lee J, Wang J, Waldman S, Zalzal P, Hurtig
M. Repair of osteochondral defects with biphasic cartilage-calcium polyphosphate
constructs in a Sheep model. Biomaterials 2006; 27:4120-4131.
85. Hayes AJ, Hall A, Brown L, Tubo R, Caterson B. Macromolecular Organization
and In Vitro Growth Characteristics of Scaffold-free Neocartilage Grafts. J
Histochem Cytochem 2007; 55:853-866.
86. Ahmed N, Gan L, Nagy A, Zheng J, Wang C, Kandel RA. Cartilage Tissue
Formation Using Redifferentiated Passaged Chondrocytes In Vitro. Tissue Eng
Part A 2008; 15:665-673.
87. Hu JC, Athanasiou KA. A Self-Assembling Process in Articular Cartilage Tissue
Engineering. Tissue Eng 2006; 12:969-979.
88. Ofek G, Revell CM, Hu JC, Allison DD, Grande-Allen KJ, Athanasiou KA.
Matrix Development in Self-Assembly of Articular Cartilage. PLoS ONE 2008;
3:e2795.
89. Rutgers M, Saris DB, Vonk LA, van Rijen MH, Akrum V, Langeveld D, van
Boxtel A, Dhert WJ, Creemers LB. Effect of Collagen Type I or Type II on
Chondrogenesis by Cultured Human Articular Chondrocytes. Tissue Eng Part A
2012; 19:59-65.

121
90. Murphy MK, Huey DJ, Hu JC, Athanasiou KA. TGF-β1, GDF-5, and BMP-2
Stimulation Induces Chondrogenesis in Expanded Human Articular Chondrocytes
and Marrow-Derived Stromal Cells. Stem Cells 2015; 33:762-773.
91. Elder SH, Cooley AJ, Borazjani A, Sowell BL, To H, Tran SC. Production of
Hyaline-like Cartilage by Bone Marrow Mesenchymal Stem Cells in a Self-
Assembly Model. Tissue Eng Part A 2009; 15:3025-3036.
92. Co C, Vickaryous MK, Koch TG. Membrane culture and reduced oxygen tension
enhances cartilage matrix formation from equine cord blood mesenchymal
stromal cells in vitro. Osteoarthritis Cartilage 2014; 22:472-480.
93. Armstrong CG, Lai WM, Mow VC. An Analysis of the Unconfined Compression
of Articular-Cartilage. J Biomech Eng T ASME 1984; 106:165-173.
94. Buschmann MD, Kim YJ, Wong M, Frank E, Hunziker EB, Grodzinsky AJ.
Stimulation of aggrecan synthesis in cartilage explants by cyclic loading is
localized to regions of high interstitial fluid flow. Arch Biochem Biophys 1999;
366:1-7.
95. Sah RLY, Kim YJ, Doong JYH, Grodzinsky AJ, Plaas AHK, Sandy JD.
Biosynthetic Response of Cartilage Explants to Dynamic Compression. J Orthop
Res 1989; 7:619-636.
96. Kim YJ, Bonassar LJ, Grodzinsky AJ. The Role of Cartilage Streaming Potential,
Fluid-Flow and Pressure in the Stimulation of Chondrocyte Biosynthesis during
Dynamic Compression. J Biomech 1995; 28:1055-1066.
122
97. Park S, Hung CT, Ateshian GA. Mechanical response of bovine articular cartilage
under dynamic unconfined compression loading at physiological stress levels.
Osteoarthritis Cartilage 2004; 12:65-73.
98. Von der Mark K, Von der Mark H. IMMUNOLOGICAL AND BIOCHEMICAL
STUDIES OF COLLAGEN TYPE TRANSITION DURING IN VITRO
CHONDROGENESIS OF CHICK LIMB MESODERMAL CELLS. J Cell Biol
1977; 73:736-747.
99. Von der Mark K. Immunological studies on collagen type transition in
chondrogenesis. Curr Top Dev Biol 1980; 14:199-225.
100. Nöth U, Rackwitz L, Heymer A, Weber M, Baumann B, Steinert A, Schütze N,
Jakob F, Eulert J. Chondrogenic differentiation of human mesenchymal stem cells
in collagen type I hydrogels. J Biomed Mater Res 2007; 83A:626-635.
101. Ragetly G, Griffon DJ, Chung YS. The effect of type II collagen coating of
chitosan fibrous scaffolds on mesenchymal stem cell adhesion and
chondrogenesis. Acta Biomater 2010; 6:3988-3997.
102. Cai R, Nakamoto T, Kawazoe N, Chen G. Influence of stepwise chondrogenesis-
mimicking 3D extracellular matrix on chondrogenic differentiation of
mesenchymal stem cells. Biomaterials 2015; 52:199-207.
103. Hynes RO. The Extracellular Matrix: Not Just Pretty Fibrils. Science 2009;
326:1216-1219.
104. Bornes T, Jomha N, Mulet-Sierra A, Adesida A. Optimal Seeding Densities for In
Vitro Chondrogenesis of Two and Three Dimensional-Isolated and Expanded
123
Bone Marrow-Derived Mesenchymal Stromal Stem Cells within a Porous
Collagen Scaffold. Tissue Eng Part C 2015.
105. Ray P, Chapman SC. Cytoskeletal Reorganization Drives Mesenchymal
Condensation and Regulates Downstream Molecular Signaling. PLoS ONE 2015;
10.
106. Murdoch AD, Hardingham TE, Eyre DR, Fernandes RJ. The Development of a
Mature Collagen Network in Cartilage from Human Bone Marrow Stem Cells in
Transwell Culture. Matrix Biol 2015.
107. Mueller MB, Tuan RS. Functional characterization of hypertrophy in
chondrogenesis of human mesenchymal stem cells. Arthritis Rheum 2008;
58:1377-1388.
108. Williams GM, Klisch SM, Sah RL. Bioengineering cartilage growth, maturation,
and form. Pediatr Res 2008; 63:527-534.
109. Serafini M, Sacchetti B, Pievani A, Redaelli D, Remoli C, Biondi A, Riminucci
M, Bianco P. Establishment of bone marrow and hematopoietic niches in vivo by
reversion of chondrocyte differentiation of human bone marrow stromal cells.
Stem Cell Res 2014; 12:659-672.
110. Gibson G. Active role of chondrocyte apoptosis in endochondral ossification.
Microsc Res Techniq 1998; 43:191-204.
111. Tew SR, Kwan APL, Hann A, Thomson BM, Archer CW. The reactions of
articular cartilage to experimental wounding - Role of apoptosis. Arthritis Rheum
2000; 43:215-225.
124
112. Narcisi R, Cleary MA, Brama PAJ, Hoogduijn MJ, Tüysüz N, ten Berge D, van
Osch GJVM. Long-Term Expansion, Enhanced Chondrogenic Potential, and
Suppression of Endochondral Ossification of Adult Human MSCs via WNT
Signaling Modulation. Stem Cell Rep 2015; 4:459-472.
113. Leijten J, Georgi N, Teixeira LM, van Blitterswijk CA, Post JN, Karperien M.
Metabolic programming of mesenchymal stromal cells by oxygen tension directs
chondrogenic cell fate. Proc Natl Acad Sci U S A 2014; 111:13954-13959.
114. Albro MB, Nims RJ, Durney KM, Cigan AD, Shim JJ, Vunjak-Novakovic G,
Hung CT, Ateshian GA. Heterogeneous engineered cartilage growth results from
gradients of media-supplemented active TGF-β and is ameliorated by the
alternative supplementation of latent TGF-β. Biomaterials 2016; 77:173-185.
115. Langer RS, Vacanti JP. Tissue engineering: The challenges ahead. Sci Am 1999;
280:86-89.
116. Nakao K, Morita R, Saji Y, Ishida K, Tomita Y, Ogawa M, Saitoh M, Tomooka
Y, Tsuji T. The development of a bioengineered organ germ method. Nature
Methods 2007; 4:227-230.
117. Odriscoll SW, Keeley FW, Salter RB. THE CHONDROGENIC POTENTIAL OF
FREE AUTOGENOUS PERIOSTEAL GRAFTS FOR BIOLOGICAL
RESURFACING OF MAJOR FULL-THICKNESS DEFECTS IN JOINT
SURFACES UNDER THE INFLUENCE OF CONTINUOUS PASSIVE
MOTION - AN EXPERIMENTAL INVESTIGATION IN THE RABBIT. J Bone
Joint Surg Am 1986; 68A:1017-1035.
125
118. Ballock RT, Heydemann A, Wakefield LM, Flanders KC, Roberts AB, Sporn
MB. TGF-beta 1 prevents hypertrophy of epiphyseal chondrocytes: regulation of
gene expression for cartilage matrix proteins and metalloproteases. Dev Biol
1993; 158:414-429.
119. Bassett JHD, Williams GR. The molecular actions of thyroid hormone in bone.
Trends Endocrinol Metab 2003; 14:356-364.
120. Okubo Y, Reddi AH. Thyroxine downregulates Sox9 and promotes chondrocyte
hypertrophy. Biochem Biophys Res Commun 2003; 306:186-190.
121. Mello MA, Tuan RS. Effects of TGF-beta 1 and triiodothyronine on cartilage
maturation: In vitro analysis using long-term high-density micromass cultures of
chick embryonic limb mesenchymal cells. J Orthop Res 2006; 24:2095-2105.
122. Lee WD, Hurtig MB, Pilliar RM, Stanford WL, Kandel RA. Engineering of
hyaline cartilage with a calcified zone using bone marrow stromal cells.
Osteoarthritis Cartilage 2015; 23:1307-1315.
123. DeLise AM, Fischer L, Tuan RS. Cellular interactions and signaling in cartilage
development. Osteoarthritis Cartilage 2000; 8:309-334.
124. Ikeda T, Kamekura S, Mabuchi A, Kou I, Seki S, Takato T, Nakamura K,
Kawaguchi H, Ikegawa S, Chung UI. The combination of SOX5, SOX6, and
SOX9 (the SOX trio) provides signals sufficient for induction of permanent
cartilage. Arthritis Rheum 2004; 50:3561-3573.
125. Henry SP, Liang S, Akdemir KC, de Crombrugghe B. The Postnatal Role of Sox9
in Cartilage. J Bone Miner Res 2012; 27:2511-2525.

126
126. Oh H, Chun CH, Chun JS. Dkk-1 expression in chondrocytes inhibits
experimental osteoarthritic cartilage destruction in mice. Arthritis Rheum 2012;
64:2568-2578.
127. Minina E, Kreschel C, Naski MC, Ornitz DM, Vortkamp A. Interaction of FGF,
lhh/Pthlh, and BMP signaling integrates chondrocyte proliferation and
hypertrophic differentiation. Dev Cell 2002; 3:439-449.
128. Hoemann CD, Lafantaisie-Favreau C-H, Lascau-Coman V, Chen G, Guzman-
Morales J. The Cartilage-Bone Interface. J Knee Surg 2012; 25:85-97.
129. Pacifici M, Koyama E, Iwamoto M. Mechanisms of synovial joint and articular
cartilage formation: Recent advances, but many lingering mysteries. Birth Defects
Res C Embryo 2005; 75:237-248.
130. Craft AM, Rockel JS, Nartiss Y, Kandel RA, Alman BA, Keller GM. Generation
of articular chondrocytes from human pluripotent stem cells. Nat Biotech 2015;
33:638-645.