
Carrying the Energy Future rev H2 - EV WORLD.COM · Carrying the Energy Future Comparing Hydrogen...
52
Institute for Lifecycle Environmental Assessment PO Box 22437 Seattle, Washington 98122-0437 www.ilea.org Carrying the Energy Future Comparing Hydrogen and Electricity for Transmission, Storage and Transportation Patrick Mazza & Roel Hammerschlag June 2004
Transcript of Carrying the Energy Future rev H2 - EV WORLD.COM · Carrying the Energy Future Comparing Hydrogen...
Institute for Lifecycle Environmental Assessment PO Box 22437 Seattle, Washington 98122-0437 www.ilea.org
Carrying the Energy Future
Comparing Hydrogen and Electricity for Transmission, Storage and Transportation
Patrick Mazza &
Roel Hammerschlag
June 2004

ii
© 2004 Institute for Lifecycle Environmental Assessment
This document may be duplicated and distributed without permission from ILEA provided that 1. it remains in Adobe Portable Document (.pdf) format, 2. it is not altered in any way and 3. it is not incorporated in another work.
Extracts and quotations for the purpose of criticism, comment, news reporting, teaching, scholarship, or research are permitted per the provisions of Fair Use law, 17 USC §107. For all other uses, please contact:
Roel Hammerschlag Institute for Lifecycle Environmental Assessment [email protected] tel. 206-328-3093 fax 206-328-6050 PO Box 22437 Seattle, WA 98122-0437
For questions regarding content, contact either author by email:
Patrick Mazza [email protected]
Roel Hammerschlag [email protected]

iii
Acknowledgements
This work, and an abbreviated report of our findings appearing in the journal Energy Policy, were made possible by a grant for Research and Writing from the John D. and Catherine T. MacArthur Foundation Program on Global Security and Sustainability. Patrick Mazza and Roel Hammerschlag would like to thank the foundation for its support; we are honored to have been given the resources to report on such an important subject.
We also would like to thank our two University of Washington research interns, Boyd H. Pro and Christopher P. Schaber, who contributed significant supporting research to this project. Mr. Pro is first author of an article entitled “Energy and Land Use Impacts of Sustainable Transportation Scenarios” submitted to the Journal of Cleaner Production, and Mr. Schaber appears as first author of “Utility Scale Storage of Renewable Energy” appearing in the July, 2004 issue of Electricity Journal. Both articles report findings that served as a foundation for discussion appearing in this report.
Our peer reviewers provided criticism and suggestions that added enormous value to this paper. It would not have been the same without them. They are: John DeCicco, Nathanael Greene, Michael Lazarus, William Leighty and Jason Mark. Of course, the content and conclusions of the final report are ultimately our own work and we take full responsibility for any errors or omissions, and for the conclusions that are drawn.
Andrea Pratt provided additional research support, Kate A. Race designed the executive summary, and Chris Lombardi created the Web adaptation. Dozens of friends and colleagues who cannot all be named provided professional and moral support. We thank all of them.

iv
An executive summary of this report is available separately; electronically at www.ilea.org,
or in print from the office of ILEA.
v
Table of Contents
A Note About Units and Numbers ..............................................................................vii
Introduction ....................................................................................................................1
Box What Is a Fuel Cell?
Part I Renewable Electrolytic Hydrogen and Its Difficulties ......................................9 Harnessing the Energies of Nature ...............................................................................9 An Idealized Scenario: Southwest Solar-Hydrogen.....................................................10 Energy Transmission: Pipelines vs. Wires ..................................................................12
Box Pipeline Leakage and Atmospheric Impacts Energy Storage: Hydrogen vs. Other Options .............................................................15 A Transition Scenario: Northwest Hydro-Gen .............................................................18 Local vs. Remote Hydrogen Production ......................................................................19
Part II Future Cars: Comparing Options ....................................................................21 Rethinking the Electric Vehicle ....................................................................................21
Box FCVs – No Advantage over Hybrids for Now
Overcoming EV Obstacles ..........................................................................................28 Plug-in HEVs: Best of Both Worlds .............................................................................31 Biomass and Hydrogen ...............................................................................................33
Part III Directing Energy for Greatest Climate Benefit..............................................36 The Best Pathways for Renewable Electricity .............................................................36 The Best Pathways for Natural Gas ............................................................................38 Nuclear Energy and Hydrogen ....................................................................................40
Conclusion Finding Common Ground .......................................................................42

vi
vii
A Note About Units and Numbers
This is a paper about energy efficiency, so it includes a lot of numbers, especially numbers that describe quantities of energy. Unfortunately, folks in different parts of the world use different units to describe energy, and within each part of the world different industries favor different units too. To keep things simple for you the reader, we limit our accounting of energy to a few, internationally standardized units.
All quantities of energy, whether they describe an amount of electricity, a quantity of liquid or gaseous fuel, or a quantity of work done, are reported as a number of joules. The joule is the international standard unit for energy, and the only one commonly used by university scientists. It is named after British scientist James Prescott Joule, whose greatest contribution to physics was the understanding of energy equivalences: that work, heat and electricity are all just different forms of energy. A joule is enough energy to lift an object about the size of an apple one meter. It’s a very small unit, so we use large multiples of a joule to keep the numbers manageable:
• A megajoule (MJ) is one million joules. One MJ is the amount of energy necessary to bring about 3 liters (3.2 quarts) of room-temperature water to boiling, or to run a 1,500 watt hair drier for 11 minutes. A liter of gasoline contains about 36 MJ of energy; a gallon contains about 140 MJ.
• A terajoule (TJ) is one million MJ. A medium-size auto fueling station might dispense about one TJ of gasoline each day. A large hydroelectric dam or small nuclear plant can generate about 100 TJ of electricity in one day when running at full capacity.
• An exajoule (EJ) is one million TJ. This is a very large unit of energy, and is useful for discussing national or global energy policy. The United States’ light vehicle fleet uses about 17 EJ of fuel each year, and the United States’ electric system generates about 12 EJ of electricity each year.
Distance is reported in kilometers (km); 1.6 kilometers equal a mile.
We report the energy intensity of automobiles in MJ/km. Less efficient cars have higher energy intensities. The corporate average fuel economy of 2003 vehicles sold in the United States is 3.4 MJ/km, which translates to about 25 miles per gallon of gasoline.
MJ, TJ and EJ are useful for reporting an amount of energy, but sometimes it is necessary to report the rate at which energy can be delivered. The rate at which energy can be delivered is called “power,” and we report power in multiples of watts. One watt is equal to delivering one joule of energy per second. The unit is named after Scotsman James Watt, who made himself rich by inventing, patenting and manufacturing a steam engine far more efficient than its competitors. Just like the joule, the watt is a small unit. So we use multiples as follows.

viii
• A kilowatt (kW) is one thousand watts. One kW is about the average rate of electricity use by a typical American home. A kW is about 1/3 larger than one horsepower, a small car engine provides up to about 60 or 70 kW of power.
• A megawatt (MW) is one thousand kW, and so is a rate of electricity delivery sufficient for about 1,000 homes. A large train locomotive can deliver about 4 MW in power; a small electric generating plant will measure a few hundred MW in size, while a large one may be 2,000 MW.
Pressure is reported in units of bars – one bar is about 15 pounds per square inch (PSI). The air pressure in typical car tires is about 3 bars, and the pressure used to operate air tools in a mechanic’s garage is about 6 bars.
For ease of reading, all numbers in the text are rounded to two significant digits. This explains slight variations between initial assumptions and the calculated efficiency percentages that result. This practice reflects the fact that hypothetical energy scenarios, no matter who is creating them, are necessarily approximate and rarely merit a level of accuracy greater than two significant digits.
Page 1
Introduction
On January 28, 2003 President George W. Bush rose to declare he had joined the growing ranks of hydrogen economy visionaries.
"A single chemical reaction between hydrogen and oxygen generates energy, which can be used to power a car – producing only water, not exhaust fumes," he explained to the joint session of Congress gathered to hear his State of the Union. "With a new national commitment, our scientists and engineers will overcome obstacles to taking these cars from laboratory to showroom, so that the first car driven by a child born today could be powered by hydrogen, and pollution-free."1
Those obstacles are considerable, in significant measure because they involve creating an entirely new system of energy production and delivery on the scale of today’s power grid. The cost in the United States alone has been estimated at between US$200 billion and $500 billion.2,3 Because such a vast investment implies other energy pathways not taken and impinges on crucial issues such as climate change and energy security, any decisions to develop hydrogen infrastructure must be set in the larger context of selecting technologies that provide the greatest benefits. An aim of this paper is to help set criteria for making such choices, in particular to compare hydrogen and electrical options for the power grid and transportation.
The first and most important understanding about the proposed hydrogen energy system is that hydrogen is not an energy source. It is an energy storage medium and carrier. And like the only other commonplace energy carrier, electricity, hydrogen must be made.
Hydrogen constitutes most of the visible matter of the universe. But on Earth almost all hydrogen is bonded with oxygen to create water, or with carbon to make organic matter and hydrocarbons including coal, petroleum and natural gas. Those bonds must be broken to make hydrogen a suitable energy carrier. It must then be isolated and transported to the point where energy is generated. That occurs when hydrogen re-bonds with oxygen either through combustion or the chemical reaction of hydrogen and oxygen on a fuel cell cathode. (See box: What is a fuel cell? on p. 8) Combustion provides heat, while fuel cell reactions generate heat and electricity.
Making hydrogen requires energy. A number of options are available:
• Electrical current run through water to break H2O into its components in a process known as electrolysis.
• Heat from sunlight or advanced nuclear reactors to break water’s bonds in thermochemical processes.
• Steam run through natural gas (NG) to break its four hydrogen atoms from its one carbon atom, known as steam reforming.
1 Bush, George W. State of the Union Address 2003. 28 Jan. 2003. 2 King, R. “Mary Tolan's Modest Proposal.” Business 2.0 June 2003: 116-122. 3 Mintz, M., S. Folga, J. Molburg, and J. Gillette. Cost of Some Hydrogen Fuel Infrastructure Options.
Argonne, IL: Argonne National Laboratory, 2002.
Page 2
• Heat employed to break hydrogen out of coal and organic matter in gasification processes.
• Biological processes that employ organisms to break down water or organic matter.
Steam reforming is the predominant source of hydrogen today, while electrolysis is a well-established technology. The others are at experimental stages.
A long-term dream, reflected in the writings of Jules Verne and carried forward by sustainable energy researchers and advocates is electrolytic hydrogen produced with renewable electricity. Typical is a recent statement by the Green Hydrogen Coalition:
Renewable sources of energy – photovoltaic solar cells, wind, small sustainable hydropower, geothermal, and even wave power – are technologies that are available today and are increasingly being used to produce electricity . . . Once produced, the hydrogen can be stored and used, when needed, to generate electricity or be used directly as fuel. Storage is the key to making renewable energy economically viable. That's because when renewable energy is harnessed to produce electricity, the electricity flows immediately. So if the sun isn't shining or the wind isn't blowing, or the water isn't flowing, electricity can't be generated. But if some of the electricity being generated is used to extract hydrogen from water, which can then be stored for later use, society will have a more continuous supply of power.4
This scenario for an electrical and transportation system based on renewable hydrogen is on its face hugely attractive. It seems to offer solutions to some of the planet’s most desperately pressing problems. Yet complex questions surround the scenario, and the answers are equally complex. They focus around the reality that while renewable electrical generation is theoretically limitless, in the real world limits prevail.
The central question addressed by this study is how to leverage limited renewable electrical generation resources for maximum environmental benefit, in particular for reduction of carbon dioxide (CO2) emissions from fossil fuel burning that are the leading global warming gas. At the core of this consideration is whether renewable resources are best employed to replace petroleum vehicle fuels with electrolytic hydrogen or to supplant coal- and gas-generated electrical power.
We base our analysis primarily on calculations of energy efficiency, grounded in a basic proposition that the degree of efficiency with which renewable energy is employed conditions the degree to which the environmental benefits of renewable energy are realized.5 All energy systems operate with a certain level of inefficiency. The amount of energy that actually provides end use services is less than the amount of potential energy that exists in fuels or the amount of energy generated from those fuels. This study compares the losses of renewable electrolytic hydrogen (ReH2) systems with those that deliver and use electricity directly.
4 Statement of the Green Hydrogen Coalition. Green Hydrogen Coalition. 8 Dec. 2003
<http://www.ems.org/rls/2003/11/20/statement_of_the.html>. Members include Friends of the Earth, Foundation on Economic Trends, Greenpeace, League of
Conservation Voters, Public Citizen, Sierra Club and the US Public Interest Research Group. 5 Where efficiency estimates in this report refer to combustible fuels, the fuel’s higher heating value (HHV)
is used as the basis for calculation.
Page 3
In a sense, this is an unfair contest because ReH2 always involves conversion steps not taken in direct electricity systems. First hydrogen must be produced through electrolysis. Then it must be fed through a fuel cell. The two processes are mirror images of each other.
Between 10%-30% of energy is lost in electrolysis. Then only a portion of the potential energy remaining in the hydrogen is re-converted into electricity. For purposes of this paper we assign a 40% loss at this stage. This gives hydrogen the benefit of the doubt since losses can be substantially higher. Calculating the overall efficiency is a simple matter. If an electrolyzer delivers 80% of the original energy and a fuel cell captures 60% of the energy delivered by the electrolyzer, then only 48% of the original energy remains. Direct electricity does not suffer these losses. Transmitting both hydrogen and electricity takes approximately the same amount of energy. So direct electricity effectively provides two kilowatts to end use services for every kilowatt delivered by ReH2.
These facts are well understood by hydrogen economy proponents and others. Nonetheless, ReH2 remains on the table because it is viewed as capable of providing services in areas where direct electricity is seen as falling short, in particular vehicle fuel and energy storage. This paper will examine direct electricity transportation and storage options that might be competitive with H2 applications.
The inefficiencies of ReH2 have an economic consequence, and most experts project that fossil-derived hydrogen will predominate for some decades. Of approximately 500 billion cubic meters of hydrogen now produced annually for uses ranging from oil refining to food processing, 96% is derived from fossil fuels and only 4% from electrolysis.6 (Global production amounts to 6.4 EJ, equaling approximately one-third the energy demands of the U.S. light vehicle fleet.) Steam reformed gas will likely be able to economically beat ReH2 for decades to come. As NG becomes more costly and supply-constrained, hydrogen derived from coal gasification is waiting in the wings. Coal represents approximately 90% of the world's remaining supplies of conventional fossil fuels.7
Robert Williams of Princeton Environmental Institute illustrates the competitive challenge to ReH2. He projects a scenario of renewable electricity at 2.5 cents/kilowatt-hour, with electrolyzer efficiency of 88% while capital costs are reduced 40%. "Even under these very optimistic assumptions, electrolytic H2 derived from renewable electricity sources would be twice as costly as H2 derived from coal with geological sequestration of the separated CO2, using technologies that are commercially available today.”8
Williams concludes, "The production of H2 from water via either electrolytic or complex thermochemical processes will have only very modest roles in providing H2 unless geological sequestration of CO2 and alternative approaches to keeping fossil CO2 out of
6 United States. Department of Energy. Hydrogen, Fuel Cells and Infrastructure Technologies Program.
Frequently Asked Questions. 19 Jan. 2004 <http://www.eere.energy.gov/hydrogenandfuelcells/hydrogen/faqs.html#year>.
7 Spreng, Daniel T. Net-Energy Analysis and the Energy Requirements of Energy Systems. New York: Praeger, 1988. 23.
8 Williams, Robert H. "Major Roles for Fossil Fuels in an Environmentally Constrained World." Prepared for Sustainability in Energy Production and Utilization in Brazil: The Next Twenty Years. Sao Paulo, Brazil. 18-20 Feb. 2002. 4.
Page 4
the atmosphere (e.g. storing fossil-energy-derived CO2 as carbonate rocks) turn out to be fatally flawed ideas."9
Substantial technological hurdles do exist.
“No company has manufactured CO2 capture systems of an appropriate size or chemistry for capturing emissions from coal-fired power plants,” notes globally recognized sequestration researcher James J. Dooley. “To really learn about sequestration we will need to inject more than one million tons/year into a reservoir for a number of years.”10
Pilot testing of large scale carbon capture and storage is only at the early stages. A major technology gap is instrumentation to verify carbon is not leaking. The tremendous amounts of carbon that would have to be stored in a coal-derived hydrogen system mandate extremely low leakage rates.
Yet while NG-based hydrogen dominates today, and coal could tomorrow, ReH2 could well become economically competitive as renewable electricity costs decline over the century. Williams gives 0.50 cents/MJ (1.8 cents/kilowatt-hour) as the point where ReH2 becomes economically competitive with coal-based hydrogen.11 Wind turbines could reach this range over coming decades, while off-peak hydroelectricity at that price is already available is some areas. But if and when ReH2 reaches market viability, the question regarding environmentally preferable uses of renewable electricity will remain. Answering this question demands comparative analysis of ReH2 and direct electricity options.
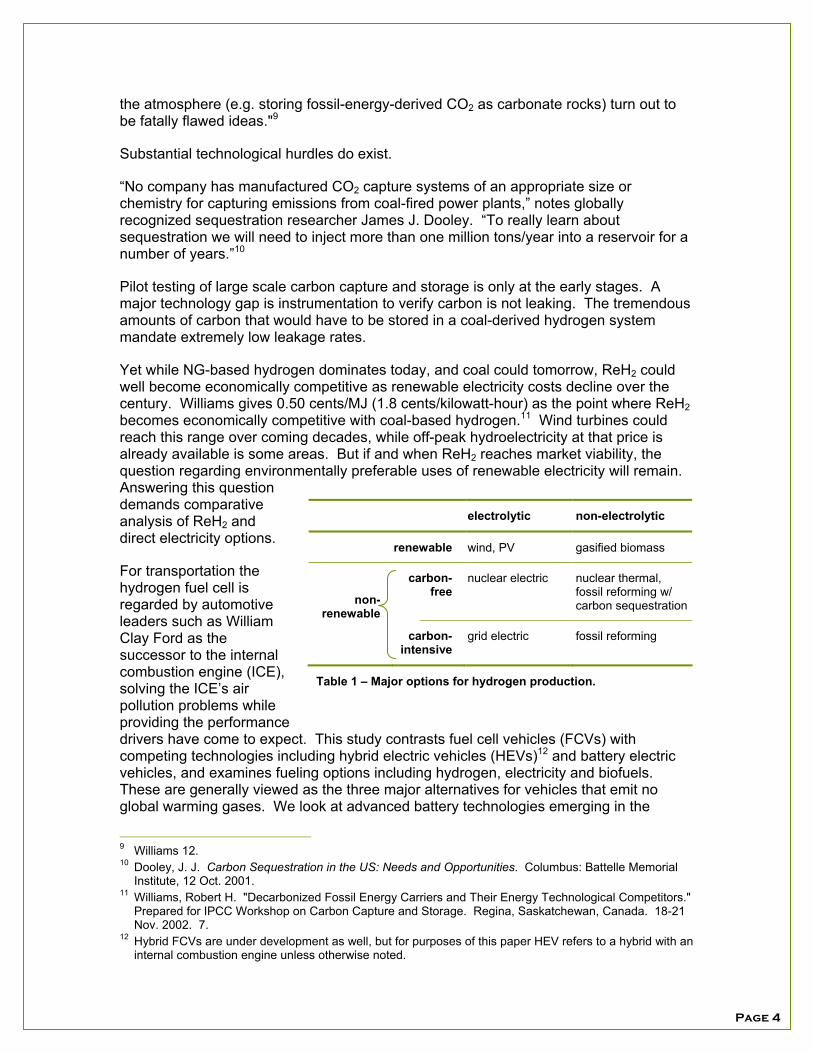
For transportation the hydrogen fuel cell is regarded by automotive leaders such as William Clay Ford as the successor to the internal combustion engine (ICE), solving the ICE’s air pollution problems while providing the performance drivers have come to expect. This study contrasts fuel cell vehicles (FCVs) with competing technologies including hybrid electric vehicles (HEVs)12 and battery electric vehicles, and examines fueling options including hydrogen, electricity and biofuels. These are generally viewed as the three major alternatives for vehicles that emit no global warming gases. We look at advanced battery technologies emerging in the
9 Williams 12. 10 Dooley, J. J. Carbon Sequestration in the US: Needs and Opportunities. Columbus: Battelle Memorial
Institute, 12 Oct. 2001. 11 Williams, Robert H. "Decarbonized Fossil Energy Carriers and Their Energy Technological Competitors."
Prepared for IPCC Workshop on Carbon Capture and Storage. Regina, Saskatchewan, Canada. 18-21 Nov. 2002. 7.
12 Hybrid FCVs are under development as well, but for purposes of this paper HEV refers to a hybrid with an internal combustion engine unless otherwise noted.
electrolytic non-electrolytic
renewable wind, PV gasified biomass
non-renewable
carbon-free
nuclear electric nuclear thermal, fossil reforming w/ carbon sequestration
carbon-intensive
grid electric fossil reforming
Table 1 – Major options for hydrogen production.

Page 5
portable electronics market that are now only coming to prototype EVs, and inquire whether EVs are a range-limited technological “dead-end,” as they are often portrayed. The emerging plug-in hybrid electric vehicle (PHEV) is discussed as a way to merge the best features of EVs and HEVs.
The second major prospective use of H2 energy, as a storage medium for intermittent renewable resources, contends with other energy storage technologies including batteries, pumped storage and compressed air. We offer a comparative analysis.
While this study focuses on the ReH2-direct electricity contrast, it impinges on larger questions about technology development pathways and end games. For if the major envisioned uses of H2 energy prove to be better served by direct electricity alternatives in the short-to-mid range, they may well be better served in the long range. For example, development of flow batteries that store electricity at utility scale could preclude the need to develop extensive H2 storage systems. Development of hybrid vehicle technologies or biofuel networks could postpone or preempt the widespread emergence of hydrogen FCVs.
A crucial distinction must be made between hydrogen and fuel cells. Discussions of the hydrogen economy often place the two in the same breath. But hydrogen is a fuel while fuel cells are energy conversion devices. Creation of a hydrogen fuel system is hindered by multiple inefficiencies, as this study will document. Fuel cells, on the other hand, are highly efficient energy conversion devices that utilize hydrogen. Many can draw that hydrogen from other fuels such as natural gas, biological methane or biofuels, and so can avoid the inefficiencies involved in generating and delivering pure hydrogen. Fuel cells can operate as stationary, distributed electrical generators, potentially at significantly higher efficiencies than central power stations or other small-scale distributed generation technologies. The option fuel cells provide to generate power close to its end use offers yet greater efficiency gains. Power line losses are avoided. The heat produced by fuel cells can drive building heating and cooling systems. The emergence of a substantial fuel cell market is in no way conditioned on the development of a hydrogen fueling network.
Joseph Romm of the Center for Energy and Climate Solutions asserts that fuel cell vehicles are unlikely to exceed more than 5% market share by 2030. Nonetheless, Romm adds, "Widespread use of stationary fuel cells running on natural gas seems likely post-2010, particularly if high-temperature fuel cells achieve their cost and performance targets."13
We ground our approach in energy efficiency analysis, because it offers a transparent and simple means to illustrate the demands and impacts of various energy pathways. Comparing the relative efficiencies of hydrogen and electricity brings a clarity that other metrics do not. Efficiency analysis clarifies how much useful work is derived from equivalent amounts of energy. Economic analysis provides other important measures, and we report on selected results by other researchers. Economics will have much to say about whether this or that energy pathway will actually be implemented. At the same time, energy efficiency provides a framework to identify which pathways offer the most promise for environmental gains. It is also more appropriate when exploring longer
13 Center for Energy and Climate Solutions. Hydrogen and Fuel Cells: A Technology and Policy Review.
Prepared for the National Commission on Energy Policy. October 2003.
Page 6
term pictures to employ energy efficiency analysis since economic projections tend to be subject to a greater degree of flux and uncertainty.
The efficiency with which energy is used ultimately does deeply influence economics. To preview a finding you will encounter later in this study, a 100-turbine wind farm that employs developing battery technologies will deliver as much end use energy as a 160-turbine wind farm that stores energy with H2. That means 1.6 times the capital investment in turbines to deliver the same amount of saleable kilowatts. This is only suggestive since the relative costs of storage technologies also comes into play. We invite full study of these economic questions, but maintain that energy efficiency remains the bedrock environmental concern that should drive other considerations.
For no reason is the efficient use of renewable resources more important than the pressing need to reduce the greenhouse gases that are increasing the capacity of the atmosphere to trap solar radiation, resulting in global warming and climate change. While the 1992 Rio treaty committed the world's nations to avoid dangerous concentrations of the gases that trap additional solar radiation, it is fair to ask whether we are not reaching that point already. We do not understand the points at which the climate system will pass critical thresholds unleashing catastrophic feedback effects, in particular massive releases from natural carbon sinks such as forests, permafrost and continental shelf hydrates. Recent refinements in global climate modeling done by the Hadley Center, claimed as the first to fully integrate such biospheric impacts, project trends towards the high end of Intergovernmental Panel on Climate Change (IPCC) scenarios – a 5.5 ºC increase in global temperatures over this century.14
The IPCC, the world's most authoritative body of climate scientists, concludes that 55-85% reductions in greenhouse gas emissions are necessary to stabilize atmospheric concentrations.15 Approximately three-quarters of human CO2 emissions derive from burning coal, oil and natural gas.16 A team of scientists examining stabilization scenarios concluded that holding carbon dioxide to its current concentrations would require production of 10 terawatts (TW) of non-carbon-emitting power by 2018, equal to two-thirds of current primary global production. If that 10 TW is not produced until 2035 CO2 levels will double.17 On the next 15-30 years hinges the future of the global climate system, so it is crucial that zero-carbon energy sources be utilized to greatest effect.
Renewable electricity can provide the same energy services as fossil fuels while eliminating greenhouse emissions. But some uses of renewable electricity yield greater emissions cuts than others. This study calculates the varying CO2 reduction benefits of directing renewables to transportation or the power grid.
Trends in technology, economics and market growth indicate that renewable power will become more abundant but that it is likely to remain a relatively scarce resource for some time. As it does become more abundant, the environmental opportunity costs
14 Jones, Chris D., et al. “Strong carbon cycle feedbacks in a climate model with interactive CO2 and
sulphate aerosols.” Geophysical Research Letters 30.9 (2003): 1479-1482. 15 Intergovernmental Panel on Climate Change. Working Group III. Climate Change 2001: Mitigation.
Geneva: IPCC Secretariat 2002. Section 2.3.2.2. 16 Intergovernmental Panel on Climate Change. Working Group I. Summary for Policymakers. Geneva:
IPCC Secretariat 2002. 7. 17 Hoffert, Martin I., et al. "Energy implications of future stabilization of atmospheric CO2 content." Nature
6705 (1998): 881-4.

Page 7
discussed in this paper become less relevant. Where a cornucopic abundance of renewables exists, where renewable generation would not be tapped without an H2 market or would otherwise go to waste, the situation entirely changes. But intense global energy demand growth is projected. Most renewable generation will find direct electricity markets, and most of the world will not experience a renewables surplus for decades at least.18 So efficiency questions will remain important. And even renewable electricity has environmental impacts, as various controversies over proposed wind farms attest. These impacts imply limits that will continue to make efficient utilization of renewable energy a vital concern.
While today there is a great “buzz” over hydrogen, we hope to energize discussion of direct electrical options. Before society undertakes the massive task of creating an entirely new energy carrier system, we should fully investigate the potentials for electricity to carry the demands of the energy future.
18 International Energy Agency. World Energy Outlook 2002. Paris: OECD/IEA, 2002.
Page 8
What Is a Fuel Cell?
The fuel cell was invented by Sir William Grove in 1839. It was not until the 1950s, however, that the National Aeronautics and Space Administration (NASA) constructed the first practical fuel cells to produce power for space vehicles.
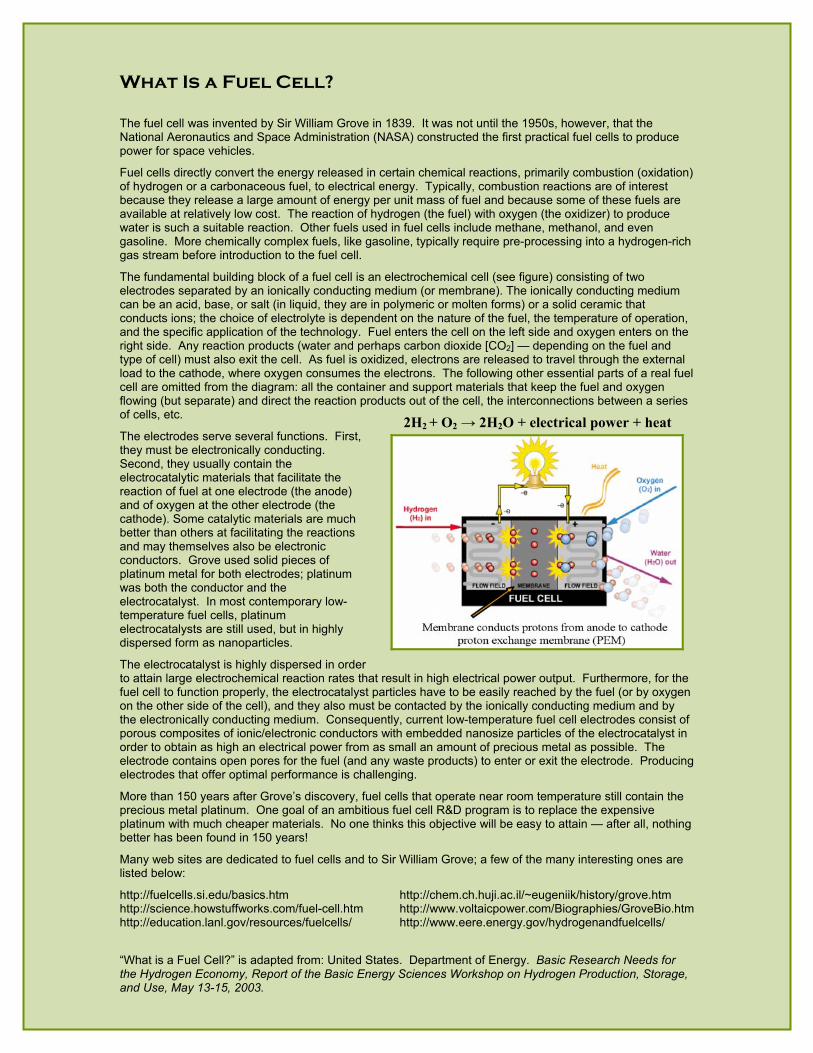
Fuel cells directly convert the energy released in certain chemical reactions, primarily combustion (oxidation) of hydrogen or a carbonaceous fuel, to electrical energy. Typically, combustion reactions are of interest because they release a large amount of energy per unit mass of fuel and because some of these fuels are available at relatively low cost. The reaction of hydrogen (the fuel) with oxygen (the oxidizer) to produce water is such a suitable reaction. Other fuels used in fuel cells include methane, methanol, and even gasoline. More chemically complex fuels, like gasoline, typically require pre-processing into a hydrogen-rich gas stream before introduction to the fuel cell.
The fundamental building block of a fuel cell is an electrochemical cell (see figure) consisting of two electrodes separated by an ionically conducting medium (or membrane). The ionically conducting medium can be an acid, base, or salt (in liquid, they are in polymeric or molten forms) or a solid ceramic that conducts ions; the choice of electrolyte is dependent on the nature of the fuel, the temperature of operation, and the specific application of the technology. Fuel enters the cell on the left side and oxygen enters on the right side. Any reaction products (water and perhaps carbon dioxide [CO2] — depending on the fuel and type of cell) must also exit the cell. As fuel is oxidized, electrons are released to travel through the external load to the cathode, where oxygen consumes the electrons. The following other essential parts of a real fuel cell are omitted from the diagram: all the container and support materials that keep the fuel and oxygen flowing (but separate) and direct the reaction products out of the cell, the interconnections between a series of cells, etc.
The electrodes serve several functions. First, they must be electronically conducting. Second, they usually contain the electrocatalytic materials that facilitate the reaction of fuel at one electrode (the anode) and of oxygen at the other electrode (the cathode). Some catalytic materials are much better than others at facilitating the reactions and may themselves also be electronic conductors. Grove used solid pieces of platinum metal for both electrodes; platinum was both the conductor and the electrocatalyst. In most contemporary low-temperature fuel cells, platinum electrocatalysts are still used, but in highly dispersed form as nanoparticles.
The electrocatalyst is highly dispersed in order to attain large electrochemical reaction rates that result in high electrical power output. Furthermore, for the fuel cell to function properly, the electrocatalyst particles have to be easily reached by the fuel (or by oxygen on the other side of the cell), and they also must be contacted by the ionically conducting medium and by the electronically conducting medium. Consequently, current low-temperature fuel cell electrodes consist of porous composites of ionic/electronic conductors with embedded nanosize particles of the electrocatalyst in order to obtain as high an electrical power from as small an amount of precious metal as possible. The electrode contains open pores for the fuel (and any waste products) to enter or exit the electrode. Producing electrodes that offer optimal performance is challenging.
More than 150 years after Grove’s discovery, fuel cells that operate near room temperature still contain the precious metal platinum. One goal of an ambitious fuel cell R&D program is to replace the expensive platinum with much cheaper materials. No one thinks this objective will be easy to attain — after all, nothing better has been found in 150 years!
Many web sites are dedicated to fuel cells and to Sir William Grove; a few of the many interesting ones are listed below:
http://fuelcells.si.edu/basics.htm http://science.howstuffworks.com/fuel-cell.htm http://education.lanl.gov/resources/fuelcells/
http://chem.ch.huji.ac.il/~eugeniik/history/grove.htm http://www.voltaicpower.com/Biographies/GroveBio.htm http://www.eere.energy.gov/hydrogenandfuelcells/
“What is a Fuel Cell?” is adapted from: United States. Department of Energy. Basic Research Needs for the Hydrogen Economy, Report of the Basic Energy Sciences Workshop on Hydrogen Production, Storage, and Use, May 13-15, 2003.
2H2 + O2 → 2H2O + electrical power + heat
Page 9
Part I
Renewable Electrolytic Hydrogen and Its Difficulties
Harnessing the Energies of Nature
All energy employed by humanity comes from one of three sources. By far most comes from the Sun. Its thermonuclear reactions send solar radiation to Earth, driving plant growth through photosynthesis. This has been the prime mover through most of human history, either through direct combustion of organic matter or through feeding human and animal muscle power. Humans also learned how to make wind turbines that harness the effect created by solar heat's pressurization of the air, and dams that capture the power of flowing water, which rises from the continual flux of moisture set up by evaporation. Direct solar energy has long been employed to heat water and buildings, and process food. In the past few decades the photovoltaic effect has been exploited, using sunlight to generate a flow of electrons from materials such as silicon.
But the most exploited solar energy source of all is the stored photosynthetic energy locked in the ancient biological matter that makes up coal, oil and natural gas. These fossil fuels which humans have learned to use over the past several hundred years now represent 80% of primary energy production.19
Radioactive elements represent humanity's second original energy source. The product of supernova explosions, these elements are located throughout the Earth. Their decay deep in the Earth creates the heat that drives geothermal operations. Of course, these elements also fuel nuclear reactors.
Humans are beginning to tap wave and tidal energy. Tides are a product of the third original source of energy, the interplay of gravity as the Moon orbits around the rotating Earth. Ocean waves are also influenced by the tides, though they are mostly a solar resource, driven by winds.
Fossil fuels and radioactive elements suitable for use in fission nuclear reactors are finite. Eventually humanity may learn to control nuclear fusion reactions to the point where they can generate useful energy, but this remains a distant prospect. At the same time, sunlight, wind, flowing water, waves and ocean tides will be available forever.20 Taken together, these natural renewable energies have potential to provide abundance far in excess of human energy demands. For this reason they are viewed as the long-term human energy future.
But unleashing that potential requires overcoming huge obstacles. Natural renewable energies tend to be far more diffuse than fossil fuels, whose primary virtue is the amount of energy they concentrate in a small space. The best places to capture natural energies tend to be some distance from the centers of energy demand. Often the
19 Geller, Howard. Energy Revolution: Policies for a Sustainable Future. Washington, DC: Island Press,
2003. 4. 20 The capacity and endurance of geothermal resources is poorly understood, as are the potential
environmental impacts of large-scale extraction. They may also contribute to the renewable energy future, but we cannot yet know to what extent.

Page 10
energies arrive out of synch with demand, and ways must be found to store them. The major renewable energy challenges are focusing diffuse energies and directing them where and when they are needed. ReH2 is sometimes seen as the medium through which these tasks will be accomplished.
Envisioned are mass fields of renewable electricity generators powering electrolysis operations. In essence, H2 carries sunlight, wind pressure and other natural energies in useful form from remote regions to metropolitan areas and people. In some scenarios pipelines would carry H2 from the fields to point of use.
"Several decades from now, hydrogen may be piped from the windy Great Plains of North America to the eastern seaboard, and from the deserts of Western China to the populous coastal plain," according to a Worldwatch Institute scenario.21 "As large wind farms and solar ranches appear in sunny and windy reaches of the world, they can generate electricity that is fed into the grid when power demand is high, and produce hydrogen when it is not."22
In other scenarios renewable installations drive decentralized electrolysis near the end-use point. Such vistas, either centralized or decentralized, represent the prize on which Green Hydrogen proponents have their eyes. Therefore a good starting point in analyzing the hydrogen economy is to examine proposals for mass production of H2 from renewable generation, and to understand the potential pitfalls.
An Idealized Scenario: Southwest Solar-Hydrogen
Consider an idealized scenario for replacing gasoline used in U.S. cars and light trucks with solar-derived H2. It is put forward by Solar-Hydrogen Education Project Director James Mason. It is the classic scenario of truly mass-scale production from an immense solar field in one of the planet's solar energy bonanzas, the American Southwest.23 This proposal is valuable as an illustration of the massive potential energies available in a relatively small stretch of land.
Mason begins by asking how much H2 would be needed to push gasoline out of fuel tanks. The U.S. will burn 21 EJ of motor gasoline in 2010, the U.S. Energy Information Administration projects. Since fuel cell power plants are generally expected to be approximately twice as efficient as internal combustion engines, the figure is 11 EJ of H2. Granted, the U.S. automobile fleet is unlikely to be fully fuel-cell-powered for decades, but Mason's scenario is still useful for illustrative purposes.
So how much land area would be needed? Mason goes in search of land that sustains 270 watts per square meter (W/m2) average hourly sunlight and finds plenty in the Southwest. Each watt-hour represents 0.0036 MJ in energy. So over a year each square meter receives 8,500 MJ of solar energy.
21 Flavin, Christopher, and Nicholas Lenssen. Power Surge: Guide to the Coming Energy Revolution. New
York: W. W. Norton & Co, 1994. 26. 22 Flavin 290. 23 Mason, James. "Electrolytic Production of Hydrogen Gas With Photovoltaic Electricity as a Replacement
Fuel for Motor Gasoline in the United States: Land, Water and Photovoltaic Resource Requirements.” Prepared for 2003 U.S. Hydrogen Conference, Washington, D.C. Farmingdale, NY: Solar Hydrogen Education Project.

Page 11
Not all of that is usable, of course. To make sure panels do not shade each other, half the land must be given to rows. So the potential energy per square meter is halved to 4,300 MJ per square meter per year (MJ/m2-yr). With solar photovoltaic (PV) efficiency of 10%, that translates into electrical production of 430 MJ/m2-yr. That electricity run through an electrolyzer with 80% efficiency will generate 340 MJ/m2-yr worth of H2. At this rate a solar ranch to generate 11 EJ will require 31,000 square kilometers, about 5% the land area of Arizona and New Mexico.
But electrolysis requires water – would the Southwest have enough? Mason's answer is, more than enough. Even dry areas such as Phoenix average 20 centimeters of rainfall annually. Each liter of water contains 0.11 kg of H2 representing 16 MJ. One centimeter of water covering one square meter of land is a volume of 10 liters, holding 160 MJ of H2. So reaching the full solar potential of 340 MJ/m2-yr would take less than 2.5 centimeters annual rainfall.
The ingredient that completes the mix is the solar photovoltaic plant itself. A solar field capable of generating enough H2 to replace all motor gasoline would need 1,800 gigawatts (GW) of capacity, Mason calculates.24 That amounts to $1.7 trillion in solar panels.25 Mason envisions building the plant in increments. "A 2,000 MW PV electrolysis plant would produce enough hydrogen gas to fuel over 10,000 metropolitan buses and 100,000 fuel cell vehicles," Mason notes. "California bus companies and public vehicle fleets could underwrite the construction of a 2,000 MW solar hydrogen plant."
It is clear from Mason's scenario that immense, almost unimaginable potentials to produce H2 from mass scale renewables exist. Certainly the U.S. alone has land area with sufficient sunlight and water many times what it would take to propel all our vehicle fleets. So in a world with a desperate need for carbon-free vehicle fuel, why not go there?
An initial problem of such scenarios is their very centralization.
Placing the source of the entire nation’s transportation fuel in a single location provides an ideal target for terrorist or other military attack. It would also be subject to natural disasters.
Centralization also means intensified environmental impacts. In this case spreading an industrial installation over 30,000 square kilometers cannot help but create impacts. For argument's sake, let us acknowledge this, and further acknowledge that in a carbon-emissions-constrained world we will have to weigh relative environmental costs of different energy pathways. We might well conclude that producing a carbon-free fuel is worth 5% of the land area of Arizona and New Mexico.
24 Mason uses the rule of thumb that photovoltaic panels operate at a capacity factor equal to average daily
insolation divided by 1,000 W/m2. In his American Southwest scenario at 270 W/m2 and an 80% electrolyzer efficiency, the required 11 EJ of hydrogen energy demands (11 EJ)/80% = 13 EJ of electricity per year, or 420 GW. The capacity factor is (270 W/m2)/(1,000 W/m2) = 0.27, so (420 GW)/0.27 = 1,500 GW of capacity is required. Mason boosts the figure an additional 15%, to 1,800 GW, to account for balance of system losses.
25 Assuming an eventual price for thin-film PV of $0.50 per watt, and balance of system costs of $50 per square meter.
Page 12
Yet, this particular use of solar photovoltaic technology takes no advantage of photovoltaic technology’s excellent scalability and flat form factor. It does not utilize existing and unused space on building rooftops that would not be environmentally degraded by the addition of solar panels. In other words, this proposal for the use of photovoltaic panels has an egregious environmental impact relative to that possible for an inherently decentralized energy technology.
The very amount of power generation envisioned in this scenario requires some comment. It amounts to roughly twice the installed electrical grid capacity of the U.S., underscoring one of the key facts of the hydrogen economy. It would require vastly more U.S. electrical generation than currently exists. And if such an expansion of renewable energy were possible, would H2 production really be the best use? Our analysis, reported in a subsequent section, indicates that other options will yield greater greenhouse gas reductions until there is a fundamental surplus of renewable energy generation.
Energy Transmission: Pipelines vs. Wires
But leaving aside the immediate question of the best use of renewable generation, as well as security and environmental problems, an overwhelming obstacle faces such centralized scenarios. Hydrogen is capable of transmitting energy over long distances. But in this regard it suffers significant disadvantages vis-à-vis electricity. While hydrogen is posed a new carrier medium capable of capturing and transmitting remote renewable resources, the energy costs of H2 transmission exceed those of electrical transmission. This section compares those costs. A later section will examine electrical storage alternatives.
Consider the energy penalties inherent in the solar Southwest hydrogen scenario. Would it really be feasible to run pipelines from the Southwest desert to all corners of the United States? Currently, NG pipelines run from Alberta and Louisiana to the eastern U.S., so there would appear to be no technical showstoppers. The major barriers would be economic, though hydrogen's chemical properties pose special challenges of metal embrittlement and leakage.
A European team led by fuel cell experts Ulf Bossel and Baldur Eliasson has undertaken an extensive analysis of hydrogen economy energy requirements, including those of pipelining.26 While experience with H2 pipelines is limited – none operate on the scale envisioned for the hydrogen economy – Bossel and Eliasson’s team employed NG industry experience, as well as basic physical and chemical understandings of hydrogen. They found that the low density of gaseous H2 makes it fairly energy-intensive to propel through a pipeline, requiring around 3.8 times more energy than an equivalent amount of NG. The compressors used for this normally consume energy drawn directly from the H2
26 Bossel and Eliasson work for ABB Switzerland which is researching methanol made from hydrogen and
carbon dioxide as a hydrogen delivery mechanism. Their paper makes an argument for this liquid medium. Whether one accepts this argument, and criticisms have been made by a number of observers (See "Comments on Paper by Bossel and Eliasson," by Maggie Mann of National Renewable Energy Laboratory), their case against gaseous and liquid hydrogen stands on its own merits.
Page 13
in the pipeline itself. Pipeline transmission of gaseous H2 is estimated to consume approximately 0.77% of the H2 for every 100 kilometers traveled.27
Applied to the Mason scenario and using the four corners28 as a representative injection point for the produced H2, the distance to Los Angeles is 910 kilometers, Chicago is 1,900 kilometers, New York is 3,000 kilometers. Piping H2 to each of these cities would result in transmission losses of 6.8%, 14% and 21% respectively. The 11 EJ estimate for vehicle fuel does not account for this loss. If we assume 15% average transmission loss, then the original H2 energy needed is nearly 13 TJ, not 11.
An analysis of another commonly cited prospect for mass ReH2, wind fields on the Great Plains, turns up similar results. The study by energy analysts Geoffrey Keith and William Leighty envisioned 4,000 megawatts of wind generation and compared the economics of transmitting the energy 1,600 kilometers to Chicago either as H2 through pipelines or as electricity through high voltage direct current (HVDC) lines.
Keith and Leighty give an H2 pipeline the special advantage of having value as a storage system. While electricity has to be used as it arrives, H2 can be "packed" into the pipeline as it is generated and used at a lower or higher rate. This makes electricity generated from the delivered H2 more valuable because it can be purchased on demand, rather than just when wind turbine blades are turning. But even with this advantage, electricity delivered with the H2 system turns out to be two to three times more expensive than that delivered via HVDC lines. The difference is due to the high expense of the equipment needed to deliver H2, and even more because of the inefficiencies of delivering energy as H2.
Line loss, the standard leakage of power from transmission lines, amounts to 0.4% per 100 kilometers. So the penalty from North Dakota to Chicago would amount to 6.4%, plus 1.5% for two AC-DC converter stations. So of the electricity that enters the line 92% would emerge.29
If the energy were transmitted as H2, energy losses would be far higher. After electrolysis only 85-90% of the energy would remain under an optimistic scenario. Reconverting that energy to electricity in a solid oxide fuel cell attached to a turbine, which converts waste heat to electricity, would be 70% efficient. In a large combined cycle turbine efficiency would be 60%.30 From those assumptions Keith and Leighty calculated that only 51-63% of source energy would emerge at the end of the process. They did not calculate pipeline energy costs.
"We assumed no compressor stations along the pipeline, partly because we couldn't find any useful analysis, or analytical method, for calculating what cost would be, nor what the spacing would be along the pipeline," Leighty explains. But that does not necessarily mean zero costs. "An input compressor station would be needed, in the case of low-
27 Bossel, Ulf, Baldur Eliasson, and Gordon Taylor. The Future of the Hydrogen Economy: Bright or Bleak?
Oberrohrdorf, Switzerland: Ulf Bossel 15 April 2003. 22. 28 The common point of Utah, Arizona, New Mexico and Colorado, at N36º59'56.2" W109º02'40.6". 29 Keith, Geoffrey, and William Leighty. Transmitting 4,000 MW of New Windpower from North Dakota to
Chicago: New HVDC Electric Lines or Hydrogen Pipeline. Draft report for Environmental Law and Policy Center, Chicago. Cambridge, MA: Synapse Energy Economics, 28 Sept. 2002. 26.
30 Keith and Leighty 25.
Page 14
pressure-output electrolyzers. High-pressure-output electrolyzers, at 70 to 140 bar, would feed the pipeline directly, eliminating the compressors entirely."31
Applying the Bossel-Eliasson pipeline energy calculations to the Keith-Leighty study yields a 12% loss from North Dakota to Chicago. In other words, only 88% of energy that enters the pipeline emerges. That would be the figure comparable to the 92% HVDC efficiency, almost a wash. So while pipeline energy consumption and electrical line losses are in roughly the same ballpark, it is the energy conversion steps that make electrolytic H2 far less efficient. Those steps bring the overall efficiency to 45-55%.32
Bossel and Eliasson arrive at similar results in their own study. Taking the energy penalties of hydrogen generation and compression along with those of a 100 km transmission distance, they conclude that the electrical energy input needed to produce and deliver 1 unit of H2 exceeds it by a factor of 1.7. "Hence, even in the best attainable case, the well-to-tank efficiency...cannot be much above 50%."33
These studies indicate it would take up to two MJ of energy transmitted via H2 pipeline to do the same amount of useful work as one MJ of HVDC-transmitted energy. Returning to the basic proposition that renewable electricity is environmentally the most valuable form of energy, it makes little sense to cut its effectiveness in half by delivering it as H2.34
This use of electricity is probably an academic matter. Because of relative efficiencies outlined above, it makes little sense to employ H2 for grid electricity, so the major market would be H2 fuel. Keith and Leighty find that wind-generated H2 would become competitive in that market only if NG prices went beyond 1.1 to 1.7¢/MJ. Historically, NG prices in Chicago have fluctuated between 0.2 and 0.8¢/MJ, so steam reformed H2 would likely have the edge for some time.
Whether electricity is carried from production point to user by H2 pipeline or high voltage wire, the energy is electrons at both source and end use. The inescapable fact is that converting energy into H2 and then re-converting it to electricity consumes energy that might otherwise go to end uses. Electricity transmitted directly with no conversion steps in between is inevitably more efficient, despite losses as it is sent through wires. This does not even take gas leakage from a hydrogen system into account. (See box: Pipeline Leakage and Atmospheric Impacts.)
Hydrogen is seen as a new energy carrier, but it performs this function with significantly less efficiency than direct electricity. For long-distance energy transmission the appropriate medium is electrons not H2.
31 Personal communication. 32 Keith and Leighty efficiency calculations of 51-63% with pipeline energy losses of 12%. 33 Keith and Leighty 29. 34 Arguments are made that while electrolytic hydrogen may involve energy losses, its value as vehicle fuel
outweighs those losses. Keith and Leighty tested that proposition against the likely economic competitor to wind-generated hydrogen, that is hydrogen steam reformed from natural gas. They found that natural gas would have to rise to 2-3 times its expected value before wind-generated hydrogen became competitive.
Page 15
Pipeline Leakage and Atmospheric Impacts
In this report we focus on the efficiency of H2 generation and transmission, which affects the size and environmental impact of H2 generators like wind farms, hydroelectric plants or photovoltaic arrays. But a hydrogen economy may also have direct environmental impacts, because H2 leaking from generating stations, pipelines, filling stations and vehicles can have significant impacts on the atmosphere.
The global emissions of hydrogen are about 77 Tg (77 teragrams, or 77 million metric tons) per year; about 19% is due to combustion of fossil fuels, and the rest to a combination of natural sources.1 We estimate that a fully realized, global hydrogen economy in 2100 might consume about 850 Tg of H2 each year. If 5% of this amount escapes to the atmosphere, that's an additional 43 Tg of H2 emissions, a 56% increase over the current global budget. This is a significant impact that should be considered seriously.
In 2003, T. K. Tromp and her colleagues published an article in Science magazine that estimated the effects of large H2 emissions on the ozone layer.2 Tromp et al pointed out that besides these negative impacts, substantial emissions of H2 could also increase the persistence of atmospheric methane (a greenhouse gas), impact the formation of clouds (changing the Earth's reflectivity), and impact microbial communities. All of these impacts can affect global climate.
Tromp et al hypothesized H2 leakage rates up to 20% in their article, an assumption that was attacked as being too pessimistic by several hydrogen proponents' follow-up letters published in Science.3 The letters' authors argued for using lower leakage rates of 2% to 3%, and point for example to a German hydrogen pipeline with a documented leakage rate of 0.1%. But it is important to keep in mind that the hydrogen economy, if implemented, will also be put into place in second- and third-world countries incapable of the tight engineering specifications and strong regulatory enforcement that keeps leakage low in first-world countries like Germany. Even more importantly, the H2 will be stored in millions of small units owned by individuals: cars. A look at any poor country, full of rusty, smoke-spewing, vintage automobiles, gives a disconcerting preview of what will happen to a future fleet of H2-powered cars.
Hydrogen emissions, though not a hydrogen showstopper, will have to be very carefully regulated if an implemented hydrogen economy is to avoid a whole new set of climate impacts created in the process of repairing those caused by carbon dioxide.
1 Novelli, P. C. et al. "Molecular hydrogen in the troposphere: Global distribution and budget." Journal of
Geophysical Research 104.D23 (1999): 30427-30444. 2 Tromp, T. K. et al. "Potential Environmental Impact of a Hydrogen Economy on the Stratosphere."
Science 300 (2003): 1740-1742. 3 These appeared in Science 302 (2003): 226-229.
Energy Storage: Hydrogen vs. Other Options
Even if electrical wires provide a more efficient means of transmitting energy, electricity cannot be stored in wires. The electric grid is basically a just-in-time delivery system, synchronized to generate power as it is used. To make intermittent sources of energy such as wind and sunlight available on demand, energy storage will be required. As the Green Hydrogen Coalition and others envision, transforming renewable electricity into H2 will meet this need.
But as with energy transmission, the H2 storage scenario is also troubled by poor efficiencies. A number of other options either available today or nearing the marketplace provide far superior efficiencies, including conventional and flow batteries, compressed-air energy storage (CAES) and pumped hydro.35 (Flywheels also have potential but are
35 Most material in this section is based on: Schaber, Christopher, Patrick Mazza and Roel Hammerschlag.
“Utility scale storage of renewable energy." Accepted for publication in Electricity Journal as of May 2004.

Page 16
further down the line.) Substantially more useful energy will emerge from these storage media than from a hydrogen electrolysis-fuel cell cycle.
Conventional batteries - Advanced technology options now becoming available for cars could also work in utility-scale applications. Lithium ion and lithium polymer batteries could store energy with 85% efficiency. Liquid (molten) sulfur batteries (NaS) offer 80% efficiency.36
Flow batteries - While conventional batteries store and release energy via chemical bonds on the battery electrodes, flow batteries accomplish this with chemical bonds made and broken in two salt solutions. This makes for easy scalability by adding to the amount of the solution, so installation costs per unit of energy decline as the system grows larger. Two types of flow battery are closing in on commercialization, vanadium redox and zinc bromide, each with 80% efficiencies.37,38
CAES - Electricity operates a compressor that pressurizes air and stores it in underground geological structures. Whenever demand calls for electricity to be retrieved, some of the pressurized air is released through a turbine that spins a generator. The turbine-generator is normally operated in conjunction with some NG firing, because releasing the air into the turbine unheated would result in exhaust air of unmanageably low temperatures. The process has a net energy storage efficiency of about 75%.39 The first commercial CAES operation, a 290 MW unit opened in Hundorf, Germany, went on-line in 1978. The second was a 110 MW unit at McIntosh, Alabama which opened in 1991. A third CAES plant rated at 2,700 MW is planned for Norton, Ohio.40 Today’s CAES set-ups use fossil methane to drive turbines. But turbines under development will be capable of running on methane derived from biomass, so prospectively can operate with no net greenhouse emissions.
Pumped hydro - Using two reservoirs, water is pumped to the higher pool when energy is generated, and then run through a hydroelectric plant into the lower pool when energy is demanded. This is the oldest and most deployed of all commercially available storage technologies, with facilities up to 1,000 MW in size, and 90 GW of capacity worldwide. It operates at 70-85% efficiencies.41 Of course, flooding land to create hydroelectric facilities involves environmental impacts.
36 Linden, David, and Thomas B. Reddy. Handbook of Batteries, Third Edition. New York: McGraw-Hill,
2002. 37 Skyllas-Kazacos, Maria. Recent Progress with the Vanadium Redox Battery. University of New South
Wales, 2000. 38 Lex, Peter, and Bjorn Jonshagen. “The zinc/bromide battery system for utility and remote applications.”
Power Engineering Journal 13.3 (1999): 142-8. 39 Kondoh, J., et al. “Electrical energy storage systems for energy networks.” Energy Conservation and
Management 41.17 (2000): 1863-1874. 40 van der Linden, Septimus. “The case for CAES.” Modern Power Systems 22.8 (2002): 19-21. 41 Donalek, Peter. Advances in Pumped Storage. Presented at Electricity Storage Association Spring
Meeting, Chicago, IL. 21 May 2003.
Page 17
Type
Energy density (MJ/L)
Lifetime (years)
Lifetime (cycles)
Energy Efficiency
(%) Electric potential
Li-ion battery .59 10 800 85 NaS battery .80 10 2,500 75 Flow batteries (VRB, ZnBr) .12 30 n/a 80
Mechanical CAES @ 300 bar .074 20 n/a 75 Pumped hydro@ 500 m elevation .0054 50 n/a 75
Hydrogen H2 350 bar tanks 3.0 n/a n/a 47 H2 700 bar tanks 5.0 n/a n/a 45 H2 in geologic formations n/a n/a n/a 47 H2 350 bar w/ 10% CHP 3.0 n/a n/a 51 H2 350 bar w/ 25% CHP 3.0 n/a n/a 57 H2 350 bar w/ 50% CHP 3.0 n/a n/a 66
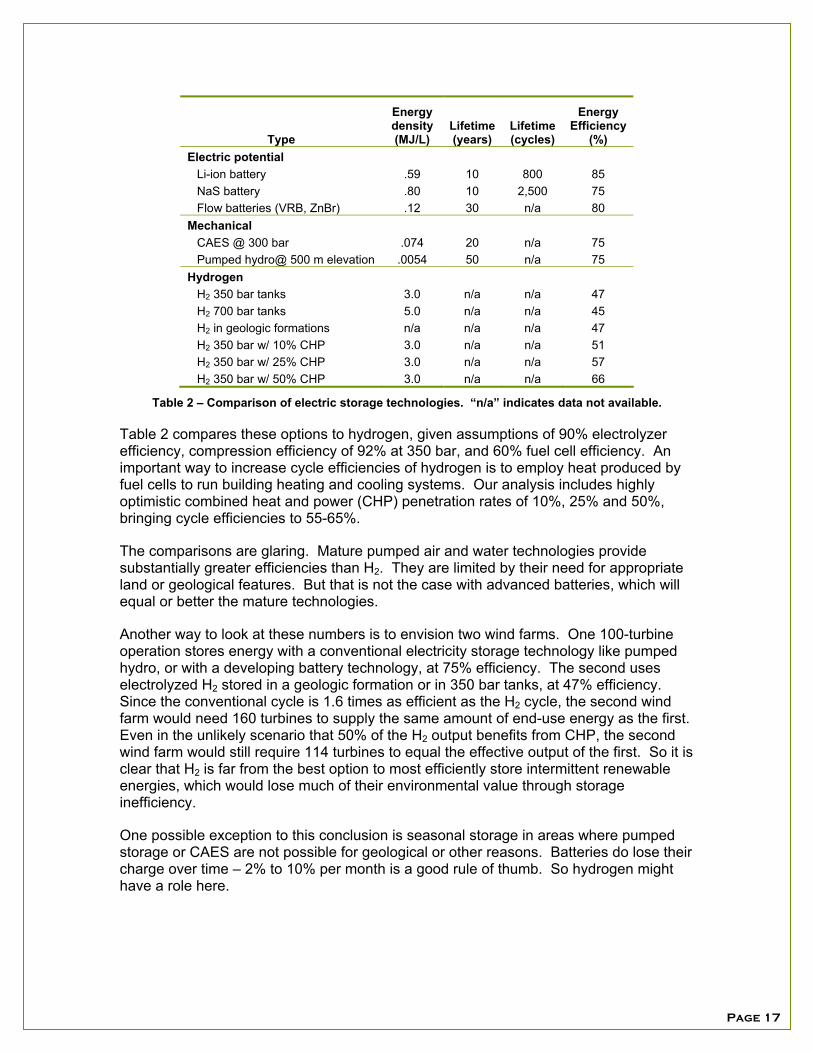
Table 2 – Comparison of electric storage technologies. “n/a” indicates data not available.
Table 2 compares these options to hydrogen, given assumptions of 90% electrolyzer efficiency, compression efficiency of 92% at 350 bar, and 60% fuel cell efficiency. An important way to increase cycle efficiencies of hydrogen is to employ heat produced by fuel cells to run building heating and cooling systems. Our analysis includes highly optimistic combined heat and power (CHP) penetration rates of 10%, 25% and 50%, bringing cycle efficiencies to 55-65%.
The comparisons are glaring. Mature pumped air and water technologies provide substantially greater efficiencies than H2. They are limited by their need for appropriate land or geological features. But that is not the case with advanced batteries, which will equal or better the mature technologies.
Another way to look at these numbers is to envision two wind farms. One 100-turbine operation stores energy with a conventional electricity storage technology like pumped hydro, or with a developing battery technology, at 75% efficiency. The second uses electrolyzed H2 stored in a geologic formation or in 350 bar tanks, at 47% efficiency. Since the conventional cycle is 1.6 times as efficient as the H2 cycle, the second wind farm would need 160 turbines to supply the same amount of end-use energy as the first. Even in the unlikely scenario that 50% of the H2 output benefits from CHP, the second wind farm would still require 114 turbines to equal the effective output of the first. So it is clear that H2 is far from the best option to most efficiently store intermittent renewable energies, which would lose much of their environmental value through storage inefficiency.
One possible exception to this conclusion is seasonal storage in areas where pumped storage or CAES are not possible for geological or other reasons. Batteries do lose their charge over time – 2% to 10% per month is a good rule of thumb. So hydrogen might have a role here.
Page 18
A Transition Scenario: Northwest Hydro-Gen
Even if H2 is neither the most efficient energy storage or transmission medium, yet another hydrogen scenario is posed to steer around those problems. Envisioned is the delivery of energy through existing electrical grid infrastructure for H2 generation by localized electrolysis units near the point of end use. Hydrogen would not primarily be employed as energy storage for the grid, but as vehicle fuel. So it would not be in direct competition with electricity, but instead would replace gasoline and diesel.
The entire critique we have so far raised of H2 as a storage and transmission mechanism for electrical power in no way obviates the use of H2 in the transportation system. Motive power and electrical power today are two largely separate energy systems with their own sets of issues. Hydrogen fuel is often seen as capable of doing what electrical power is not, becoming the primary fuel for what is today an almost entirely fossil-fueled vehicle fleet. This proposition is so central to the envisioned hydrogen economy that we devote Part II to the question of future transportation. Below, we analyze the local H2 generation scenario in the context of a comprehensive H2 fueling network proposal.
Localized generation offers potentially feasible ways to overcome chicken-and-egg problems facing other hydrogen transition scenarios. Instead of having to deploy a massive H2 infrastructure at the start, H2 can be made available at a small scale and gradually ramp up. So the hydrogen economy does not have to spring forth fully developed, but can go through infant and child growth phases before it reaches adulthood. Nonetheless, even a small start demands that a series of pieces be put in place first. Besides local generation, there must be end uses. A concept known as the Northwest Hydrogen Initiative assembles such a whole system. It would lay the groundwork for a hydrogen-propelled vehicle system, with subsidiary use of H2 for stationary peak power generation.42
The concept envisions H2 made with off-peak Columbia hydropower. If implemented it would make the Pacific Northwest the site of the world’s largest hydrogen economy demonstration project to date. In 2003 an alliance of Northwest institutions attempted to gain federal hydrogen program funding for the concept, but was unsuccessful because a required automotive industry partner could not be obtained. The alliance continues to seek federal hydrogen funding for the region.
Spearhead for the alliance is Jack Robertson, former acting administrator and deputy administrator of the Bonneville Power Administration.
“We have the capability of building the world’s largest hydrogen infrastructure around the Columbia River hydro system,” Robertson says. “We can produce hydrogen faster and cheaper than anywhere else.”
Off-peak hydropower is seen as the first of a series of renewable electricity sources that will drive mass-scale H2 production. Eventually, the list is expected to include wind, geoheat and solar, and perhaps ocean waves and tides. Off-peak hydro is first because it is generated during nighttime hours when electrical demand is low, so in some regions
42 Robertson, Jack. Northwest Hydrogen Initiative. 29 March 2004
<http://www.pnl.gov/energy/hydrogen/presentations/Robertson.pdf>.
Page 19
it is priced at 0.6 cents/MJ (more familiarly 2 cents/kWh) and under, roughly the point Robert Williams gives for economically competitive ReH2.
Many renewable energy advocates would contest dams being labeled “renewable.” Their concerns arise out of the damage that dams and dam reservoirs do to fish runs and river ecosystems. Those are valid environmental concerns. However, in the context of this discussion, hydroelectric power is defined as renewable because it is static in scope once built, needs only solar energy as an input and creates little to no waste output.
Robertson says Columbia off-peak hydropower averages 0.6 cents/MJ most of the year, and drops to around 0.3 cents/MJ seasonally. Using off-the-shelf electrolyzer technology, 200 MJ will produce one kilogram of hydrogen, which contains roughly the amount of energy in a gallon of gasoline. The initiative envisions sending electricity to hydrogen stations where electrolysis will actually take place.
A four-year Phase 1 of the Initiative would create 15 hydrogen stations along the Interstate-5 corridor, spaced mostly 160 kilometers or so apart. They would fuel 1,000 H2-fueled internal combustion engine cars operated by regional fleets. That would give the Northwest more such vehicles than the rest of the world combined. Eventually H2 is expected to run fuel-cell powered fleets, but these are not at the mass market level yet. Both Ford and BMW are actively working on H2 internal combustion vehicles for the interim. Over the second four years in Phase 2, stations would come to number 50-100, while the fleet would grow to 10,000, and begin to include FCVs.
Local vs. Remote Hydrogen Production
At the pilot levels projected for the initiative, local H2 production is quite feasible. But when power requirements are analyzed, it becomes clear that mass-scale application would require a far stronger electric distribution grid.
Bossel et al calculate that fueling 2,000 cars daily would require 3,500 GJ of H2 energy. At an 80% electrolyzer efficiency rate, that would require the input of 4,400 GJ of electricity. Pumping water from which the H2 is produced would require 130 GJ, while compressing H2 gas would draw another 530 GJ, for a total energy demand of 5,000 GJ. This means that only 70% of the original electrical energy reaches the fuel tank.43 It should be noted this scenario does not include 10% average line losses, a commonly accepted baseline in the utility industry. If they are calculated, it raises the source energy to 5,600 GJ, leaving only 63% of the original electrical energy in the fuel tank.
Though local generation seems like it would avoid transmission losses associated with H2 pipelining, the calculations around a 2,000-car fueling station show that on-site electrolysis, H2 compression and other losses swamp those due to transmission. In fact, electric transmission loss is not that different in scale from transmission loss in H2 pipelines. Bossel et al calculate 0.77% per 100 km for H2, while high voltage DC electric transmission loses a little less than 0.6% per 100 km.44
43 Bossel et al 25. 44 Rabinowitz, M. “Power Systems of the Future Parts 1-3.” IEEE Power Engineering Review 20.1, 20.3,
20.5 (2000): 5-16, 10-15, 21-24.
Page 20
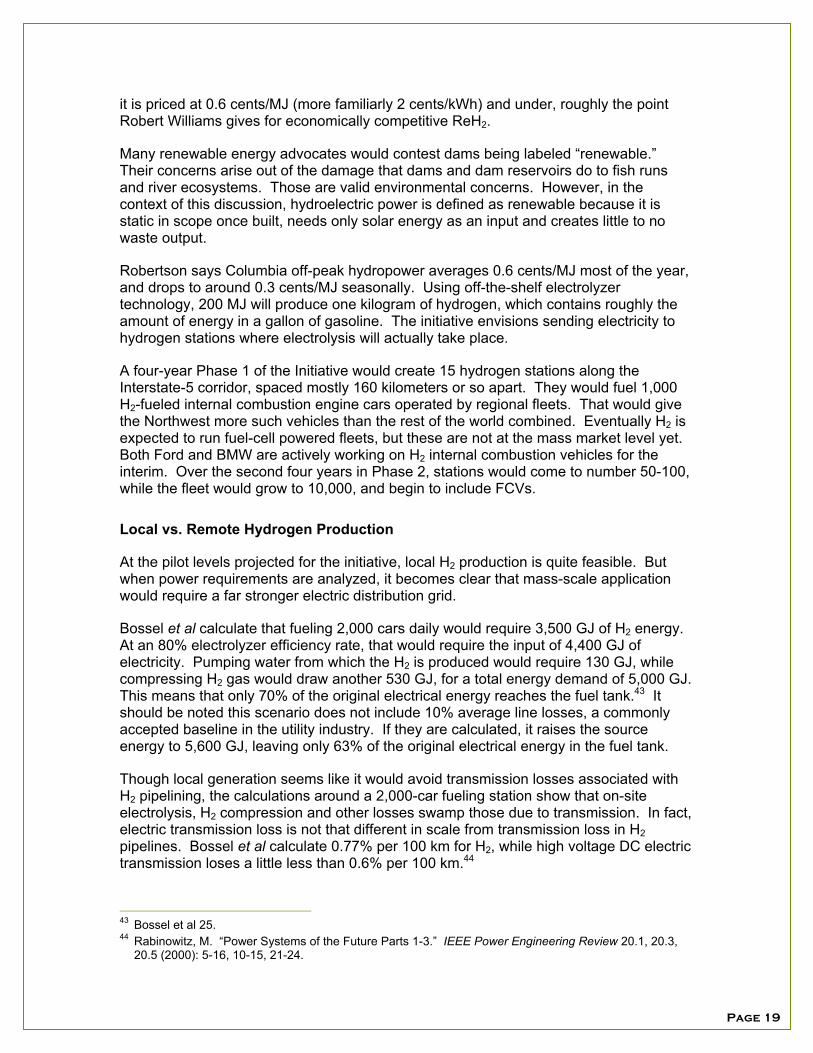
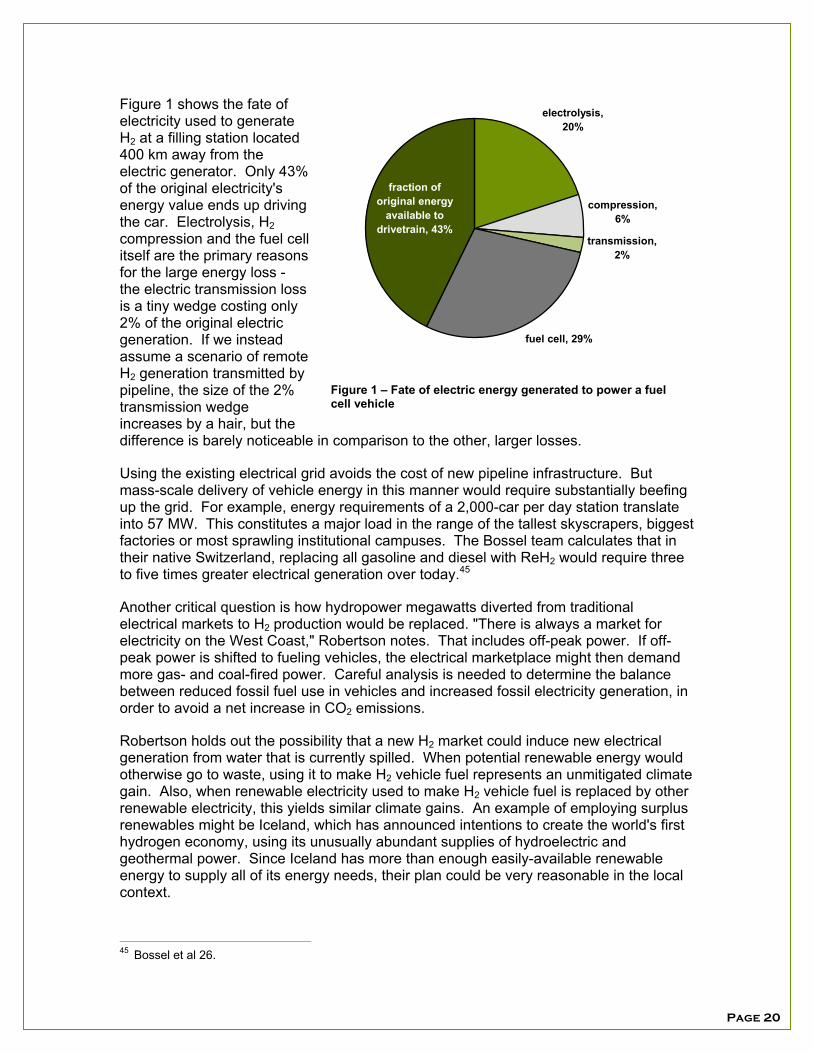
Figure 1 shows the fate of electricity used to generate H2 at a filling station located 400 km away from the electric generator. Only 43% of the original electricity's energy value ends up driving the car. Electrolysis, H2 compression and the fuel cell itself are the primary reasons for the large energy loss - the electric transmission loss is a tiny wedge costing only 2% of the original electric generation. If we instead assume a scenario of remote H2 generation transmitted by pipeline, the size of the 2% transmission wedge increases by a hair, but the difference is barely noticeable in comparison to the other, larger losses.
Using the existing electrical grid avoids the cost of new pipeline infrastructure. But mass-scale delivery of vehicle energy in this manner would require substantially beefing up the grid. For example, energy requirements of a 2,000-car per day station translate into 57 MW. This constitutes a major load in the range of the tallest skyscrapers, biggest factories or most sprawling institutional campuses. The Bossel team calculates that in their native Switzerland, replacing all gasoline and diesel with ReH2 would require three to five times greater electrical generation over today.45
Another critical question is how hydropower megawatts diverted from traditional electrical markets to H2 production would be replaced. "There is always a market for electricity on the West Coast," Robertson notes. That includes off-peak power. If off-peak power is shifted to fueling vehicles, the electrical marketplace might then demand more gas- and coal-fired power. Careful analysis is needed to determine the balance between reduced fossil fuel use in vehicles and increased fossil electricity generation, in order to avoid a net increase in CO2 emissions.
Robertson holds out the possibility that a new H2 market could induce new electrical generation from water that is currently spilled. When potential renewable energy would otherwise go to waste, using it to make H2 vehicle fuel represents an unmitigated climate gain. Also, when renewable electricity used to make H2 vehicle fuel is replaced by other renewable electricity, this yields similar climate gains. An example of employing surplus renewables might be Iceland, which has announced intentions to create the world's first hydrogen economy, using its unusually abundant supplies of hydroelectric and geothermal power. Since Iceland has more than enough easily-available renewable energy to supply all of its energy needs, their plan could be very reasonable in the local context.
45 Bossel et al 26.
electrolysis, 20%
compression, 6%
transmission, 2%
fuel cell, 29%
fraction of original energy
available to drivetrain, 43%
Figure 1 – Fate of electric energy generated to power a fuel cell vehicle
Page 21
Part II
Future Cars: Comparing Options
Rethinking the Electric Vehicle
The inefficiencies of H2 production and transmission might be granted, and the need for a larger electrical infrastructure prospectively accepted, in the framework of the need for a new vehicle fuel. Climate change, petroleum supply stress and national security concerns, not to mention air pollution, are all driving the issue of what we will drive in the future. Hydrogen fuel is seen by many as the natural successor to petroleum fuels.
Hydrogen is one of three potential contenders to supply carbon-free fuel. The others are biofuels and renewable electricity. Biofuels include ethanol, methanol, biodiesel, and a number of less-developed options. In each case, plant matter is converted to a liquid fuel that can be used in internal combustion engines nearly identical to those powering today’s cars. Biofuels are carbon neutral because the crops from which they are derived are constantly being re-grown and therefore absorbing equal amounts of carbon from the atmosphere, as the biofueled cars emit. Electricity is a carbon-free fuel when it is generated from a renewable primary energy source such as wind, solar or hydroelectric power, or from nuclear energy.
On the engine side of the equation, fuel cells compete with hybrid electric/internal combustion vehicles (HEVs) and battery electric vehicles (EVs). Hybrid FCVs now in development also use a large battery to maximize fuel cell efficiency. Both EVs and HEVs rely on electric drive trains, though HEVs employ a small on-board engine to supply extra power and charge batteries. Yet another option, the plug-in hybrid electric vehicle (PHEV), merges the EV and HEV. A following section will examine HEV and PHEV potentials. This section contrasts EVs and FCVs.
A recent National Research Council report on challenges facing H2 FCVs underscored that the automotive future is by no means a done deal.
“If battery technology improved dramatically . . . all-electric vehicles might become the preferred alternative,” notes the report. “Furthermore, hybrid electric vehicle technology is commercially available today and can therefore be realized immediately. Fossil-fuel-based or biomass-based synthetic fuels could also be used in place of gasoline.”46
Today’s vehicle technology flux resembles that of the early 20th century when three engine technologies, gasoline, steam and electricity, competed. While gasoline prevailed, the electric vehicle (EV) has never completely gone away. Small EVs are still sold in custom markets. But conventional wisdom has it that EVs are a technological dead-end hobbled by limited range and extended recharging times, so the potentially less restricted FCV is the wave of the future. Yet EV limitations pose less of an obstacle than is generally believed, while the efficiencies offered by battery electric transportation make a strong argument for revisiting the EV as a serious alternative.
46 National Research Council. Board on Energy and Environmental Systems. The Hydrogen Economy:
Opportunities, Costs, Barriers, and R&D Needs. Washington, DC: National Academy of Sciences, 2004. ES-2.
Page 22
There is natural resistance to this among many “clean-car” experts and advocates. Pilot efforts over recent years, California’s zero emission vehicle mandates in particular, have attempted to build EV markets with only limited success. This picture could change with the development of advanced battery technologies already detailed in the earlier energy storage section. We believe EV critics have insufficiently acknowledged these advances, so a purpose of this paper is to bring a needed balance. We acknowledge that advanced EVs may not be the complete answer, but they might meet the needs of a more substantial share of the market than is commonly understood.
"The reality is that battery technology has progressed significantly in the last decade. But vehicle manufacturers haven't been applying that technology to new products," says Alec N. Brooks of AC Propulsion.47
Lithium ion (Li-ion) batteries have seen a great deal of development driven by the portable electronics industry, and they are now the favored technology for powering advanced EVs. Technology is in place to develop commercial Li-ion battery packs that store electricity at an energy density of about 1.8 MJ per liter (MJ/L) and a specific energy of 0.72 MJ/kg. Lead acid batteries, familiar from conventional automobiles, compare at a paltry 0.3 MJ/L and 0.16 MJ/kg. Li-ion batteries also exhibit a substantial cycle life: at the rate discharged in automobiles, a Li-ion battery can be expected to retain over 90% of its capacity after 500 full discharges.48 The cycle life, for typical driving, will in fact approach the battery's calendar life of roughly 10 years.49
An Argonne National Laboratory study projects a mean EV ranges of 360 kilometers by 2020, with polymer lithium ion batteries the prevailing choice.50 It is safe to say that high-performance, electric vehicles with a 320-kilometer range are easily within technological reach during the time required for the emergence of commercially viable FCVs. Table 3 contrasts the Li-ion and H2 options on a number of grounds. The table makes clear that batteries are ahead of hydrogen on grounds of price, safety, calendar life and gross material availability. Even on the batteries’ weaker points of cycle life, recyclability and toxicity, fuel cells do not show decidedly superior performance in even a single category.
47 Brooks, Alec N. Perspectives on Fuel Cell and Battery Electric Vehicles. Prepared for CARB ZEV
Workshop, 5 Dec. 2002. 5. 48 Linden and Reddy. 49 Vyas, Anant D., and Henry K. Ng. Batteries for Electric Drive Vehicles: Evaluation of Future
Characteristics and Costs through a Delphi Study. Chicago, IL: Argonne National Laboratory, 1997. 50 Vyas and Ng.

Page 23
Li-ion batteries H2 storage H2 fuel cells
Price Currently $83/MJ, target $28/MJ for long-range applications, 3x reduction required.51
pressure storage: No widely-available cylinders in either 350 or 700 bar. Dynetek DyneCell and Quantum Technologies TriShield are near-market 350 bar cylinders, anticipated price $14/MJ.52 The only lightweight 700 bar cylinder close to market is one developed by Quantum Technologies assisted by funding from the U.S. DOE; no price data is available yet.
hydride storage: Very far from commercialization. Laboratory cylinders currently at $110/MJ.53
Currently $3,000/kW, target $35/kW, 85x reduction required.54
Deep cycles (80% DOD)
Currently in the neighborhood of 1,000,55 expected to reach 2,000.56 The Electric Power Research Institute estimates a requirement of 2,500 cycles for a PHEV20, but only 1,500 for a PHEV60.57 A 500 km EV may experience only a few dozen full discharges in its history, since an electric car tends to get plugged in long before it’s fully discharged.
In contrast to a battery, a hydrogen storage system will be subject only to deep cycles, since it follows the filling-station model. Take for example a car with a life expectancy of 300,000 km and driving range of 500 km. If it uses a 700 bar H2 tank allowed to discharge to 140 bar (for a refill every 400 km), during its lifetime it experiences 750 cycles across 560 bar of pressure differential, which can cause serious mechanical fatigue.
Not applicable.
Calendar life 10 years.58 pressure storage: Embrittlement limits the life of metals but carbon fiber methods should solve the problem.
hydride storage: No data.
No data. One source states a target of 4,000 to 5,000 (non-continuous) hours of operation and expresses concern that this target still needs to be met.59
Table 3 (page 1 of 2) – Comparison of secondary issues associated with Li-ion electric or hydrogen energy storage. There are three columns because a battery system does not require energy conversion (its native output is electricity) while a hydrogen system requires both storage and then conversion of the native hydrogen energy output to electricity via a fuel cell.
51 National Academy of Sciences. Review of the Research Program of the Partnership for a New Generation of Vehicles: Seventh
Report. Washington, DC: National Academies Press, 2001. 52 Doty, David F. A Realistic Look at Hydrogen Price projections. Doty Scientific Inc. 23 May 2004
<www.dotynmr.com/PDF/Doty_H2Price.pdf >. 53 fuelcellstore.com. 29 March 2004 <http://fuelcellstore.com>. 54 Argonne National Laboratory. Basic Research Needs for the Hydrogen Economy. Report of the Basic Energy Sciences Workshop
on Hydrogen Production, Storage, and Use. 13-15 May 2003. 55 Linden and Reddy. 56 Hassenzahl, Wiliam. Personal communications at Electricity Storage Association, Chicago, IL. 21 May 2003. 57 Duvall, M. Advanced Batteries for Electric-Drive Vehicles: A Technology and Cost-Effectiveness Assessment for Battery Electric,
Power Assist Hybrid Electric, and Plug-in Hybrid Electric Vehicles. Palo Alto, CA: Electric Power Research Institute, 2003 (report no. 1001577).
58 Vyas and Ng. 59 National Research Council.

Page 24
Li-ion batteries H2 storage H2 fuel cells
Gross material availability
Concern has been expressed about limitations of the world supply of lithium. However, less than 2% of Li-ion battery mass is due to lithium. Research shows that there is sufficient lithium on the planet to power between 2 and 12 billion cars.60,61
pressure storage: Not applicable.
hydride storage: The most likely materials are LaNi5H6, FeTiH2, MgH2 & NaBH4. Lanthanum is a rare earth element with an unknown reserve base; all of the other elements are plentiful. Because hydrides have a maximum storage efficiency of about 8% by weight, most hydrides require several times mass of the more expensive container elements than mass of the hydrogen stored.
Current automotive fuel cell designs require the use of platinum. Various reports indicate that the world platinum supply may or may not be sufficient to support a global fleet of fuel cell vehicles; reports that predict adequate supply all surmise continued reductions in platinum requirements per vehicle.62
Recycling European VALIBAT consortium has developed extraction processes for retrieving >90% of Li, Mn, Co and Ni from used batteries. In November 2003 the European Commission proposed a Directive for 100% battery recycling.
Most proposed elements have proven recyclability except for lanthanum. Though it is technologically possible, there is some question about high costs for boron recycling.63
Platinum recycling appears feasible; approximately 6,000 kg of platinum-group metals were recycled in 2003 (USGS 2004).64
Safety Lithium batteries have withstood many substantive safety tests, including penetration by metals without event.65 Some early Li-ion batteries exhibited a tendency toward overheating and thermal runaway, leading for instance to a recall of electric bicycles by the Consumer Products Safety Commission in 2002. The tendency can be suppressed entirely with proper electronic controls of charge and discharge rates. Argonne National Laboratory and others are working successfully to eliminate the danger with advances in electrode and electrolyte design/composition.
pressure storage: Extremely serious concern with leakage in enclosures (i.e. garages). Secondary concern that lightweight tanks are unsafe in automotive collision; pressure energy alone (ignoring H2 combustion) is significant.
Note that the concern with leakage in enclosures makes liquid storage impossible due to mandatory boil-off.
hydride storage: Safety issues are poorly understood, however none stand out as major barriers. The concerns include reaction with water, H2 pressure buildup when heat is applied, and fatigue of exterior canister due to hydride expansion/contraction.
Safety regulations may require addition of an odorant to automotive hydrogen supply. PEM fuel cells are very sensitive to purity of hydrogen; no satisfactory odorant has yet been discovered.
Toxicity Li can be mildly toxic, but is unlisted in the Agency for Toxic Substances and Disease Registry (ATSDR); it is intentionally ingested in small quantities for the purpose of treating psychiatric disorders.
Ni, La, B and Ti are all known to have mild toxicity; only Ni and B are listed in the ATSDR.
Platinum and palladium are unlisted in the ATSDR.
Table 3 (page 2 of 2)
60 Will, F. G. “Impact of lithium abundance and cost on electric vehicle battery applications.” Journal of Power Sources 63.1 (1996):
23-26. 61 Andersson B. A., and I. Rade. “Metal resource constraints of electric vehicle batteries.” Transportation Research Part D 6.5 (2001):
297-324. 62 Tonn, Bruce E., and Sujit Das. “Assessment of platinum availability for advanced fuel-cell vehicles.” Transportation Research
Record 1815 (2002): 99-104. 63 National Research Council. 64 United States. Geological Survey. Mineral Commodity Summaries 2004. Washington, DC: U.S. GPO 2004. 124. 65 Linden and Reddy.
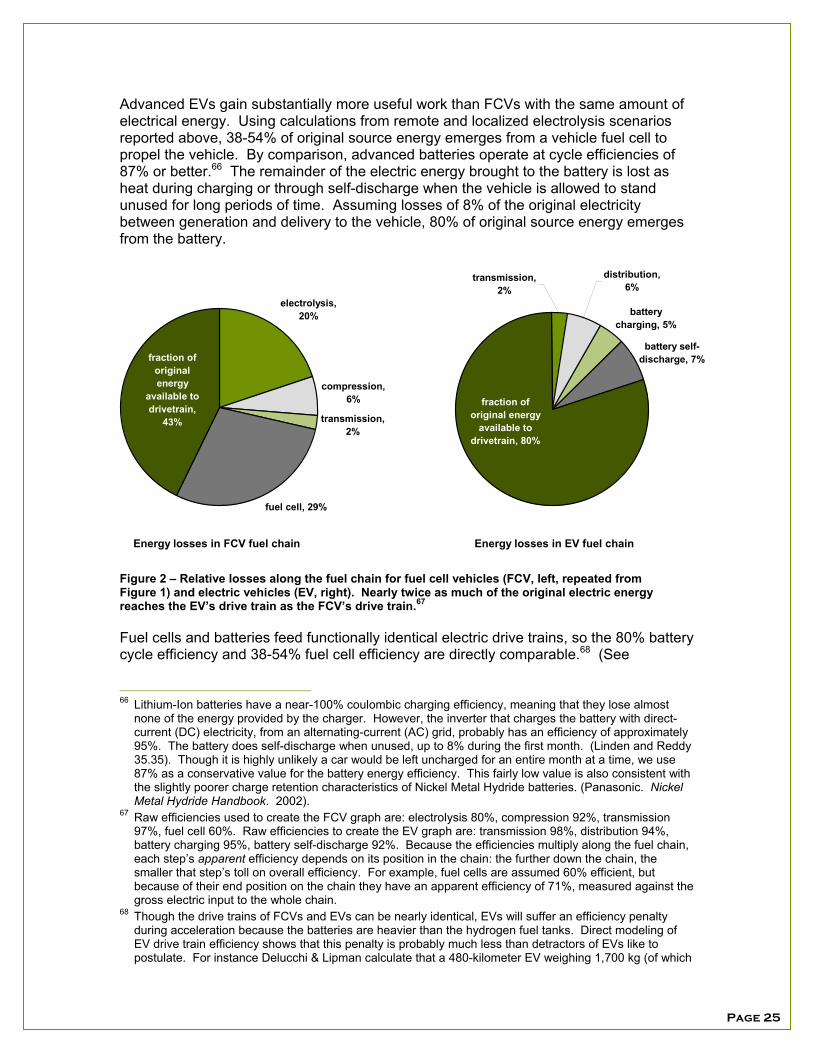
Page 25
Advanced EVs gain substantially more useful work than FCVs with the same amount of electrical energy. Using calculations from remote and localized electrolysis scenarios reported above, 38-54% of original source energy emerges from a vehicle fuel cell to propel the vehicle. By comparison, advanced batteries operate at cycle efficiencies of 87% or better.66 The remainder of the electric energy brought to the battery is lost as heat during charging or through self-discharge when the vehicle is allowed to stand unused for long periods of time. Assuming losses of 8% of the original electricity between generation and delivery to the vehicle, 80% of original source energy emerges from the battery.
Energy losses in FCV fuel chain Energy losses in EV fuel chain
electrolysis, 20%
compression, 6%
transmission, 2%
fuel cell, 29%
fraction of original energy
available to drivetrain,
43%
battery self-discharge, 7%
battery charging, 5%
distribution, 6%
transmission, 2%
fraction of original energy
available to drivetrain, 80%
Figure 2 – Relative losses along the fuel chain for fuel cell vehicles (FCV, left, repeated from Figure 1) and electric vehicles (EV, right). Nearly twice as much of the original electric energy reaches the EV’s drive train as the FCV’s drive train.67
Fuel cells and batteries feed functionally identical electric drive trains, so the 80% battery cycle efficiency and 38-54% fuel cell efficiency are directly comparable.68 (See
66 Lithium-Ion batteries have a near-100% coulombic charging efficiency, meaning that they lose almost
none of the energy provided by the charger. However, the inverter that charges the battery with direct-current (DC) electricity, from an alternating-current (AC) grid, probably has an efficiency of approximately 95%. The battery does self-discharge when unused, up to 8% during the first month. (Linden and Reddy 35.35). Though it is highly unlikely a car would be left uncharged for an entire month at a time, we use 87% as a conservative value for the battery energy efficiency. This fairly low value is also consistent with the slightly poorer charge retention characteristics of Nickel Metal Hydride batteries. (Panasonic. Nickel Metal Hydride Handbook. 2002).
67 Raw efficiencies used to create the FCV graph are: electrolysis 80%, compression 92%, transmission 97%, fuel cell 60%. Raw efficiencies to create the EV graph are: transmission 98%, distribution 94%, battery charging 95%, battery self-discharge 92%. Because the efficiencies multiply along the fuel chain, each step’s apparent efficiency depends on its position in the chain: the further down the chain, the smaller that step’s toll on overall efficiency. For example, fuel cells are assumed 60% efficient, but because of their end position on the chain they have an apparent efficiency of 71%, measured against the gross electric input to the whole chain.
68 Though the drive trains of FCVs and EVs can be nearly identical, EVs will suffer an efficiency penalty during acceleration because the batteries are heavier than the hydrogen fuel tanks. Direct modeling of EV drive train efficiency shows that this penalty is probably much less than detractors of EVs like to postulate. For instance Delucchi & Lipman calculate that a 480-kilometer EV weighing 1,700 kg (of which
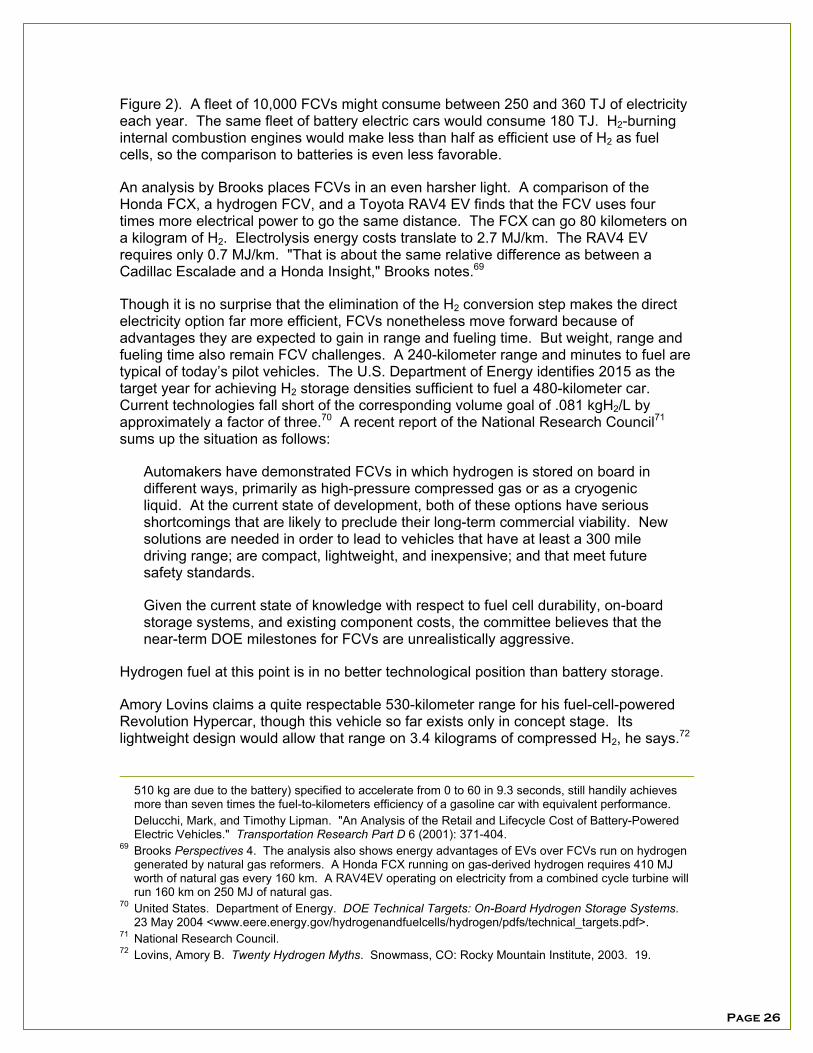
Page 26
Figure 2). A fleet of 10,000 FCVs might consume between 250 and 360 TJ of electricity each year. The same fleet of battery electric cars would consume 180 TJ. H2-burning internal combustion engines would make less than half as efficient use of H2 as fuel cells, so the comparison to batteries is even less favorable.
An analysis by Brooks places FCVs in an even harsher light. A comparison of the Honda FCX, a hydrogen FCV, and a Toyota RAV4 EV finds that the FCV uses four times more electrical power to go the same distance. The FCX can go 80 kilometers on a kilogram of H2. Electrolysis energy costs translate to 2.7 MJ/km. The RAV4 EV requires only 0.7 MJ/km. "That is about the same relative difference as between a Cadillac Escalade and a Honda Insight," Brooks notes.69
Though it is no surprise that the elimination of the H2 conversion step makes the direct electricity option far more efficient, FCVs nonetheless move forward because of advantages they are expected to gain in range and fueling time. But weight, range and fueling time also remain FCV challenges. A 240-kilometer range and minutes to fuel are typical of today’s pilot vehicles. The U.S. Department of Energy identifies 2015 as the target year for achieving H2 storage densities sufficient to fuel a 480-kilometer car. Current technologies fall short of the corresponding volume goal of .081 kgH2/L by approximately a factor of three.70 A recent report of the National Research Council71 sums up the situation as follows:
Automakers have demonstrated FCVs in which hydrogen is stored on board in different ways, primarily as high-pressure compressed gas or as a cryogenic liquid. At the current state of development, both of these options have serious shortcomings that are likely to preclude their long-term commercial viability. New solutions are needed in order to lead to vehicles that have at least a 300 mile driving range; are compact, lightweight, and inexpensive; and that meet future safety standards.
Given the current state of knowledge with respect to fuel cell durability, on-board storage systems, and existing component costs, the committee believes that the near-term DOE milestones for FCVs are unrealistically aggressive.
Hydrogen fuel at this point is in no better technological position than battery storage.
Amory Lovins claims a quite respectable 530-kilometer range for his fuel-cell-powered Revolution Hypercar, though this vehicle so far exists only in concept stage. Its lightweight design would allow that range on 3.4 kilograms of compressed H2, he says.72
510 kg are due to the battery) specified to accelerate from 0 to 60 in 9.3 seconds, still handily achieves more than seven times the fuel-to-kilometers efficiency of a gasoline car with equivalent performance.
Delucchi, Mark, and Timothy Lipman. "An Analysis of the Retail and Lifecycle Cost of Battery-Powered Electric Vehicles." Transportation Research Part D 6 (2001): 371-404.
69 Brooks Perspectives 4. The analysis also shows energy advantages of EVs over FCVs run on hydrogen generated by natural gas reformers. A Honda FCX running on gas-derived hydrogen requires 410 MJ worth of natural gas every 160 km. A RAV4EV operating on electricity from a combined cycle turbine will run 160 km on 250 MJ of natural gas.
70 United States. Department of Energy. DOE Technical Targets: On-Board Hydrogen Storage Systems. 23 May 2004 <www.eere.energy.gov/hydrogenandfuelcells/hydrogen/pdfs/technical_targets.pdf>.
71 National Research Council. 72 Lovins, Amory B. Twenty Hydrogen Myths. Snowmass, CO: Rocky Mountain Institute, 2003. 19.
Page 27
However, most of the Revolution’s innovations (whole-system design, lightweighting, active suspension) can equally be applied to long-range EVs.
The EV’s clear, current advantage over the FCV is that the EV can be brought to market immediately. Even today's limited-production EVs are already capable of meeting most daily driving needs. Solectria’s Force, having a curb weight of only 1,100 kilograms with nickel metal hydride (NiMH) batteries is specified with a range of 140-160 kilometers. The RAV4 EV with NiMH batteries is specified at 200 kilometers. Nissan’s Altra EV, using lithium ion batteries, claims 190 kilometers.73
Brooks compares a Ford Focus FCV with a concept EV based on an altered Toyota Prius, powered purely by Li-ion batteries. The Focus has 320-kilometers range and a curb weight of 1,600 kg, the Prius 220-320 kilometers with a curb weight of 1,300 kg. Refueling the Focus requires the equivalent of 860 MJ, the Prius 140 MJ. Adding batteries to the Prius to bring its weight to that of the Focus would raise the driving range to 640 kilometers.74
Examples of high-range advanced technology EVs are already emerging. For example, Electrovaya of Toronto, Canada markets polymer lithium ion laptop power supplies that claim an energy density in excess of 1.5 MJ/L. Using the same battery technology in its prototype Maya-100 EV, the company claims range of 300 kilometers per charge.75 It plans commercial production as the Maya-200. AC Propulsion's tzero electric sports car was outfitted with lithium-ion batteries in 2003. Replacing a lead-acid battery pack cut car weight by 230 kg for a total curb weight of 890 kg, while tripling energy storage capacity.76 The company claims a 480-kilometer range, 0-60 mph in 3.6 seconds and 160 kilometers per hour top speed. In the 2003 Michelin Challenge Bibendum, an effort to evaluate advanced technology vehicles, Michelin verified a range of at least 390 kilometers.77
Li-ion batteries currently cost about $83/MJ to manufacture, meaning that a 370 MJ battery pack providing 500 kilometers of range would cost a prohibitive $30,000.78 It is believed that the manufacturing cost of Li-ion batteries needs to drop to roughly $28/MJ, that is by a factor of three, before long-range, battery-electric cars can become a viable, commercial product.79 This is the greatest hurdle that Li-ion technology needs to clear for use in commercially viable vehicles, and admittedly a technology breakthrough will be needed to clear the hurdle.
But the hurdles that fuel cell technology must clear to achieve commercialization are far higher. The current commercialized cost of automotive fuel cells is estimated to be between $300/kW80 and $3,000/kW81 but the U.S. Government's FreedomCAR program
73 Electric Drive Transportation Association. 24 July 2003
<http://www.evaa.org/evaa/pages/ele_product_on-road.htm>. 74 Brooks Perspectives 9. 75 Electrovaya. 23 May 2004 <http://www.electrovaya.com>. 76 AC Propulsion. AC Propulsion Debuts tzero with Lilon Battery. Press release, 15 Sept. 2003. 31 Dec.
2003 <http://www.acpropulsion.com/LiIon_tzero_release.pdf>. 77 AC Propulsion. tzero Earns Highest Grade at 2003 Michelin Challenge Bibendum. Press release, 30
Sept. 2003. 31 Dec. 2003 <http://www.acpropulsion.com/ACP_Bib_results.pdf>. 78 National Academy of Sciences. 79 Delucchi and Lipman. 80 National Academy of Sciences.

Page 28
targets $30/kW, at least a tenfold reduction, and does not expect this goal to be reached until 2015.82 Additionally, if fuel cells require the construction of a new fuel generation and transmission infrastructure, the cost has been estimated at $3,500-$6,700 per vehicle. Direct methanol fuel cells would require less infrastructure development, but still $710-$820 per vehicle.83 Besides being much closer to market than FCVs to begin with, Li-ion EVs’ primary barrier to commercialization - the cost of batteries - could be broken sooner. That is because of the additional impetus to battery development provided by the burgeoning market for hybrid electric vehicles, which though they have not yet adopted Li-ion also require large batteries.84
Overcoming EV Obstacles
A re-shaping of the role of the automobile is overdue. General Motors Vice President for Research and Planning Larry Burns told the 2003 U.S. Hydrogen Conference that the objective of GM's FCV development "is to remove the auto from the environmental debate." That objective will not be achieved by eliminating air emissions. For the sprawling land use patterns tied to the automobile would carry huge environmental and social downsides even if all vehicles were zero emissions. Road networks and other impervious surfaces significantly damage watershed functions. Auto-dependent transportation networks inevitably cause congestion and time loss. Maintaining extensive road systems imposes fiscal stress on local governments and social stress on those who cannot afford cars or drive.85
These problems are generating an anti-sprawl backlash. Urban growth management programs and "Smart Growth" efforts to concentrate new development are burgeoning in response. The assumption that autos need a 500-kilometer-plus range is intimately tied to a sprawling landscape. Limited range vehicles are a perfect fit with more compact land-use patterns. EVs are positioned to play a key role in a restructured land use and transportation system.
Charging times represent another perceived obstacle to mass acceptance of EVs. Time to fully charge an EV is in the one-to-four-hour scope depending on the depth of discharge. But most cars remain parked more than 90% of the time, offering plenty of
81 Argonne National Laboratory. 82 United States. Department of Energy. FreedomCAR & Vehicle Technologies Program. Fuel Cell
Systems Technical Team. 16 Jan. 2004 <http://www.eere.energy.gov/vehiclesandfuels/program_areas/freedomcar/fc_fuel_cell_tech.shtml>.
83 Kalhammer, F., P. R. Prokopius, V. P. Roan, and G. E. Voecks. Status and Prospects of Fuel Cells as Automobile Engines. Sacramento, CA: State of California Air Resources Board, 1998.
84 Anderman, Menahem, Fritz R. Kalhammer, and Donald MacArthur. Advanced Batteries for Electric Vehicles: An Assessment of Performance, Cost and Availability. Sacramento, CA: State of California Air Resources Board, 2000.
85 For a good exposition of sprawl costs, see Kaid Benfield, F., Matthew D. Raimi, and Donald D.T. Chen. Once There Were Greenfields: How Urban Sprawl is Undermining America's Environment, Economy and Social Fabric. New York: Natural Resources Defense Council and Surface Transportation Policy Project, 1999. Mazza has examined sprawl costs in the Puget Sound region. See Mazza, Patrick and Eben Fodor. Taking Its Toll: The Hidden Costs of Sprawl in Washington State. Olympia, WA: Climate Solutions and Sierra Club Cascade Chapter, Jan. 2000. Taking its Toll can also be viewed at <http://climatesolutions.org/pubs/pdfs/sprawl.pdf>.

Page 29
FCVs – No Advantage over Hybrids for Now
Over coming decades even standard HEVs without plug-in capabilities will represent significant competition to FCVs. A Massachusetts Institute of Technology team compared vehicle technologies and concluded that " . . . judging solely by the lowest life-cycle energy use and GHG releases, there is no current basis for preferring either FC or ICE hybrid power plants [over today's conventional cars] for mid-size automobiles over the next 20 years or so."1
Though the researchers believe that even conventional improvements to automobile efficiency make fuel cell vehicles unnecessary in the near future, their results show gasoline hybrids outperforming conventional vehicles. The figure includes one bar on the left showing the life-cycle greenhouse gas emissions due to a typical, U.S. mid-size sedan. The remaining data points represent a few alternative technologies that could be realized by 2020. The two gasoline technologies reduce greenhouse gases by more than 50% - roughly the same as the two H2 technologies. The researchers assumed the H2 to be centrally generated from natural gas. Notice that one of the gasoline technologies makes use of a fuel cell – the gasoline is reformed into H2 on board the vehicle.
The MIT study reveals that the most likely FCV option to hit the market in coming decades, the H2 FCV driven on reformed NG, is only marginally more efficient than the gasoline hybrid. For rapid market adoption hybrids have the overwhelming advantage of running on existing fueling infrastructure.
Taking all this into account, the MIT researchers draw a conclusion that deserves serious consideration. "Therefore, if it is important to make significant reductions in fleet energy use and GHG emissions during the next 20 years, then improved ICE vehicles offer the quickest and easiest technology options for realizing those objectives."2
1 Weiss, Malcolm A. et al. Comparative Assessment of Fuel Cell Cars. Publication No. LFEE 2003-001
RP. Cambridge, MA: Massachusetts Institute of Technology Laboratory for Energy and the Environment. Feb. 2003. 1.
2 Weiss 12.
charging opportunities at both home and workplace. The fact that EV fuel is ubiquitous represents an advantage. The existing electrical grid is the fueling infrastructure – no stops at smelly gas stations pumping noxious, dangerous liquids ever again.
One study found, “A large majority of participants thought that plugging in was preferable if it was convenient, but some had issues regarding charging. Most people considered plugging in their vehicles more convenient than fueling at a gasoline station.”86
In addition, EV charging ports could run a two-way power flow, making a fleet of EVs a substantial energy storage resource that offers significant potential values to the
86 Electric Power Research Institute. Comparing the Benefits and Impact of Hybrid Electric Vehicle Options.
Report no. 1000349. Palo Alto: Electric Power Research Institute, July 2001. 2-15.
66
31 31 3227
0
10
20
30
40
50
60
70
2001 mid-size sedan
gasolinehybrid
gasoline FChybrid
hydrogenFCV
hydrogenFCV hybrid
Life
cycl
e G
HG e
mis
sion
s, g
C/k
m

Page 30
electrical grid, including peaking and reserve power, with revenues to EV owners. This concept is coming to be known as "V2G," vehicle-to-grid.87
Today a huge proportion of electrical infrastructure lays idle most of the time, serving only peak demands. Theoretically, the U.S. would need only half its power plants if power demand was even at all hours. But demand peaks daily during daytime hours and seasonally. In most of the U.S. summer cooling needs create an annual demand spike. Power delivery infrastructure is also configured to accommodate peaks. Long-distance transmission systems typically maintain 40% more capacity than expected peaks. Local distribution networks often maintain capacity 50-90% over peaks.88
Systems that could coordinate thousands of small-scale energy storage and generation units are now becoming possible with the infusion of computer intelligence throughout the grid. One of the last commercial sectors to experience the thoroughgoing integration of digital technology, electrical power will over coming decades be revolutionized by networks of microprocessors and sensors capable of optimizing the grid for top efficiency. The outcome has been described as the Energy Web, Smart Grid or Smart Energy Network.89 EVs could play an important role.
Electronic intelligence on board EVs could connect to the grid and regulate the flow of energy into and out of the vehicle. The owner's range needs would be taken into account so the vehicle would always have sufficient charge. AC Propulsion tested the concept in a demonstration project for the California Air Resources Board, bringing together software, wireless communications, grid-vehicle interface, AC/DC conversion hardware and control algorithms. Over a course of 230 hours, with average daily grid connection time of 23 hours, the connected EV responded to California Independent System Operator demands for supplemental power. The system performed well, and economic calculations revealed that gross annual grid-support income earned by connected EVs would range from $1,000-$5,000, based on daily power prices. Under conservative assumptions – use of existing battery technologies and a limited production rate of 12,000 EVs per year – 20-60% of these revenues would fully fund battery replacements.90
"Integrating electric drive vehicles with the electric power grid has been shown to be feasible and have potential to create an income stream that offsets a portion of vehicle ownership costs. If V2G were adopted and deployed by one or more automakers, there is potential to reduce costs to automakers and increase the desirability of ZEVs (Zero
87 The University of Delaware has a V2G research program and maintains a V2G portal site at
<http://www.udel.edu/V2G/> 88 Mazza, Patrick. The Smart Energy Network: Electricity's Third Great Revolution. Olympia, WA: Climate
Solutions, 2002. 5 (summary version). 89 Mazza; Consortium for Electric Infrastructure to Support a Digital Society. 24 May 2004
<http://www.e2i.org/e2i/ceids/>; Bonneville Power Administration. Energy Web: A New Kind of Network. 24 May 2004
<http://www.bpa.gov/Energy/N/Tech/energyweb/>. 90 Brooks, Alec N. Final Report: Vehicle to Grid Demonstration Project: Grid Regulation Ancillary Service
With a Battery Electric Vehicle. Contract Number 01-0313, Prepared for California Air Resources Board and California Environmental Protection Agency, 10 Dec. 2002. 30 Dec. 2003 <http://www.acpropulsion.com/Veh_Grid_Power/V2G%20Final%20Report%20R5.pdf>. 49.
Page 31
Emission Vehicles) to consumers, with the ultimate potential of building a ZEV market based on demand rather than regulations.91
While EVs themselves produce zero emissions, they are only as clean as the power that charges their batteries. So they can still represent a large greenhouse gas emissions load. This concern is covered in Part III. In terms of maximum greenhouse-emissions-reduction "bang for the buck" a model that suggests itself is the "green-tagged EV."
A small example exists in Portland, Oregon at the 200 Market Building. Building manager Russell Development sites a Corbin Sparrow EV at the downtown building so tenants can run errands even if they come to work by transit. To make the car a fully sustainable option Russell buys environmentally preferred "green-tagged" power for recharging. Green power programs, now widely operating, let customers pay a modest premium to specify that some or all of the electricity they use will be generated from renewable sources. The electrons that charge Russell's Sparrow do not literally flow from a wind turbine to their building. But for every electron the car uses, a turbine will put a green electron on the grid thanks to the company’s green power buy. Russell’s innovation should serve as an example to future policy associated with EV tax credits or other incentives
Plug-in HEVs: Best of Both Worlds
Despite the efficiency advantages of EVs and potentials for advanced technologies to overcome EV limitations, prospects for their widespread adoption will still be greeted by skepticism, justifiably or not. That cannot be said for an option that merges the best of the EV with the best of the emerging hybrid technology, the plug-in hybrid electric vehicle (PHEV).
HEVs such as the Toyota Prius or Honda Civic Hybrid are on the market today. With large batteries and partial electric drive trains, HEVs owe much to EV research and development. A small, on-board ICE overcomes EV range and charge time limits by juicing up the battery when it runs low. The engine also provides power boosts when needed. HEVs also employ systems that recapture energy lost in braking.
PHEVs, still at the development stage, are HEVs with even larger batteries that draw charge from both an on-board engine and, like a pure EV, from the power grid. The vehicle could run for longer distances than HEVs before engine charging is required. Engines can be sized smaller, compensating for added battery weight. PHEVs with 32 km and 100 km battery ranges could be developed with no weight gain, indicates computer modeling done by a University of California-Davis team developing plug-in hybrids. The team led by Andy Frank has converted a Ford Explorer into a PHEV. Frank calculates that the engine in a PHEV can run at 40% engine efficiency, about twice the efficiency of an engine in a conventional car.92
91 Brooks Vehicle to Grid 3. 92 “Andy Frank’s Plugged-In Vision.” EV World 2 March 2003.
Page 32
A 2001 study by the Electric Power Research Institute finds, “If [PHEVs] are charged every day and driven less than their all-electric range, fuel economies exceeding 100 mpeg [100 miles per equivalent gallon, or 0.85 MJ/km] can be achieved.”93
EPRI compared a conventional vehicle to a PHEV with a 100 km range Nickel Metal Hydride (NiMH) battery, the type used in today’s HEVs. The hypothetical car is charged nightly with electricity generated in a typical new, natural-gas plant, and is driven a U.S. average number of miles each day. Over a 160,000 km lifetime, the PHEV burns around 2,500 liters of gasoline, compared to 11,000 for an HEV without plug-in capacity or 15,000 liters for a conventional vehicle.94 Taking both gasoline and natural gas use into account, the PHEV reduces lifecycle CO2 emissions 60%.95 Lifetime energy and maintenance costs are $4,900 less than the conventional vehicle, but components cost around $7,400 more.96 The $2,500 gap suggests a role for incentives that take air quality benefits into account. It also underscores that PHEVs, unlike FCVs or advanced battery EVs, are very close to mass market viability now.
PHEVs with a 32 km range would actually win the price competition with production of 100,000 units annually, a newer EPRI study finds. Battery cost would be $89/MJ for a mid-size car and $97/MJ for a full-size SUV. But once balanced with fuel cost savings over each vehicle’s lifetime, these battery costs are low enough to allow a $1,200 net present value edge for the car and $1,100 for the SUV, over their conventional counterparts. EPRI also studied the economics of a pure EV with 64 km range, designed for in-city use, and found a lifetime savings of $420 over a gasoline counterpart using a small 3-cyclinder engine. These figures are before benefits for compliance with federal mileage standards that could add $1,000 to the value of a 32 km PHEV or $2,000 to a city EV.97
These results underscore how efforts to rapidly build PHEV markets could promote viability of other battery technology cars including EVs and hybrid FCVs. Though EPRI did not model options using Li-ion batteries, it can be assumed that growing markets would have similar cost reduction impacts as the “computer chip effect” of economies of scale and ascending learning curves kick into action. The PHEV is arguably the most promising “cleaner-car” bridge to tomorrow’s fully clean cars and trucks.
A recent hydrogen economy critique from David Morris of the Institute for Local Self-Reliance gives strong support to PHEVs:
The focus on building a national hydrogen distribution and fueling network to support fuel cell powered cars ignores shorter term, less expensive and more rewarding strategies encouraged by recent technological developments. The most important of these is the successful commercialization of the hybrid electric vehicle...Manufacturers should be strongly encouraged to quickly develop the next generation of HEVs that can travel significant distances on battery power
93 Electric Power Research Institute 2001 2-5. 94 Electric Power Research Institute 2001 4-24. 95 Electric Power Research Institute 2001 2-9. 96 Electric Power Research Institute 2001 4-22, 4-23. 97 Electric Power Research Institute. Advanced Batteries for Electric Drive Vehicles: A Technology and
Cost-Effectiveness Assessment for Battery Electric Vehicles, and Plug-In Hybrid Electric Vehicles. Report no. 1009299. Palo Alto: Electric Power Research Institute, Feb. 2004. viii. Vehicle lifetime is assumed to be 240,000 km for the PHEVs and 180,000 km for the in-city EVs.

Page 33
alone. Rapid advances have occurred in recent years in electric storage technologies. One element of this strategy is to encourage plug-in HEVs.98
Biomass and Hydrogen
Improvements in vehicle efficiency are absolutely vital, but they only go so far. Notes Jason Mark of the Union of Concerned Scientists, “Given rising vehicle travel and population in the U.S., notwithstanding the rest of the world, there is no possible way that we can achieve deep reductions in vehicle-related greenhouse gases by efficiency alone. Our technical analysis suggests that the best efficiency has to offer is a return to year 2000 greenhouse emissions in the U.S. light-duty sector by 2025-2030, after which GHG emissions will climb absent low-carbon fuel options.”99
Biomass might offer such an option. Cellulosic ethanol manufactured with biotechnologies capable of extracting fermentable sugars from plant matter could run vehicles with great efficiency and no added carbon burden on the atmosphere. Using cellulose, the stuff of most plant matter, offers far larger potential feedstocks and greatly improved energy balances over today’s starch-based ethanol.100 Biomass could also be gasified or processed with organisms to make H2. The limiting factor is land availability. Massive territories will be necessary to grow feedstocks. Figure 3 underscores the point.101
The graph presents the land needs for fueling the U.S. light vehicle fleet with current and speculative technologies.102 The biomass options compare biohydrogen and biofuels used in FCVs. Note the biofuel pathway would take up 936,000 square kilometers, or about 12% of the continental U.S. while biohydrogen would require 591,000 square kilometers. By comparison, crops currently cover 1.6 million square kilometers. Advances in fuel production technologies could bring biofuels land requirements down to just a fraction of these numbers. The uncertainties involved in projecting speculative technologies place both biohydrogen and ethanol within the range of the 140,000 square kilometers currently held in conservation reserve that are now mostly planted with grasses.
All of the scenarios assume the U.S. light vehicle fleet to remain static in terms of total miles driven, but converted entirely to very high efficiency electric or fuel cell vehicles.103 Our most optimistic scenario, 80,000 square kilometers to fuel the U.S. light vehicle fleet
98 Morris, David. A better way to get from here to there: A commentary on the hydrogen economy and a
proposal for an alternative strategy. Washington, DC: Institute for Local Self Reliance, Dec. 2003. 3. 99 Personal communication. 100 Wang, M., C. Saricks, and D. Santini. Effects of Fuel Ethanol Use on Fuel-Cycle Energy and Greenhouse
Emissions. Argonne, IL: Argonne National Laboratory, Jan. 1999. 101 Pro, Boyd, Roel Hammerschlag, and Patrick Mazza. “Energy and Land Use Impacts of Sustainable
Transportation Scenarios.” Submitted to Journal of Cleaner Production, Sept. 2003. 102 Note that our estimate of the land requirement for electrolytic hydrogen production is at the most
12,000 km2, which differs remarkably from the 31,000 km2 estimated by Mason. The difference is due to two factors: (1) we assume that such an enormous investment in PV cells will enable reasonably cost-effective production of 20% efficiency cells, whereas Mason assumes 12% and (2) we estimate that a hydrogen-fueled fleet will consume approximately 4.9 EJ/yr of hydrogen energy, while Mason assumes the fleet will continue to consume the current fossil fleet demand of 11 EJ/yr.
103 Based on an electric drive train consuming approximately 0.73 MJ/km at the motor terminals (behind the battery or fuel cell).
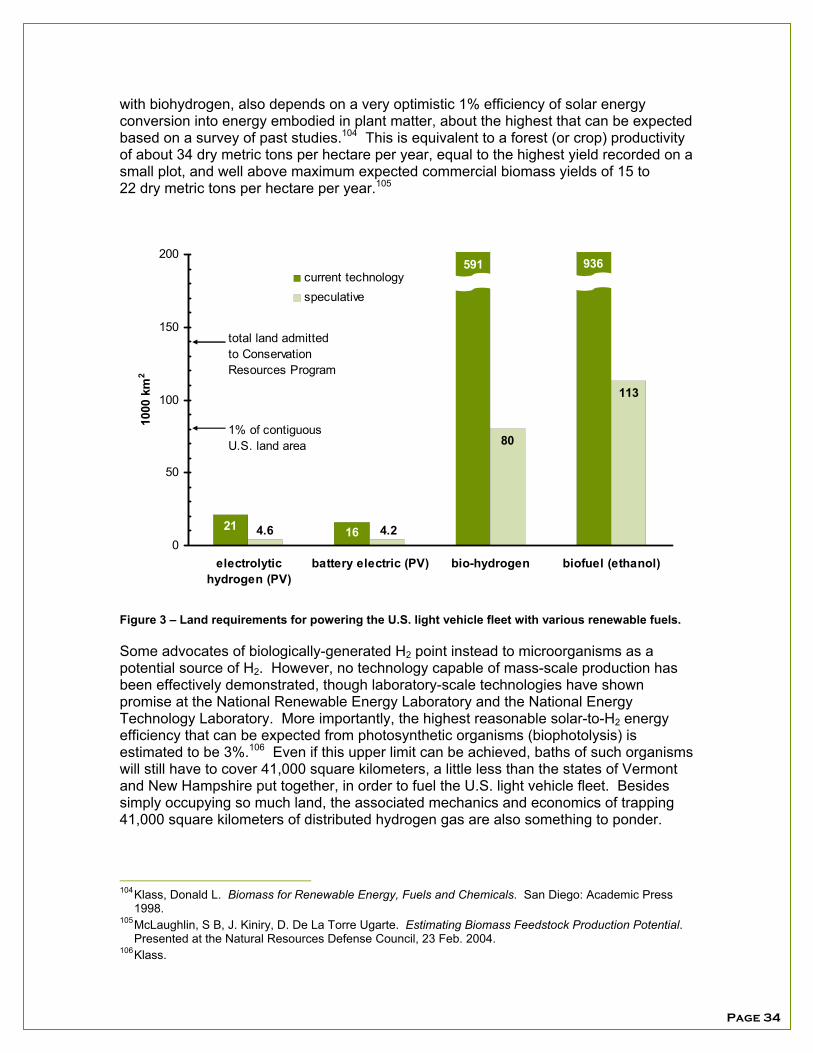
Page 34
with biohydrogen, also depends on a very optimistic 1% efficiency of solar energy conversion into energy embodied in plant matter, about the highest that can be expected based on a survey of past studies.104 This is equivalent to a forest (or crop) productivity of about 34 dry metric tons per hectare per year, equal to the highest yield recorded on a small plot, and well above maximum expected commercial biomass yields of 15 to 22 dry metric tons per hectare per year.105
80
113
1621 4.24.60
50
100
150
200
electrolytichydrogen (PV)
battery electric (PV) bio-hydrogen biofuel (ethanol)
1000
km
2
current technologyspeculative
1% of contiguous U.S. land area
total land admitted to Conservation Resources Program
591 936802
Figure 3 – Land requirements for powering the U.S. light vehicle fleet with various renewable fuels.
Some advocates of biologically-generated H2 point instead to microorganisms as a potential source of H2. However, no technology capable of mass-scale production has been effectively demonstrated, though laboratory-scale technologies have shown promise at the National Renewable Energy Laboratory and the National Energy Technology Laboratory. More importantly, the highest reasonable solar-to-H2 energy efficiency that can be expected from photosynthetic organisms (biophotolysis) is estimated to be 3%.106 Even if this upper limit can be achieved, baths of such organisms will still have to cover 41,000 square kilometers, a little less than the states of Vermont and New Hampshire put together, in order to fuel the U.S. light vehicle fleet. Besides simply occupying so much land, the associated mechanics and economics of trapping 41,000 square kilometers of distributed hydrogen gas are also something to ponder.
104 Klass, Donald L. Biomass for Renewable Energy, Fuels and Chemicals. San Diego: Academic Press
1998. 105 McLaughlin, S B, J. Kiniry, D. De La Torre Ugarte. Estimating Biomass Feedstock Production Potential.
Presented at the Natural Resources Defense Council, 23 Feb. 2004. 106 Klass.

Page 35
A number of hydrogen-producing organisms are heterotrophic: that is, they produce H2 by non-photosynthetic means. But because all biological, renewable processes are ultimately solar-driven, biohydrogen systems based on heterotrophic organisms are sure to have a net, maximum solar efficiency well under 1%, because the food supplied to the organisms will still be constrained by the 1% photosynthetic productivity limit. If the organisms produce waste, large auxiliary systems to handle this will occupy yet more land.
Besides these basic efficiency limitations, industrial-scale biohydrogen generation presents a vast spectrum of ecological, economic and safety concerns. A biohydrogen generator is a living ecosystem, meaning that it is susceptible to disease, species invasion and die-offs. Organisms bred for the purpose of generating H2 must be supported in an environment conducive to their survival. Most likely, the environment will be water-based, meaning that the organisms will need to be kept in vast storage tanks. The organisms used will probably be genetically modified and therefore not ordinarily found in the environment. So the ecological consequences of a breach in one of these tanks could be significantly more severe than those of ruptures in hog manure lagoons that have been experienced in the American south. Similar concerns regarding containment of engineered organisms could also apply to cellulosic ethanol manufacture.
Relative land use demands will play a role in social decisions regarding varied fueling options. Obviously it is far more land-efficient to rely on ReH2 than biofuels or biohydrogen. But the very spread of a biomass-based energy system across vast swathes of territory enables capture of solar gain that might not otherwise take place. This would take pressure off of renewable electrical resources that might yield greater environmental benefits if devoted to standard power grid needs rather than transportation. A mistake would be to assume a single new fuel will replace today’s petroleum-based “monoculture.” Both biomass-based fuels and ReH2 lend themselves to development of regionally-based production and distribution networks. Answers to which is the best option might vary from region to region.
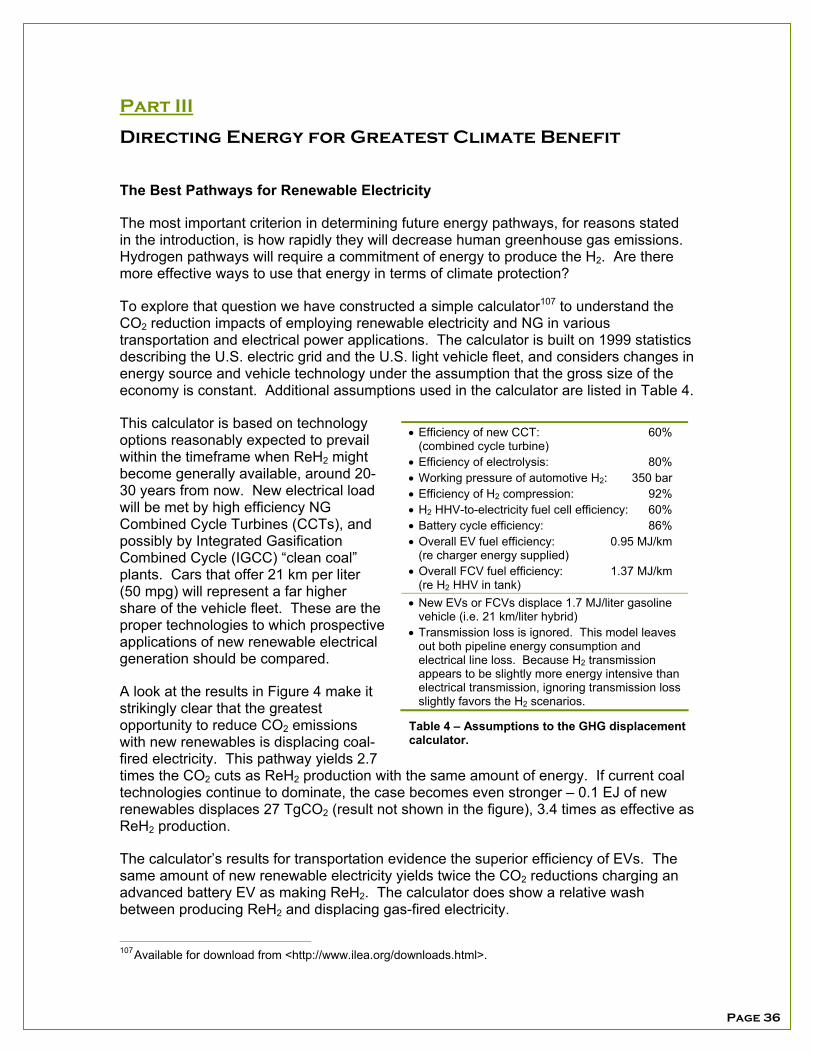
Page 36
Part III
Directing Energy for Greatest Climate Benefit
The Best Pathways for Renewable Electricity
The most important criterion in determining future energy pathways, for reasons stated in the introduction, is how rapidly they will decrease human greenhouse gas emissions. Hydrogen pathways will require a commitment of energy to produce the H2. Are there more effective ways to use that energy in terms of climate protection?
To explore that question we have constructed a simple calculator107 to understand the CO2 reduction impacts of employing renewable electricity and NG in various transportation and electrical power applications. The calculator is built on 1999 statistics describing the U.S. electric grid and the U.S. light vehicle fleet, and considers changes in energy source and vehicle technology under the assumption that the gross size of the economy is constant. Additional assumptions used in the calculator are listed in Table 4.
This calculator is based on technology options reasonably expected to prevail within the timeframe when ReH2 might become generally available, around 20-30 years from now. New electrical load will be met by high efficiency NG Combined Cycle Turbines (CCTs), and possibly by Integrated Gasification Combined Cycle (IGCC) “clean coal” plants. Cars that offer 21 km per liter (50 mpg) will represent a far higher share of the vehicle fleet. These are the proper technologies to which prospective applications of new renewable electrical generation should be compared.
A look at the results in Figure 4 make it strikingly clear that the greatest opportunity to reduce CO2 emissions with new renewables is displacing coal-fired electricity. This pathway yields 2.7 times the CO2 cuts as ReH2 production with the same amount of energy. If current coal technologies continue to dominate, the case becomes even stronger – 0.1 EJ of new renewables displaces 27 TgCO2 (result not shown in the figure), 3.4 times as effective as ReH2 production.
The calculator’s results for transportation evidence the superior efficiency of EVs. The same amount of new renewable electricity yields twice the CO2 reductions charging an advanced battery EV as making ReH2. The calculator does show a relative wash between producing ReH2 and displacing gas-fired electricity.
107 Available for download from <http://www.ilea.org/downloads.html>.
• Efficiency of new CCT: 60% (combined cycle turbine)
• Efficiency of electrolysis: 80% • Working pressure of automotive H2: 350 bar • Efficiency of H2 compression: 92% • H2 HHV-to-electricity fuel cell efficiency: 60% • Battery cycle efficiency: 86% • Overall EV fuel efficiency: 0.95 MJ/km
(re charger energy supplied) • Overall FCV fuel efficiency: 1.37 MJ/km
(re H2 HHV in tank) • New EVs or FCVs displace 1.7 MJ/liter gasoline
vehicle (i.e. 21 km/liter hybrid) • Transmission loss is ignored. This model leaves
out both pipeline energy consumption and electrical line loss. Because H2 transmission appears to be slightly more energy intensive than electrical transmission, ignoring transmission loss slightly favors the H2 scenarios.
Table 4 – Assumptions to the GHG displacement calculator.
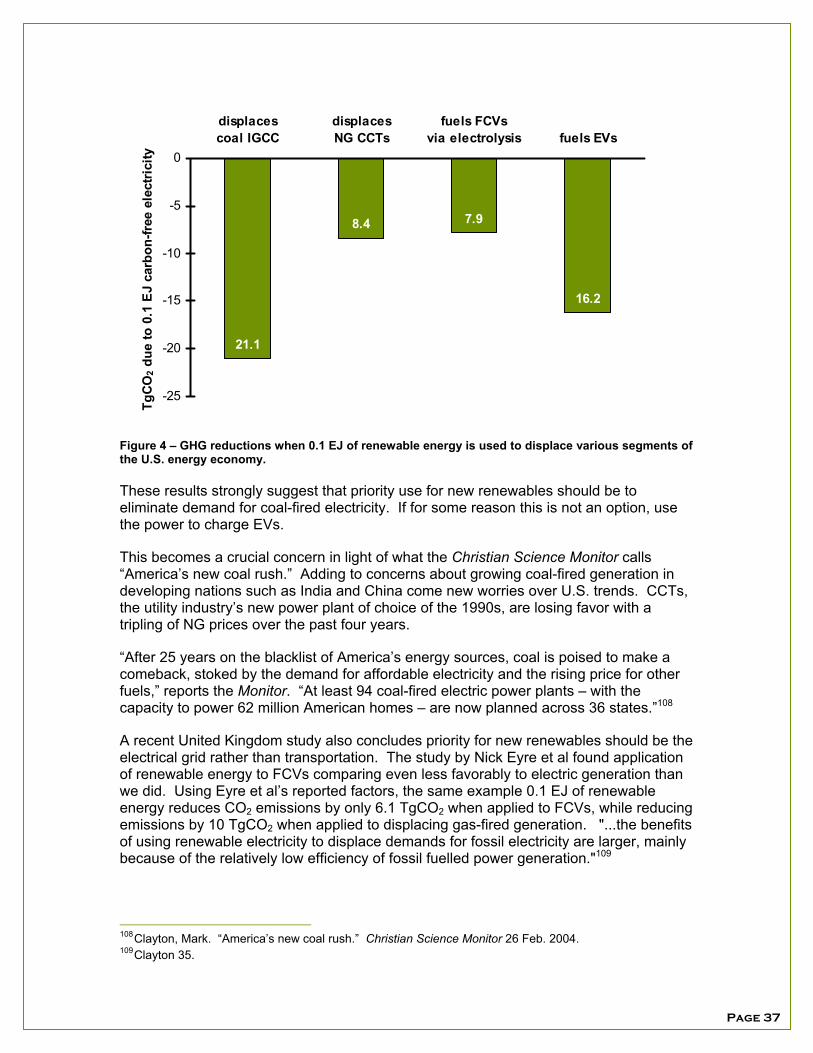
Page 37
21.1
8.4 7.9
16.2
-25
-20
-15
-10
-5
0
displacescoal IGCC
displacesNG CCTs
fuels FCVsvia electrolysis fuels EVs
TgCO
2 du
e to
0.1
EJ
carb
on-fr
ee e
lect
rici
ty
Figure 4 – GHG reductions when 0.1 EJ of renewable energy is used to displace various segments of the U.S. energy economy.
These results strongly suggest that priority use for new renewables should be to eliminate demand for coal-fired electricity. If for some reason this is not an option, use the power to charge EVs.
This becomes a crucial concern in light of what the Christian Science Monitor calls “America’s new coal rush.” Adding to concerns about growing coal-fired generation in developing nations such as India and China come new worries over U.S. trends. CCTs, the utility industry’s new power plant of choice of the 1990s, are losing favor with a tripling of NG prices over the past four years.
“After 25 years on the blacklist of America’s energy sources, coal is poised to make a comeback, stoked by the demand for affordable electricity and the rising price for other fuels,” reports the Monitor. “At least 94 coal-fired electric power plants – with the capacity to power 62 million American homes – are now planned across 36 states.”108
A recent United Kingdom study also concludes priority for new renewables should be the electrical grid rather than transportation. The study by Nick Eyre et al found application of renewable energy to FCVs comparing even less favorably to electric generation than we did. Using Eyre et al’s reported factors, the same example 0.1 EJ of renewable energy reduces CO2 emissions by only 6.1 TgCO2 when applied to FCVs, while reducing emissions by 10 TgCO2 when applied to displacing gas-fired generation. "...the benefits of using renewable electricity to displace demands for fossil electricity are larger, mainly because of the relatively low efficiency of fossil fuelled power generation."109
108 Clayton, Mark. “America’s new coal rush.” Christian Science Monitor 26 Feb. 2004. 109 Clayton 35.
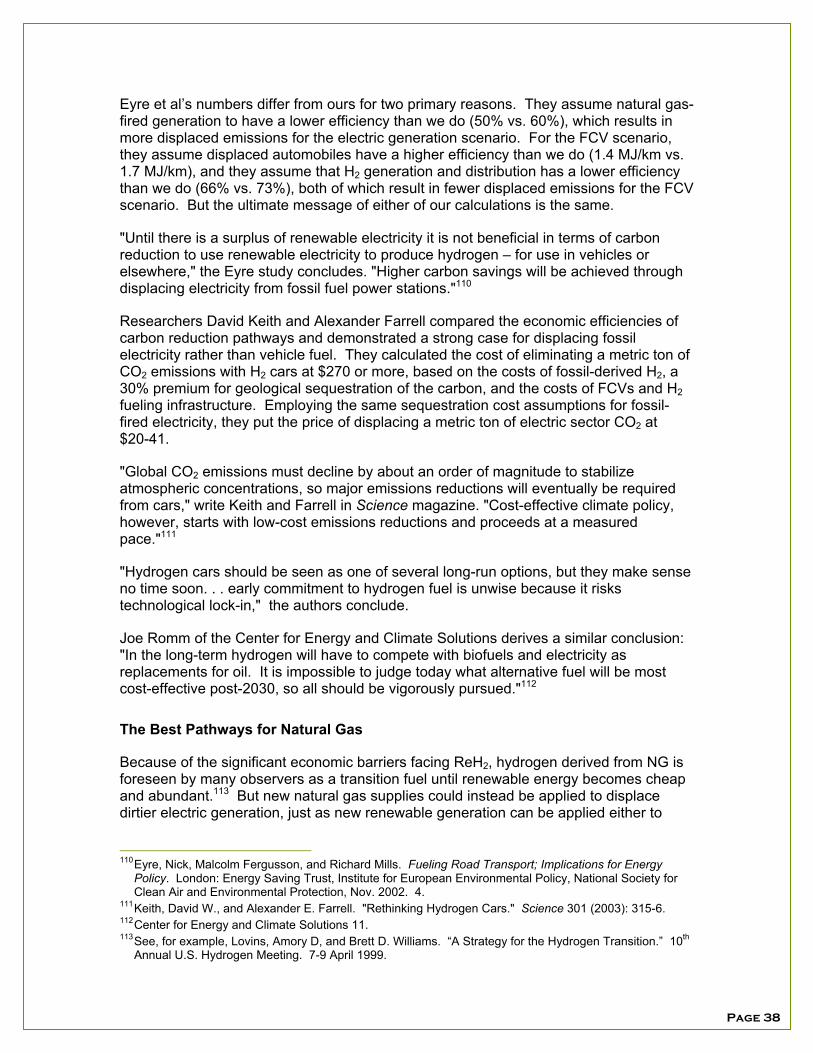
Page 38
Eyre et al’s numbers differ from ours for two primary reasons. They assume natural gas-fired generation to have a lower efficiency than we do (50% vs. 60%), which results in more displaced emissions for the electric generation scenario. For the FCV scenario, they assume displaced automobiles have a higher efficiency than we do (1.4 MJ/km vs. 1.7 MJ/km), and they assume that H2 generation and distribution has a lower efficiency than we do (66% vs. 73%), both of which result in fewer displaced emissions for the FCV scenario. But the ultimate message of either of our calculations is the same.
"Until there is a surplus of renewable electricity it is not beneficial in terms of carbon reduction to use renewable electricity to produce hydrogen – for use in vehicles or elsewhere," the Eyre study concludes. "Higher carbon savings will be achieved through displacing electricity from fossil fuel power stations."110
Researchers David Keith and Alexander Farrell compared the economic efficiencies of carbon reduction pathways and demonstrated a strong case for displacing fossil electricity rather than vehicle fuel. They calculated the cost of eliminating a metric ton of CO2 emissions with H2 cars at $270 or more, based on the costs of fossil-derived H2, a 30% premium for geological sequestration of the carbon, and the costs of FCVs and H2 fueling infrastructure. Employing the same sequestration cost assumptions for fossil-fired electricity, they put the price of displacing a metric ton of electric sector CO2 at $20-41.
"Global CO2 emissions must decline by about an order of magnitude to stabilize atmospheric concentrations, so major emissions reductions will eventually be required from cars," write Keith and Farrell in Science magazine. "Cost-effective climate policy, however, starts with low-cost emissions reductions and proceeds at a measured pace."111
"Hydrogen cars should be seen as one of several long-run options, but they make sense no time soon. . . early commitment to hydrogen fuel is unwise because it risks technological lock-in," the authors conclude.
Joe Romm of the Center for Energy and Climate Solutions derives a similar conclusion: "In the long-term hydrogen will have to compete with biofuels and electricity as replacements for oil. It is impossible to judge today what alternative fuel will be most cost-effective post-2030, so all should be vigorously pursued."112
The Best Pathways for Natural Gas
Because of the significant economic barriers facing ReH2, hydrogen derived from NG is foreseen by many observers as a transition fuel until renewable energy becomes cheap and abundant.113 But new natural gas supplies could instead be applied to displace dirtier electric generation, just as new renewable generation can be applied either to
110 Eyre, Nick, Malcolm Fergusson, and Richard Mills. Fueling Road Transport; Implications for Energy
Policy. London: Energy Saving Trust, Institute for European Environmental Policy, National Society for Clean Air and Environmental Protection, Nov. 2002. 4.
111 Keith, David W., and Alexander E. Farrell. "Rethinking Hydrogen Cars." Science 301 (2003): 315-6. 112 Center for Energy and Climate Solutions 11. 113 See, for example, Lovins, Amory D, and Brett D. Williams. “A Strategy for the Hydrogen Transition.” 10th
Annual U.S. Hydrogen Meeting. 7-9 April 1999.
Page 39
displace electric generation or to displace transportation. Our calculator reveals that displacing the “clean coal” IGCC plants with the natural gas creates 2.7 times the GHG reductions as does displacing conventional cars with FCVs (Figure 5).
12.7
4.7
7.9
-25
-20
-15
-10
-5
0
displaces coalIGCC via CCT
fuels FCVsvia reforming
fuels EVsvia CCT
TgC
O2 d
ue to
0.1
7 E
J na
tura
l gas
Figure 5 – GHG reductions when 0.17 EJ of NG is used to displace various segments of the U.S. energy economy. It takes 0.17 EJ of NG to generate 0.1 EJ of electricity, so the scale of the two displacement figures is comparable. FCVs and EVs are assumed to displace 50 mpg vehicles.
Energy economics favors EVs over FCVs so strongly that even when the original energy source is natural gas, as in Figure 5, it is still more energy efficient to use the natural gas to generate electricity that charges an EV battery, than it is to extract hydrogen from the gas and fuel an FCV.
All this comes with an important caveat. Potential exists to vastly increase renewable energy generation. But while NG is abundant worldwide, North America is facing supply constraints. This largely continental marketplace will likely require increased infusions from the rest of the world delivered in liquefied form, which will inevitably be more costly than current supplies and be less energy efficient because of energy penalties of liquefaction.
"Much if not most incremental U.S. natural gas consumption for transportation would likely come from imported liquefied natural gas," Joe Romm maintains. "This raises issues of safety, security, and import dependence, problems which alternative fuels are meant to address."114
The potential security pitfalls are evident in a rank order listing of nations with greatest gas reserves – Russia, Iran, Qatar, Saudi Arabia, U.S., Algeria, Venezuela, Nigeria, Iraq
114 Center for Energy and Climate Solutions 9.
Page 40
and Indonesia.115 In addition, a significant new demand for NG in transportation would tend to drive up gas prices, potentially slowing the displacement of coal with gas in electrical generation. So ironically the more successful gas-derived H2 FCVs become, the greater will be security problems and pressure to coal-fired generation.
Nuclear Energy and Hydrogen
Another form of electrical generation that releases no greenhouse gases, nuclear energy, has also been widely mentioned for hydrogen production. The concept is to use thermochemical rather than electrolytic processes. Nuclear technologies that are still in development will enable reactors that operate at higher temperatures than today's conventional nuclear reactors. Heat from a high temperature nuclear reactor can crack H2O into hydrogen and oxygen.116
Problems facing this scenario are those of nuclear generally - the lack of long-term waste storage, safety concerns that are exacerbated by terrorism worries, and high costs relative to competing technologies. We will leave it to other authors to debate the relative merits and burdens of nuclear energy and nuclear-generated hydrogen. However, if the development of new nuclear energy is assumed, then it can be subject to the same displacement analysis we performed for renewable electricity and new natural gas. The results appear in Figure 6.117
If nuclear thermochemical hydrogen is applied to displace gasoline the effect is substantial. But as with renewable electricity and natural gas the best use of nuclear energy from a climate standpoint is displacement of “clean” coal electric generation on the grid. And once again the EV’s superior efficiency means that nuclear power can displace more CO2 charging EVs with conventional electrical generation than it can by fueling FCVs with thermochemical H2.
115 CIA World Factbook. 31 Dec. 2003
<http://www.cia.gov/cia/publications/factbook/rankorder/2179rank.html>. 116 Argonne 2003. 117 These calculations do not take into account the possibility that waste heat from thermochemical hydrogen
production could be captured for generating electricity that could in turn be applied to electrolytic production of additional hydrogen. This would create a higher efficiency, but development of such combined cycle systems is even further down the line than the new nuclear reactors needed for thermochemical processes.

Page 41
21.1
8.4
13.8
16.2
-25
-20
-15
-10
-5
0
displaces coalIGCC via turbine
displaces NGCCTs via turbine
fuels FCVs viaH2O cracking
fuels EVsvia turbine
TgCO
2 du
e to
0.2
5 E
J nu
clea
r hea
t
Figure 6 – GHG reductions when 0.25 EJ of nuclear heat is used to displace various segments of the U.S. energy economy. It takes 0.25 EJ of heat to generate 0.1 EJ of electricity, so the scale is comparable with the other displacement figures.
Page 42
Conclusion
Finding Common Ground
To summarize our findings and their implications for the future of the hydrogen economy:
Energy transmission – Direct electricity is far more efficient than ReH2. Comparable scenarios show direct electricity delivering energy with 92% efficiency, while pipeline scenarios range from 45-63%.
Energy storage – ReH2 is exceeded in efficiency by advanced batteries, compressed air and pumped water storage by a factor of at least 1.6. In effect, using ReH2 instead of other storage media would waste substantial amounts of a clean energy resource.
Local generation – Production of ReH2 at local vehicle fueling stations is no more efficient than mass production and transmission from central points; if anything economies of scale will favor central generation. Long-distance transmission losses of electric and hydrogen transmission are nearly the same, and losses from on-site electrolysis and H2 compression swamp those due to transmission. Electric power demands for a local generating station serving 2,000 cars each day would amount to 57 MW, comparable to the load of a sprawling institutional campus.
Vehicle technology – EVs can offer twice the useful work from the same electrical energy as ReH2-powered FCVs. A fleet of 10,000 FCVs might consume between 250 and 360 TJ of electricity each year. The same fleet of battery electric cars would consume 180 TJ. Advanced battery technologies hold solid potential to substantially overcome range limitations that have held back EV acceptance. PHEVs offer an option that merges the best of EVs, including very high efficiency, with the unlimited ranges and rapid fueling time of HEVs.
Biofuels and biomass – Advanced technologies could generate liquid biofuels or biohydrogen sufficient to run the U.S. light vehicle fleet within the land base now in conservation reserve. Land demands would be many times higher than ReH2. Different fueling options might be best for different regions, depending on priorities for use of land and renewable electrical generating resources.
CO2 reductions – The use of renewable electrical generation that generates the greatest cuts is displacement of coal-fired generation. An equal amount of renewable energy yields 2.7 times the CO2 cuts when used to displace IGCC “clean coal” plants instead of fueling FCVs, and 3.4 times as much when used to displace current coal technologies. Until a surplus of renewable generation exists, most new renewables should go to meeting standard power grid needs. Natural gas also eliminates 2.7 times the CO2 when displacing coal instead of running FCVs on NG-derived H2. This raises concerns about the envisioned use of NG as a transition hydrogen source.
These conclusions are not favorable for the proposed “hydrogen economy.” More energy efficient alternatives exist to H2 in transportation and energy storage that might preclude mass-scale emergence of H2 technologies in these areas. Even when renewable electricity becomes cheap and abundant, it might be more effectively employed in advanced direct electricity applications. Land use and other environmental impacts of major renewables installations will continue to be a concern.

Page 43
Perhaps ReH2 or coal-derived H2 with sequestration will emerge as needed zero-carbon vehicle fuels. The other contenders are biomass-based fuels and direct electricity generated from sources with no net carbon emissions. A biomass future will depend on the degree to which society is willing to devote land to growing feedstocks as well as advances in biomass technologies. Substantial spread of EVs will depend on improvements in battery technologies and economics, and charge times represent a major hurdle. The advanced biofuel-powered PHEV could provide unlimited range, rapid fueling and zero greenhouse emissions. Growing PHEV markets would help all battery vehicles. The limitations and potentials of each fueling option suggest a movement from today’s petroleum “monoculture” to a diversity of fuels that fit regional resources and individual needs.
At any rate, the full-blown hydrogen economy is at least decades away. The National Research Council recently concluded, “Overall, although a transition to hydrogen could greatly transform the U.S. energy system in the long run, the impacts on oil imports and CO2 emissions are likely to be minor over the next 25 years.” 118
In the interim, greenhouse gas reductions are absolutely vital, while complementary research, development and deployment pathways could support multiple technological outcomes. We conclude with a call for common ground between hydrogen economy supporters and skeptics. The following development priorities could promote the general goal of sustainable energy while enabling a number of potential outcomes:
Rapid expansion of renewables – If ReH2 is ever to be feasible, it will require an abundance of low-cost renewable generation. A number of sustainable energy advocates including the Union of Concerned Scientists are pushing a renewable energy standard of 20% in the national power mix by 2020. California has mandated 20% in the next decade. By building markets for new renewables such standards promote economies of scale that bring costs down. “Green Hydrogen” advocates and those who look to direct electricity-based technologies have clear common cause in supporting measures to rapidly grow renewable electrical generation.
Hybrid vehicle technology - The HEV and FCV share a significant common technology base. That is reflected in substantial support through the federal FreedomCAR and Vehicle Technology Program. One-third of the amended FY 2004 budget request, $29 million out of a total budget of $91 million, is for RD&D on hybrid and electric propulsion.119 Additionally, both standard and plug-in hybrid applications are being developed for FCVs that could make them more feasible. In essence, all the new options incorporate electric drive trains, so much complementary development is possible.
Vehicle-to-grid applications – EVs, FCVs and PHEVs charged by ICE or fuel cell, are all envisioned providing support to the power grid. This will require development of technologies to manage large numbers of energy storage and generating devices, as well as economic models that provide car owners with incentives to participate. Such incentives could support growth of markets for all electric-drivetrain vehicles.
118 National Research Council ES-5. 119 FCVT Component of FreedomCAR Partnership Funding Profile. 20 Mar. 2004
<http://www.eere.energy.gov/vehiclesandfuels/pdfs/program/freedomcar_budget.pdf>.

Page 44
Biomass – Similar feedstocks are proposed to feed both biofuel and biohydrogen production. The great challenge for employing waste and residue biomass is setting up economical collection infrastructure, whether the intended product is ethanol or H2. A substantial biomass fuel system will also require cultivation of energy crops such as trees and grasses. Development of biomass crops and collection is of general benefit.
The debate on hydrogen will continue, but it does not need to preclude broad cooperation to develop sustainable energy technologies that serve multiple agendas. The emergence of global warming and climate change represent a compelling call to undertake this kind of collaborative effort.
Reducing greenhouse emissions to avoid catastrophic impacts on the global atmosphere will require immense quantities of carbon-free energy, and the difficulties of supplying sufficient amounts will only intensify with rising populations and standards of living. This is the essential context in which the future roles of hydrogen and renewable electricity must be explored if humanity is to meet the critical challenges facing it this century.