
Carrying capacity of nursery grounds for Japanese flounder ... · Maizuru Fisheries Research...
22
Maizuru Fisheries Research Station FSERC Kyoto University Yoh Yamashita and Yutaka Kurita Carrying capacity of nursery grounds for Japanese flounder in relation to stocking density
Transcript of Carrying capacity of nursery grounds for Japanese flounder ... · Maizuru Fisheries Research...

Maizuru Fisheries Research StationFSERC
Kyoto University
Yoh Yamashita and Yutaka Kurita
Carrying capacity of nursery grounds for Japanese flounder in relation to stocking density

Stock enhancement program in Japan (since 1963)
*Seventy governmental hatcheries for marine species
*Fifteen billion juvenile stage animals of 80 marine species are released each year

Japanese flounder (Paralichthys olivaceus)Stocking started in 1977 and 25 million juveniles (4-10 cm TL) are annually released

Key criteria for successful stocking1.Seed quality
2.Genetic diversity
3.Release habitat
4.Release season
5.Fish size at release
6.Release method
7.Management of the released stock
8.Optimum stocking density(in relation to carrying capacity of the habitat)(surplus productivity of habitats available for stocked fish)
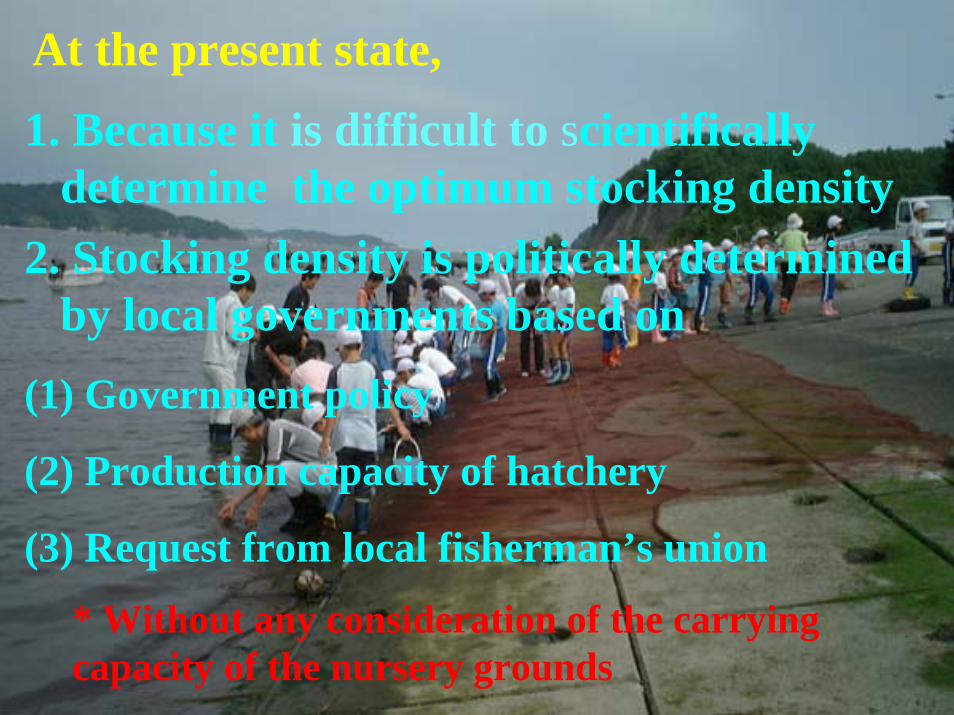
At the present state,
2. Stocking density is politically determined by local governments based on
(1) Government policy
(2) Production capacity of hatchery
(3) Request from local fisherman’s union
1. Because it is difficult to scientifically determine the optimum stocking density
* Without any consideration of the carrying capacity of the nursery grounds

Chiba Prefecture(1984 – 1995)
0
5
10
15
20
25
0 50 100 150
Number of Released Flounder (103)
Retu
rn R
ate
(%)
0
2
4
6
8
10
0 50 100 150
Number of Released Flounder (103)
Num
ber o
f Ret
urns
(103 )
*Data are shown as a local operation unit

Miyako Bay, Iwate Prefecture, (1987-2003)
0
5
10
15
20
25
0 50 100 150 200
Number of Released Flounder (103)
Retu
rn R
ate
(%)
0
5
10
15
20
25
0 50 100 150 200
Number of Released Flounder (103)
Num
ber o
f Ret
urns
(103 )

Fukushima Prefecture(1985-2002)
0
5
10
15
20
25
30
35
0 500 1000 1500
Number of Released Flounder (103)
Retu
rn R
ate
(%)
0
50
100
150
200
0 500 1000 1500
Number of Released Flounder (103)
Num
ber o
f Ret
urns
(103 )
2000-, 2001-year class
*Release operations and research on stocking effectiveness have been conducted on a prefecture level
2000-, 2001-year class

The relationship between stocking density and market return rate throughout Japan
0
5
10
15
20
25
30
35
0 500 1000 1500
Number of Released Flounder (103)
Retu
rn R
ate
(%)
0
50
100
150
200
0 500 1000 1500
Number of Released Flounder (103)
Num
ber o
f Ret
urns
(103 ) Fukushima Pref.
2000-, 2001-year class
*Data are from local governments throughout Japan
TaTaEffect
SalEffect
FishEnergy
Sal
AcxWfish
ArxWfish
DOeffect
MMSO
Wfish
Winberg
Mact
~DOobs
Mstd
GEFeed
MysidPopEner
q1 q2
Apc
FeedQual
Acmax
WastedEnergy
AwxWfish
MSgrowth
oxycal
Aa
MysidProd
As
Wwastes
NatMortality
AgScope
pHeffect
Eflux
AdxWfish
CompCons
sda
GEfish
pH
DOa
FeedRate
~pHobs
~Tobs
~Sobs
FishCons
SeedCons
MysidCalInd MysidDensArea
TemEffect
Comp0Energy
Comp0growth
Comp0Grate
Comp0N
Death0Comp1N
Death1
Comp0Ingestion
Comp1Energy
Comp1growth
Comp1Grate
death fraction
Comp1Ingestion
Mysid Mortality
FishNumber
deaths
anchovy
Ta 2TaEffect 2
SalEffect 2
SeedEnergy
Sal 2
AcxWseed
ArxWseed
DOeffect 2
MMSO 2
Wseed
Winberg 2
Mact 2
~DOobs 2
Mstd 2
GEFeed 2
q1 2 q2 2
Apc 2
Acmax 2
WastedEnergy 2
AwxWseed
MSgrowth 2
oxycal 2
Aa 2
As 2
Wwastes 2
AgScope 2
pHeffect 2
Eflux 2
AdxWfish 2
sda 2
GEseed
pH 2
DOa 2
FeedRate 2
~pHobs 2
~Tobs 2
~Sobs 2
Seed Number
TemEffect 2
SeedDeath
Predation
Predated N
Predated
~fWseed WtotalPredation
Wpredator
PredatorIngesRate
EncounterRate
~days14
mysids
Poss Consumption
Stand vs Active Metabolism
poss consumption2500
AcmaxXWseed
MysidDens in N
Total weight
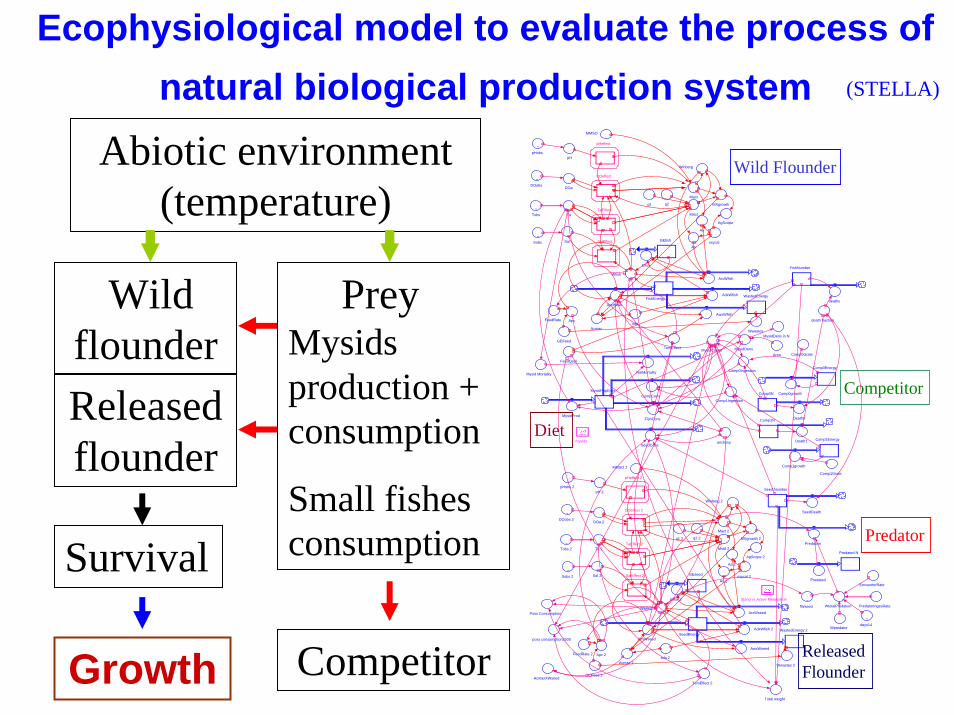
Wild Flounder
Competitor
Predator
Diet
Released Flounder
Wild flounder Releasedflounder
CompetitorGrowth
Abiotic environment (temperature)
PreyMysids production + consumption
Small fishesconsumptionSurvival
Ecophysiological model to evaluate the process of natural biological production system (STELLA)

Application of the subpopulation growth model to Ohno Bay, northeastern Japan
Model Field• Ohno Bay (39 ºN, 142 ºE)• Area
500m x 500m (Depth: 0 – 10m)
• 76,000 hatchery-juveniles(mean TL; 8.9 cm)
• Sep. 5 – Nov. 9, 1989 (65 days)
• Temperature20.1 ºC → 14.8 ºC
• Salinity 31.5 – 32.8 ppt
• DO > 6 ppm

Comparison of growth between field data and output of the model (post –release sampling for 65 days)
0
5
10
15
20
25
30
35
0 10 20 30 40 50 60 70Days aft er Release
Wei
ght
(g) Released
flounder
Wild flounder
Ohno Bay , 1989

Concept of Stock Enhancement→ Released fish use the surplusproductivity in the nursery habitats
Criterion of the optimum number of released flounder
→ Maximum number, which does not affect the growth of wild flounder
Estimate of the optimum stocking density using ecophysiological model

Relationship between number of flounder released and predicted growth of wild
flounder juveniles 65 days after release
0
10
20
30
40
50
0 20000 40000 60000 80000 100000Number of Flounder Released
Wei
ght
65 D
ays
afte
r R
elea
se (
g)
Density effect (5,000 fish)
Actual release 76,000 hatchery fish
No surplusproduction
Ohno Bay, 1989
Actual weight (wild flounder)
Over stocking!!
●
●

Regional difference in the carrying capacity for flounder juveniles
0
5
10
15
20
25
30
35
130 135 140
Longitude
Retu
rn R
ate
(%)
High return rates in northeastern
areas

●
●
●●●
●
●● Samplings of wild
flounder juveniles and mysids from 12 nurseries in
2000
●●
●●

In Northern Japan
1.Lower wild flounder juvenile density
2.Higher mysid abundance
3.Higher flounder feeding rate0.0 1.0 2.0 3.0 4.0 5.0
Nagasaki
Yamaguchi
Tottori
Fukui
Toyama
Nigata
Miyagi
Iwate
Aomori
Hokkaido
Juvenile density (ind/ min. tow)
0 100 200 300 400 500
Kagoshima
NagasakiYamaguchi
Tot tori
FukuiToyamaNiigata
MiyagiIwate
Aomori
Hokkaido
Mysid aboundance (mg/ m2)
1712.8
0 10 20 30 40 50 60
Nagasaki
Yamaguchi
Tot tori
Fukui
Toyama
Niigata
Miyagi
Iwate
Aomori
Hokkaido
Stomach Index (SI)
Wild flounder juvenile density
Mysid abundance
N
S
Feeding rate

Comparison of growth rates of wild Japanese flounder juveniles (3-6 cm TL) between northern and southern Japan
northernsouthern
DA
ILY
GR
OW
TH (m
m/d
ay) 2.0
1.5
1.0
0.5
0 14 16 18 20 22 24 26
WATER TEMPERATURE (℃ )
1.Higher growth rate in northern Japan (Tanaka et al., 1998)
2.No latitudinal difference in growth rate under the same rearing conditions
●
●
●●
●
●
●●
12
3 45
6
7
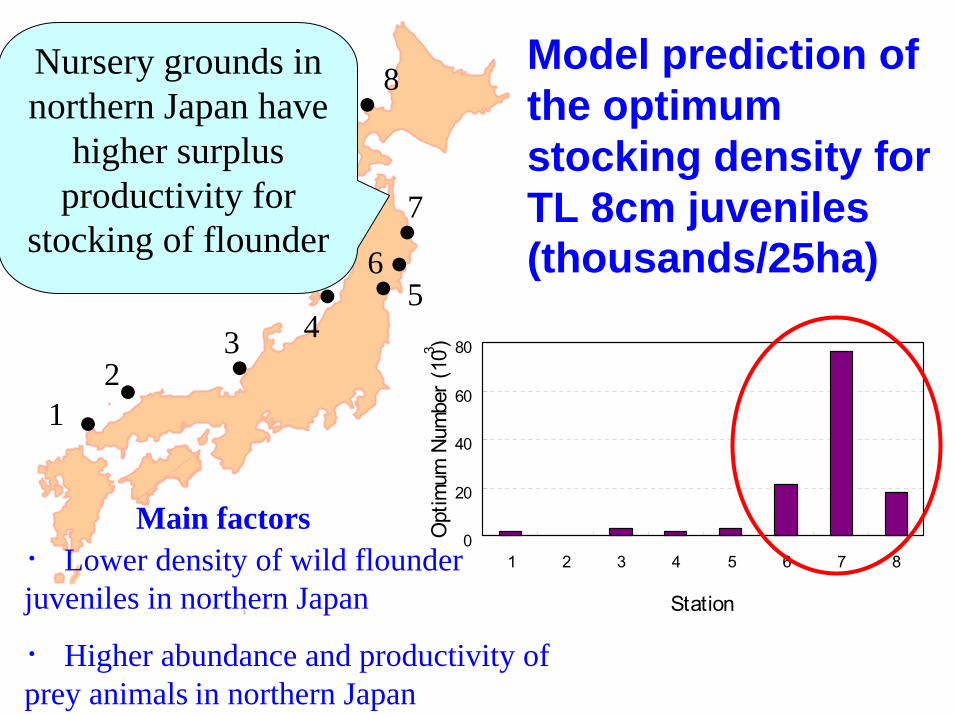
8Model prediction of the optimum stocking density for TL 8cm juveniles (thousands/25ha)
Nursery grounds in northern Japan have
higher surplus productivity for
stocking of flounder
Main factors0
20
40
60
80
1 2 3 4 5 6 7 8
Station
Opt
imum
Num
ber (
103 )
・ Lower density of wild flounder juveniles in northern Japan
・ Higher abundance and productivity of prey animals in northern Japan

1. Over-stocking of hatchery flounder has been commonly conducted at many stocking sites.
2. There are regional differences in the surplus productivity available for released flounder; Northern Japan has higher levels of surplus productivity in habitats than in southern Japan.
* However, stocking intensity is almost the same between these two areas.

Conclusions1. Each governmental institute which is
responsible for the stock enhancement program must conduct a follow-up study on the effectiveness of the program including effects of stocking density.
2. With the exception of the present study, the concept of the optimum stocking density in habitats has not been tested yet in the stock enhancement program in Japan. Appraisal of all ongoing stock enhancement programs from this point of view is needed.


![w3.maizuru-ct.ac.jpw3.maizuru-ct.ac.jp/structure/Problem_Chapter07.pdf · 0 [7.8] B El — const Ito ABC B x CD BCD MB 0 (5 0 . 250 6E1 18E1 512 ZAB 11 16 12E1 513 12E1 512 18E1 513](https://static.fdocuments.us/doc/165x107/5e3af3bcc51ec80bf138b38f/w3maizuru-ctacjpw3maizuru-ctacjpstructureproblem-0-78-b-el-a-const.jpg)